Embed Size (px)
Citation preview

KONE 2015
Financial Statements
Smooth flow through peaks and lows.Our retail customers rely on us to help them create a smooth and enjoyable shopping experience. Easy access encourages browsing on all floors, which in turn ensures a quicker return on investment.

Annual General MeetingKONE Corporation’s Annual General Meeting will be held on March 7, 2016 at 11:00 a.m. in the Finlandia Hall, Man-nerheimintie 13, Helsinki, Finland.
Shareholders wishing to attend the meeting must be registered in the KONE shareholder register at Euroclear Finland Ltd. no later than on February 24, 2016, and must register for attending the meet-ing over the internet (www.kone.com/en/investors/annual-general-meetings/), by fax (+358 (0)204 75 4523), by telephone (+358 (0)20 770 6873) by 3:00 p.m or by mail (KONE Corporation, Share Register, P.O. Box 7, FI-02151 Espoo, Finland). EET on March 2, 2016. The registration must be received by the end of the registration period. Any proxies must be submitted at the same time.
At general meetings each KONE class A share is assigned one vote, as is each block of 10 class B shares, with the pro-viso that each shareholder is entitled to at least one vote.
Information for shareholdersPayment of dividendsThe Board of Directors proposes to the Annual General Meeting that for the financial year 2015 a dividend of EUR 1.3975 be paid for each class A share and a dividend of EUR 1.40 be paid for each class B share. All shares existing on the dividend record date, March 9, 2016 are entitled to the dividend. The dividend will be paid on March 16, 2016.
KONE’s financial reporting schedule in 2016
Financial Statement Bulletin and Financial Statements for 2015 Thursday, January 28, 2016
Printed Financial Statements for 2015 week 8 February, 2016
Interim report for January 1–March 31, 2016 Thursday, April 21, 2016
Interim report for January 1–June 30, 2016 Tuesday, July 19, 2016
Interim report for January 1–September 30, 2016 Wednesday, October 26, 2016
In the second quarter of 2016, KONE will publish a separate Corporate Responsibility Report for the year 2015.
Changes of addressKONE’s shareholders are kindly requested to report changes of address to the bank where they have their book-entry account. The shareholders registered at Euroclear Finland Ltd. should send a writ-ten notice to:
Euroclear Finland Ltd.Customer Account Service,P.O. Box 1110,FI-00101 HelsinkiTel. + 358 800 180 500
In the notice, shareholders should mention their name, new address, old address and book-entry account number.
Listing of KONE securities KONE Corporation has two classes of shares: the listed class B shares and the non-listed class A shares. The KONE class B shares are listed on the Nasdaq Helsinki Ltd. and are registered at Euroclear Fin-land Ltd. Stock options 2013 have been listed on the Nasdaq Helsinki Ltd. from April 1, 2015.
Publication of financial informationKONE Corporation publishes financial information in Finnish and English. All materials are available on KONE’s website at www.kone.com, where requests for email distribution can also be made.
Requests for printed financial reports can be submitted on KONE’s website at www.kone.com. Alternatively, financial reports can be ordered by email ([email protected]), by mail (KONE Corpo-ration, Corporate Communications, P.O. Box 7, FI-02151 Espoo, Finland), or by telephone (+358 (0)204 751).
KONE 2015 Financial Statements | Information for shareholders
More information
The comprehensive investor relations pages can be found at www.kone.com Shares and shareholders, page 67Corporate governance, page 60
More information
The Board of Directors’ proposal for the distribution of profit, page 71Shares and shareholders, page 67
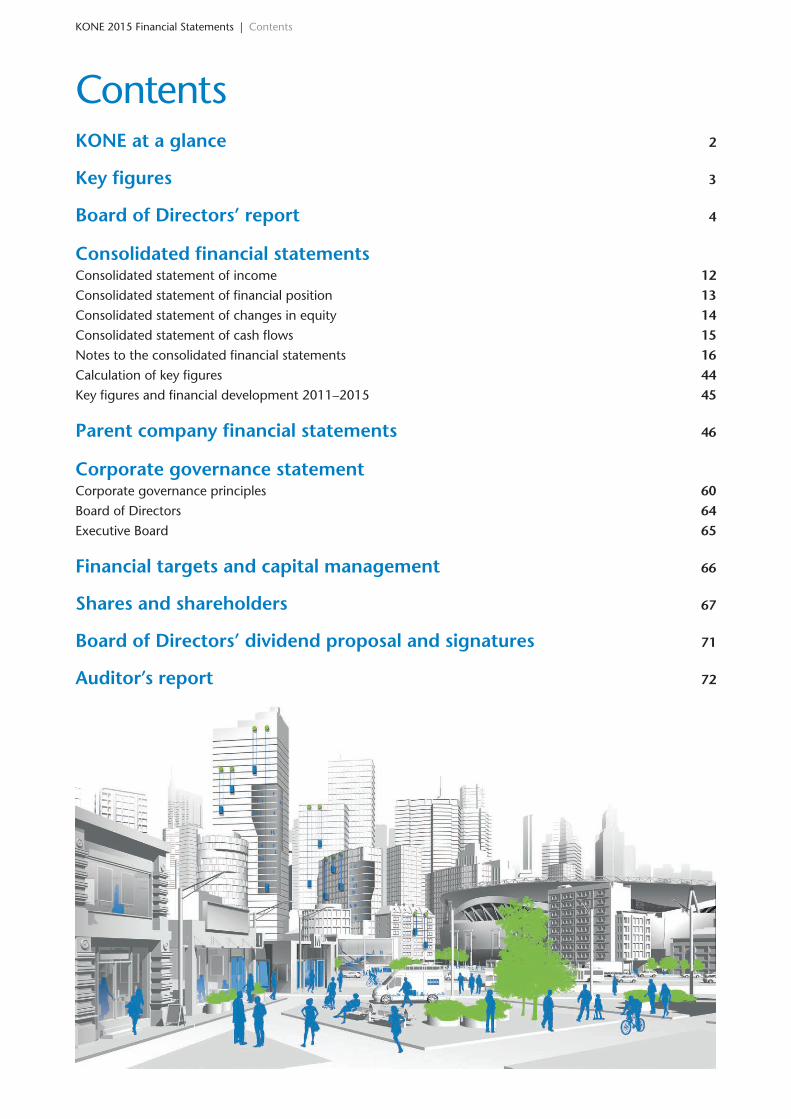
ContentsKONE at a glance 2
Key figures 3
Board of Directors’ report 4
Consolidated financial statements Consolidated statement of income 12Consolidated statement of financial position 13Consolidated statement of changes in equity 14Consolidated statement of cash flows 15Notes to the consolidated financial statements 16Calculation of key figures 44Key figures and financial development 2011–2015 45
Parent company financial statements 46
Corporate governance statement Corporate governance principles 60Board of Directors 64Executive Board 65
Financial targets and capital management 66
Shares and shareholders 67
Board of Directors’ dividend proposal and signatures 71
Auditor’s report 72
KONE 2015 Financial Statements | Contents
Coal Valley
Allen
Torreón
HyvinkääHelsinki
EssenÙsti nad labem
Cadrezzate
Chennai
KunshanNanxun
Pero
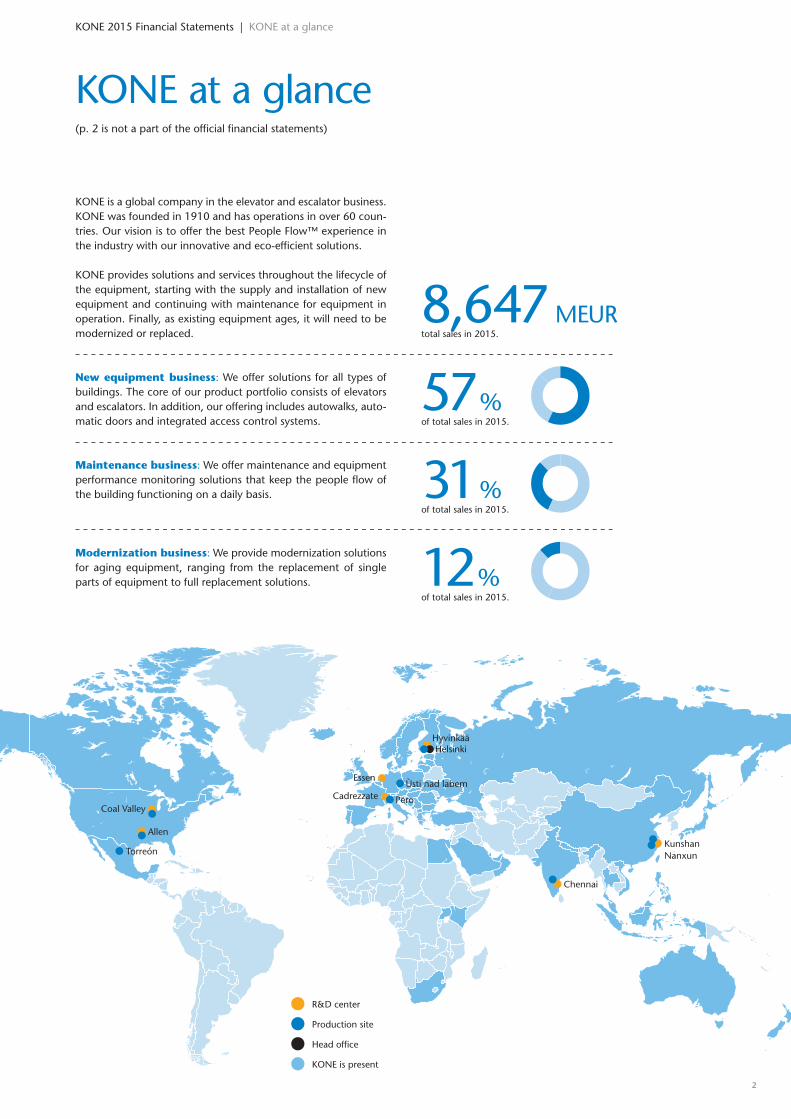
KONE at a glance
KONE 2015 Financial Statements | KONE at a glance
KONE is a global company in the elevator and escalator business. KONE was founded in 1910 and has operations in over 60 coun-tries. Our vision is to offer the best People Flow™ experience in the industry with our innovative and eco-efficient solutions.
KONE provides solutions and services throughout the lifecycle of the equipment, starting with the supply and installation of new equipment and continuing with maintenance for equipment in operation. Finally, as existing equipment ages, it will need to be modernized or replaced.
New equipment business: We offer solutions for all types of buildings. The core of our product portfolio consists of elevators and escalators. In addition, our offering includes autowalks, auto-matic doors and integrated access control systems.
Maintenance business: We offer maintenance and equipment performance monitoring solutions that keep the people flow of the building functioning on a daily basis.
Modernization business: We provide modernization solutions for aging equipment, ranging from the replacement of single parts of equipment to full replacement solutions.
57 %
8,647 MEUR
31 %
12 %
(p. 2 is not a part of the official financial statements)
R&D center
Production site
Head office
KONE is present
of total sales in 2015.
total sales in 2015.
of total sales in 2015.
of total sales in 2015.
2 2
2015 20152015
2015 2015 2015
2014 20142014
2014 2014 2014
2013 20132013
2013 2013 2013
953
-612
-983
-750
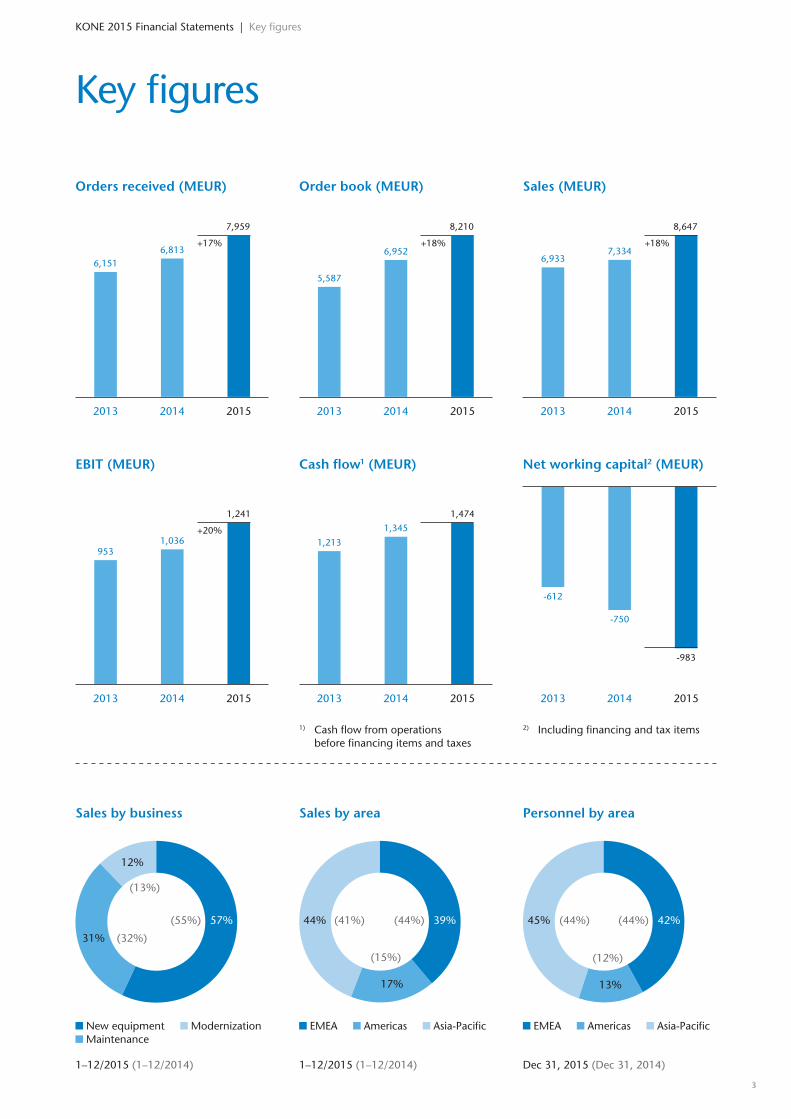
Key figures
Order book (MEUR) Sales (MEUR)Orders received (MEUR)
Net working capital2 (MEUR)EBIT (MEUR) Cash flow1 (MEUR)
2) Including financing and tax items 1) Cash flow from operations before financing items and taxes
Sales by business Sales by area Personnel by area
EMEA Americas Asia-Pacific EMEA Americas Asia-Pacific New equipment Modernization Maintenance
Dec 31, 2015 (Dec 31, 2014)1–12/2015 (1–12/2014)1–12/2015 (1–12/2014)
31% (32%)
(41%) (44%)(44%) (44%)
(15%)
(13%)
(12%)
(55%) 39% 42%57%
17%
12%
13%
44% 45%
KONE 2015 Financial Statements | Key figures
6,151
7,959
6,8136,933
8,647
7,334
5,587
8,210
6,952+18%+17% +18%
1,213
1,474
1,345
1,241
1,036+20%
32
Board of Directors’ report
KONE 2015 Financial Statements | Board of Directors’ report
KONE’s operating environmentIn 2015, the global new equipment mar-ket volumes decreased slightly due to a decline in the large Chinese new equip-ment market. Of the other markets, new equipment demand in North America grew clearly, and markets in Europe and the Middle East also saw some growth. Globally the demand in modernization increased slightly, with positive develop-ment in North America and Asia-Pacific, and a slightly better trend overall also in Europe. The major projects segment saw some growth in the year, but the develop-ment varied from quarter to quarter. The maintenance market continued to grow globally. The fastest growth was seen in Asia-Pacific. In the more mature mainte-nance markets, the rate of growth was lower.
In the EMEA region, the new equip-ment market in Central and North Europe saw clear growth, driven by the residential segment in particular. Of the larger markets, Germany, Great Britain and Scandinavia developed positively. In South Europe, the new equipment market showed some signs of recovery, but still lacked substantial growth opportunities. The new equipment market in France and Italy remained weak, but in Spain the market continued to recover from a low level. In the Middle East, the new equipment market saw some growth. This was driven by the volume business, as the major project segment was negatively impacted by economic uncertainty in the region. The modernization market devel-oped favorably in Central and Northern parts of the continent, in Great Britain in particular. It remained weaker in South Europe, although in Spain the recovery in demand continued also in moderniza-tion. The maintenance market grew in the EMEA region, but with variation in the competitive environment between differ-ent countries.
In North America, the new equipment demand developed strongly, driven by the United States, the largest market in the region. In the United States, the market grew clearly, with broad-based positive development across segments. In Canada, the new equipment market was rather stable. Demand for modernization grew in the region following the posi-tive development in the United States. In maintenance, the market saw some growth, but remained rather competitive.
In the Asia-Pacific region, the new equipment market declined slightly in 2015 from the high level of the previous year. In China, the new equipment market declined somewhat, with the weakening becoming slightly more pronounced in the second half of the year. In the resi-dential segment, affordable housing was rather stable, but demand in commer-cially-funded residential projects declined clearly. Other commercial segments declined slightly during the year, while the infrastructure segment grew signifi-cantly as a result of government stimulus actions. The market environment in China varied clearly between different regions. The first-tier cities and a part of second-tier cities continued to show a better level of demand, while the development in lower-tier cities was weak. Outside China, the market sentiment in India improved slightly with the new equipment market seeing some growth during the year. The Southeast Asian markets were rather stable overall, affected by the economic uncertainty in the region. In Australia, both new equipment and modernization demand developed positively. Mainte-nance markets in Asia-Pacific continued to grow following the positive development in new equipment installations.
KONE competes with various compa-nies in all geographic areas. Particularly in services, the market environment is fragmented with numerous smaller and larger competitors. In 2015, the pricing environment was challenging in many regions. In China, competition for market share in the new equipment market was intense, resulting in further intensified price competition during 2015. The rest of Asia-Pacific saw no major changes in the competitive environment. In the EMEA region, the pricing environment in new equipment remained the most challenging in South European markets with persisting low volumes. The pricing of new equipment in North America con-tinued to improve slightly, particularly in the volume business. In maintenance and modernization, the pricing environment was characterized by strong competi-tion in the EMEA region, particularly in South Europe and also in some of the Central and North European markets. Also in North America, price competition remained rather intense in the service business.
Orders received and Order bookOrders received grew by 16.8% in 2015, and totaled EUR 7,959 (1–12/2014: 6,813) million. At comparable exchange rates, KONE’s orders received increased by 5.6%. During January–December 2015, KONE’s orders received grew in the volume business, and saw some growth also in the major projects business. Orders received grew somewhat in new equip-ment and clearly in modernization. The orders received consist predominantly of new equipment and modernization orders. Maintenance contracts are not included in orders received, but the figure includes orders related to the mainte-nance business, such as repairs.
The order book grew by 18.1% com-pared to the end of 2014, and stood at a level of EUR 8,210 (December 31, 2014: 6,952) million at the end of 2015. At comparable exchange rates, the increase was 11.9%. The margin of the order book remained at a good level. The overall margin of orders received also remained at a good level. This was achieved despite the price pressure in several markets with progress made in product and cost competitiveness. Cancellations of orders remained at a very low level.
KONE’s new equipment orders received in elevator and escalator units amounted to approximately 161,000 units (2014: approximately 154,000 elevator and escalator units).
Orders received in the EMEA region grew clearly at comparable exchange rates as compared to 2014. New equip-ment orders grew clearly in the region. They grew significantly in Central and North Europe, with Great Britain, Ger-many and the Nordic countries contribut-ing most to the growth. In South Europe, new equipment orders were stable with strong growth in Spain, a stable develop-ment in France, and significant decline in Italy. In the Middle East, new equipment orders grew somewhat against a high comparison level. KONE’s modernization order intake in the EMEA region grew somewhat as compared to 2014, driven by clear growth in Central and North Europe. In South Europe, modernization orders were stable.
Orders received in the Americas region grew significantly at comparable rates as compared to 2014. New equipment orders received grew strongly, driven by the United States in particular. Also in
4 4

modernization, orders received saw sig-nificant growth in the region.
Orders received in the Asia-Pacific region grew slightly at comparable rates as compared to the previous year. New equipment orders received were stable in the region with a stable development in China, the largest contributor. In the rest of Asia-Pacific, new equipment orders grew significantly in the volume business but declined in major projects due to several large projects in the comparison period. Modernization orders received grew significantly in the Asia-Pacific region.
Net sales Net sales increased in 2015 by 17.9% as compared to the prior year, and totaled EUR 8,647 (1–12/2014: 7,334) million. At comparable exchange rates the increase was 8.3%. The sales consolidated from the companies acquired in 2015 did not have a material impact on KONE’s net sales for the financial period.
New equipment sales accounted for EUR 4,935 (4,009) million and represented an increase of 23.1% over the comparison period. At comparable exchange rates, new equipment sales grew by 10.6%.
KONE delivered approximately 137,000 new elevator and escalator units in 2015 (2014: approximately 130,000 elevator and escalator units).
Service (maintenance and modern-ization) sales increased by 11.6%, and totaled EUR 3,713 (3,326) million. At comparable exchange rates, service sales grew by 5.4%. Maintenance sales grew by 13.0% at historical and by 6.7% at comparable exchange rates, and totaled EUR 2,642 (2,338) million. Moderniza-tion sales increased by 8.5%, and totaled EUR 1,071 (987.4) million. At compa-rable exchange rates, modernization sales increased by 2.2%.
KONE’s elevator and escalator mainte-nance base continued to grow and was close to 1,100,000 units at the end of 2015 (the maintenance base exceeded 1,000,000 units at the end of 2014). The growth of the maintenance base was driven, in particular, by a continued good level of conversions of new equipment deliveries to the maintenance base. Acqui-sitions also somewhat contributed to the growth. During the reporting period, the balance of maintenance contracts that were won from or lost to competition
was still negative, but it was at a better level than at the end of the previous year. Another factor burdening the growth of the maintenance base was the usual impact from equipment taken out of use due to building closures.
The share of new equipment sales was 57% (55%) and the share of service sales 43% (45%) of total sales, with mainte-nance representing 31% (32%) and mod-ernization 12% (13%) of total sales. The geographical distribution of net sales was 39% (44%) EMEA, 17% (15%) Americas and 44% (41%) Asia-Pacific. The increase in the share of new equipment and Asia-Pacific was to a large extent due to changes in translation exchange rates. The largest individual countries in terms of net sales were China, the United States and France. China’s share was close to 35% and the United States’ share close to 15% of KONE’s total net sales in 2015.
Sales in the EMEA region grew by 5.1%, and totaled EUR 3,370 (3,205) million. At comparable exchange rates, the growth was 3.5%. New equipment and maintenance sales grew somewhat. Modernization sales declined slightly.
Sales in the Americas region grew by 33.2%, and totaled EUR 1,466 (1,101) million. At comparable exchange rates, the growth was 15.6%. Sales grew very strongly in new equipment and sig-nificantly in modernization. Maintenance sales grew somewhat.
Sales in the Asia-Pacific region grew by 25.8%, and totaled EUR 3,812 (3,029) million. At comparable exchange rates, the growth was 10.1% with clear growth in new equipment and significant growth in maintenance. Modernization sales saw a clear decline.
Financial result KONE’s operating income (EBIT) grew in 2015 and reached EUR 1,241 (1–12/2014: 1,036) million or 14.4% (14.1%) of net sales. Operating income grew driven by a positive development in both the new equipment and service businesses. The growth was driven by a broad-based positive development across geographical regions. Favorable translation exchange rates clearly contributed to the growth in operating income with a positive impact of approximately EUR 120 million. KONE continued to increase fixed costs in areas that support the growth of the business, in particular in Asia-Pacific and North
America as well as R&D, process develop-ment and IT.
Net financing items was EUR 122.4 (-19.1) million. An extraordinary dividend received from Toshiba Elevator and Build-ing Systems Corporation (TELC), amount-ing to EUR 118.2 million, had a strongly positive impact on financing income. Net financing items also included the revalua-tion of option liabilities from acquisitions, totaling EUR -36.9 million of which EUR 10.2 million was negative impact from exchange rates.
KONE’s income before taxes was EUR 1,364 (1,016) million. Taxes totaled EUR 311.4 (242.4) million. This represents an effective tax rate of 22.8% (23.9%) for the financial year. The main one-time items affecting the total effective tax rate for the full financial year were the extraor-dinary dividends received from TELC and the revaluation of option liabilities from acquisitions. The effective tax rate result-ing from the operations for the financial year was 23.2% (22.5%). Net income for the period under review was EUR 1,053 (773.9) million.
Basic earnings per share was EUR 2.01 (1.47). Basic earnings per share excluding the extraordinary dividend received from TELC was EUR 1.79.
Consolidated statement of financial position and Cash flow KONE’s financial position was very strong at the end of December 2015.
Cash flow from operations during January–December 2015 (before financ-ing items and taxes) was EUR 1,474 (1–12/2014: 1,345) million. The cash flow was driven by growth in operating income and continued favorable develop-ment in net working capital.
Net working capital improved, and was at the end of December 2015 EUR -983.4 (December 31, 2014: -749.7) mil-lion, including financing items and taxes. The impact from translation exchange rates was significantly positive on the reported net working capital, but also at comparable rates, net working capital improved from a very good level. This was a result of a strong level of advances received relative to inventories and good collection of accounts receivable.
Interest-bearing net debt at the end of December 2015 was EUR -1,513 (Decem-ber 31, 2014: -911.8) million. KONE’s cash and cash equivalents together with current deposits and loan receivables
54
KONE 2015 Financial Statements | Board of Directors’ report

KONE 2015 Financial Statements | Board of Directors’ report
were EUR 1,903 (1,279) million at the end of the reporting period. Interest-bearing liabilities were EUR 406.1 (373.2) million, including a net pension liability of EUR 169.2 (178.9) million and short-term loans of EUR 12.0 (12.0) million. In addition, the interest-bearing net debt includes EUR 192.4 (151.0) million of option liabilities from acquisitions. Gear-ing was -58.7%, compared with -44.2% at the end of 2014. KONE’s total equity/total assets ratio was 45.4% at the end of December 2015 (December 31, 2014: 43.6%).
Equity per share was EUR 4.94 (3.93).
Capital expenditure and acquisitions KONE’s capital expenditure, includ-ing acquisitions, totaled EUR 157.6 (1–12/2014: 154.8) million. Capital expenditure, excluding acquisitions, was mainly related to R&D, IT, business operations and production. Acquisitions accounted for EUR 64.9 (67.0) million of this figure.
During 2015, KONE’s acquisitions included the service companies Janzhoff Aufzüge GmbH and Klostermann Aufzüge GmbH in Germany as well as KONE’s authorized distributors in Croatia and Bosnia. In addition, KONE completed a number of smaller acquisitions in the EMEA region and in the United States dur-ing the reporting period. The acquisitions completed during the reporting period did not individually or as a whole have a material impact on the result or financial position of KONE.
Research and development Research and development expenses totaled EUR 121.7 (1–12/2014: EUR 103.1) million, representing 1.4% (1.4%) of net sales. R&D expenses include the development of new product and service concepts and the further development of existing solutions and services. KONE’s elevators and escalators are based on industry-leading energy efficient technol-ogy.
KONE’s customers and users are at the center of its research and development efforts. In accordance with its vision of delivering the best People Flow® experi-ence, KONE focuses on understanding the needs of its customers and the users of its solutions in order to make people flow in buildings smoother and to improve the user experience. The aim of one of
KONE’s five development programs, the Most Competitive People Flow® Solu-tions, is to offer industry-leading eleva-tors, escalators and automatic building doors, and to further develop KONE’s People Flow Intelligence solutions for the smart buildings of the future.
In 2015 KONE continued to enhance its offering, launching both a number of new solutions as well as enhancements to existing solutions. New solutions were released in various markets. In India, two new elevator models for the residential market were introduced, the KONE I MonoSpace® and the KONE I Mini-Space™. The new elevators are designed for low- and mid-rise apartment build-ings, providing customers and users with improved ride comfort and eco-efficiency as well as inspiring design. In China, KONE extended its offering in the afford-able housing segment with the launch of the KONE Z MiniSpace™ elevator. In North America, KONE’s offering was complemented with the launch for sales of the Turnstile 100 and the RemoteCall™ application, which allows the elevator to be called remotely from anywhere in the building with smartphone technology. KONE’s global escalator offering was improved with the launch of an updated version of the KONE TransitMaster™ 140 escalator targeted for the infrastructure segment. Other releases during the reporting period included new solutions for elevator electrification and signaliza-tion modernization in Europe and China.
KONE initiated elevator installations at the Jeddah Tower (formerly known as Kingdom Tower) construction site in Saudi Arabia during the second quarter of 2015. The world’s tallest building, sched-uled to be completed in 2018, will be equipped with KONE’s newest innovative technology including high-speed eleva-tors that are set to make a new record for an elevator ride’s vertical distance with 660 meters. In addition, KONE further strengthened its high-rise innovation capabilities in the fourth quarter by open-ing one of the tallest elevator test towers in the world at its R&D facility in Kunshan, China. With a height of 236 meters, the Kunshan test tower is the tallest among KONE’s testing facilities, and it comple-ments KONE’s over 300-meter-deep underground testing facility in Tytyri, Finland, allowing KONE to test elevators at various speeds.
In 2015, KONE was ranked 48th out of the 100 most innovative companies in the world by business magazine Forbes (2014: 42nd). Out of all European compa-nies listed, KONE was ranked fifth. KONE was listed by Forbes for the fifth consecu-tive year and was the only elevator and escalator company included on the list in 2015. In addition, KONE received recog-nition for its design during 2015. KONE was awarded two design awards, the iF Design Award and the Red Dot Product Design Award, for its KONE Turnstile 100 solution. KONE was recognized in the iF Design Awards already for the third time.
Change in the Board of DirectorsKazunori Matsubara, member of the Board of Directors of KONE since Febru-ary 23, 2015, tendered his resignation from the Board of Directors as of July 22, 2015. Kazunori Matsubara resigned from the Board following the sale by Toshiba Elevator and Building Systems Corpora-tion (TELC) of their previously held 4.6% stake in KONE Corporation’s share capital. Following the resignation of Kazunori Matsubara, the Board of Directors of KONE consists of eight members.
Changes in the Executive BoardIn September 2015, KONE announced the establishment of a new Technology & Innovation unit bringing together KONE’s Research & Development and IT functions. Tomio Pihkala was appointed KONE’s Chief Technology Officer to head the new unit as of January 1, 2016. Tomio Pihkala was previously responsible for KONE’s Operations Development. In his new position, he continues as a member of the Executive Board and reports to Henrik Ehrnrooth, President & CEO.
Mikko Korte was appointed Executive Vice President, Operations Development as of January 1, 2016. KONE Operations Development includes KONE’s installation operations as well as the quality, safety and environment functions. Mikko Korte was previously responsible for KONE’s new equipment business in the Americas region. In his new position he became a member of the Executive Board and reports to Henrik Ehrnrooth.
Personnel The objective of KONE’s personnel strat-egy is to help the company meet its busi-ness targets. The main goals of this strat-
6 6
egy are to further secure the availability, engagement, motivation and continuous development of the company’s personnel. All of KONE’s activities are guided by ethi-cal principles. The personnel’s rights and responsibilities include the right to a safe and healthy working environment, per-sonal well-being as well as the prohibition of any kind of discrimination.
One of the five development programs launched at the beginning of 2014 was defined as “A Winning Team of True Professionals.” The implementation of various initiatives within this program continued during 2015, and targets for 2016 were defined. The initiatives target to help all employees perform at their best, to enhance the systematic develop-ment of field competences, and to ensure the attraction of the right talent to all positions.
During 2015, in line with the target of helping all employees perform at their best, conducting high-quality per-formance discussions was a focus area at KONE. The share of employees with documented performance reviews and development plans showed a significant increase during the year. A record num-ber of employees also reported seeing a positive impact from the reviews on their personal development. In several coun-tries, special focus was paid to supervisor competence evaluations and develop-ment plans. In addition to the individual development planning, job rotation con-tinued as an important part of employee development at KONE. In 2015, a “Visit a job” concept was piloted to promote short term job rotation and the exchange of ideas across departments. In 2016, this concept will be further promoted and expanded, and actions to further improve the quality of performance evaluations will continue.
By the end of 2015, a majority of KONE’s personnel had access to the company’s online learning management system. With the increasing use of the system, over half of all active training registrations had been made for online modules at the end of the year. In addi-tion, KONE continued to invest in the training of field employees, especially in the more emerging markets, and started new partnerships to enhance competence building of maintenance technicians in China. The delivery of existing leadership and general management programs also continued as throughout the year.
KONE also continued focusing on talent attraction during the reporting period. Various employer branding and school collaboration activities took place, and KONE had apprentice programs in use in more than 20 countries. In addi-tion, KONE received over 2,000 applica-tions for its International Trainee Program, attracting top students and recent gradu-ates for assignments in an international working environment.
KONE carried out its tenth annual global employee survey with a record high response rate of 93% (2014: 91%). The overall results showed a further improvement, particularly in indicators measuring views on career opportunities, collaboration and the perceived quality of KONE’s products and services. Following the results, actions targeting identified improvement areas continued through-out the year extending also into 2016.
During the year, efforts to improve safety at work remained a high priority area at KONE. The IIFR (Industrial Injury Frequency Rate) improved further and was 2.3 in 2015 (2014: 2.8). KONE’s fourth annual Safety Week was held in all KONE units with the theme “Set an exam-ple”. Various safety-related activities were held during the week, both for internal and external stakeholders. Additionally, systematic internal sharing of practices and development ideas improving safety continued throughout the year. The indi-cator measuring KONE’s commitment to safety again received the highest single score in the annual employee survey.
KONE had 49,734 (December 31, 2014: 47,064) employees at the end of December 2015. The average number of employees was 48,469 (1–12/2014: 45,161). Employee costs for the reporting period totaled EUR 2,446 (2,100) million. The geographical distribution of KONE employees was 42% (December 31, 2014: 44%) in EMEA, 13% (12%) in the Americas and 45% (44%) in Asia-Pacific.
Environment For KONE, environmental responsibility is a combination of offering its custom-ers innovative solutions that are both energy- and cost-efficient, and reducing the adverse environmental impacts of its own operations. The focus in develop-ing eco-efficient solutions is on further improving energy-saving stand-by and hoisting solutions for elevators as well as innovative energy-saving solutions for
escalators. KONE aims to strengthen its position as a leader in sustainability in its industry, supporting governmental and other green building initiatives and the ongoing transformation of the built envi-ronment into smart eco-cities globally.
KONE has set ambitious environmental targets in its Environmental Excellence program for the years 2014–2016, with the focus on further improving the energy efficiency of its solutions as well as reduc-ing the adverse environmental impacts from its own operations. Overall, the most significant environmental impact comes from the energy used by KONE equipment during their lifetime, whereas the biggest impact on KONE’s carbon footprint from its own operations relates to the company’s vehicle fleet, electricity consumption, and logistics. KONE also continues to focus on the environmental aspects of its supply chain network.
As targeted in its Environmental Excel-lence program, KONE continued develop-ing the energy-efficiency of its solutions in 2015. KONE extended the classification coverage of its product range according to the new energy efficiency standard ISO 25745. In addition to eight elevator models classified already in the previous year, the KONE N MonoSpace® elevator also achieved the highest A-class clas-sification according to the new standard. Additionally, the KONE TravelMaster™ 110 escalator achieved the highest A+++ classification for escalators. In addition, KONE renewed the Green Label certifi-cations of the Singapore Green Building Council for the KONE N MiniSpace™ and KONE N MonoSpace® elevators.
In addition to its solutions, KONE’s manufacturing and office facilities also received recognition for their sustain-ability in 2015. The manufacturing unit in Italy achieved the ISO 50001 Energy management systems certification as the second KONE unit, in addition to the pre-viously certified unit in the Czech Repub-lic. In addition, the building housing the new head office of KONE’s subsidiary in Finland was awarded LEED Platinum green building certification.
In June 2015, KONE published its Sustainability Report 2014. The report follows the application level B of the Global Reporting Initiative guidelines. The most significant environmental achieve-ments in 2014 included reductions in reported greenhouse gas emissions from the company’s own operations. KONE’s
76
KONE 2015 Financial Statements | Board of Directors’ report
KONE 2015 Financial Statements | Board of Directors’ report
2014 carbon footprint relative to overall operations (net sales) decreased by 1.8% compared to 2013. KONE’s greenhouse gas reporting has been assured by an objective third party.
KONE’s score in CDP’s (formerly known as Carbon Disclosure Project) cli-mate change program further improved to the best possible 100 A in 2015 (2014: 100 A-). The program is designed to enable the management of greenhouse gas emissions and the risks and opportu-nities associated with climate change. In addition to carbon disclosure, CDP evalu-ates companies on their performance for mitigating climate change on a scale of A to E, with scores A to B considered high performance. In 2015, KONE reached the highest A score for the first time and was included on CDP’s global A List of 113 leading companies. For the fifth year running, KONE achieved a top posi-tion on CDP’s Nordic Climate Disclosure Leadership Index (CDLI) featuring the best 10% of companies included in the CDP Nordic report. Additionally, KONE was ranked in 2015 as one of the world’s most sustainable companies and included in the Global 100 index fund managed by investment advisory company Corporate Knights. Ranked 28th, KONE is the only elevator and escalator company in the index.
As a signatory of the United Nations Global Compact, KONE supports the new UN agenda for Sustainable Development launched in the autumn of 2015, which addresses the social, economic and envi-ronmental dimensions of sustainability. KONE’s solutions help in addressing the challenges created by urbanization, cli-mate change, demographic change and increased safety demands, all of which are covered by the new agenda. In December 2015, KONE also signed the Paris Pledge for Action supporting the objectives of the Paris Agreement on climate change.
Other events In 2007 a decision was issued by the Euro-pean Commission concerning alleged local anticompetitive practices before early 2004 in Germany, Luxembourg, Belgium and the Netherlands by lead-ing elevator and escalator companies, including KONE’s local subsidiaries. Also, the Austrian Cartel Court issued in 2007 a decision concerning anticompetitive practices that had taken place before mid-2004 in local Austrian markets by leading
elevator and escalator companies, includ-ing KONE’s local subsidiary. As announced by KONE earlier, a number of civil dam-age claims by certain companies and public entities, relating to the two 2007 decisions, are pending in related coun-tries. The claims have been made against various companies concerned by the deci-sions, including certain KONE companies. All claims are independent and are pro-gressing procedurally at different stages. The total capital amount claimed jointly and severally from all of the defendants together was EUR 262 million at the end of December 2015 (December 31, 2014: EUR 280 million). KONE’s position is that the claims are without merit. No provision has been made.
Risk management KONE is exposed to risks that may arise from its operations or changes in the business environment. The risk factors described below can potentially have an adverse effect on KONE’s business operations and financial position and, as a result, on the value of the company. Other risks, which are currently either unknown or considered immaterial to KONE may, however, become material in the future.
A weakening of the global economic environment or an increase in geopoliti-cal tensions could result in a deterioration of the market environment and the competitive situation in the global new equipment, modernization and mainte-nance markets. In particular, a disruption in the construction market or prolonged market weakness could result in a sig-nificant decline of the market for new elevators and escalators and a more chal-lenging market environment in services. Such a decline in the market in China, the EMEA region or other regions that form a substantial part of KONE’s orders, sales or profits, could lead to a decline in orders received, cancellations or delays of agreed deliveries and projects, or further intensified price competition, which could all, as a result, have a negative impact on KONE’s growth and profitability. To counteract the pressures resulting from a possible deterioration of the economic environment and its impact on the eleva-tor and escalator markets, KONE strives to continuously develop its competitiveness.
KONE operates in an industry with various local regulatory requirements in both the new equipment and service busi-nesses. Sudden or unanticipated changes
in regulations, codes or standards may result in a need for process or technology adjustments, which could adversely affect KONE’s profit development in affected countries. In order to mitigate the risk of unanticipated changes in the regulatory environment, KONE is actively involved in the development of regulations, codes and standards that aim to further improve the safety and other technologi-cal features of elevators, escalators and automatic doors.
KONE introduces new technology and continuously develops the competitive-ness of its existing offering and solutions based on anticipated future developments in relevant technologies, customer needs and market requirements. The develop-ment of new technology and execution of product releases involve risks related to the functioning of the delivery chain as well as product integrity and quality. Additionally, a failure to anticipate or address changes in the external environ-ment – including the industry and end markets, the competitive environment, relevant technology, or customer needs and behavior – could result in a deteriora-tion of KONE’s growth, competitiveness, market share or profitability. Such risks could materialize also in the case of an incident causing reputational or other damage to the company. To mitigate these risks, KONE has processes in place for product design, supply, manufac-turing, installation and maintenance involving strict quality control. KONE also follows closely emerging trends in the industry and markets as well as the developments in various fields of new technology.
KONE operates in certain high growth markets, where focused management of rapid business growth is required. This applies in particular to the availability of skilled personnel, the adequate supply of components and materials, and the ability to ensure the quality of deliv-ered products and services. Failure to adequately manage resourcing, quality of delivery, or other critical aspects in proj-ects, could result in delays in deliveries and unplanned costs, which in turn could have an adverse impact on the profit-ability of the company. KONE manages these risks through proactive project and resource planning and strict quality con-trol processes.
KONE’s business activities are depen-dent on the uninterrupted operation,
8 8

quality and reliability of its manufacturing facilities, sourcing channels, and logistics processes. A significant part of KONE’s component suppliers and global supply capacity is located in China, both in the elevator and in the escalator business. The risks related to the supply chain are con-trolled by analyzing and improving the fault tolerance of processes, focusing on diligent forecasting, fostering close coop-eration with KONE’s suppliers, and by increasing the readiness for transferring the manufacturing of critical components from one production line or supplier to another. KONE actively monitors the operations and financial strength of its key suppliers. The aim is also to secure the availability of alternative sourcing chan-nels for critical components and services. Additionally, KONE has a global property damage and business interruption insur-ance program in place.
KONE’s operations utilize information technology extensively and its business is dependent on the quality and avail-ability of information. This may expose KONE to information security violations, the misuse, theft or other loss of systems and/or data, viruses, malwares and to such malfunctions, which can result in system failures or disruptions in processes and therefore impact KONE’s business. Clear roles and responsibilities have been defined to manage IT security risks to ensure that adequate security is inbuilt within the IT management processes according to security policies, principles and guidelines. KONE uses trusted and well known technology partners to miti-gate information-related risks in all parts of its operations.
Changes in prices of raw materials and components are reflected in the produc-tion costs of elevators, escalators and automatic doors, and may therefore have a significant impact on KONE’s profitabil-ity. In order to reduce the impact of mate-rial and sourcing price fluctuation, KONE aims to enter into fixed-price contracts with its major suppliers for a significant part of its raw material and component purchases whenever feasible and relevant considering the market situation.
KONE is exposed to counterparty risks related to financial institutions through the significant amounts of liquid funds deposited with financial institutions, financial investments and in derivatives. In order to diversify the financial credit risk, KONE deposits its funds into several
banks and invests a part of its liquidity into highly liquid money market funds. KONE also manages its counterparty risk by accepting only counterparties with high creditworthiness. The size of each counterparty limit reflects the creditwor-thiness of the counterparty and KONE constantly evaluates such limits.
KONE is also exposed to risks related to the liquidity and payment schedules of its customers, which may lead to credit losses. To mitigate this risk, defined rules for tendering, levels of approval authority, and credit control have been established. The risks related to accounts receivable are minimized also through the use of advance payments, documentary cred-its and guarantees in KONE’s payment terms. KONE’s customer base consists of a large number of customers in several market areas, with no individual customer representing a material share of KONE’s sales.
KONE operates internationally and is thus exposed to risks arising from foreign exchange rate fluctuations related to cur-rency flows from revenues and expenses, as well as from the translation of income statement and statement of financial position items of foreign subsidiaries into euros. The KONE Treasury is responsible for the centralized management of finan-cial risks in accordance with the KONE Treasury Policy approved by the Board of Directors.
For further information regarding financial risks, please refer to note 2 in the consolidated Financial Statements for 2015.
Decisions of the Annual General Meeting KONE Corporation’s Annual General Meeting was held in Helsinki on Febru-ary 23, 2015. The meeting approved the financial statements and discharged the responsible parties from liability for the financial period January 1–December 31, 2014.
The number of Members of the Board of Directors was confirmed as nine. Re-elected as Members of the Board were Matti Alahuhta, Anne Brunila, Antti Herlin, Jussi Herlin, Ravi Kant, Juhani Kaskeala and Sirpa Pietikäinen. Iiris Herlin and Kazunori Matsubara were elected as new Members of the Board.
At its meeting held after the General Meeting, the Board of Directors elected from among its members Antti Herlin
as its Chairman and Jussi Herlin as Vice Chairman.
Jussi Herlin was elected as Chairman and Anne Brunila, Antti Herlin and Ravi Kant as members of the Audit Com-mittee. Anne Brunila and Ravi Kant are independent of both the company and of significant shareholders. Jussi Herlin was independent of the company until Janu-ary 10, 2016, after which he has become employed by the company.
Antti Herlin was elected as Chairman and Matti Alahuhta, Jussi Herlin and Juhani Kaskeala as members of the Nomi-nation and Compensation Committee. Juhani Kaskeala is independent of both the company and of significant sharehold-ers and Matti Alahuhta is independent of significant shareholders.
The General Meeting confirmed an annual compensation of EUR 54,000 for the Chairman of the Board, EUR 44,000 for the Vice Chairman and EUR 33,000 for Board Members. In addition, a compensa-tion of EUR 500 was approved for atten-dance at Board and Committee meetings, but such that an EUR 2,000 compensation for Committee meetings will be paid for members residing outside of Finland. Of the annual remuneration, 40 percent will be paid in class B shares of KONE Corpo-ration and the rest in cash.
The General Meeting approved the authorization for the Board of Directors to repurchase KONE’s own shares. Alto-gether no more than 52,440,000 shares may be repurchased, of which no more than 7,620,000 may be class A shares and 44,820,000 class B shares. The authoriza-tion shall remain in effect for a period of one year from the date of decision of the General Meeting.
Further, the General Meeting autho-rized the Board of Directors to decide on the issuance of shares as well as the issuance of options and other special rights entitling to shares referred to in chapter 10 section 1 of the Finnish Com-panies Act. The amount of shares to be issued based on this authorization shall not exceed 7,620,000 class A shares and 44,820,000 class B shares. The Board of Directors decides on all the conditions of the issuance of shares and of special rights entitling to shares. The authorization concerns both the issuance of new shares as well as the transfer of treasury shares. The issuance of shares and of special rights entitling to shares may be carried out in deviation from the shareholders’
98
KONE 2015 Financial Statements | Board of Directors’ report

KONE 2015 Financial Statements | Board of Directors’ report
pre-emptive rights (directed issue). The authorization shall remain in effect for a period of five years following the date of decision of the General Meeting.
Authorized public accountants Price-waterhouseCoopers Oy and Niina Vilske were nominated as the Company’s audi-tors.
The General Meeting approved dividends of EUR 1.1975 for each of the 76,208,712 class A shares and EUR 1.20 for each of the outstanding 437,517,818 class B shares. The date of record for dividend distribution was February 25, 2015 and dividends were paid on March 4, 2015.
Share capital and Market capitalization In 2010, KONE granted a conditional option program. The 2010 stock options were listed on the Nasdaq Helsinki Ltd. on April 2, 2013. Each option entitled its holder to subscribe for two (2) new class B shares at the price of, from February 24, 2015, EUR 11.875 per share. As the sub-scription period ended on April 30, 2015, the 896,000 KONE 2010 option rights held by KONE Capital Oy, a subsidiary of KONE Corporation, and otherwise unused 105 KONE 2010 option rights expired. The rest of the remaining 2,103,895 options had been used.
In 2013, KONE granted a conditional option program. The stock options 2013 were listed on Nasdaq Helsinki Ltd. as of April 1, 2015. The total number of stock options was 750,000 and 55,000 of them are held by KONE Corporation’s subsid-iary. During the reporting period 126,284 new KONE class B shares were sub-scribed for with the 2013 option rights. On December 31, 2015 a maximum of 1,263,716 shares could be subscribed for with the remaining outstanding option rights. Each option entitles its holder to subscribe for two (2) new class B shares at the price of, from February 24, 2015, EUR 25.40 per share. The share subscription period for the stock option 2010 is April 1, 2015–April 30, 2017.
In December 2013, KONE granted a conditional option program. Stock options 2014 are granted according to the decision of the Board of Directors on December 20, 2013 to approximately 550 key employees and the decision was based on the authorization received from the Shareholders Meeting on March 1, 2010. A maximum total of 1,500,000
options are granted. The original share subscription price for the option was EUR 31.80 per share and it is further reduced in situations mentioned in the terms, for example with dividends distributed before the subscription of the shares. The effective subscription price as per December 31, 2015 was EUR 29.60. Each option entitles its holder to subscribe for one (1) new or existing company’s own class B KONE share. The share subscrip-tion period for the stock options 2014 is April 1, 2016–April 30, 2018. The share subscription period begins April 1, 2016, since the financial performance of the KONE Group for the financial years 2014–2015, based on the total consideration of the Board of Directors, has been equal to or better than the average performance of the key competitors of KONE.
In December 2014, KONE granted a conditional option program. Stock options 2015 are granted according to the decision of the Board of Directors on December 18, 2014 to approximately 560 key employees. The decision was based on the authorization received from the shareholders’ meeting on March 1, 2010. A maximum total of 1,500,000 options are granted. The original share subscrip-tion price for the option is EUR 36.20 per share and it is further reduced in situa-tions mentioned in the terms, for example with dividends distributed before the subscription of the shares. The effective subscription price as per December 31, 2015 was EUR 35.00. Each stock option entitles its holder to subscribe for one (1) new or an existing company’s own class B KONE share. The share subscription period for the stock options 2015 will be April 1, 2017–April 30, 2019. The share subscription period begins only if the financial performance of the KONE Group for the financial years 2015–2016 based on the total consideration of the Board of Directors is equal to or better than the average performance of the key competi-tors of KONE.
In December 2015, KONE’s Board of Directors decided that KONE’s share-based remuneration will be based on two separate plans starting from the financial year 2016. One share-based incentive plan will be targeted for the senior management of KONE, including the President and CEO, members of the Executive Board and other top manage-ment, consisting of approximately 60 individuals. A second plan will be targeted
for other key personnel of KONE, totaling approximately 425 individuals. The incen-tive plans will be part of these individuals’ remuneration starting from the financial year 2016. According to the decision, the potential reward is based on the annual growth in sales and earnings before interest and taxes (EBIT) in both plans. However, KONE’s Board of Directors has the possibility to change the basis of the target setting annually. The potential reward is to be paid as a combination of KONE class B shares and a cash pay-ment equivalent to the taxes and similar charges that are incurred from the receipt of the shares. Plans include conditions preventing participants from transferring and participants are obliged to return the shares and the cash payments if employ-ment or service contract is terminated during a period of two years following the ending of each earning period. Following the decision, KONE does not grant new stock option plans. The current existing stock option plans 2013, 2014 and 2015 shall be carried out based on the original terms of these programs.
On December 31, 2015, KONE’s share capital was EUR 65,675,789.25 compris-ing 449,197,602 listed class B shares and 76,208,712 unlisted class A shares. KONE’s market capitalization was EUR 20,101 million on December 31, 2015, disregarding own shares in the Group’s possession. Market capitalization is cal-culated on the basis of both the listed B shares and the unlisted A shares excluding treasury shares. Class A shares are valued at the closing price of the class B shares at the end of the reporting period.
Shares in KONE’s possession During January–December 2015, KONE used its authorization to repurchase own shares. In April, 354,838 class B shares in the company’s possession were assigned to the share-based incentive plan and 3,210 class B shares as a part of the board members’ annual remuneration. In July, 5,194 class B shares were returned to KONE Corporation by virtue of the terms of KONE Corporation’s share-based incen-tive program for the years 2013–2015. In addition, KONE bought back in total 1,910,000 of its own class B shares in July. At the end of December, the Group had 12,240,544 class B shares in its posses-sion. The shares in the Group’s possession represent 2.7% of the total number of
10 10
class B shares. This corresponds to 1.0% of the total voting rights.
Shares traded on the Nasdaq Helsinki Ltd. The Nasdaq Helsinki Ltd. traded 259.2 million KONE Corporation’s class B shares in January–December 2015, equivalent to a turnover of EUR 9,930 million. The daily average trading volume was 1,032,543 shares (1–12/2014: 945,356). The share price on December 31, 2015 was EUR 39.17. The volume weighted average share price during the period was EUR 38.29. The highest quotation during the period under review was EUR 44.35 and the lowest EUR 31.50. In addition to the Nasdaq Helsinki Stock Exchange, KONE’s class B share is traded also on various alternative trading platforms. The volume of KONE’s B shares traded on the Nasdaq Helsinki Stock Exchange repre-sented approximately 31.0% of the total volume of KONE’s class B shares traded in January–December 2015 (source: Fidessa Fragmentation Index, http://fragmenta-tion.fidessa.com).
The number of registered sharehold-ers was 51,075 at the beginning of the review period and 56,441 at its end. The number of private households holding shares totaled 52,507 at the end of the period, which corresponds to approxi-mately 13.5% of the listed B shares.
According to the nominee registers, 49.3% of the listed class B shares were owned by foreign shareholders on December 31, 2015. Other foreign own-
ership at the end of the period totaled 1.3%. Thus a total of 50.6% of KONE’s listed class B shares were owned by international investors, corresponding to approximately 18.8% of the total votes in the company.
Market outlook 2016 In new equipment, the market in China is expected to decline by 5–10% in units ordered and also the price competition to continue intense. In the rest of Asia-Pacific and in North America, the market is expected to see some growth. Also the market in Europe, Middle East and Africa region is expected to grow slightly with growth in Central and North Europe and a more stable development in South Europe and the Middle East.
The modernization market is expected to grow slightly in Europe, to continue to grow in North America, and to develop strongly in Asia-Pacific.
Maintenance markets are expected to see the strongest growth rate in Asia-Pacific, and to develop rather well also in other regions.
Business outlook 2016 KONE’s net sales is estimated to grow by 2–6% at comparable exchange rates as compared to 2015.
The operating income (EBIT) is expected to be in the range of EUR 1,220–1,320 million, assuming that trans-lation exchange rates would remain at approximately the average level of Janu-ary 2016.
The Board’s proposal for the distribution of profitThe parent company’s non-restricted equity on December 31, 2015 is EUR 1,765,223,548.43 of which the net profit for the financial year is EUR 1,200,968,239.16.
The Board of Directors proposes to the Annual General Meeting that a dividend of EUR 1.3975 be paid on the outstanding 76,208,712 class A shares and EUR 1.40 on the outstanding 436,957,058 class B shares, resulting in a total amount of pro-posed dividends of EUR 718,241,556.22.
The Board of Directors further pro-poses that the remaining non-restricted equity, EUR 1,046,981,992.21 be retained and carried forward.
The Board proposes that the dividends be payable from March 16, 2016. All the shares existing on the dividend record date are entitled to dividend for the year 2015 except for the own shares held by the parent company.
Annual General Meeting 2016KONE Corporation’s Annual General Meeting will be held at 11.00 a.m. on Monday, March 7, 2016 at the Finlandia Hall, Mannerheimintie 13, in Helsinki, Finland.
Helsinki, January 28, 2016
KONE Corporation’s Board of Directors
This report contains forward-looking statements that are based on the current expectations, known factors, decisions and plans of the management of KONE. Although the management believes that the expectations reflected in such forward-looking statements are reasonable, no assurance can be given that such expectations will prove to be correct. Accordingly, results could differ materially from those implied in the forward-looking statements as a result of, among other factors, changes in economic, market and competitive conditions, changes in the regulatory environment and other govern-ment actions as well as fluctuations in exchange rates.
Information required by the Companies’ Act and the Decree of the Ministry of Finance on the Regular Duty of Disclosure of an Issuer of a Security, such as classes of shares, shareholders, related parties, terms of stock options and financial key figures have been presented in the notes to the Financial Statements.
1110
KONE 2015 Financial Statements | Board of Directors’ report
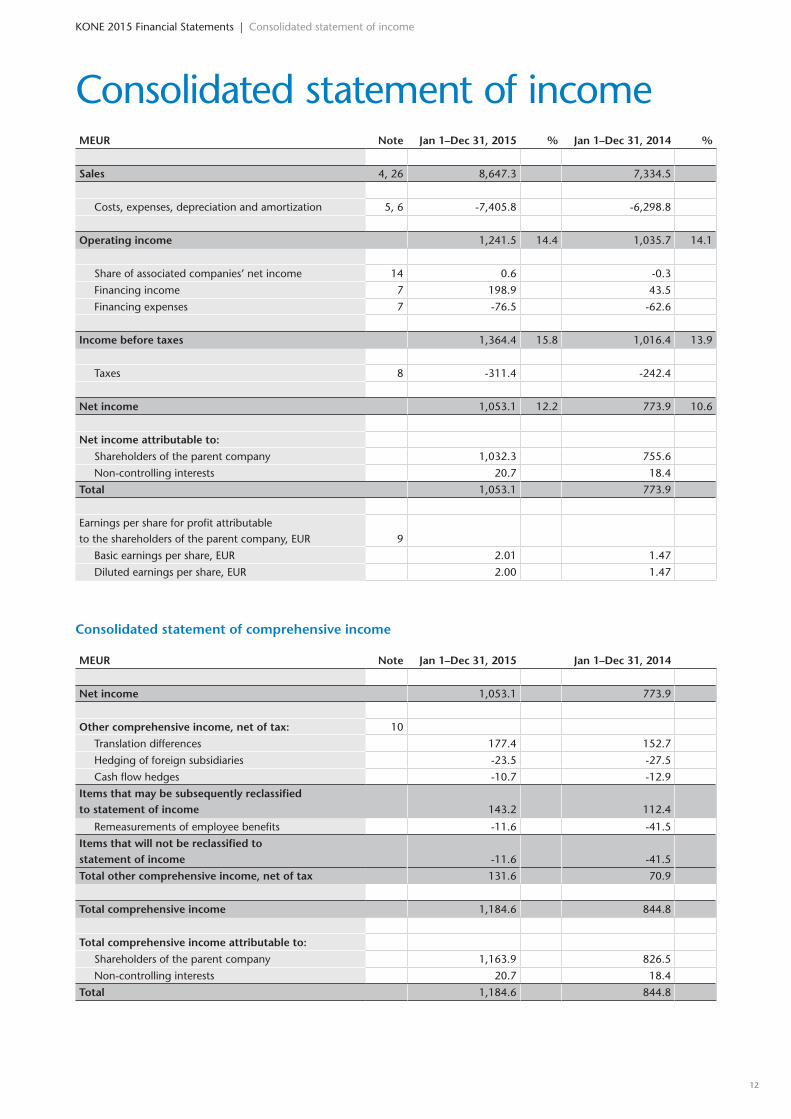
Consolidated statement of incomeMEUR Note Jan 1–Dec 31, 2015 % Jan 1–Dec 31, 2014 %
Sales 4, 26 8,647.3 7,334.5
Costs, expenses, depreciation and amortization 5, 6 -7,405.8 -6,298.8
Operating income 1,241.5 14.4 1,035.7 14.1
Share of associated companies’ net income 14 0.6 -0.3
Financing income 7 198.9 43.5
Financing expenses 7 -76.5 -62.6
Income before taxes 1,364.4 15.8 1,016.4 13.9
Taxes 8 -311.4 -242.4
Net income 1,053.1 12.2 773.9 10.6
Net income attributable to:
Shareholders of the parent company 1,032.3 755.6
Non-controlling interests 20.7 18.4
Total 1,053.1 773.9
Earnings per share for profit attributable to the shareholders of the parent company, EUR 9
Basic earnings per share, EUR 2.01 1.47
Diluted earnings per share, EUR 2.00 1.47
Consolidated statement of comprehensive income
MEUR Note Jan 1–Dec 31, 2015 Jan 1–Dec 31, 2014
Net income 1,053.1 773.9
Other comprehensive income, net of tax: 10
Translation differences 177.4 152.7
Hedging of foreign subsidiaries -23.5 -27.5
Cash flow hedges -10.7 -12.9
Items that may be subsequently reclassified to statement of income 143.2 112.4
Remeasurements of employee benefits -11.6 -41.5
Items that will not be reclassified to statement of income -11.6 -41.5
Total other comprehensive income, net of tax 131.6 70.9
Total comprehensive income 1,184.6 844.8
Total comprehensive income attributable to:
Shareholders of the parent company 1,163.9 826.5
Non-controlling interests 20.7 18.4
Total 1,184.6 844.8
KONE 2015 Financial Statements | Consolidated statement of income
12 12

Consolidated statement of financial positionAssets MEUR Note Dec 31, 2015 Dec 31, 2014
Non-current assets Goodwill 11 1,306.7 1,208.9Other intangible assets 12 271.5 261.8Property, plant and equipment 13 345.4 317.1Investments in associated companies 14 4.4 4.5Shares and other non-current financial assets 2, 15 118.3 108.0Non-current loans receivable I 2, 16 7.0 6.3Employee benefits I 2, 22 8.4 -Deferred tax assets II 17 299.7 262.8
Total non-current assets 2,361.4 2,169.4 Current assets
Inventories II 18 1,326.7 1,211.8Accounts receivable II 2 1,480.2 1,368.3Deferred assets II 2, 19 391.6 284.7Income tax receivables II 42.4 47.2Current deposits and loans receivable I 2, 16 1,350.6 942.7Cash and cash equivalents I 2 552.7 336.1
Total current assets 5,144.2 4,190.6
Total assets 7,505.6 6,360.0
Equity and liabilities MEUR Note Dec 31, 2015 Dec 31, 2014 Capital and reserves attributable to the shareholders of the parent company
Share capital 20 65.7 65.6Share premium account 100.3 100.3Paid-up unrestricted equity reserve 140.7 127.0Fair value and other reserves -16.2 -5.5Translation differences 272.1 118.3Remeasurements of employee benefits -103.6 -92.0Retained earnings 2,068.5 1,704.2
Total shareholders’ equity 2,527.5 2,017.8 Non-controlling interests 48.0 44.5 Total equity 2,575.5 2,062.4 Non-current liabilities
Loans I 2 32.5 31.2Employee benefits I 2, 22 169.2 178.9Deferred tax liabilities II 17 140.9 110.6
Total non-current liabilities 342.6 320.8 Provisions II 23 173.6 137.4 Current liabilities
Current portion of long-term loans I 2 10.9 9.3Short-term loans and other liabilities I 2 193.5 153.8Advance payments received II 24 1,829.4 1,628.7Accounts payable II 2 728.9 597.1Accruals II 2, 24 1,575.2 1,371.0Income tax payables II 76.0 79.6
Total current liabilities 4,414.0 3,839.4 Total equity and liabilities 7,505.6 6,360.0
Items designated ” I ” comprise interest-bearing net debt.Items designated ” II ” comprise net working capital.
KONE 2015 Financial Statements | Consolidated statement of financial position
1312
Consolidated statement of changes in equity
MEUR No
te
Shar
e ca
pit
al
Shar
e p
rem
ium
ac
coun
tPa
id-u
p
unre
stri
cted
eq
uity
res
erve
Fair
val
ue a
nd
o
ther
res
erve
s
Tran
slat
ion
d
iffe
ren
ces
Rem
easu
rem
ents
o
f em
plo
yee
ben
efits
Ow
n
shar
es
Ret
ain
ed
earn
ing
s
Net
inco
me
fo
r th
e p
erio
d
No
n-c
on
tro
llin
g
inte
rest
s
Tota
l eq
uity
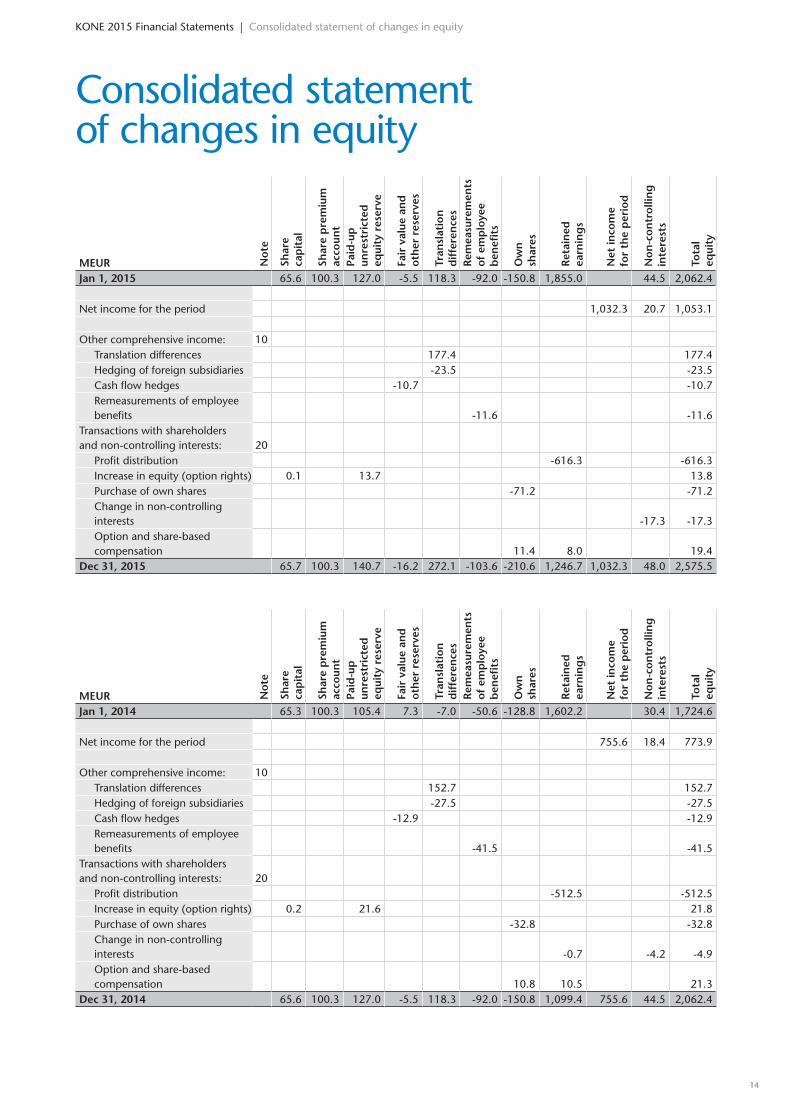
Jan 1, 2015 65.6 100.3 127.0 -5.5 118.3 -92.0 -150.8 1,855.0 44.5 2,062.4
Net income for the period 1,032.3 20.7 1,053.1
Other comprehensive income: 10Translation differences 177.4 177.4Hedging of foreign subsidiaries -23.5 -23.5Cash flow hedges -10.7 -10.7Remeasurements of employee benefits -11.6 -11.6
Transactions with shareholders and non-controlling interests: 20
Profit distribution -616.3 -616.3Increase in equity (option rights) 0.1 13.7 13.8Purchase of own shares -71.2 -71.2Change in non-controlling interests -17.3 -17.3Option and share-based compensation 11.4 8.0 19.4
Dec 31, 2015 65.7 100.3 140.7 -16.2 272.1 -103.6 -210.6 1,246.7 1,032.3 48.0 2,575.5
MEUR No
te
Shar
e ca
pit
al
Shar
e p
rem
ium
ac
coun
tPa
id-u
p
unre
stri
cted
eq
uity
res
erve
Fair
val
ue a
nd
o
ther
res
erve
s
Tran
slat
ion
d
iffe
ren
ces
Rem
easu
rem
ents
o
f em
plo
yee
ben
efits
Ow
n
shar
es
Ret
ain
ed
earn
ing
s
Net
inco
me
fo
r th
e p
erio
d
No
n-c
on
tro
llin
g
inte
rest
s
Tota
l eq
uity
Jan 1, 2014 65.3 100.3 105.4 7.3 -7.0 -50.6 -128.8 1,602.2 30.4 1,724.6
Net income for the period 755.6 18.4 773.9
Other comprehensive income: 10Translation differences 152.7 152.7Hedging of foreign subsidiaries -27.5 -27.5Cash flow hedges -12.9 -12.9Remeasurements of employee benefits -41.5 -41.5
Transactions with shareholders and non-controlling interests: 20
Profit distribution -512.5 -512.5Increase in equity (option rights) 0.2 21.6 21.8Purchase of own shares -32.8 -32.8Change in non-controlling interests -0.7 -4.2 -4.9Option and share-based compensation 10.8 10.5 21.3
Dec 31, 2014 65.6 100.3 127.0 -5.5 118.3 -92.0 -150.8 1,099.4 755.6 44.5 2,062.4
KONE 2015 Financial Statements | Consolidated statement of changes in equity
14 14
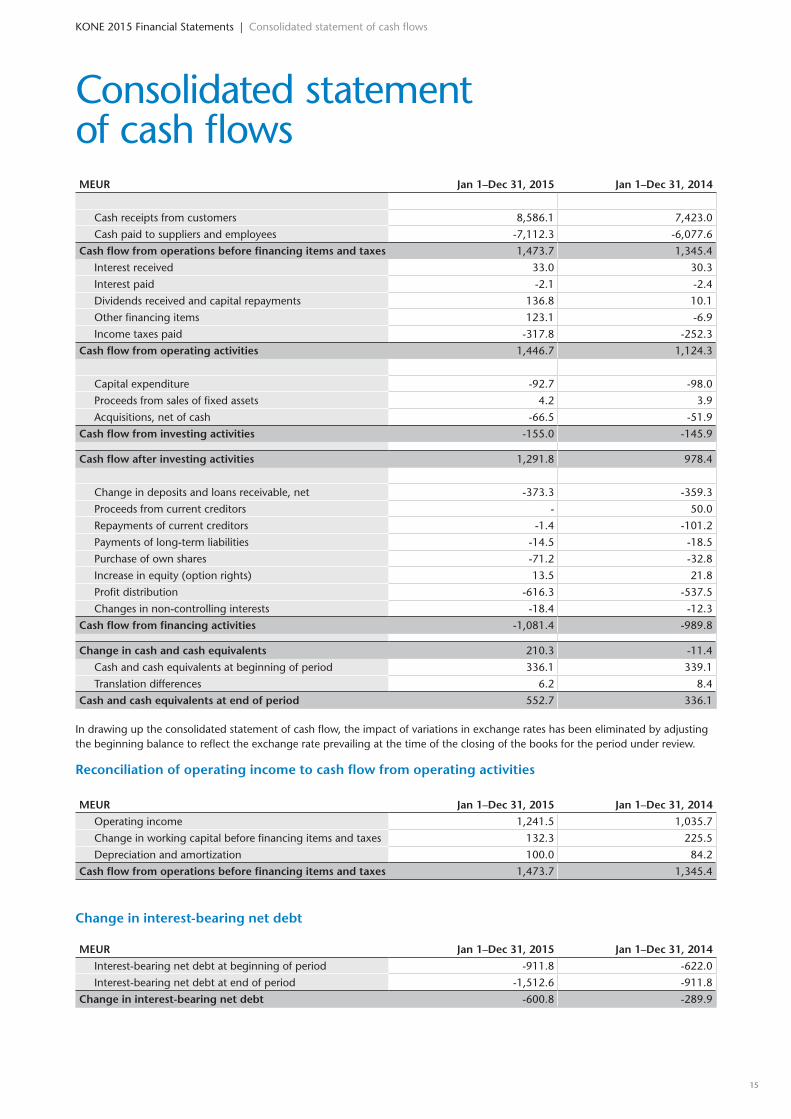
MEUR Jan 1–Dec 31, 2015 Jan 1–Dec 31, 2014
Cash receipts from customers 8,586.1 7,423.0
Cash paid to suppliers and employees -7,112.3 -6,077.6
Cash flow from operations before financing items and taxes 1,473.7 1,345.4
Interest received 33.0 30.3
Interest paid -2.1 -2.4
Dividends received and capital repayments 136.8 10.1
Other financing items 123.1 -6.9
Income taxes paid -317.8 -252.3
Cash flow from operating activities 1,446.7 1,124.3
Capital expenditure -92.7 -98.0
Proceeds from sales of fixed assets 4.2 3.9
Acquisitions, net of cash -66.5 -51.9
Cash flow from investing activities -155.0 -145.9
Cash flow after investing activities 1,291.8 978.4
Change in deposits and loans receivable, net -373.3 -359.3
Proceeds from current creditors - 50.0
Repayments of current creditors -1.4 -101.2
Payments of long-term liabilities -14.5 -18.5
Purchase of own shares -71.2 -32.8
Increase in equity (option rights) 13.5 21.8
Profit distribution -616.3 -537.5
Changes in non-controlling interests -18.4 -12.3
Cash flow from financing activities -1,081.4 -989.8
Change in cash and cash equivalents 210.3 -11.4
Cash and cash equivalents at beginning of period 336.1 339.1
Translation differences 6.2 8.4
Cash and cash equivalents at end of period 552.7 336.1
In drawing up the consolidated statement of cash flow, the impact of variations in exchange rates has been eliminated by adjusting the beginning balance to reflect the exchange rate prevailing at the time of the closing of the books for the period under review.
Reconciliation of operating income to cash flow from operating activities
MEUR Jan 1–Dec 31, 2015 Jan 1–Dec 31, 2014
Operating income 1,241.5 1,035.7
Change in working capital before financing items and taxes 132.3 225.5
Depreciation and amortization 100.0 84.2
Cash flow from operations before financing items and taxes 1,473.7 1,345.4
Change in interest-bearing net debt
MEUR Jan 1–Dec 31, 2015 Jan 1–Dec 31, 2014
Interest-bearing net debt at beginning of period -911.8 -622.0
Interest-bearing net debt at end of period -1,512.6 -911.8
Change in interest-bearing net debt -600.8 -289.9
Consolidated statement of cash flows
KONE 2015 Financial Statements | Consolidated statement of cash flows
1514
Notes to the consolidated financial statements1. ACCOUNTING PRINCIPLES
Basis of presentationKONE Corporation is a Finnish, public limited company domiciled in Helsinki, Fin-land. KONE Corporation and its subsidiar-ies together form the consolidated KONE Group (“KONE” or “the Group”). KONE’s objective is to offer the best People Flow experience by developing and deliver-ing solutions that enable people to move smoothly, safely, comfortably and without waiting in buildings in an increasingly urbanizing environment. KONE provides its customers with industry-leading eleva-tors, escalators, automatic doors and inte-grated solutions to improve the customer experience in and between buildings. In addition, KONE offers maintenance and modernization services for existing equip-ment.
The consolidated financial statements of KONE Corporation have been prepared in accordance with the International Finan-cial Reporting Standards (IFRS) as adopted by the European Union, observing the standards and interpretations effective on December 31, 2015.
KONE has adopted the new standards and interpretations that took effect during the accounting period and are relevant to its operations. The changes did not have a material impact on the result or the financial position of the Group or on the presentation of the financial statements.
The IFRS standards that take effect in 2016 are not expected to have a material impact on the result or the financial posi-tion of the Group or on the presentation of the financial statements.
The International Accounting Standards Board has issued three new standards, IFRS 15, Revenue from Contracts with Custom-ers, IFRS 9, Financial Instruments and IFRS 16, Leases which are relevant to KONE. IFRS 15 and IFRS 9 are effective starting on January 1, 2018 and IFRS 16 on Janu-ary 1, 2019. The European Union has not yet endorsed the standards. IFRS 15 estab-lishes a new five-step model that will apply to revenue arising from contracts with cus-tomers. Revenue is recognized when, or as, the customer obtains control of the goods or services in an amount that reflects the consideration to which the entity expects to be entitled in exchange for those goods or services. In addition, IFRS 15 requires a set of quantitative and qualitative dis-closures. IFRS 9 includes revised guidance on the classification and measurement of financial instruments, a new expected credit loss model for calculating impair-ment on financial assets, and new general
hedge accounting requirements. IFRS 16 requires lessees to recognize a lease liabil-ity reflecting future lease payments and a ‘right-of-use’ asset for virtually all lease contracts. KONE is currently assessing the potential impacts of the standards.
The consolidated financial statements have been prepared for the accounting period of 12 months from January 1 to December 31, 2015. The financial state-ments have been authorized for issue by the Board of Directors of KONE Corpora-tion on January 28, 2016. According to the Finnish Companies’ Act the Annual General Meeting has the right to approve, reject or make changes to the financial statements after the publication.
The consolidated financial statements are presented in millions of euros and prepared under the historical cost conven-tion except as disclosed below. Figures presented in these financial statements have been rounded from exact figures and therefore the sum of figures presented individually can deviate from the presented sum figure. Key figures have been calcu-lated using exact figures.
Trade date accounting is applied to all financial assets and liabilities.
Consolidation principlesThe consolidated accounts include the parent company and those companies in which the parent company held, directly or indirectly, more than 50 percent of the voting power or had control through management agreements with sharehold-ers holding the majority of the voting power at the end of the accounting period. In addition to these holdings, the consolidated accounts include possible holdings that are of a controlling-right nature (units/companies established for a specific reason). Subsidiaries acquired during the period were included in the consolidated financial statements from the date of acquisition, and divested subsidiar-ies up to the date of sale. Intra-corporate shareholdings have been eliminated using the acquisition method. The acquisition consideration, including deferred and contingent consideration, as well as the identifiable assets acquired and liabilities assumed, is measured at the acquisition date fair values. The acquisition-related costs are accounted as expenses for the period in which they are incurred.
At the acquisition date, the non-controlling interests are valued either at the acquisition date fair values or at non-controlling interests’ proportionate share
in the recognized amounts of the identifi-able net assets. Net income for the period is disclosed in the statement of income as an allocation to the shareholders of the parent company and non-controlling inter-ests. The allocation of the comprehensive income to the shareholders of the parent company and non-controlling interests is presented in the statement of comprehen-sive income. Non-controlling interests are disclosed separately under consolidated total equity.
An associated company is a company in which the Group holds 20–50 percent of the voting power and has a participating interest of at least 20 percent or in which the Group has considerable influence. Investments in associated companies are accounted for in the consolidated financial statements under the equity method. KONE’s share of the profit or loss of an associated company is shown in the consolidated statement of income as a separate item, and its investments in the associated companies upon the date of acquisition, adjusted for changes in the associated companies’ equity after the date of acquisition, are shown in the consoli-dated statement of financial position under “Investments in associated companies”. The share of associated companies’ net income includes also the revaluations of the previously held interest in connection with step acquisitions.
All intra-corporate transactions, receiv-ables, liabilities and unrealized profits, as well as the distribution of profits within the Group have been eliminated in the consoli-dated financial statements.
Foreign currency transactions and translationsThe items included in the financial state-ments are initially recognized in the func-tional currencies, which are defined for each group entity based on their primary economic environment.
The presentation currency of the financial statements is the euro, which is also the functional currency of the parent company.
The initial transactions in foreign cur-rencies are recorded in the functional currency at the rate of exchange prevailing at the date of the individual transaction. Foreign currency denominated receivables and liabilities are translated using period end exchange rates.
Foreign exchange gains and losses related to business transactions are treated as adjustments to sales or costs. Foreign
KONE 2015 Financial Statements | Notes to the consolidated financial statements
16 16
exchange gains and losses associated with financing transactions are included in financing income and expenses.
The statements of income of foreign subsidiaries, whose functional currency is not the euro, are translated into euros based on the average exchange rate of the accounting period. Items in the statement of financial position, with the exception of net income for the account-ing period, are translated into euros at the closing date exchange rate. Exchange rate differences arising from net invest-ments and associated companies in non-euro currency subsidiaries, as well as the exchange rate differences resulting from translating income and expenses at the average rates and assets and liabilities at the closing rate, are recorded in transla-tion differences under equity. Respective changes during the period are presented in other comprehensive income. Exchange rate differences resulting from derivatives and loans designated as hedges on net assets in foreign subsidiaries have been entered as translation differences in other comprehensive income. The cumulative translation differences related to foreign operations are reclassified from equity to statement of income upon the disposal of the foreign operation.
Derivative financial instruments and hedge accountingDerivative financial instruments are initially and subsequently recognized at fair value in the statement of financial position. The fair values of foreign exchange forward contracts are calculated by discounting the future cash flows of the contracts with the relevant market interest rate yield curves on the valuation date and by calculating the difference between the discounted values in euros. The fair values of cross cur-rency swaps are determined by discount-ing the expected future cash flows of the contracts with the market interest rate yield curves of the currencies concerned. The fair value of electricity price forwards is based on electricity stock exchange prices on the valuation date.
At the contract date the derivatives are classified as hedging instruments of a business transaction of firm or highly prob-able purchase or sales contract of which are partly included in cash flow hedge accounting, hedges against fair value changes of assets or liabilities or hedges of net investments in foreign entities.
When cash flow hedge accounting is applied and the hedging relationship meets the effectiveness criteria then the effective portion of changes in the fair values of the foreign exchange derivatives initiated for hedging firm or highly prob-able future purchase or sales contracts is recognized through the statement of com-prehensive income to the hedge reserve. The gain or loss relating to the ineffective portion is recognized immediately in the adjustment items to sales and purchases.
The cumulative changes of fair values are transferred into the statement of income in adjustment items to sales or purchases simultaneously when the hedged sale or purchase realizes. If a foreign exchange derivative included in the cash flow hedge accounting expires or is sold or when a hedge no longer meets the criteria for hedge accounting, the cumulative change in the fair value of the hedging instrument will remain in the hedge reserve and is recognized in the income statement at the same time with the hedged sale or purchase. The cumulative fair values of the hedging instruments are transferred from the hedge reserve to adjustment items to sales or purchases immediately if the hedged cash flow is no longer expected to occur. When cash flow hedge account-ing is applied, the hedged risk and the hedging relationship are documented in accordance with the principles of hedge accounting. Hedge effectiveness is assessed before hedge accounting is applied and at least on a quarterly basis thereafter.
The changes in the fair values of derivatives that are designated as hedg-ing instruments but are not accounted for according to the principles of cash flow hedge accounting are recognized based on their nature either in the operative costs or as financial income or expenses: if the hedged item is an operative transaction, the fair values of the hedging instru-ments are recognized in operative costs and expenses, and if the hedged item is a monetary transaction, the fair values are recognized in financing items.
Changes in the fair values of foreign exchange derivatives are recognized in financing income and expenses if the hedged item is a loan receivable, deposit or a financial asset or liability denominated in a foreign currency. Fair value changes of electricity price forwards designated as hedges against future electricity purchases are recognized in the income statement as adjustment items to purchases.
The effective portion of the changes in the fair values of foreign currency hedges against the translation differences arising from consolidating net investments in foreign entities are recognized through the statement of comprehensive income to the translation differences and would be trans-ferred to the income statement in case the net investment were disposed of partially or in its entirety.
Accrued interest on cross currency swaps during the accounting period is rec-ognized in financing income and expenses.
Fair values of derivative instruments are recognized under current assets and liabili-ties in the balance sheet.
Operating segmentsThe profitability of KONE is presented as a single entity. The KONE business idea is to serve its customers by providing solu-tions throughout the entire lifecycle of the equipment, beginning from the installation
of new equipment to the maintenance and modernization during their lifecycle and the full replacement of the equipment. Most of the equipment that are deliv-ered are converted into long-term KONE maintenance contracts. KONE’s operating business structure is globally harmonized based on defined business processes. Material operative decisions are made by the Board of Directors of KONE. Such deci-sions are prepared and presented by the full-time Chairman of the Board and the President and Chief Executive Officer. Due to the business model of KONE, the nature of its operations and its governance struc-ture, the Group as a whole is the relevant operating segment to be reported.
Revenue recognitionRevenue from the sale of goods is recog-nized after KONE has transferred the risks and rewards of ownership of the goods to the customer and retains neither a con-tinuing right to dispose of the goods nor effective control over the goods.
Revenues from separately defined, long-term major projects are recorded as sales under the percentage of completion method. The percentage of completion is defined as the proportion of individual contract cost incurred to date from the total estimated contract costs. The per-centage of completion method requires accurate estimates of future revenues and costs over the full term of the major project. These significant estimates form the basis for the amount of project rev-enue to be recognized and include the latest updated total project revenue, cost and contract risks adjusted by the typical estimation revisions for similar types of projects. These estimates may materially change due to the stage of completion of the projects, changes in the project scope, costs estimates and customer’s plans and other factors.
Revenues from the rendering of mainte-nance services and repairs are recognized when the services have been rendered or over the contract term when the work is being carried out.
Research and development costsResearch and development costs are expensed as they incur, because the future economic benefits of new products and development of existing products and services can only be proven after their suc-cessful introduction to the market.
Income taxThe Group tax expense includes taxes of subsidiaries based on taxable income for the period, together with tax adjust-ments for previous periods and changes in deferred taxes. Deferred taxes are provided for temporary differences arising between the tax bases of assets and liabilities and their carrying amounts in financial report-ing, and measured with enacted tax rates.
1716
KONE 2015 Financial Statements | Notes to the consolidated financial statements
Typical temporary differences arise from provisions, depreciations and amortiza-tions, inter-company inventory margins, defined benefit plans and tax losses carried forward. Deferred tax assets on unused tax losses and other temporary differences are recognized to the extent it is probable that taxable profit is available.
Goodwill and other intangible assetsAcquisitions are accounted for using the acquisition method. Goodwill represents the excess of acquisition cost over the fair values of identified acquired assets and liabilities of acquired companies.
Goodwill arises typically in connection with major acquisition, and represents the value of the acquired market share, business knowledge and the synergies obtained in connection with the acquisi-tion. The carrying amount of goodwill is tested for impairment (see Impairment of assets).
In connection with acquisitions, other intangible assets are identified and pre-sented in other intangible assets in the statement of financial position. These assets are amortized on a straight-line basis over their expected useful lifetime. KONE often acquires small elevator and door service companies, where the net identified assets are typically allocated to the acquired maintenance contracts. The acquired maintenance contracts are typi-cally amortized over ten years.
Other intangible assets also include expenditure on acquired patents, trade-marks and licenses, including acquired software licenses. These assets are amor-tized on a straight-line basis over their expected useful lifetime, which does not usually exceed five years. The carrying amount of any intangible asset is impair-ment tested (see Impairment of assets) when an indication of impairment exists and at the end of each accounting period.
Property, plant and equipmentProperty, plant and equipment are mea-sured at cost less accumulated depreciation and any impairment losses (see Impair-ment of assets). Depreciation is recorded on a straight-line basis over the economic useful lives of the assets as follows:
Buildings 5–40 yearsMachinery and equipment 4–10 years
Land is not depreciated.
Expenditure on repairs and maintenance of property, plant and equipment is recog-nized as expense when incurred.
Impairment of assetsThe carrying amounts of non-current tan-gible assets and other intangible assets are reviewed upon each statement of financial position date to determine whether there is any indication of impairment, or more
frequently should any indication arise. If any such indication arises, the recoverable amount is estimated as the higher of the asset’s fair value less cost of disposal and the value in use. An impairment loss is recognized in the statement of income whenever the carrying amount exceeds the recoverable amount.
A previously recognized impairment loss is reversed only if there has been a significant change in the estimates used to determine the recoverable amount, but not, however, to an extent higher than the carrying amount that would have been determined without impairment loss been recognized in prior years, deducted by the cumulative depreciations.
The Group assesses the carrying amount of goodwill annually or more frequently if any indication of impairment exists. Goodwill is allocated to the cash generating units (CGUs) of the Group, which are identified according to the coun-try of operation and business unit at the level at which goodwill is monitored for internal management purposes. The recov-erable amount of a CGU is determined by value-in-use calculations. In assessing the recoverable amount, estimated future cash flows are discounted to their present value. Cash flow estimates are based on operative managerial estimates. The discount rate is the weighted average cost of capital (WACC) for the main currency area in the location of the CGU (country or business area), which reflects the market assessment for the time-value of money and for the risk specific in KONE’s business.
Any impairment loss of goodwill is rec-ognized immediately as an expense and is not subsequently reversed.
LeasesKONE has entered into various operating leases under which payments are treated as rentals and charged to the statement of income on a straight-line basis over the leasing term. Leases of plant and equip-ment where KONE fundamentally bears all the rewards and risks of ownership are classified as finance leases.
Finance leases are recognized as assets at the inception of the lease at the lower of the fair value of the leased equipment and the estimated present value of the underly-ing lease payments. The corresponding rental obligations, net of finance charges, are included in interest-bearing liabilities. Lease payments are apportioned between the finance charge and the reduction of outstanding liability.
Plant and equipment acquired under finance leasing contracts are depreciated over either the useful life of the asset or the lease period, whichever is less.
Shares and other non-current financial assetsShares and other non-current financial assets are classified as available-for-sale investments.
Shares include long-term strategic investments, which are investments in equity instruments that do not have a quoted price in an active market. The fair value of these shares cannot be reliably measured because the range of reasonable fair value measurements is significant and the probabilities of the various estimates cannot be reasonably assessed. These shares are classified as available-for-sale investments and measured at cost.
Other available-for-sale investments are measured at fair value and recognized through the statement of comprehensive income until the items are sold, collected, otherwise disposed or impaired, at which time the cumulative gain or loss recog-nized in other comprehensive income is included in the profit or loss for the period. However, when fair values are not avail-able, the investments are measured at cost adjusted by any impairment losses.
InventoriesInventories are valued at the lower of cost and net realizable value. Cost is deter-mined on a first-in-first-out (FIFO) basis. Raw materials and supplies, however, are valued based on weighted average cost method or at standard cost. Semi-manu-factures have been valued at production costs.
Work in progress includes direct labor and material costs as of the consolidated statement of financial position date with a proportion of indirect costs related to the manufacturing and installation costs of sales orders included in work in progress.
An allowance is recorded for obsolete items.
Accounts receivableAccounts receivable are initially measured at cost. An impairment loss is recognized for doubtful accounts receivable, based on the aging profile of overdue receivables and a case-by-case analysis of individual receivables.
Current deposits and loans receivableCurrent deposits and loans receivable are initially recognized at fair value and there-after at amortized cost using the effective interest rate method. Only substantial transaction costs are counted for when measuring the acquisition cost. Deposits and loan receivables are impaired if the carrying amount is greater than the esti-mated recoverable amount.
Investments in commercial papers, short-term bank deposits, money-market funds and other money market instru-ments are included in deposits and loans receivable.
Cash and cash equivalentsCash and cash equivalents include cash-in-hand and bank account balances. Bank overdrafts are included in other current liabilities.
KONE 2015 Financial Statements | Notes to the consolidated financial statements
18 18

Post-employment benefitsThe Group operates various employee benefit plans in accordance with local con-ditions and practices. The plans are classi-fied as either defined contribution plans or defined benefit plans. The pension plans are generally funded by payments from employees and by the relevant KONE com-panies. The assets of these plans are gener-ally held in separate insurance companies or trustee-administered funds. Pension costs and liabilities are based on calcula-tions by the local authorities or indepen-dent qualified actuaries. Contributions to the defined contribution plans are charged directly to the statement of income in the year to which these contributions relate. For defined benefit plans, pension cost is determined based on the advice of quali-fied actuaries who carry out a full valuation of the plan on a regular basis using the projected unit credit method. Under this method, the costs of providing pensions are charged to the statement of income so as to spread the regular costs over the working lives of employees. KONE presents the service cost relating to defined benefit obligations in employment expenses while the net interest is presented in financing expenses.
The liability of defined benefit pension plans is the present value of the defined benefit obligation less the fair value of plan assets. The discount rates used in actuarial calculations of employee benefits liabilities are adjusted to market rates. Remeasure-ments of employee benefits are recognized in the other comprehensive income. Obli-gations to pay long-term disability benefit, the level of which is dependent on the length of service of the employee, are mea-sured to reflect the probability that pay-ments will be required and the length of service for which it is expected to be made. Employee benefit liability is presented as part of interest-bearing net debt.
ProvisionsProvisions are recognized when KONE has a current legal or constructive obliga-tion as a result of past events, and it is probable that an outflow of resources will be required to settle the obligation and a reliable estimate of the amount of the obligation can be made. Recognition and measurement of a provision generally employs managerial estimates of the prob-ability and the amount of the liability.
Provisions for warranties cover the esti-mated liability to repair or replace products still under warranty at the statement of financial position date. This provision is calculated based on historical experience of levels of repair and replacements.
Provision for claims is recognized when the claim has been received and it is prob-able that it will be settled and the settle-ment amount can be estimated reliably.
A provision for business restructuring is recognized only when a detailed and
formal plan has been established, when there is a valid expectation that such a plan will be carried out and the plan has been communicated.
Provisions for loss contracts are recog-nized when it is probable that the costs will exceed the estimated total revenue. The probable loss is recognized as an expense immediately.
Advance payments receivedAdvance payments received include cus-tomer payments for the orders included in work in progress.
Loans payableLoans payable are classified in the valu-ation category other financial liabilities. They are measured initially at fair value, net of directly attributable transaction costs incurred and are subsequently carried at amortized cost using the effective interest rate method.
Earnings per shareBasic earnings per share is calculated by dividing the net profit attributable to shareholders of the parent company by the weighted average number of ordinary shares in issue during the year, excluding ordinary shares purchased by the Group and held own shares. Diluted earnings per share reflect the possible impact of the share-based incentive plans and option rights.
EquityWhen KONE purchases its own shares, the consideration paid and directly attribut-able costs are recognized as a deduction in equity. When such shares are sold, the consideration received, net of directly attributable transaction costs, is included in equity.
Profit distributionProfit distribution includes dividends and donations decided by the Shareholders’ Meeting. The dividend and distribution of profits proposed by the Board is not deducted from the equity prior to accep-tance by a shareholders’ meeting.
Share-based compensationThe fair value of the options granted to the key employees has been determined at the grant date and will be recognized as an expense over the vesting period. The total amount to be expensed over the vesting period is determined based on the Group’s estimate of the number of the options that are expected to be vested by the end of the vesting period. The fair value of the options granted is determined by the Black-Scholes pricing model. The impact of any non-market vesting condi-tions (sales growth and EBIT development) has been excluded, but they are included in the assumptions about the number of options that are expected to become exer-
cisable. At each consolidated statement of financial position date, the entity revises its estimates of the number of options that are expected to become exercisable. The impact of the revision of original estimates is recognized in the statement of income. When options are exercised and new shares given, the impacts of changes in the share capital which exceed the account-ing par value of the shares are included in the paid-up unrestricted equity reserve. If treasury shares are used in subscriptions with option rights, the subscription price is included in the paid-up unrestricted equity reserve.
The Board has granted a share owner-ship plan to the Group’s management. Pursuant to the share ownership plan, the reward to the management will be settled as a combination of KONE class B shares and cash when the criteria set in the terms and conditions for the plan are met. The fair value of the share-based payments settled with KONE class B shares has been determined at the grant date and will be recognized as an expense over the vesting period. The total amount to be expensed over the vesting period is determined based on the Group’s estimate of the num-ber of the shares that are expected to be vested by the end of the vesting period. The impact of any non-market vesting conditions (sales and EBIT development) has been excluded, but they are included in assumptions about the number of shares that are expected to be distributed. At each consolidated statement of financial posi-tion date, the entity revises its estimates of the number of shares that are expected to be distributed. It recognizes the impact of the revision of original estimates in the statement of income. The fair value of the share-based payments settled with cash has been determined so that it covers taxes and taxable benefit costs that are incurred. The liability shall be measured, initially and at each reporting date until settled, based on the fair value of the shares expected to be distributed and expensed based on the extent to which the employees have ren-dered service to date. KONE recognizes the impact of the revision of original estimates, if any, in the statement of income.
Accounting estimatesThe preparation of the financial statements in accordance with the IFRS requires man-agement to make judgements, estimates and assumptions that affect the measure-ment of the reported assets and liabilities and other information, such as contingent assets and liabilities and the recognition of income and expenses in the statement of income. Although these estimates and assumptions are based on the manage-ment’s best knowledge of current events and actions, actual results may differ from the estimates.
1918
KONE 2015 Financial Statements | Notes to the consolidated financial statements

2. FINANCIAL RISKS AND INSTRUMENTS
KONE’s business activities are exposed to financial risks such as foreign exchange risks, interest rate risks, liquidity risks and credit risks. These financial risks are man-aged as part of the total KONE risk port-folio. KONE Treasury is responsible for the centralized management of financial risks in accordance with the KONE Treasury Policy approved by the Board of Direc-tors. KONE business units manage their financial risks locally in accordance with the KONE Treasury Policy.
Foreign exchange risksKONE operates internationally and is thus exposed to risks arising from foreign exchange rate fluctuations related to cur-rency flows from revenues and expenses (transaction risk) and from the translation of statement of income and statement of financial position items of foreign subsid-iaries into euros (translation risk).
Transaction risksA substantial part of KONE operations are denominated in local functional cur-rencies and do not therefore give rise to transaction risk. The sales and installations of new equipment and modernizations typically take place in the local currency of the customer. Component and mate-rial expenses may occur in other cur-rencies than the sales currency, which exposes KONE to transaction risks. The KONE policy is to hedge the foreign
exchange exposure of the order book and other highly probable future sales and purchases with foreign exchange forward contracts. The business units are responsible for evaluating and hedging the transaction risks in their operations according to the foreign exchange policy. The most significant transaction risk expo-sures arising from business operations are in the Chinese renminbi, US dollar, Saudi Arabian riyal, Malaysian ringgit and Brit-ish pound. The majority of the currency forward contracts expire within one year.
Hedge accounting is applied in busi-ness units, where there are significant revenues or expenses in foreign currency. When hedge accounting is applied the gains and losses from the hedges are recognized in the statement of income at the same time as the exchange rate gains and losses for the hedged items are recognized.
KONE’s internal loans and deposits are primarily initiated in the local currencies of the subsidiaries in which case the pos-sible foreign exchange risks are hedged using foreign exchange swap contracts.
Translation risks Changes in consolidation exchange rates affect KONE’s statement of income, cash flow statement and statement of financial position, which are presented in euros. As approximately 75% of KONE’s revenues occur in functional currencies other than
euro, the translation risk is significant for KONE. A change of 10% in the annual average foreign exchange rates would have caused a 7.7% (7.2%) change in 2015 in the consolidated sales in euros. Such a change would have had a higher impact on KONE’s operating income and therefore also some impact on KONE’s relative operating income. The translation of the subsidiaries’ balance sheets into euros caused translation differences of EUR 177.4 (152.7) million in 2015. The translation risk is not hedged as a rule with financial instruments as KONE’s busi-ness consists of continuous operations in various currency areas. The most signifi-cant translation risk exposures are in the Chinese renminbi, Hong Kong dollar and US dollar.
Additional info
The most significant risks and uncertainties related to KONE’s business are described in the Board of Directors’ Report, risk management on page 8 and in the Corporate governance statement, in risk management on page 61.
Foreign exchange risk sensitivity analysis of financial assets and liabilitiesThe foreign exchange risk sensitivity analysis for the most important currency pairs has been calculated for the KONE companies’ foreign currency nominated financial assets and liabilities including foreign exchange forward contracts outstanding on the balance sheet date. The order book or forecasted cash flows are not included. The exposures in the most important currency pairs are disclosed in the table below. The foreign exchange risk sensitivity analysis represents the impact of a change in the foreign exchange rates of 10 percent to the statement of income and to the equity on the balance sheet date. Changes in the equity are caused by foreign exchange forwards designated in cash flow hedge accounting. The sensitivity analysis is calculated before taxes. A 10% change in the foreign exchange rates (strengthening of the euro and US dollar) on the balance sheet date would have resulted in an impact of EUR 0.2 (15.8) million to the statement of income and an impact of EUR 1.0 (-16.8) million to the equity.
Exposure against EUR Exposure against USD
MEUR HKD USD GBP Others Total CNY MYR CAD Others TotalExposure Dec 31, 2015 -300 -228 -70 -78 -676 203 -82 -44 -82 -5
Exposure Dec 31, 2014 -272 -209 -63 -64 -608 190 -56 -42 -61 31
KONE 2015 Financial Statements | Notes to the consolidated financial statements
20 20

Interest rate risksKONE’s cash and short-term investments were EUR 1,902.3 (1,276.4) million at the balance sheet date. KONE’s interest-bear-ing debt was EUR 406.1 (373.2) million at the balance sheet date and consisted of EUR 44.5 (43.3) million of financial debt, EUR 192.4 (151.0) million of option lia-bilities from acquisitions, and EUR 169.2 (178.9) million of employee benefits.
As KONE’s excess liquidity is invested in tenors of less than one year, the changes in the interest rates do not have any significant impact on their market val-ues. The changes in the interest rates may however impact future interest income.
When calculating the interest rate sensitivity analysis the interest-bearing net financial debt is assumed to remain on the level of the closing balance of 2015 during the following financial period. The
sensitivity analysis presents the impact of a 1 percentage point change in the interest rate level on the net interest income for the financial period by taking into account the net financial debt tied to interest periods of less than one year, -1,886.7 (-1,265.1) million euros. For 2016 a 1 percentage point change in the interest rate level would mean a change of EUR 18.9 (12.7) million in net interest income. The interest rate sensitivity is cal-culated before taxes.
A change in interest rates does not have a material impact on the net interest on employee benefits or option liabilities from acquisitions.
Refinancing and liquidity risksKONE’s cash and cash equivalents was EUR 552.7 (336.1) million and money market investments including short-term
deposits EUR 1,349.6 (940.3) million on December 31, 2015. Most of the cash and short-term investments are man-aged centrally by Corporate Treasury, but some are located on decentralized bank accounts and local investments in a num-ber of KONE countries. KONE also has a commercial paper program of EUR 500 million and existing committed bilateral credit facilities of EUR 540.3 million to ensure sufficient liquidity.
Additional info
The principles and objectives of KONE’s capital management are presented on page 66 of the financial statements.
Maturity analysis of financial liabilities and interest payments
Dec 31, 2015 Dec 31, 2014
MEUR < 1 year 1–5 years > 5 years Total < 1 year 1–5 years > 5 years Total
Interest-bearing debt
Long-term loans - -0.8 - -0.8 - -5.1 - -5.1
Finance lease liabilities -10.9 -24.5 - -35.3 -9.3 -19.9 - -29.2
Short-term loans -0.1 - - -0.1 -0.9 - - -0.9
Used bank overdraft limits -1.0 - - -1.0 -1.8 - - -1.8
Interest payments -0.0 - - -0.0 -0.0 -0.1 - -0.1
Option liabilities from acquisitions -192.4 - - -192.4 -151.0 - - -151.0
Employee benefits - - -169.2 -169.2 - - -178.9 -178.9
Non-interest bearing debt
Accounts payables -728.9 - - -728.9 -597.1 - - -597.1
Derivatives
Capital inflow 2,697.4 158.1 - 2,855.4 1,802.4 216.1 - 2,018.5
Capital outflow -2,669.7 -153.1 - -2,822.8 -1,771.6 -196.2 - -1,967.8
Net interest 0.3 - - 0.3 0.7 0.3 - 1.0
Net outflow -905.2 -20.4 -169.2 -1,094.8 -728.6 -4.9 -178.9 -912.4
Maturity structure of committed credit facilities
MEUR Dec 31, 2015 Facility maturity Dec 31, 2014
Use
d
amo
unt
Un
used
am
oun
t
Tota
l
2016
2017
2018
2019
2020
Late
r
Use
d
amo
unt
Un
used
am
oun
t
Tota
l
Committed facilities - 540.3 540.3 50.0 50.0 110.3 70.0 100.0 160.0 - 484.1 484.1
2120
KONE 2015 Financial Statements | Notes to the consolidated financial statements

Financial credit risksKONE has substantial amounts of cash and short-term investments. In order to diversify the financial credit risk, KONE deposits its funds into several banks and invests a part of its liquidity into highly liquid money market funds. Global coun-terparty limits are approved by the Board of Directors. All open exposures such as cash on bank accounts, investments, deposits and other financial transactions, for example derivatives contracts, are included when measuring the financial credit risk exposure. When selecting counterparty banks and other investment targets only counterparties with high creditworthiness are approved. The size of each limit reflects the creditworthi-ness of the counterparty. Counterparty creditworthiness is evaluated constantly and the required actions are considered case by case if significant changes in the creditworthiness of a counterparty occur.
Customer credit risk managementCustomer credit risks relate to advance payments receivable from customers or to accounts receivable related to equipment handed over or to services rendered. This risk is managed by defining the rules for tendering, payment terms, authorizations and credit control as well as project man-agement controls. Advance payments, documentary credits and guarantees are used in payment terms to minimize customer credit risks. KONE proactively manages its accounts receivable in order to minimize the risk of customer defaults. KONE’s customer base consists of a large number of customers in several market areas. The management considers that there are no significant concentrations of credit risk with any individual customer or geographical region.
The credit quality of advance pay-ments receivable and accounts receivable
is evaluated according to KONE’s credit policy. According to this policy, the rules for credit quality evaluation are set sepa-rately for the new equipment business and the service business. The credit qual-ity is evaluated both on the basis of the aging of the receivables as well as on the basis of individual case by case customer analysis in order to identify customers with a potential higher credit risk due to individual customer specific reasons. The bad debt provision for the accounts receivable is recognized on the basis of this credit quality evaluation. The amount of bad debt provision recorded to cover doubtful accounts was EUR 146.5 (127.1) million at the end of the financial period.
Aging structure of the accounts receivable after recognition of impairment, MEUR Dec 31, 2015 Dec 31, 2014Not past due and less than one month due receivables 1) 1,099.3 1,006.0
Past due 1–3 months 1) 207.6 180.6
Past due 3–6 months 1) 129.7 118.9
Past due > 6 months 43.6 62.8Accounts receivable in the consolidated statement of financial position 1,480.2 1,368.3
1) There is no material impairment loss recognized related to these receivables.
Derivatives
Fair values of derivative financial instruments, MEUR
Derivative assets
Dec 31, 2015
Derivative liabilities
Dec 31, 2015
Fair value,net
Dec 31, 2015
Fair value,net
Dec 31, 2014Foreign exchange forward contracts and swaps
In cash flow hedge accounting 23.6 -17.6 5.9 0.7
Other hedges 16.7 -17.7 -1.0 27.1
Cross-currency swaps 6.7 -0.3 6.5 19.7
Electricity price forward contracts - -1.2 -1.2 -1.1
Total 47.1 -36.8 10.3 46.4
Nominal values of derivative financial instruments, MEUR Dec 31, 2015 Dec 31, 2014
Foreign exchange forward contracts and swaps
In cash flow hedge accounting 1,074.4 821.0
Other hedges 1,642.7 1,058.7
Cross-currency swaps 138.9 138.9
Electricity price forward contracts 2.6 5.5
Total 2,858.5 2,024.1
KONE 2015 Financial Statements | Notes to the consolidated financial statements
22 22
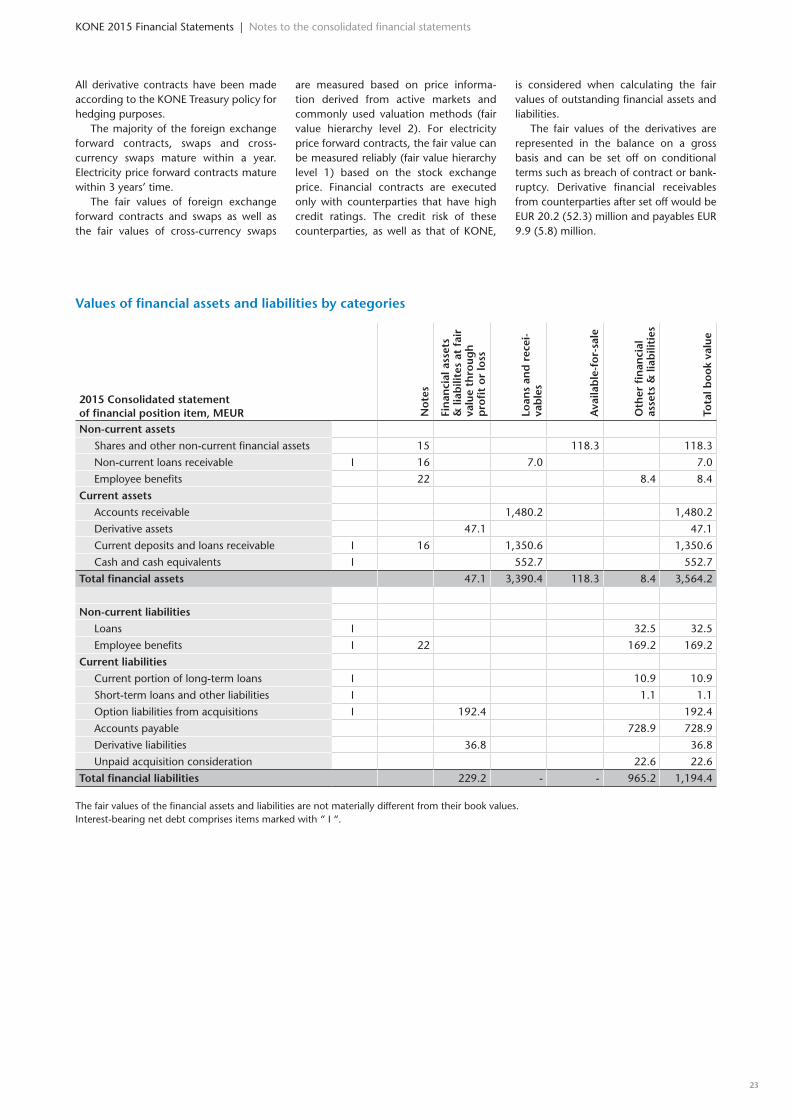
Values of financial assets and liabilities by categories
2015 Consolidated statement of financial position item, MEUR N
ote
s
Fin
anci
al a
sset
s &
liab
ilite
s at
fai
r va
lue
thro
ugh
p
rofi
t o
r lo
ss
Loan
s an
d r
ecei
-va
ble
s
Ava
ilab
le-f
or-
sale
Oth
er fi
nan
cial
as
sets
& li
abili
ties
Tota
l bo
ok
valu
e
Non-current assets
Shares and other non-current financial assets 15 118.3 118.3
Non-current loans receivable I 16 7.0 7.0
Employee benefits 22 8.4 8.4
Current assets
Accounts receivable 1,480.2 1,480.2
Derivative assets 47.1 47.1
Current deposits and loans receivable I 16 1,350.6 1,350.6
Cash and cash equivalents I 552.7 552.7
Total financial assets 47.1 3,390.4 118.3 8.4 3,564.2
Non-current liabilities
Loans I 32.5 32.5
Employee benefits I 22 169.2 169.2
Current liabilities
Current portion of long-term loans I 10.9 10.9
Short-term loans and other liabilities I 1.1 1.1
Option liabilities from acquisitions I 192.4 192.4
Accounts payable 728.9 728.9
Derivative liabilities 36.8 36.8
Unpaid acquisition consideration 22.6 22.6
Total financial liabilities 229.2 - - 965.2 1,194.4
The fair values of the financial assets and liabilities are not materially different from their book values.Interest-bearing net debt comprises items marked with “ I “.
All derivative contracts have been made according to the KONE Treasury policy for hedging purposes.
The majority of the foreign exchange forward contracts, swaps and cross-currency swaps mature within a year. Electricity price forward contracts mature within 3 years’ time.
The fair values of foreign exchange forward contracts and swaps as well as the fair values of cross-currency swaps
are measured based on price informa-tion derived from active markets and commonly used valuation methods (fair value hierarchy level 2). For electricity price forward contracts, the fair value can be measured reliably (fair value hierarchy level 1) based on the stock exchange price. Financial contracts are executed only with counterparties that have high credit ratings. The credit risk of these counterparties, as well as that of KONE,
is considered when calculating the fair values of outstanding financial assets and liabilities.
The fair values of the derivatives are represented in the balance on a gross basis and can be set off on conditional terms such as breach of contract or bank-ruptcy. Derivative financial receivables from counterparties after set off would be EUR 20.2 (52.3) million and payables EUR 9.9 (5.8) million.
2322
KONE 2015 Financial Statements | Notes to the consolidated financial statements

2014 Consolidated statement of financial position item, MEUR N
ote
s
Fin
anci
al a
sset
s an
d li
abili
tes
at
fair
val
ue t
hro
ugh
p
rofi
t o
r lo
ss
Loan
s an
d r
ecei
-va
ble
s
Ava
ilab
le-f
or-
sale
Oth
er fi
nan
cial
lia
bili
ties
Tota
l bo
ok
valu
e
Non-current assets
Shares and other non-current financial assets 15 108.0 108.0
Non-current loans receivable I 16 6.3 6.3
Current assets
Accounts receivable 1,368.3 1,368.3
Derivative assets 69.3 69.3
Current deposits and loans receivable I 16 942.7 942.7
Cash and cash equivalents I 336.1 336.1
Total financial assets 69.3 2,653.4 108.0 2,830.7
Non-current liabilities
Loans I 31.2 31.2
Employee benefits I 178.9 178.9
Current liabilities
Current portion of long-term loans I 9.3 9.3
Short-term loans and other liabilities I 2.8 2.8
Option liabilities from acquisitions I 151.0 151.0
Accounts payable 597.1 597.1
Derivative liabilities 22.8 22.8
Unpaid acquisition consideration 26.8 26.8
Total financial liabilities 173.8 - - 846.1 1,019.9
The fair values of the financial assets and liabilities are not materially different from their book values.Interest-bearing net debt comprises items marked with “ I “.
3. ACQUISITIONS
KONE completed 23 (17) acquisitions dur-ing 2015 for a total consideration of EUR 64.9 million. The acquired businesses are specialized in the elevator, escalator and automatic building door business. The acquisitions completed during the finan-cial period were not material individually or as a whole to KONE’s 2015 financial statements. The sales consolidated from the companies acquired during 2015 did not have a material impact on the Group sales for the financial period.
The fair values of the acquired net assets, based on a provisional assess-ment, as well as the acquisition costs, are summarized in the table on page 25. The considerations were paid for in cash, except for certain deferred considerations, which will be paid later. For most of the completed acquisitions, the acquisition
cost includes a contingent consideration, which is typically determined by the financial performance of the acquired business after the date of the acquisition. Changes in the fair value of the contin-gent consideration after the acquisition date are recognized as a profit or loss. KONE acquired a 100% interest in all businesses acquired in 2015.
The most significant acquisitions dur-ing 2015 were the acquisitions of elevator companies Janzhoff Aufzüge GmbH and Klostermann Aufzüge GmbH in Germany and the acquisitions of KONE’s authorized distributors Lift Modus d.o.o. (Croatia) and Lift Modus d.o.o. Sarajevo (Bosnia).
The combined acquisition consid-eration of Janzhoff Aufzüge GmbH, Klostermann Aufzüge GmbH, Lift Modus d.o.o. and Lift Modus d.o.o. Sarajevo was
EUR 33.3 million. Based on provisional assessments, the fair value of the identi-fied net assets of these acquisitions was EUR 8.9 million, including EUR 7.3 million of maintenance contracts. The increase in goodwill totaled EUR 24.4 million. Good-will represents the value of the acquired market share, business knowledge and expected synergies. Note 11 provides more detail on goodwill.
During 2015, KONE completed other acquisitions for a total consideration of EUR 31.6 (33.3) million, of which, based on provisional assessments, EUR 17.4 (24.4) million was allocated to maintenance contracts included in other intangible assets. Acquired maintenance contracts are typically amortized over ten years. Note 12 provides more detail on other intangible assets.
KONE 2015 Financial Statements | Notes to the consolidated financial statements
24 24
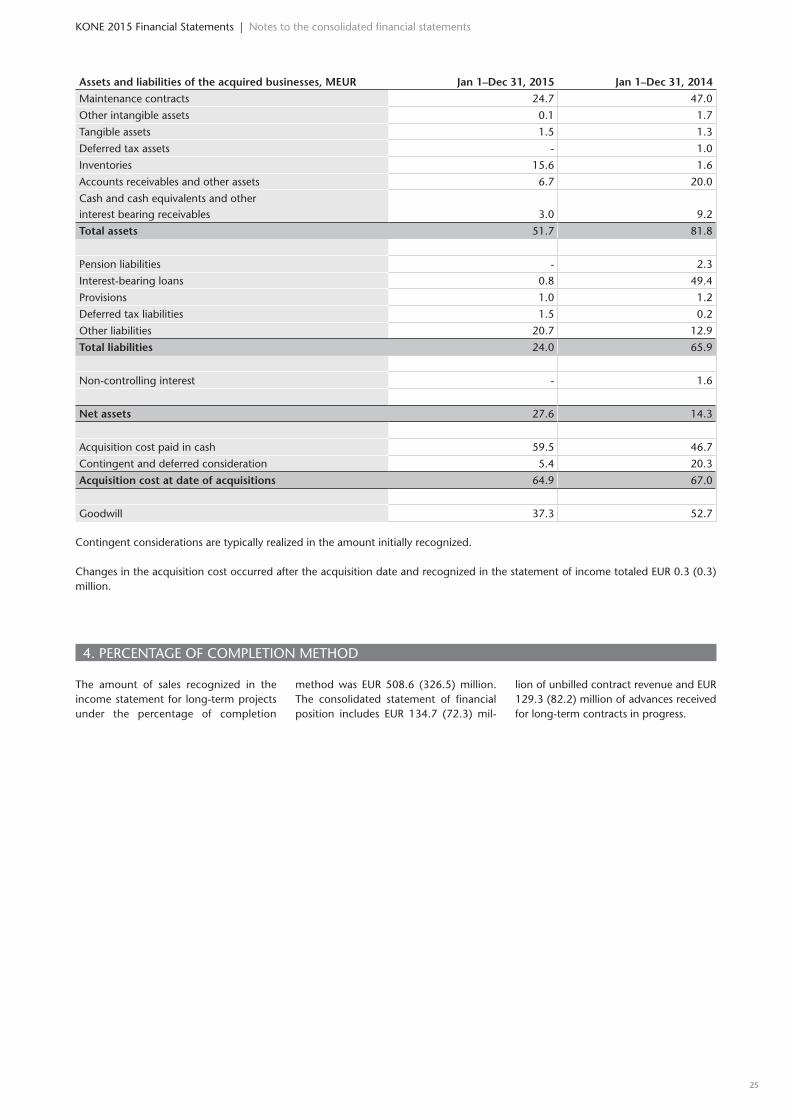
4. PERCENTAGE OF COMPLETION METHOD
The amount of sales recognized in the income statement for long-term projects under the percentage of completion
method was EUR 508.6 (326.5) million. The consolidated statement of financial position includes EUR 134.7 (72.3) mil-
lion of unbilled contract revenue and EUR 129.3 (82.2) million of advances received for long-term contracts in progress.
Assets and liabilities of the acquired businesses, MEUR Jan 1–Dec 31, 2015 Jan 1–Dec 31, 2014
Maintenance contracts 24.7 47.0
Other intangible assets 0.1 1.7
Tangible assets 1.5 1.3
Deferred tax assets - 1.0
Inventories 15.6 1.6
Accounts receivables and other assets 6.7 20.0
Cash and cash equivalents and other interest bearing receivables 3.0 9.2
Total assets 51.7 81.8
Pension liabilities - 2.3
Interest-bearing loans 0.8 49.4
Provisions 1.0 1.2
Deferred tax liabilities 1.5 0.2
Other liabilities 20.7 12.9
Total liabilities 24.0 65.9
Non-controlling interest - 1.6
Net assets 27.6 14.3
Acquisition cost paid in cash 59.5 46.7
Contingent and deferred consideration 5.4 20.3
Acquisition cost at date of acquisitions 64.9 67.0
Goodwill 37.3 52.7
Contingent considerations are typically realized in the amount initially recognized.
Changes in the acquisition cost occurred after the acquisition date and recognized in the statement of income totaled EUR 0.3 (0.3) million.
2524
KONE 2015 Financial Statements | Notes to the consolidated financial statements
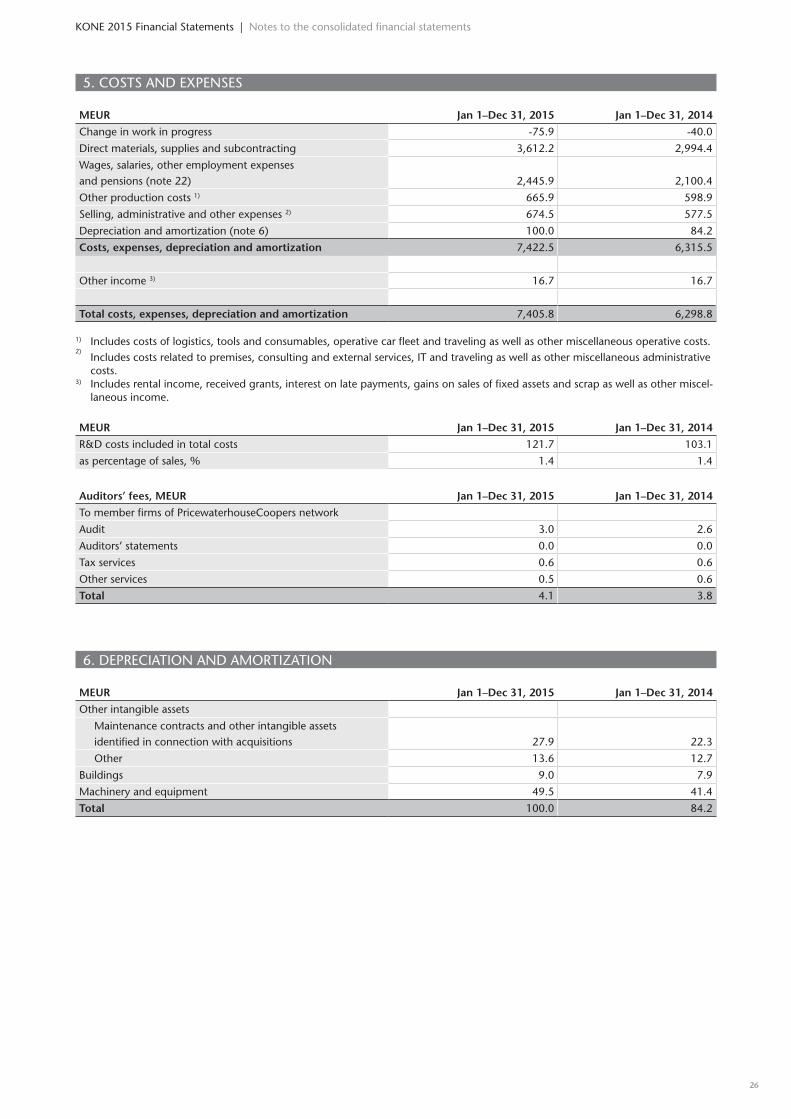
5. COSTS AND EXPENSES
MEUR Jan 1–Dec 31, 2015 Jan 1–Dec 31, 2014
Change in work in progress -75.9 -40.0
Direct materials, supplies and subcontracting 3,612.2 2,994.4
Wages, salaries, other employment expenses and pensions (note 22) 2,445.9 2,100.4
Other production costs 1) 665.9 598.9
Selling, administrative and other expenses 2) 674.5 577.5
Depreciation and amortization (note 6) 100.0 84.2
Costs, expenses, depreciation and amortization 7,422.5 6,315.5
Other income 3) 16.7 16.7
Total costs, expenses, depreciation and amortization 7,405.8 6,298.8
1) Includes costs of logistics, tools and consumables, operative car fleet and traveling as well as other miscellaneous operative costs.2)
Includes costs related to premises, consulting and external services, IT and traveling as well as other miscellaneous administrative costs.
3) Includes rental income, received grants, interest on late payments, gains on sales of fixed assets and scrap as well as other miscel-laneous income.
MEUR Jan 1–Dec 31, 2015 Jan 1–Dec 31, 2014
R&D costs included in total costs 121.7 103.1
as percentage of sales, % 1.4 1.4
Auditors’ fees, MEUR Jan 1–Dec 31, 2015 Jan 1–Dec 31, 2014
To member firms of PricewaterhouseCoopers network
Audit 3.0 2.6
Auditors’ statements 0.0 0.0
Tax services 0.6 0.6
Other services 0.5 0.6
Total 4.1 3.8
6. DEPRECIATION AND AMORTIZATION
MEUR Jan 1–Dec 31, 2015 Jan 1–Dec 31, 2014
Other intangible assets
Maintenance contracts and other intangible assets identified in connection with acquisitions 27.9 22.3
Other 13.6 12.7
Buildings 9.0 7.9
Machinery and equipment 49.5 41.4
Total 100.0 84.2
KONE 2015 Financial Statements | Notes to the consolidated financial statements
26 26
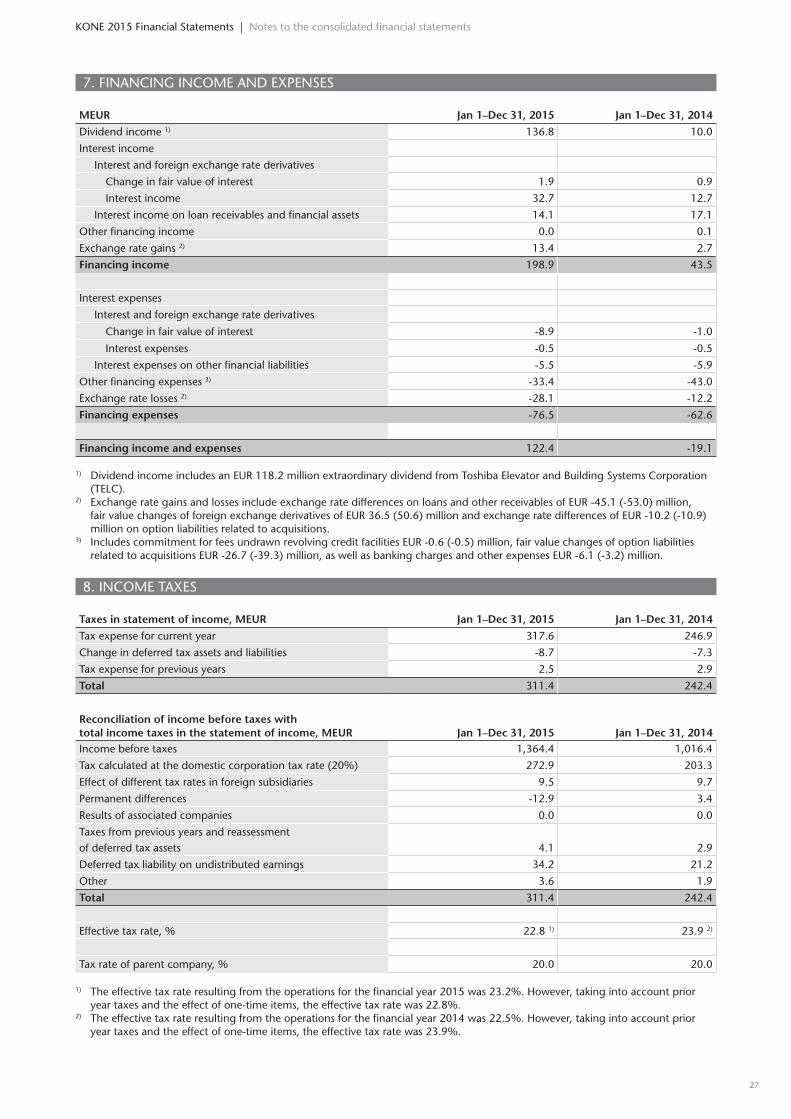
7. FINANCING INCOME AND EXPENSES
MEUR Jan 1–Dec 31, 2015 Jan 1–Dec 31, 2014
Dividend income 1) 136.8 10.0
Interest income
Interest and foreign exchange rate derivatives
Change in fair value of interest 1.9 0.9
Interest income 32.7 12.7
Interest income on loan receivables and financial assets 14.1 17.1
Other financing income 0.0 0.1
Exchange rate gains 2) 13.4 2.7
Financing income 198.9 43.5
Interest expenses
Interest and foreign exchange rate derivatives
Change in fair value of interest -8.9 -1.0
Interest expenses -0.5 -0.5
Interest expenses on other financial liabilities -5.5 -5.9
Other financing expenses 3) -33.4 -43.0
Exchange rate losses 2) -28.1 -12.2
Financing expenses -76.5 -62.6
Financing income and expenses 122.4 -19.1
1) Dividend income includes an EUR 118.2 million extraordinary dividend from Toshiba Elevator and Building Systems Corporation (TELC).
2) Exchange rate gains and losses include exchange rate differences on loans and other receivables of EUR -45.1 (-53.0) million, fair value changes of foreign exchange derivatives of EUR 36.5 (50.6) million and exchange rate differences of EUR -10.2 (-10.9) million on option liabilities related to acquisitions.
3) Includes commitment for fees undrawn revolving credit facilities EUR -0.6 (-0.5) million, fair value changes of option liabilities related to acquisitions EUR -26.7 (-39.3) million, as well as banking charges and other expenses EUR -6.1 (-3.2) million.
8. INCOME TAXES
Taxes in statement of income, MEUR Jan 1–Dec 31, 2015 Jan 1–Dec 31, 2014
Tax expense for current year 317.6 246.9
Change in deferred tax assets and liabilities -8.7 -7.3
Tax expense for previous years 2.5 2.9
Total 311.4 242.4
Reconciliation of income before taxes with total income taxes in the statement of income, MEUR Jan 1–Dec 31, 2015 Jan 1–Dec 31, 2014Income before taxes 1,364.4 1,016.4
Tax calculated at the domestic corporation tax rate (20%) 272.9 203.3
Effect of different tax rates in foreign subsidiaries 9.5 9.7
Permanent differences -12.9 3.4
Results of associated companies 0.0 0.0
Taxes from previous years and reassessment of deferred tax assets 4.1 2.9
Deferred tax liability on undistributed earnings 34.2 21.2
Other 3.6 1.9
Total 311.4 242.4
Effective tax rate, % 22.8 1) 23.9 2)
Tax rate of parent company, % 20.0 20.0
1) The effective tax rate resulting from the operations for the financial year 2015 was 23.2%. However, taking into account prior year taxes and the effect of one-time items, the effective tax rate was 22.8%.
2) The effective tax rate resulting from the operations for the financial year 2014 was 22.5%. However, taking into account prior year taxes and the effect of one-time items, the effective tax rate was 23.9%.
2726
KONE 2015 Financial Statements | Notes to the consolidated financial statements
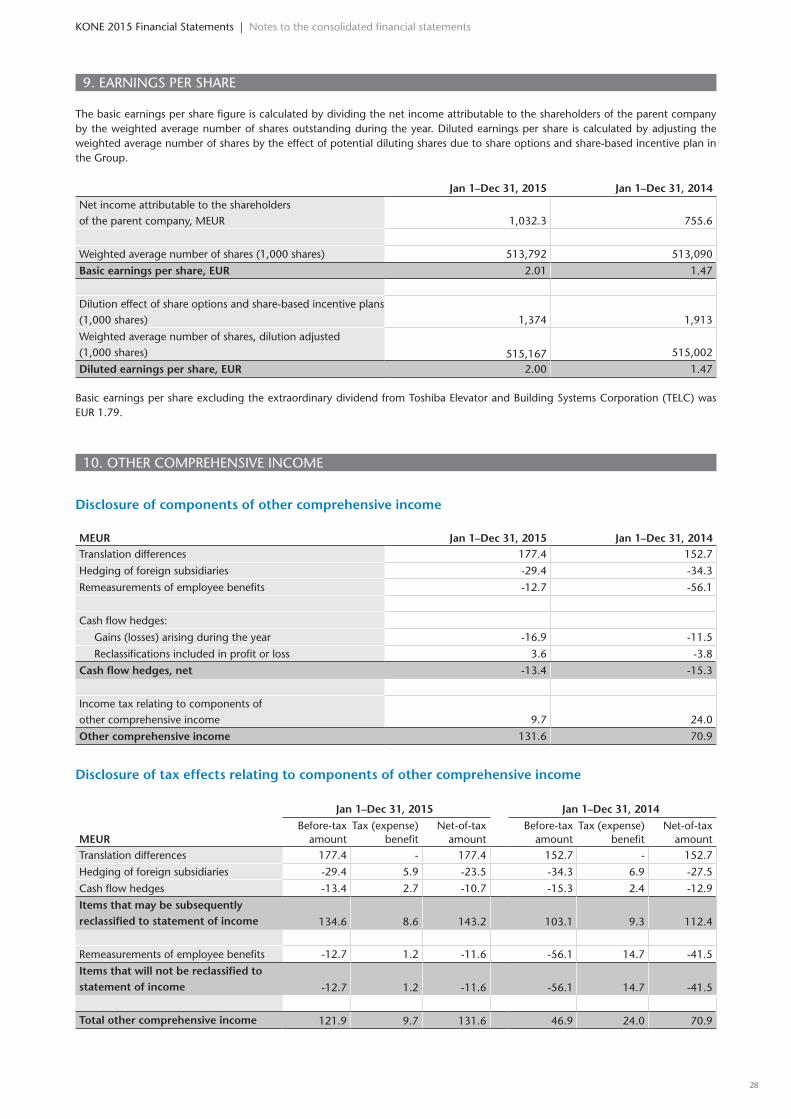
9. EARNINGS PER SHARE
The basic earnings per share figure is calculated by dividing the net income attributable to the shareholders of the parent company by the weighted average number of shares outstanding during the year. Diluted earnings per share is calculated by adjusting the weighted average number of shares by the effect of potential diluting shares due to share options and share-based incentive plan in the Group.
Jan 1–Dec 31, 2015 Jan 1–Dec 31, 2014
Net income attributable to the shareholders of the parent company, MEUR 1,032.3 755.6
Weighted average number of shares (1,000 shares) 513,792 513,090
Basic earnings per share, EUR 2.01 1.47
Dilution effect of share options and share-based incentive plans (1,000 shares) 1,374 1,913
Weighted average number of shares, dilution adjusted (1,000 shares) 515,167 515,002
Diluted earnings per share, EUR 2.00 1.47
Basic earnings per share excluding the extraordinary dividend from Toshiba Elevator and Building Systems Corporation (TELC) was EUR 1.79.
10. OTHER COMPREHENSIVE INCOME
Disclosure of components of other comprehensive income
MEUR Jan 1–Dec 31, 2015 Jan 1–Dec 31, 2014Translation differences 177.4 152.7
Hedging of foreign subsidiaries -29.4 -34.3
Remeasurements of employee benefits -12.7 -56.1
Cash flow hedges:
Gains (losses) arising during the year -16.9 -11.5
Reclassifications included in profit or loss 3.6 -3.8
Cash flow hedges, net -13.4 -15.3
Income tax relating to components of other comprehensive income 9.7 24.0
Other comprehensive income 131.6 70.9
Disclosure of tax effects relating to components of other comprehensive income
MEUR
Jan 1–Dec 31, 2015 Jan 1–Dec 31, 2014
Before-tax amount
Tax (expense) benefit
Net-of-tax amount
Before-tax amount
Tax (expense) benefit
Net-of-tax amount
Translation differences 177.4 - 177.4 152.7 - 152.7
Hedging of foreign subsidiaries -29.4 5.9 -23.5 -34.3 6.9 -27.5
Cash flow hedges -13.4 2.7 -10.7 -15.3 2.4 -12.9
Items that may be subsequently reclassified to statement of income 134.6 8.6 143.2 103.1 9.3 112.4
Remeasurements of employee benefits -12.7 1.2 -11.6 -56.1 14.7 -41.5
Items that will not be reclassified to statement of income -12.7 1.2 -11.6 -56.1 14.7 -41.5
Total other comprehensive income 121.9 9.7 131.6 46.9 24.0 70.9
KONE 2015 Financial Statements | Notes to the consolidated financial statements
28 28

11. GOODWILL
Goodwill allocationGoodwill is allocated to cash-generating units (CGUs). Cash generating unit is typically the country unit in which the aquired business is operating, in accordance with KONE’s management system and structures. The carrying amount of goodwill is allocated to 23 different CGU’s. Five largest CGU’s carries 74% of the goodwill. The carrying amount of goodwill is below EUR 10 million for eleven CGUs. The goodwill allocation to the CGUs is presented in the table below:
Goodwill/CGU, MEUR Dec 31, 2015 % Dec 31, 2014 %
Five largest CGUs 973.5 74 843.8 70
Five smallest CGUs 19.7 2 24.8 2
Other CGUs 313.4 24 340.3 28
Total 1,306.7 1,208.9
Mean 56.8 54.9
Median 13.2 22.3
Impairment testingThe value-in-use calculations for the CGU specific cash flow projections are based on financial estimates prepared by the man-agement. The financial estimates are pre-pared for the following two years for each CGU. The cash flows for subsequent years are assumed prudently without growth. The used discount rates are based on the weighted average cost of capital (WACC), which reflects the market assessment for the time-value of money and for the risk specific in KONE’s business.
The assumptions on business growth, price and cost development assumptions embedded in the CGU specific cash flow
projections are based on assessments by management of the market demand and environment, which are examined against external information sources. The assumptions on productivity and efficiency are based on internal targets, which are evaluated against actual per-formance. The discount rates are based on the risk-free interest rates, risk factors (beta coefficient) and market risk premi-ums available on financial markets. The value-in-use calculations are validated against KONE’s market capitalization.
No goodwill impairment losses were recognized during the accounting period.
The impairment testing process includes a sensitivity analysis in which the CGU spe-cific cash flow estimates were reduced by 10–40 percent and the discount interests were increased by 1–4 percentage points. Based on the sensitivity analysis, the prob-ability for impairment losses was very low. Under the basic scenario, the value-in-use calculations were on average 7.1 times higher than the CGUs assets employed. The respective ratio was for the five larg-est CGUs was 5.4; for the five smallest 12.8 and respectively for the other CGUs 10.9.
Discount interest rates used (pre-tax): EMEA Americas Asia-Pacific
2015 7.03% 8.21% 9.47%
2014 6.45% 8.17% 10.10%
Goodwill reconciliation
Goodwill, MEUR Dec 31, 2015 Dec 31, 2014
Opening net book value 1,208.9 1,103.6
Translation differences 55.4 56.4
Increase 5.7 0.4
Decrease -0.6 -4.2
Companies acquired (note 3) 37.3 52.7
Closing net book value 1,306.7 1,208.9
2928
KONE 2015 Financial Statements | Notes to the consolidated financial statements
12. OTHER INTANGIBLE ASSETS
Jan 1–Dec 31, 2015, MEURMaintenance
contracts Other Total
Jan 1, 2015:
Acquisition cost 290.2 129.3 419.5
Accumulated amortization and impairment -65.8 -92.0 -157.8
Net book value 224.5 37.3 261.8
Opening net book value 224.5 37.3 261.8
Translation differences 10.6 1.4 12.0
Increase 2.8 11.9 14.7
Decrease - -0.9 -0.9
Reclassifications - 0.6 0.6
Companies acquired (note 3) 24.7 0.1 24.8
Amortization -27.9 -13.6 -41.5
Closing net book value 234.6 36.9 271.5
Dec 31, 2015:
Acquisition cost 322.4 212.6 535.0
Accumulated amortization and impairment -87.8 -175.7 -263.5
Net book value 234.6 36.9 271.5
Jan 1–Dec 31, 2014, MEURMaintenance
contracts Other Total
Jan 1, 2014:
Acquisition cost 266.7 112.7 379.4
Accumulated amortization and impairment -71.2 -79.3 -150.5
Net book value 195.5 33.4 228.9
Opening net book value 195.5 33.4 228.9
Translation differences 3.5 3.1 6.6
Increase 2.4 11.4 13.8
Decrease -1.6 -0.1 -1.7
Reclassifications - 0.5 0.5
Companies acquired (note 3) 47.0 1.7 48.6
Amortization -22.3 -12.7 -35.0
Closing net book value 224.5 37.3 261.8
Dec 31, 2014:
Acquisition cost 290.2 129.3 419.5
Accumulated amortization and impairment -65.8 -92.0 -157.8
Net book value 224.5 37.3 261.8
KONE 2015 Financial Statements | Notes to the consolidated financial statements
30 30
13. PROPERTY, PLANT AND EQUIPMENT
Jan 1–Dec 31, 2015, MEUR Land BuildingsMachinery &
equipment
Machinery & equipment,
leased for own use
Fixed assets under
construction Advance
payments Total
Jan 1, 2015:
Acquisition cost 7.5 208.0 398.8 57.0 26.4 6.3 701.4
Accumulated depreciation - -76.6 -282.6 -27.7 - - -384.2
Net book value 7.5 131.4 116.2 29.4 26.4 6.3 317.1
Opening net book value 7.5 131.4 116.2 29.4 26.4 6.3 317.1
Translation differences 0.1 4.9 4.0 2.5 1.3 0.1 12.8
Increase 0.2 15.1 40.5 16.4 10.9 3.5 86.5
Decrease -0.5 -0.5 -3.5 -2.6 -0.4 -2.8 -10.2
Reclassifications -0.1 19.8 6.1 -0.1 -26.0 -3.5 -3.8
Companies acquired (note 3) - 0.0 1.4 - - - 1.5
Depreciation - -9.0 -39.4 -10.1 - - -58.5
Closing net book value 7.2 161.6 125.1 35.5 12.3 3.7 345.4
Dec 31, 2015:
Acquisition cost 7.2 247.2 447.1 41.1 12.3 3.7 758.6
Accumulated depreciation - -85.6 -322.0 -5.6 - - -413.2
Net book value 7.2 161.6 125.1 35.5 12.3 3.7 345.4
Jan 1–Dec 31, 2014, MEUR Land BuildingsMachinery &
equipment
Machinery & equipment,
leased for own use
Fixed assets under
construction Advance
payments Total
Jan 1, 2014:
Acquisition cost 7.7 189.7 347.9 44.1 16.4 1.4 604.6
Accumulated depreciation - -68.8 -248.8 -20.1 - - -335.0
Net book value 7.7 120.9 99.1 24.0 16.4 1.4 269.6
Opening net book value 7.7 120.9 99.1 24.0 16.4 1.4 269.6
Translation differences 0.1 6.3 3.8 1.7 2.2 0.2 14.3
Increase 0.1 6.1 41.9 14.6 21.7 6.0 90.3
Decrease -0.4 -1.1 -1.5 -3.4 -0.1 -1.3 -7.9
Reclassifications - 7.1 5.5 0.1 -13.8 - -1.2
Companies acquired (note 3) - 0.0 1.2 0.1 0.0 - 1.3
Depreciation - -7.9 -33.8 -7.6 - - -49.2
Closing net book value 7.5 131.4 116.2 29.4 26.4 6.3 317.1
Dec 31, 2014:
Acquisition cost 7.5 208.0 398.8 57.0 26.4 6.3 701.4
Accumulated depreciation - -76.6 -282.6 -27.7 - - -384.2
Net book value 7.5 131.4 116.2 29.4 26.4 6.3 317.1
During the period of Jan 1-Dec 31, 2015, capital expenditure on production facilities, customer service in the sales and mainte-nance operations, as well as on information systems, including new finance leases, totaled EUR 92.7 (87.8) million.
3130
KONE 2015 Financial Statements | Notes to the consolidated financial statements
14. ASSOCIATED COMPANIES AND RELATED PARTY TRANSACTIONS
Investments in associated companies, MEUR Dec 31, 2015 Dec 31, 2014
Total at beginning of period 4.5 4.3
Translation differences 0.3 0.4
Share of associated companies’ result after taxes 0.3 -0.1
Dividends received -0.9 -0.2
Increase 0.2 -
Total at end of period 4.4 4.5
The associated companies’ financial information presented here is based on the latest official financial statements available and esti-mates for the year 2015.
The net income of KONE’s associated companies for the year 2015 was EUR 1.2 million based on estimates available. Based on the official financial statements, the assets of KONE’s associated companies totaled EUR 30.9 million and equity EUR 11.7 million. In the year 2014, the associated companies recognized total sales of EUR 37.8 million and a total net income of EUR 3.2 million.
Transactions with associated companies, MEUR Jan 1–Dec 31, 2015 Jan 1–Dec 31, 2014
Sales of goods and services 0.0 1.7
Purchases of goods and services 28.6 23.9
Balances with associated companies
Receivables from associated companies, MEUR Dec 31, 2015 Dec 31, 2014
Short-term loans - 0.2
Accounts receivable - 0.9
Total - 1.1
Liabilities to associated companies, MEUR Dec 31, 2015 Dec 31, 2014
Accounts payable 6.7 4.5
Total 6.7 4.5
Transactions with key managementThe key management of KONE consists of the Board of Directors and the Executive Board.
Compensation paid to the key management, MEUR Jan 1–Dec 31, 2015 Jan 1–Dec 31, 2014
Salaries and other remunerations 7.5 7.3
Share-based payments 13.8 10.5
Total 21.3 17.8
KONE 2015 Financial Statements | Notes to the consolidated financial statements
32 32
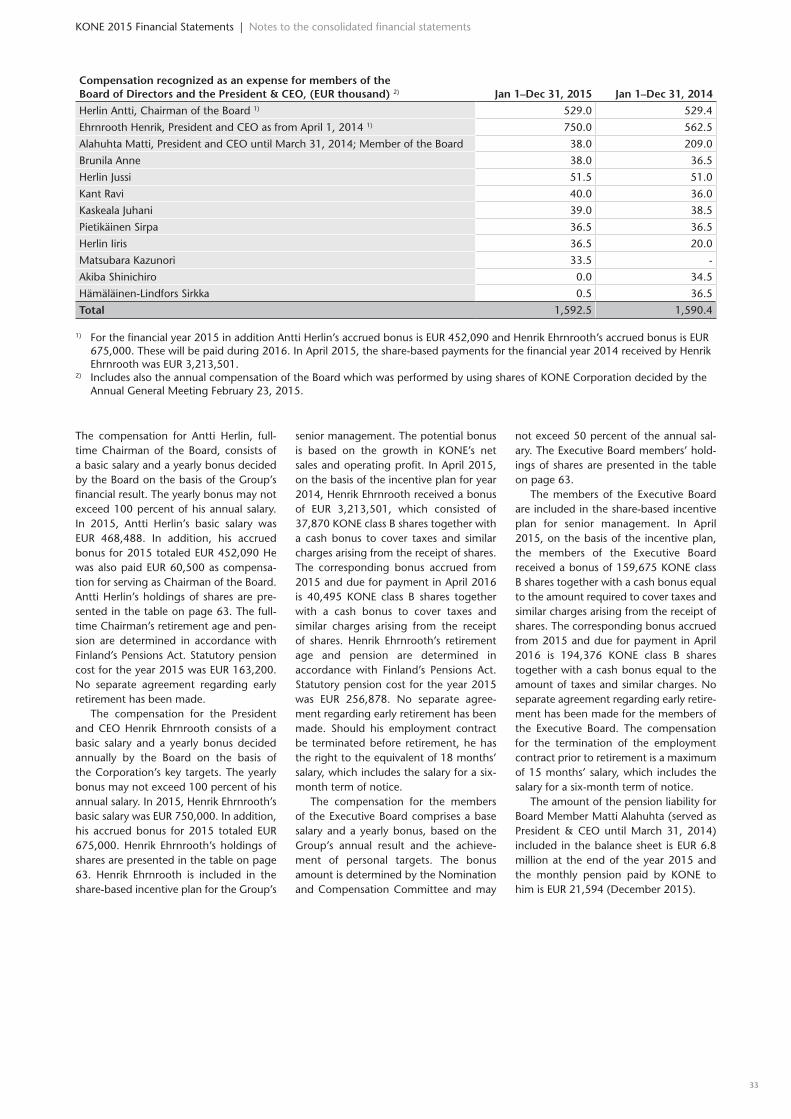
Compensation recognized as an expense for members of the Board of Directors and the President & CEO, (EUR thousand) 2) Jan 1–Dec 31, 2015 Jan 1–Dec 31, 2014
Herlin Antti, Chairman of the Board 1) 529.0 529.4
Ehrnrooth Henrik, President and CEO as from April 1, 2014 1) 750.0 562.5
Alahuhta Matti, President and CEO until March 31, 2014; Member of the Board 38.0 209.0
Brunila Anne 38.0 36.5
Herlin Jussi 51.5 51.0
Kant Ravi 40.0 36.0
Kaskeala Juhani 39.0 38.5
Pietikäinen Sirpa 36.5 36.5
Herlin Iiris 36.5 20.0
Matsubara Kazunori 33.5 -
Akiba Shinichiro 0.0 34.5
Hämäläinen-Lindfors Sirkka 0.5 36.5
Total 1,592.5 1,590.4
1) For the financial year 2015 in addition Antti Herlin’s accrued bonus is EUR 452,090 and Henrik Ehrnrooth’s accrued bonus is EUR 675,000. These will be paid during 2016. In April 2015, the share-based payments for the financial year 2014 received by Henrik Ehrnrooth was EUR 3,213,501.
2) Includes also the annual compensation of the Board which was performed by using shares of KONE Corporation decided by the Annual General Meeting February 23, 2015.
The compensation for Antti Herlin, full-time Chairman of the Board, consists of a basic salary and a yearly bonus decided by the Board on the basis of the Group’s financial result. The yearly bonus may not exceed 100 percent of his annual salary. In 2015, Antti Herlin’s basic salary was EUR 468,488. In addition, his accrued bonus for 2015 totaled EUR 452,090 He was also paid EUR 60,500 as compensa-tion for serving as Chairman of the Board. Antti Herlin’s holdings of shares are pre-sented in the table on page 63. The full-time Chairman’s retirement age and pen-sion are determined in accordance with Finland’s Pensions Act. Statutory pension cost for the year 2015 was EUR 163,200. No separate agreement regarding early retirement has been made.
The compensation for the President and CEO Henrik Ehrnrooth consists of a basic salary and a yearly bonus decided annually by the Board on the basis of the Corporation’s key targets. The yearly bonus may not exceed 100 percent of his annual salary. In 2015, Henrik Ehrnrooth’s basic salary was EUR 750,000. In addition, his accrued bonus for 2015 totaled EUR 675,000. Henrik Ehrnrooth’s holdings of shares are presented in the table on page 63. Henrik Ehrnrooth is included in the share-based incentive plan for the Group’s
senior management. The potential bonus is based on the growth in KONE’s net sales and operating profit. In April 2015, on the basis of the incentive plan for year 2014, Henrik Ehrnrooth received a bonus of EUR 3,213,501, which consisted of 37,870 KONE class B shares together with a cash bonus to cover taxes and similar charges arising from the receipt of shares. The corresponding bonus accrued from 2015 and due for payment in April 2016 is 40,495 KONE class B shares together with a cash bonus to cover taxes and similar charges arising from the receipt of shares. Henrik Ehrnrooth’s retirement age and pension are determined in accordance with Finland’s Pensions Act. Statutory pension cost for the year 2015 was EUR 256,878. No separate agree-ment regarding early retirement has been made. Should his employment contract be terminated before retirement, he has the right to the equivalent of 18 months’ salary, which includes the salary for a six-month term of notice.
The compensation for the members of the Executive Board comprises a base salary and a yearly bonus, based on the Group’s annual result and the achieve-ment of personal targets. The bonus amount is determined by the Nomination and Compensation Committee and may
not exceed 50 percent of the annual sal-ary. The Executive Board members’ hold-ings of shares are presented in the table on page 63.
The members of the Executive Board are included in the share-based incentive plan for senior management. In April 2015, on the basis of the incentive plan, the members of the Executive Board received a bonus of 159,675 KONE class B shares together with a cash bonus equal to the amount required to cover taxes and similar charges arising from the receipt of shares. The corresponding bonus accrued from 2015 and due for payment in April 2016 is 194,376 KONE class B shares together with a cash bonus equal to the amount of taxes and similar charges. No separate agreement regarding early retire-ment has been made for the members of the Executive Board. The compensation for the termination of the employment contract prior to retirement is a maximum of 15 months’ salary, which includes the salary for a six-month term of notice.
The amount of the pension liability for Board Member Matti Alahuhta (served as President & CEO until March 31, 2014) included in the balance sheet is EUR 6.8 million at the end of the year 2015 and the monthly pension paid by KONE to him is EUR 21,594 (December 2015).
3332
KONE 2015 Financial Statements | Notes to the consolidated financial statements
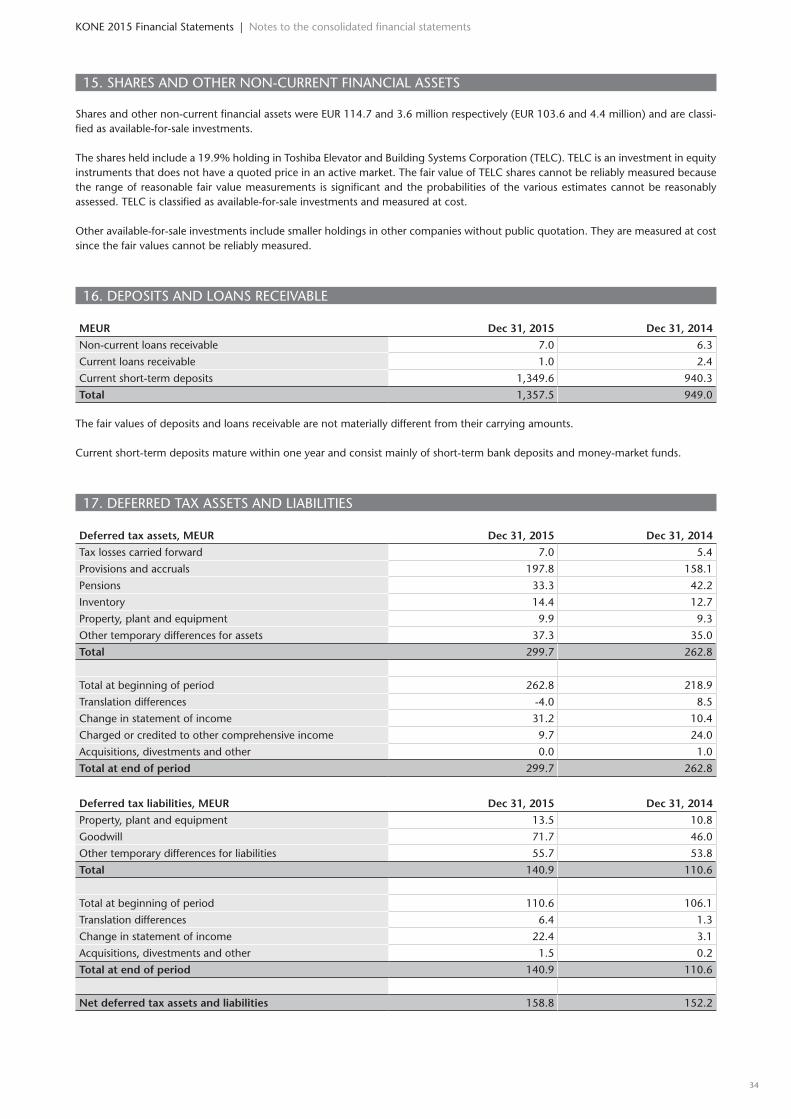
15. SHARES AND OTHER NON-CURRENT FINANCIAL ASSETS
Shares and other non-current financial assets were EUR 114.7 and 3.6 million respectively (EUR 103.6 and 4.4 million) and are classi-fied as available-for-sale investments.
The shares held include a 19.9% holding in Toshiba Elevator and Building Systems Corporation (TELC). TELC is an investment in equity instruments that does not have a quoted price in an active market. The fair value of TELC shares cannot be reliably measured because the range of reasonable fair value measurements is significant and the probabilities of the various estimates cannot be reasonably assessed. TELC is classified as available-for-sale investments and measured at cost.
Other available-for-sale investments include smaller holdings in other companies without public quotation. They are measured at cost since the fair values cannot be reliably measured.
16. DEPOSITS AND LOANS RECEIVABLE
MEUR Dec 31, 2015 Dec 31, 2014
Non-current loans receivable 7.0 6.3
Current loans receivable 1.0 2.4
Current short-term deposits 1,349.6 940.3
Total 1,357.5 949.0
The fair values of deposits and loans receivable are not materially different from their carrying amounts.
Current short-term deposits mature within one year and consist mainly of short-term bank deposits and money-market funds.
17. DEFERRED TAX ASSETS AND LIABILITIES
Deferred tax assets, MEUR Dec 31, 2015 Dec 31, 2014
Tax losses carried forward 7.0 5.4
Provisions and accruals 197.8 158.1
Pensions 33.3 42.2
Inventory 14.4 12.7
Property, plant and equipment 9.9 9.3
Other temporary differences for assets 37.3 35.0
Total 299.7 262.8
Total at beginning of period 262.8 218.9
Translation differences -4.0 8.5
Change in statement of income 31.2 10.4
Charged or credited to other comprehensive income 9.7 24.0
Acquisitions, divestments and other 0.0 1.0
Total at end of period 299.7 262.8
Deferred tax liabilities, MEUR Dec 31, 2015 Dec 31, 2014
Property, plant and equipment 13.5 10.8
Goodwill 71.7 46.0
Other temporary differences for liabilities 55.7 53.8
Total 140.9 110.6
Total at beginning of period 110.6 106.1
Translation differences 6.4 1.3
Change in statement of income 22.4 3.1
Acquisitions, divestments and other 1.5 0.2
Total at end of period 140.9 110.6
Net deferred tax assets and liabilities 158.8 152.2
KONE 2015 Financial Statements | Notes to the consolidated financial statements
34 34
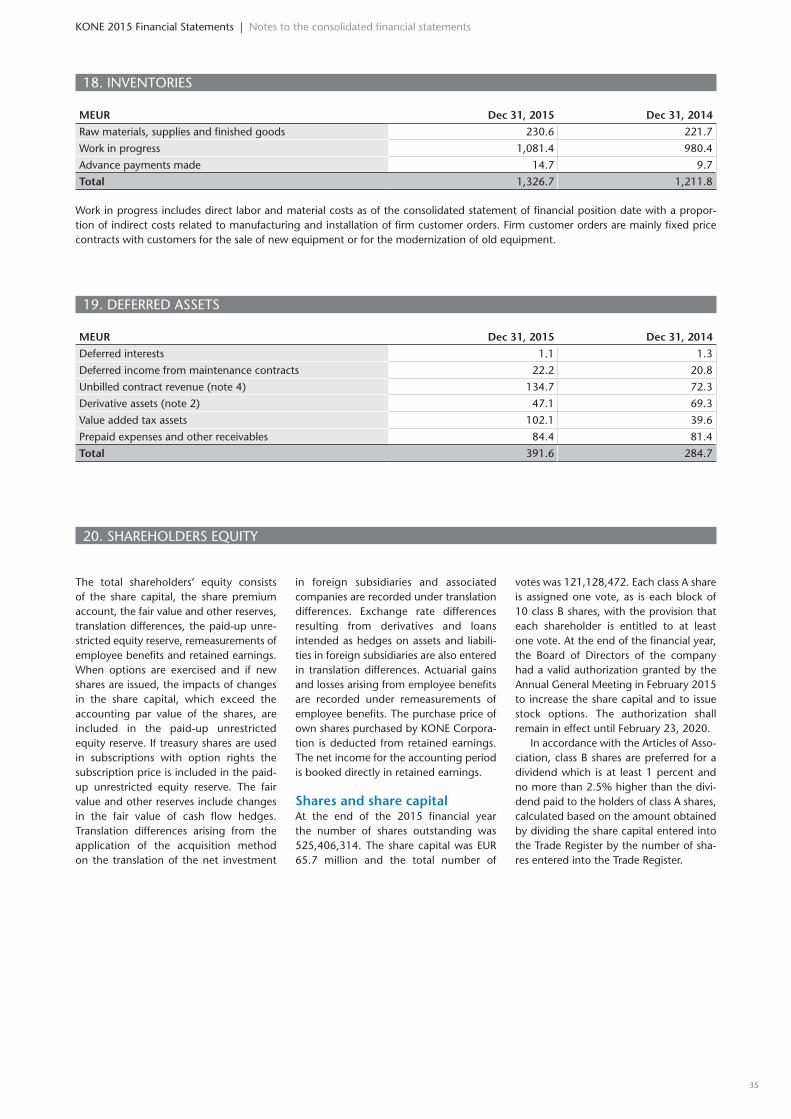
18. INVENTORIES
MEUR Dec 31, 2015 Dec 31, 2014
Raw materials, supplies and finished goods 230.6 221.7
Work in progress 1,081.4 980.4
Advance payments made 14.7 9.7
Total 1,326.7 1,211.8
Work in progress includes direct labor and material costs as of the consolidated statement of financial position date with a propor-tion of indirect costs related to manufacturing and installation of firm customer orders. Firm customer orders are mainly fixed price contracts with customers for the sale of new equipment or for the modernization of old equipment.
19. DEFERRED ASSETS
MEUR Dec 31, 2015 Dec 31, 2014
Deferred interests 1.1 1.3
Deferred income from maintenance contracts 22.2 20.8
Unbilled contract revenue (note 4) 134.7 72.3
Derivative assets (note 2) 47.1 69.3
Value added tax assets 102.1 39.6
Prepaid expenses and other receivables 84.4 81.4
Total 391.6 284.7
20. SHAREHOLDERS EQUITY
The total shareholders’ equity consists of the share capital, the share premium account, the fair value and other reserves, translation differences, the paid-up unre-stricted equity reserve, remeasurements of employee benefits and retained earnings. When options are exercised and if new shares are issued, the impacts of changes in the share capital, which exceed the accounting par value of the shares, are included in the paid-up unrestricted equity reserve. If treasury shares are used in subscriptions with option rights the subscription price is included in the paid-up unrestricted equity reserve. The fair value and other reserves include changes in the fair value of cash flow hedges. Translation differences arising from the application of the acquisition method on the translation of the net investment
in foreign subsidiaries and associated companies are recorded under translation differences. Exchange rate differences resulting from derivatives and loans intended as hedges on assets and liabili-ties in foreign subsidiaries are also entered in translation differences. Actuarial gains and losses arising from employee benefits are recorded under remeasurements of employee benefits. The purchase price of own shares purchased by KONE Corpora-tion is deducted from retained earnings. The net income for the accounting period is booked directly in retained earnings.
Shares and share capitalAt the end of the 2015 financial year the number of shares outstanding was 525,406,314. The share capital was EUR 65.7 million and the total number of
votes was 121,128,472. Each class A share is assigned one vote, as is each block of 10 class B shares, with the provision that each shareholder is entitled to at least one vote. At the end of the financial year, the Board of Directors of the company had a valid authorization granted by the Annual General Meeting in February 2015 to increase the share capital and to issue stock options. The authorization shall remain in effect until February 23, 2020.
In accordance with the Articles of Asso-ciation, class B shares are preferred for a dividend which is at least 1 percent and no more than 2.5% higher than the divi-dend paid to the holders of class A shares, calculated based on the amount obtained by dividing the share capital entered into the Trade Register by the number of sha-res entered into the Trade Register.
3534
KONE 2015 Financial Statements | Notes to the consolidated financial statements
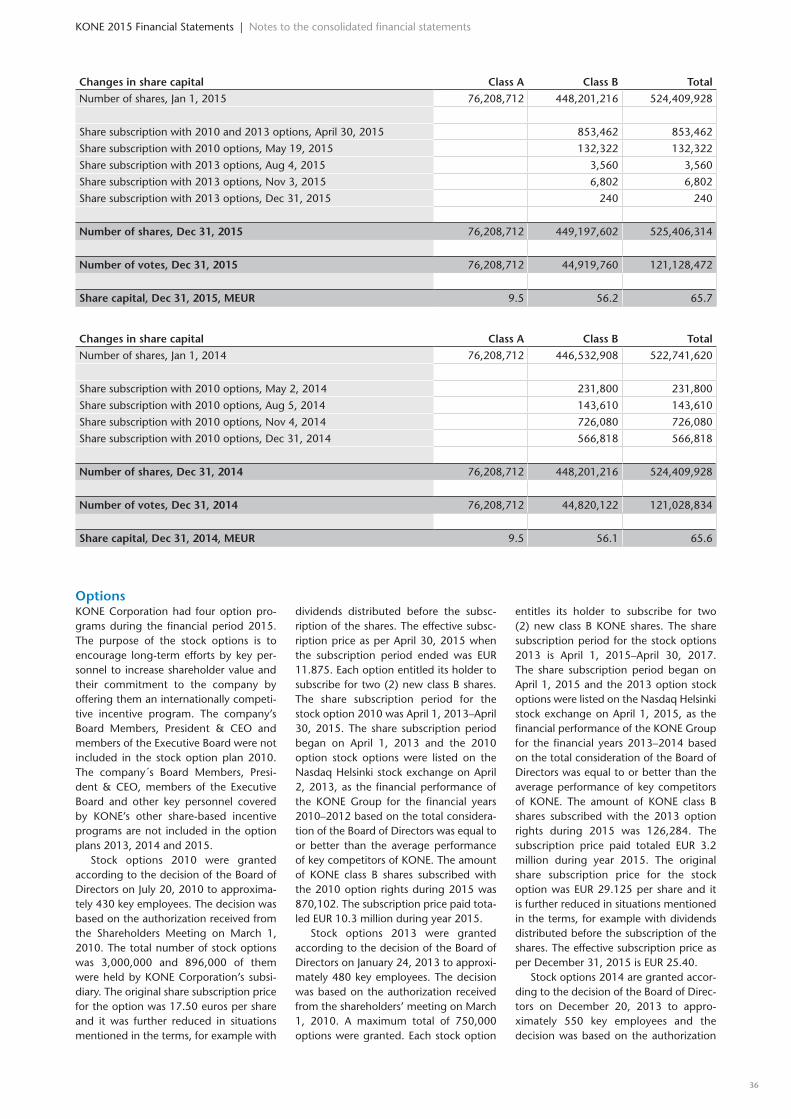
OptionsKONE Corporation had four option pro-grams during the financial period 2015. The purpose of the stock options is to encourage long-term efforts by key per-sonnel to increase shareholder value and their commitment to the company by offering them an internationally competi-tive incentive program. The company’s Board Members, President & CEO and members of the Executive Board were not included in the stock option plan 2010. The company´s Board Members, Presi-dent & CEO, members of the Executive Board and other key personnel covered by KONE’s other share-based incentive programs are not included in the option plans 2013, 2014 and 2015.
Stock options 2010 were granted according to the decision of the Board of Directors on July 20, 2010 to approxima-tely 430 key employees. The decision was based on the authorization received from the Shareholders Meeting on March 1, 2010. The total number of stock options was 3,000,000 and 896,000 of them were held by KONE Corporation’s subsi-diary. The original share subscription price for the option was 17.50 euros per share and it was further reduced in situations mentioned in the terms, for example with
dividends distributed before the subsc-ription of the shares. The effective subsc-ription price as per April 30, 2015 when the subscription period ended was EUR 11.875. Each option entitled its holder to subscribe for two (2) new class B shares. The share subscription period for the stock option 2010 was April 1, 2013–April 30, 2015. The share subscription period began on April 1, 2013 and the 2010 option stock options were listed on the Nasdaq Helsinki stock exchange on April 2, 2013, as the financial performance of the KONE Group for the financial years 2010–2012 based on the total considera-tion of the Board of Directors was equal to or better than the average performance of key competitors of KONE. The amount of KONE class B shares subscribed with the 2010 option rights during 2015 was 870,102. The subscription price paid tota-led EUR 10.3 million during year 2015.
Stock options 2013 were granted according to the decision of the Board of Directors on January 24, 2013 to approxi-mately 480 key employees. The decision was based on the authorization received from the shareholders’ meeting on March 1, 2010. A maximum total of 750,000 options were granted. Each stock option
entitles its holder to subscribe for two (2) new class B KONE shares. The share subscription period for the stock options 2013 is April 1, 2015–April 30, 2017. The share subscription period began on April 1, 2015 and the 2013 option stock options were listed on the Nasdaq Helsinki stock exchange on April 1, 2015, as the financial performance of the KONE Group for the financial years 2013–2014 based on the total consideration of the Board of Directors was equal to or better than the average performance of key competitors of KONE. The amount of KONE class B shares subscribed with the 2013 option rights during 2015 was 126,284. The subscription price paid totaled EUR 3.2 million during year 2015. The original share subscription price for the stock option was EUR 29.125 per share and it is further reduced in situations mentioned in the terms, for example with dividends distributed before the subscription of the shares. The effective subscription price as per December 31, 2015 is EUR 25.40.
Stock options 2014 are granted accor-ding to the decision of the Board of Direc-tors on December 20, 2013 to appro-ximately 550 key employees and the decision was based on the authorization
KONE 2015 Financial Statements | Notes to the consolidated financial statements
Changes in share capital Class A Class B Total
Number of shares, Jan 1, 2015 76,208,712 448,201,216 524,409,928
Share subscription with 2010 and 2013 options, April 30, 2015 853,462 853,462
Share subscription with 2010 options, May 19, 2015 132,322 132,322
Share subscription with 2013 options, Aug 4, 2015 3,560 3,560
Share subscription with 2013 options, Nov 3, 2015 6,802 6,802
Share subscription with 2013 options, Dec 31, 2015 240 240
Number of shares, Dec 31, 2015 76,208,712 449,197,602 525,406,314
Number of votes, Dec 31, 2015 76,208,712 44,919,760 121,128,472
Share capital, Dec 31, 2015, MEUR 9.5 56.2 65.7
Changes in share capital Class A Class B Total
Number of shares, Jan 1, 2014 76,208,712 446,532,908 522,741,620
Share subscription with 2010 options, May 2, 2014 231,800 231,800
Share subscription with 2010 options, Aug 5, 2014 143,610 143,610
Share subscription with 2010 options, Nov 4, 2014 726,080 726,080
Share subscription with 2010 options, Dec 31, 2014 566,818 566,818
Number of shares, Dec 31, 2014 76,208,712 448,201,216 524,409,928
Number of votes, Dec 31, 2014 76,208,712 44,820,122 121,028,834
Share capital, Dec 31, 2014, MEUR 9.5 56.1 65.6
36 36
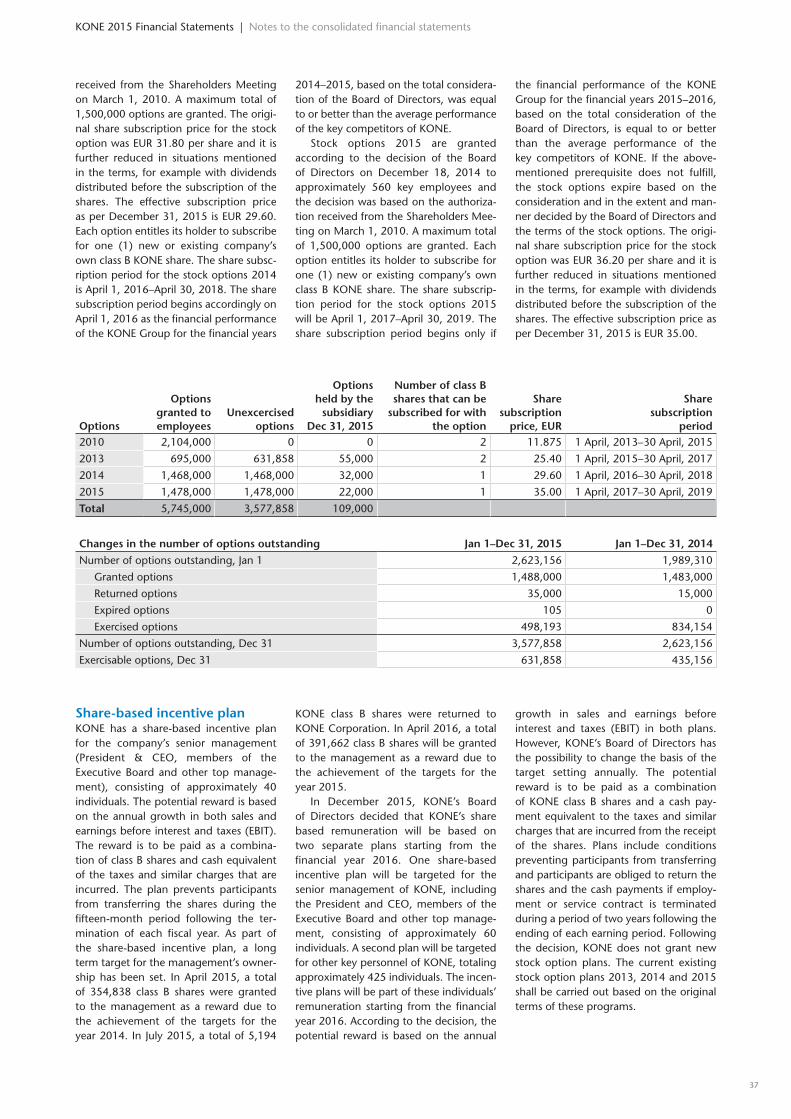
received from the Shareholders Meeting on March 1, 2010. A maximum total of 1,500,000 options are granted. The origi-nal share subscription price for the stock option was EUR 31.80 per share and it is further reduced in situations mentioned in the terms, for example with dividends distributed before the subscription of the shares. The effective subscription price as per December 31, 2015 is EUR 29.60. Each option entitles its holder to subscribe for one (1) new or existing company’s own class B KONE share. The share subsc-ription period for the stock options 2014 is April 1, 2016–April 30, 2018. The share subscription period begins accordingly on April 1, 2016 as the financial performance of the KONE Group for the financial years
2014–2015, based on the total considera-tion of the Board of Directors, was equal to or better than the average performance of the key competitors of KONE.
Stock options 2015 are granted according to the decision of the Board of Directors on December 18, 2014 to approximately 560 key employees and the decision was based on the authoriza-tion received from the Shareholders Mee-ting on March 1, 2010. A maximum total of 1,500,000 options are granted. Each option entitles its holder to subscribe for one (1) new or existing company’s own class B KONE share. The share subscrip-tion period for the stock options 2015 will be April 1, 2017–April 30, 2019. The share subscription period begins only if
the financial performance of the KONE Group for the financial years 2015–2016, based on the total consideration of the Board of Directors, is equal to or better than the average performance of the key competitors of KONE. If the above-mentioned prerequisite does not fulfill, the stock options expire based on the consideration and in the extent and man-ner decided by the Board of Directors and the terms of the stock options. The origi-nal share subscription price for the stock option was EUR 36.20 per share and it is further reduced in situations mentioned in the terms, for example with dividends distributed before the subscription of the shares. The effective subscription price as per December 31, 2015 is EUR 35.00.
Options
Options granted to employees
Unexcercised options
Options held by the
subsidiary Dec 31, 2015
Number of class B shares that can be
subscribed for with the option
Share subscription
price, EUR
Share subscription
period2010 2,104,000 0 0 2 11.875 1 April, 2013–30 April, 2015
2013 695,000 631,858 55,000 2 25.40 1 April, 2015–30 April, 2017
2014 1,468,000 1,468,000 32,000 1 29.60 1 April, 2016–30 April, 2018
2015 1,478,000 1,478,000 22,000 1 35.00 1 April, 2017–30 April, 2019
Total 5,745,000 3,577,858 109,000
Changes in the number of options outstanding Jan 1–Dec 31, 2015 Jan 1–Dec 31, 2014
Number of options outstanding, Jan 1 2,623,156 1,989,310
Granted options 1,488,000 1,483,000
Returned options 35,000 15,000
Expired options 105 0
Exercised options 498,193 834,154
Number of options outstanding, Dec 31 3,577,858 2,623,156
Exercisable options, Dec 31 631,858 435,156
Share-based incentive planKONE has a share-based incentive plan for the company’s senior management (President & CEO, members of the Executive Board and other top manage-ment), consisting of approximately 40 individuals. The potential reward is based on the annual growth in both sales and earnings before interest and taxes (EBIT). The reward is to be paid as a combina-tion of class B shares and cash equivalent of the taxes and similar charges that are incurred. The plan prevents participants from transferring the shares during the fifteen-month period following the ter-mination of each fiscal year. As part of the share-based incentive plan, a long term target for the management’s owner-ship has been set. In April 2015, a total of 354,838 class B shares were granted to the management as a reward due to the achievement of the targets for the year 2014. In July 2015, a total of 5,194
KONE class B shares were returned to KONE Corporation. In April 2016, a total of 391,662 class B shares will be granted to the management as a reward due to the achievement of the targets for the year 2015.
In December 2015, KONE’s Board of Directors decided that KONE’s share based remuneration will be based on two separate plans starting from the financial year 2016. One share-based incentive plan will be targeted for the senior management of KONE, including the President and CEO, members of the Executive Board and other top manage-ment, consisting of approximately 60 individuals. A second plan will be targeted for other key personnel of KONE, totaling approximately 425 individuals. The incen-tive plans will be part of these individuals’ remuneration starting from the financial year 2016. According to the decision, the potential reward is based on the annual
growth in sales and earnings before interest and taxes (EBIT) in both plans. However, KONE’s Board of Directors has the possibility to change the basis of the target setting annually. The potential reward is to be paid as a combination of KONE class B shares and a cash pay-ment equivalent to the taxes and similar charges that are incurred from the receipt of the shares. Plans include conditions preventing participants from transferring and participants are obliged to return the shares and the cash payments if employ-ment or service contract is terminated during a period of two years following the ending of each earning period. Following the decision, KONE does not grant new stock option plans. The current existing stock option plans 2013, 2014 and 2015 shall be carried out based on the original terms of these programs.
3736
KONE 2015 Financial Statements | Notes to the consolidated financial statements
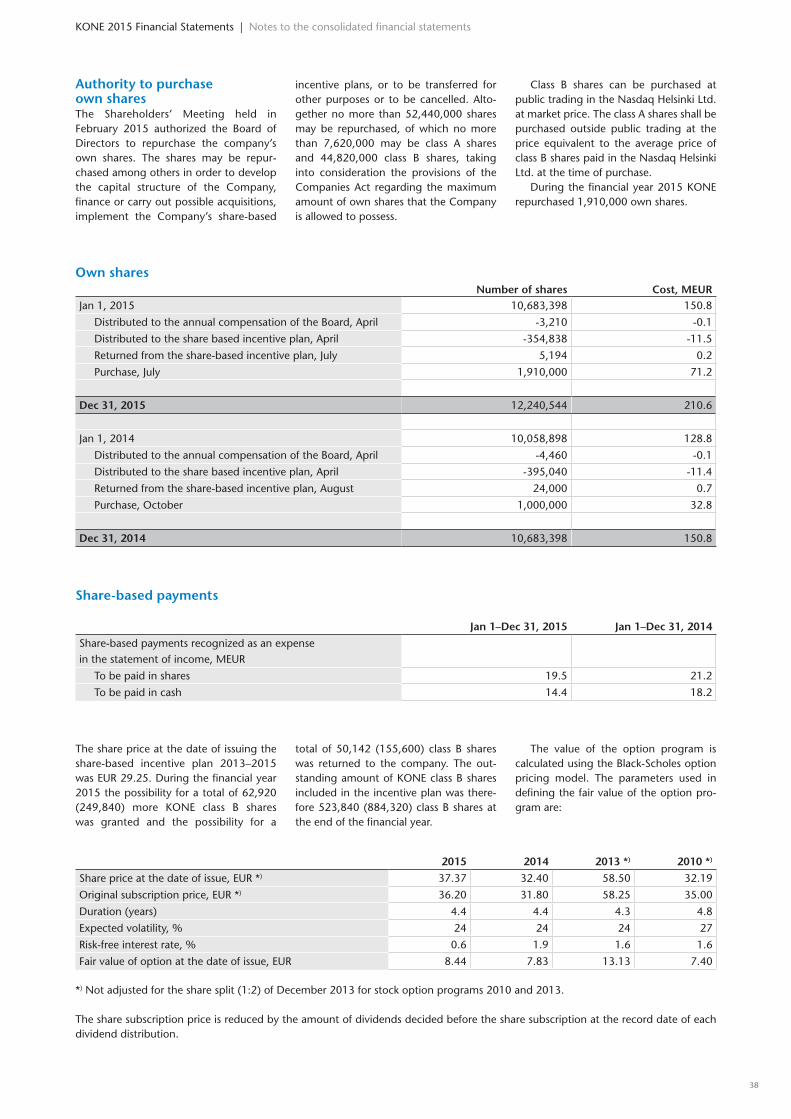
KONE 2015 Financial Statements | Notes to the consolidated financial statements
Authority to purchase own sharesThe Shareholders’ Meeting held in February 2015 authorized the Board of Directors to repurchase the company’s own shares. The shares may be repur-chased among others in order to develop the capital structure of the Company, finance or carry out possible acquisitions, implement the Company’s share-based
incentive plans, or to be transferred for other purposes or to be cancelled. Alto-gether no more than 52,440,000 shares may be repurchased, of which no more than 7,620,000 may be class A shares and 44,820,000 class B shares, taking into consideration the provisions of the Companies Act regarding the maximum amount of own shares that the Company is allowed to possess.
Class B shares can be purchased at public trading in the Nasdaq Helsinki Ltd. at market price. The class A shares shall be purchased outside public trading at the price equivalent to the average price of class B shares paid in the Nasdaq Helsinki Ltd. at the time of purchase.
During the financial year 2015 KONE repurchased 1,910,000 own shares.
Own shares Number of shares Cost, MEURJan 1, 2015 10,683,398 150.8
Distributed to the annual compensation of the Board, April -3,210 -0.1
Distributed to the share based incentive plan, April -354,838 -11.5
Returned from the share-based incentive plan, July 5,194 0.2
Purchase, July 1,910,000 71.2
Dec 31, 2015 12,240,544 210.6
Jan 1, 2014 10,058,898 128.8
Distributed to the annual compensation of the Board, April -4,460 -0.1
Distributed to the share based incentive plan, April -395,040 -11.4
Returned from the share-based incentive plan, August 24,000 0.7
Purchase, October 1,000,000 32.8
Dec 31, 2014 10,683,398 150.8
Share-based payments
Jan 1–Dec 31, 2015 Jan 1–Dec 31, 2014
Share-based payments recognized as an expense in the statement of income, MEUR
To be paid in shares 19.5 21.2
To be paid in cash 14.4 18.2
The share price at the date of issuing the share-based incentive plan 2013–2015 was EUR 29.25. During the financial year 2015 the possibility for a total of 62,920 (249,840) more KONE class B shares was granted and the possibility for a
total of 50,142 (155,600) class B shares was returned to the company. The out-standing amount of KONE class B shares included in the incentive plan was there-fore 523,840 (884,320) class B shares at the end of the financial year.
The value of the option program is calculated using the Black-Scholes option pricing model. The parameters used in defining the fair value of the option pro-gram are:
2015 2014 2013 *) 2010 *)
Share price at the date of issue, EUR *) 37.37 32.40 58.50 32.19
Original subscription price, EUR *) 36.20 31.80 58.25 35.00
Duration (years) 4.4 4.4 4.3 4.8
Expected volatility, % 24 24 24 27
Risk-free interest rate, % 0.6 1.9 1.6 1.6
Fair value of option at the date of issue, EUR 8.44 7.83 13.13 7.40
*) Not adjusted for the share split (1:2) of December 2013 for stock option programs 2010 and 2013.
The share subscription price is reduced by the amount of dividends decided before the share subscription at the record date of each dividend distribution.
38 38
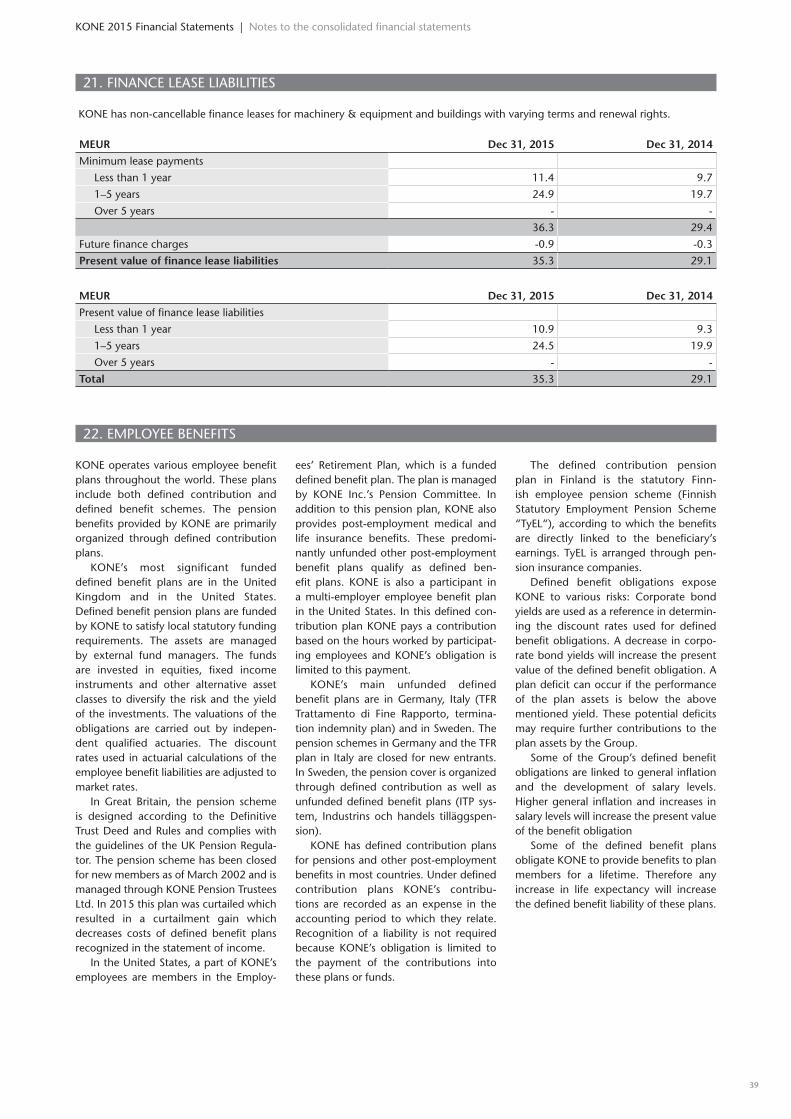
22. EMPLOYEE BENEFITS
KONE operates various employee benefit plans throughout the world. These plans include both defined contribution and defined benefit schemes. The pension benefits provided by KONE are primarily organized through defined contribution plans.
KONE’s most significant funded defined benefit plans are in the United Kingdom and in the United States. Defined benefit pension plans are funded by KONE to satisfy local statutory funding requirements. The assets are managed by external fund managers. The funds are invested in equities, fixed income instruments and other alternative asset classes to diversify the risk and the yield of the investments. The valuations of the obligations are carried out by indepen-dent qualified actuaries. The discount rates used in actuarial calculations of the employee benefit liabilities are adjusted to market rates.
In Great Britain, the pension scheme is designed according to the Definitive Trust Deed and Rules and complies with the guidelines of the UK Pension Regula-tor. The pension scheme has been closed for new members as of March 2002 and is managed through KONE Pension Trustees Ltd. In 2015 this plan was curtailed which resulted in a curtailment gain which decreases costs of defined benefit plans recognized in the statement of income.
In the United States, a part of KONE’s employees are members in the Employ-
ees’ Retirement Plan, which is a funded defined benefit plan. The plan is managed by KONE Inc.’s Pension Committee. In addition to this pension plan, KONE also provides post-employment medical and life insurance benefits. These predomi-nantly unfunded other post-employment benefit plans qualify as defined ben-efit plans. KONE is also a participant in a multi-employer employee benefit plan in the United States. In this defined con-tribution plan KONE pays a contribution based on the hours worked by participat-ing employees and KONE’s obligation is limited to this payment.
KONE’s main unfunded defined benefit plans are in Germany, Italy (TFR Trattamento di Fine Rapporto, termina-tion indemnity plan) and in Sweden. The pension schemes in Germany and the TFR plan in Italy are closed for new entrants. In Sweden, the pension cover is organized through defined contribution as well as unfunded defined benefit plans (ITP sys-tem, Industrins och handels tilläggspen-sion).
KONE has defined contribution plans for pensions and other post-employment benefits in most countries. Under defined contribution plans KONE’s contribu-tions are recorded as an expense in the accounting period to which they relate. Recognition of a liability is not required because KONE’s obligation is limited to the payment of the contributions into these plans or funds.
The defined contribution pension plan in Finland is the statutory Finn-ish employee pension scheme (Finnish Statutory Employment Pension Scheme “TyEL“), according to which the benefits are directly linked to the beneficiary’s earnings. TyEL is arranged through pen-sion insurance companies.
Defined benefit obligations expose KONE to various risks: Corporate bond yields are used as a reference in determin-ing the discount rates used for defined benefit obligations. A decrease in corpo-rate bond yields will increase the present value of the defined benefit obligation. A plan deficit can occur if the performance of the plan assets is below the above mentioned yield. These potential deficits may require further contributions to the plan assets by the Group.
Some of the Group’s defined benefit obligations are linked to general inflation and the development of salary levels. Higher general inflation and increases in salary levels will increase the present value of the benefit obligation
Some of the defined benefit plans obligate KONE to provide benefits to plan members for a lifetime. Therefore any increase in life expectancy will increase the defined benefit liability of these plans.
21. FINANCE LEASE LIABILITIES
KONE has non-cancellable finance leases for machinery & equipment and buildings with varying terms and renewal rights.
MEUR Dec 31, 2015 Dec 31, 2014
Minimum lease payments
Less than 1 year 11.4 9.7
1–5 years 24.9 19.7
Over 5 years - -
36.3 29.4
Future finance charges -0.9 -0.3
Present value of finance lease liabilities 35.3 29.1
MEUR Dec 31, 2015 Dec 31, 2014
Present value of finance lease liabilities
Less than 1 year 10.9 9.3
1–5 years 24.5 19.9
Over 5 years - -
Total 35.3 29.1
3938
KONE 2015 Financial Statements | Notes to the consolidated financial statements
KONE 2015 Financial Statements | Notes to the consolidated financial statements
Employee benefit liabilities recognized in the consolidated statement of financial position, MEUR Dec 31, 2015 Dec 31, 2014Employee benefits
Defined benefit plans 142.6 161.3
Other post-employment benefits 18.2 17.7
Total 160.8 178.9
Dec 31, 2015 Dec 31, 2014
Employee benefit liabilities recognized in the consolidated statement of financial position, MEUR
Defined benefit plans
Other post- employment
benefitsDefined
benefit plans
Other post- employment
benefitsPresent value of unfunded obligations 84.0 0.7 112.9 0.7
Present value of funded obligations 453.7 18.4 409.1 17.8
Fair value of benefit plans’ assets -395.1 -0.9 -360.7 -0.8
Total 142.6 18.2 161.3 17.7
Dec 31, 2015 Dec 31, 2014
Net liability reconciliationDefined
benefit plans
Other post- employment
benefitsDefined
benefit plans
Other post- employment
benefitsEmployee benefit liability at beginning of period 161.3 17.7 120.8 14.0
Employee benefit assets at beginning of period - - - -
Net liability at beginning of period 161.3 17.7 120.8 14.0
Translation differences 5.1 2.0 1.3 1.9
Acquisitions of new companies - - 2.3 -
Costs recognized in statement of income -0.4 0.9 3.3 0.7
Remeasurements 4.2 -1.7 54.1 2.0
Paid contributions and benefits -27.6 -0.7 -20.5 -0.9
Reclassifications - - - -
Net liability at end of period 142.6 18.2 161.3 17.7
Employee benefit liability at end of period 151.1 18.2 161.3 17.7
Employee benefit assets at end of period -8.4 - - -
Net liability at end of period 142.6 18.2 161.3 17.7
Amounts recognized in the statement of income, MEUR Jan 1–Dec 31, 2015 Jan 1–Dec 31, 2014Defined contribution pension plans 161.9 126.2
Defined benefit pension plans -0.4 3.3
Other post-employment benefits 0.9 0.7
Total 162.3 130.1
Jan 1–Dec 31, 2015 Jan 1–Dec 31, 2014
Amounts recognized in the statement of income, MEUR
Defined benefit plans
Other post- employment
benefitsDefined
benefit plans
Other post- employment
benefitsCurrent service costs 13.6 0.3 10.4 0.1
Net interest 4.2 0.6 4.2 0.6
Past-service costs -0.2 - -0.1 -
Settlements - - - -
Curtailments -18.1 - -11.2 -
Total -0.4 0.9 3.3 0.7
The actual return on the assets of defined benefit plans was EUR -0.5 (34.0) million.
40 40

Defined benefit plans: assumptions used in calculating benefit obligations
Jan 1–Dec 31, 2015 Jan 1–Dec 31, 2014
Europe USA Europe USA
Discount rate, % 3.43 3.89 3.56 3.78
Future salary increase, % 2.9 4.0 3.8 4.0
Future pension increase, % 2.8 4.0 2.8 4.0
Sensitivity of the defined benefit obligation to changes in actuarial assumptions
Impact on defined benefit obligation Dec 31, 2015 Dec 31, 2014
Discount rate, +0.25 percentage points -3.8% -4.0%
Discount rate, -0.25 percentage points 4.3% 4.5%
Future salary increase, +0.25 percentage points - 0.4%
Future salary increase, -0.25 percentage points - -0.4%
Future pension increase, +0.25 percentage points 0.2% 2.8%
Future pension increase, -0.25 percentage points -0.2% -2.2%
The above sensitivity analyses cover 79 (79) percent of KONE’s defined benefit obligation. Sensitivities are calculated by changing one assumption at a time while keeping other variables constant.
23. PROVISIONS
Jan 1–Dec 31, 2015, MEURProvision
for warrantyProvision for claims
Provision for business
restructuring
Provision for loss
contractsOther
provisions TotalTotal provisions at beginning of period 53.9 3.3 19.4 23.0 37.8 137.4
Translation differences 1.6 0.0 0.1 1.2 -0.7 2.1
Increase 46.6 7.4 15.5 16.9 29.9 116.3
Provisions used -27.3 -0.9 -15.6 -14.4 -4.9 -63.1
Reversal of provisions -4.8 - -0.8 -2.2 -12.2 -20.1
Companies acquired - - - 0.4 0.6 1.0
Total provisions at end of period 69.9 9.8 18.6 24.9 50.4 173.6
Non-current
liabilitiesCurrent
liabilities TotalDistribution of provisions as of Dec 31, 2015 74.8 98.8 173.6
Jan 1–Dec 31, 2014, MEURProvision
for warrantyProvision for claims
Provision for business
restructuring
Provision for loss
contractsOther
provisions TotalTotal provisions at beginning of period 68.0 4.2 16.3 19.8 31.1 139.4
Translation differences 2.7 -0.1 0.2 1.5 0.6 4.9
Increase 24.2 1.0 13.6 11.4 13.0 63.2
Provisions used -27.0 -1.1 -9.2 -8.7 -4.2 -50.2
Reversal of provisions -14.1 -0.7 -1.5 -1.0 -2.7 -19.9
Companies acquired - - - - - -
Total provisions at end of period 53.9 3.3 19.4 23.0 37.8 137.4
Non-current
liabilitiesCurrent
liabilities TotalDistribution of provisions as of Dec 31, 2014 44.0 93.5 137.4
4140
KONE 2015 Financial Statements | Notes to the consolidated financial statements

24. ACCRUALS AND ADVANCE PAYMENTS RECEIVED
Accruals, MEUR Dec 31, 2015 Dec 31, 2014
Accrued interests 0.2 0.1
Accrued income of maintenance contracts 309.7 284.6
Late costs accruals 1) 379.2 299.6
Accrued salaries, wages and employment costs 406.1 371.5
Share-based payments 31.0 29.0
Derivative liabilities (note 2) 36.8 22.8
Accrued value added tax 124.1 65.8
Accruals from acquisitions 22.6 26.8
Other accruals 265.6 270.8
Total 1,575.2 1,371.0
1) Includes expected costs still to be incurred on new equipment and modernization contracts which have been completed.
Advance payments received, MEUR Dec 31, 2015 Dec 31, 2014
Advance payments received 1,829.4 1,628.7
Advance payments received include customer payments for orders included in work in progress according to the contractual payment terms.
25. COMMITMENTS
MEUR Dec 31, 2015 Dec 31, 2014
Guarantees
Associated companies - 1.9
Others 6.9 4.2
Operating leases 277.7 277.8
Total 284.6 283.9
Banks and financial institutions have guaranteed obligations arising in the ordinary course of business of KONE companies up to a maximum of EUR 1,322.7 (1,064.3) million as of December 31, 2015.
KONE leases cars, machinery & equipment and buildings under operating leases with varying terms.
The future minimum lease payments under non-cancellable operating leases, MEUR Dec 31, 2015 Dec 31, 2014Less than 1 year 73.6 72.0
1–5 years 153.8 151.7
Over 5 years 50.3 54.1
Total 277.7 277.8
The aggregate operating lease expenses totaled EUR 92.7 (96.3) million.
KONE 2015 Financial Statements | Notes to the consolidated financial statements
42 42
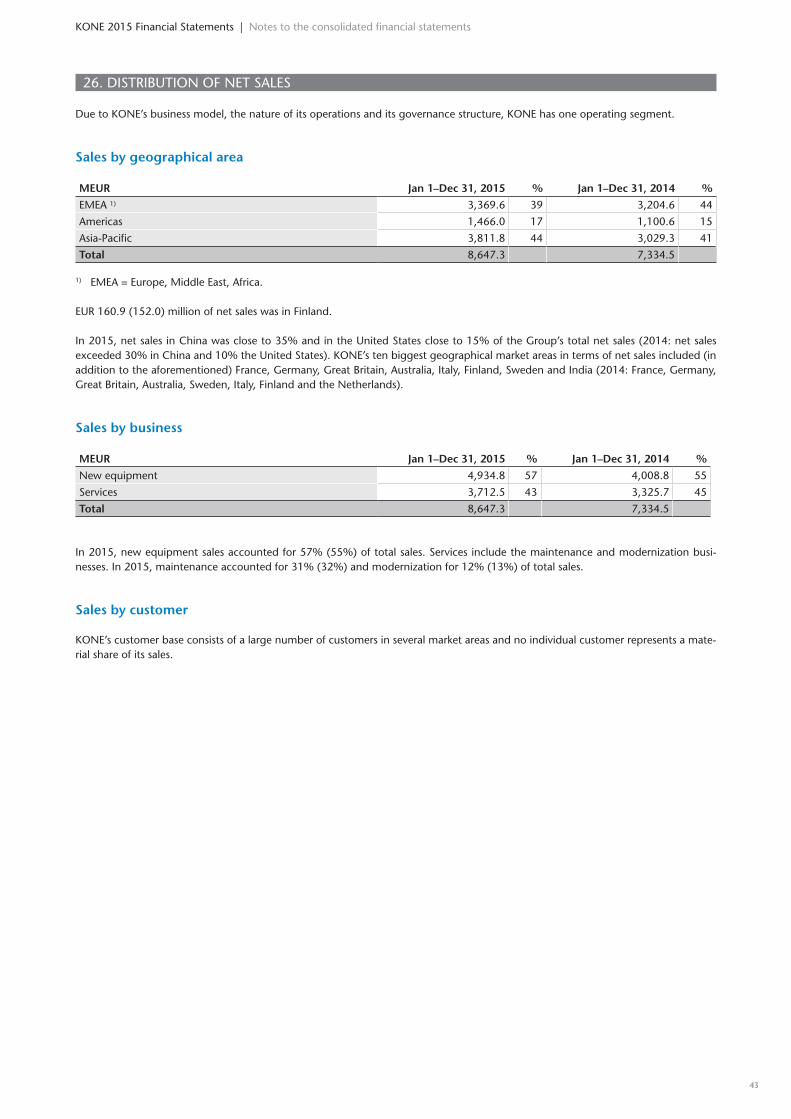
26. DISTRIBUTION OF NET SALES Due to KONE’s business model, the nature of its operations and its governance structure, KONE has one operating segment.
Sales by geographical area
MEUR Jan 1–Dec 31, 2015 % Jan 1–Dec 31, 2014 %
EMEA 1) 3,369.6 39 3,204.6 44
Americas 1,466.0 17 1,100.6 15
Asia-Pacific 3,811.8 44 3,029.3 41
Total 8,647.3 7,334.5
1) EMEA = Europe, Middle East, Africa.
EUR 160.9 (152.0) million of net sales was in Finland.
In 2015, net sales in China was close to 35% and in the United States close to 15% of the Group’s total net sales (2014: net sales exceeded 30% in China and 10% the United States). KONE’s ten biggest geographical market areas in terms of net sales included (in addition to the aforementioned) France, Germany, Great Britain, Australia, Italy, Finland, Sweden and India (2014: France, Germany, Great Britain, Australia, Sweden, Italy, Finland and the Netherlands).
Sales by business
MEUR Jan 1–Dec 31, 2015 % Jan 1–Dec 31, 2014 %
New equipment 4,934.8 57 4,008.8 55
Services 3,712.5 43 3,325.7 45
Total 8,647.3 7,334.5
In 2015, new equipment sales accounted for 57% (55%) of total sales. Services include the maintenance and modernization busi-nesses. In 2015, maintenance accounted for 31% (32%) and modernization for 12% (13%) of total sales.
Sales by customer
KONE’s customer base consists of a large number of customers in several market areas and no individual customer represents a mate-rial share of its sales.
4342
KONE 2015 Financial Statements | Notes to the consolidated financial statements

Calculation of key figuresAverage number
of employees=
the average number of employees at the end of each calendar month
during the accounting period
Return on equity (%) = 100 x net income
total equity (average of the figures for the accounting period)
Return on
capital employed (%)= 100 x
net income + financing expenses
equity + interest-bearing-debt
(average of the figures for the accounting period)
Total equity/total assets (%) = 100 xtotal equity
total assets - advance payments received
Gearing (%) = 100 xinterest-bearing-debt - liquid assets - loans receivable
total equity
Basic earnings/share = net income attributable to the shareholders of the parent company
issue and conversion-adjusted weighted average
number of shares - repurchased own shares
Equity/share = total shareholders’ equity
number of shares (issue adjusted) - repurchased own shares
Dividend/share = dividend payable for the accounting period
issue and conversion-adjusted weighted average
number of shares - repurchased own shares
Dividend/earnings (%) = 100 x dividend/share
earnings/share
Effective dividend yield (%) = 100 x dividend/share
price of class B shares at end of accounting period
Price/earnings = price of class B shares at end of accounting period
earnings/share
Average price = total EUR value of all class B shares traded
average number of class B shares traded during the accounting period
Market value of all
outstanding shares=
the number of shares (A + B) at end of accounting period
times the price of class B shares at end of accounting period 1)
Shares traded = number of class B shares traded during the accounting period
Shares traded (%) = 100 x number of class B shares traded
average weighted number of class B shares
1) Excluding repurchased own shares. Class A shares are valued at the closing price of the class B shares.
KONE 2015 Financial Statements | Calculation of key figures
44 44

Key figures and financial developmentConsolidated statement of income, Jan 1–Dec 31 2015 2014 2013 2012 2011Sales, MEUR 8,647 7,334 6,933 6,277 5,225- sales outside Finland, MEUR 8,486 7,183 6,807 6,114 5,080Operating income, MEUR 1,241 1,036 953 791 725- as percentage of sales, % 14.4 14.1 13.8 12.6 13.9Operating income excluding one-time items, MEUR 1) 1,241 1,036 953 829 725- as percentage of sales, % 1) 14.4 14.1 13.8 13.2 13.9Income before taxes, MEUR 1,364 1,016 960 804 817- as percentage of sales, % 15.8 13.9 13.9 12.8 15.6Net income, MEUR 1,053 774 713 611 644
Consolidated statement of financial position, MEUR Dec 31, 2015 Dec 31, 2014 Dec 31, 2013 Dec 31, 2012 Dec 31, 2011Non-current assets 2,361 2,169 1,938 1,937 1,750Current assets 5,144 4,191 3,405 3,197 2,977Total equity 2,575 2,062 1,725 1,834 2,034Non-current liabilities 343 321 262 302 208Provisions 174 137 139 136 89Current liabilities 4,414 3,839 3,217 2,862 2,397Total assets 7,506 6,360 5,343 5,134 4,727Interest-bearing net debt -1,513 -912 -622 -574 -829Assets employed 2) 1,063 1,151 1,103 1,260 1,205Net working capital 2) -983 -750 -612 -439 -361Inventories, net of advance payments received -503 -417 -294 -261 -167
Other data, Jan 1–Dec 31 2015 2014 2013 2012 2011Orders received, MEUR 7,959 6,813 6,151 5,496 4,465Order book, MEUR 8,210 6,952 5,587 5,050 4,348Cash flow from operations before financing items and taxes, MEUR 1,474 1,345 1,213 1,071 820Capital expenditure, MEUR 93 88 74 119 52- as percentage of sales, % 1.1 1.2 1.1 1.9 1.0Expenditure for research and development, MEUR 122 103 96 86 83- as percentage of sales, % 1.4 1.4 1.4 1.4 1.6Average number of employees 48,469 45,161 41,139 38,477 34,769Number of employees at end of period 49,734 47,064 43,298 39,851 37,542Employee costs 2,446 2,100 1,984 1,875 1,676
Key ratios, %, Jan 1–Dec 31 2015 2014 2013 2012 2011Return on equity 45.4 40.9 40.1 32.1 35.5Return on capital employed 41.7 37.7 36.3 29.4 34.3Total equity/total assets 45.4 43.6 43.7 47.1 54.0Gearing -58.7 -44.2 -36.1 -31.3 -40.8
Key figures per share, Jan 1–Dec 31 2015 2014 2013 2012 2011Basic earnings per share, EUR 2.01 1.47 1.37 1.17 1.26Diluted earnings per share, EUR 2.00 1.47 1.36 1.17 1.25Basic earnings per share, EUR, excluding one-time items 3) 1.79 - - 1.23 1.15Equity per share, EUR 4.94 3.93 3.30 3.53 3.97Dividend per class B share, EUR 5) 1.40 4) 1.20 1.00 1.525 1.45Dividend per class A share, EUR 5) 1.3975 4) 1.1975 0.9975 1.52 1.445Dividend per earnings, class B share, % 69.7 4) 81.5 73.0 129.8 115.1Dividend per earnings, class A share, % 69.6 4) 81.3 72,8 129.4 114.7Effective dividend yield, class B share, % 3.6 4) 3.2 3.0 5.5 7.2Price per earnings, class B share 19.49 25.68 23.96 23.74 15.91Market value of class B share, average, EUR 38.29 31.83 31.60 23.69 19.91- at end of period, EUR 39.17 37.82 32.80 27.90 20.05Market capitalization at end of period, MEUR 6) 20,101 19,429 16,816 14,306 10,249Number of class A shares at end of period, (1,000s) 76,209 76,209 76,209 76,209 76,209Weighted average number of class A shares, (1,000s) 76,209 76,209 76,209 76,209 76,209Number of class B shares at end of period, (1,000s) 6) 449,198 437,518 436,474 436,543 434,939Weighted average number of class B shares, (1,000s) 7) 438,958 438,794 438,831 438,104 436,889Weighted average number of shares, (1,000s) 7) 515,167 515,002 515,040 514,313 513,098
All share-related figures adjusted for the share split (1:2) done in December 2013. Comparative figures for 2012 have been restated according to the revised IAS 19 Employee Benefits.
1) 2012: Excluding a one-time cost related to the support function development and cost adjustment programs.2) Including tax receivables and liabilities, accrued interest and derivative items.3) 2015: Excluding the extraordinary dividend from TELC. 2012: Excluding a one-time cost related to the support function development and cost adjust-
ment programs. 2011: Excluding a one-time gain from revaluation of previously held interest in GiantKONE.4) Board’s proposal.5) 2012: Including an extra dividend of EUR 0.65 per class B-share and EUR 0.6475 per class A-share. 2011: Including an extra dividend of EUR 0.75 per
class B-share and EUR 0.7475 per class A-share. 6) Reduced by the number of repurchased own shares. Class A shares are valued at the closing price of the class B shares.7) Adjusted for share issue and share option and share-based incentive plan dilution, and reduced by the number of repurchased own shares.
KONE 2015 Financial Statements | Key figures and financial development
4544

Parent company statement of incomeEUR Note Jan 1–Dec 31, 2015 Jan 1–Dec 31, 2014
Sales 1 543,447,039.93 454,088,006.86
Other operating income 2 7,995,425.19 9,594,794.10
Materials and services -2,865,216.19 -538,678.28
Personnel expenses 3 -78,872,864.25 -66,476,807.18
Depreciation and amortization 4 -13,072,140.30 -12,138,877.93
Other operating expenses 5 -298,001,215.18 -260,126,561.64
Operating income 158,631,029.20 124,401,875.93
Financing income and expenses 6 1,032,117,087.91 273,386,220.88
Income before extraordinary items 1,190,748,117.11 397,788,096.81
Extraordinary items +/- 7 44,000,000.00 30,600,000.00
Income before appropriations and taxes 1,234,748,117.11 428,388,096.81
Appropriations -1,684,645.71 -1,092,513.12
Income taxes -32,005,093.71 -31,613,166.86
Deferred taxes -90,138.53 8,382,611.39
Net income 1,200,968,239.16 404,065,028.22
KONE 2015 Financial Statements | Parent company statement of income
46 46

Parent company statement of financial position
KONE 2015 Financial Statements | Parent company statement of financial position
Assets, EUR Note Dec 31, 2015 Dec 31, 2014Non-current assetsIntangible assets 8 26,973,598.00 28,178,470.00Property, plant and equipment 9 28,120,403.91 18,842,969.94Investments
Subsidiary shares 10 3,088,037,403.28 3,196,747,917.57Other shares 11 2,374,307.53 3,114,631.47
3,090,411,710.81 3,199,862,549.04
Total non-current assets 3,145,505,712.72 3,246,883,988.98
Current assetsLong-term receivables 12
Loans receivable 28,017,318.31 25,898,816.9228,017,318.31 25,898,816.92
Short-term receivables 13Accounts receivable 53,967,795.45 50,385,346.67Loans receivable 376,592,637.89 172,728,792.19Deferred tax assets 8,571,965.50 8,662,104.03Other receivables 4,595,641.39 4,461,397.82Deferred assets 182,902,357.88 216,577,733.14
626,630,398.11 452,815,373.85
Financial investments 1,036,624,826.92 438,225,293.21Cash and cash equivalents 315,985,202.73 112,847,839.29
Total current assets 2,007,257,746.07 1,029,787,323.27
Total assets 5,152,763,458.79 4,276,671,312.25
Equity and liabilities, EUR Note Dec 31, 2015 Dec 31, 2014Equity
Share capital 65,675,789.25 65,551,241.00Share premium account 100,328,064.58 100,328,064.58
Other reservesPaid-up unrestricted equity reserve 140,702,748.16 127,026,774.86
Retained earnings 423,552,561.11 707,056,121.78Net income 1,200,968,239.16 404,065,028.22
Total equity 14 1,931,227,402.26 1,404,027,230.44
Cumulative accelerated depreciation 7,300,024.40 5,615,378.69Appropriations 7,300,024.40 5,615,378.69
Provisions 15 4,745,756.94 4,624,451.56
LiabilitiesNon-current liabilities 16
Loans 1,333,527,173.54 1,012,643,547.611,333,527,173.54 1,012,643,547.61
Current liabilities 17Accounts payable 56,413,885.24 52,701,197.41Loans 1,702,631,049.64 1,678,351,897.44Other liabilities 1,776,731.92 1,516,762.37Accruals 115,141,434.85 117,190,846.73
1,875,963,101.65 1,849,760,703.95
Total liabilities 3,209,490,275.19 2,862,404,251.56
Total equity and liabilities 5,152,763,458.79 4,276,671,312.25
4746

Parent company cash flow statement
EUR Jan 1–Dec 31, 2015 Jan 1–Dec 31, 2014
Cash receipts from customers 520,535,189.07 513,185,208.67
Cash receipts from other operative income 7,848,265.20 7,017,593.89
Cash paid to suppliers and employees -376,229,094.68 -312,175,746.68
Financing items 1,100,822,352.25 277,797,551.37
Taxes and other items -31,750,603.49 -98,509,204.77
Cash flow from operating activities 1,221,226,108.35 387,315,402.48
Capital expenditure -21,380,942.48 -23,072,376.93
Proceeds from sales of fixed assets 409,247.16 3,308,127.64
Subsidiary investments -95,376,569.00 -423,764,494.62
Proceeds from sales of subsidiary shares 200,214,510.42 210,000,000.00
Cash flow from investing activities 83,866,246.10 -233,528,743.91
Purchase of own shares -71,156,511.97 -32,802,268.73
Increase in equity (option rights) 13,540,074.85 21,813,127.10
Net change in short-term debt 24,843,578.82 314,104,283.67
Net change in long-term debt 320,883,625.93 303,585,900.31
Profit distribution -616,281,314.22 -537,483,743.78
Group contributions received 30,600,000.00 41,584,500.00
Other financing items -804,384,444.42 -303,789,541.05
Cash flow from financing activities -1,101,954,991.01 -192,987,742.48
Change in cash and cash equivalents 203,137,363.44 -39,201,083.91
Cash and cash equivalents, Jan 1 112,847,839.29 152,048,923.20
Cash and cash equivalents, Dec 31 315,985,202.73 112,847,839.29
Change in cash and cash equivalents 203,137,363.44 -39,201,083.91
Reconciliation of net income to the cash flow from operating activities
Net income 1,200,968,239.16 404,065,028.22
Depreciation and amortization 13,072,140.30 12,138,877.93
Other adjustments -38,297,671.28 -31,941,877.49
Income before change in working capital 1,175,742,708.18 384,262,028.66
Change in receivables 43,461,285.67 -28,285,717.66
Change in liabilities 2,022,114.50 31,339,091.48
Cash flow from operating activities 1,221,226,108.35 387,315,402.48
KONE 2015 Financial Statements | Parent company cash flow statement
48 48
Accounting principles of the parent company financial statementsThe parent company financial statements have been prepared according to the Finnish Accounting Standards. Financial statements have been prepared for the period of 12 months between January 1 and December 31, 2015.
Foreign currency transactionsTransactions in foreign currencies are recorded at the rate of exchange prevail-ing on the date of the individual trans-action. Foreign currency denominated receivables and liabilities are translated using the period end exchange rates.
Foreign exchange gains and losses associated with loans, deposits and other statement of financial position items are included under financing income and expenses.
Derivative instrumentsDerivate financial instruments that are used to hedge the currency and the interest rate risks as well as to hedge the commodity risk related to the electricity price risk are initially and subsequently recognized at fair value in the statement of financial position. The fair values of foreign exchange forward contracts are calculated by discounting the future cash flows of the contracts with the relevant market interest rate yield curves on the valuation date and by calculating the dif-ference between the discounted values in euros. The fair values of cross currency swaps are determined by discounting the expected future cash flows of the con-tracts with the market interest rate yield curves of the currencies concerned. The fair value of electricity price forwards is based on electricity stock exchange prices on the valuation date. The fair values of derivative financial instruments are pre-sented in note 19.
Changes in the fair values of foreign exchange derivatives are recognized in financing income and expenses if the hedged item is a loan receivable, deposit
or a financial asset or liability denomi-nated in a foreign currency. Fair value changes of electricity price forwards designated as hedges against future electricity purchases are recognized in the income statement as adjustment items to purchases.
Revenue recognitionRevenues related to the utilization of intangible property rights are recognized as sales on an accrual basis, according to the existing contracts. The sales of services are recognized as sales when the services have been rendered or when the work is being carried out.
Research and development costResearch and development costs are expensed as they incur.
PensionsAn external pension insurance company manages the parent company statu-tory pension plan. Contributions to the pension plan are charged directly to the statement of income in the year to which these contributions relate.
LeasesLeasing payments are charged to the statement of income on a straight-line basis over the leasing term. Remaining future leasing liabilities from existing con-tracts are presented in note 18.
Extraordinary itemsExtraordinary items include received and charged group contributions.
TaxesTax expense includes taxes based on tax-able income for the period, together with tax adjustments for previous periods and changes in deferred taxes. Deferred taxes are provided for temporary differences arising between the tax basis of assets and liabilities and their book values in financial
reporting, and measured with enacted tax rates.
Deferred tax liabilities arising from temporary differences are fully recognized with prudency, whereas the deferred tax assets are recognized only to the extent of the probable future tax benefit.
Non-current assetsIntangible assets and property, plant and equipment are stated at the cost less accumulated depreciation and amortiza-tion. Depreciation and amortization is recorded on a straight-line basis over the economic useful lives of the assets as fol-lows:
Buildings 5–40 yearsMachinery and equipment 4–10 yearsOther long-term expenditure 4–5 years
Land is not depreciated.
Investments in subsidiaries and other companies are measured at cost, or fair value in case the fair value is less than cost.
ProvisionsFuture costs in which the parent company has committed to and which probably will not contribute in future revenues are recognized in provisions.
Financial risk managementKONE Group Treasury of the parent com-pany centrally manages the group finan-cial risk. The financial risk management principles are presented in note 2 of the consolidated financial statements.
Cash and cash equivalentsCash and cash equivalents includes cash-in-hand and bank account balances. Used bank overdrafts are included in other cur-rent liabilities.
KONE 2015 Financial Statements | Accounting principles of the parent company financial statements
4948
Notes to the parent company financial statementsNotes to the statement of income
1. SALES
Sales to subsidiaries was 543,447.0 (454,088.0) thousand, which relates to revenues for the utilization of intellectual property rights.
2. OTHER OPERATING INCOME
EUR 1,000 Jan 1–Dec 31, 2015 Jan 1–Dec 31, 2014Subsidies received 1,538.6 1,146.9Recharged energy 1,968.9 2,058.9Service charges 2,452.8 2,076.6Others 2,035.2 4,312.4Total 7,995.4 9,594.8
3. PERSONNEL EXPENSES
EUR 1,000 Jan 1–Dec 31, 2015 Jan 1–Dec 31, 2014Wages and salaries 65,527.8 53,082.3Pension costs 10,067.2 10,591.6Other employment expenses 3,277.9 2,802.9Total 78,872.9 66,476.8
In 2015, the salaries and fees paid to the President & CEO and to the Board of Directors were together EUR 5,830.2 (5,037.7) thou-sand. Average number of staff employed by the parent company was 785 during the financial year (733).
4. DEPRECIATION AND AMORTIZATION
EUR 1,000 Jan 1–Dec 31, 2015 Jan 1–Dec 31, 2014Intangible rights 473.1 382.1Other long term expenditure 9,745.2 9,253.0Buildings 530.0 434.0Machinery and equipment 2,323.8 2,069.7Total 13,072.1 12,138.9
5. AUDITORS’ FEES
EUR 1,000 Jan 1–Dec 31, 2015 Jan 1–Dec 31, 2014Audit 386.5 370.0Auditors’ statements 6.8 7.5Tax advise 2.0 14.0Other services 293.0 346.8Total 688.3 738.3
KONE 2015 Financial Statements | Notes to the parent company financial statements
50 50
6. FINANCING INCOME AND EXPENSES
EUR 1,000 Jan 1–Dec 31, 2015 Jan 1–Dec 31, 2014Dividend income from subsidiaries 1,074,413.2 319,293.1Other dividends received 0.5 36.5Interest income from subsidiaries 1,761.2 2,214.2Interest income from others 32,298.2 13,937.7Interest expenses to subsidiaries -31,803.5 -27,829.9Interest expenses to others -6,589.7 -108.3Other financing income and expenses -37,962.8 -34,157.1Total 1,032,117.1 273,386.2
7. EXTRAORDINARY INCOME AND EXPENSES
EUR 1,000 Jan 1–Dec 31, 2015 Jan 1–Dec 31, 2014Group contributions received 44,000.0 30,600.0Total 44,000.0 30,600.0
Notes to the statement of financial position
8. INTANGIBLE ASSETS
Jan 1–Dec 31, 2015, EUR 1,000 Intangible
rights
Other long-term
expenditureAdvance
payments TotalJan 1, 2015Acquisition cost 3,025.1 90,226.3 5,132.6 98,383.9Accumulated amortization and impairment -1,854.5 -68,351.0 - -70,205.5Net book value 1,170.6 21,875.3 5,132.6 28,178.5
Opening net book value 1,170.6 21,875.3 5,132.6 28,178.5Increase 195.5 8,957.8 - 9,153.3Decrease - -920.7 - -920.7Reclassifications 760.3 2,684.1 -2,663.5 781.0Amortization -473.1 -9,745.2 - -10,218.3Closing net book value 1,653.2 22,851.3 2,469.1 26,973.6
Dec 31, 2015Acquisition cost 3,980.8 98,812.0 2,469.1 105,261.9Accumulated amortization and impairment -2,327.6 -75,960.7 - -78,288.3Net book value 1,653.2 22,851.3 2,469.1 26,973.6
Jan 1–Dec 31, 2014, EUR 1,000 Intangible
rights
Other long-term
expenditureAdvance
payments TotalJan 1, 2014Acquisition cost 2,724.3 81,107.0 - 83,831.3Accumulated amortization and impairment -1,472.4 -59,104.8 - -60,577.2Net book value 1,251.9 22,002.2 - 23,254.1
Opening net book value 1,251.9 22,002.2 - 23,254.1Increase 300.8 9,128.3 5,132.6 14,561.7Decrease - -2.2 - -2.2Amortization -382.1 -9,253.0 - -9,635.1Closing net book value 1,170.6 21,875.3 5,132.6 28,178.5
Dec 31, 2014Acquisition cost 3,025.1 90,226.3 5,132.6 98,383.9Accumulated amortization and impairment -1,854.5 -68,351.0 - -70,205.5Net book value 1,170.6 21,875.3 5,132.6 28,178.5
5150
KONE 2015 Financial Statements | Notes to the parent company financial statements
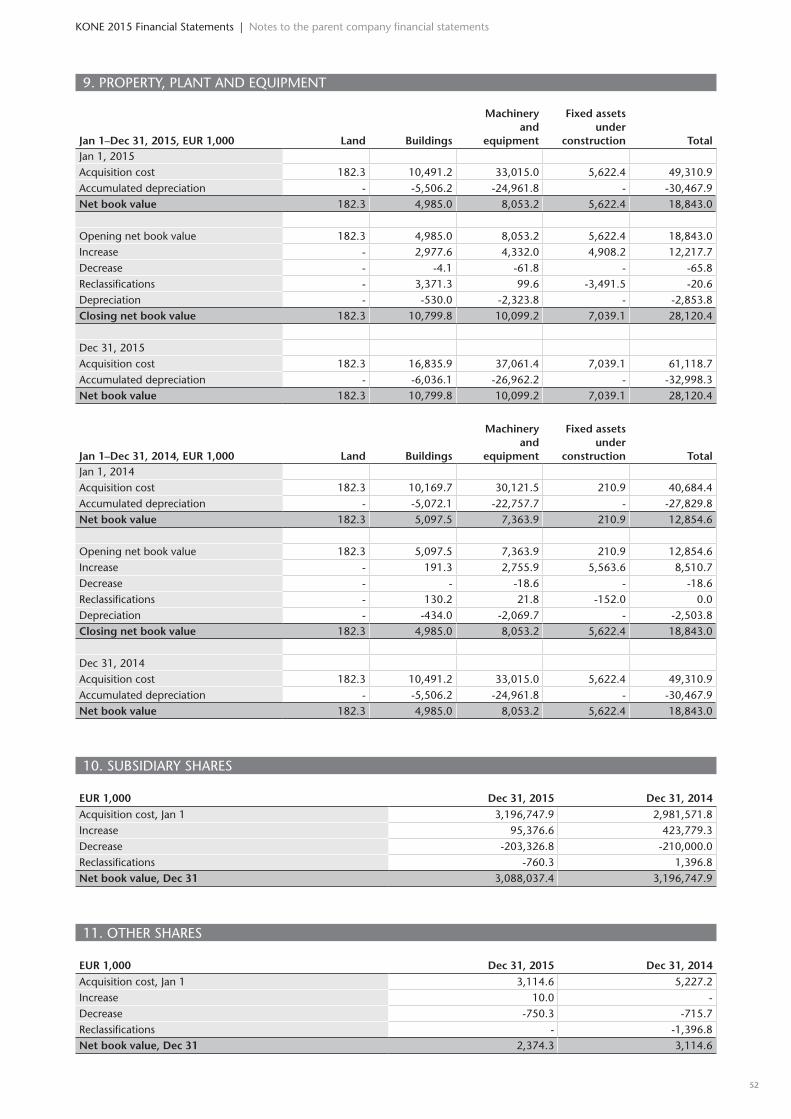
9. PROPERTY, PLANT AND EQUIPMENT
Jan 1–Dec 31, 2015, EUR 1,000 Land Buildings
Machinery and
equipment
Fixed assets under
construction TotalJan 1, 2015Acquisition cost 182.3 10,491.2 33,015.0 5,622.4 49,310.9Accumulated depreciation - -5,506.2 -24,961.8 - -30,467.9Net book value 182.3 4,985.0 8,053.2 5,622.4 18,843.0
Opening net book value 182.3 4,985.0 8,053.2 5,622.4 18,843.0Increase - 2,977.6 4,332.0 4,908.2 12,217.7Decrease - -4.1 -61.8 - -65.8Reclassifications - 3,371.3 99.6 -3,491.5 -20.6Depreciation - -530.0 -2,323.8 - -2,853.8Closing net book value 182.3 10,799.8 10,099.2 7,039.1 28,120.4
Dec 31, 2015Acquisition cost 182.3 16,835.9 37,061.4 7,039.1 61,118.7Accumulated depreciation - -6,036.1 -26,962.2 - -32,998.3Net book value 182.3 10,799.8 10,099.2 7,039.1 28,120.4
Jan 1–Dec 31, 2014, EUR 1,000 Land Buildings
Machinery and
equipment
Fixed assets under
construction TotalJan 1, 2014Acquisition cost 182.3 10,169.7 30,121.5 210.9 40,684.4Accumulated depreciation - -5,072.1 -22,757.7 - -27,829.8Net book value 182.3 5,097.5 7,363.9 210.9 12,854.6
Opening net book value 182.3 5,097.5 7,363.9 210.9 12,854.6Increase - 191.3 2,755.9 5,563.6 8,510.7Decrease - - -18.6 - -18.6Reclassifications - 130.2 21.8 -152.0 0.0Depreciation - -434.0 -2,069.7 - -2,503.8Closing net book value 182.3 4,985.0 8,053.2 5,622.4 18,843.0
Dec 31, 2014Acquisition cost 182.3 10,491.2 33,015.0 5,622.4 49,310.9Accumulated depreciation - -5,506.2 -24,961.8 - -30,467.9Net book value 182.3 4,985.0 8,053.2 5,622.4 18,843.0
10. SUBSIDIARY SHARES
EUR 1,000 Dec 31, 2015 Dec 31, 2014Acquisition cost, Jan 1 3,196,747.9 2,981,571.8Increase 95,376.6 423,779.3Decrease -203,326.8 -210,000.0Reclassifications -760.3 1,396.8Net book value, Dec 31 3,088,037.4 3,196,747.9
11. OTHER SHARES
EUR 1,000 Dec 31, 2015 Dec 31, 2014Acquisition cost, Jan 1 3,114.6 5,227.2Increase 10.0 -Decrease -750.3 -715.7Reclassifications - -1,396.8Net book value, Dec 31 2,374.3 3,114.6
KONE 2015 Financial Statements | Notes to the parent company financial statements
52 52

12. LONG-TERM RECEIVABLES
EUR 1,000 Dec 31, 2015 Dec 31, 2014Loans receivable from subsidiaries 28,017.3 25,898.8Long-term receivables 28,017.3 25,898.8
13. SHORT-TERM RECEIVABLES
Receivables from subsidiaries, EUR 1,000 Dec 31, 2015 Dec 31, 2014Accounts receivable 53,658.9 49,826.8Loans receivable 376,592.6 172,728.8Deferred assets 125,932.0 130,418.6Total 556,183.5 352,974.2
Receivables from externals, EUR 1,000 Dec 31, 2015 Dec 31, 2014Accounts receivable 308.9 558.5Others 4,595.6 4,461.4Deferred assets 56,970.4 86,159.1Total 61,874.9 91,179.1
Deferred tax assets 8,572.0 8,662.1
Total short-term receivables 626,630.4 452,815.4
Deferred assets, EUR 1,000 Dec 31, 2015 Dec 31, 2014Derivative assets 50,977.2 77,579.9Deferred income taxes 7,048.1 11,535.4Unbilled contract revenue 67,835.9 54,766.7Group contributions 44,000.0 30,600.0Others 13,041.1 42,095.8Total 182,902.4 216,577.7
14. EQUITY AND CHANGES IN EQUITY
EUR 1,000Share
capital
Sharepremium account
Paid-up unrestricted
equity reserveOwn
sharesRetainedearnings
Net income for the period Total
Book value Jan 1, 2015 65,551.2 100,328.1 127,026.8 -150,793.6 1,261,914.8 1,404,027.2
Profit distribution -616,281.3 -616,281.3
Purchase of own shares -71,156.5 -71,156.5Option and share-based compensation 124.5 13,676.0 11,396.7 -11,527.5 13,669.8
Net income for the period 1,200,968.2 1,200,968.2
Net book value Dec 31, 2015 65,675.8 100,328.1 140,702.7 -210,553.4 634,106.0 1,200,968.2 1,931,227.4
Non-restricted equity includes the paid-up unrestricted equity reserve, retained earnings deducted by own shares and the profit for the financial year. The non-restricted equity was EUR 1,765,223,548.43 (1,238,147,924.86) at the end of the period.
EUR 1,000Share
capital
Sharepremium account
Paid-up unrestricted
equity reserveOwn
sharesRetainedearnings
Net income for the period Total
Book value Jan 1, 2014 65,342.7 100,328.1 105,415.8 -128,814.0 1,381,033.8 1,523,306.4
Profit distribution -512,492.2 -512,492.2
Purchase of own shares -32,802.3 -32,802.3Option and share-based compensation 208.5 21,611.0 10,822.7 -10,691.9 21,950.3
Net income for the period 404,065.0 404,065.0
Net book value Dec 31, 2014 65,551.2 100,328.1 127,026.8 -150,793.6 857,849.7 404,065.0 1,404,027.2
5352
KONE 2015 Financial Statements | Notes to the parent company financial statements
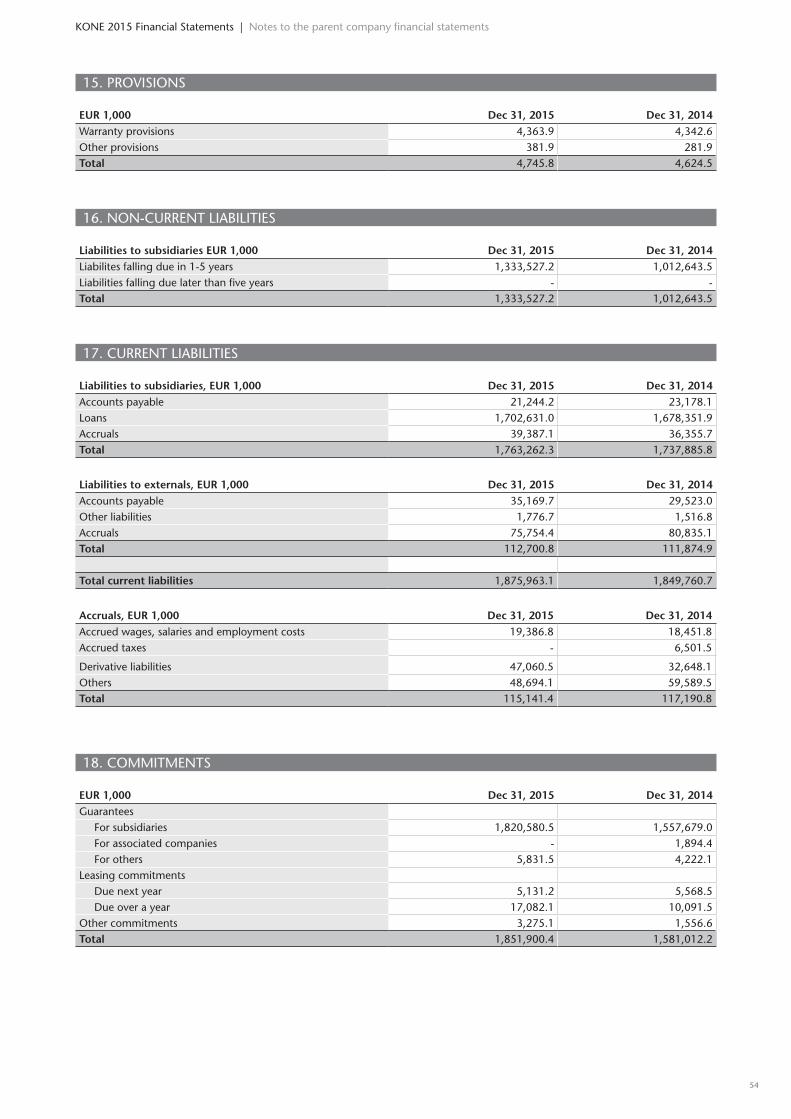
15. PROVISIONS
EUR 1,000 Dec 31, 2015 Dec 31, 2014Warranty provisions 4,363.9 4,342.6Other provisions 381.9 281.9Total 4,745.8 4,624.5
16. NON-CURRENT LIABILITIES
Liabilities to subsidiaries EUR 1,000 Dec 31, 2015 Dec 31, 2014Liabilites falling due in 1-5 years 1,333,527.2 1,012,643.5Liabilities falling due later than five years - -Total 1,333,527.2 1,012,643.5
17. CURRENT LIABILITIES
Liabilities to subsidiaries, EUR 1,000 Dec 31, 2015 Dec 31, 2014Accounts payable 21,244.2 23,178.1Loans 1,702,631.0 1,678,351.9Accruals 39,387.1 36,355.7Total 1,763,262.3 1,737,885.8
Liabilities to externals, EUR 1,000 Dec 31, 2015 Dec 31, 2014Accounts payable 35,169.7 29,523.0Other liabilities 1,776.7 1,516.8Accruals 75,754.4 80,835.1Total 112,700.8 111,874.9
Total current liabilities 1,875,963.1 1,849,760.7
Accruals, EUR 1,000 Dec 31, 2015 Dec 31, 2014Accrued wages, salaries and employment costs 19,386.8 18,451.8Accrued taxes - 6,501.5
Derivative liabilities 47,060.5 32,648.1Others 48,694.1 59,589.5Total 115,141.4 117,190.8
18. COMMITMENTS
EUR 1,000 Dec 31, 2015 Dec 31, 2014Guarantees
For subsidiaries 1,820,580.5 1,557,679.0For associated companies - 1,894.4For others 5,831.5 4,222.1
Leasing commitmentsDue next year 5,131.2 5,568.5Due over a year 17,082.1 10,091.5
Other commitments 3,275.1 1,556.6Total 1,851,900.4 1,581,012.2
KONE 2015 Financial Statements | Notes to the parent company financial statements
54 54

19. DERIVATIVES
Fair values of derivative instruments, EUR 1,000 Dec 31, 2015 Dec 31, 2014
FX forward contract with external parties 800.5 23,507.5FX forward contract with subsidiaries -2,209.9 2,811.1Cross currency and interest rate swaps, due under one year 6,490.5 -Cross currency and interest rate swaps, due in 1–3 years - 19,723.0Electricity derivatives -1,164.3 -1,109.7Total 3,916.7 44,931.8
Nominal values of derivative instruments, EUR 1,000 Dec 31, 2015 Dec 31, 2014FX forward contract with external parties 2,256,016.6 1,543,139.5FX forward contract with subsidiaries 737,929.3 556,514.9Cross currency and interest rate swaps, due under one year 138,894.5 -Cross currency and interest rate swaps, due in 1–3 years - 138,894.5Electricity derivatives 2,595.2 5,453.0Total 3,135,435.5 2,244,001.8
Derivatives are hedging transactions in line with KONE hedging policy. More information about financial risks management is descri-bed in the notes to the consolidated statements (note 2).
List of the Parent company accounting journals, common document types and means of storaging
Balance sheet book In paper
Journal and general ledger In electrical format
Accounts payable and accounts receivable In electrical format and in paper
Loan and deposit register In electrical format and in paper
Sales invoices document type RV In electrical format
Purchase invoices document type RE In electrical format
Memo vouchers document type Y3 In electrical format and in paper
Fixed asset register document type AA In electrical format and in paper
Periodisation entries document type SA In electrical format and in paper
Bank entries document type SB In electrical format and in paper
Travel expense entries document type ZH In electrical format and in paper
Salary entries document type Z9 In electrical format
Financing entries document type TI In electrical format and in paper
Adjustments and cancellations document type AB In electrical format
A complete list of the document types is included in the balance sheet binder.
5554
KONE 2015 Financial Statements | Notes to the parent company financial statements
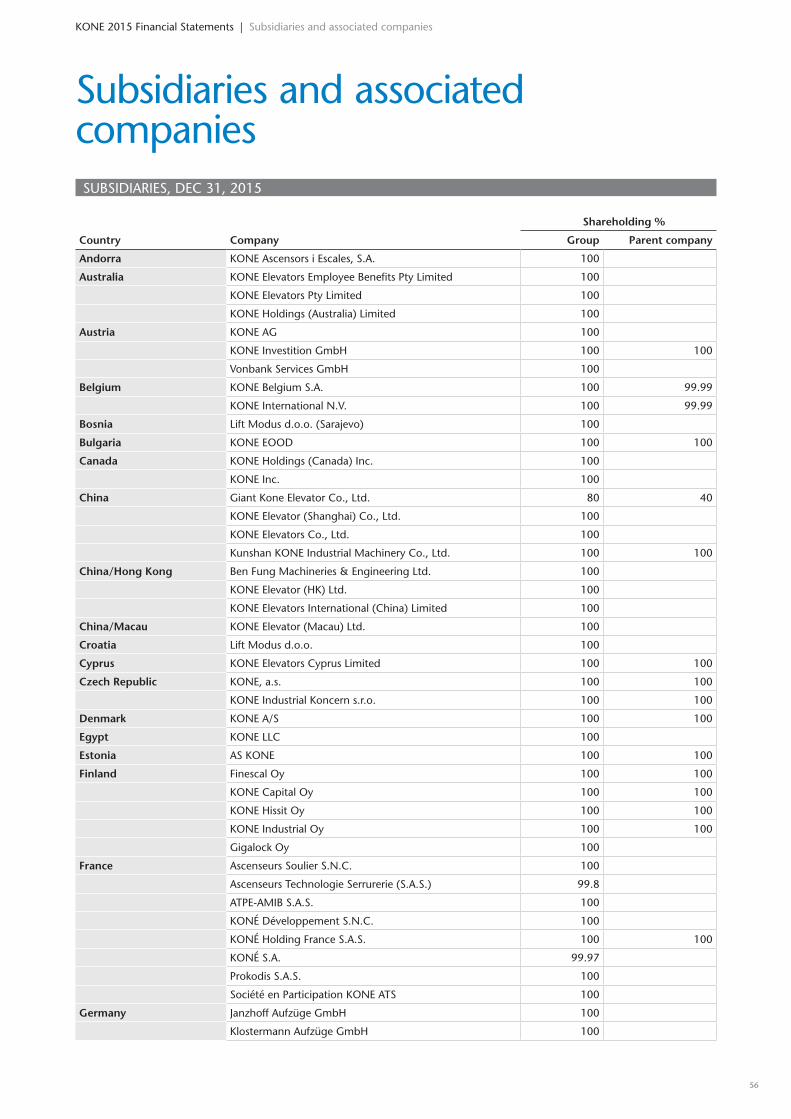
Subsidiaries and associated companies
KONE 2015 Financial Statements | Subsidiaries and associated companies
SUBSIDIARIES, DEC 31, 2015
Share holding %
Country Company Group Parent company
Andorra KONE Ascensors i Escales, S.A. 100
Australia KONE Elevators Employee Benefits Pty Limited 100
KONE Elevators Pty Limited 100
KONE Holdings (Australia) Limited 100
Austria KONE AG 100
KONE Investition GmbH 100 100
Vonbank Services GmbH 100
Belgium KONE Belgium S.A. 100 99.99
KONE International N.V. 100 99.99
Bosnia Lift Modus d.o.o. (Sarajevo) 100
Bulgaria KONE EOOD 100 100
Canada KONE Holdings (Canada) Inc. 100
KONE Inc. 100
China Giant Kone Elevator Co., Ltd. 80 40
KONE Elevator (Shanghai) Co., Ltd. 100
KONE Elevators Co., Ltd. 100
Kunshan KONE Industrial Machinery Co., Ltd. 100 100
China/Hong Kong Ben Fung Machineries & Engineering Ltd. 100
KONE Elevator (HK) Ltd. 100
KONE Elevators International (China) Limited 100
China/Macau KONE Elevator (Macau) Ltd. 100
Croatia Lift Modus d.o.o. 100
Cyprus KONE Elevators Cyprus Limited 100 100
Czech Republic KONE, a.s. 100 100
KONE Industrial Koncern s.r.o. 100 100
Denmark KONE A/S 100 100
Egypt KONE LLC 100
Estonia AS KONE 100 100
Finland Finescal Oy 100 100
KONE Capital Oy 100 100
KONE Hissit Oy 100 100
KONE Industrial Oy 100 100
Gigalock Oy 100
France Ascenseurs Soulier S.N.C. 100
Ascenseurs Technologie Serrurerie (S.A.S.) 99.8
ATPE-AMIB S.A.S. 100
KONÉ Développement S.N.C. 100
KONÉ Holding France S.A.S. 100 100
KONÉ S.A. 99.97
Prokodis S.A.S. 100
Société en Participation KONE ATS 100
Germany Janzhoff Aufzüge GmbH 100
Klostermann Aufzüge GmbH 100
56 56
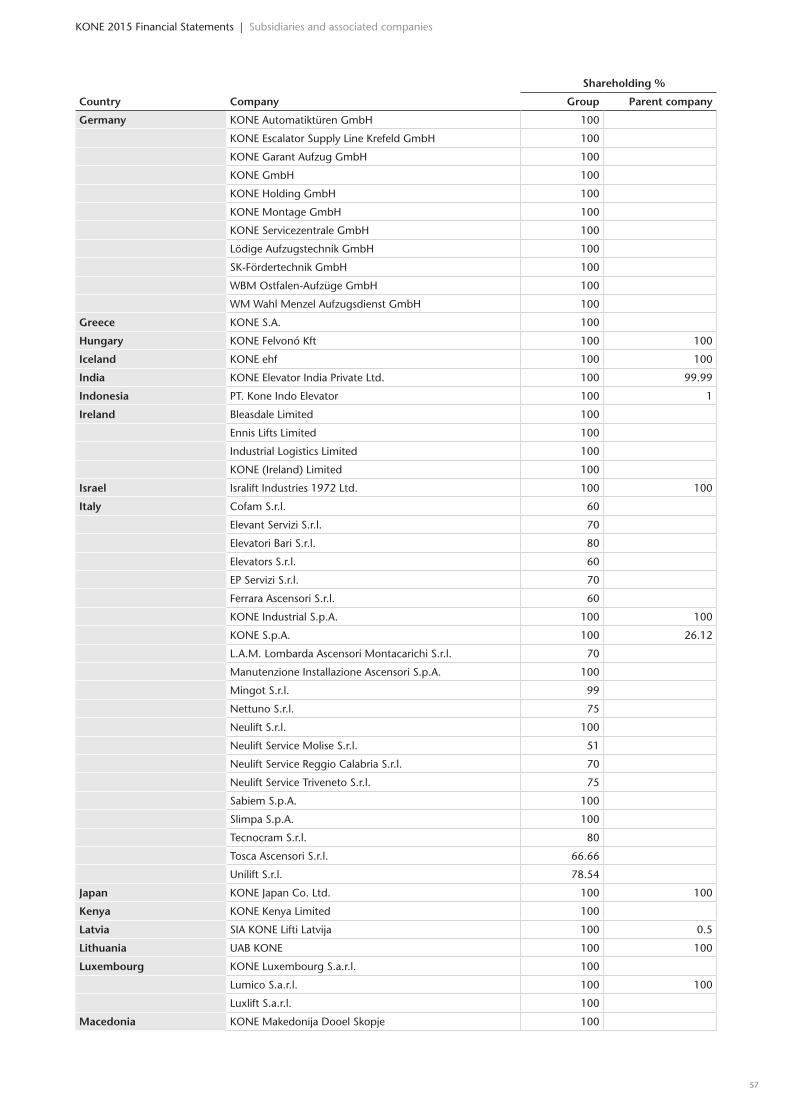
Share holding %
Country Company Group Parent company
Germany KONE Automatiktüren GmbH 100
KONE Escalator Supply Line Krefeld GmbH 100
KONE Garant Aufzug GmbH 100
KONE GmbH 100
KONE Holding GmbH 100
KONE Montage GmbH 100
KONE Servicezentrale GmbH 100
Lödige Aufzugstechnik GmbH 100
SK-Fördertechnik GmbH 100
WBM Ostfalen-Aufzüge GmbH 100
WM Wahl Menzel Aufzugsdienst GmbH 100
Greece KONE S.A. 100
Hungary KONE Felvonó Kft 100 100
Iceland KONE ehf 100 100
India KONE Elevator India Private Ltd. 100 99.99
Indonesia PT. Kone Indo Elevator 100 1
Ireland Bleasdale Limited 100
Ennis Lifts Limited 100
Industrial Logistics Limited 100
KONE (Ireland) Limited 100
Israel Isralift Industries 1972 Ltd. 100 100
Italy Cofam S.r.l. 60
Elevant Servizi S.r.l. 70
Elevatori Bari S.r.l. 80
Elevators S.r.l. 60
EP Servizi S.r.l. 70
Ferrara Ascensori S.r.l. 60
KONE Industrial S.p.A. 100 100
KONE S.p.A. 100 26.12
L.A.M. Lombarda Ascensori Montacarichi S.r.l. 70
Manutenzione Installazione Ascensori S.p.A. 100
Mingot S.r.l. 99
Nettuno S.r.l. 75
Neulift S.r.l. 100
Neulift Service Molise S.r.l. 51
Neulift Service Reggio Calabria S.r.l. 70
Neulift Service Triveneto S.r.l. 75
Sabiem S.p.A. 100
Slimpa S.p.A. 100
Tecnocram S.r.l. 80
Tosca Ascensori S.r.l. 66.66
Unilift S.r.l. 78.54
Japan KONE Japan Co. Ltd. 100 100
Kenya KONE Kenya Limited 100
Latvia SIA KONE Lifti Latvija 100 0.5
Lithuania UAB KONE 100 100
Luxembourg KONE Luxembourg S.a.r.l. 100
Lumico S.a.r.l. 100 100
Luxlift S.a.r.l. 100
Macedonia KONE Makedonija Dooel Skopje 100
5756
KONE 2015 Financial Statements | Subsidiaries and associated companies

KONE 2015 Financial Statements | Subsidiaries and associated companies
Share holding %
Country Company Group Parent company
Malaysia Fuji Lift & Escalator Manufacturing Sdn. Bhd. 100
KONE Elevator (M) Sdn. Bhd. 49 49
Premier Elevators Sdn. Bhd. 100 100
Mexico KONE Industrial S.A. de C.V. 100
KONE Industrial Servicios S.A. de C.V. 100
KONE Mexico S.A. de C.V. 100 0.1
Monaco S.A.M. KONÉ 100
Montenegro KONE d.o.o. Podgorica 100
Netherlands Hissi B.V. 100
Hopmann Liftservice B.V. 100
KONE B.V. 100
KONE Deursystemen B.V. 100
Kone Finance Holding B.V. 100
Kone Holland B.V. 100 53.2
KONE Markus B.V. 100
KONE Nederland Holding B.V. 100
Waldoor B.V. 100
Norway KONE Aksjeselskap 100 100
KONE Rulletrapper AS 100 100
Oman KONE Assarain LLC 70
Philippines Elevators Philippines Construction, Inc. 49
KPI Elevators Inc. 100
Poland KONE Sp.z o.o. 100 100
Portugal KONE Portugal-Elevadores Lda. 100 1
VTP-Tractores S.A. 99.28 0.71
Qatar KONE Elevators LLC 49 49
Romania KONE Ascensorul S.A. 100 99.99
Russia CJSC KONE Lifts 100 100
Saudi-Arabia KONE Areeco Limited 50 10
Serbia KONE d.o.o. Beograd-Voždovac 100
Singapore KONE Pte Ltd. 100
Slovak Republic KONE s.r.o. 100 99.91
KONE SSC s.r.o. 100 100
Slovenia KONE d.o.o. 100 100
South Africa KONE Elevators South Africa (Pty) Ltd. 100
Spain KONE Elevadores, S.A. 100 99.99
MARVI Ascensores S.L. 100
Sweden KONE AB 100
KONE Door AB 100
KONE Metro AB 100
Motala Hissar AB 100
Uppsala Hiss Montage och El AB 100
Switzerland KONE (Schweiz) AG 100
Recolift SA 100 100
Taiwan Ben Fung Elevators Taiwan Ltd. 100
KONE Elevators Taiwan Co. Ltd. 100
Thailand KONE Public Company Limited 83.9
Thai Elevators & Escalators Ltd. 73.99
Thai Elevators Holding Ltd. 49
Turkey KONE Asansör Sanayi ve Ticaret A.S. 100
58 58
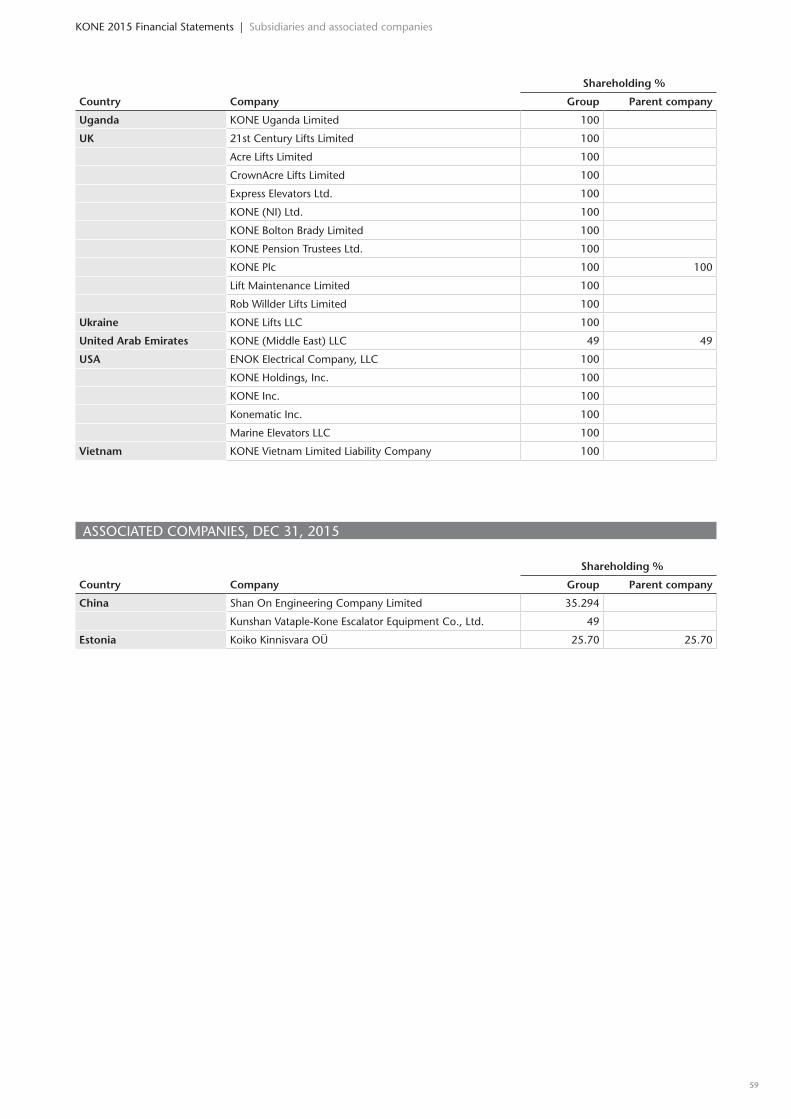
Share holding %
Country Company Group Parent company
Uganda KONE Uganda Limited 100
UK 21st Century Lifts Limited 100
Acre Lifts Limited 100
CrownAcre Lifts Limited 100
Express Elevators Ltd. 100
KONE (NI) Ltd. 100
KONE Bolton Brady Limited 100
KONE Pension Trustees Ltd. 100
KONE Plc 100 100
Lift Maintenance Limited 100
Rob Willder Lifts Limited 100
Ukraine KONE Lifts LLC 100
United Arab Emirates KONE (Middle East) LLC 49 49
USA ENOK Electrical Company, LLC 100
KONE Holdings, Inc. 100
KONE Inc. 100
Konematic Inc. 100
Marine Elevators LLC 100
Vietnam KONE Vietnam Limited Liability Company 100
ASSOCIATED COMPANIES, DEC 31, 2015
Share holding %
Country Company Group Parent company
China Shan On Engineering Company Limited 35.294
Kunshan Vataple-Kone Escalator Equipment Co., Ltd. 49
Estonia Koiko Kinnisvara OÜ 25.70 25.70
5958
KONE 2015 Financial Statements | Subsidiaries and associated companies

Corporate governance statement
KONE’s general governance principles The duties and responsibilities of KONE Corporation’s various governing bod-ies are determined by Finnish law and KONE’s corporate governance principles. KONE complies with the Finnish Corpo-rate Governance Code 2010 published by the Securities Market Association, with the exception of recommendations 26 (Independence of the members of the audit committee), 29 (Members of the nomination committee) and 32 (Members of the remuneration committee). The entire Code is available on the Internet at www.cgfinland.fi. These exceptions are due to the company’s ownership structure. The company’s largest shareholder, Antti Herlin, controls 62 percent of the com-pany’s voting rights and 22 percent of its shares. The significant entrepreneurial risk associated with ownership justifies the main shareholder serving as Chairman or Member of the Board of Directors and of its Committees and, in this capacity, over-seeing the shareholders’ interests.
KONE’s administrative bodies and officers with the greatest decision-making power are the General Meeting of Share-holders, the Board of Directors of KONE Corporation, the Chairman of the Board and the President and CEO. At the Annual General Meeting of Shareholders, the shareholders approve the consolidated financial statements, decide on the distri-bution of profits, select the members of the Board of Directors and the auditors and determine their compensation.
KONE Corporation’s Annual General Meeting is convened by the Board of Directors. According to the Articles of Association, the Annual General Meeting of Shareholders shall be held within three months of the closing of the financial year on a date decided by the Board of Direc-tors.
Board of Directors
Duties and responsibilitiesThe Board of Directors’ duties and respon-sibilities are defined primarily by the Articles of Association and the Finnish Lim-ited Liability Companies’ Act. The Board’s duties include:• compiling of the Board of Directors’
report, interim reports and financial statements
• ensuring the proper organization and surveillance of the accounting and asset management
• the preparation of proposals for the General Meeting and the convocation of the General Meetings
• the approval and confirmation of strate-gic guidelines and the principles of risk management
• the ratification of annual budgets and plans
• the appointment of a full-time Chair-man of the Board and a President and CEO, and decisions on the terms and conditions of their employment
• decisions on the company’s corporate structure
• decisions on major acquisitions and investments
• decisions on other matters falling under the Board’s responsibility by law
The Board has created rules of procedure stipulating the duties of the Board, its Chairman and its Committees. The Board of Directors holds six regular meetings a year and additional meetings as required. The Board of Directors reviews its own performance and procedures once a year.
Members of the BoardThe Annual General Meeting elects five to ten members and no more than three deputy members to the Board of Directors for one year at a time in accordance with KONE Corporation’s Articles of Association. The Board of Directors elects a Chairman and Vice Chairman among its members. In electing the members of the Board, attention is paid to the candidates’ broad and mutually complementary experience, expertise and views of both KONE’s busi-ness and other businesses.
CommitteesThe Board of Directors has appointed two committees consisting of its members: the Audit Committee and the Nomination and Compensation Committee. The Board has confirmed rules of procedure for both Committees. The Secretary to the Board acts as the Secretary of both Committees.
The Audit Committee monitors the Group’s financial situation and supervises reporting related to the financial state-ments and interim reports. The Audit Com-mittee monitors and assesses the adequacy and appropriateness of KONE’s internal control and risk management, as well as the adherence to rules and regulations. It also monitors and oversees the financial statement and financial reporting process, and processes the description of the main features of the internal control and risk management systems pertaining to the
financial reporting process included in the company’s corporate governance state-ment. In addition, it deals with the Cor-poration’s internal audit plans and reports. The Director of Internal Audit reports the internal audit results to the Committee. The Audit Committee evaluates the audit-ing of the Group’s companies and the appropriateness of the related arrange-ments and auditing services, and considers the auditors’ reports. Furthermore, the Committee formulates a proposal to the Annual General Meeting regarding the auditors to be selected for the Corporation.
The Nomination and Compensation Committee prepares proposals to be made to the Annual General Meeting regarding the nomination of Board members and their compensation and makes decisions regarding senior management appoint-ments and compensation. The Committee also decides on the compensation systems to be used.
Operational management
Full-time Chairman of the Board and the President and CEOKONE Corporation’s Board of Directors appoints the full-time Chairman of the Board and the President and CEO. The Board determines the terms and conditions of employment of the full-time Chairman of the Board and the President and CEO, and these are defined in their respective written contracts. The Chairman of the Board prepares matters to be considered by the Board together with the President and CEO and the corporate staff. The Chairman of the Board and the President and CEO are responsible for the execution of the targets, plans, strategies and goals set by the Board of Directors within the KONE Group. The President and CEO is also responsible for operational leadership within the scope of the strategic plans, budgets, operational plans, guidelines and orders approved by KONE Corporation’s Board of Directors. The President and CEO presents operational issues to the Board, and is responsible for implementing the decisions of the Board.
Executive BoardThe Executive Board supports the President and CEO in executing the corporate strat-egy. The Executive Board follows business developments, initiates actions and defines operating principles and methods in accor-dance with guidelines handed down by the Board of Directors and the President and CEO. The Executive Board holds
(p. 60–65 are not a part of the official financial statements)
KONE 2015 Financial Statements | Corporate governance statement | Corporate governance principles
60 60
regular monthly meetings and additional meetings as required.
Control systemsKONE Corporation’s Board of Directors has ratified the principles of internal control, risk management and internal auditing to be followed within the Group.
Internal controlThe goal of KONE’s internal control system is to ensure that the Group’s operations are efficient and profitable, that its business risk management is adequate and appro-priate, and that the information created is reliable. The control system also makes it possible to oversee that the determined operating principles and given instructions are followed.
The Board’s Audit Committee moni-tors the functioning of the internal control process. The Corporation has an Internal Audit Department, which is separate from the operational management. The Head of Internal Audit reports to the Chairman of the Board. The Internal Audit Department is responsible for auditing both the internal control system and the management of business risks. It reports its findings to the Audit Committee.
Risk managementKONE’s Risk Management and Strategy Development functions jointly coordinate and develop a systematic assessment of risks and opportunities within core business planning and decision-making processes.
KONE continuously assesses the risks and opportunities related to its business environment, operations and financial performance in order to limit unnecessary or excessive risks. In addition, KONE’s units and functions systematically identify and assess, as part of the strategic planning and budgeting processes, the risks that can threaten the achievement of their business objectives. Key risks are reported to the Risk Management function, which facilitates the risk management process and consolidates the risk information to the Executive Board. The Executive Board assigns the ownership of identified signifi-cant risk exposures to specific functions or units. The Board of Directors reviews the
KONE risk portfolio regularly on the basis of the Executive Board’s assessment.
The Risk Management function is also responsible for administering the com-pany’s global insurance programs. The Treasury function manages financial risks centrally according to the KONE Treasury Policy.
Main features of internal control and risk management related to financial reportingCorrect financial reporting in KONE’s internal control framework means that its financial statements give a true and fair view of the operations and the finan-cial position of the group and that such statements do not include intentional or unintentional misstatements or omissions either in respect of the figures or level of disclosure. The internal control framework is built and based on reporting processes and frameworks as described below, as well as on the company values, a company culture with emphasis on honesty and high standards for ethical behavior. The frame-work is promoted by adequate training, by fostering a positive and a disciplined work attitude and by hiring and promoting suit-able employees.
The financial management and control of KONE’s operations is coordinated by the Global Finance and Control function and implemented by a network of subsidiary and business entity Controllers within KONE. Internal control processes and pro-cedures are regularly evaluated and steered by the Board of Directors, the Audit Com-mittee, Business and Finance management and internal and external auditors.
KONE’s monthly management plan-ning and financial reporting process repre-sents a key control procedure within KONE in ensuring the effectiveness and efficiency of operations. KONE’s financial statements are based on the monthly management reporting process. This process includes in-depth analyses of deviations between actual performance, budgets, prior year performance and latest forecasts for the business. The process covers financial information as well as key performance indicators that measure the operational performance on a business unit and corporate level. The process is designed to ensure that any deviations from plans, in terms of financial or operating perfor-mance and financial management policies are identified, communicated and reacted upon efficiently, in a harmonized and timely manner.
Financial control tasks are built into the business processes of KONE as well as into the ongoing business supervision and monitoring by management. KONE has established Financial Control Models for order-based activities, service activities as well as for treasury and tax matters.
The models have been defined in order to ensure that the financial control cov-ers the relevant tasks in an efficient and timely manner. Financial Control Models are designed to support the efficiency and effectiveness of operations through well-defined and productive monitoring process. The correctness of the financial reporting is supported and monitored through the Financial Control Models. The models include Key Control Tasks for Finance Directors and controllers of KONE’s subsidiaries and entities. Key Con-trol Indicators are defined and linked to the tasks in the Financial Control Models. The aim of these indicators is to measure and support the effectiveness and harmoniza-tion of operations. The effectiveness of the Financial Control Models and indicators is assessed in all units regularly and audited by the Global Finance and Control Func-tion.
The internal control procedures applied to KONE’s financial reporting process are laid down in carefully defined principles and instructions. A unified and globally harmonized framework provides processes, tools and instructions to cover manage-rial and external financial reporting. The interpretation and application of account-ing standards is centralized in the Global Finance and Control function, which main-tains, under supervision of the Audit Com-mittee, the KONE Accounting Standards. The Global Finance and Control function monitors the compliance of the KONE Accounting Standards in the various enti-ties of the group. Budgeting and reporting processes and contents are defined in the KONE Accounting and Reporting Instruc-tions. These standards and instructions are maintained and updated centrally by the Global Finance and Control function and applied uniformly throughout KONE.
KONE has a global enterprise resource planning (ERP) system which is built to reflect the KONE Accounting Standards and KONE Accounting and Reporting Instructions. KONE applies a controlled change management process ensuring that no changes to the financial post-ing logic of the ERP system can be made without approval from the Global Finance and Control function. Automatic interfaces between different systems are princi-pally applied in the period-end financial reporting process of KONE. Transactional processing is increasingly centralized in dedicated internal shared service centers.
Effective internal control over record to report processes, from business processes and systems to the financial statements, is important in ensuring the correctness of financial reporting. This is driven by the identification of key data elements of the business and the quality of the data to ensure correct financial reporting and forecasting ability.
More information
Most significant risks and uncer-tainties related to KONE’s business are described in the Board of Directors’ Report. Financial risk management is described in note 2, page 20.
6160
KONE 2015 Financial Statements | Corporate governance statement | Corporate governance principles
AuditingThe task of statutory auditing is to verify that the financial statements and Board of Directors’ report provide accurate and adequate information on KONE’s result and financial position. In addition, audit-ing includes an audit of the Corporation’s accounting and administration.
According to the Articles of Associa-tion, the company must have a minimum of one and a maximum of three Auditors. The Auditors must be public accountants or public accounting firms authorized by Finland’s Central Chamber of Commerce. The Auditor is elected at the Annual Gen-eral Meeting for a term which expires at the end of the following Annual General Meeting.
InsidersKONE Corporation adheres to the insider guidelines of the Nasdaq Helsinki Ltd, which have been supplemented with internal insider guidelines approved by the Board of Directors. The company maintains its public and company-specific insider registers in the Euroclear Finland Ltd’s SIRE system. In compliance with the Finnish Securities Markets Act, KONE’s public insiders include the members and deputy members of the Board of Directors, the President and CEO and the Auditors. In addition to these individuals, KONE’s public insiders include the members of the Executive Board of the company. In addition to the public insiders, KONE’s per-manent insiders include company-specific insiders defined by the company who regularly receive or have access to inside information due to their position or tasks. Permanent insiders are permitted to trade in KONE shares and securities entitling to KONE shares during a six-week period after the release of interim reports and financial statements releases. The company also maintains a project-specific insider register when necessary. Project-specific insiders are prohibited from trading KONE securi-ties until the termination of the project.
The person in charge of KONE’s insider issues is the Secretary to the Board of Directors.
Corporate governance in 2015The Annual General Meeting was held in Helsinki, Finland on February 23, 2015.
Board of Directors and committeesThe Annual General Meeting elected nine members to KONE’s Board of Directors. The full-time Chairman of the Board of Directors of KONE Corporation is Antti Herlin. Jussi Herlin is the Vice Chairman of the Board. The other members of the Board are Matti Alahuhta, Anne Brunila, Iiris Herlin, Ravi Kant, Juhani Kaskeala and Sirpa Pietikäinen. Kazunori Matsubara stepped down from KONE’s Board of Directors on July 22, 2015.
Of the Board members, Anne Brunila, Iiris Herlin, Ravi Kant, Juhani Kaskeala and Sirpa Pietikäinen are independent of the Corporation. Jussi Herlin was independent of the Corporation until January 10, 2016, after which he became employed by the Corporation. With the exception of Antti Herlin, Jussi Herlin and Iiris Herlin, the other Board members are independent of the Corporation’s significant shareholders.
In 2015, the Board of Directors con-vened 7 times, with an average attendance rate of 93%. Jukka Ala-Mello serves as Sec-retary to the Board and to its Committees.
Audit committeeThe Board of Directors’ Audit Committee comprises Jussi Herlin (Chairman of the Corporation, independent of KONE Corpo-ration in 2015), Anne Brunila (independent member), Antti Herlin and Ravi Kant (inde-pendent member). The Audit Committee held 3 meetings in 2015, with an average attendance rate of 92%.
Caj Lövegren serves as the Head of Internal Audit.
Nomination and compensation committeeThe Nomination and Compensation Com-mittee comprises Antti Herlin (Chairman), Matti Alahuhta (independent of significant shareholders), Jussi Herlin (independent of KONE Corporation in 2015) and Juhani Kaskeala (independent member).
The Nomination and Compensation Committee held 5 meetings in 2015, with an average attendance rate of 100%.
Compensation and other benefits of the Board of DirectorsThe Annual General Meeting of KONE Corporation in February 2015 confirmed the fees of the members of the Board as follows (annual fees in EUR):
Chairman of the Board 54,000Vice chairman 44,000Member 33,000
Of the annual remuneration, 40 percent was paid in class B shares of KONE Cor-poration and the rest in cash. It was also confirmed that a meeting fee of EUR 500 is paid for each meeting of the Board and its committees, however such that for
committee members residing outside of Finland a fee of EUR 2,000 is paid. Board members’ travel expenses and daily allow-ances are compensated in accordance with the company’s travel expense policy.
Compensation and other benefits of the ChairmanThe compensation for Antti Herlin, full-time Chairman of the Board, consists of a basic salary and a yearly bonus decided by the Board on the basis of the Group’s financial result. The yearly bonus may not exceed 100 percent of the recipient’s annual salary. In 2015, Antti Herlin’s basic salary was EUR 468,488. In addition, his accrued bonus for 2015 totaled EUR 452,090 He was also paid EUR 60,500 as compensation for serving as Chairman of the Board. Antti Herlin’s holdings of shares are presented in the table on page 63.
The full-time Chairman’s retirement age and pension are determined in accordance with Finland’s Pensions Act. No separate agreement regarding early retirement has been made.
President and CEOHenrik Ehrnrooth serves as KONE Corpora-tion’s President and CEO.
Compensation and other benefits of the President and CEOThe President and CEO’s compensation consists of a basic salary and a yearly bonus determined annually by the Board on the basis of the Corporation’s key targets. The yearly bonus may not exceed 100 percent of the recipient’s annual salary.
Henrik Ehrnrooth’s annual base salary is EUR 750,000. In addition, his accrued bonus for 2015 totaled EUR 675,000. Henrik Ehrnrooth’s holdings of shares are presented in the table on page 63.
Henrik Ehrnrooth is included in the share-based incentive plan for the Group’s senior management. The potential bonus is based on the growth in KONE’s net sales and operating profit. In April 2015, on the basis of the incentive plan for the year 2014, Henrik Ehrnrooth received a bonus of EUR 3,213,501 which consisted of 37,870 KONE class B shares together with a cash bonus to cover taxes and similar charges arising from the receipt of shares. The corresponding bonus accrued from 2015 and due for payment in April 2016 is 40,495 KONE class B shares together with a cash bonus to cover taxes and similar charges arising from the receipt of shares.
Henrik Ehrnrooth’s retirement age and pension are determined in accordance with Finland’s Pensions Act. No separate agreement regarding early retirement has been made. Should his employment contract be terminated before retirement, he has the right to the equivalent of 18 months’ salary, which includes the salary for a six-month term of notice.
KONE 2015 Financial Statements | Corporate governance statement | Corporate governance principles
More information
This statement is available on the company’s web pages at www.kone.com and it has been given separately of the Board of Directors’ report
62 62
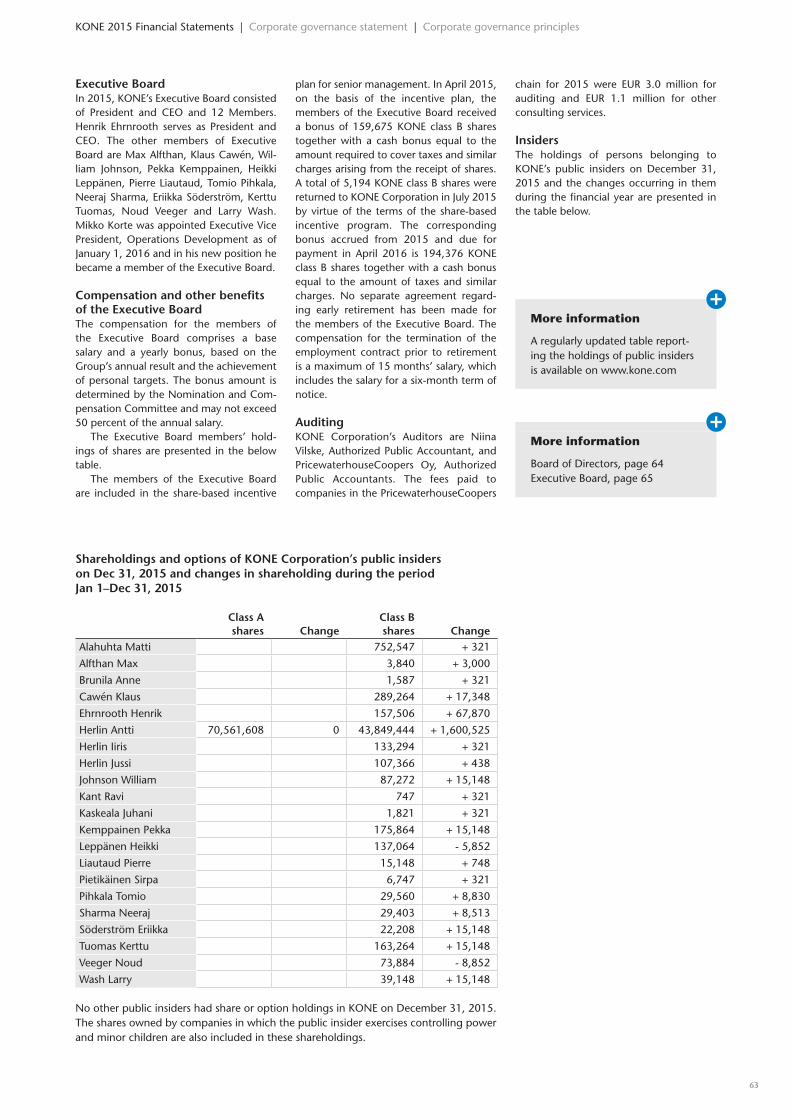
Executive BoardIn 2015, KONE’s Executive Board consisted of President and CEO and 12 Members. Henrik Ehrnrooth serves as President and CEO. The other members of Executive Board are Max Alfthan, Klaus Cawén, Wil-liam Johnson, Pekka Kemppainen, Heikki Leppänen, Pierre Liautaud, Tomio Pihkala, Neeraj Sharma, Eriikka Söderström, Kerttu Tuomas, Noud Veeger and Larry Wash. Mikko Korte was appointed Executive Vice President, Operations Development as of January 1, 2016 and in his new position he became a member of the Executive Board.
Compensation and other benefits of the Executive BoardThe compensation for the members of the Executive Board comprises a base salary and a yearly bonus, based on the Group’s annual result and the achievement of personal targets. The bonus amount is determined by the Nomination and Com-pensation Committee and may not exceed 50 percent of the annual salary.
The Executive Board members’ hold-ings of shares are presented in the below table.
The members of the Executive Board are included in the share-based incentive
plan for senior management. In April 2015, on the basis of the incentive plan, the members of the Executive Board received a bonus of 159,675 KONE class B shares together with a cash bonus equal to the amount required to cover taxes and similar charges arising from the receipt of shares. A total of 5,194 KONE class B shares were returned to KONE Corporation in July 2015 by virtue of the terms of the share-based incentive program. The corresponding bonus accrued from 2015 and due for payment in April 2016 is 194,376 KONE class B shares together with a cash bonus equal to the amount of taxes and similar charges. No separate agreement regard-ing early retirement has been made for the members of the Executive Board. The compensation for the termination of the employment contract prior to retirement is a maximum of 15 months’ salary, which includes the salary for a six-month term of notice.
AuditingKONE Corporation’s Auditors are Niina Vilske, Authorized Public Accountant, and PricewaterhouseCoopers Oy, Authorized Public Accountants. The fees paid to companies in the PricewaterhouseCoopers
chain for 2015 were EUR 3.0 million for auditing and EUR 1.1 million for other consulting services.
InsidersThe holdings of persons belonging to KONE’s public insiders on December 31, 2015 and the changes occurring in them during the financial year are presented in the table below.
More information
A regularly updated table report-ing the holdings of public insiders is available on www.kone.com
More information
Board of Directors, page 64Executive Board, page 65
Shareholdings and options of KONE Corporation’s public insiders on Dec 31, 2015 and changes in shareholding during the period Jan 1–Dec 31, 2015
Class A shares Change
Class B shares Change
Alahuhta Matti 752,547 + 321
Alfthan Max 3,840 + 3,000
Brunila Anne 1,587 + 321
Cawén Klaus 289,264 + 17,348
Ehrnrooth Henrik 157,506 + 67,870
Herlin Antti 70,561,608 0 43,849,444 + 1,600,525
Herlin Iiris 133,294 + 321
Herlin Jussi 107,366 + 438
Johnson William 87,272 + 15,148
Kant Ravi 747 + 321
Kaskeala Juhani 1,821 + 321
Kemppainen Pekka 175,864 + 15,148
Leppänen Heikki 137,064 - 5,852
Liautaud Pierre 15,148 + 748
Pietikäinen Sirpa 6,747 + 321
Pihkala Tomio 29,560 + 8,830
Sharma Neeraj 29,403 + 8,513
Söderström Eriikka 22,208 + 15,148
Tuomas Kerttu 163,264 + 15,148
Veeger Noud 73,884 - 8,852
Wash Larry 39,148 + 15,148
No other public insiders had share or option holdings in KONE on December 31, 2015. The shares owned by companies in which the public insider exercises controlling power and minor children are also included in these shareholdings.
6362
KONE 2015 Financial Statements | Corporate governance statement | Corporate governance principles
Board of DirectorsAntti Herlin Chairman of the Boardb. 1956, D.Sc. (Econ.) h.c., D.Arts h.c., D.Sc. (Tech.) h.c.Member of the Board since 1991.Has served as Chairman of the Board since 2003. Previously served as CEO of KONE Corporation 1996–2006 and as Deputy Chairman 1996–2003.Current key positions of trust are Chairman of the Board of Security Trading Oy, Holding Manutas Oy and Sanoma Corpora-tion, Deputy Chairman of the Supervisory Board of Ilmarinen Mutual Pension Insur-ance Company, Member of the Board of the Confederation of Finnish Industries and Member of the Board of Technology Indus-tries of Finland.
Jussi Herlin Vice Chairman of the Boardb. 1984, M. Sc. (Econ.)Member of the Board since 2012. Consultant at Accenture between 2012–2014. Previously served as Deputy Member of the Board of KONE Corporation during the years 2007–2012.Current key positions of trust are Member of the Board of Security Trading Oy, Member of the Board of the Tiina and Antti Herlin Foundation, Member of the Board of the Finnish Family Firms Association and Mem-ber of the Supervisory Board of the Finnish Fair Corporation.
Matti Alahuhtab. 1952, D. Sc. (Tech.), D.Sc. (Tech.) h.c.Member of the Board since 2003. Previously served as President of KONE Cor-poration since 2005, and President & CEO from 2006 to 2014, as Executive Vice Presi-dent of Nokia Corporation 2004, as Presi-dent of Nokia Mobile Phones 1998–2003 and as President of Nokia Telecommunica-tions 1993–1998.Current key positions of trust are Chairman of the Board of DevCo Partners Corporation, Chairman of the Board of Outotec Corpora-tion, Chairman of the Board of the Confed-eration of Finnish Industries, and Member of the Board of AB Volvo and Member of the Board of ABB Ltd.
Anne Brunila b. 1957, D.Sc. (Econ.), D.Sc. (Econ.) h.c.Member of the Board since 2009.Professor of Practice, Hanken School of Economics since 2014. Previously served as Executive Vice President, Corporate Relations and Strategy and Member of the Management Team of Fortum 2009–2012, as President and CEO of the Finnish Forest Industries Federation 2006–2009, in the Finnish Ministry of Finance as Director General 2003–2006 and in several advisory and executive positions in the Bank of Fin-land 1992–2000 and in the European Com-mission 2000–2002.Current key positions of trust are Member of the Board of Stora Enso, Member of the Board of Sampo Plc, Member of the Board of Sanoma Corporation, Chairman of the Board of Aalto University Foundation, Mem-ber of the Board of The Research Institute of the Finnish Economy ETLA and Member of the Board of the Finnish Business and Policy Forum EVA.
Iiris Herlinb. 1989, B.A. candidate in Social SciencesMember of the Board since 2015. Deputy Member of the Board 2013–2014.Current key positions of trust are Member of the Board of Security Trading Oy and Member of the Board of the Tiina and Antti Herlin Foundation.
Ravi Kantb. 1944, B. Tech. (Hons.), M.Sc., D.Sc. (Hon)Member of the Board since 2014.Previously served in different positions in Tata Motors since 1999, and as Managing Director and CEO from 2005 to 2009 and after that as the Vice Chairman of the Board of Directors until 2014. Prior to that, he was Director, Consumer Electronics, Philips India; Director (Marketing) LML Ltd. and Vice President (Marketing) Titan Watches Ltd.Current key positions of trust are Chairman of the Board of Indian Institute of Manage-ment Rohtak and Member of the Board of Sesa Sterlite Ltd, Member of the Board of the National Institute of Design (India), Member of the Board of Enactus (USA) and Member of the Board of WonderWork (USA).
Juhani Kaskeala b. 1946, AdmiralMember of the Board since 2009.Managing director of Admiral Consulting Oy since 2011. Previously served in the Finnish Defence Forces in several positions 1965–2009, last as Commander of the Finnish Defence Forces 2001–2009.Current key positions of trust are Member of the Board of Forcit Ab, Member of the Board of Nixu Oyj, Member of the Board of John Nurminen Foundation, Vice chairman of the Delegation of the Finnish Olympic Committee and Member of the European Leadership Network.
Sirpa Pietikäinen b. 1959, M.Sc. (Econ.)Member of the Board since 2006.Served as Member of the European Parlia-ment since 2008 and as a negotiation theory lecturer and consultant since 1999. Previously served as a Member of Finland’s Parliament 1983–2003 and as Finland’s Minister of the Environment 1991–1995.Current key positions of trust are Chairman of GLOBE EU, Chairman of the Finnish Asso-ciation of Landscape Industries, Member of the Board of Alzheimer Europe, Member of the Finn Church EU Advisory Board, Mem-ber of the Board of Lammi Savings Bank and Member of the KVS Foundation Advisory Board.
Jukka Ala-Mello b. 1963, M.Sc. (Econ.), Authorized Public AccountantSecretary to the Board of Directors since 2006. Has served as Director of KONE Corpora-tion and Managing Director and Member of the Board of Security Trading Oy and Holding Manutas Oy since 2006. Previously served as a Partner and APA Auditor in Price-waterhouseCoopers Oy 1993–2006 and Financial Manager of Panostaja Corporation 1990–1993.Current key positions of trust are Chairman of the Board of Panostaja Corporation and Chairman of the Board of OWH-Yhtiöt Cor-poration.
KONE 2015 Financial Statements | Corporate governance statement | Board of Directors
More information
Corporate governance, page 60
More information
A regularly updated table report-ing the holdings of public insiders is available at www.kone.com.
64 64

Executive BoardHenrik EhrnroothPresident and CEOb. 1969, M.Sc. (Econ)President & CEO of KONE Corporation since April 2014. Member of the Executive Board. Previously served as Chief Financial Officer of KONE Corporation 2009–2014. Earlier worked at Goldman Sachs from 1998–2009, most recently as a Managing Director in the Investment Banking Division and at UBS in various positions from 1994–1998.Current key positions of trust are Member of the Board of UPM Kymmene Corporation and Member of the Foundation Board of the International Institute for Management Development (IMD, Switzerland).
Max AlfthanMarketing and Communications b. 1961, M.Sc. (Econ.)Member of the Executive Board and employed by KONE Corporation since 2014. Previously served as Chief Strategy Officer of Fiskars 2008–2014, Senior Vice President for Communications of Amer Sports Corporation 2001–2008, Managing Director of Lowe Lintas & Part-ners Oy 1998–2001 and Marketing Director of Sinebrychoff 1989–1998.
Klaus CawénM&A and Strategic Alliances, Russia, Legal Affairsb. 1957, LL.M.Member of the Executive Board since 1991. Employed by KONE Corporation since 1983. Previously served as General Counsel of KONE Corporation 1991–2001.Current key positions of trust are Member of the Board of Oy Karl Fazer Ab, Member of the Board of East Office of Finnish Indus-tries Ltd, Member of the Board of Outotec Oyj and Member of the Board of Toshiba Elevator and Building Systems Corporation (Japan).
William B. JohnsonGreater Chinab. 1958, MBAMember of the Executive Board since 2012, and employed by KONE Corporation since 2004. Previously served as Managing Direc-tor of KONE China since 2004, Service Vice President of Asia-Pacific, Carrier Interna-tional Corporation (United Technologies) 2002–2004, as Managing Director Australia, Carrier Air Conditioning Ltd. (United Tech-nologies) 2001–2002, and in various leader-ship roles with Otis Elevator Company and Trammell Crow Company.
Pekka KemppainenService Businessb. 1954, Licentiate in TechnologyMember of the Executive Board since 2005. Employed by KONE Corporation since 1984. Previously served in KONE Corpora-tion as Executive Vice President, Asia-Pacific 2004–2010, as Executive Vice President, New Equipment Business, Elevators and Escalators 2001–2004, as Senior Vice Presi-dent, New Equipment Business and Tech-nology 1995–2001 and as Director of the Research Center 1990–1994.
Heikki LeppänenNew Equipment Businessb. 1957, Licentiate in TechnologyMember of the Executive Board since 2005. Employed by KONE Corporation since 1982. Previously served in KONE Corpora-tion as Senior Vice President, Technology 2004–2005 and as Head of Global Research and Development 2000–2004.
Pierre LiautaudWest & South Europe, AfricaCustomer Experience b. 1958, M.Sc (Ecole Polytechnique, Ecole Nationale Supérieure des Télécommunications)Member of the Executive Board and employed by KONE Corporation since 2011. Previously served in Microsoft EMEA as Vice President, Enterprise & Partner Group 2003–2006, then Area Vice President Western Europe 2006–2009. Was CEO at @viso (Vivendi-Softbank, 1999–2001) and Activia Networks (2001–2003). Also served in IBM Corporation 1982–1999, most recently as Vice-President Marketing, Inter-net Division (1998) and General Manager, Global Electronics Industry (1999).
Tomio PihkalaOperations Development b. 1975, M. Sc. (Mechanical Engineering)Member of the Executive Board since 2013. Employed by KONE Corporation since 2001. Previously served in KONE Corpora-tion as Executive Vice President, Safety, Quality and Installation 2013–2014, as Vice President, Technology Finland 2011–2013, as Director, Service Business, in KONE China 2009–2010, as Director, Product Strategy and Marketing, in KONE China 2007–2008.
Neeraj SharmaAsia-Pacific, Middle East b. 1960, B.E (Marine)Member of the Executive Board since 2014. Employed by KONE Corporation since 2009. Previously served in KONE Corpora-tion as Managing Director for KONE India 2009–2014, prior to which he served in various leadership roles at General Electric.
Eriikka SöderströmCFOb. 1968, M.Sc. (Econ)Member of the Executive Board since 2014. Employed by KONE Corporation since 2013. Previously served at Vacon as CFO from 2009–2012, at Nautor as CFO in 2008 and in Nokia Siemens Networks / Nokia Networks in several finance leadership posi-tions between 1994–2007.Current key position of trust is Member of the Board of Comptel Corporation.
Kerttu TuomasHuman Resourcesb. 1957, B. Sc. (Econ.)Member of the Executive Board and employed by KONE Corporation since 2002. Previously served as Group Vice Presi-dent, Human Resources of Elcoteq Network Corporation 2000–2002, as Personnel & Organization Manager of Masterfoods Oy (Mars) 1994–1999 and as Consultant at Mercuri Urval 1987–1993.Current key positions of trust are Vice Chair-man of the Board of Kemira Corporation, and member of the Strategic Board of CEMS, the Global Alliance In Management Education.
Noud VeegerCentral and North Europe b. 1961, M.Sc. (Econ.)Member of the Executive Board since 2004. Employed by KONE Corporation since 1999. Previously served in KONE Corpora-tion as Executive Vice President, Asia-Pacific and Middle East 2010–2014, as Executive Vice President, Central and North Europe 2004–2010, as Managing Director of KONE Plc (UK) 2002–2004, as Director, New Eleva-tor & Escalator Business, KONE Netherlands 1999–2002, as Director of OTRA Nether-lands 1996–1998 and as Managing Director of HCI Central America 1993–1996.
Larry WashAmericasb. 1961, B. Sc. (Electrical Engineering), MBAMember of the Executive Board and employed by KONE Corporation since 2012. Previously served as President of Global Services for the Climate Solutions sector of Ingersoll Rand, as Vice President of service and contracting business for Trane within North and Latin America, and in various leadership roles with Xerox and Eastman Kodak.
Changes as of January 1, 2016Tomio Pihkala was appointed KONE’s Chief Technology Officer to head the new Technology & Innovation unit. In his new position, he continues as a member of the Executive Board. Mikko Korte was appointed Executive Vice President, Opera-tions Development. In his new position he became a member of the Executive Board.
KONE 2015 Financial Statements | Corporate governance statement | Executive Board
6564

Financial targets and capital managementFinancial targetsKONE has defined long-term financial tar-gets for its financial performance. These targets are:
• Growth: faster than the market • Profitability: EBIT 16% • Cash flow: improved working capital
rotation
KONE has not however defined a time frame for the achievement of these financial targets. The target is to continu-ously grow faster than the market and to improve working capital rotation. The target over the long term is to achieve an EBIT margin of 16%. However, given the capital and asset structure of KONE, the aim is not to maximize the EBIT margin in the short term, but rather to grow the absolute EBIT in an optimal way over the long term and as a result maintain a strong return on capital employed. The relative EBIT margin target is relevant in ensuring that growth is profitable and that pricing, quality and productivity improve continuously.
Capital managementKONE aims to manage its capital in a way that supports the profitable growth of operations by securing an adequate liquidity and capitalization of the group at all times. The target is to maintain a capital structure that contributes to the creation of shareholder value.
The assets employed in KONE’s busi-ness consist principally of net working capital, fixed assets, and investments which are funded by equity and net debt, as shown in the table below. Due to the business model and the business pro-cesses of KONE, the level of total assets employed is relatively low. KONE aims to maintain a negative net working capital to ensure a healthy cash flow even when the business is growing and to maintain a high return on assets employed. Cash flow from operations is the principal source of KONE’s financing. External funding, as well as cash and cash equiva-lents, are managed centrally by the Group Treasury according to the Group Treasury Policy. Liquid assets are invested only in counterparties with high creditworthiness and deposits to ensure continuous access to the funds.
KONE has not defined a specific target for its capital structure, but the aim is to ensure a strong credit quality to provide for ample access to external funding sources and to support the growth ambi-tions of the business. KONE considers its current capital structure to be a strength, as it allows for capturing potential value-creating business opportunities, should such opportunities arise. In the event that significant attractive investment or acquisition opportunities were available, KONE could also utilize its borrowing capacity. In such cases the level of debt and financial gearing could be higher
for a period of time. At the end of 2015, the funding of KONE was guaranteed by existing committed credit lines and excess liquidity.
KONE has not defined a specific target for dividends or share buy-backs. The divi-dend proposal by the Board of Directors is determined on the basis of the overall business outlook, business opportunities, as well as the present capital structure and the anticipated changes in it.*) At the end of December 2015, KONE had 12,240,544 class B shares in its posses-sion.
To ensure an efficient internal alloca-tion and utilization of its capital resources, KONE measures the financial results of its business activities after a capital allocation charge. The capital allocation charge is based on the assets employed in the busi-ness activity and the weighted average cost of capital (WACC).
The WACC is also used as a hurdle rate when evaluating the shareholder value creation potential of new acquisitions, major capital expenditure and other investments. The valuation methods used are payback time, discounted cash flow and profitability and cash flow multiples.
More information
Financial risks, note 2, page 20
MEUR 2015 2014 2013 2012 2) 2011Assets employed:Goodwill and shares 1,429.4 1,321.3 1,215.7 1,239.2 1,174.0Other fixed assets 1) 616.9 578.9 498,4 459.8 392.3Net working capital -983.4 -749.7 -611.5 -439.3 -361.4Total assets employed 1,062.9 1,105.5 1,102.6 1,259.7 1,204.9
Capital:Equity 2,575.5 2,062.4 1,724.6 1,833.7 2,034.0Interest-bearing net debt -1,512.6 -911.8 -622.0 -574.0 -829.1Total capital 1,062.9 1,150.5 1,102.6 1,259.7 1,204.9
Gearing -58.7 -44.2 -36.1 -31.3 -40.8Total equity/total assets 45.4 43.6 43.7 47.1 54.0
1) Property, plant and equipment, acquired maintenance contracts and other intangible assets.2) Figures for 2012 have been restated according to the revised IAS 19 ’Employee Benefits’.*) In 2011–2015, the dividend payout ratio has been 69.7–129.8% for class B shares (Board’s proposal 2015).
KONE 2015 Financial Statements | Financial targets and capital management
66 66
Market capitalizationDuring the financial year 2015 the price of the KONE Corporation class B share rose by 3.6%, from EUR 37.82 to EUR 39.17, on the Nasdaq Helsinki Ltd. in Finland. During the same period, the OMX Helsinki Cap Index rose by approximately 11.7% and the Euro Stoxx 600 Index by approxi-mately 7.8%. During the financial year the price of the KONE Corporation class B share peaked at EUR 44.35 and was EUR 31.50 at its lowest. At the end of 2015, the company’s market capitalization, in which the unlisted class A shares are valued at the closing price of the class B shares on the last trading day of the financial year, was EUR 20,101 million. At the end of Decem-ber 2015, the company held 12,240,544 class B shares as treasury shares.
During the financial year, 259.2 million KONE Corporation class B shares were traded on the Nasdaq Helsinki Ltd. The value of the shares traded was EUR 9,930 million. The average daily turnover of class B shares was 1,032,543, representing a value of EUR 39.5 million. The relative turnover of KONE’s class B shares (exclud-ing class B shares held by KONE Corpora-tion) was 59%. In addition to the Nasdaq Helsinki Stock Exchange, KONE’s class B share is traded also on various alternative trading platforms. The volume of KONE’s B shares traded on the Nasdaq Helsinki Stock Exchange represented approximately 31% of the total volume of KONE’s class B shares traded in 2015 (Source: Fidessa Fragmentation Index).
Shares and share capitalAt the end of December 2015, the share capital was EUR 65,675,789.25. During the financial year the share capital increased by EUR 124,548.25 due to the subscription of shares with the KONE 2010 and KONE 2013 option rights.
Each class A share is assigned one vote, as is each block of 10 class B shares, with the proviso that each shareholder is entitled to at least one vote. At the end of Decem-ber 2015, the total number of shares was 525,406,314, comprising 449,197,602 class B shares and 76,208,712 class A shares. The total number of votes was 121,128,472.
DividendsIn accordance with the Articles of Asso-ciation, class B shares are preferred for a dividend, which is at least one percent and no more than 2.5 percent higher than the dividend paid to the holders of class A shares, calculated from the accounting par value of the share. The accounting par value of the share is EUR 0.125. The Board of Directors proposes to the Annual General Meeting that for the financial year 2015 a dividend of EUR 1.3975 be paid for each class A share and a dividend of EUR 1.40 be paid for each class B share.
Authorization to raise the share capitalAt the end of the financial year, the Board of Directors of the company had a valid authorization granted by the Shareholders’ Meeting in February 2015 to increase the share capital and to issue stock options. The authorization is effective until February 23, 2020.
Authorization to purchase and surrender own sharesKONE Corporation’s Annual General Meet-ing held on February 23, 2015 authorized the Board of Directors to repurchase the company’s own shares. The authorization will remain in effect for a period of one
Shares and shareholdersyear from the date of the decision of the General Meeting.
Altogether no more than 52,440,000 shares may be repurchased, of which no more than 7,620,000 may be class A shares and 44,820,000 class B shares, tak-ing into consideration the provisions of the Companies Act regarding the maximum amount of its own shares that the Com-pany is allowed to possess.
The shares may be repurchased, among other reasons, to develop the capital structure of the Company, finance or carry out possible acquisitions, implement the Company’s share-based incentive plans, or to be transferred for other purposes or to be cancelled.
The minimum and maximum consid-eration for the shares to be purchased is determined for both class A and class B shares on the basis of the trading price for class B shares determined on the Nasdaq Helsinki Ltd. on the time of purchase.
During January–December 2015, KONE used its authorization to repurchase own shares. In April, 354,838 class B shares in the company’s possession were assigned to the share-based incentive plan and 3,210 class B shares as a part of the board mem-bers’ annual remuneration. In July, 5,194 class B shares were returned to KONE Corporation by virtue of the terms of KONE Corporation’s share-based incentive program for the years 2013–2015. In addi-tion, KONE bought back in total 1,910,000 of its own class B shares in July. At the end of December, the Group had 12,240,544 class B shares in its possession.
OptionsKONE Corporation had four option pro-grams during the financial period 2015. The purpose of the stock options is to encourage long-term efforts by key person-nel to increase shareholder value and their commitment to the company by offering them an internationally competitive incen-tive program. The company’s Board Mem-bers, President & CEO and members of the
Class A shares, % Class B shares, %
*) Includes foreign-owned shares registered by Finnish nominees.
KONE 2015 Financial Statements | Shares and shareholders
More information
Market capitalization is calculated on the basis of both the listed class B shares and the unlisted class A shares excluding treasury shares.
24.5% Companies
50.6% Foreign shareholders *)
1.9% Financial institutions and insurance companies
13.5% Individuals
5.0% Non-profit organizations
4.4% Public institutions
92.6% Companies
7.4% Non-profit organizations
6766
45
40
35
30
25
20
15
10
5
0
40
35
30
25
20
15
10
5
0
20132010 2011 201220092008200720062005 2014 2015
KONE CORPORATION’S SHARE CAPITAL CONSISTS OF THE FOLLOWING:
Number of shares Par value, EUR
Class A 76,208,712 9,526,089
Class B 449,197,602 56,149,700
Total 525,406,314 65,675,789
KONE class B share
KONE 2013option rights
Trading code, Nasdaq Helsinki Ltd. in Finland KNEBV KNEBVEW113
ISIN code FI0009013403 FI4000146832
Accounting par value EUR 0.125
Conversion rate 1:2
KONE class B shares traded Jan 1–Dec 31, 2015, million shares
Market capitalization, MEUR
KONE class B share price development Jun 1, 2005–Dec 31, 2015, EUR
KONE class B Share OMX Helsinki Cap Index Euro Stoxx 600 Index
Jan
Jun
Oct
Feb Jul
Nov
Mar
Aug DecAp
r
May
Sep
KONE 2015 Financial Statements | Shares and shareholders
25,000
20,000
15,000
10,000
5,000
0
More information
Information for share-holders, see inside of report’s front cover
More information
IR contact details, see inside of report’s back cover
More information
Option programs, note 20, page 36
Jun
1, 2
005
Jun
30, 2
006
Jun
30, 2
007
Jun
30, 2
008
Jun
30, 2
005
Sep
30,
200
6
Sep
30,
200
7
Sep
30,
200
8
Sep
30,
200
5
Dec
31,
200
6
Dec
31,
200
7
Dec
31,
200
8
Dec
31,
200
5M
ar 3
1, 2
006
Mar
31,
200
7
Mar
31,
200
8
Jun
30, 2
009
Jun
30, 2
010
Jun
30, 2
011
Jun
30, 2
012
Sep
30,
200
9
Sep
30,
201
0
Sep
30,
201
1
Sep
30,
201
2
Dec
31,
200
9
Dec
31,
201
0
Dec
31,
201
1
Dec
31,
201
2
Mar
31,
200
9
Mar
31,
201
0
Mar
31,
201
1
Mar
31,
201
2
Jun
30, 2
013
Jun
30, 2
014
Sep
30,
201
3
Sep
30,
201
4
Dec
31,
201
3
Dec
31,
201
4
Mar
31,
201
3
Mar
31,
201
4
Jun
30, 2
015
Sep
30,
201
5
Mar
31,
201
5
Dec
31,
201
5
68 68

Executive Board were not included in the stock option plan 2010. The company´s Board Mem-bers, President & CEO, mem-bers of the Executive Board and other key personnel covered by KONE’s share-based incentive programs other than option pro-grams are not included in the option plans 2013, 2014 and 2015.
Stock options 2010 were granted according to the decision of the Board of Directors on July 20, 2010 to approxi-mately 430 key employees. The decision was based on the authorization received from the Shareholders Meeting on March 1, 2010. The total number of stock options was 3,000,000 and 896,000 of them were held by KONE Corporation’s subsidiary. The original share subscription price for the option was 17.50 euros per share and it was further reduced in situations mentioned in the terms, for example with dividends distributed before the subscrip-tion of the shares. The effective subscrip-tion price as per April 30, 2015 when the subscription period ended was EUR 11.875. Each option entitled its holder to subscribe for two (2) new class B shares. The share subscription period for the stock option 2010 was April 1, 2013–April 30, 2015. The share subscription period began on April 1, 2013 and the 2010 option stock options were listed on the Nasdaq Helsinki stock exchange on April 2, 2013, as the financial performance of the KONE Group for the financial years 2010–2012 based on the total consideration of the Board of Directors was equal to or better than the average performance of key competitors of KONE. The amount of KONE class B shares subscribed with the 2010 option rights during 2015 was 870,102. The subscrip-tion price paid totaled EUR 10.3 million during year 2015.
Stock options 2013 were granted according to the decision of the Board of Directors on January 24, 2013 to approxi-mately 480 key employees. The decision was based on the authorization received from the shareholders’ meeting on March 1, 2010. A maximum total of 750,000 options were granted. Each stock option entitles its holder to subscribe for two (2) new class B KONE shares. The share subscription period for the stock options 2013 is April 1, 2015–April 30, 2017. The share subscription period began on April 1, 2015 and the 2013 option stock options were listed on the Nasdaq Helsinki stock exchange on April 1, 2015, as the financial performance of the KONE Group for the financial years 2013–2014 based on the total consideration of the Board of Directors was equal to or better than the average performance of key competitors of KONE. The amount of KONE class B shares subscribed with the 2013 option rights during 2015 was 126,284. The subscrip-tion price paid totaled EUR 3.2 million dur-ing year 2015. The original share subscrip-tion price for the stock option was EUR 29.125 per share and it is further reduced in situations mentioned in the terms, for
example with dividends distributed before the subscription of the shares. The effective subscription price as per December 31, 2015 is EUR 25.40.
Stock options 2014 are granted according to the decision of the Board of Directors on December 20, 2013 to approximately 550 key employees and the decision was based on the authorization received from the Shareholders Meeting on March 1, 2010. A maximum total of 1,500,000 options are granted. The origi-nal share subscription price for the stock option was EUR 31.80 per share and it is further reduced in situations mentioned in the terms, for example with dividends distributed before the subscription of the shares. The effective subscription price as per December 31, 2015 is EUR 29.60. Each option entitles its holder to subscribe for one (1) new or existing company’s own class B KONE share. The share subscription period for the stock options 2014 is April 1, 2016–April 30, 2018. The share subscrip-tion period begins April 1, 2016 as the financial performance of the KONE Group for the financial years 2014–2015, based on the total consideration of the Board of Directors, was equal to or better than the average performance of the key competi-tors of KONE.
Stock options 2015 are granted according to the decision of the Board of Directors on December 18, 2014 to approximately 560 key employees and the decision was based on the authorization received from the Shareholders Meet-ing on March 1, 2010. A maximum total of 1,500,000 options are granted. Each option entitles its holder to subscribe for one (1) new or existing company’s own class B KONE share. The share subscrip-tion period for the stock options 2015 will be April 1, 2017–April 30, 2019. The share subscription period begins only if the financial performance of the KONE Group for the financial years 2015–2016, based on the total consideration of the Board of Directors, is equal to or better than the average performance of the key competi-tors of KONE. If the above-mentioned pre-requisite does not fulfill, the stock options expire based on the consideration and in the extent and manner decided by the Board of Directors and the terms of the stock options. The original share subscrip-tion price for the stock option was EUR 36.20 per share and it is further reduced in situations mentioned in the terms, for example with dividends distributed before the subscription of the shares. The effective subscription price as per December 31, 2015 is EUR 35.00.
Share-based incentive planKONE has a share-based incentive plan for the company’s senior management (President & CEO, members of the Execu-tive Board and other top management), consisting of approximately 40 individu-als. The potential reward is based on the annual growth in both sales and earnings
before interest and taxes (EBIT). The reward is to be paid as a combination of class B shares and cash equivalent of the taxes and similar charges that are incurred. The plan prevents participants from trans-ferring the shares during the fifteen-month period following the termi-nation of each fiscal year. As part of the share-based incentive plan, a long term target for the management’s ownership has been set. In April 2015, a total of 354,838 class B shares were granted to the management as a reward due to the achievement of the targets for the year 2014. In July 2015 a total of 5,194 KONE class B shares were returned to KONE Corporation. In April 2016, a total of 391,662 class B shares will be granted to the management as a reward due to the achievement of the tar-gets for the year 2015.
In December 2015, KONE’s Board of Directors decided that KONE’s share based remuneration will be based on two sepa-rate plans starting from the financial year 2016. One share-based incentive plan will be targeted for the senior management of KONE, including the President and CEO, members of the Executive Board and other top management, consisting of approximately 60 individuals. A second plan will be targeted for other key person-nel of KONE, totaling approximately 425 individuals. The incentive plans will be part of these individuals’ remuneration starting from the financial year 2016. According to the decision, the potential reward is based on the annual growth in sales and earnings before interest and taxes (EBIT) in both plans. However, KONE’s Board of Directors has the possibility to change the basis of the target setting annually. The potential reward is to be paid as a combination of KONE class B shares and a cash payment equivalent to the taxes and similar charges that are incurred from the receipt of the shares. Plans include conditions preventing participants from transferring and par-ticipants are obliged to return the shares and the cash payments if employment or service contract is terminated during a period of two years following the end-ing of each earning period. Following the decision, KONE does not grant new stock option plans. The current existing stock option plans 2013, 2014 and 2015 shall be carried out based on the original terms of these programs.
ShareholdersAt the end of December 2015, KONE Corporation had 56,441 shareholders. A breakdown of the shareholders is shown on page 67 and 70.
At the end of December 2015, non-Finnish shareholders held approximately 50.6% of KONE Corporation’s class B shares, corresponding to around 18.8% percent of the votes. Of these foreign-owned shares, 5,853,322 were registered in the shareholders’ own names. Foreign-owned shares may also be nominee-regis-tered. Only shares registered in the share-
6968
KONE 2015 Financial Statements | Shares and shareholders
RECONCILIATION OF OWN SHARES, DEC 31, 2015
KONE Corporation and Group total pcs Acquisition cost Average price31.12.2014 10,683,398 150,793,600.58 14.11April 29, 2015 -354,838 -11,444,162.71 32.25April 29, 2015 -3,210 -104,833.43 32.66July 17, 2015 5,194 152,282.83 29.32July 22, 2015 500,000 18,543,911.51 37.09July 23, 2015 320,000 11,968,677.53 37.40July 24, 2015 214,000 8,072,938.96 37.72July 27, 2015 266,000 9,802,007.32 36.85July 28, 2015 184,000 6,771,703.70 36.80July 29, 2015 160,000 5,919,695.38 37.00July 30, 2015 156,000 5,902,969.56 37.84July 31, 2015 110,000 4,174,608.01 37.9531.12.2015 12,240,544 210,553,399.24 17.20
SHAREHOLDINGS ON DEC 31, 2015 BY NUMBER OF SHARES
Number of sharesNumber
of ownersPercentage
of ownersNumber
of sharesPercentage
of shares1 – 10 2,825 5.00 18,374 0.00
11 – 100 20,264 35.89 1,115,597 0.21101 – 1,000 25,090 44.44 9,460,300 1.80
1,001 – 10,000 7,253 12.85 20,524,525 3.9110,001 – 100,000 893 1.58 23,530,211 4.48
100,001 – 116 0.21 470,714,179 89.59Total 56,441 99.98 525,363,186 99.99Shares which have not been transferred to the paperless book entry system 14 0.02 43,128 0.01Total 525,406,314 100.00
MAJOR SHAREHOLDERS ON DEC 31, 2015
A-series B-series Total % of shares % of votes 1 Herlin Antti 70,561,608 43,849,444 114,211,052 21.74 61.87 Holding Manutas Oy 1) 54,284,592 33,754,254 88,038,846 16.76 47.60 Security Trading Oy 2) 16,277,016 8,208,016 24,485,032 4.66 14.12 Herlin Antti 0 1,687,174 1,687,174 0.32 0.142 Polttina Oy 0 17,471,928 17,471,928 3.33 1.443 Wipunen varainhallinta Oy 0 16,350,000 16,350,000 3.11 1.354 Riikantorppa Oy 0 16,000,000 16,000,000 3.05 1.325 Kone Foundation 5,647,104 9,859,632 15,506,736 2.95 5.486 Varma Mutual Pension Insurance Company 0 6,070,076 6,070,076 1.16 0.507 Ilmarinen Mutual Pension Insurance Company 0 4,820,860 4,820,860 0.92 0.408 Blåberg Olli 0 4,040,000 4,040,000 0.77 0.339 The State Pension Fund 0 3,700,000 3,700,000 0.70 0.3110 Blåberg Karolina 0 2,411,960 2,411,960 0.46 0.20 10 largest shareholders total 76,208,712 124,373,900 200,582,612 38.18 73.18 Foreign shareholders 3) 0 227,397,785 227,397,785 43.28 18.77
Repurchased own shares 0 12,240,544 12,240,544 2.33 1.01 Others 0 85,185,373 85,185,373 16.21 7.03Total 76,208,712 449,197,602 525,406,314 100.00 100.00
The list of ten major shareholders includes the major shareholders with a Finnish book-entry account.1) Antti Herlin’s ownership in Holding Manutas represents 1.1 percent of the shares and 12.8 percent of the voting rights and together with the
ownership of Security Trading, company in which he exercises controlling power, his ownership represents 51.0 percent of the shares and 62.7 percent of the voting rights.
2) Antti Herlin’s ownership in Security Trading Oy represents 99.9 percent of the shares and 99.8 percent of the voting rights. The shareholding of Security Trading Oy amounts to 8,408,016 KONE Corporation’s class B shares, when taking into account 200,000 shares that were lent out on December 31, 2015.
3) Foreign ownership including foreign-owned shares registered by Finnish nominees.
KONE 2015 Financial Statements | Shares and shareholders
holders’ own name entitle their holders to vote at Shareholders’ Meetings. There were 221,544,463 nominee-registered shares, representing approximately 42.2% percent of all shares, at the end of Decem-ber 2015.
Shareholdings of the Chairman and Members of the Board of DirectorsOn December 31, 2015, KONE Corpora-tion’s Chairman and Members of the Board of Directors owned 70,561,608 class A
shares and 44,853,553 class B shares, representing approximately 22.0% of the total number of shares and 62.0% of the total votes.
70 70

Dividend proposal
The parent company’s non-restricted equity on December 31, 2015 is EUR 1,765,223,548.43 of which the net profit for the financial year is EUR 1,200,968,239.16.
The Board of Directors proposes to the Annual General Meeting that a dividend of EUR 1.3975 be paid on the outstanding 76,208,712 class A shares and EUR 1.40 on the outstanding 436,957,058 class B shares, resulting in a total amount of proposed divi-dends of EUR 718,241,556.22. The Board of Directors further proposes that the remaining non-restricted equity, EUR 1,046,981,992.21 be retained and carried forward.
The Board proposes that the dividends be payable from March 16, 2016.
Signatures for the Financial statements and Board of Directors’ report
Helsinki, January 28, 2016
Antti Herlin Jussi Herlin
Matti Alahuhta Anne Brunila
Iiris Herlin Ravi Kant
Juhani Kaskeala Sirpa Pietikäinen
Henrik Ehrnrooth,President & CEO
The Auditor’s Note
Our auditors’ report has been issued today.
Helsinki, January 28, 2016
PricewaterhouseCoopers OyAuthorised Public Accountants
Pasi Karppinen Niina VilskeAuthorised Authorised Public Accountant Public Accountant
Dividend proposal, signatures for the Board of Directors’ report and Finan-cial statements and Auditor’s note.
KONE 2015 Financial Statements | Dividend proposal, signatures for the Board of Directors’ report and Financial statements and Auditor’s note.
7170

Auditor’s reportTo the Annual General Meeting of KONE CorporationWe have audited the accounting records, the financial statements, the report of the Board of Directors and the administra-tion of KONE Corporation for the year ended 31 December, 2015. The financial statements comprise the consolidated statement of financial position, income statement, statement of comprehensive income, statement of changes in equity and statement of cash flows, and notes to the consolidated financial statements, as well as the parent company’s balance sheet, income statement, cash flow state-ment and notes to the financial state-ments.
Responsibility of the Board of Directors and the Managing DirectorThe Board of Directors and the Man-aging Director are responsible for the preparation of consolidated financial statements that give a true and fair view in accordance with International Financial Reporting Standards (IFRS) as adopted by the EU, as well as for the preparation of financial statements and the report of the Board of Directors that give a true and fair view in accordance with the laws and regulations governing the preparation of the financial statements and the report of the Board of Directors in Finland. The Board of Directors is responsible for the appropriate arrangement of the control of the company’s accounts and finances, and the Managing Director shall see to it that the accounts of the company are in compliance with the law and that its financial affairs have been arranged in a reliable manner.
Auditor’s ResponsibilityOur responsibility is to express an opin-ion on the financial statements, on the consolidated financial statements and on the report of the Board of Directors based on our audit. The Auditing Act requires that we comply with the requirements of professional ethics. We conducted our audit in accordance with good auditing practice in Finland. Good auditing prac-tice requires that we plan and perform the audit to obtain reasonable assurance about whether the financial statements and the report of the Board of Directors are free from material misstatement, and whether the members of the Board of Directors of the parent company or the Managing Directors are guilty of an act or negligence which may result in liabil-ity in damages towards the company or whether they have violated the Limited Liability Companies Act or the articles of association of the company.
An audit involves performing proce-dures to obtain audit evidence about the amounts and disclosures in the financial statements and the report of the Board of Directors. The procedures selected depend on the auditor’s judgment, including the assessment of the risks of material misstatement, whether due to fraud or error. In making those risk assess-ments, the auditor considers internal con-trol relevant to the entity’s preparation of financial statements and report of the Board of Directors that give a true and fair view in order to design audit procedures that are appropriate in the circumstances, but not for the purpose of expressing an opinion on the effectiveness of the company’s internal control. An audit also includes evaluating the appropriateness of accounting policies used and the reason-ableness of accounting estimates made by management, as well as evaluating the overall presentation of the financial statements and the report of the Board of Directors.
We believe that the audit evidence we have obtained is sufficient and appropri-ate to provide a basis for our audit opin-ion.
Opinion on the Consolidated Financial StatementsIn our opinion, the consolidated financial statements give a true and fair view of the financial position, financial performance, and cash flows of the group in accordance with International Financial Reporting Standards (IFRS) as adopted by the EU.
Opinion on the Company’s Financial Statements and the Report of the Board of DirectorsIn our opinion, the financial statements and the report of the Board of Directors give a true and fair view of both the con-solidated and the parent company’s finan-cial performance and financial position in accordance with the laws and regulations governing the preparation of the financial statements and the report of the Board of Directors in Finland. The information in the report of the Board of Directors is consistent with the information in the financial statements.
Helsinki, 28 January, 2016
PricewaterhouseCoopers OyAuthorised Public Accountants
Pasi Karppinen Niina VilskeAuthorised AuthorisedPublic PublicAccountant Accountant
KONE 2015 Financial Statements | Auditor’s report
72 72

More information
The comprehensive investor relations pages can be found at www.kone.com Shares and shareholders, page 67Corporate governance, page 60Information for shareholders on report’s front cover
Investor RelationsInvestor Relations policyKONE strives to offer liquid shares that present an attractive investment alterna-tive to domestic and foreign investors. The primary task of KONE’s Investor Relations is to ensure that the market has correct and sufficient information at its disposal in order to determine the value of the KONE share at all times. This task is being performed in KONE’s written com-munications, such as the financial state-ments and interim reports, the corporate responsibility report, stock exchange and press releases, the internet pages as well as in all other communication with inves-tors and analysts.
In all of its communications, KONE complies with the requirements for listed companies as defined by the Securities Markets Act, the rules of the Nasdaq Helsinki Ltd. and any other applicable regulation concerning prompt and simul-taneous disclosure of information.
Investor Relations activitiesAll of KONE’s Investor Relations activities are coordinated by the Investor Relations function. This ensures fair and equal access to company information and to its spokespersons. Investor Relations also gathers and analyses capital market infor-mation for KONE’s Executive Board. In all of its activities, KONE’s Investor Relations strives for prompt, transparent and high-quality service.
Silent periodKONE observes a period of silence prior to releasing financial results. This means that there will be no discussions regarding financial issues with the capital markets or the financial media during the three-week period preceding the publication of interim results and the four-week period preceding the publication of the annual financial statements. This applies to meet-ings, telephone conversations or other means of communication.
AnalystsA list of brokers and financial analysts that actively follow KONE’s development is available in the Investors section on the company’s website at www.kone.com.
Contact information
Ms Katri SaarenheimoDirector, Investor RelationsTel. +358 (0)204 75 [email protected]
Des
ign
Zee
land
Fam
ily, p
rintin
g Pa
inot
alo
Plus
Dig
ital,
Porv
oo
KONE 2015 Financial Statements | Investor relations
72
KONE Corporation
Head OfficeKartanontie 1P.O. Box 8FI-00331 HelsinkiFinlandTel. +358 (0)204 751Fax +358 (0)204 75 4309
Corporate OfficesKeilasatama 3P.O. Box 7FI-02150 EspooFinlandTel. +358 (0)204 751Fax +358 (0)204 75 4496
www.kone.com