Embed Size (px)
Citation preview

CHAPTER 1
INTRODUCTION
1

Chapter I
1.1 Introduction to Portfolio Investment
1.2 Methodology
1.3 Objectives of the Project Report
1.4 Limitations of the Project report
1.5 Scope of the project report.
2
1.1 INTRODUCTION
Portfolio
Well, this is one avenue of finance where there is so much ambiguity about its
existence with various fund or portfolio managers. An individual can have a number of
portfolios built up through various managers; all viable. This is the beauty of portfolios. Thus
it is defined as
“Collection of investments held by individual or institution”.
A portfolio could be build up by investment analysis which is very common with most
institutions, whilst an individual will consult a financial advisor or financial institution which
offers portfolio management services. The whole idea is to diversify your investments so as
minimize risk and maximize returns. Portfolio can include following assets:
Stocks
Bonds
Options
Warrants
Gold certificates
Real estate
Futures contracts
Production facility etc.
One of the secrets to successful long-term investing is portfolio investing, or diversification.
These are big words to use with your friends (or your financial adviser), but they're big words
which simply mean "not putting all your eggs in one basket".
There are two primary reasons for portfolio investing or diversification:
1. Protecting your capital, and
2. Ensuring you're able to maximize your return and minimize your risk.
3
Most savings association uses a team approach when engaging in portfolio management
service. The two key players in portfolio management are:
1) Account portfolio manager
2) Account administrator
The portfolio manager is responsible for the account investments. In fulfilling this
responsibility, the portfolio manager must choose investments that are suitable for the
account. In making these choices, the portfolio manager keeps in mind the investment
management objective for the account while operating within defined risk parameters. In
order to achieve the identified objectives, each account’s needs should be defined as
specifically as possible. These needs and the account objectives are generally identified by
the account administrator. Once the needs have been established and the account objectives
identified, the portfolio manager can then design a portfolio that will achieve the desired rate
of return, keeping within an acceptable level of risk.
Determining Account Objectives
The account administrator must determine the objectives of the account. This can be
accomplished through a combination of discussions with the settlor and other interested
parties, as well as a review of the governing account instrument. In order to establish the
account objectives, the account administrator must first determine the specific income
requirements and needs of the account and/or the beneficiaries.
The account administrator must carefully consider the amount of income that the
beneficiaries need from the account. Although guidance for a specific amount may be found
in the governing instrument, most instruments simply provide that the beneficiaries should
receive income sufficient to maintain a standard of living to which they have grown
accustomed or that sufficient income be generated to meet the ascertainable standards of
health, education, maintenance and support. In order to determine this amount, the account
administrator must be aware of the beneficiary’s current financial condition, including the
beneficiary’s current and future expenses as well as income from other sources. Also
4
important in determining the income requirements are the interests of the remainder
beneficiaries in preserving and increasing the principal of the account. All this information
must be weighted together and certain conclusions reached which is then passed on to the
portfolio manager to devise an investment strategy that meets the needs of the account.
Designing the Portfolio
In designing a mix of assets for an account, the portfolio manager must consider the
timing of probable distributions from the account. For example, if the account beneficiary is
elderly or disabled, then the portfolio should contain enough liquid assets to meet expected
medical expenses.
It may be in the best interest of a beneficiary to minimize income, estate and generation-
skipping taxes and the portfolio manager should design a portfolio accordingly. For example,
tax-sheltered investments such as municipal bonds may be more appropriate for an account
whose beneficiaries are in a high tax bracket, other considerations being equal. Although the
tax consequences of retaining, purchasing and selling investments should not be the primary
determinant for investment decisions, the tax consequences of such actions may be
significant and the portfolio manager should be aware of such effects.
Investment objectives should, to the extent possible, be related to the age of the
beneficiaries and the expected duration of the account. Establishing long-term investment
goals for fiduciary accounts, which terminate within a relatively short period, would be
inappropriate. For example, an account that will remain in existence through several levels of
beneficiaries (spouse, children, grandchildren) should ordinarily have different investment
objectives than an account that will terminate within a short period of time.
There are various investment strategies that may be utilized by a portfolio manager to
achieve the objectives of an account. If the account’s objective is to minimize risk, then a
conservative strategy will provide stability of income and principal and will also allow as
5

much opportunity for appreciation as it is consistent with that objective. If the objective is to
provide large financial returns to the account, then a more aggressive strategy will provide
higher yields or principal appreciation; however, this strategy requires a greater degree of risk
and wider tolerance for losses to achieve the objective. Attainment of these or other
objectives can in most cases be best achieved by adopting specific investment vehicles or an
appropriate mix of those vehicles. The portfolio manager should carefully document the
decision-making process to show how the chosen investment strategy will achieve the stated
goals of the trust account.
Next, the portfolio manager must implement the investment strategy. The
implementation should correspond closely to the initial review of assets required by 12 CFR
§550.210, one purpose of which is to compare assets used to fund the trust or received from a
prior trustee for suitability and compatibility with the needs of the account. Assuming some
restructuring of the portfolio is necessary; the portfolio manager should develop and
implement a systematic program for retaining assets, purchasing appropriate assets and/or
disposing of assets that are unsuitable for achieving the investment objectives. This
restructuring may involve an extended time period so as to avoid sharp initial losses, take
advantage of market timing or avoid adverse tax consequences, such as large capital gains.
Documentation of the decision-making regarding the restructuring process is a good risk
management practice.
ASSET CLASSES
The asset classes considered in this report are more on generalization per say rather
than specific consideration. These are classes which would be considered worth investing for
any type of corpus as well as type of client such as
Aggressive
Moderate
6
Defensive
1.2 METHODOLOGYThe methodology followed consists of
Primary research
Secondary research
Primary research basically involves two types of survey:
1) Investor survey
2) Industry opinion
Apart from this I have taken advice from:
Mr. RAJ BANDARI, DIRECTOR – HEAD DEALINGS, NETWORTH
STOCK BROKING Ltd.
Mr. SANDEEP BAID, SENIOR FUND ACCOUNTANT, FRANKLINN
TEMPLETON
Mrs. RESHMA DIAZ, MCX ANALYST.
Mr. PURNANAND, SUB-BROKER, MAN FINANCIALS LTD.
Mr. MUKESH GUPTA, PORTFOLIO EXPERT.
Mr. SAURABH CHAKRABORTY, PORTFOLIO MANAGER
Mr. GAUTAM TAURANI, PORTFOLIO MANAGER, JPMORGAN
7
1.3Objectives of the Project Report
The basic idea of the report is to communicate the basis on which portfolio is built
considering various factors such as;
risk appetite,
desired returns,
key players involved behind constructing a portfolio, market fluctuations,
calculation of returns and finally zeroing on the optimum portfolio.
Some of the major objectives of the project report as follows:-
Identification of various investment vehicles available to the investors.
Identification of factors determining appropriate asset class/vehicle.
Determining appropriate investment strategy with respect to Risk and Return.
Construction of optimum Portfolio’s with respect to various types of Investors/clients.
(Aggressive, Moderate & Defensive)
Since Equity investments are considered to be one the most widely used investment
alternative available to the investors, my project report mainly focuses on Equity investments
(in constructing portfolio’s) apart from theoretical explanation of various investment options
available to the investors. However in our Portfolio due to the high risk free rates, the
investments are diversified in to equities across sectors.
8
1.4 Limitations of Project Report
The study has certain limitation/constraints which have led to the obstruction, of widening the
scope and objectives of the study.
Limited industries are only covered in the study.
The analysis is based on selective technical tools.
Only equity investments are considered for portfolio construction
The risk and return of scrip’s selected are analyzed as per BSE indexes only.
1.5 Scope of the Investment
As financial markets become more sophisticated and complex, investors need a financial
intermediary who provides the required knowledge and professional expertise on successful
investing. Portfolio management services are emerging as the favorite investment vehicle, it
is because of many advantages it has over other forms and avenues of investing, particularly
for the investor who has limited resources available in terms of capital and ability to carry out
detailed research and market monitoring. The following are the major advantages of portfolio
investment:
Portfolio diversification
Professional management
Reduction/diversification of risk
Reduction of transaction costs
Liquidity
Convenience and flexibility
Safety
9

Tailor made portfolio’s…etc
CHAPTER 2
REVIEW OF LITERATURE
10
LITERATURE REVIEW
REVIEW 1 :
Investing in Private Equity Funds: A Survey
Ludovic Phalippou
University of Oxford - Said Business School; University of Oxford - Oxford-
Man Institute of Quantitative Finance
Abstract:
This literature review covers the issues faced by private equity fund investors. It shows what
has currently been established in the literature and what has yet to be investigated. In
particular, it shows the many important questions to be answered by future research. The
survey shows that the average investor has obtained poor returns from investments in private
equity funds, potentially because of excessive fees. Overall, investors need to gain familiarity
with actual risk, past return, and specific features of private equity funds. Increased
familiarity will improve the sustainability of this industry that plays such a central role in the
economy.
REVIEW 2 :
Equity investment management and benchmarking at EDHEC-Risk
Institute.
Type : EDHEC Publication
Dates :Created on January 16, 2013Under the responsibility of Frédéric Blanc-Brude,
Research Director at EDHEC Risk Institute—Asia, this chair examines the investment
characteristics of infrastructure equity investment from the point of view of
institutional investors.
11
This research chair aims to bring clarity to institutional investors and regulators about
the nature and investment profile of underlying infrastructure assets and of different
types of investment funds using infrastructure as an underlying asset. In the context of
the current shift towards alternative investment amongst institutional investors, this
work will benefit the entire investment management community and help improve
asset allocation and portfolio construction decisions.
This research will follow three directions concurrently. First, by helping the
investment management industry to better appreciate the financial economics and
investment characteristics of underlying infrastructure investments, be they
standalone projects or integrated utilities, we aim to contribute to improved
investment vehicle design by intermediaries and to enhanced usage of infrastructure
equity in long-term asset allocation decisions.
Second, in the context of the regulatory changes affecting long-term investors, we aim
to develop theoretical insights allowing for finer risk assessment and valuation of
infrastructure equity. The objective is to assist institutional investors in the design,
calibration and update of internal models that adequately account for the specificities
of equity infrastructure investment when determining risk-based solvency and capital
requirements.
Finally, we aim to discuss the bases for a cash flow-reporting standard with the
industry and engage in a wide-ranging effort to collect new data from investors in
infrastructure equity, and work towards the development of meaningful and useful
performance and risk benchmarks.
This foundation paper starts from the empirical observation that infrastructure
investing has not proven straightforward for institutional investors and that investment
performance has so far seemed out of sync with their expectations. It makes two
important contributions to the approach of infrastructure equity investment: firstly,
using fundamental results and insights from economics and corporate finance, it
shows that underlying infrastructure equity investments are not real assets as is
sometimes argued, but financial assets representing rights to contractually determined
cash flows. Secondly, it reviews the past decade of academic research on investment
12
vehicles using infrastructure equity as an underlying and shows that the infrastructure
equity beta has so far remained elusive and that passive investment solutions remain
to be built. This research chair is dedicated to promoting research supporting such
developments.
REVIEW 3 :
Private Equity Fund Investing
Author info.
Filip Wijkström
Associate Professor
Director of Research
Stockholm School of Economics
Carin Holmquist
Professor
Director of Center for Entrepreneurship
and Business Creation
Stockholm School of Economics
AbstractPrivate equity investing (PE) has experienced a rapid growth on a global scale over the
past several decades and has become a significant industry. But while scholars have
devoted considerable effort to studying the area of risk capital investing into
businesses, research about private equity as an asset class is surprisingly scarce. The
aim of the dissertation is to address this gap by enhancing the understanding of PE
13

fund investing in general, and specifically about how heterogeneity in investor-specific
characteristics and entry order strategies may impact performance.
Outside of the PE literature, the major theoretical framework for the dissertation
has been derived from the entry order streams of research. By cross-fertilizing theories
about first mover advantages (FMA) with ideas stemming from the imitation literature,
a developed research model and thereby a richer set of tools to theoretically explain
entry order behaviors and outcomes in environments less prevalent for existing FMA
research has been developed.
The strategy pursued to achieve the dissertation’s objectives was to apply both
inductive and deductive research approaches. In order to provide a rich and
comprehensive understanding of private equity as an asset class, a qualitative study was
undertaken based on in-depth interviews with institutional PE fund investors. In
addition, in order to facilitate a thorough investigation of the links between
organizational characteristics, entry order and performance, a quantitative study was
also carried out. Hypotheses were tested through the statistical analysis of unique data
covering all PE funds raised in Sweden between 1983 and 2003, collected within the
frame for this dissertation.
Based on a comprehensive set of interviews with PE fund investors, in-depth
insights about variances in motives for investing in the asset class, ways of working,
and investment strategies were acquired. One of the more interesting findings from
this study is that there seem to be two significantly divergent investment strategies that
lead to satisfactory performances when investing in PE funds: (i) to be a devoted,
highly skilled and independent investor, or (ii) to copy the behaviors and decisions of
other investors who are perceived as having high skills and thus have attained
prominence in the market. This, in turn, suggests that organization-specific
characteristics determine which strategy will be the optimal choice for a certain
investor.
REVIEW 4 :
The Relevance of Index Funds for Pension Investment in Equities
14
Aurthor info.
Ajay Shah and Kshama Fernandes
AbstractThe rise of index funds has been one of the most remarkable phenomena in the fund
industry over the past 25 years. The traditional rationale for the success of index funds is
based
on market efficiency, net of transaction costs. In addition, we focus on the role played by
agency
conflicts between fund managers and investors, which are hard to resolve given the low
power of
statistical tests of performance.
Most of the empirical evidence about the superiority of index funds is from the United
States. We discuss issues in the application of index funds in developing countries, and the
policy issues in the financial sector that impact on the enabling market infrastructure for
index
funds. Finally, we apply these ideas to thinking about the relevance of index funds in pension
investment.
REVIEW 5:
Social Security Investment in Equities I: Linear Case
Peter Diamond, Jean Geanakoplos
NBER Working Paper No. 7103
Issued in April 1999
NBER Program(s): EFG
Social Security trust fund portfolio diversification to include some equities
reduces the equity premium by raising the safe real interest rate. This requires
15
changes in taxes. Under the hypothesis of constant marginal returns to risky
investments, trust fund diversification lowers the price of land, increases
aggregate investment, and raises the sum of household utilities, suitably
weighted. It makes workers who do not own equities on their own better off,
though it may hurt some others since changed taxes and asset values redistribute
wealth across contemporaneous households and across generations. In our
companion paper we reconsider the effects of diversification when there are
decreasing marginal returns to safe and risky investment. Our analysis uses a
two-period overlapping generations general equilibrium model with two types of
agents, savers and workers who do not save. The latter represent approximately
half of all workers who hold no equities whatsoever.
REVIEW 6 :
Information costs and home bias: an analysis of US holdings of foreign
equities
Alan G Ahearne ,
William L Griever ,
Francis E Warnock
Division of International Finance, Board of Governors of the Federal
Reserve System, Stop 42A, 20th and C Streets NW, Washington, DC
20551, USA
Abstract
We test extant hypotheses of the home bias in equity holdings using high quality cross-border
holdings data and quantitative measures of barriers to international investment. The effects of
16
direct barriers to international investment, when statistically significant, are not economically
meaningful. More important are information asymmetries that owe to the poor quality and
low credibility of financial information in many countries. While a direct measure of
information costs is not available, some foreign firms have reduced these costs by publicly
listing their securities in the United States, where investor protection regulations elicit
standardized, credible financial information. A proxy for the reduction in information
asymmetries—the portion of a country’s market that has a public US listing—is a major
determinant of a country’s weight in US investors’ portfolios. Foreign countries whose firms
do not alleviate information costs by opting into the US regulatory environment are more
severely underweighted in US equity portfolios.
REVIEW 7 :
U.S. Equity Investment in Emerging Stock Markets
1. Linda L. Tesar and
2. Ingrid M. Werner
Abstract
This article examines U.S. equity flows to emerging stock markets from 1978 to 1991 and
draws three main conclusions. First, despite the recent increase in U.S. equity investment in
emerging stock markets, the U.S. portfolio remains strongly biased toward domestic equities.
Second, of the fraction of the U.S. portfolio that is allocated to foreign equity investment, the
share invested in emerging stock markets is roughly proportional to the share of the emerging
stock markets in the global market capitalization value. Third, the volatility of U.S.
transactions in emerging-market equities is higher than in other foreign equities. The
normalized volatility of U.S. transactions appears to be falling over time, however, and we
find no relation between the volume of U.S. transactions in foreign equity and local turnover
rates or volatility of stock returns.
17
REVIEW 8 :
An Information Based Explanation of the Domestic Bias in International Equity
Investment
Thomas Gehrig
The Scandinavian Journal of Economics
Vol. 95, No. 1 (Mar., 1993), pp. 97-109
The Scandinavian Journal of Economics © 1993
Abstract:
The domestic bias in international equity investment presents a major challenge to asset
pricing models building on the assumption of symmetrically informed investors. Some
further evidence on the home bias is provided and the question of why foreign exchange risk
or capital controls are not sufficient to explain the full effect is discussed. A simple noisy
rational expectations model is introduced where, even in equilibrium, investors remain
incompletely informed. It is shown that the domestic bias arises quite naturally when
investors are on average better informed about domestic stocks
Chapter II
2.1 Types of portfolio
2.2 Asset Classes
2.3 Equity
2.3 Concept of Risk and Returns
18

2.1 TYPES OF PORTFOLIO
To add a broader perspective to portfolio investment we have considered 3 types of
investors:
1) Aggressive: The type of portfolio constructed for an aggressive investor would
include majority of its investments into equities as shown.
2) Moderate: This type of portfolio would see a striking balance of investments between
equities, mutual funds, gold etc.
3) Defensive: This type of portfolio will have a stable return with minimum risk
involved with most of the investments in fix deposit’s (FD’s), bonds etc, however in
our portfolio due to the high risk free rates, the investments are diversified into
equities across sectors.
We have also designed an ideal portfolio according to our analysis and the industry feedback
that we received after the surveys and interviews. The ideal portfolio is modeled on the
aggressive portfolio due to high rewards and sustainable risk.
The basic idea of the report is to communicate the basis on which portfolio is built
considering various factors such as; risk appetite, desired returns, key players involved
behind constructing a portfolio, market fluctuations, calculation of returns and finally zeroing
on the optimum portfolio. Thus there are 4 portfolios been designed and the last portfolio is
the ideal one according to the analysis, surveys and industry opinion.
2.2 ASSET CLASSES
19
Investors can sell their mutual fund on any business day and receive the current market
value on their investments within a short period of time (within 3 to 5 days).
Affordability
The minimum initial investment for a mutual fund is fairly low for most of the
funds (as low as Rs. 500 for some schemes). Mutual funds are liable to special set of
regulatory, accounting and tax rules. Unlike most other types of business entities, they are
not taxed on their income as long as they distribute substantially all of it to their
shareholders. Also the type of income they earn is often unchanged as it passes through to
the shareholders. Mutual fund distributions of tax-free municipal bond income are also
tax-free to the shareholder. Taxable distributions can be either ordinary income or capital
gains, depending on how the fund earned those distributions.
NET ASSET VALUE
The net asset value or NAV, is the current market value of fund’s holdings, usually
expressed as per-share amount. For most funds the NAV is determined daily, after the close
of trading on some specific financial exchange. This is not a thumb rule to be followed. Some
funds update it multiple times days during the trading day. In case of open-end funds the
shares are sold and redeemed at NAV so the orders are processed only after the NAV is
determined. Close end-funds may trade at a price a higher or lower than the NAV; this i
Plans
Fixed income plans (FMPS).
Gold exchange traded funds.
Systematic investment plans (SIP).
2.2.3 EQUITY
Stock market can be viewed as a market for trading of company stock and derivatives of
the same. Both these securities are listed on stock exchange as well as those only traded
privately.
Equity investment
This generally refers to buying and selling or of holding of shares of stock market. This
activity could be carried out by individuals as well as firms and funds in anticipation of
income from dividends capital gain as the value of stock rises.
20
When the investment is in infant companies, it is referred to as venture capital investing
and is generally understood to be higher risk than investment in listed going-concern
situations.
Direct holdings and pooled funds
The equities held by private individuals are often held via mutual funds or other forms
of pooled investment vehicle, many of which have quoted prices that are listed in financial
newspapers and magazine. The mutual funds are typically managed by prominent fund
management firms (e.g. Fidelity or Vanguard)
Pros
Access to professional investor skills and obtaining diversification of holdings.
Regular written reports.
Dividend payments.
Cons
Fees payable to the manager at entry, annually and exit.
Over diversify.
2.3 THE CONCEPT OF RISK & RETURNS
The primary objective of any investor is to maximize his returns and
minimize his risk from his investments, subject to various constraints, of course.
Return is a kind of motivation, inspiring the investor in the form of rewards, for undertaking
the investment. The importance of returns in any investment decision can be traced to the
following factors:
It enables investors to compare alternative investments in terms of what they have to offer
the investor.
Measurement of historical returns enables the investors to assess how well they have
done.
Measurement of past returns also helps in estimation of future returns.
This reveals that there are 2 types of returns:
1) Realized or Historical returns
2) Expected returns.
21
Realized Return:
This is ex-post (after the fact) return, or return that was or could have been
earned. For example, a deposit of Rs. 1000/- in a bank on Jan 1, at a stated annual interest
rate of 10% will be worth Rs 1,100 exactly a yr later. The historical or realized return in
this case is 10%.
Expected return:
This is the return from an asset that investor anticipate or expect to earn
over some future period. The expected return is subject to uncertainty or risk and may
or may not occur. The investor compensates for the uncertainty in returns and the
timing of those returns by requiring an expected return is sufficiently high to offset
the risk or uncertainty.
Components of Return
What constitutes the return on any investment? Return is basically made up of 2
components:
The periodic cash receipts or income on the investment in the form of interest, dividends,
etc. The term yield is often used in connection with this component of return. Yield refers
to the income derived from a security in relation to its price, usually its purchase price.
For example, the yield on a 10% bond at a purchase price of Rs. 900 is 11.11%.
The appreciation (depreciation) in price of the asset is referred to as capital gain (loss).
This is the difference between the purchase price and the price at which the asset can be
sold.Many investors have capital gains as their primary objective and expect this
component to be larger than the income component.
22
2.3.1 MEASURING THE RATE OF RETURN
The rate of return is the total return the investor receives during the holding period stated as a
percentage of the purchase price of the investment at the beginning of the holding period. In
other words, it is the income from the security in the form of cash flows and the difference in
price of the security between the holding periods expressed as
percentage of purchase price of the security at the beginning of the holding period.
The general equation for calculating the rate of return is shown below:
k = Dt + (Pt - Pt-1)
Pt-1
Where, k = Rate of return
Pt = Price of the security at time‘t’ i.e. at the end of the holding
Period.
Pt-1 = Price of the security at time ‘t-1’ i.e. at the beginning of the
Holding period or purchase price.
Dt = Income or cash flows receivable from the security at time‘t’.
Rate of return are usually stated at an annual percentage rate to allow comparison of returns
between securities. Let us first look at the calculation of rate of return of an equity stock then
a bond.
STOCK’S RATE OF RETURN
What are 2 components of return from shares? The first component “Dt” is the
income in cash from dividends and the second component is the price change (appreciation
and depreciation).
Illustration 1: If a share of ACC is purchased for Rs. 3,850 on FEB 8 of last yr and
sold for Rs, 3800 on FEB 9 of this yr and the company paid a dividend of Rs.35 for the yr,
how do we calculate the rate of return?
k = 35 + ( 3800-3580) / 3580 = 7.12%
23
RATE OF RETURN OF BOND
In the case of bonds, instead of dividends, the investor is entitled to payments of
interest annually or semi-annually, based on the coupon rate. The investor also benefits if
there is an appreciation on the price of the bond.
Probabilities and Rates of Return:
What are probabilities? A probability is a number that describes the chances of an
event taking place. Probabilities are governed by 5 rules and range from 0 to 1.
A probability can never be larger than 1. In other words maximum probability of an event
taking place is 100%.
The sum total of probabilities must be equal to 1.
A probability can never be a negative number.
If an outcome is certain to occur, it is assigned a probability of 1, while impossible
outcomes are assigned a probability of 0.
The possible outcomes must be mutually exclusive and collectively exhaustive.
How does probability affect the rate of return? In a world of uncertainty, the expected return
may or may materialize. In such situation, the expected rate of return for any asset is the
weighted average rate of return using the probability of each rate of return as the weight. The
expected rate of return ‘k’ is calculated by summing the products of rates of return and their
respective probabilities. This can be mathematically stated as follows:
n
k =∑ Pi ki
i=1
Where, k= Expected rate of return.
Pi = probability associated with the ith possible outcome.
ki = rate of return from the ith possible outcome.
n = number of possible outcomes
24
RISK
Risk and return go hand in hand in investments and finance. One cannot talk about
returns without talking about risk, because, investments decisions always involve a trade-off
between risk and return. Risk can be defined as “the chance that the actual outcome from an
investment will differ from the experienced outcome”. This means that, the more variable the
possible outcomes that can occur, the greater the risk.
RISK AND EXPECTED RATE OF RETURN
The width of a probability of rates of return is a measure of risk. The wider the
probability distribution, the greater is the risk or greater the variability of return the greater
the variance.
SOURCES OF RISK
What are the various sources of risk? What are the factors which make any financial
asset risky? Let us look at some of general sources of risk.
Interest rate risk : It is the variability in a security’s return resulting from changes in the
level of interest rates. Other things being equal, security prices move inversely to the
interest rates. The reason for this is related to the valuation of securities. This risk affects
bondholders more directly than equity investors.
Market risk: Market risk refers to the variability of returns due to the influence and
fluctuations in securities market. All securities are exposed to market risk but equity
shares get the most affected. The risk includes a wide range of factors exogenous to
securities themselves like expressions, wars, politics, etc
Inflation risk: With the rise in inflation there is reduction of purchasing power , hence
this is also referred to as purchasing power risk and affects all securities. This risk is also
directly related to interest rate risk, as interest rates go up with inflation.
Business risk: This refers to the risk of doing business in particular industry or
environment and it gets transferred to the investors who invest in the business or
company.
Financial risk: Financial risk arises when companies resort to financial leverage or the
use of debt financing. The more the company resorts to debt financing, the greater is the
financial risk.
25
Liquidity risk: This risk is associated with the secondary market in which the particular
security is traded. A security which can be bought or sold quickly without significant
price concessions is considered liquid. The greater the uncertainty about the time element
and the price concession, the, greater the liquidity risk. Securities which have ready
markets like treasury bills have lesser liquidity risk.
MEASUREMENT OF TOTAL RISK
Risk is associated with the dispersion in the likely outcomes. Dispersion refers to
variability. If an asset’s returns have no variability, it has no risk. An investor analyzing
series of returns on an investment over a period of years needs to know something about the
variability of its returns or in other words the asset’s total risk. There are different ways to
measure variability of returns.
The range of the returns, i.e. the difference ways between the highest possible rate
of return and the lowest possible rate of return is one measure, but range is based on only 2
extreme values.
The variance of an asset’s rate can be found as the sum of the squared deviation of
each possible rate of return from the expected rate of return multiplied by the probability that
the rate of return occurs.
VAR (k) = ∑i=1 to n Pi (ki – k )2
Where, VAR(k) = Variance of returns
Pi = Probability associated with the ith possible outcome
ki = rate of return from ith possible outcome.
k = expected rate of return
n = number of years.
A third and most popular way of measuring variability of returns is standard deviation.
The standard deviation denoted by sigma is simply the square root of variance of the rates of
return
Sigma = √VAR (k) = [ ∑i=1 to n Pi (ki – k)2]1/2The standard deviation and variance are
conceptually equivalent quantitative measures of total risk. Standard deviation is preferred to
range because of the following advantages.
Unlike the range, standard deviation considers every possible event and assigns each a
weight equal to its probability.
26
Standard deviation is a very familiar concept and many calculators and computers are
programmed to calculate it.
Standard deviation is a measure of dispersion around the expected value. This is in
absolute consensus with the definition of risk as “variability of returns”.
Standard deviation is obtained as the square root of squared differences multiplied by
their probabilities. This facilitates comparison of risk as measured by standard deviation
and expected returns as both are measured in the same costs. This is why standard
deviation is preferred to variance as a measure of risk.
DIVERSIFIABLE AND NON-DIVERSIFIABLE RISK
The fact returns on stocks do not move in perfect tandem means that risk can be
reduced by diversification. But the fact that there is some positive correlation means that in
practice risk can never be reduced to zero. So, there is a limit on the amount of risk that can
be reduced through diversification. This can be traced to 2 major reasons.
Degree of correlation
The amount of risk reduction depends on the degree of positive correlation between
stocks. The lower the degree of positive correlation, the greater is the amount of risk
reduction that is possible.
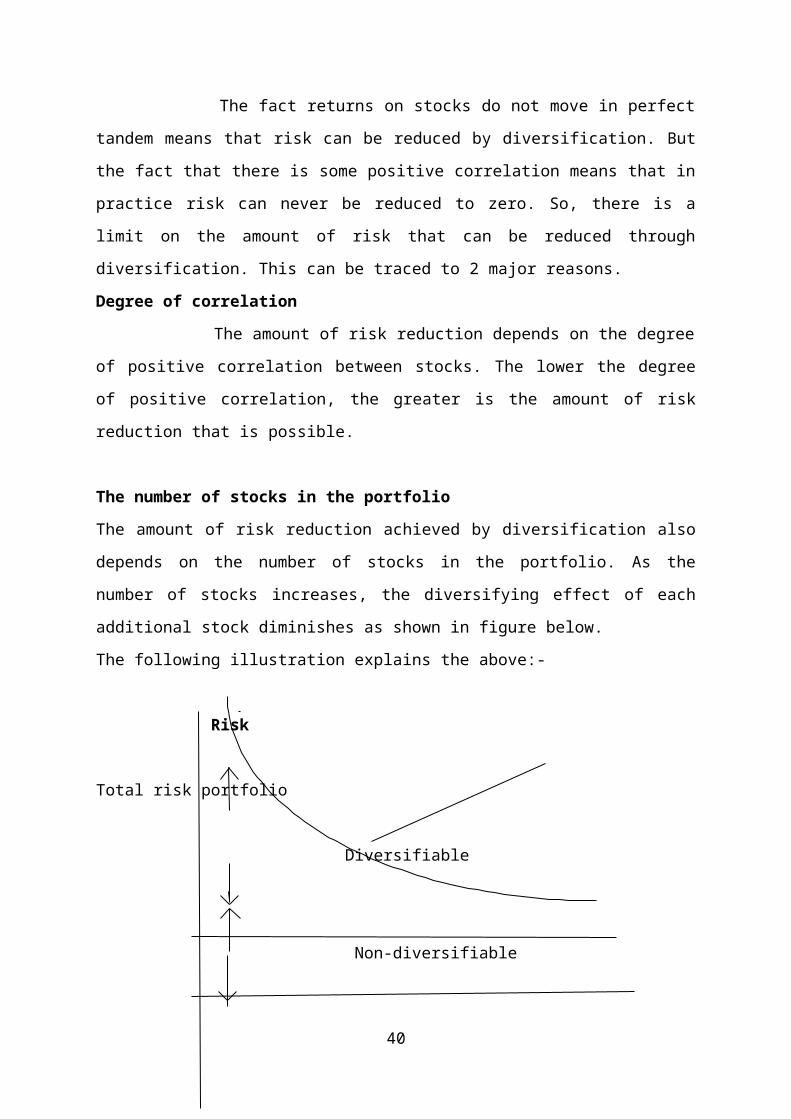
The number of stocks in the portfolio
The amount of risk reduction achieved by diversification also depends on the number of
stocks in the portfolio. As the number of stocks increases, the diversifying effect of each
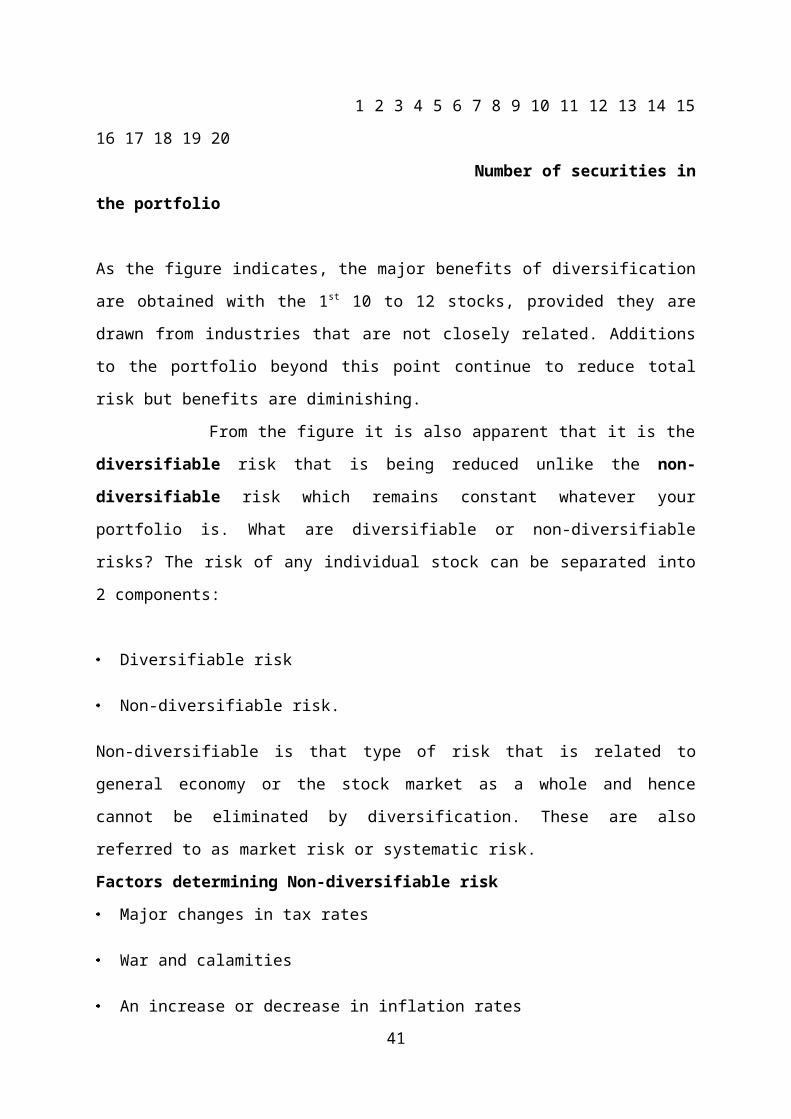
additional stock diminishes as shown in figure below.
The following illustration explains the above:-
Risk
Total risk portfolio
Diversifiable
Non-diversifiable
27
1 2 3 4 5 6 7 8 9 10 11 12 13 14 15 16 17 18 19 20
Number of securities in the portfolio
As the figure indicates, the major benefits of diversification are obtained with the 1st 10 to 12
stocks, provided they are drawn from industries that are not closely related. Additions to the
portfolio beyond this point continue to reduce total risk but benefits are diminishing.
From the figure it is also apparent that it is the diversifiable risk that is being reduced
unlike the non-diversifiable risk which remains constant whatever your portfolio is. What
are diversifiable or non-diversifiable risks? The risk of any individual stock can be separated
into 2 components:
Diversifiable risk
Non-diversifiable risk.
Non-diversifiable is that type of risk that is related to general economy or the stock market as
a whole and hence cannot be eliminated by diversification. These are also referred to as
market risk or systematic risk.
Factors determining Non-diversifiable risk
Major changes in tax rates
War and calamities
An increase or decrease in inflation rates
A change in economic policy
Industrial recession
An increase in international oil prices, etc.
Factors determining Diversifiable risk
Company strike
Bankruptcy of a major supplier
Death of a key company officer
Unexpected entry of new competitor into the market etc.
28
.
CHAPTER 3 29
INDUSTRY PROFILE
COMPANY PROFILE
3.1 INDUSTRY PROFILE
Stock Market Basics:-
Understanding the stock market starts with a basic understanding stocks. A stock represents
partial ownership of a company – the smallest share possible. Company's issues stocks to
raise capital and investors who buy stock are actually buying a portion of the company.
Ownership, even a small share, gives investors rights to a say in how the company is run and
a share in the profits (if any). While stocks give owners certain rights, they do not carry
obligation in case the company defaults or faces a lawsuit. In a worst-case scenario the stock
will become worthless but that is the limit to the investor's liability.
Companies issue stocks to raise capital. They may need a cash injection to expand or to
30
acquire new properties. Each stock issue is limited to a certain number of shares, and when
they are issued they are given a par value. The market quickly adjusts that par value
according the perceived health of the company and its potential for growth.
Investors usually buy stocks because they believe the company will continue to grow and the
value of their shares will rise accordingly. Investors who acquire stock in a new company are
taking more of a risk than buying shares of well-established companies but the potential gain
is much greater. Those who bought Microsoft shares early in the game (and did not sell them)
saw an exponential rise in their value.
Stock Market Trading:-
The phrase Stock Market Trading is commonly used to encompass both the physical
location for buying and selling (trading) stocks as well as the overall activity of the market
within a certain country. When we hear an expression such as the stock market was down
today it refers to the combined stock market trading activity of many stock exchanges i.e. the
New York Stock Exchanges (NYSE) NASDAQ etc, in the United States.
Stock Exchange is the term for the physical location where the actual activity of stock
trading/share trading or investing in stocks takes place. Most countries have many different
stock exchanges and usually a particular company's stocks are traded on only one exchange,
although large corporations may be listed in several different locations.
Stock Exchanges:-
Stock exchanges exist throughout the world. It is possible to buy or sell stocks on any of them
by having trading accounts with the various stock trading programs. You can also get stock
trading information from these exchanges. The only restriction is the opening hours of each
exchange. For example, NYSE and NASDAQ allow stock market trading operations from
9:30 a.m. to 4:00 p.m. Eastern Time from Monday to Friday. Other exchanges have similar
opening hours based on their local time. If you want to trade on the Hong Kong Stock
Exchange your order will be executed sometime between 9:30 p.m. and 4:00 a.m. New York
Time.
31
The major stock exchanges of the world are located in Japan (Tokyo Stock Exchange), India
(Bombay Stock Exchange), Europe (London Stock Exchange, Frankfurt Stock Exchange, and
SWX Swiss Exchange), the People's Republic of China (Shanghai Stock Exchange) and the
United States. The major exchanges in the US are the NYSE, NASDAQ, and Amax.
By providing a centralized, ready market for the exchange of securities, stock exchanges
greatly facilitate the financing of business through flotation of stocks and bonds. However,
speculative stock market trading can sometimes accentuate the instability of an economy.
The reality of the Great Depression was emphasized by the stock market crash in 1929.
Federal laws administered by the Securities and Exchange Commission regulate the interstate
sale of securities and certain stock exchange practices in the United States.
Stock market trading closely follows the economy of a country. When the economy is
doing well, the market is bullish. Bull markets occur during times of high economic
production, low unemployment and low inflation. Bear markets, on the other hand, follow
downtrends in the economy. When inflation and unemployment see an upturn, stock prices
start falling. Hence, to keep investments safe, savvy investors track various economic indices,
stock trading information, and stock market trends.
Fluctuations in stock prices are also driven by supply and demand, which in turn are
determined to a large extent on investor psychology. Seeing a stock rise in price may cause
investors to jump on the bandwagon and this rush to buy drives the price even faster. A
falling price can have the same effect. These are short-term fluctuations. Stock prices tend to
normalize after such runs. Hence, to predict possible upturns or downturns in the stock
markets, it becomes imperative to track and analyze stock trading information.
The stock exchange is only one of many opportunities to invest. Other popular markets
include the Foreign Exchange Market (FOREX), the Futures Market, and the Options
Market.
The FOREX is the biggest (in terms of value of trades) investment market in the world.
FOREX traders buy one currency against another and can profit from small changes in value.
32
Most FOREX trades are entered and exited in one 24-hour span, and traders have to keep a
close watch on the market in order to make profitable trades.
Futures & Options:-
The Futures Market is a market of contracts to buy and sell goods at specified prices and
times. It exists because buyers and sellers of goods wish to lock in prices for future delivery,
but market conditions can make the actual futures contract fluctuate considerably
in value. Most investors in the futures market are not interested in the actual goods - only in
the profit that can be realized in trading the contracts.
The Options Market is similar to the Futures Market in that an option is a contract that gives
you the right (but not the obligation) to trade a stock at a certain price before a specified date.
They can be traded on their own or purchased as a form of insurance against price
fluctuations within a certain time frame.
All three of these markets are quite risky and require considerable knowledge and experience
to prevent substantial losses. They also require close attention to market movements. Stock
Investments, on the other hand, are less risky because movements of the market are usually
gradual. Although short-term investment strategies are possible, most view stocks as long-
term investments. But whatever your financial objectives may be, try to track stock trading
information. This will help you in maximizing your profits and keeping your investments
safe.
Stock Trading Strategies:-
There are two basic ways to trade the stock market – shooting in the barrel or using effective
stock trading strategies to determine which stocks to buy, when to sell, and how to protect
your investment dollars. Needless to say, strategies outperform barrel shooting by a large
margin. There are, however, hundreds of stock market trading strategies to choose from. Of
33
all of these, there are a couple of tried and trued methods that have worked well for investors
over many years. The nubile investor is advised to investigate some of these basic strategies
and see for himself how they perform. New stock trading strategies can be explored once the
basic ones are well.
Hedging – A good stock market strategy:
Hedging is a one of the better stock trading strategies to follow if your objective is capital
protection. Hedging is a way of protecting an investment by reducing the risks involved in
holding a particular stock. The risk that the price of the stock will drop can be offset by
buying a put option that allows you to sell at the stock at a particular price within a certain
time frame. If the price of the stock falls, the value of the put option will increase. If you have
a broad portfolio, buying put options against individual stocks can be an expensive stock
market investing strategy to follow. A better option may be to buy a put option on the stock
market itself. This protects you against general market declines. Another way to hedge
against market declines is to sell financial futures like the S&P 500 futures.
Dogs of the Dow – Stock market trading strategies of the past:
This is a strategy that became popular during the 1990s. The idea was to buy the best-value
stocks in the Dow Industrial Average by choosing the 10 stocks that have the lowest P/E
ratios and the highest dividend yields. The companies on the Dow Index are mature
Companies that offer reliable investment performance. The idea is that the lowest 10 on the
Dow had the most potential for growth over the coming year.
A new twist on the Dogs of the Dow is the Pigs of the Dow. This stock market investing
strategy selects the worst 5 Dow stocks by looking at the percentage of price decline in the
previous year. As with the Dogs, the idea is that the Pigs stand tore bound more than the
others.
Buying on Margin – One of the Risky stock trading strategies
34

Buying on margin means to buy stocks with borrowed money – usually from your broker.
Margin gives you more return than if you were to pay the full cost outright because you
receive more stock for a lower initial investment. Margin buying can also be risky because if
the stock loses value your losses will be correspondingly greater. When buying on margin the
investor should have stop-loss orders in place to limit losses in the case of market reversal.
The amount of margin should be limited to about 10% of the value of your total account.
Dollar Cost and Value Averaging – A Good Strategies
Dollar cost averaging involves investing a fixed dollar amount on a regular basis. An
example would be buying shares of a mutual fund on a monthly basis. If the fund drops in
price the investor will receive more shares for his money. Conversely, when the price is
higher, the fixed amount will buy fewer shares. An alternative to this is value averaging. The
investor decides on a regular value he wishes to invest. For example, he may wish to invest
$100 a month in a mutual fund. When the price of the fund is high he puts a higher dollar
amount in the fund and when the price is low he spends less money. This averages out his
investment to the original $100 per month. Stock Trading Strategies like Value averaging
almost always outperforms dollar cost averaging as a percentage return on the money
invested. When used as part of a broader trading strategy, it can help secure the growth of
your investment fund.
Stock Market Indexes:-
Stock indexes are a statistical average of a particular stock exchange or sector. Indexes are
composed of stocks which have something in common – they are all part of the same
exchange; they are part of the same industry; or they represent companies of a certain size or
location.
There are many different stock indexes, the most common in the United States being the Dow
Jones Industrial Average, the NYSE Composite index, and the S&P 500 Composite Stock
35
Price Index. Stock indexes give an overall perspective about the economic health of a
particular industry or stock exchange.
There are several different ways to calculate indexes. An index based solely on the price of
stocks is called a 'price weighted index'. This type of index does not take into consideration
the importance of any particular stock or the size of the company. An index, which is 'market
value weighted', on the other hand, takes into account the size of the companies. That way,
price shifts of small companies have less influence than those of larger companies. Another
type of index is the 'market-share weighted' index. This type of index is based on the number
of shares rather than their total values.
Stock Trading Systems:-
By following a stock trading system, market condition will at times be favorable to buy and
at other times be favorable to sell. Clearly defined conditions give 'signals' that the educated
investor can read and act on. Signals are not as crucial for the long-term investor. For these
people, market conditions and the value of particular companies can be watched on a daily
basis. For day-traders, however, signals are crucial for acting quickly on stock market
movements.
Investors who treat trading as a full-time job have the time to watch the market movements
for signals. Oftentimes, however, signals can be automated and integrated into trading
software. The investor can choose which signals to be alerted about and they will
automatically appear on screen. Software signals are usually only available by subscription
and some services charge hundreds of dollars a year for a complete package. This includes
trading software and access to up-to-the-minute charts for the latest information about the
stock market.
Investors who don't have the time to watch the market closely can subscribe to services,
which publish signals on a daily or hourly basis. These stock-trading systems may employ
market analysts who may follow several indicators to arrive at a particular signal. More
commonly, however, their systems are completely automated with signals being generated by
software, which examines market conditions. Some of these services have a better track
36
record than others – it's a good idea to research them before signing up.
With any third-party signal provider it pays to know how the signals are being generated.
Since there are such a large number of market indicators some of them may contradict each
other. In addition, a particular indicator may send out conflicting signals depending on the
time frame.
Market conditions also play an important part on the accuracy of indicators. During upswings
in the market, for example, trend indicators will send out buy signals but longer-term
oscillator indicators will view the market as being overbought and send out a sell
Signal. Generally speaking, trend indicators are most accurate during trend conditions and
oscillators are best during times of transition. Both types of indicators are often in variance
with the other.
To overcome these problems, try to find a signal generator that uses at least 3 market
indicators for verification. Signals that are verified by 3 different indicators are strong and
tend to be accurate. It is also important to look at signals from varying time frames. An
upswing may simply be a short-term correction and the market may afterwards continue its
downward movement. Taking a broad view of market conditions allows you to see these
variations more clearly.
Depending on the type of stock trading system you sign up for, signals can be delivered by
email on a daily basis, available for viewing on a website, or be integrated into your trading
software so that popes appear on your screen for particular signals that you are watching.
Companies, which provide signals usually, offer their services on a monthly basis. Some are
quite expensive – as high as several hundred dollars a month. These are obviously aimed at
the professional trader but other services are also available at more reason able costs.
The value of these stock-trading systems has to be weighed by the individual investor. They
can be a great time saver but they may also encourage laziness when it comes to analyzing
the market. A knowledgeable trader should have the tools necessary to judge the
37
effectiveness of a signal system and do some of the calculations himself to keep on top of the
market.
Stock Market Prices:-
In glancing through the stock market prices listed in the newspaper one might wonder how
stocks are priced and what affects price movement? After all, there is a wide variety of prices
and some well-known companies are traded for relatively low prices while obscure listings.
To a certain extent stock market prices are determined by investor confidence but that
confidence in turn is based on real or perceived performance. Companies report their
financial status on a quarterly basis when they disclose cash flow, sales and earnings. These
hard numbers are the foundation of a company's worth, but investor speculation can
undermine or override actual financial data.
Rumors abound on the stock market, and if there is news that a company is about to make a
strategic move buyers may flock to buy that stock. As with any other market, the principal of
supply and demand applies. If there is a sudden upsurge in investor interest, the price of a
stock will rise accordingly. Conversely, fear among investors can cause a stock price to
plummet. In the long run, however, company performance and worth are the biggest factors
in determining stock prices.
Stock market prices are available from many sources. Newspapers carry market summaries of
the day's movements and online sources can provide current prices around the clock.
Stockbrokers can also provide stock market quotes– either online or by telephone in the case
of full-service brokers.
A stock market quote table in a newspaper or Internet web site is full of useful information
that can help the investor make decisions about buying or selling stocks. Being able to read a
stock table is a necessary skill for anyone interested in the stock market.
38

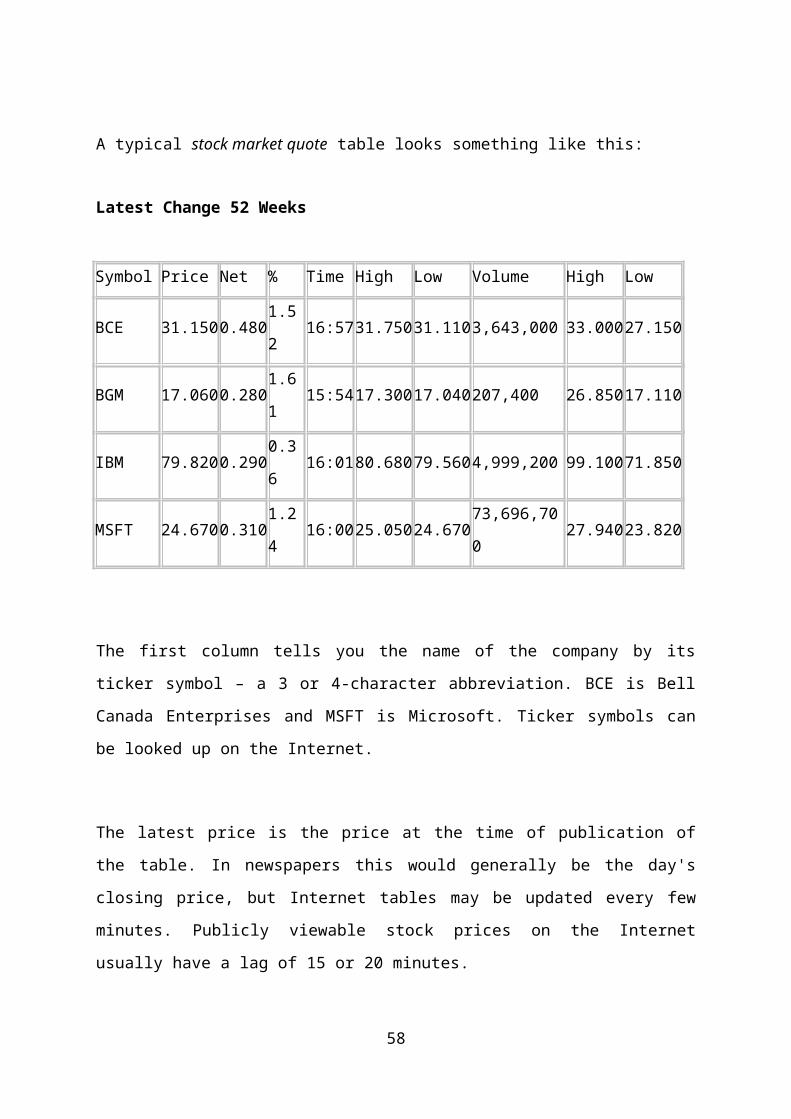
A typical stock market quote table looks something like this:
Latest Change 52 Weeks
Symbol Price Net % Time High Low Volume High Low
BCE 31.150 0.480 1.52 16:57 31.750 31.110 3,643,000 33.000 27.150
BGM 17.060 0.280 1.61 15:54 17.300 17.040 207,400 26.850 17.110
IBM 79.820 0.290 0.36 16:01 80.680 79.560 4,999,200 99.100 71.850
MSFT 24.670 0.310 1.24 16:00 25.050 24.670 73,696,700 27.940 23.820
The first column tells you the name of the company by its ticker symbol – a 3 or 4-character
abbreviation. BCE is Bell Canada Enterprises and MSFT is Microsoft. Ticker symbols can be
looked up on the Internet.
The latest price is the price at the time of publication of the table. In newspapers this would
generally be the day's closing price, but Internet tables may be updated every few minutes.
Publicly viewable stock prices on the Internet usually have a lag of 15 or 20 minutes.
Change is the difference between the previous day's closing price and the current quote. Time
shows the time of the last transaction. High, Low, and Volume all refer to the current (or last)
trading day. High is the highest price the stock sold for, Low is the lowest price, and Volume
is the number of shares that have been traded. Finally the 52-week High and Low shows you
the highest and lowest prices in the previous year.
There may be additional columns for information about Bid Price (the price a buyer is willing
to pay), Ask Price (the price a seller is willing to sell), Price/Earnings ratio (P/E – the stock
price divided by the earnings per share), Market Cap (outstanding shares multiplied by
current market price), and Dividends Per Share (the current annual dividend the company
pays)
39
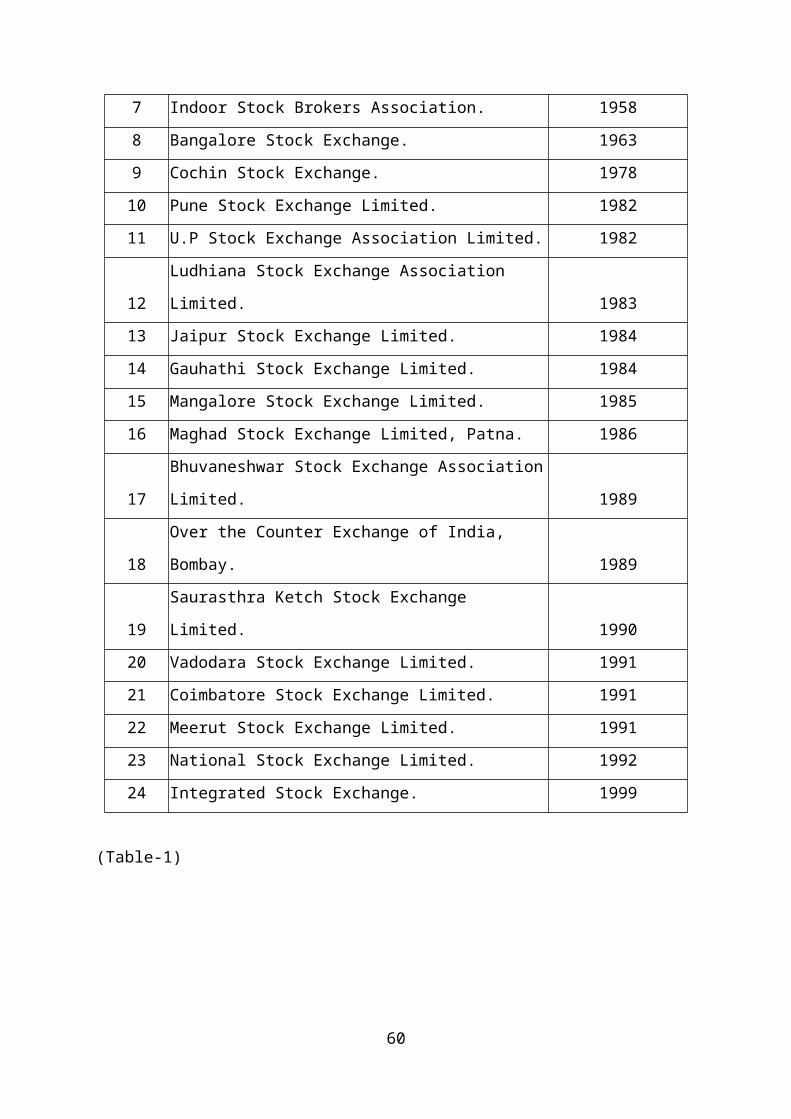
INDIAN STOCK EXCHANGES
S.No NAME OF THE STOCK EXCHANGE YEAR
1 Bombay Stock Exchange 1875
2 Hyderabad Stock Exchange. 1943
3 Ahmedabad Share and Stock Brokers Association. 1957
4 Calcutta Stock Exchange Association Limited. 1957
5 Delhi Stock Exchange Association Limited. 1957
6 Madras Stock Exchange Association Limited. 1957
7 Indoor Stock Brokers Association. 1958
8 Bangalore Stock Exchange. 1963
9 Cochin Stock Exchange. 1978
10 Pune Stock Exchange Limited. 1982
11 U.P Stock Exchange Association Limited. 1982
12 Ludhiana Stock Exchange Association Limited. 1983
13 Jaipur Stock Exchange Limited. 1984
14 Gauhathi Stock Exchange Limited. 1984
15 Mangalore Stock Exchange Limited. 1985
16 Maghad Stock Exchange Limited, Patna. 1986
17 Bhuvaneshwar Stock Exchange Association Limited. 1989
18 Over the Counter Exchange of India, Bombay. 1989
19 Saurasthra Ketch Stock Exchange Limited. 1990
20 Vadodara Stock Exchange Limited. 1991
21 Coimbatore Stock Exchange Limited. 1991
22 Meerut Stock Exchange Limited. 1991
23 National Stock Exchange Limited. 1992
24 Integrated Stock Exchange. 1999
(Table-1)
40
3.2 COMPANY PROFILE
About Networth Stock broking Ltd.
Ever since its inception in 1993, Networth Stock Broking Limited (NSBL)
has sought to provide premium financial services and information, so that the power of
investment is vested with the client. They equip those who invest with them to make
intelligent investment decisions, providing them with the flexibility to either tap company’s
extensive knowledge and expertise, or make their own decisions.
NSBL made its debut into the financial world by servicing Institutional
clients, and proved its high scalability of operations by growing exponentially over a short
period of time. Now, powered by a top-notch research team and a network of experts, they
provide an array of retail broking services across the globe - spanning India, Middle East,
Europe and America. They are a Depository participant at Central Depository Services India
(CDSL) and National Securities Depository (NSDL)
Their strong support, technology-driven operations and business units of
research, distribution and advisory coalesce to provide you with a one-stop solution to cater
to all broking and investment needs. Their customers have been participating in the booming
commodities markets with membership at the Multi Commodity Exchange of India (MCX)
and National Commodity & Derivatives Exchange (NCDEX) through Networth Stock Com
Ltd.
NSBL is a member of the National Stock Exchange of India Ltd (NSE)
and the Bombay Stock Exchange Ltd (BSE) on the Capital Market and Derivatives (Futures
& Options) segment. It is also a listed company at the BSE. Networth Stock Broking Limited
(NSBL) has sought to provide premium financial services and information
41
NETWORTH’S TEAM OF EXPERTS
Owing to the vision and expertise of their team of experts, Networth has
established itself as one of the premier financial services organization in India. Networth
professionals form the backbone of the organization, pooling together their expertise from top
financial service and broking houses.
A strong team of professionals, experienced and qualified pool of human
resources drawn from top financial service & broking houses form the back bone of their
sizeable infrastructure. Highly technology oriented, the company's scalability of operations
and the highest level of service standards has ensured rapid growth in the number of locations
& the clients serviced in a very short span of time.
Key Persons of Networth
S.P. Jain - Chairman & Managing Director
SathyanRajan - Director & Head – Sales
J. Gopalakrishnan- Vice President & Southern Region Head
Girish V Dev- Director & COO
Raj Bhandari- Director & Head – Dealing
42

Corporate overview
• Networth is a listed entity on the BSE since 1994
• The company is professionally managed with experience of over a decade in broking
and advisory services
• Networth is a member of BSE, NSE, MCX, NCDEX, AMFI, CDSL
• Current network in India with 256 branches and franchise. Presence in major metros
and cities
• Empanelled with prominent domestic Mutual Funds, Insurance Companies, Banks,
Financial Institutions and Foreign Financial Institutions.
• Strong experienced professional team
• 50000+ strong and growing client base
• Average daily broking turnover of around INR 5 billion
• AUM with Investment Advisory Services of around INR 6 billion
Infrastructure
• A corporate office and 3 divisional offices in CBD of Mumbai which houses state-of-
the-art dealing room, research wing & management and back offices.
• All of 256 branches and franchisees are fully wired and connected to hub at Corporate
office at Mumbai. Add on branches also will be wired and connected to central hub
• Web enabled connectivity and software in place for net trading.
• 200 operative ID’s for dealing room
43
• State of the Art accounting and billing system, on line risk management system in
place with 100% redundancy back up.
• In house technology back up team to ensure un-interrupted connectivity.
Products and services portfolio
• Retail and institutional broking
• Research for institutional and retail clients
• Distribution of financial products
• Corporate finance
• Net trading
• Depository services
• Commodities Broking
44
m
as
Servicesnn
v
rokilue
agete vis
45
The Networth connectivity with 256 branches and growing
Networth Research Products
• India Daily Notes – Market Insight for the day
46
107 branches
• Market Musing – What’s Hot and What’s not !!!
• Bullion Tracker – Analysis of trends in Gold & Silver
• Economy Pulse – Monthly overview of macro factors
• Company-Specific Reports – Detailed fundamental report
subsequent to plant visit & management meet
• Pre-Quarter Result Previews – Result preview of companies under
coverage
• Result Update – Post result review of companies under coverage
• Stock Stance - Management Visit Note
• Theme-Based Reports –Budget Analysis, Dividend
NSBL - Objectives of the Company:
To increase its investors all over the country
To provide better services to their clients
To maintain good relation with the clients
Increasing the profits of the company
To lead their transactions under the control Act of Securities Exchange Board of India
1992
47
NSBL - Product / Service produced:
Here the product means service relate to the company the company Brokerage
Services. Its hasspreaded across over the country with experienced and expertized in the
Brokerage services rendered by the Brokers in their Branches to their Investors.
NSBL – Market Research:
Market research is one of important Methodology for finding the problem and
make analyze and interpret and solve the problem. In every area it has sharing the
contribution towards successing the projects / problems.
In the NSBL company has also adopted this technique by Research analysts to
these brokers utilizes and understands their researches then they will moving in a right path.
The research analysts analyses the company performance and what are the company’s
stocks are moving why the company’s scrips prices are fluctuating and what are the effects
for this situations under the circumstances. Then the company successfully operating their
activities produce of good operating Results.
NSBL – Operating Results:
The Operating Results of the NSBL company is satisfactory compare to its
competitors are India Bulls, Networth Stock Broking ltd, India info line etc., They are giving
quality services to their clients and improving their retained gains. Through this they are
creating new clients through adopting different strategies for attracting the clients towards its
business then its future glorious.
NSBL – Future Outlook:
Its future will be Glorious because it has recently launches new service to
expand its business i.e., NSBL - INSURANCE it tie ups with other insurance companies like
Reliance insurance and Bajaj life insurance to gather the customers towards their company to
other insurance companies they will gain the profit like the company NSBL
planned for the future make its fruitful.
48
CHAPTER 4
DATA ANALYSIS
AND
PRESENTATION
49
Chapter IV
4.2. Survey Analysis
4.3. Asset Profile
4.3 SURVEY ANALYSIS
50
Investment Experience
0123456789
10
No experience less than 3years
3 to 6 years more than 6years
The above chart shows the breakup of the investment experience of the investors. As seen
from the graph, majority investors lie under nil experience and experience less than 3 years.
This undermines the importance of portfolio investment service to tap the market and develop
the investing habits of the people.
51
Age
63%
23%
5%
9%
less than 25
25 to 35
35 to 50
more than 50
The above graph shows the break up of the age of the people surveyed in order to understand
the age factor in planning the portfolio for the investors. The age determines a quotient in the
investment pattern in terms of the sectoral investments within the different asset classes. The
age factor is an important determinant of the stage of investment of the investor in order to
plan the portfolio of the investor. It helps to evaluate the factors such as risk appetite and
need of funds.
52
98
4
1
0
2
4
6
8
10
less than10000
10000-20000
20000-50000
morethan
50000
Monthly disposable income
Monthly disposableincome
The above graph illustrates the monthly disposable income among the respondents. As we
can observe that most of the investors fall under less than Rs.10000 while the no of
respondents under Rs. 10000-20000 is stood at 8 ( the second most). The investors whose
disposable income between Rs. 20000-50000 is less which account to 4 respondents only,
while only 1 investor disposable income is more than Rs. 50000.
53
The
above graph can be interpreted as an equal need among investors for capital appreciation as
well regular income from the investments. As you can observe from the figure above
showing an equal no; of respondents responds their objective as capital appreciation and
regular income. This shows the broader division of investors objective into two aspects as
mentioned above.
54
Investment Objective
11
11
0 2 4 6 8 10 12
Regular income
CapitalAppreciation
No.of people
Investment Objective
Withdrawal period
12
5
1
4
02468
101214
within 2 years 2-5 years 5-10 years more than 10years
Period
No. of people
Withdrawl period
This is an important indicator of the liquidity preference of the investors which helps to
determine effective portfolio construction. The above figure shows the withdrawal period of
the investors. It can be observed from the above figure that most of the investors withdraw
their savings within a short duration of 2 years (i.e. 12 respondents) and good no; of people
withdraw their savings from 2-5 years (i.e. 5 respondents). It is quite interesting to observe
that only one respondent wish to withdraw his savings from 5-10 years of span. Respondents
who have long term investment objective opted for more than 10 years as their withdrawal
period.
4.2 Asset Profile
4.2.1 ICICI Bank Ltd.
The following chart is the graphical representation of the stock performance of ICICI Bank
Ltd for the period of one year.
55
Open: Rs.575
Close: Rs.913
Low: Rs.440
High: Rs.995
Returns:
High = [(High – Open) / Open] %
Normal = [(Close – Open) / Open] %
Low = [(Low – Open) / Open] %
Probability of
occurrence (pi)
Returns (ki) (Pi x ki)
High 0.2 60% 12
Normal 0.6 42% 25.2
Low 0.2 -42% -8.4
Mean = ∑ (Pi x ki) = 28.8 %
Returns (ki)
%
(ki – K) (ki – K).(ki – K) (pi).(ki – K) (ki
– K)
56

High 60 40 1600 320
Normal 42 22 484 290.4
Low -42 -62 3844 768.8
Standard Deviation = √∑ (pi).(ki – K) (ki – K) = 37.14 %
K represents the arithmetic mean of the returns.
The probability of 20% is given to a high/low return due to the volatile nature of the
equity in comparison with mutual funds and debt instruments.
The consideration for the expected returns is based on the past realized returns and is
calculated thereof. Also, open price is the price is the price of the stock at the beginning
of the period and close is the last traded price in the period.
The second consideration is the close price which is taken for equating the normal rate of
return for the period defined.
The returns for 3 years and 5 years are calculated by annual compounding of the returns
for one year.
4.2.8 BHARAT HEAVY ELECTRICALS Ltd.
The following chart is the graphical representation of the stock performance of Bharat Heavy
Electricals Ltd for the period of one year.
Open: Rs.1950
Close: Rs.2700
High: Rs.2710
57
Low: Rs.1600
Returns:
High = [(High – Open) / Open] %
Normal = [(Close – Open) / Open] %
Low = [(Low – Open) / Open] %
Probability of
occurrence (pi)
Returns (ki) (Pi x ki)
High 0.2 40% 8
Normal 0.6 38% 22.8
Low 0.2 -17% 3.4
Mean = ∑ (Pi x ki) = 34.2 %
Returns (ki)
%
(ki – K) (ki – K).(ki – K) (pi).(ki – K) (ki
– K)
High 40 20 400 80
Normal 38 18 324 194.4
Low -17 -37 1369 273.8
Standard Deviation = √∑ (pi).(ki – K) (ki – K) = 23 %
K represents the arithmetic mean of the returns.
The probability of 20% is given to a high/low return due to the volatile nature of the
equity in comparison with mutual funds and debt instruments.
The consideration for the expected returns is based on the past realized returns and is
calculated thereof. Also, open price is the price is the price of the stock at the beginning
of the period and close is the last traded price in the period.
The second consideration is the close price which is taken for equating the normal rate of
return for the period defined.
The returns for 3 years and 5 years are calculated by annual compounding of the returns
for one year.
58

4.2.9 HDFC Ltd.
The following chart is the graphical representation of the stock performance of HDFC Ltd for
the period of one year.
Open: Rs.740
Close: Rs.1070
High: Rs.1140
Low: Rs.640
Returns:
High = [(High – Open) / Open] %
Normal = [(Close – Open) / Open] %
Low = [(Low – Open) / Open] %
Probability of
occurrence (pi)
Returns (ki) (Pi x ki)
High 0.2 54% 10.8
Normal 0.6 45% 27
Low 0.2 -13% -2.6
59
Mean = ∑ (Pi x ki) = 35.2 %
Returns (ki)
%
(ki – K) (ki – K).(ki – K) (pi).(ki – K) (ki
– K)
High 54 25 625 125
Normal 45 16 256 153.6
Low -13 -42 1764 352.8
Standard Deviation = √∑ (pi).(ki – K) (ki – K) = 25 %
K represents the arithmetic mean of the returns.
The probability of 20% is given to a high/low return due to the volatile nature of the
equity in comparison with mutual funds and debt instruments.
The consideration for the expected returns is based on the past realized returns and is
calculated thereof. Also, open price is the price is the price of the stock at the beginning
of the period and close is the last traded price in the period.
The second consideration is the close price which is taken for equating the normal rate of
return for the period defined.
The returns for 3 years and 5 years are calculated by annual compounding of the returns
for one year.
4.2.10 ABAN OFFSHORE Ltd.
The following chart is the graphical representation of the stock performance of ABAN
Offshore Ltd for the period of one year.
60
Open: Rs.1070
Close: Rs.2520
High: Rs.2605
Low: Rs.715
Returns:
High = [(High – Open) / Open] %
Normal = [(Close – Open) / Open] %
Low = [(Low – Open) / Open] %
Probability of
occurrence (pi)
Returns (ki) (Pi x ki)
High 0.2 143% 28.4
Normal 0.6 135% 81
Low 0.2 -33% -6.6
Mean = ∑ (Pi x ki) = 102.8 %
Returns (ki)
%
(ki – K) (ki – K).(ki – K) (pi).(ki – K) (ki
– K)
High 143 61 3721 744.2
Normal 135 53 2809 1685.4
Low -33 -115 13225 2645
61
Standard Deviation = √∑ (pi).(ki – K) (ki – K) = 71 %
K represents the arithmetic mean of the returns.
The probability of 20% is given to a high/low return due to the volatile nature of the
equity in comparison with mutual funds and debt instruments.
The consideration for the expected returns is based on the past realized returns and is
calculated thereof. Also, open price is the price is the price of the stock at the beginning
of the period and close is the last traded price in the period.
The second consideration is the close price which is taken for equating the normal rate of
return for the period defined.
The returns for 3 years and 5 years are calculated by annual compounding of the returns
for one year.
4.2.12 FIDELITY TAX ADVANTAGE
The following illustration gives the details of the Fidelity Tax Advantage Fund
Mutual Fund Fidelity Mutual Fund
Scheme Name Fidelity Tax Advantage Fund
Objective of SchemeTo generate long-term capital growth from a diversified portfolio
of predominantly equity and equity-related securities.
Scheme Type Open Ended
Scheme Category ELSS
Launch Date 5-Jan-2006
Indicate Load Separately Entry:For each Purchase<5 crs:2.25%;For each Purchase>=5 crs
or by an FOF or as a result of dividend reinvestment:NIL;For
62

SIP (each instalment):1.25%;For switch-in: As applicable to
each Purchase; Exit Load:NIL. No load for switches between
options of the Scheme.
Minimum Subscription
AmountRs. 500
Latest Net Asset Value
Scheme NAV NameNet Asset
Value
Repurchase
PriceSale Price Date
Fidelity Tax Advantage Fund-
Dividend Option16.620 16.620 16.994 29-Feb-2012
Fidelity Tax Advantage Fund-
Growth Option16.620 16.620 16.994 29-Feb-2012
Latest Assets Under Management (AUM Rs in Lacs)
Scheme NAV Name AUMAdjusted
AUM
Average
AUM For
The Month
As At The
End Of
Fidelity Tax Advantage Fund-
Dividend Option47111.7 47111.7 51271.62 Jan-2012
Fidelity Tax Advantage Fund-
Growth Option64586.29 64586.29 69843.2 Jan-2012
High: 35%
Normal: 12%
Low: 9%
Probability of Returns (ki) (Pi x ki)
63

occurrence (pi)
High 0.2 35 7
Normal 0.6 12 7.2
Low 0.2 9 1.8
Mean = ∑ (Pi x ki) = 16 %
Returns (ki)
%
(ki – K) (ki – K).(ki – K) (pi).(ki – K) (ki
– K)
High 35 16 256 51.2
Normal 12 -7 49 29.4
Low 9 -10 100 20
Standard Deviation = √∑ (pi).(ki – K) (ki – K) = 10 %
The returns for the funds are based on the returns recorded due to the change in the NAV
during the period of 3 months, 6 years and 1 year.
CHAPTER 5
64
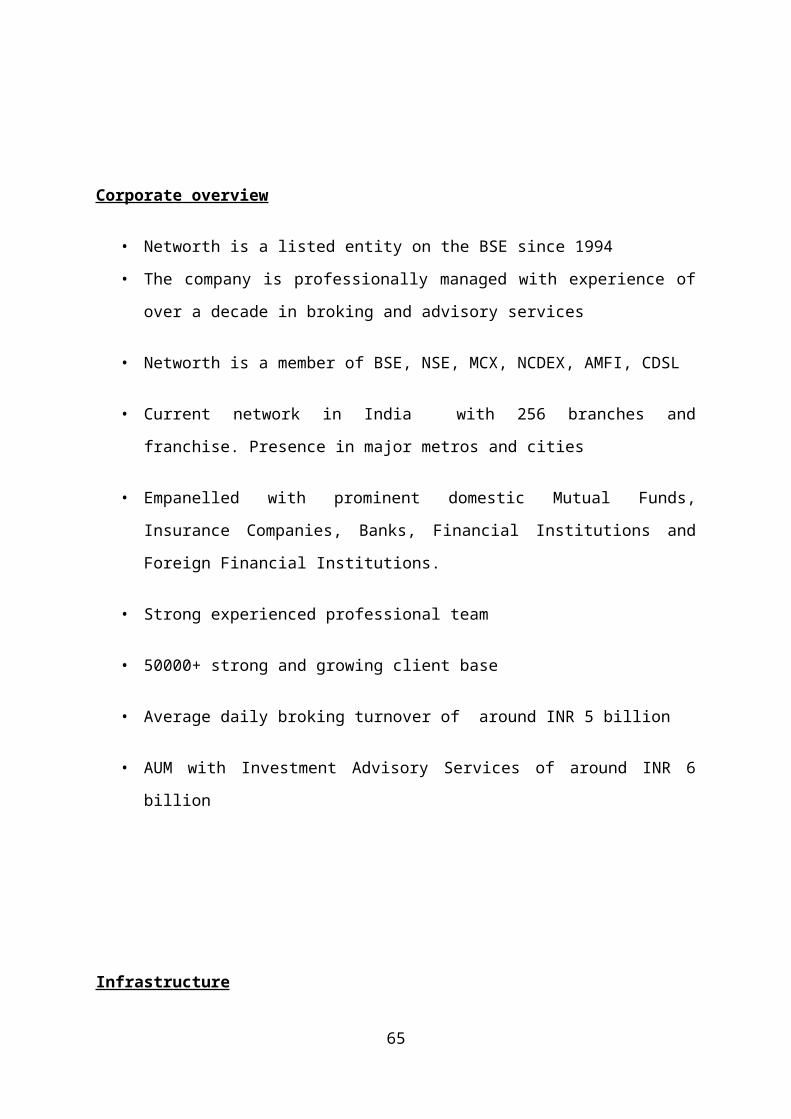
FINDINGS , SUGGESTIONS AND CONCLUSION
65

FINDINGS
The investor can recognize and analyze the risk and return of the shares by using this
analysis.
The investor who bears high risk will be getting high returns.
The investor who is having optimum portfolio will be taking optimum returns with
minimum risk.
The investor should include all securities which are under valued in their portfolio and
remove those securities that are over valued.
The investor has to maintain the portfolio of diversified sectors stocks rather than
investing in a single sector of different stocks.
People who are investing in portfolios mostly depend on the advice of their friends,
relatives, financial advisers.
People generally invest their savings in fixed deposits, recurring deposits, and
national savings certificates and government securities as they are less risky and the
returns are guarantied.
Most of the investor invests in basic necessities. They plan to invest in insurance
(LIC, GIC) and pension fund as these give guarantied returns and are less risky.
Most of the investors feel that inviting in stock/capital market is of high risk there fore
they don’t invest in them.
66

SUGGESTIONS
Select your investments on economic grounds.
Public knowledge is no advantage.
Buy stocks in companies with potential for surprises.
Take advantage of volatility before reaching a new equilibrium.
Listen to rumors and tips, check for yourself.
Don’t put your trust in only one investment. It is like “putting all the eggs in one
basket “. This will help lesson the risk in the long term.
The investor must select the right advisory body which is has sound knowledge about
the product which they are offering.
Professionalized advisory is the most important feature to the investors.
Professionalized research, analysis which will be helpful for reducing any kind of risk
to overcome.
67

Conclusion
As with many areas of financial planning, the range of investment options has increased
significantly with new investment products being introduced regularly. Moreover, many more
areas of investment opportunities have become available to the ordinary investor which
previously could be considered only by large institutional investors for e.g. investments in
foreign equities and commercial property, both of which are accessible through collective
investment vehicles. This increased complexity of the investment market has led on one hand
for many investors adopting a more sophisticated approach towards planning their portfolio.
The following highlighted pointers are portfolio investment in a nutshell and are the factors
undermining portfolio management.
Review of portfolio required due to: -
∆ Tax Position
∆ Financial Position
∆ Aspirations/plans
Investment Strategy = ↑Returns ↓ Risk
Factors determining appropriate asset class/ vehicles as follows: -
Risk profile & expected returns
Income & Capital needs of the investor – now and in the future.
Tax position of the investor
68
BIBLIOGRAPHY
BIBLIOGRAPHY
BOOKS
Financial Management – ICFAI publication
Financial Management – Khan& Jain
Finance in a nutshell – Javier Estrada
Financial Management – Stephen Forrester
Modern Portfolio theory & investment analysis – Elton & Gruber
Security analysis and portfolio management – Fischer and Jordan
Investment banking and brokerage – Marshall & Ellis
Investment management – Cowdell & Billings
Investment analysis and portfolio management – Reily & Brown
WEBLIOGRAPHY
www.wikipedia.com
www.esnips.com
www.ehow.com
www.careers-in-finance.com
www.investopedia.com
www.chartadvisor.com
www.icicidirect.com
www.rediff.com/news
www.moneycontrol.com
69


![Seven habbits training]](https://img.pdfslide.us/doc/110x75/5550e618b4c905417d8b4b45/seven-habbits-training.jpg)