Embed Size (px)
Citation preview

A11100PUBLICATIONS A111Db m b cj lb
NBSIR 81-2444
Smoke Movement Through ASuspended Ceiling System
U S. DEPARTMENT OF COMMERCENational Bureau of Standards
National Engineering Laboratory
Center for Fire Research
Washington, DC 20234
Issued:
February 1 982
Final Report
Funded in part by:
Veterans Administration
Office of Construction Researchshington, DC 20420
apartment of Health and Human Services
ashington, DC 20201


nationalof STANTIBUS
UBBABT
NBSIR 81-2444 MAY 14 1982
SMOKE MOVEMENT THROUGH ASUSPENDED CEILING SYSTEM
John H. Klote
U S. DEPARTMENT OF COMMERCENational Bureau of Standards
National Engineering Laboratory
Center for Fire Research
Washington, DC 20234
Issued:
February 1 982
Final Report
Funded in part by:
Veterans Administration
Office of Construction Research
Washington, DC 20420
Department of Health and Human Services
Washington, DC 20201
U S. DEPARTMENT OF COMMERCE, Malcolm Baldrige, Secretary
NATIONAL BUREAU OF STANDARDS, Ernest Ambler, Director

' “ ^ t lAHOS' 'a
*' »'• * Hf( !,:
>8% H YA

TABLE OF CONTENTS
Page
LIST OF FIGURES v
LIST OF TABLES viii
Abstract . 1
1. INTRODUCTION 2
2. TEST FACILITY 3
3. EXPERIMENTAL DETAILS 5
3.1 Instrumentation 5
3.1.1 Temperature ..... 5
3.1.2 Smoke Obscuration . 5
3.1.3 Carbon Monoxide ..... 5
3.1.4 Velocity 6
3.2 Test Program 6
3.3 Test Procedures 6
3.3.1 Smoke Candle Test 6
3.3.2 Smoldering Tests 7
3.3.3 Low Energy Tests 7
3.3.4 High Energy Tests 8
3.4 Mattresses and Bedding 8
3.4.1 Low Energy Tests 8
3.4.2 High Energy Tests 9
4. HAZARD ANALYSIS 9
4.1 Smoke Obscuration 10
4.2 Carbon Monoxide 10
5. TEST RESULTS AND DISCUSSION 11
5.1 Smoke Candle Test 11
5.2 Smoldering Tests 12
5.2.1 Tests 1 and 2 12
5.2.2 Test 3 13
5.3 Low Energy Tests 14
5.3.1 Tests 4 and 5 14
5.3.2 Test 6 15
5.3.3 Test 7 16
5.3.4 Test 8 16
5.3.5 Test 9 17
5.3.6 Test 10 18
iii

TABLE OF CONTENTS (cont'd)
Page
5.4 High Energy Tests 195.4.1 Tests 11 and 12 195.4.2 Smoke Leakage into Room 2 205.4.3 Smoke Movement through the Ceiling 21
5.5 Comparison of Test Types 225.5.1 Smoke Movement 225.5.2 Hazardous Conditions 225.5.3 Smoke Detection 23
5.6 Interstitial Space Exhaust .... 24
5.7 Patient Room Exhaust 265.8 Smoke Movement Paths 27
6. SUMMARY AND CONCLUSIONS 28
7. ACKNOWLEDGEMENTS 30
8. REFERENCES 31
iv

LIST OF FIGURES
Page
Figure 1. Floor plan of test facility 33
Figure 2. Section of test facility 34
Figure 3. Ceiling plan of test facility 35
Figure 4. Ventilation system for test facility 36
Figure 5. Instrumentation plan for test facility . . 37
Figure 6. Instrumentation plan for interstitial space 38
Figure 7. Instrumentation in burn room doorway 39
Figure 8. Instrumentation in burn room 40
Figure 9. Instrumentation in room 1 41
Figure 10. Floor plan for test facility showing status of
doors and windows during the tests 42
Figure 11. Smoke obscuration for the smoke candle test 43
Figure 12. Smoke obscuration in the burn room and the
interstitial space for tests 1 and 2 44
Figure 13. Smoke obscuration in the burn room and the
interstitial space for tests 2 and 3 45
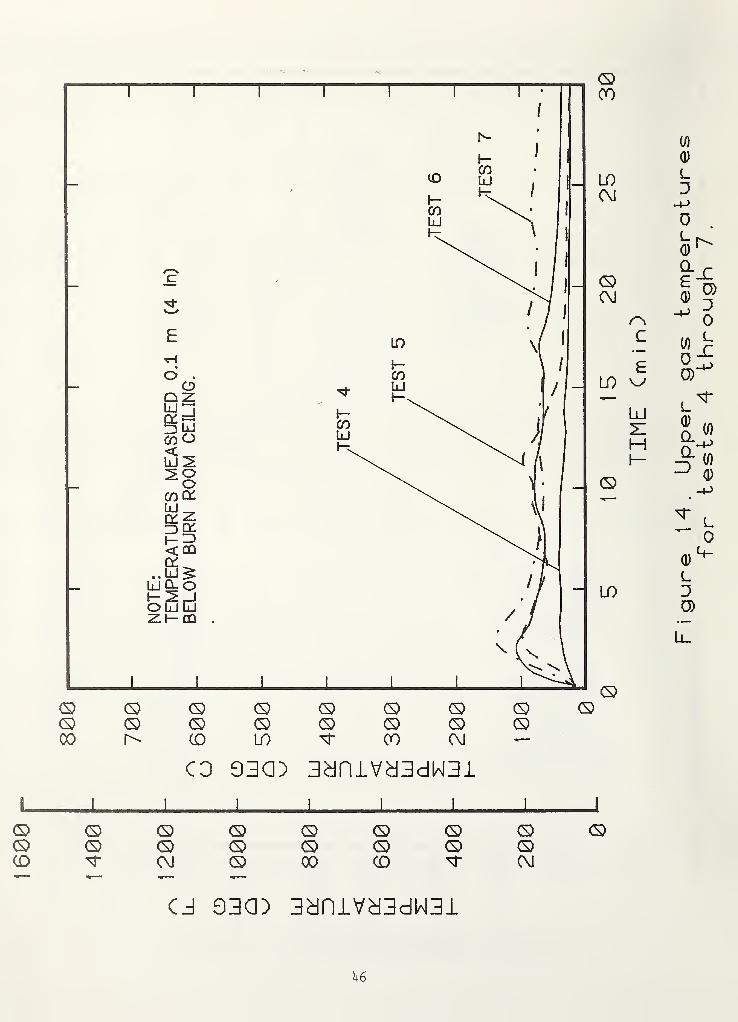
Figure 14. Upper gas temperatures for tests 4 through 1 ... . 46
Figure 15. Upper gas temperatures for tests 8 through 10 ... . 47
Figure 16. Smoke obscuration for tests 4 and 5 48
Figure 17. Smoke obscuration for test 5 49
Figure 18. Carbon monoxide concentrations for test 5 50
Figure 19. Smoke obscuration for test 6 51
Figure 20. Smoke obscuration for test 7 52
Figure 21. Carbon monoxide concentrations for tests 6 and 7 . . 53
Figure 22. Smoke obscuration for test 8 54
v
LIST OF FIGURES (cont'd)
Page
Figure 23. Smoke obscuration for test 9 55
Figure 24. Smoke obscuration for test 10 56
Figure 25. Temperatures for test 11 57
Figure 26. Temperatures for test 12 58
Figure 27. Smoke obscuration for tests 11 and 12 59
Figure 28. Carbon monoxide concentrations for tests 11 and 12 . . 60
Figure 29. Pressure difference across burn room ceiling fortests 10, 11 and 12 . 61
Figure 30. Smoke obscuration for the smoke candle test and
test 1 62
vi

LIST OF TABLES
Page
Table 1. Fan Schedule 63
Table 2. List of Instrumentation 64
Table 3. Test Schedule 66
Table 4 . Ignition Source 67
Table 5. Technical Data for Mattress and Bedding for
Tests 4-10 68
Table 6. Technical Data for Mattress and Bedding forTests 11 and 12 69
Table 7. Times to Hazard Level Due to CO Concentrations 70
Table 8. Smoke Detector Activation Times 71
vii


SMOKE MOVEMENT THROUGH A SUSPENDED CEILING SYSTEM
John H. Klote
Abstract
A series of full-scale tests were conducted to
evaluate smoke movement through a suspended ceiling
and into an interstitial space of a hospital type
facility. A test facility specifically constructed
for this project is described. The test series
consisted of one smoke candle test and 12 fire tests
including both smoldering and flaming fires. Smoke
movement through the suspended ceiling system was
evaluated in terms of the total smoke movement
through the test facility. The effects of ventila-
tion and smoke exhaust on smoke concentration in
the test facility were investigated. It was con-
cluded that the use of the interstitial space
exhaust as described in this paper will effec-
tively prevent hazard conditions due to smoke
downflow through suspended ceilings. It was also
concluded that smoldering fires of the type
examined in this test series are not a significant
problem in hospitals.
Key words: Ceiling systems; hazard analysis;
hospitals; interstitial space; mattresses; smoke
control; smoke exhaust; smoke movement; ventilation
systems
.

1 . INTRODUCTION
Smoke is commonly recognized as a major killer in building fires.
One of the reasons for this is that smoke flows through numerous leak-
age paths to locations remote from the fire, resulting in a hazard to
human life. These leakage paths can be open doors, cracks around
closed doors, stairwells, elevator shafts, construction cracks in
walls and floors, and even cracks or openings in a suspended acoustical
ceiling.
Extensive use of suspended acoustical ceilings has resulted in
questions within the Veterans Administration (VA) and among the fire
protection community regarding the potential of danger resulting from
smoke leakage through the ceiling. This is especially true for cases
where there are large areas above the suspended ceiling, such that
smoke could travel through these paths to locations remote from the
fire. Such smoke movement could involve smoke movement up through the
ceiling, horizontal flow in the space above the ceiling, and then
downward flow into an occupied space.
This paper reports the results of a test series conducted to
evaluate smoke movement through a suspended ceiling system. Particular
emphasis in this study was directed toward examining this problem under
a construction arrangement typical of a hospital. A test facility was
constructed which consisted of four patient rooms and a section of
corridor. Above these spaces there was an open space referred to as
the interstitial space. The interstitial space was separated from the
lower spaces by a suspended ceiling system. In hospitals the inter-
stitial space is typically used for mechanical and electrical equipment,
ductwork, piping, and conduit.
Smoke is defined for this paper to consist of all airborne products of
combustion including both particles and gases.
2

In this test series the extent of smoke penetration through the
ceiling was evaluated from (1) smoke candles, (2) smoldering fires, (3)
low energy flaming fires, and (4) high energy flaming fires. Smoke
concentrations were determined by measuring smoke obscuration and CO
concentration. Smoke concentrations were recorded in a number of
locations throughout the test facility in order to evaluate smoke
movement through the ceiling system in light of smoke movement through-
out the rest of the test facility. The effects of the ventilation,
occupancy space exhaust, and interstitial space smoke exhaust on smoke
concentration in the test facility were also investigated. In addition,
a hazard analysis, limited to smoke obscuration and CO concentration,
is included.
2. TEST FACILITY
The test facility was built inside another structure to minimize
the effect of the wind. This facility has four patient rooms and a
section of corridor as shown in figure 1. The burn room has one door
to the corridor and another smaller door to the space outside the test
facility. This smaller door was included to provide a convenient exit.
This door was closed throughout all the tests except for the first 5 to
10 seconds of each test when the person who ignited the test fire was
exiting. Reference in this report to the "burn room door" will mean
the door between the burn room and the corridor.
The doors throughout the test facility had polymer seals on both
sides and the top. These seals were a commercial product which was
specifically made for use on metal door frames. The sealing mechanism
was a thin polymer leaf against which the door closed. Small leakage
paths existed at the corners where these seals met. The doors were
undercut 23 mm (7/8 in). No attempt was made to seal these cracks at
the bottom of the doors from the four rooms into the corridor. However,
bottom sweeps were installed on the two doors to the outside of the
test facility.
3

Figure 2 shows a section through the test facility. The walls of
the facility consist of 16 ran (5/8 in) type X gypsum board on steel
studs. All of the gypsum board joints were taped and spackled. The
perimeter walls of the test facility have gypsum board on the interior
side only. The interior walls are 2.44 m (8 ft) high and have gypsum
board on both sides. The suspended ceilings are separately hung in
each room.
The ceiling was constructed of 0.61 x 1.22 m (24 x 48 in) acoustical
tiles supported by a steel grid system. The ceiling plan is shown in
figure 3. The construction of the ceiling was (see figure 2) in accor-2
dance with the ceiling portion of UL listing A202 [1] , floor ceiling
assembly, with the exception that ceiling hold down clips were left off
one ceiling tile in each room and one tile in the corridor. These
uncliped tiles were used as access panels. In addition, an open cell
polymer seal was installed between the ceiling wall molding and the
wall, as is common practice in Veterans Administration hospitals. The
ceiling tiles weighed 49.6 N/m2 (1.00 lb/ft 2).
The ventilation system for the test facility is shown in figure 4.
This system consists of supply and exhaust for the four patient rooms
as well as ventilation for the interstitial space. Table 1 is a
schedule of the ventilation fans. The system was designed and balanced
to provide six air changes per hour in the patient rooms. Four radial
fans were installed for ventilation of the interstitial space. These
fans are capable of being repositioned in the ductwork so that they can
be used for either supply or exhaust of the interstitial space. Each
radial fan has a damper for adjusting air flow. During this test
series the only radial fan used was fan 5 in the exhaust mode. All of
the outside air dampers were motorized.
Numbers in brackets refer to references listed at the end of this
paper
.
4

3. EXPERIMENTAL DETAILS3.1
Instrumentation
The instruments used in this test series are shown in figures 5
thru 9 and are listed in table 2. Response times of smoke detectors
and a tell-tale sprinkler were recorded automatically by activation of
a relay which stopped a clock. All tests were recorded with 35 mm
still camera or on video tape with separate coverage in the burn room
and in the interstitial space. Generally, all instrumentation channels
were recorded at 20 second intervals for the smoldering tests and at
13 second intervals for the flaming tests. The data acquisition system
was located in an instrumentation trailer adjacent to the main building.
3.1.1
Temperature
Temperatures in the test facility were measured at locations shown
in figures 5 thru 9, and outside air temperature was measured. These
temperatures were measured by bare beaded chromel-alumel thermocouples
made from 0.51 mm (24 gauge) diameter wire.
3.1.2
Smoke Obscuration
The obscuration of smoke was measured at 12 locations as shown in
figures 5 thru 9. The smoke meters measured optical density over a
1.0 m (3.28 ft) horizontal path using spotlights as light sources and
using photodiodes (PIN 3DP) as receivers.
3.1.3
Carbon Monoxide
Carbon monoxide (CO) was continuously measured at five locations
as shown in figures 5 thru 9. In rooms 1, 2, and 3 the CO sample
probes were located at approximately head height for a patient laying
in bed. In the burn room the CO sample probe was located approximately
5

0.91 m (3 ft) above the bed. This location was chosen so that it would
collect smoke from the fire plume. Another CO probe was located at
approximately the mid-height of the interstitial space. CO concentra-
tions were measured with nondispersive, infrared analyzers.
3.1.4 Velocity
Air and gas velocity were measured in the burn room doorway and
the window in room 2. In both cases the velocity was measured 0.1 m
(4 in) below the top and 0.1 m (4 in) above the bottom of the opening.
The room 1 window was open only for tests 1 thru 3 and accordingly the
velocity at this window was recorded for these tests only. Velocities
were measured with bidirectional probes [2] connected to variable
reluctance differential pressure transducers.
3.2 Test Program
The smoke leakage performance of the ceiling system was tested
with smoke generated by four types of sources: (1) smoke candle, (2)
smoldering fire, (3) low energy flaming fire, and (4) high energy
flaming fire. Throughout the tests the doors to rooms 1 and 3 were
open and the door to room 2 was closed. The status of doors and windows
for all the tests is shown in figure 10. The test schedule for all of
the tests except the smoke candle test is listed in table 3.
3.3 Test Procedures
3.3.1 Smoke Candle Test
A commercially available three minute duration smoke candle was
set in the center of the flat steel surface of the hospital bed and
ignited. Visual observations were made and the test was recorded on
video tape. This test was performed so that smoke movement from smoke
candles could be compared with smoke movement from real fires.
6

3.3.2 Smoldering Tests
A smoldering fire of high reproducibility was developed for these
tests. The pallet for the smoldering fires was constructed in the
following steps:
a. Fiberglass insulation 0.58 mm (23 in) wide and 89 mm (3.5
in) thick was placed over a plywood board 1.83 m x 0.58 m x
13 mm (72 in x 23 in x 1/2 in) thick.
b. Three layers of untreated cotton batting 0.69 m (27 in) wide
and 25 mm (1 in) thick were placed on top of the fiberglass.
c. A bedspread of 50 percent polyester and 50 percent cotton was
placed on top.
d. The assembly was then turned over, compressed with approximately
70 N (16 lb) force and the spread was pulled tight and stapled
securely on both sides.
The pallet was placed with the plywood side down on the hospital
bed in the burn room. Three slits were made in the pallet, approximately
76 mm (3 in) long and 40 mm (1.6 in) deep into the cotton batting. One
of these slits was located in the center of the pallet and the other
two were located 0.61 m (24 in) from each end and equidistant from the
sides. The pallet was ignited by placing a lighted half cigarette in
each slit and then pushing the slit shut. The cotton batting had been
stored in a room at 30 percent RH and 21° C (70° F)
.
3.3.3 Low Energy Tests
These tests are referred to as low energy tests because the
mattress was filled with fire retardant treated cotton padding. A
detailed description of the mattress and bedding for these tests is
provided in section 3.4.1. The fire was started in a steel wastebasket
7

containing 20 sheets of newspaper of which ten crumpled and ten were
rolled and placed vertically. The wastebasket was placed in contact
with the blanket and top sheet. Each test began when the contents of
the wastebasket were ignited with a cigarette lighter. All bedding and
wastepaper were kept in a storage room where the humidity was in the
range of 30 - 50 percent RH and the temperature was in the range of
16 - 23° C (60 - 74° F)
.
3.3.4 High Energy Tests
These tests were referred to as high energy tests because the
mattress was filled with polyurethane foam. A detailed description of
the mattress and bedding for these tests is provided in section 3.4.2.
The mattress was one which has been used as part of the NBS mattress
flammability test program [3, 4, 5], A polyethylene wastebasket filled
with 443 g (.97 lb) of combustibles was placed next to the bed as was
done in the NBS mattress tests. Table 4 lists the contents of the
wastebasket. The wastebasket was placed in contact with the bedspread.
Each test began when the contents of the wastebasket were ignited with
a cigarette lighter. All bedding and wastebasket items were kept in a
50 percent RH conditioning room at a temperature of 21° C (70° F) for
at least 24 hours prior to each test in order to be consistent with the
prior NBS mattress tests [3],
3.4 Mattresses and Bedding
3.4.1 Low Energy Tests
The mattresses and bedding for the low energy flaming tests were
supplied by the Veterans Administration. The mattress was an inner-
spring mattress constructed of fire retardant treated cotton felt
padding with a retardant treated vinyl impregnated nylon tick covering
(outermost layer). The bedding consisted of a blanket, two sheets, a
pillow and a pillow case. The pillow had cotton ticking and was filled
with duck feathers. A detailed description of the mattress and bedding
is provided in table 5. For test 4, the first low energy flaming test,
8

a fire retardant blanket of a matrix fiber of 50 percent vinyl and 50
percent vinyon was used. In this test only the newspaper in the
wastebasket and a small amount of the cotton sheet burned. Because the
fire intensity was so low, it was decided to use a cotton blanket
furnished by the Veterans Administration for subsequent low energy
tests
.
3.4.2 High Energy Tests
The mattress and bedding for the high energy tests were the same
as the mattress and its bedding materials used in the NBS mattress test
program [3]. The mattress chosen was a polyurethane innerspring one
which was coded M-02 in the mattress tests. The bedding was obtained
from a commerical hospital supplier and was intended for use in health
care facilities. The bedding consisted of a cotton drawsheet, two
sheets, and a bedspread, a pillow case and pillow filled with shreaded
polyurethane foam. A detailed description of the mattress and bedding
is listed in table 6.
4. HAZARD ANALYSIS
The primary objective of this project was to study smoke movement
through the interstitial space resulting from a fire originating below
the space in an occupied room. In addition, a limited discussion
regarding the resultant hazard to human life from such fires is also
presented. For this paper the hazard analysis was limited to smoke
obscuration and CO concentration. It should not be inferred that CO is
the only toxic gas that is significant in fire situations. This was
the only gas measured due to the limited scope of the project. In this
discussion of hazard analysis, temperature was not considered because
the primary concern of this study is with the hazards associated with
smoke at locations where there is negligible temperature rise due to
the fire.
9

4.1 Smoke Obscuration
The limiting level of smoke obscuration for human safety was
selected for two separate hazards in this fire test scenario. The
first concerned rescue of a patient from a patient room, and the second
involved the use of the corridor as an exit way. Obscuration was
measured at a number of locations (section 3.1.2) in order to study
smoke movement. For hazard analysis only the smoke meters located 1.5
m (5 ft) above the floor in the patient rooms and in the corridor were
considered. Critical levels of obscuration selected for each location
were based on investigations by Jin [6, 7]. Jin recommended limits on
obscuration based on not reducing the walking speed below that of a
blindfolded subject in a smoke free environment. This obscuration was
approximately 0.25 OD/m. Accordingly, in this paper, the value of 0.25
OD/m is used as the critical level of smoke obscuration for both the
patient rooms and the corridor.
4.2 Carbon Monoxide
CO forms carboxyhemoglobin (COHb) in the blood and thereby reduces
the oxygen carrying capacity of the blood. Therefore, percent COHb is
a meaningful measure of CO toxicity. The following approximate pro-
cedure, adopted for this test program to evaluate COHb, has been
employed by O’Neill and Hayes [4, 5],
Steward derived an equation of COHb from experiments with human
volunteers [8], The volunteers were subjected to very high concentrations
of CO and their COHb levels were then measured. CO uptake is directly
proportional to the breathing rate which is approximately 6.5 £/min
for an individual at rest. The breathing rate increases with activity
and also from exposure to CO2 . A 4 percent concentration of CO2 will
more than double the breathing rate [9]. Since both of these factors
must be considered in a fire situation, a breathing rate of 18 2,/min
was selected for purposes of analysis. The equation developed based
on Steward's work for determining C0Hb% is:
10

ACOHb% = 5.98 x 1CT4 (At) [CO]1,036
where At is time in minutes and CO is concentration in ppm. An initial
value of 0.75 percent COHb was established, based on information pro-
vided by Alarie and Zullo [10] for use in the computation. A 25 percent
calculated COHb was selected in this study as the critical level of
COHb at which incipient incapacitation may occur [11].
In addition to the threshold for time-rated accumulation, another
limit must be selected for CO exposure. Instantaneous doses of high
levels of CO must also be considered due to the physiological effects
such as cardiac arrhythmia [12] which can occur independently of the
effects of increased COHb. Claudy [13] reported on the effects of
exposure to high concentrations of CO. The results of his work indicate
that incipient incapacitation may occur with only a few short breaths
at an exposure level of 10,000 ppm CO. And, at a slightly higher
concentration of 12,800 ppm Claudy reported that unconsciousness could
occur in 2 to 3 breaths, followed by death in 1-3 minutes. Based on
this an instantaneous threshold of 10,000 ppm (1.0 percent by Vol) CO
was selected as a criterion, in addition to the time integrated exposure
resulting in COHb level of 25 percent.
5. TEST RESULTS AND DISCUSSION
5.1 Smoke Candle Test
The smoke candle test was conducted under the following conditions
:
1. The burn room door was closed.
2. The window to room 1 was open.
3. The supply and exhaust systems for the four patient roomswere operating.
4. The interstitial space exhaust fans were off.
5. The status of the other doors and the windows was the same as
for all of the other tests, as listed in table 3.
11

As expected, visual observation revealed that the smoke filled the
burn room quickly, but there was a much lower level of smoke in the
other rooms, the corridor and the interstitial space. Figure 11 indicates
that the optical density in the corridor and the interstitial space was
considerably lower than the optical density in the burn room. In
addition, it was observed that the major path of smoke movement through
the suspended ceiling was at joints between the walls and the metal wall
molding of the suspension system, in spite of the fact that these joints
were filled with open cell foam. In section 5.5, this smoke candle test
is compared with the other tests conducted in this series.
5.2 Smoldering Tests
In the first three tests, the burn room door was closed and smoldering
fires were set as described in section 3.3.1. The test conditions for
these tests are summarized in table 3. Throughout all three tests there
was only slight visible smoke in the corridor and rooms 1, 2, and 3.
Visual observation after 60 minutes revealed that small quantities of
smoke were flowing under the burn room door into the corridor. The CO
concentrations outside the burn room were negligible. In all three
tests the temperature outside the burn room remained constant, and the
temperature 0.1 m (4 in) below the burn room ceiling only increased by
8° C.
5.2.1 Tests 1 and 2
Test 1 was conducted with the supply air and exhaust air on and all
the ceiling tiles in place. In order to determine the effect of missing
ceiling tiles, test 2 was conducted with two ceiling tiles missing from
the burn room ceiling. Figure. 12 shows smoke obscuration in the burn
room and interstitial space for these two tests. The data from test 1
is for less than 60 minutes because of a failure in the data acquisition
software. As expected the obscuration is greater in the interstitial
space in test 2 with the ceiling tiles missing from the burn room.
12

5.2.2 Test 3
In order to determine the effect of the ventilation system on smoke
movement, test 3 was a repeat of test 2 except that the supply and
exhaust fans to the four patient rooms were shut off. Figure 13 shows
the smoke obscuration in the burn room and the interstitial space for
tests 2 and 3 showing. There is a substantial increase in smoke con-
centration when the ventilation system is off.
The window in room 1 was open throughout these tests to determine
the effect of an open window on smoke movement. In all three smoldering
tests there was flow into room 1 at the bottom of the window and out of
room 1 at the top. The air velocities at the window fluctuated in the
range of 0 to 0.5 m/s (0 to 0.15 ft/s). This type of flow is indicative
of natural air currents which exist in buildings, and would be unusual
for a window open to the outside. In such cases the flow is usually
dominated by either wind or stack effect or by both. Accordingly, the
flow would be in one direction across the opening. Because the burn
room door was closed, the open window in room 1 probably had no signifi-
cant effect on the smoldering fire. However, for tests with the burn
room door open, the open window would probably have an affect on the
fire. This would impair reproducibility of the tests and yield no
benefits. For this reason the window in room 1 was closed for all
further tests.
During the smoldering tests the smoke obscuration and CO
concentrations did not result in a significant threat to life. CO
levels in the burn room were below 0.15 percent for all three tests, and
COHb levels for a person in the burn room were well below the critical
level. Smoke obscuration was below critical level throughout tests 1
and 2. And, in test 3 smoke obscuration remained below the critical
level for the first 30 minutes of the test.
13

A worry with a smoldering fire is that it will continue until
hazardous conditions result, or until the fire develops into a flaming
fire. While there was only the slightest visible smoke in the corridor
and in rooms 1, 2 and 3, a very irritating smell was present in these
spaces after the first few minutes of each test. It is apparent from
figures 12 and 13 that smoke obscuration due to the smoldering fires is
below the hazard level for at least a half hour. Hospitals have people
who are awake 24 hours a day who can smell these fires and then easily
extinguish them. Therefore, smoldering fires of the type examined in
this test series do not appear to represent a serious problem in hospitals.
5.3 Low Energy Tests
In tests 4 through 10, fire retardant cotton mattress and bedding
as described in section 3.4.1 were burned. The test conditions for
these tests are summarized in table 3. The burn room door was open for
all tests, with the exception of test 7. The window in room 1 was
closed for all tests for reasons discussed in section 5.2.2. The status
of all windows and doors for these tests is provided in figure 10.
Figures 14 and 15 show the upper gas temperatures in the burn room for
these tests.
5.3.1 Tests 4 and 5
Test 4 was conducted with both the supply air and the exhaust air
on. For this test a fire retardant blanket was used on the bed. This
blanket was very successful in limiting the growth of the fire as can be
seen from the upper gas temperature in figure 14. Test 5 was the same
as test 4 except that a cotton blanket was used to increase the fire
intensity. This was successful and cotton blankets were used for the
rest of the low energy tests. Figure 16 shows smoke obscuration in the
corridor and in the interstitial space for both test 4 and 5. It is
apparent that the smoke obscuration is much greater in test 5 when the
cotton blanket was on the bed.
14

During test 5 the burn room and rooms 1 and 3 were open to the
corridor. It was visually observed that these spaces filled with smoke
after about 2 or 3 minutes. This is also apparent from the smoke obscu-
ration data shown in figure 17. As would be expected the corridor was
obscured slightly before rooms 1 and 3. The door to room 2 was closed
throughout the test series, and smoke was observed flowing under the
door and into room 2. It can be seen from figure 17 that the smoke
obscuration in room 2 was considerably lower than that of the corridor
or other rooms. Figure 17 shows that the obscuration of the intersti-
tial space during test 5 was much lower than that of the corridor or
that of rooms 1 and 3. This indicates that the smoke flow through the
open doorway was much greater than that through the ceiling system.
During this test there was no indication of smoke movement from the
interstitial space to room 2.
Similar observations regarding smoke movement can be obtained by
examining CO concentration. Figure 18 shows CO concentrations for test
5. The CO concentrations in the burn room, and rooms 1 and 3 were
relatively high, while the concentrations in room 2 and the interstitial
space are negligible. It can be observed from figure 18 that the burn
room concentration of CO is about twice that measured in rooms 1 and 3.
This is because the burn room CO probe samples the gas from the fire
plume
.
5.3.2 Test 6
The test conditions for test 6 were the same as those for test 5
except that the supply air and the return air were shut off. This test
was conducted to determine the extent to which smoke obscuration would
increase without ventilation. Figure 19 shows smoke obscurations for
test 6. As in test 5 the optical density in the corridor and rooms 1
and 3 increased rapidly while the optical density in the interstitial
space and room 2 was much lower. As in test 5 it is apparent that the
smoke flow through the open doorway was much greater than the upward
smoke flow through the ceiling system. There were no indications of
smoke flowing from the interstitial space into room 2.
15

In comparing smoke obscuration from tests 5 and 6 (figures 17 and
19) ,it is apparent that the increase in smoke obscuration is dramatic
when the ventilation is shut off. This is especially so for room 2
where the optical density was five times greater when the ventilation
was off.
5.3.3 Test 7
Test 7 was conducted to determine the effect of a closed burn room
door on smoke concentration. This test was the same as test 6 except
for the closed door. Figure 20 shows smoke obscurations for test 7. By
comparing figures 19 and 20 it is apparent that closing the burn room
door significantly reduces the smoke obscuration in the corridor and in
rooms 1, 2, and 3. However, these figures also show that closing the
burn room door has essentially no effect on smoke obscuration in the
interstitial space. This is probably because the major path of smoke
movement into the interstitial space is through the burn room ceiling in
either case. In addition, there were no indications of smoke flowing
from the interstitial space into room 2.
Figure 21 shows CO concentration in the burn room and in room 1 for
tests 6 and 7. This data shows that closing the burn room door results
in increased CO in the burn room and decreased CO in room 1. The burn
room CO concentration is increased to the extent that in test 7 the
critical level of COHb is reached in 22.6 minutes. However, in all the
other low energy tests where the burn room door was open the critical
level was not reached.
5.3.4 Test 8
Test 8 was performed to determine the effect of exhausting two air
changes per hour from the interstitial space. With the exception of
exhausting the interstitial space, the conditions of this test were the
same as those of test 6. It was expected that exhausting the intersti-
tial space would act to pull smoke through the ceiling and into the
16

interstitial space. Accordingly, the level of smoke in the corridor and
patient rooms would decrease. Figure 22 shows smoke obscuration for
test 8. In comparing the results of tests 6 and 8 (figures 19 and 22),
it is apparent that exhausting the interstitial space did indeed result
in reduced smoke obscuration in the corridor and in rooms 1, 2, and 3.
Unfortunately, this reduction in obscuration did not result in greatly
reduced hazard conditions. It can also be noticed by comparing figures
19 and 22, that exhausting the interstitial space had little effect on
the smoke obscuration in the interstitial space. In this test, as in
earlier tests, smoke was observed leaking into room 2 through the crack
under the door. It should be noted that there were no indications of
smoke flowing from the interstitial space into room 2.
5.3.5 Test 9
In order to determine the leakage paths into room 2 and to reconfirm
the results of test 8, test 9 was conducted. Test 9 was the same as
test 8 except that the cracks around the door to room 2 were sealed with
tape. Figure 23 shows smoke obscuration for test 9. In comparing the
smoke obscuration for tests 8 and 9 (figures 22 and 23), it is apparent
that there was good repeatability between the two tests everywhere
except in room 2. As expected, the two figures show that the smoke
obscuration in room 2 was lower with the cracks around the door taped.
It was observed during test 9 that smoke was flowing into room 2 through
the exhaust grill. The exhaust and supply systems were off, and appar-
ently smoke traveled from the burn room to room 2 through the exhaust
duct.
As in test 8, the interstitial space exhaust had little effect on
the smoke obscuration in the interstitial space, and there was no indica-
tion of smoke movement from the interstitial space into room 2.
17

5.3.6 Test 10
Test 10 was conducted to determine the effect of operating the
exhaust system for the patient rooms during a low energy fire. The door
to room 2 was still sealed, and during the test no visible smoke was
observed in room 2. This can be seen from the smoke obscuration data
for test 10 which is provided in figure 24. The reasons for the absence
of smoke in room 2 during this test are discussed in detail in section
5.7.
Test 10 is the same as test 6 except that the exhaust air system is
on in test 10. Comparison of the smoke obscuration for tests 5 and 10
(figures 19 and 24) shows that the obscuration throughout the facility
was considerably lower when the exhaust air was on. This result was
anticipated because test 10 is very similar to test 5 (figure 17) where
both the exhaust and supply were operating. However, the smoke obscura-
tion from test 10 was lower than that for test 5, indicating that exhaust
alone does more to eliminate smoke than exhaust and supply together.
An explanation which might be proposed for this is that the supply
system provides combustion air which increases the combustion rate.
This explanation does not consider that when the supply fan is off there
is an inflow of outside air through whatever small cracks exist in the
test facility. This inflow equals the exhaust rate and would also
provide combustion air to the fire.
In addition, smoke feedback into the supply air system did not
occur because the supply air was completely taken from the outside on
the opposite side of the building from where the exhaust air was rejected
(figure 4) . Another possible effect is that the supply air reduced the
ability of the exhaust system to remove smoke from the patient rooms.
The supply diffusers were located approximately in the middle of each
patient room (figure 3) and the return air grills were located 6 ft
18

above the floor in each patient room (figures 1 and 4). Because of the
proximity of the diffusers and exhaust grill it is likely that the
supply air diluted the smoke flowing into the exhaust system. This
would reduce the smoke exhaust capability of the exhaust system.
5.4 High Energy Tests
5.4.1 Tests 11 and 12
In tests 11 and 12, polyurethane mattress and bedding as described
in section 3.3.4 were burned. The test conditions for these tests are
listed in table 3. The burn room door was open for both of these tests.
The status of all doors and windows in the test facility is provided in
figure 10. Figures 25 and 26 show temperatures for tests 11 and 12.
These figures indicate that these tests were highly repeatable.
Test 11 was conducted with all the ventilation fans shut off. For
tests 11 and 12, the door to room 2 was sealed to determine the extent
of smoke movement through the duct work. Under these circumstances the
smoke movement into room 2 would be similar to that into a room which
had solid partitions separating it from the fire space. In test 11 as
in test 9 smoke was observed flowing into the room 2 through the exhaust
duct.
Test 12 was conducted with the air exhausted from the interstitial
space at a rate of 2 air changes per hour. The exhaust grill and the
supply register in room 2 were sealed off to determine other possible
paths of smoke into room 2
.
During both tests 11 and 12 visual observation revealed that shortly
after ignition there was considerable smoke flow out of the top of the
burn room door, and that after about 2 minutes the corridor, and rooms 1
and 3 were obscured with smoke. In addition, during the first 4 minute
of tests 11 and 12, smoke was observed flowing into the interstitial
space through the cracks between the wall molding and the wall. And, at
about 4 minutes the interstitial space filled very rapidly with smoke.
19

Figure 27 shows smoke obscuration for tests 11 and 12. This confirms
the visual observations, described above. Similar trends can be found
by observing the CO concentrations shown in figure 28. After about 4
minutes the CO concentration in room 1 increased rapidly, while the CO
concentrations in the interstitial space increased at a somewhat lower
rate
.
It is also apparent from figure 28 that the CO concentrations in
room 1 were lower in test 12 when the interstitial space was exhausted.
This is similar to the reduced smoke concentrations caused by intersti-
tial exhaust during the low energy fires of tests 8 and 9. It can be
observed from both figures 27 and 28 that exhausting the interstitial
space has little effect on the smoke concentrations in the interstitial
space
.
5.4.2 Smoke Leakage into Room 2
The effect of sealing the return grill and the supply diffusers in
room 2 should reduce the smoke concentrations in that room by preventing
smoke movement through the duct systems. This behavior can be observed
by examining smoke obscuration in figure 27 or by examining CO concen-
tration in figure 28. Smoke obscuration and calculated COHb in room 2
were both well below the critical levels selected for this study. The
concentration of CO in room 2 was below the instantaneous threshold.
However, if the fire had been of longer duration it is possible that the
smoke obscuration and COHb might have exceeded critical levels in room
2 .
During test 12 smoke may have infiltrated room 2 through the
suspended ceiling, through cracks around the door frame, through cracks
between the partitions, etc. Upon examination before and after test 12,
traces of smoke movement were evident on the ceiling tile around the
diffusers in room 2. Visual examination of these smoke traces could not
conclusively determine the direction of this smoke movement. It should
be pointed out that in a real hospital the interstitial space would be
20

many times larger, and therefore the smoke in the interstitial space
would be more diluted. This indicates that any smoke flow down through
a ceiling system would probably result in smoke concentrations even
lower than those in room 2 during test 12.
5.4.3 Smoke Movement through the Ceiling
The discussion of tests 11 and 12 in section 5.4.1 included a
description of the smoke concentrations in the interstitial space.
During the first 4 minutes of these tests, smoke was observed flowing
from the burn room into the interstitial space through the cracks between
the ceiling wall molding and the wall. Apparently, the open cell foam
(section 2) used to seal these cracks was ineffective in stopping smoke
movement. At approximately 4 minutes into the test, it was observed
that the smoke in the interstitial space increased very rapidly. This
rapid increase in smoke concentration in the interstitial space can be
observed from the CO concentrations shown in figure 28 and from smoke
obscuration in figure 27.
After test 11 the ceiling of the burn room was still intact.
However, the metal suspension system was warped which resulted in a
large number of cracks which would let smoke flow into the interstitial
space. It can be observed from figure 25 that the gas temperature 0.1 m
(4 in) below the burn room ceiling was very high; it peaked at 725° C
(1340° F) at about 6 minutes into the test. It seems apparent that the
high temperature of the combustion gases near the ceiling warped the
suspension system and that a greatly increased flow of smoke through the
ceiling system resulted. This accounts for the rapid increase in smoke
in the interstitial space at about 5 minutes into the test. After test
11 the burn room ceiling was rebuilt for test 12.
Figure 29 shows the pressure difference across the burn room
ceiling (see instrument number 56 on figure 8) . For this figure a
positive pressure indicates that the burn room is at a higher pressure
than the interstitial space. It can be observed from figure 29 that in
21

both tests 11 and 12 the pressure increased to about 9 Pa (0.036 inch
H2 O) at about 5 minutes into the test. Then the pressure suddenly
dropped to below 1 Pa (0.004 inch H2 O). This drop in pressure coincides
with the rapid increase in smoke concentration in the interstitial
space. When the suspension system warped, the increased leakage area
resulted in both increased gas flow into the interstitial space and
decreased pressure differential across the ceiling. It can also be
observed from figure 29 that the differential pressures across the
ceiling were larger for test 12. This was due to the presence of inter-
stitial exhaust during test 12.
5.5 Comparison of Test Types
5.5.1 Smoke Movement
It is well known that the movement of smoke produced by smoke
candles is significantly different than the movement of smoke produced
by flaming fires. This is because the smoke from smoke candles lacks
the buoyant forces which exist in smoke produced by flaming fires.
However, one might think that smoke movement due to smoke candles and
smoldering fires would be very similar because in both cases the buoyant
forces of the smoke are negligible. A comparison of smoke obscuration
for the smoke candle test and test 1 (figure 30) shows that this is not
the case. The reason for this is that the rates of smoke production are
very different. The smoke candle releases a large quantity of smoke in
about three minutes, while the smoldering fire releases smoke slowly for
about an hour. Therefore, the smoke movement due to a smoke candle is
considerably different from that due to either a flaming test or a
smoldering test.
5.5.2 Hazardous Conditions
During the three smoldering tests the CO concentration was
considerably below the instantaneous threshold and the calculated COHb
was well below the critical level. In the first two smoldering tests
(figure 12) smoke obscuration was below the critical level. For test 3
22

when the ventilation system was off the smoke obscuration (figure 13)
was below the critical level throughout the facility except for the burn
room. Even in the burn room the hazard level was not reached until 30
minutes into test 3.
In the low and high energy tests smoke obscuration was more severe.
With the exception of test 7 all of these tests were conducted with the
burn room door open. Test 4 was unique in that a fire retarded blanket
was on the bed. With the exception of tests 4 and 7, smoke obscuration
for both the low and high energy tests followed the same pattern, i.e.
smoke from the burn room flowed into the corridor and then into rooms 1
and 3. Obscuration of these spaces reached the critical level at 1 to 3
minutes into each test.
However, the danger due to CO concentration was very different for
the low and high energy tests. The COHb reached the critical level in
the burn room for test 7, a low energy test, at 22.6 min. This measure-
ment was not very meaningful for hazard analysis because it was measured
1.53 m (5 ft) above the floor over the bed in the fire plume. The
critical level of COHb was not reached for any other low energy tests.
However, critical levels of COHb and the instantaneous threshold of CO
were reached for several locations in the test facility during the high
energy tests. The times required to reach the critical level of COHb
and the instantaneous threshold of CO are listed in table 7.
5.5.3 Smoke Detection
Smoke detectors were included in this test series to examine their
performance. The ionization detectors used for this test series were
the same type as used by Bukowski [14] in a study of detector perform-
ance in health care occupancies. Bukowski reported activation times
during flaming tests of 15 to 45 s for ionizing detectors in the burn
room and 50 to 115 s for ionizing detectors in the corridor.
23

Throughout this test series smoke detectors were located in the
burn room and the corridor as shown in figure 3. Activation times for
these detectors are listed in table 8. During the smoldering tests the
corridor remained essentially smoke free and accordingly the corridor
detector was not activated. It is well known that the activation time
of ionization detectors is longer for smoke from smoldering fires than
for flaming fires. The activation time during the three smoldering
tests was in the range of 27 to 60 minutes which was considerably
greater than the activation times during the flaming tests.
As expected, the activation times for the low and high energy
flaming tests are for the most part in the same range as those reported
by Bukowski. Test 7 is an obvious exception with an activation time of
over a half hour for the corridor detector. This was because the burn
room door was closed during test 7.
5.6 Interstitial Space Exhaust
The purpose of exhausting the interstitial space in tests 8, 9 and
12 was to prevent smoke in the interstitial space from flowing down into
occupied spaces and thereby causing hazardous conditions. This is
equivalent to saying that the performance of an interstitial space
exhaust system should be such that it subjects the patients to no greater
danger than would occur in a hospital in which the interstitial space
had a solid floor. Room 2 can be considered a room in which a patient
might be subject to smoke flowing through the ceiling from the inter-
stitial space.
Workers who might be in the interstitial space at the time of a
fire need to be considered. It is reasonable to expect that maintenance
workers are capable of evacuating under their own power. One criteria
for allowable levels of smoke obscuration and CO concentration in the
interstitial space is that these levels it should be no worse than they
would be without an interstitial space exhaust.
24

Regarding the low energy fires of tests 8 and 9, the following
observations have been made in sections 5.3 and 5.5:
(1) The interstitial space exhaust had little effect on the smoke
obscuration in the interstitial space. Calculated COHb in the
interstitial space was well below the critical level and the
instantaneous threshold of CO was never reached.
(2) The optical densities in the patient rooms and in the corridor
were lower with than without the interstitial space exhaust.
(3) There was no indication of smoke movement from the interstitial
space into room 2
.
Therefore the interstitial space exhaust system successfully met
the above requirements when it was exposed to a low energy fire in these
tests
.
Regarding the high energy fire of test 12, the following observations
were made in sections 5.4 and 5.5:
(1) The interstitial space exhaust had little effect on the smoke
obscuration in the interstitial space. The time for calculated
COHb to reach the critical level was essentially the same with
or without the exhaust.
(2) The optical densities in the corridor and in the patient rooms
were lower with than without the interstitial space exhaust.
(3) There was some slight smoke movement through the ceiling of
room 2. However, the smoke obscuration was below the critical
level as was the calculated COHb. The CO concentrations never
reached the instantaneous threshold in room 2.
25

It can not be said that the exhaust system totally satisfied the
above requirements because there was some smoke movement through the
ceiling during the high energy fires. However, it can be said that this
smoke movement did not result in hazardous conditions in room 2. So, it
would appear that the interstitial exhaust system performed reasonably
well during the high energy fire. In a real hospital where the inter-
stitial space is larger, the result would be to dilute the smoke in the
interstitial space and thus reduce the problem even further.
5.7 Patient Room Exhaust
During test 10 the patient room exhaust system was operating. As
discussed in section 5.3.6, this exhaust reduced smoke concentration in
the corridor and rooms 1 and 3. The door to room 2 was sealed and room
2 remained essentially smoke free throughout the test. This might lead
someone to believe that the patient room exhaust could be used to pre-
vent smoke movement through the interstitial space. However, such a
conclusion is unjustified for reasons described below.
The pressure difference across the burn room ceiling for test 10 is
shown in figure 29. The pressure in the first 5 minutes of the test
indicates that the burn room was at a higher pressure than the intersti-
tial space. This would result in smoke flowing from the burn room into
the interstitial space. This positive pressure was due to the buoyancy
of the gas in the burn room as can be seen from the temperature curve
for this test in figure 15. After about 5 minutes the temperature in
the burn room decreased. With the buoyancy forces thus decreased, the
exhaust system dominated air flow across the ceiling. The negative
pressure across the ceiling after 5 minutes (figure 29) indicates flow
from the interstitial space into the burn room. Therefore, except for
the first 5 minutes of this test, no smoke flowed into the interstitial
space. Without similar pressures in room 2, air must have been pulled
by the exhaust fan from the interstitial space into room 2. The fact
that there was so little smoke in the interstitial space explains why
room 2 remained essentially smoke free during test 10.
26

Unfortunately the exhaust system could not be tested during a high
energy fire due to temperature limitations of the fan. This would not
necessarily be the case for real buildings where exhaust fans serving
larger areas would be subjected to lower temperatures due to dilution.
However, observation of the results of the high energy tests can yield
insight into what would happen if a high energy fire was exhausted. It
was seen in the first few minutes of test 10 that temperatures of 100° C
in the burn room forced smoke into the interstitial space in spite of
the inhibiting effect of the patient room exhaust system. The higher
temperatures from the high energy tests (figures 25 and 26) would result
in much more smoke being forced into the interstitial space over a
longer period of time. In such a situation, the exhaust system would
pull this same smoke, from the interstitial space into room 2. Therefore,
it can be concluded that if the conditions of test 10 were repeated for
a high energy fire, significant levels of smoke would have accumulated
in room 2 . These resulting room 2 concentrations would be even higher
in the case of a longer duration fire, which is frequently the case in
real buildings
.
5.8 Smoke Movement Paths
During this test series there was smoke movement through (1) open
doorways, (2) the crack under the doors, (3) the exhaust duct system,
and (4) the cracks in the ceiling system. During all high energy tests
and low energy tests except for test 7, there was considerable smoke
movement through the open burn room door into the corridor and from the
corridor into rooms 1 and 3 through open doors. During these tests the
smoke obscuration in the corridor and in rooms 1 and 3 were all in the
same range and were considerably higher than the smoke obscuration in
the interstitial space or in room 2. As one might expect, this indicates
that the smoke movement through the open doors is greater than that
through other paths mentioned above.
27

During the smoldering tests, small quantities of smoke were observed
leaking through the crack under the closed burn room door and into the
corridor. However, the resulting smoke obscuration in the corridor was
negligible. During tests 5, 6, and 8 smoke was observed flowing from
the corridor into room 2 through the crack under the door to room 2.
Although, this was the only observed path of smoke movement into room 2
during these tests, and the resulting smoke obscurations in room 2 were
significant. For test 9 the cracks around the door to room 2 were
sealed, and smoke was observed flowing into room 2 through the exhaust
duct (exhaust system not operating) . The resulting smoke obscuration in
room 2 was considerably lower during this test than when the door was
not sealed. The leakage through the exhaust duct system was less than
that through the crack under the door to room 2. A similar leakage was
observed through the exhaust duct system during high energy fire of test
11 .
For test 12, the supply register and the exhaust grill were sealed
in room 2. Smoke traces were observed around the ceiling tile near the
supply register after test 12. These traces indicated that there was
some smoke movement through the ceiling system, however it could not be
determined whether this smoke movement was into or out of room 2. The
smoke obscuration in room 2 during test 12 was quite low. This indicates
that any leakage that might have occurred from the interstitial space
into room 2 through the ceiling system would have been much less that
that through the other smoke movement paths discussed.
6. SUMMARY AND CONCLUSIONS
1. The use of the interstitial space exhaust at a rate of two air
changes per hour as described in this test series will effectively
prevent hazard conditions due to smoke downflow through the suspended
ceiling from the interstitial space during low or high energy fires
represented in this test series. This is discussed in detail in
section 5.6.
28

2. There was an indication of smoke leakage through the ceiling of
room 2 during test 12, a high energy test. While the direction of
the leakage was not determined, it is possible that smoke was
leaking into room 2 from the interstitial space. Hazard conditions
in room 2 due to smoke obscuration or due to CO concentrations did
not result. It can be further stated that this leakage was con-
siderably less than leakages observed through open doorways,
through cracks under closed doors, and through the exhaust duct
system. This is discussed in section 5.8.
3. Smoldering fires of the type examined in this test series are not a
significant problem in hospitals. This is discussed in section
5.2.
4. When the ceiling system was not subjected to high temperatures, the
most significant smoke leakage into the interstitial space was
observed flowing through the crack between the wall and the wall
molding of the ceiling suspension system. This was observed in the
smoke candle test and during the first 4 minutes of tests 11 and
12. This leakage existed in spite of the fact that this crack was
filled with an open cell foam.
5. When the ceiling system was exposed to high temperatures the metal
grid system warped and greatly increased the smoke flow through the
ceiling. This is discussed in detail in section 5.4.3.
6. The use of the fire retardant blanket (matrix fiber of 50 percent
vinyl and 50 percent vinyon) on the bed fire of test 4 resulted in
significantly lower temperature and smoke production than the use
of a cotton blanket on the bed fire. This is discussed in section
5.3.1.
29

7 . The use of the patient room exhaust air system reduced smoke
concentration throughout the test facility in test 10 as discussed
in section 5.3.6. During this low energy fire room 2 was virtually
smoke free. However, in the event of a high energy fire significant
smoke levels in room 2 would probably result even with this exhaust
system. The reasons for this statement are discussed in section
5.7.
8. Closing the burn room door for the low energy fire of test 7
resulted in higher CO concentrations in the burn room. Test 7 was
the only low energy test where critical levels of calculated COHb
were reached in the burn room. However, closing the burn room door
did result in lower smoke obscuration and CO concentrations outside
the burner room. This is discussed in section 5.3.6.
9. The movement of smoke produced by a smoke candle is considerably
different than the movement of smoke from a flaming or smoldering
fire. This is discussed in section 5.5.1.
10. The activation times of the ionizing smoke detectors during flaming
tests were found to be consistent with previous work. This is
discussed in section 5.5.3.
7
.
ACKNOWLEDGEMENTS
Appreciation is expressed to Lionel Issen and William Bailey for
their contributions to the design and construction of the test facility.
Appreciation is also expressed to Warren Hayes, Richard Zile and
Melvin Womble for instrumentating of the test facility and conducting
the experiments. The author is especially appreciative of Warren Hayes
for his effort in developing a highly reproducible smoldering fire.
Thanks are due to Richard Peacock who wrote the computer graphics
30

routine used to generate the graphs in this paper. Thanks are also due
to Sandra Nowstrup for using that routine to generate those graphs.
Special thanks are due to Emil Braun who wrote the computer routines
used for data acquisition and data reduction.
8 . REFERENCES
[1] Fire Resistance Directory, Underwriters Laboratory (Jan. 1980)
.
[2] McCaffrey, B. J. and Heskestad, G., A Robust Bidirectional Low
Velocity Probe for Flame and Fire Application, Combustion and
Flame, Vol. 26, 125-7, (1976).
[3] Babrauskas, V., Combustion of Mattresses Exposed to Flaming
Ignition Sources, Part 1 Full-Scale Tests and Hazard Analysis, Nat.
Bur. Stand. (U.S.), NBSIR 77-1290, (Sept. 1977).
[4] O'Neill, J. G. and Hayes, W. D., Full-Scale Fire Tests with
Automatic Sprinklers in a Patient Room, Nat. Bur. Stand. (U.S.),
NBSIR 79-1749, (June 1979).
[5] O'Neill, J. G. and Hayes, W. D., Full-Scale Fire Tests with
Automatic Sprinklers in a Patient Room - Part II, Nat. Bur. Stand.
(U.S.), NBSIR 80-2097, (July 1980).
[6] Jin, T., Visibility through Fire Smoke, Part 2, Report of the Fire
Research Institute of Japan, No. 33, 31-48 (1971). Part 5, Report
of Fire Research Institute of Japan, No. 42, 12-18 (1975) .
[7] Jin, T., Visibility through Fire Smoke, Main Reports on Production,
Movement and Control of Smoke in Buildings, pp. 100-153, Japanese
Association of Fire Science and Engineering (1974)
.
31

[8] Steward, R. D. ,et al, Experimental Human Exposure to High
Concentrations of Carbon Monoxide, Architectural Environmental
Health, Vol . 26, 1-7 (Jan. 1973).
[9] Parker, J. E., Jr. and West, V. R. , Bioastronautics Data Book, NASA
SP-3006, Chapter II, Scientific and Technical Information Office,
NASA (1973)
.
[10] Alarie, Y. and Zullo, P., Predicting Carboxyhemoglobin for Different
Patterns of Carbon Monoxide Exposure, Industrial Health Foundation
Symposium on Carbon Monoxide, pp 18-46, Pittsburgh, Pa (1974)
.
[11] Kimmerle, G., Aspects and Methodology for the Evaluation of
Toxicological Parameters during Fire Exposure, Journal of Fire and
Flammability/Combustion Toxicology, Vol. 1, 4-41 (Feb. 1974).
[12] Stewart, R. D., The Effect of Carbon Monoxide on Man, Journal of
Fire and Flammability/Combustion Toxicology, Vol. 1, 167-176 (1974).
[13] Claudy, W. D., Respiratory Hazards of the Fire Service, National
Fire Protection Assn., Boston, MA (1957).
[14] Bukowski, R. W. , Tests on the Performance of Automatic Fire Detectors
in Health Care Occupancies - A Preliminary Report, Nat. Bur. Stand.
(U.S.), NBSIR 79-1739 (April 1979).
32

40-0
33
Figure
1.
Floor
plan
of
test
facility

34
Figure
2.
Section
of
test
facility

35
Figure
3.
Ceiling
plan
of
test
facility

36
Figure
4.
Ventilation
system
for
test
facility

or-
1
I
oo
rH t3c cO aj
cn voi iH -P
w wp pCfl CO
O 0)
-p -p
p po oft ft
TJ T34J <DM WP P
w wP1 ftc c<U (U
p pp pw wc c
I—I M* *
*
P
oa)
ft
Pw0)
ppoft
caj
pft
co•Hpaj
PC<L)
PPw
tr\
oppS>0•HP>H
00
ss>-00
•<l> ^ > © ©
37

yy_i
a.00
Q_ LUh*O LU LUo 00 So oS Q
0
luVl-*
00 Qu OLU O1— o c/5
• $ *
38
Figure
6.
Instrumentation
plan
for
interstitial
space

X 07*v52aa J^30A
I t4 • AA 4 31A
12A
08«v51
SYMBOLS
• THERMOCOUPLE
SMOKE METER LIGHT PATH
V VELOCITY PROBE
AA INSTRUMENTS USED FOR
TESTS 4 - 6 AND 8 - 10
Figure 7- Instrumentation in burn room doorway
39

56
ooi\> # 1,A 430 a (S) sen01 @02 ®03®
SYMBOLS
• THERMOCOUPLE
-© 00 PROBE
SMOKE METER PATH
PRESSURE PROBE
® SMOKE DETECTOR
(S) TELL TAIL SPRINKLER
A INSTRUMENTS USED FOR TESTS 1-3 ONLY
Figure 8. Instrumentation in burn room
UO

SYMBOLS
• THERMOCOUPLE
NOTES
:
1. Room 2 window was open for tests1-3 only. All other windows wereclosed throughout the test series
-©- CO PROBE 2. Heights of smoke meter,thermocouple and CO probe in rooms
. 2 and 3 are the same as for room 1
.
<4 SMOKE METER LIGHT PATH
V VELOCITY PROBE
INSTRUMENTS USED FOR TESTS 1-3 ONLY
Figure 9. Instrumentation in room 1
1+1

Q3S01Q Q3S010
03S010 03S013
U2
Figure
10.
Floor
plan
for
test
facility
showing
status
of
doors
and
windows
during
the
tests

6 5-c< LU 5 in
2t+. bJ CO •
Id OQ£ oq: J _•
in O ^ ^ OrcoBoh- fe*2< I
i—• X. I
—
goo
LO00
GC\J
r\c
ELO
LUz;H
g
LO
Gg LO G VO G VO G) X GG r- X 00 G r- LO 00
C\l G G G
(/)
(1)
(D
T5C00
©_Y0EW
©X
L0
c0
0L00wX0
<D
_Y0ECO
©L0U)
Li_
c^/aco Nonvanosgo1+3

bJ ZOt- o:o
CS)
<0
cs>
LO
G)^r
r\C
EQ w00
Ld
H
CS)
(\J
G>
G>G> LO G) LO G) LO G> LO G)G> LO 00 G) n- LO 00
C\J ,
—
,
—
,
—
s> S> G)
c^/aco Nonvdnosaouu
Figure
12.
Smoke
obscuration
in
the
burn
room
and
the
interstitial
space
for
tests
1
and
2.

CD
<S>
LO
<S^r
<sco
Q(\J
<5>
Q£> LO LO O L
0
s» LOO h- LO 00 s> r- LO 00
00 ,
—
,
—
0 © O
r\C
£
LlI
21HI—
c^/aco Nonvanosao^5
Figure
13.
Smoke
obscuration
in
the
burn
room
and
the
interstitial
space
'For
tests
2
and
3.
0091
cj 93 a) 3aniva3dW3i
Figure
14.
Upper
gas
temperatures
for
tests
4
through
7.

1600
G)CO
LO(\J
G>OJ
r\C
ELO w
LlJ
z:HI—
g>
- LO
G>G) G) G) G) G) G) G) G) G)G) G) G) G> G) G) G) G)OO CO LO OO C\J
| 1
CO 93a>
i
3dnivd3dW3i_i i i
| i
G> G) G) G> G) G) G) G)G> G> G) G) G) G> G)
OJ G) 00 CO 00
W<D
LD
-4->
0 •
LG)CD —aE X0) 0)
-+J 00
(/) L0 X0-4J
LOO0)
a wQ.-P
X w<D
• -»->
LO— L0
d)t+-
L00)
X
cj 93 a) 3amva3dW3i
47

G)oo
LOOJ
G)C\J
r\C
ELO vy
LU21H
G)
LO
G>g> LO g> LO LO © LO G)G> r- LO OJ <s> LO CJ
OJ ,
—
,
—
0 G> G>
LO
"0
c0
to
-4->
to
(1)
L04-
C0
-4->
0LD0to
_Q0
0E
(/)
<0
(1)
L0U)
Li_
c^/ao) Nonvanosao
bQ

cw/ao) Nonvmosaoi>9

00 lN30d3d
LO
W<D
L04-
Wc0
0L-p
c<D
0c00
~0
X0c0£
c0_QL0o
00
<d
LDU)
Ll
50

ovaco Nonvanosao
51

rG>00
OC _
LO
x E
LU ^§ d
<+- I—
O GO
in<
O JXkJZ<LICQ
LOOJ
G>00
r\C
ELO
LUz:H
©
LO
h-
G>G) LO G> LO Q LO © LO ©G) r- LO 00 © r- LO 00
C\J -*r— .r— G) G) G)
c^/gcd Nonvanosao
52
Figure
20.
Smoke
obscuration
for
test

t
—
r
2o..onq:hI-Z2cn cn oLIDO
HZ2COOIOUDOI— CQ 01
G>00
U)(\J
G)<\l
r\C
EL0 ^
LUz:HI—
G)
UO
G>G> OO (0 ^r C\J G)
G) G) G) G)
C\J
Q)
LDCD
00 INdOddd
53
Carbon
monoxide
concentrations
for
tests
6
and
7.

CD LO CD LO Q LO G> LO <S>
Q LO 00 Q r- LO 00
C\1 Q Q <3
ovacD Nonvdnosao
5 1*
Figure
22.
Smoke
obscuration
for
test

00 !N30d3d
CM
CD
LDU)
Li-
53
Carbon
monoxide
concentrations
For
tests
6
and
7.

oo
c^/gcd Nonvanosao
5 ^
Figure
22.
Smoke
obscuration
for
test

© LO © LO © LO © LO ©© LO 00 © LO C\i
00 -
—
© © ©cw/aco Nonvmosao
55
Figure
23.
Smoke
obscuration
for
test

© LO © LO © Si) © LO ©© Lf) CVJ © r- LO (\S
CM -r— © © ©cvacD NQiivmosao
56

ovaco Nonvmosao55
Figure
23.
Smoke
obscuration
for
test

© LO 0 ID LO G> LO G)G) LO (\l CD r- LO 00
(NJ ,— G) G> <s>
cw/aco Noiivanosao
56

Q L
O
g> LO G> LO G> LO G>G> in 00 G> LO 00
00 ,
—
G) G) G)
c^/aco Nonvanosao55
Figure
23.
Smoke
obscuration
for
test

c^/aco Nonvanosao
56

1600
L
g G G g G g G) G) G)g G g G Q G) G Goo r- (0 LO CO 00
CO 030) 3dfUVd3dW31
G G) G G G G G GG G G) G G G G
C\J G OO (Q <\J
r\C
E
LUz:HI—
W<D
L0
<+-
wCD
LD-p
0LCD
aEQ)
1
-
L
0
C\J
LDD)
Li_
C3 930) 3dniVd3dW31
57

1600
co 93 a) 3dnivd3dU3i
' i i i' _i
Q g G G G G G G GG G G G> G G G G00 r- CO L
0
m-CO CM
G G G G G G G GG G G G G G GM" CM G OO <0 CM
C 3 93a) 3dniVd3dW31
58

G> LO G) LO g> LO G) LO G)G> r- LO C\J G> LO CM
C\] ,
—
G> G) G)
ovaco Nonvanosao59

00 IN30&3d
<s> oo CO ^r C\1 G>
o <S> <s> <s
60

C 0 cD 33N3d3 JJIG 3dRSS3dd
G>
c
CD
0
£00L
cLD_Q
W(/)
0L00
CD
0c<D
LCD
tf-
**-
~0
0LDWWQ)
LCL
<\J
"0
c0
Q
to
-p
w0-p
L0
<+-
O)00
0LDU)
Li-
61

Q<0
©L
0
©
©00
©CM
©
©© UO © ljo © L
0
© L0 ©© r- L0 CM © If) CM
CM x— x— X— © © ©
r\C
£\y
LUz;Hb-
c w/ao) Nonvanosao62
Figure
30.
Smoke
obscuration
for
the
smoke
candle
test
and
test
1
.

Table 1. Fan Schedule
FanNumber
Capacity(cfm) Type Use
1 500 Centrifugal Supply2 500 Centrifugal Exhaust3 300 Radial4 120 Radial
Ventilation
5 120 Radialof inter-
6 300 Radialstitial space
6 3

Table 2. List of Instrumentation
Number Thermocouples
00
0102
03
04
05
06
07
08
09
10
11
12
13
14
15
16
17
18
19
20
23
24
25
11A12A
Burn room 0.1 m (4 in) below ceilingBurn room 0.2 m (8 in) below ceilingBurn room 0.3 m (12 in) below ceilingBurn room 0.4 m (16 in) below ceilingBurn room 0.8 m (31 in) below ceilingBurn room 1.2 m (3.9 ft) below ceilingBurn room floorBurn room doorway 0.1 m (4 in) below top
Burn room doorway 0.1 m (4 in) above floorBurn room floor under bedBurn room floor under wastebasket ....
Burn room 0.13 m (5 in) below ceiling^.Burn room 1.53 m (5.0 ft) above floor .
Burn room 0.81 m (32 in) above floorRoom 1 - 1.53 m (5.0 ft) above floorRoom 2 - 1.53 m (5.0 ft) above floorRoom 3 - 1.53 m (5.0 ft) above floorCorridor 1.53 m (5.0 ft) above floorCorridor 0.13 m (5 in) below ceilingInterstitial space 0.76 m (30 in) below topInterstitial space 0.13 m (5 in) below top..
.
Window of room 1 - 0.1 m (4 in) below topWindow of room 2 - 0.1 m (4 in) above bottomOutside air
( 1 )
Burn room doorway 0.1 m (4 in) below top ( 2 )
Burn room doorway 1.53 m (5.0 ft) above floor ( 2 )
Number Smoke Meters
30
31
32
33
34
35
36
37
38
39
30A31
A
( 1 )
( 1 )
Burn room 0.13 m (5 in) below ceilingBurn room 1.53 m (5.0 ft) above floor'
Burn room 0.81 m (32 in) above floor
^
Room 1 - 1.53 m (5.0 ft)
Room 2 - 1.53 m (5.0 ft)
Room 3 - 1.53 m (5.0 ft)
Corridor 1.53 m (f.O ft)
above floorabove floorabove floorabove floor
Corridor 0.13 m (5 in) below ceilingInsterstitial space 0.76 m (30 in) below topInsterstitial space 0.13 m (5 in) below t^p
Burn room doorway 0.1 m (4 in) below topBurn room doorway 1.53 m (5.0 ft) above floor ( 2 )
These instruments were only used for tests 1-3.
These instruments were used for tests 4-6 and 8-10.
6k

Table 2. List of Instrumentation (cont'd)
Numb er CO Probes
40
4142
43
44
(3)Burn room 1.53 m (5.0 ft) above floorRoom 1 - 0.81 m (32 in) above floorRoom 2 - 0.81 m (32 in) above floorRoom 3 - 0.81 m (32 in) above floorInterstitial space 0.76 m (30 in) below top^
Number Velocity Probes
50
51
54
55
Burn room doorway 0.1 m (4 in) below topBurn room doorway 0.1 m (4 in) above bottom.
Window of room 1 - 0.1 m (4 in) below top . .
Window of room 1 - 0.1 m (4 in) above bottom'
Number Differential Pressure
56 Across burn room ceiling
These instruments were only used for tests 1-3.
These instruments malfunctioned during test 8.
65

Table
3.
Test
Schedule
cOuo
e S oo o3 3 3
>4-1 4-4 o
X X 4->
3 a) 0)
> > 0O o 36 e cfl
0) 00 3 00 i—
i
0 3 3 3 3 03 •H •Heg CO r—
4
CO t—
4
3(3 <u •H 3 •H 33 1—
1
3 I—
1
3 3PS •r4 3 •rH 3 X
4-1 4-1 30 0 3
00 O 00 O 33 O a O 3•H 3 •H 3 3i—
I
rH•H 3 •H 3 3d) 3 (1) 3 0O 3 a 3 30 0 t—
1
04 CN P
4-1
i—
1
CO
cd 3•H cO4-1 ,3•H X 4-4 4-4 4-1 444-1 W 44 4-4 4-1 44CO o o O Ou 3cu CJ4-1 cO
a coM c/o
04-1 d)
CO 4-1
2 CO 4-4
cd Oo 3 3 4-4 3rG cn O O o OXw 0
•H<3
03
O'* 4->
rH CO 4-1
p to 3 3 4h 3P C/0 O O o O3C/0
•H<
t—
1
b Xo 3
S X) 3 3 a 3o 3 d) 3 a) Oo •H P P a i—
4
Pi & O O o O
0oo 1-1 X X T3PS o 3 3 CU
o CO CO CO 30 Q o o O 3(-4 0 t—
4
rH P3 a C_> CJ OCQ
3 00 00 bO >4p 3 3 a ooOo •r-4 •H •H 3H 3 3 U 3
3 3 (U 34-1 X) X "d WCO i—
1
t—4 rHc
u
O O o &0 0 0 0 OC/0 C/0 CO 4
11
4-1
CO I—
1
04 CO <rcu
3
X3PP
o 33 3 33 3O 3 33 3 O3 OX 3 X
3 3-3 B 04
O 3 0 3r-l O O 3
3 O 303 3 3 300 O . 33 3 XO 3 4-4
3 3 300! O O3 'r
' 3 33 3 3
in 3 30 3 3
3 0 F—S3 3 a 33 r-4 3 O3 03 3 44H U
4H 4H 44 Ol Ol4h 4-1 4-1 C
i 3O o O C> O
'
4-4 4-r 4-1 4-1
3 4-4 4-1 4-f 4-1
O o o o o
4-1 4-1 4-1 4-1
3 4-1 4H 4-1 4-1
O o O o o
"O "d 'dCD <U cu cu <u
CO CO CO CO CO
O o o o oi—
1 tH rH t—
i\
—
1
u CJ CJ CJ a
3 3
"dcu
CO 3 33 3 o 3 3p £ rH P PO O O O
Oo P00 oo 00 00 003 3 3 3 33 3 3 3 33 3 3 3 3W W W W Ws & 5 5 so O o o o0 0 0 0 0
m cD ro 00 CO
"dCcd
CM
3 g3 O3 O3 33
31 -H
CO CO X)co CO 33 3 03 3 33 3 3 33 3 CO O3 3 X0 0 3 •rH
i—
1
33 3 0 33 3 0 O3 3 3 30 0 003 3 33 3 Oo 03 3 0 33 3 P
0Oo P P0 0 3 OO O 3 3P P 0
33OoX
4-1 44 CM 34-1 44 3 OO O O •H
333X3
303
X3
44 0 33 44 0O o o • r
X33O
i—
I
U
33&
44 44 0 3 •
44 44 0 O /-VO o o O 0X 4-1
UCM O0 rHO r—
1
O3X X X CO
3 3 3 • r« \CO CO 3 3 o*O O O 3
i—
1
i-4 i—
1
p CNo O CJ O m
3 . CO
3 X cd
3 3 £15 3
O <u
3 0 H3 3 cd
3 3 3 O u3 3 3 O 3P P P X 3 4-1
O O O 3 CO
cn 5 dcd
X 0 rC3 O X3 o cu
Oo Oo 3P 00 00 0 cu
00 3 30
3 a3 3 3 3 cd
3 3 3 O 3 a3 W W O 0 co
W 0 03
3 *H15 00 00 3 0 cd
O *H •H 3 3 •H0 35 X 3
04J
3 •HO 4->
i—
1
3 CO0 0 u3 cu
X 4-1
O rH CM 3 3 ciH I—
1
i—
1
0 3 Mi—
1
CN
66

Table 4. Ignition Source
Wastebasket — Polyethylene wastebasket
Size: 248 mm x 178 mm x 254 mm highWeight: 282 g (.6 lb)
Trash contents, in order of stacking
1
— Polyethylene liner16 — Sheets of newspaper1 — Paper cup, 85 g (3 oz.), crumpled2 — Sheets of writing paper3 — Tissues, paper handkerchief, crumpled1 — Cigarette pack, crumpled1 — Milk carton, 227 g (8 oz.)
2 — Paper cup, 85 g (3 oz.)
,
crumpled1 — Cigarette pack, crumpled1 — Sheet of writing paper, crumpled2 — Tissues, paper handkerchief, crumpled
Total weight of contents: 443 g (.97 lb)
Combined weight, wastebasket and contents: 725 g (1.6 lb)

Table 5. Technical Data for Mattress andBedding for Tests 4-10
'{t
TotalSize (m) Weight
Mattress Width Length Thickness (kg)
Fire RetardantCotton Innerspring 0.91 2.03 0.17 23
Bedding ItemSize
Width(m)
Length Composition
TotalWeight(kg)
Fire RetardantBlanket 2.29 1.68
Matrix Fiber50% vinyl50% vinyon
1.41
(2)Cotton Blanket 2.29 1.68 Cotton 1.54
Sheet 2.74 1.96 65% Polyester35% Cotton
0.65
Pillow Case 0.91 0.53 65% Polyester35% Cotton
0.13
Pillow 0.69 0.52 Cotton Cover,Duck FeatherFilling
1.50
Fire retardant2Cotton blanket
blanket used in test 4 only,
used in tests 5-10.
68

Table 6. Technical Data for Mattress and Beddingfor Tests 11 and 12
Total WeightSize (m) Weight Combustibles
Mattress Width Length Thickness (kg) (kg)
PolyurethaneInnerspring 0.89 2.03 0.17 15 6
Bedding ItemSize
Width(m)
Length Composition
TotalWeight(kg)
Spread 2.79 1.93 50% Cotton50% Polyester
1.07
Sheet andDrawsheet 2.64 1.83
50% Cotton50% Polyester 0.60
Pillow Case 0.91 0.53 50% Cotton50% Polyester
0.60
Pillow- Filling- Cover 0.69 0.52
PolyurethaneCotton
0.67
0.16
Pillow 0.69 0.53 Polyvinyl chloride 0.90Protector
69

Table 7 . Times to Hazard Level Dueto CO Concentrations
Test Space
TimeCOHb>25%
(min)
CO>1%
7 Burn Room 22.6 -
11 Burn Room - 4.7
11 Room 1 9.2 -
11 Room 3 9.5 -
11 Interstitial Space 19 -
12 Burn Room^^ - -
12 Room 1 9.8 -
12 Room 3 11.1 -
12 Interstitial Space 18 -
‘'‘CO analyzer failure.
70

Table 8. Smoke Detector Activation Times
Test Test TypeTime
Burn Room(sec)
Corridor
1 Smoldering 3567 N/A
2 Smoldering 2679 N/A
3 Smoldering 1604 N/A
4 Low Energy 43.7 71.2
5 Low Energy 37.2 49.4
6 Low Energy 15.2 26.7
7 Low Energy 20.0 2024
8 Low Energy 34.9 53.1
9 Low Energy 54.5 72.3
10 Low Energy 54.4 66 .
6
11 High Energy 20.4 37.4
12 High Energy 22.0 42.6
Note: N/A = not activated during test
71

NBS-1T4A (rev. 2 -ec)
U.S. DEPT. OF COMM.
BIBLIOGRAPHIC DATASHEET (See instructions)
1. PUBLICATION ORREPORT NO.NBSIR 81-2444
2. Performing Organ. Report No, 3. Publ i cation Date
February 1982
4. TITLE AND SUBTITLESMOKE MOVEMENT THROUGH A SUSPENDED CEILING SYSTEM
5. AUTHOR(S)
John H. Klote6. PERFORMING ORGANIZATION (If joint or other than NBS. see instructions)
NATIONAL BUREAU OF STANDARDSDEPARTMENT OF COMMERCEWASHINGTON, D.C. 20234
7. Contract/Grant No.
8 . Type of Report & Period Covered
Final Report
9. SPONSORING ORGANIZATION NAME AND COMPLETE ADDRESS (Street, City . State. ZIP)
andVeterans AdministrationOffice of Construction ResearchWashington, D.C. 20420
Department of Health and Human ServicesWashington, D.C. 20201
10.
SUPPLEMENTARY NOTES
! J Document describes a computer program; SF-185, FIPS Software Summary, is attached.
11.
ABSTRACT (A 200-word or less factual summary of most significant information. If document includes a significantbi bliography or literature survey, mention it here)
A series of full-scale tests were conducted to evaluate smoke movementthrough a suspended ceiling and into an interstitial space of a hospital type
facility. A test facility specifically constructed for this project is
described. The test series consisted of one smoke candle test and 12 fire
tests including both smoldering and flaming fires. Smoke movement through
the suspended ceiling system was evaluated in terms of the total smoke
movement through the test facility. The effects of ventilation and smoke
exhaust on smoke concentration in the test facility were investigated.12.
KEY WORDS (Six to twelve entries; alphabetical order; capitalize only proper names; and separate key words by semicolon s)
Ceiling systems; hazard analysis; hospitals; interstitial space; mattresses;
smoke control; smoke exhaust; smoke movement; ventilation systems
13.
AVAILABILITY
[^Unlimited
1 |
For Official Distribution. Do Not Release to NTIS
PJ Order From Superintendent of Documents, U.S. Government Printing Office, Washington, D.C.20402.
py] Order From National Technical Information Service (NTIS), Springfield, VA. 22161
14. NO. OFPRINTED PAGES
77
15. Price
$ 10.50
USCOMM-DC 6043-P80


i
J
1
I