Embed Size (px)
Citation preview

Presented to:
By:
Date:
Smoke Generator Standardization
and
The Effects of Environmental Variations
International Aircraft Systems Fire Protection Forum
Matthew Karp
October 31, 2018
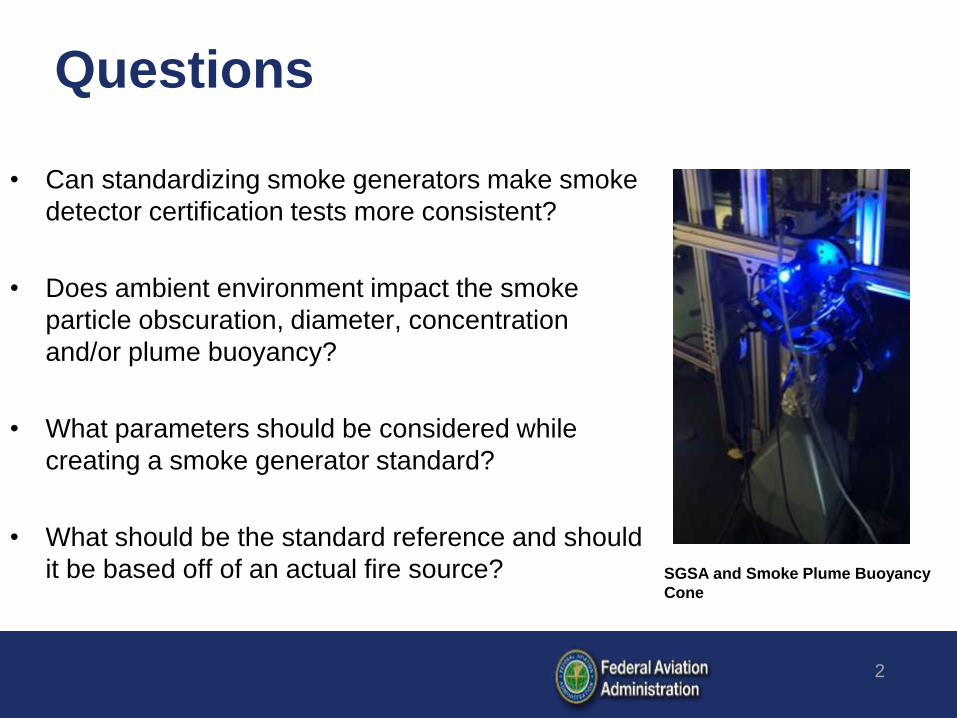
Questions
• Can standardizing smoke generators make smoke
detector certification tests more consistent?
• Does ambient environment impact the smoke
particle obscuration, diameter, concentration
and/or plume buoyancy?
• What parameters should be considered while
creating a smoke generator standard?
• What should be the standard reference and should
it be based off of an actual fire source?
2
SGSA and Smoke Plume Buoyancy
Cone

Altitude Chamber
• 8’ length by 6’ width by 6’ height
• Controls
– Temperature
• As low as: -100F
– Pressure
• As low as: 2psia
• Tested range
– Temperature
• 50F – 90F
– Pressure
• 10psia – 14.7psia
3
Altitude Chamber

Test Apparatus
• 5 Smoke Detectors
• 1 Blue and 1 IR light scattering measurement
(SGSA)
– 3” below ceiling
• 1 SMPS
– 3” below ceiling
• 5 Thermocouples
– 0”, 5”, 11”, 23” and 35” above smoke generator
• 2 Anemometers
– 10” and 20” above smoke generator
• 6 Obscuration Meters
– 6”, 12”, 18”, 24”, 36” and 40” above smoke
generator
4
Thermocouples, anemometers and
obscuration meters
SGSA and smoke detectors

Smoke Generators • Concept Aviator UL
– Non-pressurized tank for steady
smoke release
– High user adjustability
• Oil temperature
• Heat exchanger temperature
• Chimney temperature 0-100%
• Smoke density valve
5
Concept Aviator
• Siemens Cerberus
– Pressurized tank for instant smoke
release
– Preset smoke programs with timed
bursts of smoke
• Tested programs 3, 5 and 6
• Various heat outputs
• Two possible exit nozzles
Siemens Cerberus

• Potential Parameters
– Amplitude
• Possible maximum threshold
– Steady State Obscuration
• Characterizes total smoke
obscuration
– Dependent on volume
– Time Dependent Reference Curve
• Duration of smoke plume
• Minimum and maximum bounds
(± 5%obscuration/ft)
– Area Under the Curve
Time vs % Obscuration
Arbitrary Concept Aviator settings
Smoke Obscuration
Duration of Smoke Plume
0
20
40
60
80
100
0 50 100 150
%O
bsc
ura
tio
n/f
t
Time, s
Amplitude Steady State Obscuration

Smoke Obscuration - Temperature
• Positive correlation between the
steady state percent obscuration
per foot and the ambient
temperature
– within tested range of 50-90F
• Most observable at sea level
– Varies from:
17%obscuration/ft at 50F to
30%obscuration/ft at 90F with
program 5 at sea level
Steady state percent obscuration per foot vs
temperature with various test conditions and
settings with Siemens Cerberus
0
20
40
60
80
100
120
0 20 40 60
Tem
pe
ratu
re,
F
%Obscuration/ft
3 - Sea Level - Prog 6 3 - Altitude - Prog 5
3 - Altitude - Prog 3 3 - Sea Level - Prog 5

Scanning Mobility Particle Sizer (SMPS) • How does the SMPS work?
– An impactor removes large particles
and measures flow.
– A neutralizer creates a well-
characterized charge distribution on the
particles.
– Inside a Differential Mobility Analyzer
(DMA), the charged particles
experience an electrical field that
separates particles based on their
electrical mobility and outputs a
monodisperse aerosol.
• Electrical mobility is inversely
related to particle size
– The condensation particle counter
(CPC) counts the monodispersed
particles as they exit the DMA.
8
Electrostatic classifier model 3082 with Long DMA, Left
Condensation particle counter model 3756, Right

Particle Characterization
• Particle size and distribution
changes with ambient
temperature and pressure
– 8000ft altitude 90F– reds
– 8000ft altitude 50F – greens
– Ambient 90F – purples
– Ambient 50F – yellows
9
0.0E+00
5.0E+06
1.0E+07
1.5E+07
2.0E+07
2.5E+07
3.0E+07
50 250 450N
orm
aliz
ed
Co
nce
ntr
atio
n,
dW
/dlo
gDp
Diameter, nm
Diameter vs particle concentration
Test samples of 60 seconds starting at 90 seconds
after gas release with Siemens Cerberus Program 5

Particle Characterization
• Particle size and distribution
changes with time of
measurement
• 60 second data collection
starting at:
1. 10 seconds – purples
• Upper limits of
condensation particle
counter
2. 90 seconds – yellows
3. 210 seconds – greens
10
Diameter vs particle concentration
Test samples of 60 seconds starting at 10, 90 and
210 seconds with Siemens Cerberus Program 5
0.0E+00
1.0E+07
2.0E+07
3.0E+07
4.0E+07
5.0E+07
0 200 400 600N
orm
aliz
ed
Co
nce
ntr
atio
n, d
W/d
logD
p
Diameter, nm

Particle Characterization
• Siemens Cerberus Diameter
– Program 3: 176±18nm
– Program 5,6: 246±20nm
• Concept Aviator Diameter
– Varies by setting
– Ranges from: 108 – 374nm
• The average total concentration
varies mostly by time of collection
– Wide range:
5.4-46million/cm³
– Higher concentrations when
measured shortly after gas
release
11
Diameter vs particle concentration
Individual test sample averages of various programs
and environmental settings with Siemens Cerberus
and Aviator UL
0.0E+00
1.0E+07
2.0E+07
3.0E+07
4.0E+07
5.0E+07
100 200 300 400
To
tal
Co
ncen
trati
on
, #/c
m³
Geometric Average Diameter, nm
Prog 5 - 90F - 14.7psia Prog 5 - 50F - 14.7psiaProg 5 - 90F - 10psia Prog 5 - 50F - 10psiaProg 6 - 90F - 14.7psia Prog 6 - 50F - 14.7psiaProg 6 - 90F - 10psia Prog 3 - 90F - 14.7psiaProg 3 - 90F - 10psia Prog 3 - 50F - 10psiaAviator UL

Particle Size - Temperature
12
0
25
50
75
100
150 200 250 300
Tem
pe
ratu
re,
F
Geometric Mean Diameter, nm
3 - Sea Level - Prog 6 2 - Sea Level - Prog 6
2 - Sea Level - Prog 5 3 - Sea Level - Prog 5
2 - Altitude - Prog 5 3 - Altitude - Prog 5
2 - Altitude - Prog 3 3 - Altitude - Prog 3
• There is a slight but
observable trend
– Increasing the
temperature causes a
slight increase in
geometric mean diameter
– Varies from:
196nm at 50F to
243nm at 90F with
program 5 at sea level
Diameter vs temperature
Test samples of 60 seconds with varying sampling starts,
programs and environment with Siemens Cerberus

Particle Size - Pressure
• There is a slight but
observable trend
– Increasing the pressure
causes a slight decrease
in geometric mean
diameter
– Varies from:
167nm at 14.7psia to
208nm at 10psia with
program 3 at 90F
13
5
10
15
150 200 250 300
Pre
ssu
re, p
sia
Geometric Mean Diameter, nm
2 - ~50F - Prog 5 3 - ~50F - Prog 5 2 - ~90F - Prog 5
3 - ~90F - Prog 5 2 - ~90F - Prog 3 3 - ~90F - Prog 3
3 - ~90F - Prog 6 2 - ~90F - Prog 6
Diameter vs pressure
Test samples of 60 seconds with varying sampling starts,
programs and environment with Siemens Cerberus

Particle Concentration - Temperature
• There is a slight but
observable trend
– Increasing the
temperature causes a
slight increase in particle
concentration
– Within the tested range, the
environmental impact on
particle concentration
appears insignificant
14
0
25
50
75
100
5.00E+06 1.00E+07 1.50E+07 2.00E+07
Tem
pe
ratu
re,
F
Total Concentration, #/cm³
3 - Sea Level - Prog 6 2 - Sea Level - Prog 6 2 - Altitude - Prog 5
3 - Altitude - Prog 5 2 - Altitude - Prog 3 3 - Altitude - Prog 3
2 - Sea Level - Prog 5 3 - Sea Level - Prog 5
Total concentration vs temperature
Test samples of 60 seconds with varying sampling starts,
programs and environment with Siemens Cerberus

Particle Concentration - Pressure
• There is a slight but
observable trend
– Increasing the pressure
causes a slight decrease
in particle concentration
– Within the tested range, the
environmental impact on
particle concentration
appears insignificant
15
5
10
15
5.00E+06 1.00E+07 1.50E+07 2.00E+07
Pre
ssu
re, p
sia
Total Concentration, #/cm³
2 - ~50F - Prog 5 3 - ~50F - Prog 5 2 - ~90F - Prog 5
3 - ~90F - Prog 5 2 - ~90F - Prog 3 3 - ~90F - Prog 3
3 - ~90F - Prog 6 2 - ~90F - Prog 6
Total concentration vs pressure
Test samples of 60 seconds with varying sampling starts,
programs and environment with Siemens Cerberus

Theory
Light Scattering
• Mie Scattering Theory governs light scattering by sub-micron particles
• The general solution is found through the application of Maxwell’s equation
• A simplified approximation of Mie scattering is given by van de Hulst [6]
𝑸 = 𝟐 −𝟒
𝒑𝐬𝐢𝐧 𝒑 +
𝟒
𝒑𝟐(𝟏 − 𝐜𝐨𝐬 𝒑 )
• Where Q is the efficiency factor of scattering
𝒑 =𝟒𝝅𝒂 𝒏 − 𝟏
λ
• This shows that the scattering intensity is a function of
– n, Refractive index of the particle
– a, radius of the particle
– λ, Wavelength of the incident light
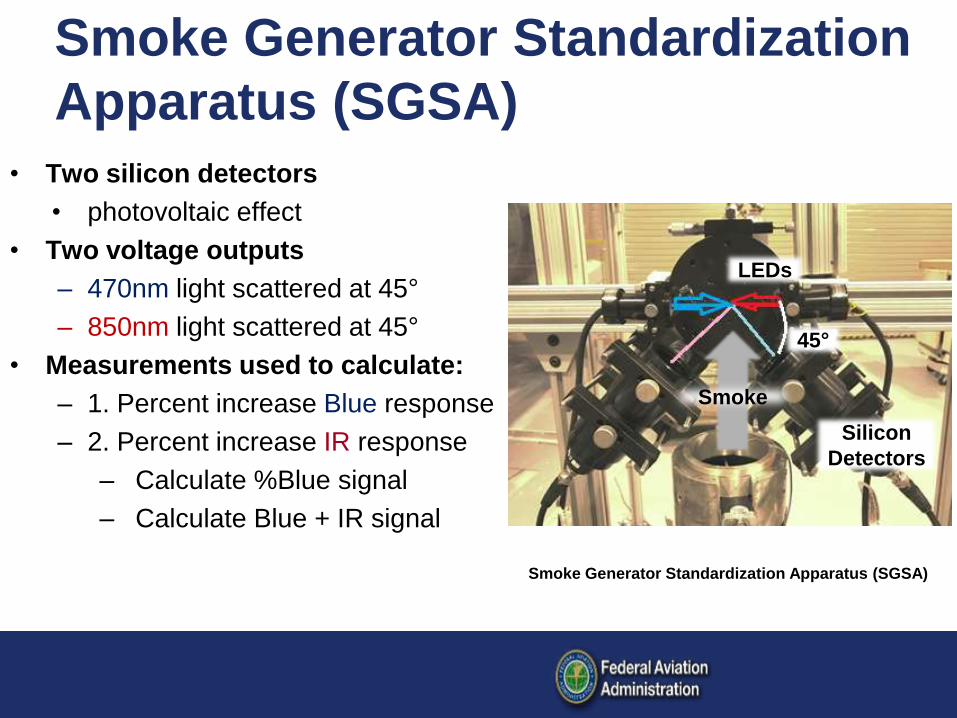
Smoke Generator Standardization
Apparatus (SGSA)
• Two silicon detectors
• photovoltaic effect
• Two voltage outputs
– 470nm light scattered at 45°
– 850nm light scattered at 45°
• Measurements used to calculate:
– 1. Percent increase Blue response
– 2. Percent increase IR response
– Calculate %Blue signal
– Calculate Blue + IR signal
LEDs
Silicon
Detectors
45°
Smoke
Smoke Generator Standardization Apparatus (SGSA)

Theory
Blue and IR Light Scattering
• Green line represents the
theoretical %Blue correspondence
to diameter according to the Mie
Scattering Theory
• Red dots annotate experimental
test results from SGSA and the
measured diameter with the SMPS
– Data from both Siemens
Cerberus and Concept Aviator
• Experimental data agrees with
the Mie Scattering Theory!
Maxwell’s Equation plotted using 470nm for Blue and
850nm for IR scattered light, assuming refractive index
of 1.65 with Siemens Cerberus and Concept Aviator
0
0.1
0.2
0.3
0.4
0.5
0.6
0.7
0.8
0.9
0.01 0.1 1 10%
Blu
e S
ign
al
Diameter, µm

Particle Size – SMPS & SGSA
• There is a positive correlation
between SMPS particle size
and SGSA %Blue signal after
grouping the data points by the
test environment and start time
of data collection
• Altitude
– ~10psia ~90F
• Altitude Temperature
– ~10psia ~50F
• Temperature
– ~14.7psia ~50F
• Ambient
– ~14.7psia ~90F
19
%Blue signal vs SMPS diameter
Test samples starting at 210 seconds for 60 seconds with
varying programs and environments with Siemens Cerberus
(programs 5 and 6) and Aviator UL
R² = 0.9199 R² = 0.9518
R² = 0.9738
R² = 0.9436
0
100
200
300
400
00.511.5
Ge
om
etri
cal M
ean
Dia
met
er,
nm
% Blue AltitudeTemperatureAltitude TemperatureAviator and Siemens Ambient

Particle Concentration – SMPS &
SGSA
• There is a positive correlation
between SMPS concentration
and SGSA Blue + IR signal
after grouping the data points
by the test environment and
start time of data collection
• Altitude
– ~10psia ~90F
• Altitude Temperature
– ~10psia ~50F
• Temperature
– ~14.7psia ~50F
• Ambient
– ~14.7psia ~90F
20
R² = 0.8867
R² = 0.9937
R² = 0.9532
R² = 0.755
0.0E+00
4.0E+06
8.0E+06
1.2E+07
1.6E+07
0 0.2 0.4 0.6 0.8Tota
l Co
nce
ntr
atio
n, #
/cm
³
Blue + IR
Altitude Temperature
Altitude Temperature Ambient
%Blue signal vs SMPS concentration
Test samples starting at 210 seconds for 60 seconds with
varying programs and environments with Siemens Cerberus
(programs 5 and 6)

Smoke Obscuration and SGSA
• The combined blue and IR signal
has a strong correlation with the
average steady state percent
obscuration
R² = 0.92
0
10
20
30
40
50
60
0 0.2 0.4 0.6 0.8A
vera
ge P
erc
en
t O
bsc
ura
tio
n/f
t Blue + IR
Blue and IR scattered light signal vs average percent
obscuration per foot
0
50
100
0
0.5
1
1.5
2
-5 5 15 25 35
Blue + IR Obsc 5
Blue and IR scattered light signal and %obscuration per foot
vs time

Smoke Plume Buoyancy
• Decreasing the ambient
temperature slightly
increases the smoke plume
buoyancy
• V1: 10” from generator
• V2: 20” from generator
22
0
40
80
120
100 150 200 250
Tem
pe
ratu
re,
F
V, ft/min
V1, ~10psi V2, ~10psi
V1, ~14.7psi V2, ~14.7psi
Velocity vs temperature
Velocity is averaged over 60 seconds with varying
pressures, Siemens Cerberus (programs 5 and 6)
V1
V1
V2
V2

Smoke Plume Buoyancy
• Decreasing the ambient
pressure slightly increases
the smoke plume buoyancy
• V1: 10” from generator
• V2: 20” from generator
23
0
5
10
15
20
100 150 200 250
Pre
ssu
re, p
sia
V, ft/min
V1, ~90F V1, ~50F V2, ~50F V2, ~90F
Velocity vs pressure
Velocity is averaged over 60 seconds with varying
temperature, Siemens Cerberus (programs 5 and 6)
V1 V1 V2 V2

UMD Testing
24
Four obscuration measurements
Thermocouple
above source
Blue and IR
measurements
• Testing was conducted
inside a partitioned DC-10
cargo compartment
• Thermocouple measurements
were taken at eight locations
above source
– Average temperature rise
was calculated
• Varying fire loads
– Smoldering and flaming
Partitioned D-10 Cargo Compartment
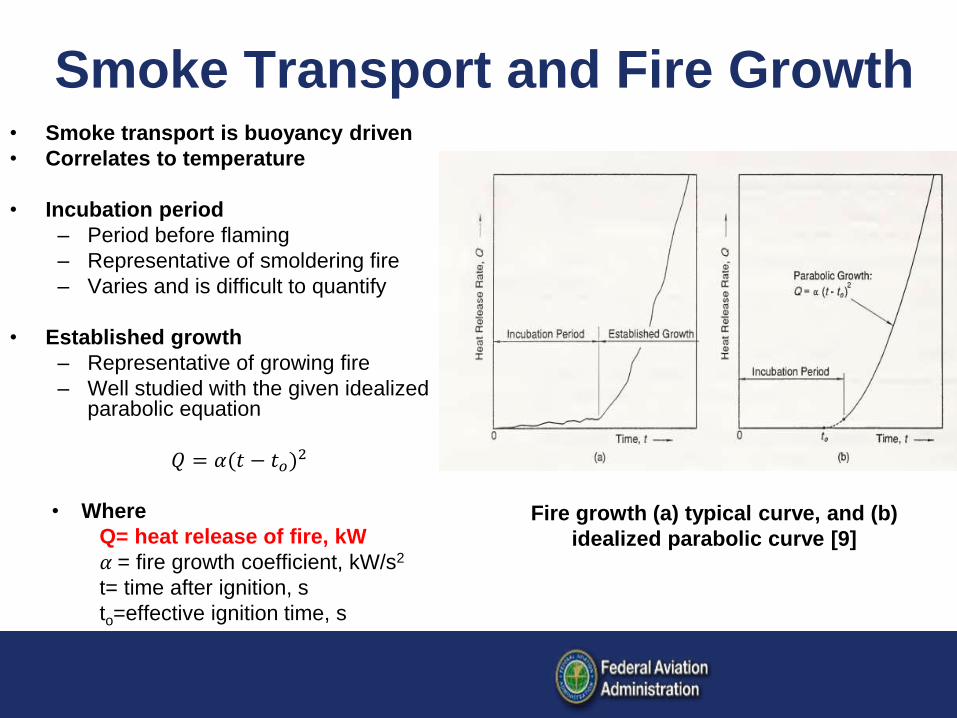
Smoke Transport and Fire Growth
Fire growth (a) typical curve, and (b)
idealized parabolic curve [9]
• Smoke transport is buoyancy driven
• Correlates to temperature
• Incubation period
– Period before flaming
– Representative of smoldering fire
– Varies and is difficult to quantify
• Established growth
– Representative of growing fire
– Well studied with the given idealized parabolic equation
𝑄 = 𝛼(𝑡 − 𝑡𝑜)2
• Where
Q= heat release of fire, kW
𝛼 = fire growth coefficient, kW/s2
t= time after ignition, s
to=effective ignition time, s

Temperature
• Concept Aviator UL has an
adjustable chimney heater (~0.9kw)
ranging from 0-100%
• The Aviator UL heater setting
above 20% best emulates the
temperature increase from a fire
transitioning from incubation period
to established growth
• The Aviator UL heater setting
below 7.5% best emulates the
temperature increase from a
smoldering fire
26
0
10
20
30
0 60 120 180
Tem
pe
ratu
re R
ise
, F
Time, s Suitcase Paper 1 Paper 2
Paper Flaming PU Wood
Aviator 7.5% Aviator 5% Aviator 20%
Aviator 40% Aviator 100%
Time vs temperature rise
Comparison of temperature rise of various smoke
sources and smoke generator heater settings
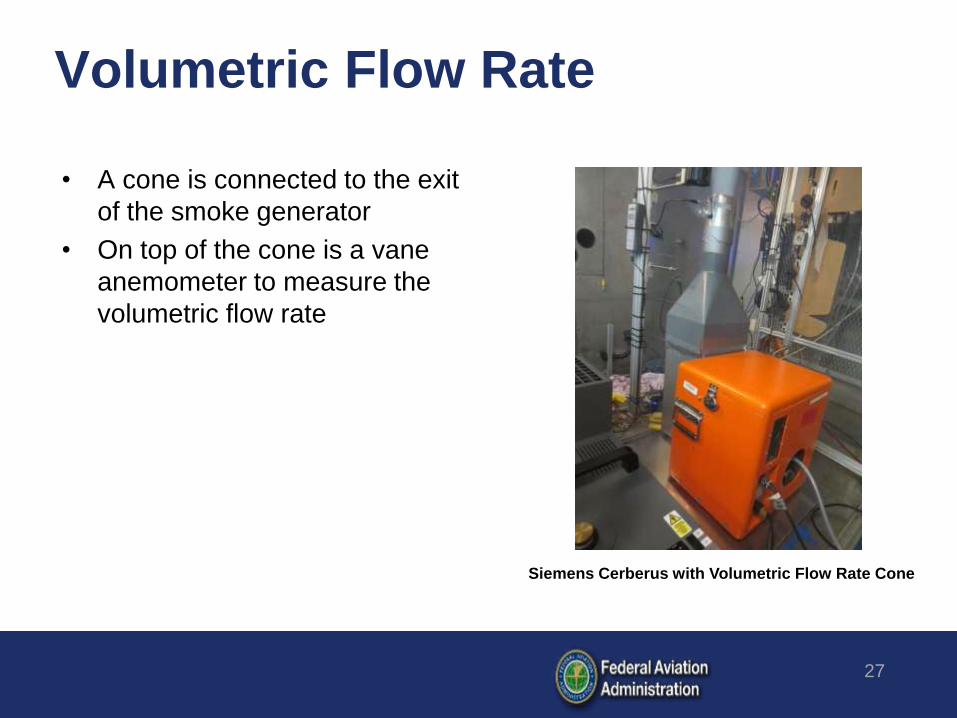
Volumetric Flow Rate
• A cone is connected to the exit
of the smoke generator
• On top of the cone is a vane
anemometer to measure the
volumetric flow rate
27
Siemens Cerberus with Volumetric Flow Rate Cone

Smoke Plume buoyancy
28
• Smoke plume velocity
increases with smoke
generator heat output
• Estimated volumetric flow rate
for fire transitioning from
incubation period to
established growth
• Estimated volumetric flow rate
for a smoldering fire
5.1
6.7
8.6
9.2
11.7
13.0
13.2
14.2
15.5
16.8
16.8
0 5 10 15 20
Aviator 5% Heat
Aviator 7.5% Heat
Aviator 1 Heater
Aviator 20% Heat
Aviator 40% Heat
Aviator 4 Heaters
Siemens Prog 3
Aviator 60% Heat
Aviator 80% Heat
Siemens Prog 5 ,6
Aviator 100% Heat
Q, ft3/min
Volumetric flow rate
Comparison volumetric flow rate of various smoke
generator settings with Siemens Cerberus and Aviator UL

Questions and Answers
• Can standardizing smoke generators make smoke detector
certification tests more consistent?
• Yes:
– Testing standards can provide an even reference for test methodology
and equipment for smoke detection certification
29

Questions and Answers
• Does ambient environment impact the smoke particle obscuration,
diameter, concentration and/or plume buoyancy?
• Yes, within the tested range of 50-90F and 10-14.7psia:
– Percent obscuration per foot varies with temperature
– The smoke particle diameter, concentration and smoke plume buoyancy
varies slightly with ambient environment
• New question: Is this impact significant?
– Depends on the parameters of a smoke generator standard
30

Questions and Answers
• What parameters should be considered while creating a smoke
generator standard?
• Smoke detection is dependent on smoke density, particle size, smoke plume
buoyance and compartment size
– Smoke Density: It is possible to characterize smoke obscuration by amplitude,
steady state obscuration and/or with a time dependent reference curve
• The combined blue and IR signal has a strong positive correlation with the
obscuration meter percent obscuration per foot
– Particle Size: There is a strong negative correlation between the SMPS
particle size and the SGSA %blue signal
– Smoke Plume Buoyancy: Volumetric flow rate yields repeatable plume
buoyancy and is independent of distance from smoke generator
– Test Compartment Volume: Increasing the volume decreases smoke
density
31

Questions and Answers
• What should be the standard reference and should it be based off of an
actual fire source?
• Smoldering, transitioning or flaming?
– Low chimney heater settings appear to better emulate
smoldering fires
– High chimney heater settings appear to better emulate
transitioning fires
– Higher chimney heater settings can better emulate flaming fires
• Fire load size?
– The Concept Aviator and the Siemens Cerberus have adjustable
settings that can greatly alter smoke output
• Other?
• Should reference depend on cargo compartment volume?
32

Contact Information
Matthew Karp
Research Engineer
FAA ANG-E211 Systems Fire Protection
Phone: 609-485-4538
Email: [email protected]
33
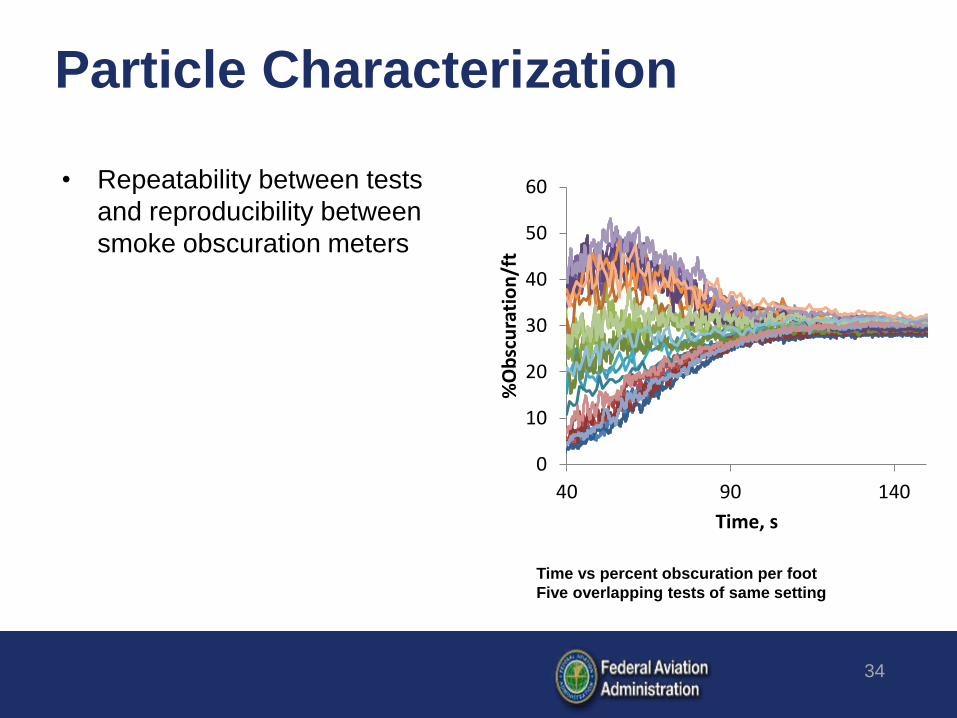
Particle Characterization
• Repeatability between tests
and reproducibility between
smoke obscuration meters
34
Time vs percent obscuration per foot
Five overlapping tests of same setting
0
10
20
30
40
50
60
40 90 140%
Ob
scu
rati
on
/ft
Time, s

SMPS and SGSA • There is a strong negative correlation
between the SMPS particle size and the
SGSA %blue signal
– For the Concept Aviator and Siemens
Cerberus at ambient temperature and
pressure
• Possible to estimate actual smoke particle
size assuming similar refractive index
35
168
198
172
174
219
237
237
262
264
267
280
283
350
144
247
250
263
273
285
307
0 0.2 0.4 0.6 0.8
80 180 280 380
Batteries
Siemens 1
Concept 1
Siemens 2
Siemens 3
Concept 2
Concept 3
Concept 4
Concept 5
Flaming Cardboard
Smoldering Paper
Smoldering Cardboard
Siemens 4
Siemens 5
Siemens 6
Flaming Paper
Concept 6
Smoldering Suitcase
Siemens 7
Smoldering PU
Concept 7
1-%Blue
Particle Diameter, nm
EstimatedDiameter
SMPS
%Blue

Particle Size
Summary
• Particle size increases over time
• Particle size changes depending
on program setting and exit nozzle
diameter
– Programs 5 and 6
– Program 3
– Larger exit nozzle diameter >
large particles
• Increasing the ambient temperature
– increases the particle size
• Decreasing the ambient pressure
– increases the particle size
36
151
162
171
174
181
181
204
205
206
216
227
230
234
237
239
239
240
241
242
242
252
252
253
263
264
267
270
282
283
0 100 200 300 400
2-Prog3-90F-14.7psia
1-Prog3-90F-14.7psia
3-Prog3-90F-14.7psia
1-Prog3-90F-14.7psia
2-Prog3-90F-10psia
1-Prog3-90F-10psia
2-Prog5-50F-14.7psia
3-Prog3-90F-14.7psia
3-Prog3-90F-10psia
1-Prog5-50F-14.7psia
1-Prog6-50F-14.7psia
2-Prog6-50F-14.7psia
1-Prog5-90F-14.7psia
2-Prog6-90F-14.7psia
2-Prog5-50F-10psia
1-Prog5-50F-10psia
2-Prog5-90F-14.7psia
3-Prog5-50F-14.7psia
1-Prog5-90F-10psia
2-Prog5-90F-10psia
1-Prog6-90F-14.7psia
2-Prog6-90F-10psia
1-Prog6-90F-10psia
3-Prog6-50F-14.7psia
3-Prog5-90F-14.7psia
3-Prog5-90F-10psia
3-Prog5-50F-10psia
3-Prog6-90F-10psia
3-Prog6-90F-14.7psia
Geometric Mean Diameter, nm

Particle Size – Concept Aviator
• Concept Aviator particle size
varies by setting and ranges
from 108 – 374nm
• Can create similar particle
diameters and concentrations to
Siemens Cerberus
• Depending on:
– Smoke density valve setting
– Chimney heater setting
– Gas propellant pressure
37
108
121
149
150
198
219
237
237
270
280
350
374
0 100 200 300 400
Aviator 1
Aviator 2
Aviator 3
Aviator 4
Aviator 5
Aviator 6
Aviator 7
Aviator 8
Aviator 9
Aviator 10
Aviator 11
Aviator 12
Geometric Mean Diameter, nm
Smoke particle diameter for various Aviator UL smoke
generator settings measured by SMPS with Concept
Aviator UL

Particle Concentration
Summary
• Particle concentration is most
dense during initial bursts of smoke
– From 10-70s
– From 90-150s and 210-270s
• Particle concentration changes
slightly depending on program
• Increasing the ambient temperature
– increases the particle
concentration
• Increasing the ambient pressure
– decreases the particle
concentration
38
5.63E+06
5.91E+06
6.99E+06
7.31E+06
7.60E+06
8.14E+06
8.30E+06
8.49E+06
9.08E+06
9.46E+06
1.00E+07
1.04E+07
1.06E+07
1.13E+07
1.13E+07
1.19E+07
1.24E+07
1.29E+07
1.36E+07
1.45E+07
1.46E+07
1.51E+07
1.65E+07
1.70E+07
1.83E+07
2.14E+07
2.36E+07
3.32E+07
4.59E+07
0.00E+00 2.00E+07 4.00E+07 6.00E+07
3-Prog3-90F-14.7psia
3-Prog5-50F-14.7psia
3-Prog3-90F-14.7psia
3-Prog5-50F-10psia
3-Prog5-90F-14.7psia
3-Prog6-50F-14.7psia
3-Prog3-90F-10psia
2-Prog5-50F-14.7psia
3-Prog5-90F-10psia
2-Prog5-90F-14.7psia
2-Prog5-50F-10psia
2-Prog3-90F-14.7psia
3-Prog6-90F-14.7psia
2-Prog6-50F-14.7psia
1-Prog3-90F-14.7psia
2-Prog5-90F-10psia
3-Prog6-90F-10psia
1-Prog5-50F-14.7psia
2-Prog3-90F-10psia
2-Prog6-90F-14.7psia
1-Prog5-50F-10psia
1-Prog3-90F-14.7psia
2-Prog6-90F-10psia
1-Prog3-90F-10psia
1-Prog5-90F-10psia
1-Prog6-50F-14.7psia
1-Prog6-90F-10psia
1-Prog5-90F-14.7psia
1-Prog6-90F-14.7psia
Axis Title

Smoke Plume Buoyancy Summary
39
140
156
160
173
185
186
201
203
215
98
94
93
139
160
165
167
164
178
0 75 150 225
Prog 3 - 90F - 14.7psia
Prog 3 - 90F - 10psia
Prog 3 - 50F - 10psia
Prog 5 - 90F - 14.7psia
Prog 5 - 50F - 14.7psia
Prog 6 - 50F - 14.7psia
Prog 5 - 90F - 10psia
Prog 5 - 50F - 10psia
Prog 6 - 90F - 10psia
Velocity, ft/min
Series2 Series1V 2 V 1
• The smoke plume buoyancy
is dependent on the smoke
generator heat output
– Red high heat output
– Yellow low heat output
• V1 10” from generator
• V2 20” from generator
Velocity comparison at different heights by program,
temperature and pressure with Siemens Cerberus

Smoke Obscuration
• Less deviation with steady state
measurements than amplitude
measurements
• Large difference between maximum
amplitude and steady state
obscuration
• Positive correlation with ambient
temperature
• No observable correlation with
ambient pressure
27
23
36
60
63
65
63
74
73
6
6
10
17
24
27
29
30
50
0 20 40 60 80
Prog 3 - 90F -14.7psia
Prog 3 - 50F -10psia
Prog 3 - 90F -10psia
Prog 5 - 50F -14.7psia
Prog 5 - 50F -10psia
Prog 5 - 90F -10psia
Prog 6 - 50F -14.7psia
Prog 5 - 90F -14.7psia
Prog 6 - 90F -10psia
%Obscuration/ft
Steady State Amplitude
Comparison of percent obscuration per foot with
various test conditions with Siemens Cerberus

Particle Characterization
• Particle size and distribution
changes with program setting
– Program 6 – oranges
– Program 5 – greens
– Program 3 – purples
41
0.0E+00
5.0E+06
1.0E+07
1.5E+07
2.0E+07
2.5E+07
3.0E+07
50 250 450N
orm
aliz
ed
Co
nce
ntr
atio
n,
dW
/dlo
gDp
Diameter, nm
Diameter vs particle concentration
Test samples of 60 seconds starting at 90 seconds
after gas release with Siemens Cerberus