Embed Size (px)
Citation preview

Smoke Control by Mechanical Exhaustor Natural Venting 51James A. Milke
Introduction
Smoke management in large-volume spaces,
such as atria and covered malls, poses separate
and distinct challenges fromwell-compartmented
spaces. In particular, smoke control strategies
using pressure differences and physical barriers
described by Klote in Chap. 50, and NFPA
92, Standard for Smoke-Control Systems [1], are
infeasible. Without physical barriers, smoke
propagation is unimpeded, spreading easily
throughout the entire space. The tall ceiling
heights in many large-volume spaces pose addi-
tional challenges because of the production of
substantial quantities of smoke and delayed
detection times. However, on the positive side,
the combination of large-volume space and tall
ceiling height permit the smoke to become
diluted and cooled as it spreads vertically and
horizontally, thereby reducing the level of hazard
posed by the smoke. Even so, there is still a need
to ensure that dangerous concentrations of smoke
are prevented in large-volume spaces.
In addition to atria and covered malls, there
are many other examples of large-volume spaces,
including convention centers, airport terminals,
sports arenas, and warehouses where smoke
management is of concern. The engineering
principles governing the design of smoke control
systems for all of these various large-volume
spaces are the same. However, differences in the
smoke control system designs for the variety of
large-volume spaces may be found. Differences in
designs are a result of differences in fire scenarios
and design goals, reflecting the range of building
uses and operations and the nature of who or what
may be exposed to the smoke. Given the
similarities in engineering principles affecting
smoke control system design, the term atrium
will be used throughout this chapter to refer to
all types of large-volume spaces.
The discussion presented in this chapter is
divided into two sections. First, conditions within
the atrium prior to actuation of a smoke control
system are discussed. As part of this discussion,
the smoke filling process is described along with
the time required for actuation of a smoke control
system. The second part of the chapter includes a
description of conditions within the atrium after
actuation of the smoke control system.
As a preface to any discussion on smoke con-
trol systems, a definition of smoke must be
established (NFPA 92, Standard for Smoke Con-trol Systems [1], Section 3.3.13):
The airborne solid and liquid particulates and
gases evolved when a material undergoes pyrolysis
or combustion, together with the quantity of air
that is entrained or otherwise mixed into the mass.
Although only the combustion products are
visible and potentially toxic, what is visually
observed as smoke is a mixture of the combus-
tion products and the entrained air. Air is
J.A. Milke (*)
University of Maryland, Department of Fire Protection
Engineering, University of Maryland, College Park,
MD, 20742, USA
DOI 10.1007/978-1-4939-2565-0_51, # Society of Fire Protection Engineers 2016
1824M.J. Hurley (ed.), SFPE Handbook of Fire Protection Engineering,
Telegram EDUFIRE_IREDUFIRE.IR

entrained along the entire height of the smoke
plume below a smoke layer. Proportionally, the
smoke is mostly entrained air. In the space
between the base and tip of the flames, most of
the entrained air is not consumed in the combus-
tion process and only dilutes the combustion
products. Entraining air into the smoke plume
increases the mass flow in the plume to increase
the quantity of smoke produced. However, the
entrained air also dilutes the smoke to decrease
the concentration of combustion gases and cool
the smoke. In some cases, the smoke may be
sufficiently diluted to mitigate the associated
hazards.
Hazard Parameters
Smoke can adversely affect building
occupants, fire brigade members, property
(including the building structure and contents),
and mission continuity. Typically, the threat to
people or objects is posed when they come into
contact with smoke for a sufficient period
of time.
People who become exposed to smoke are
generally harmed as a result of the exposure to
toxic gases or elevated temperature. The toxic
effects of smoke on people are described in Purser
(see Chap. 63) and Klote et al. [2]. In addition,
smoke may reduce visibility. A reduction of visi-
bility may cause people to become disoriented
and can in turn increase the amount of time they
are exposed to the smoke [3]. A reduction of
visibility may also increase the susceptibility of
building occupants to trip over obstructions or
even fall over balcony railings [4].
Building components can be affected by the
elevated temperature due to smoke. Building
components heated by smoke are considered in
fire resistance analyses. In addition, building
contents may be affected by exposure to the
elevated temperatures, corrosive gases, or partic-
ulate matter. Contents exposed to heated smoke
may be melted, distorted, or charred, depending
on the temperature of the smoke and the degree
of exposure. Contents that are submerged in
smoke and come into contact with combustion
gases and smoke particles may become stained or
emit an odor of smoke. Exposure to smoke can
damage electronic equipment, especially if resto-
ration activities are not initiated promptly after
the fire [5].
Following a fire, a building or portion thereof
may be closed due to restoration, threatening
mission continuity. This results in loss of revenue
for the building owner, temporary unemploy-
ment of workers in the building, and loss of
service of the facility to the community, among
other outcomes.
Smoke Layer Interface Position
The smoke layer interface position is located a
distance, z, above the top of the fuel, as indicated
in Fig. 51.1. This parameter is used to assess the
danger of people or objects being immersed in a
smoke layer. Sole use of this parameter to assess
hazard level is conservative by considering any
concentration of smoke to be unacceptable. For
people, even though the physiological effects due
to being submerged in “light” smoke levels may
be minor, the psychological effects and extended
evacuation time may be appreciable. Being
surrounded by smoke of any nature may decrease
the speed of evacuation, perhaps until the smoke
is no longer relatively benign. In terms of prop-
erty protection issues, any smoke may be unac-
ceptable because of smoke staining or smoke
corrosivity.
Light Obscuration
As with the smoke layer depth parameter, light
obscuration is not lethal by itself. Associated
with an increase in light obscuration is a reduc-
tion in visibility, which is likely to yield a longer
evacuation time and extend exposure to the
toxins in smoke. In some documented fires, evac-
uation has been terminated due to a lack of suffi-
cient visibility [6–8]. A fire fighter’s injury in an
atrium fire was attributed to a significant
51 Smoke Control by Mechanical Exhaust or Natural Venting 1825
Telegram EDUFIRE_IREDUFIRE.IR

reduction in visibility due to light obscuration
[4]. The fire fighter fell from an upper balcony
because he could not see the edge.
Limiting values from 0.23 to 1.2 m�1 have
been suggested for the extinction coefficient
[6–8]. Alternatively, a critical limit may be
based on a preferred minimum visibility distance
to a particular target. For example, a limit of light
obscuration can be suggested such that occupants
can see an illuminated exit sign across a room or
at the end of a corridor [3, 9].
Temperature and Gas SpecieConcentration
The final two parameters, elevated temperature
of the smoke layer and gas specie concentration
(such as CO, CO2, and HCN), can be directly
related to the potential for harm (see Chap. 63).
Critical limits for these two parameters can be
suggested based on toxicity studies.
Smoke Management Approaches
The design of a smoke control system for an
atrium is influenced by the following three
characteristics of the atrium:
1. Geometric shape and dimensions
2. Relative location within the building
3. Separation from communicating spaces
Several approaches are available to achieve
smoke management goals in an atrium (e.g.,
limit the fire size, provide physical barriers, and
provide mechanical or natural ventilation).
Selection of the best smoke management
approach for a particular atrium should consider
the use, size, and arrangement of the associated
spaces.
Limiting the fire size can be accomplished by
controlling the type, quantity, and arrangement
of fuel. In addition, the fire size can be controlled
through an automatic suppression system.
Physical barriers limit smoke spread to adja-
cent spaces. The ability of a physical barrier to
limit smoke spread is dependent on the leakage
of the barrier and pressure difference across the
barrier. The barrier needs to withstand the expo-
sure to smoke and an elevated temperature envi-
ronment. In an atrium with a tall ceiling, the
temperature of the smoke layer in the atrium
may be only slightly above ambient temperatures
in the space.
Mechanical or natural ventilation may be
provided to remove smoke from the atrium.
Removing smoke from the atrium can be intended
to limit the accumulation of heat and smoke
within the atrium or arrest the descent of the
smoke layer. Mechanical ventilation can be
provided to oppose smoke movement induced by
the fire to restrict smoke spread to communicating
Axisymmetric plume
H
d
z
z1
Fig. 51.1 Axisymmetric
plume [1]
1826 J.A. Milke
Telegram EDUFIRE_IREDUFIRE.IR

spaces. Gravity vents may be provided to remove
smoke, though their performance can be
compromised by environmental factors.
Analytical Approach
Numerous tools are available to aid in the design
and evaluate the adequacy of a smoke control
system. The selection of a particular tool is
dependent on the accuracy needed for the analy-
sis and the applicability of the analytical
tools given the characteristics of the large space
and selected fire scenarios. The principal
characteristics that affect applicability are
• Geometry of the large space: variation of hor-
izontal cross-sectional area, sloped versus flat
ceiling
• Transient aspects: unsteady versus steady heat
release rate, constant versus transient opera-
tion of smoke control system
• Fire development: heat release rate as a func-
tion of time (for example, constant, power-
law relationship with time, tn)
• Environmental effects: stack effect, wind
• Interacting systems: other smoke control
systems, HVAC, other exhaust systems (for
example in laboratories)
The range of design tools available to assess
the performance of smoke control system designs
can be grouped into the following categories:
• Zone model (algebraic equation based)
• Zone model (computer based)
• Field model
• Physical scale model
The intent of an engineering analysis of
smoke conditions in an atrium is to express the
level of hazard in terms of physically based
parameters, for example, smoke layer interface
position, temperature, gas concentration (such as
carbon monoxide), and light obscuration. The
magnitude of each of these parameters can be
predicted based on engineering principles. In
addition to being predictable, critical threshold
values are available for the hazard parameters in
order to properly assess the severity of the threat
(See Chap. 63). This chapter will concentrate on
the life hazards posed by smoke. The hazards
smoke poses to contents, property, and mission
continuity are described elsewhere [2–4, 10].
Physical Scale Models
Physical scale models provide a representation of
a space, though in a reduced scale. Physical scale
models are especially useful in examining atria
with irregular shapes or numerous projections. A
review of applying physical scale models as a
design aid for atrium smoke control systems was
provided by Milke and Klote [11].
Quintiere provided a review of scaling
relationships based on preserving the Froude num-
ber [12]. The Froude number, Fr, is defined as v/gl.
The scaling relations are
Temperature:
Tm ¼ TF ð51:1ÞGeometric position:
xm ¼ xFlmlF
� �ð51:2Þ
Pressure:
Δ pm ¼ Δ pFlmlF
� �ð51:3Þ
Velocity:
vm ¼ vFlmlF
� �1=2
ð51:4Þ
Time:
tm ¼ tFlmlF
� �1=2
ð51:5Þ
Convectiveheat release:
_Qc,m ¼ _Qc, f
lmlF
� �5=2
ð51:6Þ
Volumetric flow rate:
Vfan,m ¼ Vfan,FlmlF
� �5=2
ð51:7Þ
Experiments based on Froude modeling may
be done with air at atmospheric pressure. Froude
modeling does not preserve the Reynolds num-
ber. However, appropriate selection of the size of
the physical scale model can ensure that fully
51 Smoke Control by Mechanical Exhaust or Natural Venting 1827
Telegram EDUFIRE_IREDUFIRE.IR

developed flow is achieved to minimize the
consequences of not preserving the Reynolds
number. Because the smoke behavior in only
certain areas of the scaled atrium may be of
interest, fully developed flow only needs to be
achieved in these particular areas. Often a physi-
cal scale model with a critical dimension of at
least 0.3 m in any areas of interest will be suffi-
cient to achieve fully developed, turbulent flow.
As an example, in most shopping malls and atria,
the critical dimension in question would be the
floor-to-ceiling height of one of the balconies.
In addition, Froude modeling does not pre-
serve the dimensionless parameters concerning
heat transfer. Generally, this limitation has little
effect because the temperature is the same for the
physical scale model and the full-scale facility.
Froude modeling does not apply to locations with
high temperature and low Reynolds numbers
(e.g., near the flame). However, Froude modeling
provides useful information about smoke trans-
port away from the fire.
Some surface effects can be preserved by
scaling the thermal properties of the construction
materials for the model. The thermal properties
can be scaled by
Thermal properties:
kρcp� �
w,m¼ kρcp� �
w,F
lm
lF
� �0:9
ð51:8Þ
Because scaling thermal properties have only
a secondary effect on fluid flow, considerations
of convenient construction and flow visualization
may require that some or all surface materials in
the model are different from those selected based
on thermal property scaling.
Example 1 A physical scale model is proposed
to determine the equilibrium smoke layer posi-
tion for the atrium depicted in Fig. 51.2. Because
the horizontal cross-sectional area varies with
height, algebraic equation and computer-based
zone models are of limited value. The overall
height of the atrium being studied is 30.5 m and
the design fire is steady with a heat release rate of
5 MW. An exhaust fan capacity of 142 m3/s is
proposed. By applying the scaling relationships
to formulate a small-scale model, the basic
parameters for the scale model are
• Height: 3.8-m-tall model (1/8 scale)
• Fire size: 28 kW
• Fan capacity: 0.78 m3/s
Analytical Models
Two categories of analytical models are zone and
field models. A description of field models is
outside the scope of this chapter. Zone models
divide each compartment into a limited number
of control volumes, typically an upper and a lower
zone. Inherent in the zone approach is the assump-
tion of uniform properties throughout each zone.
In spaces with a large floor area, this assumption
may be tenuous. Nonetheless, calculations
associated with the zone model approach are rela-
tively easy to perform and are often accepted for
engineering purposes. Calculations following the
zone model approach may be in the form of alge-
braic equations or a computer algorithm.
The zone model approach assumes that smoke
from a fire is buoyant, rises to the ceiling, and
forms a smoke layer. The buoyant nature of
smoke is due to the decreased density of the
heated smoke. As smoke rises in a plume, air is
entrained to increase the mass flow rate in the
plume. A decrease in the velocity and tempera-
ture of the smoke plume results from the increase
in the plume mass flow rate, as dictated by
Fig. 51.2 Small-scale model of atrium
1828 J.A. Milke
Telegram EDUFIRE_IREDUFIRE.IR

conservation of momentum and energy. In addi-
tion, the entrained air dilutes the combustion
products in the plume. The entire smoke layer
is assumed to have uniform characteristics. As
smoke is supplied to the smoke layer from the
plume, the interface between the smoke layer and
lower clear air zone descends. The additional
smoke supplied by the plume also results in an
increase in the smoke layer temperature, carbon
monoxide concentration, and light obscuration.
Being a simplification, the zone model
approach may not be applicable in some
situations. One example includes a scenario
with operating sprinklers, which may cool the
layer and also entrain smoke from the upper
layer into the water spray pattern descending
into the lower zone. Another example consists
of the case where smoke does not reach the ceiling
as a result of a loss of buoyancy, where the pre-fire
temperature near the ceiling of the atrium is
greater than that near the floor. This situation is
discussed in more detail later in this chapter. A
third situation involves an atrium with a large
cross-sectional area where the horizontal variation
in conditions from one portion of the atrium to
another is important to the analyst. Where
localized conditions associated with the smoke
plume or smoke layer need to be assessed, field
models are more appropriate than zone models.
Two categories of fire scenarios for smoke
management design in atria include (1) fires
located in the atrium, and (2) fires located in a
space adjacent and open to the atrium. This chap-
ter concentrates only on fires within the atrium
space. Methods to estimate conditions in any of
the adjacent spaces, resulting from fires
originating in the atrium or from fires in other
adjacent spaces, are addressed elsewhere [2].
Smoke Filling Period
A smoke layer is formed once the smoke plume
reaches the ceiling and the ceiling jet spreads
horizontally to reach the bounding walls of the
space. Subsequently, the smoke layer starts to
descend in the space. In relatively small spaces
with low ceilings, the smoke layer forms almost
immediately. However, in large spaces with tall
ceilings, the time required to form a smoke layer
may be appreciable. The delay in forming a layer
is attributable to the transport lag of the smoke.
The smoke filling period continues until the
properly sized smoke exhaust fans are actuated.
Transport Lag
The transport lag is composed of the time for a
smoke plume to reach the ceiling (plume trans-
port lag) and the time for the ceiling jet to reach
the bounding enclosure (ceiling jet transport lag).
These two time periods are depicted in Fig. 51.3.
Correlations for the plume and ceiling jet
transport lag are available in the literature for
both steady and t2 fires [13, 14]. Because virtu-
ally all fires have a growth period before
reaching a steady phase, the transport lag
correlations for steady fires have little relevance.
Correlations for the plume transport lag for
steady and t2-fires areSteady files:
tpl ¼ 0:67H4=3= _Q1=3 ð51:9Þ
t2 fires:
tpl ¼ 0:1H4=5t2=5g ð51:10Þ
Estimates of the plume transport lag from
Equations 51.9 and 51.10 are provided in
Fig. 51.4. As indicated in the figure, even the
shortest plume transport lag for t2 fires,
associated with the fast t2 fire, is greater than
that for a modest-size steady fire.
Comparable correlations for the ceiling jet
transport lag for steady and t2 fires areSteady files:
tc j ¼ r11=6
1:2 _Q1=3
H1=2ð51:11Þ
t2 fires:
tc j ¼ 0:72rt2=5g
H1=5ð51:12Þ
A comparison of the ceiling jet transport lag
for a modest-size steady fire and t2 fires is
51 Smoke Control by Mechanical Exhaust or Natural Venting 1829
Telegram EDUFIRE_IREDUFIRE.IR

presented in Fig. 51.5. Again, the transport lag
associated with the steady fire is much less than
that associated with any of the t2 fires.
Many zone models do not account for trans-
port lag. In low-height spaces with small
compartments, this is likely to be inconsequen-
tial. In tall spaces with large cross-sectional hor-
izontal areas, the lag may be important. In such
cases, only models that incorporate transport lag
are to be selected.
Smoke Layer Interface Position
Once the smoke layer has formed, the initial rate
of descent of the layer is very rapid, slowing as
the layer descends. This is attributable to the rate
of smoke production being dependent on the
height of the plume where entrainment occurs,
i.e., the distance from the top of the fuel to the
smoke layer.
Both empirical correlations and theoretically
based methods are available to address
conditions during the smoke filling period using
a zone model approach [15]. Theoretically based
methods use statements of conservation of mass
and energy to determine the volume of the upper
layer. Conservation of mass accounts for the
smoke mass supplied from the plume to
the smoke layer along with any smoke leaving
the zone through ventilation openings. Conserva-
tion of energy is applied to address the energy
being supplied by the plume along with heat
losses from the layer.
Generally, the predicted smoke layer interface
position determined by the two analytical
Ceiling jet transport lag
Plumetransportlag
Fig. 51.3 Plume and
ceiling jet transport lag
0
5
10
15
20
0 6 12 18 24 30
Height (m)
Tim
e (s
)
0.5 MW
Fast t 2
Medium t 2
Slow t 2Fig. 51.4 Plume
transport lag
1830 J.A. Milke
Telegram EDUFIRE_IREDUFIRE.IR

methods differs. The smoke layer is comprised of
the uppermost portion of the layer in which the
conditions are relatively uniform at any eleva-
tion. Below that section is a transition zone,
where the conditions decrease until they reach
the bottom edge of the layer and are at their
minimum value. The predictions from the empir-
ical correlations relate to the position of the bot-
tom edge of the transition zone as determined in
an experimental program. In the theoretically
based correlations, all of the smoke is considered
to be in one layer with uniform properties. Com-
bination of the transition zone and the upper
portion into one uniform zone effectively results
in the transition zone being compressed so as to
have the same properties as the upper portion. As
such, the theoretically based correlations relate to
a thinner smoke layer than the empirical
approach.
Empirical Correlations
Empirical correlations have been developed by
Heskestad to determine the smoke layer interface
position as a function of time for steady and t2
fires. These correlations, included in NFPA
92 [1], are based on experimental data in large
spaces. In the experimental efforts, the smoke
layer interface position was established by a
variety of means, including visual observations
and measurements of temperature change, car-
bon dioxide concentration, or light obscuration.
The correlations are simple expressions with
easily acquired input and minimal computations.
The correlations provide conservative estimates
of the smoke layer interface position (i.e.,
predicting the lower edge of the transition zone
of the smoke layer which may include only
‘wisps’ of smoke) [16]. The correlations are
applicable to simplified cases related to the fire
and geometry of the space. Fire scenarios must
be steady state or, if growing, follow a t2 profile.
The assumed geometrical configuration is a
space of uniform cross-sectional area (i.e., rect-
angular or right cylindrical solids). In addition to
the noted simplifications, second-order
parameters such as environmental factors (e.g.,
stack effect, wind) and the effect of HVAC
systems are neglected.
Steady Fires The position of the smoke layer
interface for steady fires can be estimated using
Equation 51.13 [16, 17]. Equation 51.13 is based
on experimental data from fires in large-volume
spaces with A/H2 of 0.9–14 [18–20].
0
80
40
120
160
200
0 6 12 18 24 30Radius (m)
Tim
e (s
)
0.5 MW, 30 m0.5 MW, 5 m
Fast t 2, 30 m
Fast t 2, 5 mMed. t 2, 30 m
Med. t 2, 5 m
Slow t 2, 5 m
Slow t 2, 30 m
Fig. 51.5 Ceiling jet
transport lag
51 Smoke Control by Mechanical Exhaust or Natural Venting 1831
Telegram EDUFIRE_IREDUFIRE.IR

z
H¼ 1:11� 0:28 ln
t _Q1=3
H�4=3
A=H2
!ð51:13Þ
Where z/H � 0.2.
Equation 51.13 is presented in non-dimensional
form. The quantity t _Q1=3
H�4=3 represents the
normalized time from ignition. The significance
of the normalized time parameter is to
indicate that the same relative smoke layer posi-
tion occurs for a long duration, low heat release
rate fire in a tall ceiling height atrium, as for a short
duration, large fire in an atrium with a short
ceiling height. Different atrium geometries are
accounted for by the non-dimensional shape
factor, (A/H2) [18, 19].
The limits noted for A/H2 reflect the range of
shape factors for the facilities in which the
experiments were performed [18, 19]. Examples
of atria within the noted range include atria with
a cross-sectional area of 10,000 m2 and a height
of 105 m (A/H2 ¼ 0.9) or a height of 27 m (A/
H2 ¼ 14). Comparisons of the predictions from
Equation 51.13 to experimental data from fires in
tall spaces are provided in Fig. 51.6 [20–22].
Transport lag, or the initial time period to
form a smoke layer, is implicitly included in
Equation 51.13. Evidence of this characteristic
is obtained for short time durations where the
resulting z/H is greater than 1.0 (otherwise z/H > 1 would literally mean that the smoke
layer interface is above the ceiling). The lower
limit for z/H of 0.2 relates to the lowest level
where data were taken in any of the referenced
experiments.
t2fires Equation 51.14 provides a correlation of
the time-dependent smoke layer interface posi-
tion for fires following a t2-type profile
[16]. Equation 51.14 is also based on experimen-
tal data in spaces with shape factors ranging from
0.9 to 14 [20, 23].
z
H¼ 0:91 tt�2=5
g H�4=5 A=H2� ��3=5
h i�1:45
ð51:14ÞEquations 51.13 and 51.14 both assume that
the fire is located near the center of the atrium
floor, remote from any walls. Smoke production
is greatest for the centered configuration and
thereby represents the worst-case condition.
Example 2 For a fast, t2 fire in an atrium with a
cross-sectional area of 800 m2 and height of
20 m, determine the position of the smoke layer
interface after 120 s.
9080706050403020100
(tQ1/3H–4/3)/(A /H 2)(kW1/3–s/m4/3)
0
0.1
0.2
0.3
0.4
0.5
0.6
0.7
0.8
0.9
1
BRI NRCC Heskestad
EQN 13 FMD
Nor
mal
ized
sm
oke
laye
r po
sitio
n (z
/H)
NFPA 92B
Fig. 51.6 Comparisons of
smoke layer position—
experimental data versus
predictions
1832 J.A. Milke
Telegram EDUFIRE_IREDUFIRE.IR

Solution Applying Equation 51.14 with A/H2 ¼2.0 and tg ¼ 150 s, z/H is 0.95 or z ¼ 19m.
Example 3 For a fast, t2 fire in an atrium with a
cross-sectional area of 800 m2 and height of
20 m, determine the time for the smoke layer
interface to reach 15 m above floor level.
Solution Re-expressing Equation 51.14 to solve
for t,
t ¼ 0:94t2=5g H4=5 A=H2� �3=5
z=Hð Þ�0:69 ð51:15Þ
Applying Equation 51.15 with A/H2 ¼ 2.0
and tg ¼ 150 s, t is 140 s.
Reviewing the results from Examples 2 and
3, the smoke layer barely descends below the
ceiling in the first 120 s. This is indicative of
the lag time required for the plume to reach the
ceiling and to form a layer. Then, after only
another 20 s, the smoke layer descends 4 m,
demonstrating the rapid initial descent rate of
the smoke layer interface. The rapid descent is
attributable to the significant quantity of smoke
produced during the early stage of a fire in a
tall ceiling space when the height available
for entrainment is at its largest value. The
predicted trend of rapid filling during the
early stage of a fire has been reported by eye-
witness accounts from four fires in atria [4,
24–26].
Theoretically Based Approach
Conservation of mass and energy can be applied
to provide an estimate for the position of the
theoretical smoke layer interface. Equation 51.16
expresses the conservation of mass, mu, for theupper smoke layer, assuming no exhaust from the
layer.
dmu
dt¼ _m ð51:16Þ
Approximating the smoke as an ideal gas with
properties of heated air, and assuming that the
ambient pressure and specific heat are constant,
the expression for conservation of energy for the
smoke layer is
ρhð ÞudVu
dt¼ _Qc þ _mh1 ð51:17Þ
Given the previously assumed conditions,
ρh is a constant. Substituting the volumetric
flow rate for the mass flow rate and simplifying,
dVu
dt¼
_Qc
ρhþ _V ð51:18Þ
The growth rate of the upper layer indicated in
Equation 51.18 is dependent on two terms:
(1) the volume supplied by the plume and
(2) the expansion of the volume due to heating.
For the case of an atrium with a constant cross-
sectional area, A,
dVu
dt¼ A
dzudt
ð51:19Þ
As long as the smoke layer interface is well
above the flaming region (see discussion later in
this chapter), the plume mass entrainment rate
can be estimated from [27].
dVu
dt¼ _m
ρ¼ kv _Q
1=3z5=3 ð51:20Þ
Several simplifications can be made for large
clear heights (i.e., clear heights in excess of
10 m). The clear height is the distance from the
top of the fuel to the bottom of the smoke layer.
The magnitude of the second term is much less
than the first. Generally, z is much greater than zo.
In addition, the volume increase of the upper
layer supplied by the plume is appreciably
greater than that due to expansion. With
these simplifications and by substituting
Equations 51.19 and 51.20 into Equation 51.18,
an expression for dzu/dt can be formulated
dzudt
¼ kv _Qz5=3
Að51:21Þ
In Equation 51.21, kv is the volumetric
entrainment constant, defined as [36].
kv ¼ 0:076=ρ
The convective heat release fraction is the
ratio of the convective heat release rate to the
total heat release rate and is typically assumed
51 Smoke Control by Mechanical Exhaust or Natural Venting 1833
Telegram EDUFIRE_IREDUFIRE.IR

to be on the order of 0.7–0.8. Throughout
this chapter, a value of 0.7 is selected for the
convective heat release fraction [1]. Assuming a
plume entrainment constant of 0.076 kg
kW�1/3�m�5/3�s�1 and the density of ambient air
as 1.2 kg/m3, the volumetric entrainment con-
stant is 0.064 m4/3 kW�1/3 s�1.
An expression for the smoke layer position
resulting from a steady fire as a function of time
can be obtained by integrating Equation 51.9:
z
H¼ 1þ 2kvt _Q
1=3
3 A=H2� �
H4=3
" #�3=2
ð51:22Þ
Alternatively, for a t2 fire
z
H¼ 1þ 4kvt t=tg
� �2=3A=H2� �
H4=3
" #�3=2
ð51:23Þ
A comparison of the predictions from
Equations 51.13 and 51.22 is provided in
Fig. 51.6. One principal difference relates to the
time delay for the smoke layer to form, i.e.,
transport lag. Transport lag is included implicitly
in Equation 51.13. Equation 51.22 assumes that a
smoke layer forms immediately. The transport
lag can be accounted for separately [13].
Example 4 For a fast, t2 fire in an atrium with a
cross-sectional area of 800 m2 and height of
20 m, determine the position of the smoke layer
interface after 120 s.
Solution Applying Equation 51.23 with A/H2 ¼ 2.0 and tg ¼ 150 s, z/H is 0.72 or
z ¼ 14.4 m.
Vented Period
If a smoke control system has the capability to
exhaust smoke, the descent of the smoke layer
can be arrested if the volumetric rate of smoke
exhaust from the smoke layer equals the volu-
metric rate of smoke supplied to the layer.
Neglecting the effect of expansion, the layer
descent is stopped when the mass exhaust rate
is equal to the mass entrainment rate by the
plume. Algebraic equations are available to esti-
mate the properties of the smoke layer, including
1. Position of smoke layer interface
2. Temperature of smoke layer
3. Light obscuration in smoke layer and
4. Gas concentration in smoke layer
Equilibrium Smoke Layer InterfacePosition
The exhaust rate necessary to arrest the descent
of the smoke layer can be estimated based on
knowledge of the mass entrainment rate into the
plume. The mass entrainment rate depends on the
configuration of the plume. Plume configurations
reviewed in this chapter are
1. Axisymmetric plume
2. Wall plume
3. Corner plume
4. Balcony spill plume
Axisymmetric Plume Axisymmetric plumes
are formed from fires involving fuel packages
remote from any walls (i.e., near the center of
the atrium floor). Being remote from any walls,
air is entrained around all of the plume perimeter
along the entire clear height of the plume. The
functional relationship of the mass entrainment
rate to the heat release rate and clear height
is [28].
_m ¼ f _Q1=3
c z5=3� �
ð51:24Þ
One set of equations for the mass entrainment
rate was originally derived by Heskestad
[27]. One of the equations in the pair developed
by Heskestad applies to estimating the entrain-
ment in the flaming portion of the plume and
another deals with the overall plume, including
flaming portion and upper portion where flames
are absent.
The limiting height is defined as the height of
the continuous flaming region, (i.e., where flames
are present 50 % of the time). The limiting height
may be estimated as [27].
1834 J.A. Milke
Telegram EDUFIRE_IREDUFIRE.IR

z f ¼ 0:166 _Q2=5
c ð51:25ÞFor clear heights less than the limiting height,
i.e., where flames extend into the smoke layer,
the entrainment rate is estimated using
Equation 51.26
_m ¼ 0:032 _Q3=5
c z ð51:26ÞFor clear heights greater than the limiting
height, i.e., where the flaming region ends prior
to reaching the smoke layer, the entrainment rate
is estimated using Equation 51.27:
_m ¼ 0:071 _Q1=3
c z5=3 þ 0:0018 _Qc ð51:27ÞEquation 51.27 is a simplified version of the
original expression developed by Heskestad (see
Chap. 13, with zo from the original expression set
equal to zero. The validity of neglecting zo in
Equation 51.27 is based on the observation that
zo is typically small, compared to z [2]. The loca-
tion of the virtual origin of an assumed point
source can be estimated as [27].
zo ¼ 0:083 _Q2=5 � 1:02do ð51:28Þ
For noncircular fuels, an equivalent diameter
needs to be defined. The definition of an equiva-
lent diameter is based on a circle that has an area
equal to the floor area covered by the fuel. Con-
sidering a wide range of diameters and heat
release rates associated with a variety of typical
fuel packages, the virtual origin ranges from 0.5
to �5 m. Negative values are obtained when the
second term is greater than the first (i.e., for fuel
commodities with modest heat release rates
spread over a large area).
Originally, Equations 51.26 and 51.27 were
developed to describe plumes from horizontal,
circular flammable liquid pool fires. However,
these equations have been shown to be applicable
to more complex fuels, as long as the limiting
height is greater than the diameter of the fuel, and
the fire only involves the surface of the material
(i.e., is not deep-seated) [27].
The mass rate of smoke production estimated
by Equations 51.26 and 51.27 is independent of
the type of materials involved in the fire, other
than indirectly in terms of the heat release rate.
This is due to the mass rate of entrained air being
much greater than the mass rate of combustion
products generated, which is true as long as suf-
ficient air is available for combustion. As a result
of the fire being approximated as a point source
in the entrainment equations, the shape or form
of the fuel is not of primary importance. Thus,
the parameters associated with a detailed
description of the fuel package are relegated to
a level of secondary importance.
In both Equations 51.26 and 51.27, the mass
entrainment rate is dependent on the clear height,
where the mass entrainment rate increases with
increasing values of the clear height. During the
early stages of the fire, the clear height has its
maximum value thereby providing the maximum
smoke production rate. This is especially true if
the flame height is well below the smoke layer,
where the smoke production rate is proportional
to z5/3.
In most engineering applications, the smoke
production (or exhaust) rate is expressed in terms
of a volumetric rate rather than a mass rate. In
order to accommodate this preference, the rela-
tionship between the volumetric rate and mass
rate is expressed as Equation 51.29.
_V ¼ _m
ρð51:29Þ
Assuming smoke to have the same properties
as air, the density of smoke may be evaluated as
the density of air at the temperature of the smoke
layer [3]. Graphs relating the volumetric smoke
production rate to the clear height for selected
total heat release rates ranging from 1000 to
10,000 kW are provided in Fig. 51.7.
Example 5 A fire has a total heat release rate of
5000 kW and is located at the center of the atrium
floor. The smoke layer interface is 35 m above
the floor. Determine the mass and volumetric
rates of smoke being supplied by the plume to
the smoke layer (i.e., at the location of the smoke
layer interface).
51 Smoke Control by Mechanical Exhaust or Natural Venting 1835
Telegram EDUFIRE_IREDUFIRE.IR

Solution First, the limiting height is evaluated
using Equation 51.25 to determine the applicable
equation for the mass rate of entrainment, assum-
ing the convective heat release fraction is 0.7,
zf ¼ 4.3 m. Because z > zf, Equation 51.27 is theapplicable equation for determining the mass rate
of smoke production. Neglecting zo, the mass
smoke production rate is 410 kg/s. The
associated volumetric rate (from Equation 51.29,
assuming 20 �C and 1 atm pressure) is 340 m3/s.
Wall and Corner Plumes Fires located near
walls and corners principally entrain air only
along the surface of the plume away from the
walls or corner. Consequently, the amount of
smoke production is reduced for these locations,
compared to the axisymmetric plume remotely
located from the walls. Using the concept of
reflection, the smoke production rate from wall
and corner plumes can be estimated [29, 30].
A plume generated by a fire located against a
wall only entrains air from approximately half of
its perimeter, as indicated in Fig. 51.8. According
to the concept of reflection, the smoke produc-
tion rate is estimated as half of that from a fire
that is twice as large (in terms of heat release
rate) (note: having half of the entrainment does
not cancel out the impact of considering twice
the fire size as the entrainment is proportional to
the one-third power of the heat release rate).
Similarly, a plume generated by a fire located
near a corner of a room is referred to as a corner
plume (see Fig. 51.8). Using the concept of a
reflection, the smoke production rate from corner
plumes, where the intersecting walls form a 90�
angle, is estimated as one-quarter of that from a
fire that is four times as large.
Example 6 A fire located on the floor of an
atrium has a total heat release rate of 5000 kW.
The smoke layer interface is 35 m above the
floor. Compare the mass rates of smoke being
supplied by the plume to the smoke layer, given
an axisymmetric, wall, or corner plume
configuration.
Solution In Example 5, zf ¼ 4.3 m and the
smoke production rate for the axisymmetric
plume using Equation 51.27 is 410 kg/s. Apply-
ing the same equation for the wall plume, the
smoke production rate for a fire size of
10,000 kW is estimated as 520 kg/s. Dividing
that rate by two provides the smoke production
rate for the wall plume (260 kg/s). Similarly, for
50454035302520151050
Clear height (m)
800
700
600
500
400
300
200
100
0
1000 kW 2500 kW 5000 kW 10,000 kW
Vol
umet
ric r
ate
(m3 /
s)
Fig. 51.7 Smoke
production rate for
axisymmetric plumes
1836 J.A. Milke
Telegram EDUFIRE_IREDUFIRE.IR

the case of the corner plume, the smoke produc-
tion rate is 170 kg/s (considering one-quarter of
the smoke production rate from a
20,000 kW fire).
Comparing the smoke production rates for the
three plumes (axisymmetric, wall, and corner
plumes), the smoke production rate is greatest
for the axisymmetric plume (410 kg/s) compared
to 260 and 170 kg/s for the wall and corner
plumes, respectively. Thus, conservative hazard
assessments should assume an axisymmetric
plume is developed from a fire that is located
away from the walls, near the center of the space.
Balcony Spill Plume A balcony spill plume is
generated in cases where smoke reaches an inter-
mediate obstruction, such as a balcony, travels
horizontally under the obstruction, and then turns
and rises vertically. Scenarios with balcony spill
plumes involve smoke rising above a fire, reaching
a ceiling, balcony, or other significant horizontal
projection, then traveling horizontally toward the
edge of the balcony. Characteristics of the
resulting balcony spill plume depend on
characteristics of the fire, width of the spill
plume, and height of the ceiling above the fire. In
addition, the path of horizontal travel from the
plume centerline to the balcony edge is significant.
Several correlations on air entrainment into
balcony spill plumes have been presented in the
literature over several decades. A comprehensive
review of the proposed correlations is provided
by Harrison [31], Lougheed et al. [32] and Lim
[33]. The correlations presented in NFPA
92 reflect the results obtained by Lougheed
et al. from large-scale experiments and numerical
simulations. One of the correlations in NFPA
92 has its roots back to Law’s [34] interpretation
of small-scale experimental data obtained by
Morgan and Marshall [35]. This correlation is
presented as:
_m ¼ 0:36 _Q _W2
� �1=3zb þ 0:25Hð Þ ð51:30Þ
Lougheed et al. found that their large scale
data was well described by this correlation for
clear heights (z) in excess of 15 m. For lower
heights, Lougheed et al. suggest the following
correlation:
_m ¼ 0:59 _Q1=3
W1=5ðzb þ 0:17 _W7=15
H
þ 10:35W7=15 � 15Þ ð51:31Þ
The correlations presented in Equations 51.30
and 51.31, as well as others presented by numer-
ous previous researchers, apply to balcony spill
plumes of a specific configuration. The configu-
ration considered is depicted in Fig. 51.9. As
illustrated in the figure, the fire is located in a
communicating space and the smoke flows under
a soffit out from the room of fire origin, then
under a short horizontal obstruction, i.e., bal-
cony. The balcony is oriented perpendicular to
the opening from the room. Any variations from
Wall plume
Corner plume
Fig. 51.8 Wall and corner plume diagrams
51 Smoke Control by Mechanical Exhaust or Natural Venting 1837
Telegram EDUFIRE_IREDUFIRE.IR

this specific configuration have not been
investigated and thus the balcony spill plume
correlations presented as Equations 51.30 and
51.31 should not be applied for those situations.
Instead, the application of CFD codes or small-
scale models should be applied to assess those
situations.
Predictions of the smoke production rate
using Equation 51.30 for the balcony spill
plume are included in Fig. 51.10. The
calculations represented in the figure consider a
3-m height to the underside of the balcony.
Reprinted with permission from NFPA
92-2012, Standard for Smoke Control Systems,
Copyright# 2011, National Fire Protection
Association. This reprinted material is not the
complete and official position of the NFPA on
the referenced subject, which is represented only
by the standard in its entirety.
A comparison of the smoke production rate
for axisymmetric and balcony spill plumes is
provided in Fig. 51.11. The results from both
Equations 51.30 and 51.31 are depicted in
Fig. 51.11 and are the reason for the points of
inflection at a clear height of 15 m. The heat
release rate for both fires is a steady state
5000 kW, and H is 3 m for the balcony spill
plume. For short heights, the smoke production
0.0
200.0
400.0
600.0
800.0
1000.0
1200.0
1400.0
1600.0
0 5 10 15 20 25 30 35 40 45 50
Clear height above balcony (m)
1000 kW, W=5 m 1000 kW, W=10 m 5000 kW, W=5 m
5000 kW, W=10 m 10000 kW, W=5 m 10000 kW, W=10 m
Vo
lum
etri
c R
ate
(m3 /
s)
Fig. 51.9 Approximation of a balcony spill plume
Fig. 51.10 Smoke production rate predictions for balcony spill plumes (H ¼ 3 m)
1838 J.A. Milke
Telegram EDUFIRE_IREDUFIRE.IR

rate for the balcony spill plume is appreciably
greater than that for the axisymmetric plume.
However, with increasing height, the smoke pro-
duction rates from the two plumes become com-
parable. Eventually, the two curves intersect,
suggesting that, at some height, the balcony
spill plume behaves in the same manner (i.e.,
produces the same amount of smoke) as an axi-
symmetric plume. The point of intersection can
be determined by setting the mass flow in Equa-
tion 51.27 equal to that in Equation 51.30.
The width of the plume, W, can be estimated
by considering the presence of any physical ver-
tical barriers attached to the balcony. The
barriers act to restrict dispersion of the horizontal
flow of smoke under the balcony. However, in
the absence of any barriers, an equivalent width
can be defined, based on results from visual
observations of the width of the balcony spill
plume at the balcony edge from the set of
small-scale experiments by Morgan and Mar-
shall [35]. The definition of an equivalent con-
fined plume width is the width that entrains the
same amount of air as an unconfined balcony
spill plume. The equivalent width is evaluated
using the following expression
L ¼ wþ b ð51:32Þ
Properties of Smoke Layer
Properties of the smoke layer are of interest both
during the filling period of the fire and during the
vented period. During the filling period, determi-
nation of the smoke layer properties is important
to assess the level of hazard prior to actuation of
a mechanical smoke control system. During the
vented period, smoke layer properties are of
interest to assess the level of hazard associated
with those cases where occupants are exposed to
smoke (i.e., the highest walking level is
submerged in the smoke layer). The smoke
layer properties of interest include temperature,
light obscuration, and gas species concentration.
Temperature Rise in Smoke Layer The tem-
perature of the smoke layer can be determined
based on an energy balance for the volume of the
smoke layer. Energy is supplied to the layer by
the fire. Energy may be lost from the layer to the
enclosure (walls, ceiling) of the space. During
the filling period, the resulting expression is [1].
T ¼ To exp1� χlð ÞQ
Qo
� �ð51:33Þ
Estimates for χl (heat loss fraction from the
smoke to enclosure) vary appreciably. Some of
the design guides suggest assuming that the
smoke layer is adiabatic (i.e., setting χl ¼ 0),
in order to be conservative [1]. Walton
suggested values for χl between 0.6 and 0.9
for relatively small spaces of near cubic shape
[36]. In many of the large spaces with tall
ceiling heights, the temperature rise anticipated
for the smoke layer is relatively modest such
that convection and radiation heat transfer to an
0.0
100.0
200.0
300.0
400.0
500.0
600.0
700.0
800.0
0 5 10 15 20 25 30 35 40 45 50
Clear height (m)
Axisymmetric
BALC, H= 3 m, W= 3 m
BALC, H= 3 m, W= 5 m
BALC, H= 5 m, W= 3 m
BALC, H= 5 m, W= 5 m
Vo
lum
etri
c ra
te (
m3 /
s)
Fig. 51.11 Comparison of
smoke production rate for
axisymmetric and balcony
spill plumes
51 Smoke Control by Mechanical Exhaust or Natural Venting 1839
Telegram EDUFIRE_IREDUFIRE.IR

enclosure will also be modest. Consequently, in
such applications, the adiabatic assumption will
provide reasonable predictions of the tempera-
ture rise. However, in low ceiling spaces (under
approximately 10 m) the temperature may be
significantly overestimated by applying the adi-
abatic assumption.
Similarly, the equilibrium smoke layer tem-
perature during venting can be approximated by
applying an energy balance to the smoke layer. In
this case, energy is also lost from the layer due to
smoke being exhausted from the atrium. Equa-
tion 51.34 can be used to determine the tempera-
ture rise of the smoke layer under adiabatic
conditions.
ΔT ¼ 1� χlð Þ _Qc
c p _mð51:34Þ
If the adiabatic assumption is applied, the
smoke layer temperature will be overestimated,
providing a conservative estimate of the hazard.
In reality, some heat is lost from the upper smoke
layer to the surrounding walls and ceiling. How-
ever, no elementary method is available to esti-
mate the overall proportion of heat that is lost to
the surroundings [37, 38]. Some zone and field
computer fire models account for heat losses to
the boundary, thereby avoiding the need to
specify the heat loss fraction [19, 39]. The adia-
batic smoke layer temperature for a range of fire
sizes is presented in Fig. 51.12.
The degree of overestimation can be assessed
by comparing the estimated smoke layer temper-
ature with the plume centerline temperature. For
thermodynamic reasons, the smoke layer temper-
ature cannot exceed the plume centerline temper-
ature. The plume centerline temperature, Tc, can
be evaluated using Equation 51.35 [40]
Tc ¼ 0:08To_Q2=3
c z�5=3 þ To ð51:35Þ
The volumetric venting rate for other heat
release rates or temperature rises may be deter-
mined using Equation 51.36 considering that the
specific heat is virtually constant for the expected
temperature range of interest
_Qc1
_Qc2
¼ V1
V2
ΔTad1
Tad2
T2
T1
ð51:36Þ
As can be observed from Equation 51.36, dou-
bling the volumetric venting rate for the same
size fire reduces the temperature rise by approxi-
mately 50 % (the temperature rise is not precisely
halved, since the absolute temperature of the
smoke layer in both instances is not exactly
the same).
504540353025201510500
50
100
150
200
250
300
350
400
1000 kW 2500 kW 5000 kW 10,000 kW
Clear height (m)
Tem
pera
ture
ris
e (K
)
Fig. 51.12 Temperature
rise of smoke layer for
axisymmetric plumes
1840 J.A. Milke
Telegram EDUFIRE_IREDUFIRE.IR

Light Obscuration The visibility distance
through smoke can be related to the optical den-
sity per unit pathlength via empirical correlations
[41, 42]. The experimental basis for the
correlations consists of tests with humans
viewing objects through smoke. However,
the participants were not directly exposed to the
irritating effects of smoke. Consequently, the
reported correlations are likely to overestimate
the visibility distance.
In addition to the light obscuration quality of
the smoke, the visibility of an object is dependent
on the light source for the object being viewed as
well as ambient lighting conditions [42, 43].
The optical density of the smoke layer can be
determined considering that all of the
particulates generated by the fire are transported
to the layer via the plume and accumulate in the
layer. Such an approach neglects any deposition
of soot on enclosure surfaces, thereby
overestimating the optical densities. The
expressions for the smoke filling and vented
periods are provided as Equations 51.37 and
51.38 [16].
Smoke filling : D ¼ DmQ
χaHcA H � zð Þ ð51:37Þ
Vented : D ¼ Dm_Q
χcΔHc _m=ρð51:38Þ
The mass optical density is dependent on the
fuel, burning mode, ventilation conditions, and
operation of sprinklers. The mass optical density
can vary by orders of magnitude for different
ventilation conditions.
Although a reduction in visibility is not
directly life-threatening, it does reduce the walk-
ing speed of individuals, thereby increasing the
exposure time to toxic gases and elevated
temperatures. In addition, the reduction in visi-
bility may lead to an increased susceptibility to
occupants tripping or falling. The relationship
between visibility and movement speed is
indicated in Fig. 51.13.
Carbon Monoxide Concentration The con-
centration of gas species contained in the smoke
layer can be determined considering that all of
the mass that is supplied to the layer via the
plume accumulates in the layer. No absorption
by the enclosure is assumed. The resulting
expressions for the smoke filling and vented
periods are [16].
Smoke filling : ϒi ¼ f iQ
ρoχaHcA H � zð Þð51:39Þ
Vented : ϒi ¼ f iQ
_mχaHcð51:40Þ
In order to express the gas species concentra-
tion in units of ppm, Equation 51.41 needs to be
applied
Nonirritatingsmoke
Irritatingsmoke
Blindfolded person
0
1.4
1.2
1.0
0.8
0.6
0.4
0.2
0.00 0.10 0.20 0.30 0.40
Optical density (m)
Wal
king
spe
ed (
m/s
)
Fig. 51.13 Relationship
between visibility through
smoke and walking speed
51 Smoke Control by Mechanical Exhaust or Natural Venting 1841
Telegram EDUFIRE_IREDUFIRE.IR

ppmi ¼ MWair
MWiγi � 106 ð51:41Þ
Input for evaluating the gas species concen-
tration includes the yield fraction and heat of
combustion, both of which are fuel dependent
parameters. The yield fraction is dependent on
the burning mode and oxygen concentration.
Most of the information tabulated on the yield
fraction, such as that by Khan (see Chap. 36),
assumes well-ventilated, flaming combustion.
Most of the fires of interest in large spaces will
involve flaming combustion and are likely to be
well ventilated. However, fires in small,
connected spaces may become underventilated.
Caution needs to be exercised in properly
identifying ventilation conditions when
predicting these parameters because the yield
fraction can vary by orders of magnitude for
different ventilation conditions. Also, the yield
fractions noted by Tewarson are relevant
only to cases where sprinklers are not
operating [44].
Example 7 Estimate the steady-state smoke
layer properties (temperature, visibility to an
internally illuminated exit sign, and CO concen-
tration) during the vented period, given the fol-
lowing situation:
1. The smoke layer interface is maintained 35 m
above floor level.
2. The rate of heat release of the flaming fire is a
steady state 5000 kW.
3. The fuel is comprised principally of
polyurethane foam.
SOLUTION Smoke Layer TemperatureEquation 51.34 can be applied to determine the
adiabatic smoke layer temperature rise. In Exam-
ple 5, a mass rate of smoke production of 410 kg/
s was determined. Thus, assuming an adiabatic
smoke layer, a convective heat release rate frac-
tion of 0.7 and specific heat of air of 1.0 kJ/kg�K,the temperature rise is 8.5 �C.
Visibility Visibility during the vented period is
estimated using Equation 51.38. Fuel-related
parameters are obtained in Chaps. 36, 24.
Dm ¼ 260 m2=kg
Hc ¼ 12, 400 kJ=kg
Considering smoke layer density, ρ, at the tem-
perature of the smoke layer to be 1.17 kg/m3, the
optical density is 0.32 m�1 and the associated
visibility is 8.5 m.
CO Concentration CO concentration for the
vented period is estimated using Equations 51.40
and 51.41, with the fuel-related properties again
evaluated from, Appendix C.
f CO for polyurethane ise 0:030kgco=kgfuelThe resulting CO concentration in the smoke
layer is 31 ppm.
Comparison of Mechanical Exhaustand Natural Venting Designs
Design Aspects of MechanicalVenting Systems
Most smoke control systems for covered malls
and atria in the United States use mechanical
venting systems. Mechanical venting systems
need to be designed to exhaust the amount of
smoke needed to satisfy design objectives. The
volumetric flow of smoke needs to be adjusted
for temperature, using the methods discussed
previously in this chapter.
Mechanical exhaust systems are relatively
immune to environmental effects because
the energy associated with the fan is able to pro-
vide a sufficient force for smoke movement and,
thus, is not relying as much on the buoyancy of
the smoke or stack effect. Protection from wind
effects can be accommodated by hardware.
Response time is a principal limitation for
mechanical exhaust systems. The response
time is the sum of the time for detection and the
time for the system to reach capacity (which may
be up to a minute). This combined time may be
longer than the time for the smoke layer to reach
the critical height established by design goals.
Also, because the capacity of a mechanical
venting system is sized considering a particular
1842 J.A. Milke
Telegram EDUFIRE_IREDUFIRE.IR

size of design fire (see Equations 51.26, 51.27,
51.30 and 51.31), if an actual fire has a greater
heat release rate than considered in the design,
the capacity of the mechanical exhaust will not
be sufficient.
In addition, mechanical exhaust systems are
susceptible to plugholing, a situation in which a
hole is created in the smoke layer below the
exhaust inlet by a high-capacity exhaust system.
This results in a reduction in efficiency of the
exhaust system because air from beneath
the smoke layer is being extracted, thereby the
desired quantity of smoke is not being extracted,
causing the smoke layer to deepen. Plugholing is
addressed later in this chapter.
The limitations of mechanical venting
systems can be overcome in some cases by
providing detection devices that minimize the
time required for detection and by using several
small capacity exhaust fans to avoid plugholing.
However, despite these measures, it is still possi-
ble that design goals will not be able to be
achieved by mechanical venting designs. Thus,
the feasibility of such goals may need to be
evaluated. Alternative smoke management
approaches may be sought, for example,
providing physical barriers at upper levels to
reduce the required clear height or considering
opposed airflow at openings above the design
smoke layer interface position.
Design Aspects of NaturalVenting Systems
Natural venting removes smoke by taking advan-
tage of the buoyancy of the smoke. In the United
States, natural venting systems are primarily found
only in facilities such as industrial or warehouse
structures. Outside of the United States, natural
venting is often utilized in many applications.
The key advantages of natural venting
systems are the self-correcting aspect of the
vents in case the design fire is inappropriately
defined and the simplicity of the operation of
natural vents. These advantages will be described
as part of the continuing discussion in this
section.
The engineering principles that apply to vent
operation addressed in this section consider
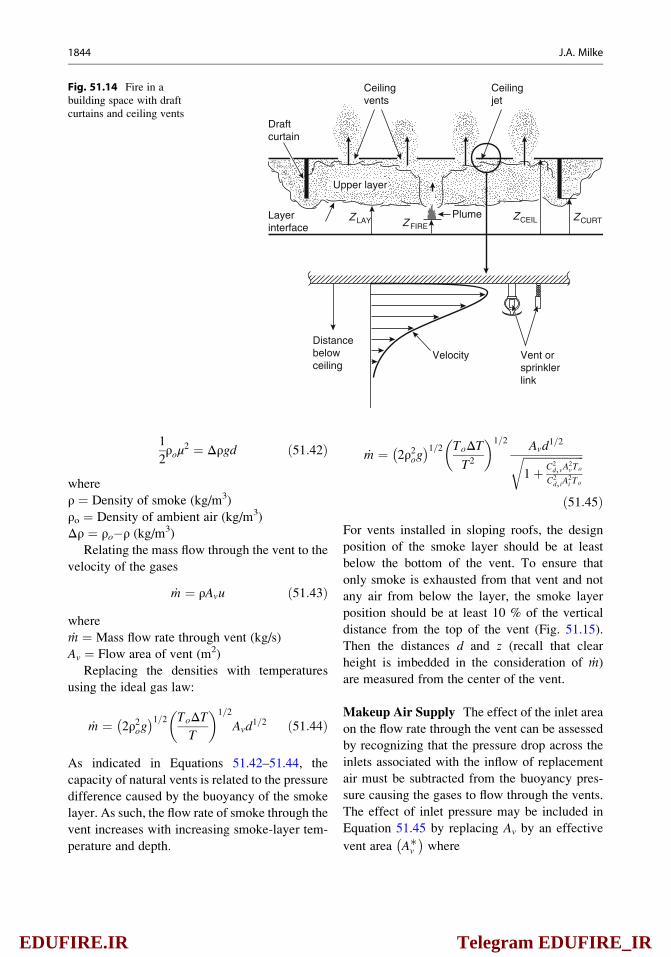
the scenarios depicted in Fig. 51.14. Because
smoke filling along the underside of the ceiling
in a curtained area is similar to that in a compart-
ment, additional information on compartment
fire scenarios is presented in Chap. 33. If the
draft curtains are deep enough, they can be
thought of as simulating the walls of a single
compartment.
The description of engineering principles of
natural vents will be provided from the perspec-
tive of a two-layer zone model. The overall
building compartment is assumed to have near-
floor inlet vents that are large enough to maintain
the area below the smoke layer at outside-
ambient conditions. The upper smoke-layer
thickness will change with time, but at any
instant it is assumed to be uniform in space,
with absolute temperature, T, and density, ρ.Mass and energy are transferred continuously
to and from the upper and lower layers. Conser-
vation of energy and mass along with the Ideal
Gas Law is applied to the layers, which leads to
equations that require estimates of components
of heat transfer, enthalpy flow, and mass flow to
the layers. Qualitative and some key quantitative
features of these phenomena are described and
presented below. The reader is referred to
Chap. 15, for a general discussion on the topic
of flow through vents. Considering a vent in a
wall or ceiling, flow is driven through such a vent
mainly by cross-vent hydrostatic pressure
differences from the high- to the low-pressure
side of the vent. The traditional means of calcu-
lating vent-flow rates is by using an orifice-type
flow calculation.
Assuming relatively quiescent conditions in
the areas on both sides of the vent, the pressure
in each space can be described as the hydrostatic
pressure. The mass flow through a vent is derived
from Bernoulli’s equation, where the buoyancy
pressure is related to the dynamic pressure at the
vent:
51 Smoke Control by Mechanical Exhaust or Natural Venting 1843
Telegram EDUFIRE_IREDUFIRE.IR
1
2ρoμ
2 ¼ Δρgd ð51:42Þ
where
ρ ¼ Density of smoke (kg/m3)
ρo ¼ Density of ambient air (kg/m3)
Δρ ¼ ρo�ρ (kg/m3)
Relating the mass flow through the vent to the
velocity of the gases
_m ¼ ρAvu ð51:43Þwhere
m ¼ Mass flow rate through vent (kg/s)
Av ¼ Flow area of vent (m2)
Replacing the densities with temperatures
using the ideal gas law:
_m ¼ 2ρ2og� �1=2 ToΔT
T
� �1=2
Avd1=2 ð51:44Þ
As indicated in Equations 51.42–51.44, the
capacity of natural vents is related to the pressure
difference caused by the buoyancy of the smoke
layer. As such, the flow rate of smoke through the
vent increases with increasing smoke-layer tem-
perature and depth.
_m ¼ 2ρ2og� �1=2 ToΔT
T2
� �1=2 Avd1=2ffiffiffiffiffiffiffiffiffiffiffiffiffiffiffiffiffiffiffiffiffiffi
1þ C2d,vA
2vTo
C2d, iA
2i To
rð51:45Þ
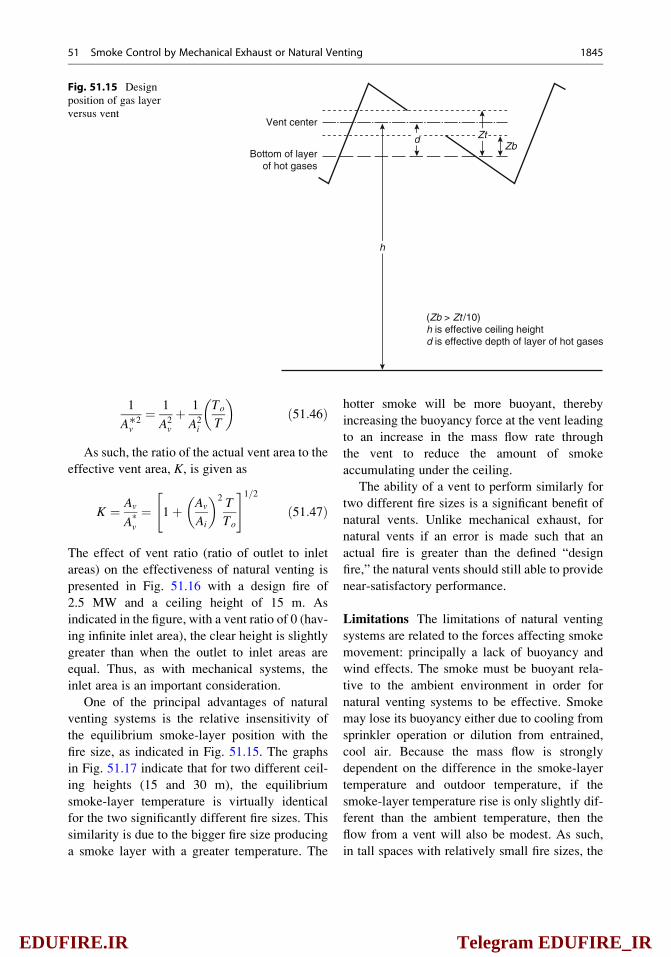
For vents installed in sloping roofs, the design
position of the smoke layer should be at least
below the bottom of the vent. To ensure that
only smoke is exhausted from that vent and not
any air from below the layer, the smoke layer
position should be at least 10 % of the vertical
distance from the top of the vent (Fig. 51.15).
Then the distances d and z (recall that clear
height is imbedded in the consideration of m)
are measured from the center of the vent.
Makeup Air Supply The effect of the inlet area
on the flow rate through the vent can be assessed
by recognizing that the pressure drop across the
inlets associated with the inflow of replacement
air must be subtracted from the buoyancy pres-
sure causing the gases to flow through the vents.
The effect of inlet pressure may be included in
Equation 51.45 by replacing Av by an effective
vent area A∗v
� �where
Distancebelowceiling
Velocity Vent orsprinklerlink
Draftcurtain
Ceilingvents
Ceilingjet
Layerinterface
Z LAY ZCEIL ZCURTZ FIRE
Plume
Upper layer
Fig. 51.14 Fire in a
building space with draft
curtains and ceiling vents
1844 J.A. Milke
Telegram EDUFIRE_IREDUFIRE.IR
1
A∗2v
¼ 1
A2v
þ 1
A2i
To
T
� �ð51:46Þ
As such, the ratio of the actual vent area to the
effective vent area, K, is given as
K ¼ Av
A*v
¼ 1þ Av
Ai
� �2 T
To
" #1=2ð51:47Þ
The effect of vent ratio (ratio of outlet to inlet
areas) on the effectiveness of natural venting is
presented in Fig. 51.16 with a design fire of
2.5 MW and a ceiling height of 15 m. As
indicated in the figure, with a vent ratio of 0 (hav-
ing infinite inlet area), the clear height is slightly
greater than when the outlet to inlet areas are
equal. Thus, as with mechanical systems, the
inlet area is an important consideration.
One of the principal advantages of natural
venting systems is the relative insensitivity of
the equilibrium smoke-layer position with the
fire size, as indicated in Fig. 51.15. The graphs
in Fig. 51.17 indicate that for two different ceil-
ing heights (15 and 30 m), the equilibrium
smoke-layer temperature is virtually identical
for the two significantly different fire sizes. This
similarity is due to the bigger fire size producing
a smoke layer with a greater temperature. The
hotter smoke will be more buoyant, thereby
increasing the buoyancy force at the vent leading
to an increase in the mass flow rate through
the vent to reduce the amount of smoke
accumulating under the ceiling.
The ability of a vent to perform similarly for
two different fire sizes is a significant benefit of
natural vents. Unlike mechanical exhaust, for
natural vents if an error is made such that an
actual fire is greater than the defined “design
fire,” the natural vents should still able to provide
near-satisfactory performance.
Limitations The limitations of natural venting
systems are related to the forces affecting smoke
movement: principally a lack of buoyancy and
wind effects. The smoke must be buoyant rela-
tive to the ambient environment in order for
natural venting systems to be effective. Smoke
may lose its buoyancy either due to cooling from
sprinkler operation or dilution from entrained,
cool air. Because the mass flow is strongly
dependent on the difference in the smoke-layer
temperature and outdoor temperature, if the
smoke-layer temperature rise is only slightly dif-
ferent than the ambient temperature, then the
flow from a vent will also be modest. As such,
in tall spaces with relatively small fire sizes, the
h
d ZtZb
Vent center
Bottom of layerof hot gases
(Zb > Zt /10)h is effective ceiling heightd is effective depth of layer of hot gases
Fig. 51.15 Design
position of gas layer
versus vent
51 Smoke Control by Mechanical Exhaust or Natural Venting 1845
Telegram EDUFIRE_IREDUFIRE.IR

modest capacity of natural vents may constrain
the ability to achieve design objectives,
necessitating that mechanical ventilation
be used.
To consider the effect of outside wind
conditions, pressures on the outside of the build-
ing in the vicinity of the vent need to be assessed.
The pressure on the building depends on the wind
speed at the elevation of the vent, wind direction
relative to the outside building geometry, and
proximity and geometry of neighboring
buildings. Wind effects on buildings are
addressed in Klote et al. [2].
If the building vents are open and if vent areas
are relatively small compared to the building
surface area, then pressures near the vent
openings will be substantially unchanged from
the above-mentioned, closed-vent pressure dis-
tribution, except near any local through-vent
flows that may develop. Also, although the
0
10
20
30
40
50
60
70
80
90
0 3 6 9 12 15
Clear height (m)
Vent ratio = 0
Vent ratio = 0.5
Vent ratio = 1
Ven
t are
a (m
2 )
Fig. 51.16 Effect of vent
ratio on natural venting
0
10
20
30
40
50
60
70
0 6 12 18 24 30
Ven
t are
a (m
2 )
15 m, 2.5 MW
15 m, 5 MW
30 m, 2.5 MW
30 m, 5 MW
Clear height (m)
Fig. 51.17 Effect of vent
ratio on natural venting for
two ceiling heights
(15, 30 m) and fire sizes
(2.5 MW, 5 MW)
1846 J.A. Milke
Telegram EDUFIRE_IREDUFIRE.IR

exterior pressures generally vary from vent to
vent, they will be relatively uniform for any
particular vent. Under these conditions, a deter-
mination of flow rates into and/or out of vents
and through the interior of the building is based
on an interior building flow analysis, with
pressure-specified boundary conditions at the
open vents.
A Single, Open Inlet Vent or Multiple
Openings at the Same Pressure If there is
only one open inlet vent on the upwind side of
the building that experiences a relatively high
pressure differential above the local hydrostatic
pressure or if there are several open vents, all at
locations on the outside surface of the building
where pressures are substantially identical, then,
the wind will have no effect on the inflow or
outflow through the vents. Thus, if the air inside
the building is uniformly at the outside air tem-
perature and if there is no mechanical ventilation,
then the effect of the wind will be simply to bring
the interior hydrostatic pressure at the location of
the vent(s) to the aerodynamic-flow-specified
value; the interior of the building will be
“pressurized” as a result of the open vent(s), but
there will be no wind-induced interior flows. If
there is a fire in the room with the open vent (e.g.,
the vent is a broken window), then, in the usual
way, there will be fresh air inflow into the room
toward the bottom of the vent and buoyant smoke
outflow toward the top of the vent, all this taking
place at an aerodynamic-flow-specified, elevated
hydrostatic pressure within the room.
If the open vent is in a side of the building
with a negative wind coefficient (e.g., facing
downwind or on roofs near the upwind side),
the pressure at the vent will be relatively low,
and the local hydrostatic pressure will be reducedby an amount only on the order of ρou2/2. Again,no wind-induced flow at the vent is expected.
Two Inlet Vents, One on the Upwind Side and
One on the Downwind Side of the Building If
there are two inlet vents in the walls of the
building, one upwind and one downwind (ignor-
ing heating and mechanical ventilation), then
there will be wind-induced flow through the
vents and within the building. Inlet air will be
provided at the high-pressure upwind vent and
outlet air at the low-pressure downwind vent,
with levels of through-vent flows and of interior
hydrostatic pressures determined by an appropri-
ate analysis that accounts for conservation of
momentum (i.e., Bernoulli’s equation) and mass
at the exterior vents and at room-to-room vents
within the interior of the building. The changes in
hydrostatic pressures within the rooms of the
building, over and above the hydrostatic
pressures that would be present in a quiescent
environment, would be somewhere between the
wind-induced pressures at the locations of the
high-pressure vent and the low-pressure vent.
Wind-Modified Pressures at Roof Surfaces
and Wind-Modified Action of Ceiling
Vents Roof surfaces of flat-roofed buildings
tend to have negative, wind-induced pressure
coefficients, unless the buildings are very long
in a direction parallel with the wind direction.
Sloping roofs may have pressure coefficients that
can be positive or negative, depending on wind
direction. Therefore, if the interior, wind-induced
hydrostatic pressures are greater than those
associated with a quiescent environment (e.g.,
the result of open vents in the upwind side of
the building), then the flow of smoke through
ceiling vents can be enhanced significantly by
virtue of increased, favorable, cross-vent
pressures. However, for reduced interior
pressures (e.g., as a result of open vents on the
downwind side of the building), the effect of
wind conditions can substantially disrupt the
desired smoke-removing action of ceiling vents,
even reducing the direction of the cross-vent
pressures and, as a result, the direction of the
flow through the vents (i.e., making the flow
travel from the outside to the inside).
Thermal Activation of Vents
Convective heating and thermal response of
near-ceiling-deployed fusible links or other
near-ceiling thermal sensor devices (including
thermoplastic vent covers designed to soften
51 Smoke Control by Mechanical Exhaust or Natural Venting 1847
Telegram EDUFIRE_IREDUFIRE.IR

and “drop out” at specified actuation design
temperatures) are determined from the local
time-dependent distributions of ceiling jet veloc-
ity and temperature. These distributions will
depend on vertical distance below the ceiling
and radial distance from the fire-plume axis.
Once the operating temperature of the thermal
element is reached, the device or devices
operated by the element will be actuated.
Characteristics of ceiling jets are described in
Chap. 14.
The mathematical fire model LAVENT (fus-
ible-Link-Actuated VENTs) [22–24] was devel-
oped and is available to simulate most of the
phenomena described above. The LAVENT
model can be used to simulate on a time-
dependent basis and to study parametrically a
wide range of scenarios with natural vents. Full
documentation for LAVENT, including its theo-
retical basis [22], a user guide for the computer
code [23], and sample problems using the code
are included in Annexes B, C, and D of NFPA
204 [45]. In its current form, LAVENT does not
account for wind effects, the reduced effective-
ness of vents as a result of limited-area inlet
vents, or the presence of mechanical systems
[22]. Input data on the thermal response
characteristics of the link will be needed for
such an analysis. The use of LAVENT has not
been validated for estimating the response of
“drop out” vents.
Sprinklers and Vents
Vents and sprinklers provide different fire safety
benefits. The level of fire safety in a facility
would be enhanced if both sets of benefits could
be achieved systematically. However, simply
providing the two technologies following design
rules independent of each other will not neces-
sarily lead to a combination of their respective
benefits. Potential problems may occur as a result
of the interaction of the two technologies (i.e.,
operation of the smoke and heat vents can mod-
ify sprinkler performance and the operation of
the sprinklers can modify smoke and heat vent
performance). As an example of the latter, con-
sider the case in which water spray from a sprin-
kler system cools the smoke, thereby reducing
the buoyancy of the smoke. The reduced buoy-
ancy reduces the mass flow rate through a vent,
thereby resulting in a deeper smoke layer. How-
ever, the sprinkler discharge can also dramati-
cally reduce the fire size resulting in a decreased
production of smoke.
Numerous research projects have been
conducted to address the interaction between
vents and sprinklers (see Annex A of NFPA
204 and Beyler and Cooper [46] for a thorough
review of the previous research). The previous
projects have sought to demonstrate the level of
impact that one system has on the other’s per-
formance, either by indicating that it is always
significant, always insignificant, or significant
only if a particular set of conditions is provided.
Projects have also attempted to identify design
changes necessary if both systems are present
(i.e., perhaps larger vent sizes could be installed
in sprinklered buildings to counteract the
reduced mass flow of cooled smoke). To date,
none of the previous projects have been able to
provide the conclusive results that provide
definitive information illustrating the degree of
influence that one system has on the other for
all situations.
Past Studies of Combined Vent/Sprinkler
Systems A review of 34 papers evaluated the
validity of generic claims and counterclaims on
the benefits of combined vent/sprinkler systems
[46]. A listing of these claims and counterclaims
and a summary of conclusions on their validity
follow.
Claims and Counterclaims [46] In the literature,
claims that have been made in favor of vent/
sprinkler systems can be reduced to the following
three:
1. Smoke and heat vents limit the distribution of
products of combustion in the facility whether
deployed sprinklers are operative or
inoperative.
2. Smoke and heat vents decrease the number of
activated sprinklers.
1848 J.A. Milke
Telegram EDUFIRE_IREDUFIRE.IR

3. Smoke and heat vents assist the fire depart-
ment in identifying the location of the fire
within the facility and in reducing the need
for manual roof venting.
In the literature, claims that have been made
against vent/sprinkler systems can be reduced to
the following four:
1. Smoke and heat vents cause enhanced burning
rates.
2. Smoke and heat vents delay sprinkler
activation.
3. Smoke and heat vents increase the number of
activated sprinklers.
4. Smoke and heat vent flow rates are insuffi-
cient to realize any benefit.
Validity of Claims for and Against Combined
Vent/Sprinkler Systems After evaluating reports
of studies of combined vent/sprinkler systems,
Beyler and Cooper [46] came to the following
conclusions:
• Venting does not have a negative effect on
sprinkler performance.
• If a fire is directly beneath a vent, activation of
the first sprinklers may be delayed slightly,
but there is no evidence that this delay will
have a significant impact on overall sprinkler
performance.
• Venting does limit the spread of smoke by
removing smoke from the building near the
source of the fire (within the curtained com-
partment of fire origin), improving visibility
for building occupants while evacuating and
for fire fighters during fire control operations.
• By limiting the spread of smoke and heat,
venting reduces smoke and heat damage to
the building.
• In the event that sprinklers do not operate,
venting remains a valuable aid in controlling
the fire manually.
• In many fires, current vent design practices,
for example, those of NFPA 204 [45], are
likely to limit the number of vents operated
to one and, in successful sprinkler operations,
vents may not operate at all.
• Design practices should use methods that
ensure early operation of vents; vent operation
should be ganged so that the benefit of roof
vents is fully realized.
• When deployed with vents and draft curtains,
a sprinkler design needs to take full account of
draft curtains as obstructions to ceiling jet
flows and sprinkler discharge.
• Draft curtains should be placed in aisles rather
than over storage.
Considerations for the Design of Combined
Vent/Sprinkler Systems Taking Beyler and
Cooper’s conclusions into account and drawing
on current knowledge of basic physical phenom-
ena involved in vent/sprinkler interactions, the
design of combined sprinkler/vent systems should
seek to satisfy the following general criteria:
1. A successful vent design, whether deployed
with or without sprinklers, is one that leads to
the benefits of improved visibility and safety
during a fire by limiting the descent of the
upper smoke layer to a specified height (i.e.,
eye level of occupants and fire fighters).
2. When draft-curtain compartmentation is
included in the vent design, a significant addi-
tional possible benefit results from the smoke
being contained within the curtained compart-
ment of fire origin by action of the venting.
Interaction of Sprinkler Spray and Smoke
Layer The action of sprinkler sprays on a
smoke layer includes a combination of evapora-
tive cooling and dilution of the smoke. Dilution
occurs due to entrainment of the relatively cool
and uncontaminated lower-layer gases and the
upper layer by the spray [47–59]. Provided the
sprinkler spray–reduced smoke temperature and
associated loss of buoyancy are not too great, the
effect of evaporative cooling of the smoke, even
if accompanied by moderate sprinkler
spray–driven mixing, could be offset by addi-
tional vent capacity. However, even without sig-
nificant evaporative cooling, sprinkler
spray–driven mixing action can be so significant
that it leads to a precipitous increase in the vol-
ume of smoke and thus a deeper smoke-layer. If
and when the latter vigorous mixing occurs, then
even impractically large increases in vent capac-
ity are unlikely to lead to any significant
51 Smoke Control by Mechanical Exhaust or Natural Venting 1849
Telegram EDUFIRE_IREDUFIRE.IR
improvement. The latter phenomenon is com-
monly referred to as smoke logging. As such, avent design that is developed to meet the above
general criteria must be based on an analysis that
accounts for and avoids the phenomena of smoke
logging.
There is experimental evidence that smoke
logging can be controlled by venting [60], and a
preliminary analysis to explain the phenomenon
has been provided [47, 48]. Thus, it has been
reported that “preliminary tests in [a] . . . large-
scale mall . . . showed that, under some
conditions, [a] . . . smoke layer could be brought
down by a manually operated sprinkler spray,
[and that] smoke logging then occurred rapidly,
with a high smoke density at low level. However,
under some conditions, the smoke layer was not
disturbed by a sprinkler spray” [48].
Computer Simulations of Sprinkler
Spray–Driven Cooling, Mixing, and Smoke
Logging A computer model could be applied
to address the issue of sprinkler spray–driven
cooling, mixing, and smoke logging. However,
the past experimental studies have not led to an
understanding of the complex phenomena of
sprinkler spray cooling and sprinkler
spray–driven smoke transport and mixing that
causes the temperature reduction that could be
used as a basis for such a model. What is known
through anecdotal accounts of visual
observations is that spray-driven mixing and
transport of an initially stable and growing
upper smoke layer can and often does lead to
onset of smoke logging, whereby the mixing
actions of sprinkler sprays are so vigorous as to
effectively and continuously mix any newly
generated smoke from the fire plume with the
smoke already present in the smoke layer to fill
the entire space.
Analytic fire-modeling has been employed to
assess a generic interaction of a downward-
directed sprinkler spray and a two-layer fire envi-
ronment can be used to resolve the above issues
[59]. The model simulated the action of the sprin-
kler spray, including the effects of evaporative
cooling and the spray-driven mixing of the
elevated-temperature, upper smoke layer and
the relatively cool and uncontaminated lower
layer. The analysis led to the identification of
six possible modes of sprinkler/layer interaction
[58, 59]. The mode that prevailed at any time
during the development of a particular fire was
found to depend mainly on the thickness and
temperature of the upper smoke layer and on
the momentum, spread angle, and characteristic
droplet size of the sprinkler spray. In any partic-
ular fire scenario, the action of open vents and/or
draft-curtain compartmentation could provide
some control of the thickness and temperature
of the layer and, therefore, of sprinkler/layer
interactions that prevail.
Of the six above-referenced modes of sprin-
kler/vent interaction, four were found to be par-
ticularly favorable in the sense that they would
maximize the success of a combined sprinkler/
vent design. Thus, with proper vent design the
favorable modes could lead to the desired control
of the smoke-layer depth while minimizing
smoke mixing to the lower layer to the point
that any smoke there is only in a highly dilute
state. Thus, for a given set of sprinkler spray
characteristics, if the smoke layer is kept rela-
tively thin and/or not too buoyant (i.e., its tem-
perature is not too high), then the rates of both
mass and enthalpy flow entrained into the upper-
layer part of the sprinkler’s “spray cone of influ-
ence” would be relatively insignificant compared
to the corresponding rates associated with the
fire-plume flow to the upper layer. In the early
part of a typical fire scenario and immediately
subsequent to one or more rapid-response sprin-
kler discharges, the condition of a relatively thin
and not-too-high-temperature upper smoke layer
should be prevalent. As a result, the combined
action of cooling and momentum exchange in the
spray cone would be strong enough to transport
the entrained smoke through the layer interface
and well into the depth of the lower layer to be
mixed eventually, with negligible consequences,
into the rest of the lower-layer gases.
In contrast to the above, there were two par-
ticularly unfavorable modes of sprinkler/vent
interaction that would minimize the likely suc-
cess of a combined sprinkler/vent design. These
configurations could lead to relatively vigorous
1850 J.A. Milke
Telegram EDUFIRE_IREDUFIRE.IR

mixing between the smoke layer and the lower
layer, leading to a rapid growth of the upper
smoke layer and possibly to smoke logging.
Resolving the Problem of Sprinkler Skipping
and Vent Skipping In terms of achieving vent/
sprinkler design objectives, it is important to
identify a possible means of resolving problems
associated with the phenomena known as sprin-kler skipping and vent skipping.
If ceiling jet–convected water droplets strike a
sprinkler link or bulb, then, because of effects of
evaporative cooling, there will be a significant
reduction of its rate of heating, which can lead to
a significant delay in sprinkler discharge. It is the
resulting, unpredictable, and deleterious delay in
sprinkler discharge that is referred to as sprinkler
skipping.Although research has been conducted to
characterize the spray from sprinklers, a general
description of all aspects of the spray is beyond
the current state of knowledge. Such a descrip-
tion would be needed to provide a reliable
model that can be used to predict the
phenomenon.
Accounting for Sprinkler Skipping and Vent
Skipping in Design In the design of sprinklers
without vents, the effects of sprinkler skipping on
the ability of a sprinkler system to control a fire
are taken into account by the empirically based
design standard, NFPA 204. In contrast, when
vents and sprinklers are used together, the ran-
dom and unpredictable effects of vent skipping
are not accounted for in the design of automatic
vent systems as outlined in NFPA 204.
In terms of combined vent/draft-curtain
designs, and as an alternative to traditional auto-
matic, fusible-link-actuated vents, which could
involve the problem of vent skipping, a more
controllable and reliable means of ensuring
timely and effective vent action is available.
One generic possibility would involve ganging,
that is, opening together all or most vent units in
the compartment of fire origin [61]. A ganging
strategy that could be well integrated into a reli-
able, consensus sprinkler/vent design is one in
which all vents of the fire compartment are
ganged to open together immediately following
first sprinkler discharge.
A Consensus Approach to the Designof Combined Sprinkler/Vent Systems
Using Mathematical Fire Models to Achieve
Design Objectives The above discussion
indicates that effective sprinkler/vent systems
are feasible and that mathematical fire models
with a proven capability for simulating sprin-
kler/smoke interactions can be used as the basis
for a consensus approach to identify and estab-
lish effective sprinkler/vent system designs.
The capabilities of mathematical models to sim-
ulate sprinkler/smoke interactions have been
reviewed [62, 63]. The models considered were
those that are complete (i.e., they can simulate
both isolated sprinkler/smoke interactions and
full fire scenarios, where the latter would be
used to establish the success of sprinkler/vent
designs). Both zone-type and field model–type
simulation approaches were found to be applica-
ble for addressing the problem. In the usual way,
the two approaches are complementary in the
sense that the zone model approach is more
applicable and appropriate for parametric studies
and as a practical design tool and the field model
approach is more applicable for simulating and
studying the details of specific scenarios, for
example, the discharge sequence of sprinklers
and the effectiveness of a vent design where
draft curtains are almost directly above the fire.
A sprinkler/vent design approach that uses
zone-type fire model simulations might involve
application of an advanced version of LAVENT
that would include the sprinkler/smoke-
interaction simulation model [59] discussed ear-
lier. A successful preliminary implementation of
this approach, with a revised prototype model
called LAVENTS (fusible Link-Actuated
VENTs and Sprinklers), has already been
presented [64]. Applications of the LES (LargeEddy Simulation) model [65–68], the JASMINE
model [69, 70], and others [71, 72] have also
been reported.
51 Smoke Control by Mechanical Exhaust or Natural Venting 1851
Telegram EDUFIRE_IREDUFIRE.IR

One of the difficulties in applying the above
for design applications is the limited availability
of input data to describe the initial sprinkler
spray from a wide range of sprinklers and the
response characteristics of the vent.
A Set of Example Guidelines for Design of a
Consensus Sprinkler/Vent System As a sum-
mary to the above discussion, the following
example guidelines are provided for the design
of a sprinkler/vent system.
1. Establish the sprinkler design in the tradi-
tional way; that is, develop design parameters
using full-scale testing involving effective,
rapid, sprinkler-activation strategies in the
absence of vents (in this context, “rapid”
means that the design problem involves an
effectively unconfined ceiling where smoke-
layer buildup is negligible and does not affect
the timing or sequence of early sprinkler
discharge).
2. Establish a vent design objective. In cases in
which sprinkler action is expected to control
the fire (i.e., the fire will not exceed a
specified, maximum energy-release rate), the
design objective for scenarios as shown in
Fig. 51.13 might be for the vents to maintain
indefinitely the smoke from spreading beyond
the curtained compartment of fire origin (i.e.,
the smoke-layer interface does not descend
below the bottom of the draft curtains). If the
latter design objective is too ambitious or in
cases in which sprinkler action is expected
only to slow but not to stop the growth of the
fire, then the design objective would be for the
vents to maintain the smoke from spreading
beyond the curtained compartment of fire ori-
gin for a specified time interval (e.g., the time
expected for the fire department to respond
and initiate an attack on the fire).
3. Adopt a practical/achievable strategy of early
opening of all vents in the compartment of fire
origin, e.g., ganged operation of all vents in
the curtained compartment of fire origin based
on and subsequent to first sprinkler activation.
4. Using a fire model with a proven capability of
simulating the time-dependent interaction of
sprinklers, vents, and draft curtains, develop a
vent design that meets the established design
objectives.
Special Conditions
There are some aspects of smoke control system
design that involve special attention. These
aspects, which affect actuation of active smoke
control systems and the efficiency of exhaust
fans, are the following:
• Intermediate stratification
• Confined flow
• Plugholing
• Makeup air supply
Intermediate Stratification
The upward movement of smoke in the plume is
dependent on the smoke being buoyant relative
to the surroundings. Delays in activation may be
experienced where ceiling-mounted initiating
devices are present if the air near the ceiling is
warmer than the rising smoke [2, 73]. Dillon [74]
reported measurements of the difference in ambi-
ent temperature from floor to ceiling to be on the
order of 50 �C in some atria with glazed ceilings.
A prefire, warm air layer may be created due to a
solar load where the ceiling contains glazing
materials. In such cases, the smoke will stratify
below this warm air layer and not reach the
ceiling. Early after ignition, the maximum height
to which the smoke plume will rise depends on
the convective heat release rate and the ambient
temperature variation in the open space.
Algebraic correlations may be applied to
address two situations (Fig. 51.18):
1. The temperature of the ambient air is assumed
constant up to a height above which there is
discrete increase in temperature associated
with a layer of warm air. This situation may
occur if the upper portion of a mall, atrium, or
other large space is unoccupied so that the air
in that portion is left unconditioned.
2. The ambient interior air within the large space
has a constant temperature gradient
1852 J.A. Milke
Telegram EDUFIRE_IREDUFIRE.IR

(temperature change per unit height) from
floor level to the ceiling. This case is less
likely than the first.
In the first case, where the interior air has a
discrete temperature change at some elevation
above floor level, then the potential for stratifica-
tion can be assessed by determining the tempera-
ture of the plume at the height associated with
the lower edge of the warm air layer. Where the
plume centerline temperature is equal to the
ambient temperature, the plume is no longer
buoyant, loses its ability to rise, and stratifies at
that height. One correlation for the plume center-
line temperature was presented previously as
Equation 51.35.
In the particular case where the ambient,
pre-fire temperature increases uniformly along
the entire height, the maximum plume rise can
be determined from [19].
zm ¼ 3:79F1=4G�3=8 ð51:48Þwhere
F ¼ g _Qc= Toρoc p
� �G ¼ � g=ρoð Þdρo=dz
Assuming standard conditions and that the
smoke in the space behaves as an ideal gas, the
expressions for F and G are
F ¼ 0:0277 _Qc
G ¼ 0:0335dTo=dz
Because dTo/dz is a constant, ΔTo/H may be
substituted for the derivative. Substituting the
simplified expressions for F and G into Equa-
tion 51.48 yields [73].
zm ¼ 5:54 _Q1=4
c ΔTo=Hð Þ�3=8 ð51:49ÞBy reformulating Equation 51.49 to solve for
_Qc, a minimum fire size can be determined that is
just large enough to force the smoke to the ceil-
ing of an atrium without prematurely stratifying
due to the increasing ambient temperature.
_Qc ¼ 0:00118H5=2ΔT3=2o ð51:50Þ
The results of an analysis of intermediate
stratification are presented in Fig. 51.19. In one
case, a step function is assumed to provide a
30 �C change in temperature 15 m above the
floor due to the upper portion of the atrium
being unconditioned. For the other case, a tem-
perature gradient of 1.5 �C/m is arbitrarily
assumed in an atrium with a ceiling height of
20 m. Plume centerline temperatures from two
size fires are graphed based on Equation 51.35.
As indicated in the figure, for the case with the
uniform gradient, smoke is expected to stratify
Step functiontemperature
profile
Buildingwith
atrium
Lineartemperature
profile
Fig. 51.18 Pre-fire
temperature profiles
51 Smoke Control by Mechanical Exhaust or Natural Venting 1853
Telegram EDUFIRE_IREDUFIRE.IR
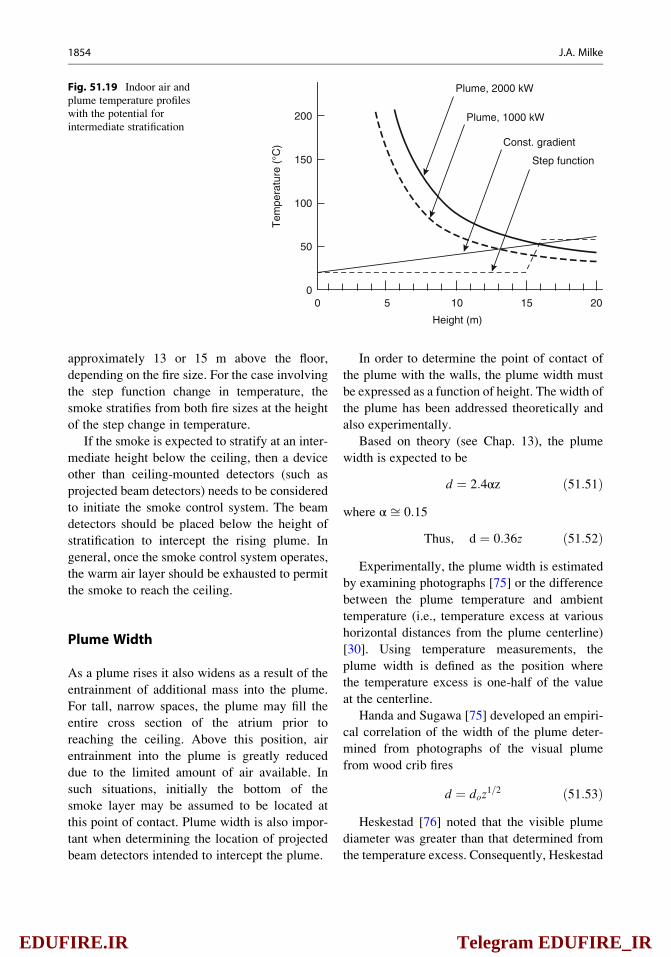
approximately 13 or 15 m above the floor,
depending on the fire size. For the case involving
the step function change in temperature, the
smoke stratifies from both fire sizes at the height
of the step change in temperature.
If the smoke is expected to stratify at an inter-
mediate height below the ceiling, then a device
other than ceiling-mounted detectors (such as
projected beam detectors) needs to be considered
to initiate the smoke control system. The beam
detectors should be placed below the height of
stratification to intercept the rising plume. In
general, once the smoke control system operates,
the warm air layer should be exhausted to permit
the smoke to reach the ceiling.
Plume Width
As a plume rises it also widens as a result of the
entrainment of additional mass into the plume.
For tall, narrow spaces, the plume may fill the
entire cross section of the atrium prior to
reaching the ceiling. Above this position, air
entrainment into the plume is greatly reduced
due to the limited amount of air available. In
such situations, initially the bottom of the
smoke layer may be assumed to be located at
this point of contact. Plume width is also impor-
tant when determining the location of projected
beam detectors intended to intercept the plume.
In order to determine the point of contact of
the plume with the walls, the plume width must
be expressed as a function of height. The width of
the plume has been addressed theoretically and
also experimentally.
Based on theory (see Chap. 13), the plume
width is expected to be
d ¼ 2:4αz ð51:51Þwhere α ffi 0:15
Thus, d ¼ 0:36z ð51:52ÞExperimentally, the plume width is estimated
by examining photographs [75] or the difference
between the plume temperature and ambient
temperature (i.e., temperature excess at various
horizontal distances from the plume centerline)
[30]. Using temperature measurements, the
plume width is defined as the position where
the temperature excess is one-half of the value
at the centerline.
Handa and Sugawa [75] developed an empiri-
cal correlation of the width of the plume deter-
mined from photographs of the visual plume
from wood crib fires
d ¼ doz1=2 ð51:53Þ
Heskestad [76] noted that the visible plume
diameter was greater than that determined from
the temperature excess. Consequently, Heskestad
Const. gradient
Step function
Plume, 1000 kW
Plume, 2000 kW
0
50
100
150
200
0 5 10 15 20
Height (m)
Tem
pera
ture
(°C
)
Fig. 51.19 Indoor air and
plume temperature profiles
with the potential for
intermediate stratification
1854 J.A. Milke
Telegram EDUFIRE_IREDUFIRE.IR

estimated the visible plume diameter to be twice
that determined by the excess temperature
approach. Thus, the plume diameter is estimated
as
d ¼ 0:48Tc
To
� �1=2
z ð51:54Þ
As indicated in Equation 51.35, the plume
centerline temperature decreases appreciably
with increasing height. Thus, for tall spaces, the
plume centerline temperature may be close to
ambient. For example, at a height of 30 m with
a fire size of 5000 kW and To of 293 K, Tc is
312 K. In this case (Tc/To)1/2 in Equation 51.51 is
only 1.03. Because of the rapid decline in Tc with
increasing height, for engineering purposes (Tc/To)
1/2 can be approximated as being 1.0. Conse-
quently, in many cases the total plume diameter
may be approximated by considering the plume
diameter to be approximately one-half of the
height.
Considering the variety of analyses for plume
width, the plume width is estimated to be
25–50 % of the height above the top of the fuel
package, with the 36 % proportion from theory
being near the middle of the range.
Plugholing
Plugholing occurs when the exhaust capacity at a
single point is sufficiently large to draw air from
the lower layer in addition to smoke. As such,
less smoke is removed by the exhaust fans and a
deeper layer results. Because a simple method to
estimate the proportion of air drawn in from
below the smoke layer by the fans is unavailable,
an elementary method of estimating the smoke
layer depth during plugholing is not available. As
such, simple calculations can only be performed
to assess the occurrence of plugholing, not the
effect.
The original research on plugholing was done
for natural vents. Recently, Lougheed and
Hadjisophocleous demonstrated that the
plugholing analysis for natural vents was also
applicable to mechanical venting [77]. In order
to avoid plugholing, the maximum exhaust
capacity at an extract point is:
_Vmax ¼ 4:16γd5=2ΔTTo
� �1=2
ð51:55Þ
Where γ is a factor relating to the location of
the vent. If the vent is in the middle of the space,
γ ¼ 1 [1].
Results of applying Equation 51.56 are
provided in Fig. 51.20 for a range of temperature
rise values of the smoke. Where venting
capacities greater than the maximum limit are
needed to achieve smoke management
objectives, multiple extract points need to be
provided to avoid plugholing.
Assuming an axisymmetric plume, m can be
replaced using Equation 51.20, and the smoke
0
20
40
60
80
100
120
140
0 1 2 3 4 5
Smoke Layer Depth
Temp rise=10°C
Temp rise=20°C
Temp rise=50°C
Temp rise=100°C
Exh
aust
Rat
e (m
3 /s)
Fig. 51.20 Effect of
smoke-layer depth and
temperature rise on
maximum exhaust capacity
51 Smoke Control by Mechanical Exhaust or Natural Venting 1855
Telegram EDUFIRE_IREDUFIRE.IR

layer temperature can be replaced using Equa-
tion 51.34 (assuming adiabatic conditions) to
express the minimum smoke layer depth in
terms of the heat release rate and clear height as
indicated in Fig. 51.21. For a single extract point,
the minimum smoke layer depth is slightly less
than 40 % of the clear height.
Makeup Air Supply
The makeup air supplied to the atrium should be
• Uncontaminated
• Introduced below the smoke layer
• Introduced at a slow velocity
• Supplied at a rate less than the required
exhaust rate
Air that is not contaminated by smoke can be
provided by locating intakes for the makeup air
remote from the smoke exhaust discharge,
preventing smoke feedback. To address the
potential for smoke being introduced into the
makeup air supply, a smoke detector should be
provided to shut down the makeup air supply
system. Selection of a smoke detector for this
application should consider the operating
conditions, range of temperatures, and installa-
tion within a duct.
All makeup air should be provided below the
smoke layer interface. Any makeup air provided
above the smoke layer interface merely adds
mass to the smoke layer, which must be added
to the required capacity of the smoke exhaust to
prevent an increase in the smoke layer depth. If
introduced near the smoke layer interface, the
makeup air may increase the amount of mixing
of clean air with the smoke to further add to the
smoke layer.
Makeup air should be provided at a slow
velocity so that the plume, fire, and smoke
layer are not adversely affected. Makeup air
supplied at a rapid velocity near the plume
may deflect the plume to enhance the entrain-
ment rate, thereby increasing the rate of smoke
production. In addition, the burning rate of the
fire may be increased by makeup air provided at
an excessive velocity. Because the entrainment
process induces an air velocity of approxi-
mately 1 m/s, the maximum makeup air veloc-
ity in the vicinity of the plume is often
recommended to be 1 m/s. Because of the dif-
fusion of air once past the diffuser, the makeup
air velocity at the diffuser may be greater than
1 m/s.
Finally, the mass rate of makeup air supplied
must be less than that being exhausted. Failure to
follow this guideline may lead to the atrium
being pressurized relative to the communicating
spaces. Being at a positive pressure, smoke
movement will be forced through any unpro-
tected openings in physical barriers into the com-
municating spaces.
0.0
0.1
0.2
0.3
0.4
0.5
0.6
0.7
0 20 40 60 80 100
d/z
2.5 MW
5 MW
10 MW
Exhaust Rate (m3/s)
Fig. 51.21 Ratio of
smoke-layer depth to clear
height for single exhaust
point
1856 J.A. Milke
Telegram EDUFIRE_IREDUFIRE.IR

Limited Fuel
In some cases smoke management objectives
may be fulfilled without a dedicated smoke con-
trol system due to the intrinsic qualities of the
atrium. The intrinsic qualities of the atrium
include parameters, such as the composition and
quantity of fuel and geometry of the atrium. As
an example, a limited amount of fuel may be
present that is unable to sustain a fire for a suffi-
cient period of time to create conditions beyond
the allowable limits. The amount of fuel con-
sumed during the time period of interest depends
on whether the fire is steady or unsteady. In the
case of a steady fire, the fuel mass consumed in a
given period of time is determined as
_m f ¼_Qt
Hcð51:56Þ
Alternatively, for an unsteady, t2 profile fire,
the fuel mass consumed during a given period of
time is given as
_m f ¼ 333t3
Hct2gð51:57Þ
When analyzing the inherent ability of the
atrium to fulfill the smoke management design
goals, the time period should relate either to the
performance of a fire protection system or to the
development of smoke layer conditions in excess
of acceptable levels. For example, in life
safety–oriented designs, the time period may be
either that required for evacuation, or for untena-
ble conditions to be generated, whichever is less.
Opposed Airflow
Opposed airflow refers to systems where airflow
is provided in a direction opposite to the unde-
sired direction of smoke movement. Opposed
airflow may be used in lieu of physical barriers
to prevent smoke spread from one space to
another (i.e., between the communicating space
and the atrium). Opposed airflow limits smoke
flow by countering the momentum of the smoke
attempting to enter the adjoining space. A mini-
mum airflow velocity at all points of the opening
must be provided in order to prevent smoke
migration through the opening. Empirical
correlations to estimate the minimum average
velocity for the entire opening are available,
based on limited experimental data [78]. The
calculated average velocity is greater than the
actual minimum velocity required at an opening
to oppose smoke propagation to insure that the
minimum critical velocity is achieved at all
points, considering the effects of turbulence
caused by the edges and corners of the opening.
The minimum average velocity to oppose
smoke originating in the communicating space
is evaluated using Equation 51.59.
ve ¼ 0:64
ffiffiffiffiffiffiffiffiffiffiffiffiffiffiffiffiffiffiffiffiffiffiffiffiffigH Ts � Toð Þ
Ts
sð51:58Þ
Alternatively, if the smoke at the opening is
part of a rising plume that is rising along the side
of the atrium wall, then Equation 51.60 is
applicable.
ve ¼ 0:057_Q
z
!1=3
ð51:59Þ
The opposed airflow velocity should not
exceed 1 m/s. Above that limit, the airflow veloc-
ity may deflect the plume away from the wall,
making more plume surface area available for
entrainment. The increased area for entrainment
will enhance the smoke generation rate. Conse-
quently, the problem of propagation to the com-
municating space may be solved by an excessive
average velocity; however, other problems may
be created by the increased smoke production
rate and a possible increase in the depth of the
smoke layer in the atrium. The volumetric capac-
ity of the mechanical equipment required to
deliver the necessary velocity for opposed air-
flow can be approximated as
Voa ¼ Aove ð51:60Þ
If several openings are protected with the
opposed airflow approach using the same
51 Smoke Control by Mechanical Exhaust or Natural Venting 1857
Telegram EDUFIRE_IREDUFIRE.IR

mechanical equipment, the cross-sectional area
should be the sum of the areas for all of the
openings. The opposed airflow technique may
be infeasible due to the substantial amount of
airflow capacity required to protect numerous
openings having a large total area.
Where opposed airflow is utilized, the impact
of the volume of air being introduced into the
space with the fire must be assessed. For exam-
ple, if the airflow is directed into the atrium and
smoke exhaust equipment is also provided to
maintain a constant position of the smoke layer
interface in the atrium, then all of the additional
air used for opposed airflow must also be
exhausted. The additional air can be accounted
for by increasing the required mass rate of
exhaust in the atrium by the amount used for
the opposed airflow. The additional air being
exhausted will also affect the qualities of the
smoke layer within the atrium (see
Equations 51.34, 51.38, and 51.40). The smoke
layer temperature, Ts(K), can be determined
using Equation 51.61, based on an analysis
included elsewhere [3].
T ¼ 293
þ 0:0018þ 0:072 _Q�2=3
c z5=3 þ 712Ao
ffiffiffiffiffiffiffiffiffiffiffiffiffiffiffiH T�293ð Þ
p_QcT
3=2
�1
ð51:61Þ
Equation 51.61 must be applied iteratively to
determine the resulting smoke layer temperature.
In cases with large clear heights, the temperature
of the air used for the opposed airflow strategy
will be virtually equal to the temperature of the
smoke layer to permit the addition of volumetric
rates of air rather than mass rates.
Alternatively, if airflow is directed from the
atrium into a communicating space, the commu-
nicating space must also be exhausted, otherwise
the communicating space will become positively
pressurized.
Example 8 Considering the atrium from Exam-
ple 5. There are five 5-m-wide � 2.5-m-high
openings to the communicating space. The bot-
tom of the openings is 30 m above the floor of the
atrium. Considering a 5000 kW fire in the center
of the floor of the atrium, determine the
following:
1. Minimum airflow velocity required for
opposed airflow
2. Volumetric rate of air supply for opposed
airflow
3. Capacity of the exhaust fans in the atrium to
maintain the smoke layer interface at an ele-
vation 25 m above floor level and also to
accommodate the additional air from the
opposed airflow approach
Solution The minimum opposed airflow veloc-
ity can be determined using Equation 51.60.
However, the temperature of the smoke layer,
T, is unknown. Thus, Equation 51.61 must be
applied first. Solving iteratively, T is approxi-
mately 305 K. The minimum airflow velocity is
0.20 m/s. The volumetric supply capacity for the
opposed airflow strategy for all five openings is
12.5 m3/s. The associated mass flow rate is
15.0 kg/s.
Without the opposed airflow, the mass rate of
smoke exhaust required to maintain the smoke
layer interface height in the atrium at a height of
25 m is determined using Equation 51.27 to be
236 kg/s. Thus, the combined mass exhaust rate
necessary is 251 kg/s. This mass flow rate
corresponds to a volumetric rate of 209 m3/s.
As a practical issue, this exhaust rate should
be compared to that required to keep the smoke
layer interface above the top of the openings
(i.e., 32.5 m above floor level). Based on
Equations 51.27 and 51.29, the required volu-
metric exhaust rate is 362 kg/s. Thus, in this
situation, the combined exhaust rate with the
opposed airflow strategy is less than that
associated with the strategy to keep the smoke
layer interface above the opening.
Nomenclature
A Cross-sectional area of the atrium (m2)
Ao Cross-sectional area of opening (m2)
b Distance from the store opening to the
balcony edge (m)
1858 J.A. Milke
Telegram EDUFIRE_IREDUFIRE.IR
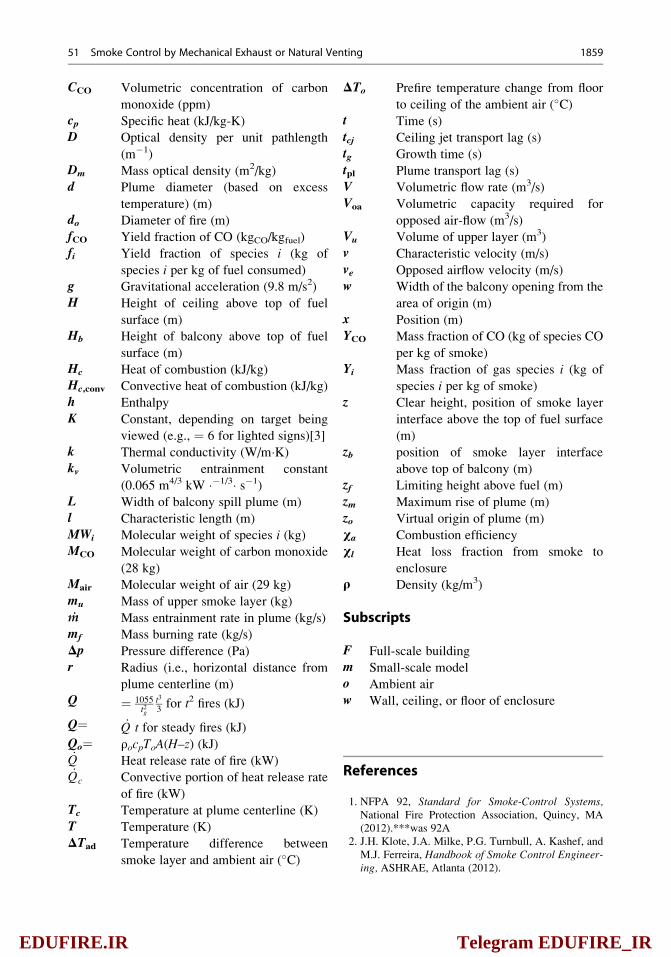
CCO Volumetric concentration of carbon
monoxide (ppm)
cp Specific heat (kJ/kg-K)
D Optical density per unit pathlength
(m�1)
Dm Mass optical density (m2/kg)
d Plume diameter (based on excess
temperature) (m)
do Diameter of fire (m)
fCO Yield fraction of CO (kgCO/kgfuel)
fi Yield fraction of species i (kg of
species i per kg of fuel consumed)
g Gravitational acceleration (9.8 m/s2)
H Height of ceiling above top of fuel
surface (m)
Hb Height of balcony above top of fuel
surface (m)
Hc Heat of combustion (kJ/kg)
Hc,conv Convective heat of combustion (kJ/kg)
h Enthalpy
K Constant, depending on target being
viewed (e.g., ¼ 6 for lighted signs)[3]
k Thermal conductivity (W/m�K)kv Volumetric entrainment constant
(0.065 m4/3 kW ��1/3� s�1)
L Width of balcony spill plume (m)
l Characteristic length (m)
MWi Molecular weight of species i (kg)MCO Molecular weight of carbon monoxide
(28 kg)
Mair Molecular weight of air (29 kg)
mu Mass of upper smoke layer (kg)
m Mass entrainment rate in plume (kg/s)
mf Mass burning rate (kg/s)
Δp Pressure difference (Pa)
r Radius (i.e., horizontal distance from
plume centerline (m)
Q ¼ 1055t2g
t3
3for t2 fires (kJ)
Q¼ _Q t for steady fires (kJ)
Qo¼ ρocpToA(H–z) (kJ)_Q Heat release rate of fire (kW)_Qc Convective portion of heat release rate
of fire (kW)
Tc Temperature at plume centerline (K)
T Temperature (K)
ΔTad Temperature difference between
smoke layer and ambient air (�C)
ΔTo Prefire temperature change from floor
to ceiling of the ambient air (�C)t Time (s)
tcj Ceiling jet transport lag (s)
tg Growth time (s)
tpl Plume transport lag (s)
V Volumetric flow rate (m3/s)
Voa Volumetric capacity required for
opposed air-flow (m3/s)
Vu Volume of upper layer (m3)
v Characteristic velocity (m/s)
ve Opposed airflow velocity (m/s)
w Width of the balcony opening from the
area of origin (m)
x Position (m)
YCO Mass fraction of CO (kg of species CO
per kg of smoke)
Yi Mass fraction of gas species i (kg of
species i per kg of smoke)
z Clear height, position of smoke layer
interface above the top of fuel surface
(m)
zb position of smoke layer interface
above top of balcony (m)
zf Limiting height above fuel (m)
zm Maximum rise of plume (m)
zo Virtual origin of plume (m)
χa Combustion efficiency
χl Heat loss fraction from smoke to
enclosure
ρ Density (kg/m3)
Subscripts
F Full-scale building
m Small-scale model
o Ambient air
w Wall, ceiling, or floor of enclosure
References
1. NFPA 92, Standard for Smoke-Control Systems,National Fire Protection Association, Quincy, MA
(2012).***was 92A
2. J.H. Klote, J.A. Milke, P.G. Turnbull, A. Kashef, and
M.J. Ferreira, Handbook of Smoke Control Engineer-ing, ASHRAE, Atlanta (2012).
51 Smoke Control by Mechanical Exhaust or Natural Venting 1859
Telegram EDUFIRE_IREDUFIRE.IR
3. T. Jin, “Irritating Effects of Fire Smoke on Visibility,”
Fire Science and Technology, 5, 1 (1985).
4. J. Morehart, “Sprinklers in the NIH Atrium: How Did
They React During the Fire Last May?” Fire Journal,83, pp. 56–57 (1989).
5. NFPA 75, Standard for the Protection of InformationTechnology Equipment, National Fire Protection
Association, Quincy, MA (2009).
6. R.D. Peacock and E. Braun, “Fire Tests of Amtrak
Passenger Rail Vehicle Interiors,” NBS TechnicalNote 1193, National Bureau of Standards,
Gaithersburg, MD (1984).
7. V. Babrauskas, “A Laboratory Flammability Test for
Institutional Mattresses,” Fire Journal, 72, 93,
pp. 35–40 (1981).
8. S.W. Harpe, T.E. Waterman, and W.S. Christian,
“Detector Sensitivity and Siting Requirements for
Dwellings, Phase 2, Part 2 ‘Indiana Dunes Tests,’”
Report No. PB-263882, National Bureau of
Standards, Gaithersburg, MD (1977).
9. Milke, J.A., Hugue, D.E., Hoskins, B.L., and Carroll
J.P., “Tenability Analyses in Performance-Based
Design,” Fire Protection Engineering, 28, 50-56
(2005),
10. J.L. Bryan, “Damageability of Buildings, Contents,
and Personnel from Exposure to Fire,” Fire SafetyJournal, 11, pp. 15–32 (1984).
11. J.A. Milke and J.H. Klote, “Smoke Management in
Large Spaces in Buildings,” Building Control Com-
mission of Victoria and The Broken Hill Proprietary
Company Limited, Melbourne, Australia (1998).
12. J.G. Quintiere, “Scaling Applications in Fire
Research,” Fire Safety Journal, 15, pp. 3–29 (1989).
13. F.W. Mowrer, “Lag Times Associated with Fire
Detection and Suppression,” Fire Technology,26, 3, pp. 244–265 (1990).
14. J.S. Newman, “Principles for Fire Detection,” FireTechnology, 24, 2, pp. 116–127 (1988).
15. J.A. Milke, “Smoke Management for Covered Malls
and Atria,” Fire Technology, 26, 3, pp. 223–243
(1990).
16. G. Heskestad and M.A. Delichatsios, “Environments
of Fire Detectors—Phase I: Effect of Fire Size, Ceil-
ing Height, and Materials,” Vol. I—Measurements(NBS-GCR-77-86), Vol. II—Analysis (NBS-GCR-77-95), National Bureau of Standards, Gaithersburg, MD
(1977).
17. B.R. Morton, Sir Geoffrey Taylor, and J.S. Turner,
“Turbulent Gravitational Convection from
Maintained and Instantaneous Sources,” in
Proceedings of Royal Society A, 234, pp. 1–23,
London (1956).
18. G. Mulholland, T. Handa, O. Sugawa, and
H. Yamamoto, “Smoke Filling in an Enclosure,”
Paper 81-HT-8, The American Society of Mechanical
Engineers, New York (1981).
19. L.Y. Cooper, M. Harkleroad, J. Quintiere, and
W. Rinkinen, “An Experimental Study of Upper Hot
Layer Stratification in Full-Scale Multiroom Fire
Scenarios,” Paper 81-HT-9, The American Society
of Mechanical Engineers, New York (1981).
20. G. Heskestad, Letter to the Editor, Fire Technology,27, 2, pp. 174–185 (1991).
21. T. Yamana and T. Tanaka, “Smoke Control in Large
Spaces (Part 2—Smoke Control Experiments in a
Large-Scale Space),” Fire Science and Technology,5, 1, pp. 41–54 (1985).
22. G.D. Lougheed, Personal Communication, National
Research Council of Canada (Mar. 20, 1991).
23. S.P. Nowlen, “Enclosure Environment Characteriza-
tion Testing for the Baseline Validation of Computer
Fire Simulation Codes,” NUREG/ CR-4681, SAND86–1296, Sandia National Laboratories, Albuquerque,NM (1987).
24. J.A. Sharry, “An Atrium Fire,” Fire Journal, 67, 6, pp.39–41 (1973).
25. J. Lathrop, “Atrium Fire Proves Difficult to Venti-
late,” Fire Journal, 73, 1, pp. 30–31 (1979).
26. D.M. McGrail, “Denver’s Polo Club Condo Fire:
Atrium Turns High-Rise Chimney,” Fire Engineer-ing, pp. 67–74 (1992).
27. G. Heskestad, “Engineering Relations for Fire
Plumes,” SFPE TR 82-8, Society of Fire Protection
Engineers, Boston (1982).
28. C. Beyler, “Fire Plumes and Ceiling Jets,” Fire SafetyJournal, 11, pp. 53–76 (1986).
29. R.L. Alpert and E.J. Ward, “Evaluation of
Unsprinklered Fire Hazards,” Fire Safety Journal,7, pp. 127–143 (1984).
30. F.W. Mowrer and B. Williamson, “Estimating Room
Temperatures from Fires alongWalls and in Corners,”
Fire Technology, 23, 2, pp. 133–145 (1987).
31. Harrison, R., “Entrainment of Air Into Thermal Spill
Plumes,” PhD Dissertation, University of Canterbury,
New Zealand (2009).
32. Lougheed, GD., McCartney, C.J. and Gibbs, E., “Bal-
cony Spill Plumes Final Report, RP-1247, ASHRAE,
Atlanta (2007).
33. Lim, J.M.K., “Numerical Modeling of Balcony Spill
Plumes Using Fire Dynamics Simulator (FDS),” MS
Thesis, University of Maryland (2010).
34. M. Law, “A Note on Smoke Plumes from Fires in
Multi-Level Shopping Malls,” Fire Safety Journal,10, pp. 197–202 (1986).
35. H.P. Morgan and N.R. Marshall, “Smoke Control
Measures in a Covered Two-Story Shopping Mall
Having Balconies and Pedestrian Walkways,” BRECP11/79, Fire Research Station, Borehamwood,
England (1979).
36. W.D. Walton, “ASET-B: A Room Fire Program for
Personal Computers,” NBSIR 85-3144, National
Bureau of Standards, Gaithersburg, MD (1985).
37. Lincolne Scott Australia Pty Ltd., JupitersCasino—Report on Atrium Smoke Tests, Lincolne
Scott Australia Pty Ltd., Toowong, Australia
(1986).
1860 J.A. Milke
Telegram EDUFIRE_IREDUFIRE.IR

38. G.O. Hansell and H.P. Morgan, “Smoke Control in
Atrium Buildings Using Depressurization,” PD 66/88,Fire Research Station, Borehamwood, UK (1988).
39. R.A. Waters, “Stansted Terminal Building and Early
Atrium Studies,” Journal of Fire Protection Engi-neering, 1, 2, pp. 63–76 (1989).
40. G. Heskestad, “Similarity Relations for the Initial
Convective Flow Generated by Fire,” Paper 72-WA/HT-17, American Society of Mechanical Engineers,
New York (1972).
41. T. Jin, “Visibility Through Fire Smoke (Part 2),”
Report of the Fire Research Institute of Japan, Nos.33, 31, Tokyo (1971).
42. J.G. Quintiere, “An Assessment of Correlations
Between Laboratory and Full-Scale Experiments for
the FAA Aircraft Fire Safety Program, Part 1:
Smoke,” NBSIR 82-2508, National Bureau of
Standards, Gaithersburg, MD (1982).
43. G. Heskestad, “Hazard Evaluation,” submitted to
NFPA Task Group on Smoke Management of Atria,
Covered Malls, and Large Spaces, unpublished man-
uscript (1988).
44. G.D. Lougheed, “Probability of Occurrence and
Expected Size of Shielded Fires in Sprinklered Build-
ing; Phase 2, Full-Scale Fire Tests,” National
Research Council of Canada, Ottawa (1997).
45. NFPA 204, Standard for Smoke and Heat Venting,National Fore Protection Association, Quincy, MA
(2012).
46. C.L. Beyler and L.Y. Cooper, “Interaction of
Sprinklers with Smoke Vents,” Fire Technology,37, 1, pp. 9–36 (2001).
47. M.L. Bullen, “The Effect of a Sprinkler on the Stabil-
ity of a Smoke Layer beneath a Ceiling,” FireResearch Note No. 1016, Department of the Environ-
ment and Fire Officers’ Committee, Joint Fire
Research Organization, Watford, UK (1974).
48. M.L. Bullen, “The Effect of a Sprinkler on the Stabil-
ity of a Smoke Layer beneath a Ceiling,” Fire Tech-nology, 13, 1, pp. 21–34 (1977).
49. R.L. Alpert, “Calculated Interaction of Sprays with
Large-Scale Buoyant Flows,” Journal of Heat Trans-fer, 106, pp. 310–317 (1984).
50. A.J. Gardiner, First Report on the Interaction betweenSprinkler Sprays and the Thermally Buoyant Layers ofGases from Fires, South Bank Polytechnic, London
(1985).
51. A.J. Gardiner, Second Report on the Interactionbetween Sprinkler Sprays and the Thermally BuoyantLayers of Gases from Fires, South Bank Polytechnic,
London (1986).
52. A.J. Gardiner, Third Report on the Interactionbetween Sprinkler Sprays and the Thermally BuoyantLayers of Gases from Fires, South Bank Polytechnic,
London (1988).
53. A.J. Gardiner, Fourth Report on the Interactionbetween Sprinkler Sprays and the Thermally BuoyantLayers of Gases from Fires, South Bank Polytechnic,
London (1988).
54. L.A. Jackman, Second Report on the Interactionbetween Sprinkler Sprays and the Thermally BuoyantLayers of Gases from Fires, South Bank Polytechnic,
London (1990).
55. L.A. Jackman, Third Report on the Interactionbetween Sprinkler Sprays and the Thermally BuoyantLayers of Gases from Fires, South Bank Polytechnic,
London (1991).
56. L.A. Jackman, P.F. Nolan, A.J. Gardiner, and
H.P. Morgan, Mathematical Model of the Interac-tion of Sprinkler Spray Drops with Fire Gases,South Bank University, London, Swedish Fire
Research Board, and National Institute of Standards
and Technology (NIST), Fire Suppression Research,
First International Conference on Fire Suppression
Research, May 5–8, 1992, Stockholm, Sweden,
(V. Sjolin, D.D. Evans, and N.H. Jason, eds.),
pp. 209–227 (1992).
57. G. Heskestad, “Sprinkler/Hot Layer Interaction,”
NIST-GCR-91-590, National Institute of Standards
and Technology (NIST), Gaithersburg, MD (1991).
58. L.Y. Cooper, “The Interaction of an Isolated Sprinkler
Spray and a Two-Layer Compartment Fire Environ-
ment. Phenomena and Model Simulations,” FireSafety Journal, 25, 2, pp. 89–107 (1995).
59. L.Y. Cooper, “The Interaction of an Isolated Sprinkler
Spray and a Two-Layer Compartment Fire Environ-
ment,” International Journal Heat and Mass Transfer,38, 4, pp. 679–690 (1995).
60. P.L. Hinkley, “Work by the Fire Research Station on
the Control of Smoke in Covered Shopping Centers,”
BRE Paper CP 83/75, Building Research Establish-
ment (BRE), Fire Research Station (FRS), London
(1975).
61. A.J.M. Heselden, “The Interaction of Sprinklers and
Fire Venting,” Fire Surveyor, 11, 5, pp. 13–28 (1982).62. G. Holmstedt, “Sprinkler and Fire Venting Interac-
tion,” Literature Survey on Modeling Approaches andExperiments Available and Recommendations forFurther Studies, 92178 AR GH/AB, Swedish Fire
Research Board, Stockholm, Sweden (1992).
63. B. Persson and H. Ingason, “Modeling of Interaction
between Sprinklers and Fire Vents,” SP Report1996:32, Swedish National Testing and Research
Institute, Sweden (1996).
64. L.Y. Cooper, “LAVENTS—A Computer Program to
Model the Interaction between Sprinklers, Smoke
Layers, and Smoke Vents,” presented at the Interna-tional Conference on Smoke Ventilation andSprinklers—Aspects of Combined Use, Fire Research
Station, Borehamwood, UK (1992).
65. K.B. McGrattan, A. Hamins, D.W. Stroup, “Sprinkler,
Smoke and Heat Vent, Draft Curtain Interaction—
Large-Scale Experiments and Model Development,”
NISTIR 6196, National Institute of Standards and
Technology (NIST), Gaithersburg, MD (1998).
66. K.B. McGrattan, H.R. Baum, and R.G. Rehm, “Large
Eddy Simulations of Smoke Movement,” Fire SafetyJournal, 30, pp. 161–178 (1998).
51 Smoke Control by Mechanical Exhaust or Natural Venting 1861
Telegram EDUFIRE_IREDUFIRE.IR

67. K.B. McGrattan and D.W. Stroup, “Sprinkler, Vent
and Draft Curtain Interaction: Experiment and Com-
puter Simulation,” National Institute of Standards andTechnology (NIST), Gaithersburg, MD (1997).
68. K.B. McGrattan and D.W. Stroup, “Large Eddy
Simulations of Sprinkler, Vent and Draft Curtain Per-
formance,” Fire Suppression and Detection ResearchApplication, Symposium, Research and Practice:Bridging the Gap, Proceedings, National Fire Protec-tion Research Foundation, February 12–14, 1997,
Orlando, FL, pp. 59–68 (1997).
69. H. Touvinen, “Validation of Ceiling Jet Flows in a
Large Corridor with Vents Using the CFD Code JAS-
MINE,” Fire Technology, 32, 1, pp. 25–49 (1996).
70. H. Touvinen and L.Y. Cooper, “Validation of Ceiling
Jet Flows in a Large Corridor with Vents Using the
CFD Code JASMINE: Errata and Additional
Remarks,”Fire Technology, 33, 2, pp. 183–186 (1997).71. R.N. Mawhinney, E.R. Galea, and M.K. Patel, “Euler-
Lagrange Modeling of Fire/Sprinkler Interactions,”
Fire Safety Science—Proceedings of the Fifth Inter-national Symposium, International Association of FireSafety Science (IAFSS), Australia, p. 1336 (1997).
72. W.K. Chow and A.C. Tang, “Experimental Studies on
Sprinkler Water Spray Smoke Layer Interaction,” Jour-nalofAppliedFire Science,4, 3, pp.171–184 (1994–95).
73. G. Heskestad, “Note on Maximum Rise of Fire
Plumes in Temperature-Stratified Ambients,” FireSafety Journal, 15, pp. 271–276 (1989).
74. M. Dillon, “Acceptance Testing and Techniques,”
presented at The Roundtable on Fire Safety in Atri-ums—Are the Codes Meeting the Challenge?,Washington, DC (1988).
75. T. Handa and O. Sugawa, “Flow Behavior of Plume
from Growing Fire Source in High Ceiling Enclo-
sure,” Journal of Fire and Flammability, 12, 1, pp.31–50 (1981).
76. G. Heskestad, “Fire Plume Entrainment and
Related Problems in Venting of Fire and Smoke
from Large Open Spaces,” submitted to NFPA Task
Group on Smoke Management of Atria, Covered
Malls, and Large Spaces, unpublished manuscript
(1987).
77. G.D. Lougheed and G.V. Hadjisophocleous, “Investi-
gation of Atrium Exhaust Effectiveness,” ASHRAETransactions, 103, 2 (1997).
78. G. Heskestad, “Inflow of Air Required at Wall and
Ceiling Apertures to Prevent Escape of Fire Smoke,”
FMRC J. I. OQ4E4.RU, Factory Mutual Research
Corporation, Norwood, MA (1989).
James A. Milke is a professor and chair in the Depart-
ment of Fire Protection Engineering at the University of
Maryland. His recent research activities have included
assessing the performance of smoke control systems in
fires.
1862 J.A. Milke
Telegram EDUFIRE_IREDUFIRE.IR

)رایگان( تهویه وتخلیه دود، های اطفا، اعلام حریق انیمیشن –ویدیو
مشاهده هر یک از ویدیوهای زیر کافیست بر روی عنوان آن آموزش کلیک نمایید تا به صفحه برای
ویدیو و آموزش آن عنوان هدایت شوید.
انیمیشن ویدیو
اطفا حریق آبی •
o سیستم اطفا لوله خشک اسپرینکلر
o تر اسپرینکلر سیستم اطفا لوله
o عملگر سیستم اطفا پیش
o سیستم اطفا واترمیست
o سیستم اطفا سیلابی
سیستم اطفا فوم •
تجهیزات هشدار دهنده - تجهیزات اطفا حریق •
اسپرینکلر -تجهیزات اطفا حریق •
سیستم اطفا آشپزخانه صنعتی •
سیستم اطفا آیروسل •
سیستم اطفا دستی •
سیستم اطفا گازی •
o سیستم اطفاFM200 , NOVEC, Inert Gas (IG)
o 2سیستم اطفاCO
سیستم تهویه و تخلیه دود •
سیستم اعلام حریق •
o پذیر آدرس
o متعارف

آموزش استاندارد
NFPA 13آموزش استاندارد •
NFPA 14آموزش استاندارد •
NFPA 20آموزش استاندارد •
افزار آموزش نرم
o اتواسپرینک
o پایروسیم
o فایندر پث
دانلود استاندارد
o ترجمه استانداردNFPA 30,14,13,10
o تمامی استانداردهایNFPA & FM
o رد ترجمه استانداNFPA 1037
محصولات
o به زبان فارسی برای اولین بار در ایران 2019و 2013اتواسپرینک
o به زبان فارسی برای اولین بار در ایران 2019آلارم کد
o اطفا حریق آبی
o نت )ماژول اسپرینکلر( پایپ
o کانتم
o اعلان حریق
های حضوری دوره
o آموزش اتواسپرینک
o کدآموزش آلارم
o آموزش پایروسیم
o آموزش کانتم + اگزاست
o پمپ + بازدید از کارگاهآموزش اطفا آبی+
o آموزش اطفا گازی
o آموزش اطفا فوم
o آموزش مبحث سوم مقررات ملی
o آموزش اعلام حریقF&G
o پذیر آموزش اعلام حریق آدرس
o آموزش اعلام حریق متعارف
o نشانی )برق، مکانیک، عمران، معماری( دوره آمادگی آزمون آتش