Embed Size (px)
Citation preview
2Q15 REVIEW & 2015 OUTLOOK
4350 Brownsboro Rd.Suite 210Louisville, KY 40207
p (502) 259-2500 f (502) 259-1501 www.cbandt.com
Please Note: Statements made in this commentary are drawn from Commonwealth’s internal research and with the permission of outside research providers. The content of this commentary is copyrighted and reproduction or distribution of this material is prohibited and all rights
are reserved. Nothing herein should be construed as a prediction or guarantee of either investment results or account specific actions. Copyright Commonwealth Bank & Trust Company, Bloomberg, Standard and Poors, and Litman/Gregory.
NOT FDIC INSURED / NOT BANK GUARANTEED / MAY LOSE VALUE / NOT GUARANTEED BY ANY GOVERNMENT AGENCY / NOT A BANK DEPOSIT
SUMMER2015
Page 1
2Q15 REVIEW Despite an improving jobs climate, the U.S. market fell 3.5% in the last week of June as uncertainty grew over the EU-Greece bailout standoff as well as a margin-fueled crash in China’s fledgling Shanghai market. Nevertheless, the S&P 500 remained in positive territory at quarter end, buoyed by dividends. The quarter as well as the year have been volatile as expected, swinging between 2050 and 2130 since early February – a 4% swing. Adding insult to injury for investment managers and their clients, the high part of this range was hit mid-month in each of April, May and June, while returning to the lows of the range in the last week of the month, when returns are calculated and statements are printed. The market recovered some by the end of July with a 3.32% YTD return. After the late August market correction, we are lowering our year-end target to 2100 from 2175 for the S&P 500, which applies a lower multiple of 15.5x our 2017 EPS estimates of $135, which is 7.5% lower than the consensus EPS estimate.
Global Stock Markets: The U.S. market eked out its 10th straight quarter of positive returns, returning a slightly positive 0.28% in 2Q15. Markets were on a healthy recovery trajectory for the U.S., Europe and China at the onset of the second quarter and oil prices rebounded through peak driving season. Markets reversed at the end of June, however, as a result of the EU-Greece standoff and Chinese market developments. In July, markets made an unsteady recovery as it appears Greece and the EU will reach an agreement. In August, the S&P 500 fell 12.5% from its May high on fears that slowing China and EM growth will push the U.S. and Europe into recession. Investors mostly view the Shanghai market correction as rookie regulatory mistakes as the communist government permitted significant margin lending, which fueled the bubble over the last 12 months. Now the Chinese government is trying to soften the landing via trading restrictions and forced security purchases by financial institutions. It is unclear how the correction will impact China’s economy and its consumers. We do not believe the decision to devalue the Yuan (RMB) was a direct result of the Shanghai stock market turmoil.
Interest Rates: The bond market was down during the quarter (-1.68%) and the Barclay’s Aggregate Bond Index ended the first half of 2015 down -0.09%. The bond market also exhibited range-bound volatility as the 10-year treasury yield fluctuated between 1.90% and 2.50% for most of the year. Improving U.S. economic and jobs data as well as improving EU data ushered in higher rates. Forward rate contracts imply that the Fed will raise Fed Funds rates by 0.25% in September and at every other Fed meeting. Market consensus implies the 10-year treasury will reach 3.00% in the last half of 2016.
2015 ECONOMIC OUTLOOKU.S. - Economists and analysts have started to lower 2015 U.S. GDP estimates from 3.0 to between 2.0% and 3.0%. It appears the Fed may be at the lower end of these estimates. Jobs continue to grow and wages are beginning to show signs of growth. The consumer is starting to increase spending most likely spurred by lower oil prices. Nevertheless, the 20% rise in the dollar against other currencies since last summer (5.8% YTD) is hurting exports. Capex estimates, the “Investment” component of GDP, are also being cut by companies, reducing GDP forecasts. “Investment” is
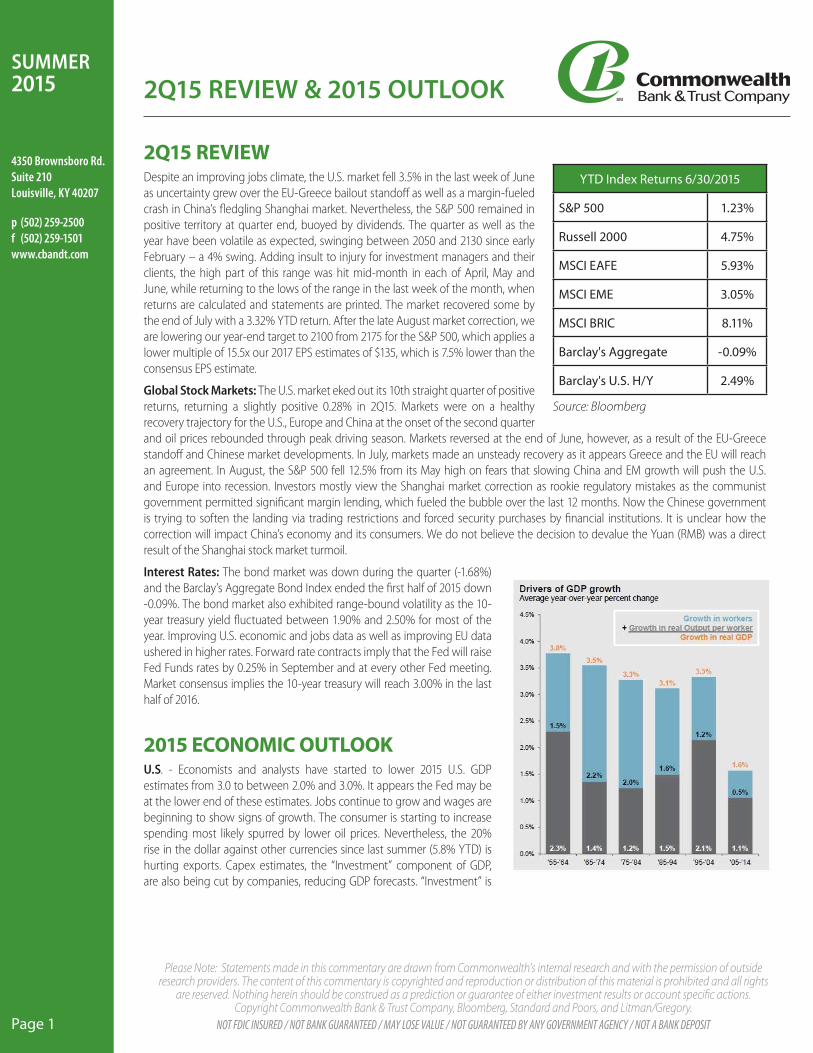
YTD Index Returns 6/30/2015
S&P 500 1.23%
Russell 2000 4.75%
MSCI EAFE 5.93%
MSCI EME 3.05%
MSCI BRIC 8.11%
Barclay's Aggregate -0.09%
Barclay's U.S. H/Y 2.49%
Source: Bloomberg

2Q15 REVIEW & 2015 OUTLOOK
4350 Brownsboro Rd.Suite 210Louisville, KY 40207
p (502) 259-2500 f (502) 259-1501 www.cbandt.com
Please Note: Statements made in this commentary are drawn from Commonwealth’s internal research and with the permission of outside research providers. The content of this commentary is copyrighted and reproduction or distribution of this material is prohibited and all rights
are reserved. Nothing herein should be construed as a prediction or guarantee of either investment results or account specific actions. Copyright Commonwealth Bank & Trust Company, Bloomberg, Standard and Poors, and Litman/Gregory.
NOT FDIC INSURED / NOT BANK GUARANTEED / MAY LOSE VALUE / NOT GUARANTEED BY ANY GOVERNMENT AGENCY / NOT A BANK DEPOSIT
SUMMER2015
Page 2
needed in order to increase the productivity of workers (“Growth in real Output per worker”). If you look at the chart to the right, there has not been a material growth in workers over the last 10 years as the workforce was reduced via the “Great Recession”. Economic forecaster, BCA, believes U.S. work force growth will return to 1.0% and productivity will return to 1.5% over the next decade. This should result in a 2.0%-2.5% GDP growth rate, not the 3.0%-3.5% growth rate experienced during the baby boom decades. The good news for these demographics data is that the slower growth likely holds inflation closer to 2%. In the meantime, dollar strength and lower oil are proving deflationary. The Fed estimates that the strong dollar is having an impact on the economy equal to a 1.0%-1.5% rate hike. In our opinion, the economic drag on the economy from the higher dollar lowers the probability of a Fed rate hike to 40% for September. If economic data improves as we expect in 3Q15 and 4Q15 we think the probability rises to 50% for the December meeting and 10% next year.
China & Emerging Markets – China remains a wild card for forecasters, not so much to determine China’s output, but to determine China’s impact on global GDP growth. We believe that China represents incremental or marginal demand for U.S. and European companies. In past years, Chinese demand could make the difference between a good earnings year and a mediocre one for U.S and European companies. China is a top trading partner for many Asian economies as well as several South American economies such as Brazil and Venezuela. Forecasters know that China’s economy is declining, but government manipulation of economic data makes it difficult to determine the depth of the decline. China’s official growth rate fell to 7% in 2Q15 as growth continues to slow (Chart 2). Just a reminder as China develops that even 6% growth in China adds more to global GDP than 14% growth did in 2007. China’s GDP has more than doubled, so the actual impact should be kept in perspective. The Chinese government is implementing stimulus measures including interest rate cuts, lower bank reserve requirements and a devaluation of the Yuan - the first time in 40 years. It is also adding another 300 billion RMB infrastructure investment to another 1 trillion RMB infrastructure investment committed earlier this year. These expenditures should add 2%-3% to GDP over the next three years.
It is not unreasonable for the business media to treat China’s economy as a blackbox. Missing from media coverage are the key drivers of the slowdown: lower government spending (Chart 3) and slowing credit growth (Chart 4). The trillions of government spending on roads, airports, dams and energy plants over the next three years is a large number, but it is a fraction of what was spent between 2009 and 2011. Lending is still growing in China, but at a 5% slower rate despite the banking stimuli. Therefore, exports, consumer spending and business output need to meet or exceed a core 5% growth rate for China to maintain the 7% GDP growth target for the next three years. Investors are rightly concerned that a “soft” landing may be a lot “harder” for the People’s Party to pilot.

2Q15 REVIEW & 2015 OUTLOOK
4350 Brownsboro Rd.Suite 210Louisville, KY 40207
p (502) 259-2500 f (502) 259-1501 www.cbandt.com
Please Note: Statements made in this commentary are drawn from Commonwealth’s internal research and with the permission of outside research providers. The content of this commentary is copyrighted and reproduction or distribution of this material is prohibited and all rights
are reserved. Nothing herein should be construed as a prediction or guarantee of either investment results or account specific actions. Copyright Commonwealth Bank & Trust Company, Bloomberg, Standard and Poors, and Litman/Gregory.
NOT FDIC INSURED / NOT BANK GUARANTEED / MAY LOSE VALUE / NOT GUARANTEED BY ANY GOVERNMENT AGENCY / NOT A BANK DEPOSIT
SUMMER2015
Page 3
2015 MARKET OUTLOOKKey tenets of our 2015 thesis remain intact, but we have lowered our 2015 outlook for U.S. stocks and bonds to the middle or lower part of our initial ranges: S&P 500 4%-6% (6.0%-8.0% from the August 27 S&P 500 close of 1987) vs. 5%-8%; and Barclays Bond Aggregate 2%-3% vs. 2%-4%. The impact of weather on earnings as well as the impact from a weaker Euro resulting from protracted Greek negotiations have hurt market sentiment and have kept earnings forecasts from rebounding. We think the strong dollar remains the more important story for the S&P 500. Now that China has decided to allow the Yuan to be devalued a little (2% stated; 5% expected), the move will likely have iterative effects on currencies of China’s Emerging Market trading partners. Emerging markets have grown to account for 50% of Global GDP. As their currencies fall, the U.S., Europe and China’s goods become more expensive and earnings fall for the companies that make up their market indices. Forecasters claim international revenues make up 50% of S&P 500 revenues and impact 30% of the 500 companies in the index. The weak Euro makes it difficult for multi-national companies to raise earnings guidance. As we exit 2Q15 earnings season, we hope estimates have bottomed, but as oil begins to fall again, we are concerned that expectations could be lowered further for energy stocks offsetting upward revisions in other industry sectors.
Over the long term, stock market index returns reflect the underlying fundamentals (e.g., earnings) of the companies comprising the index, while bond market returns reflect the fundamentals of the economy (e.g., GDP). Most of the variables that impact earnings and the economy are interconnected and we think four variables will make the biggest impact on markets for the rest of the year as the same variables had in the first half of the year.
1. Dollar vs. Euro Exchange Rate: The EU-Greece stand-off will take some time to resolve and, depending on the latest solution, may be revisited for a fourth bailout 6-12 months after the current band-aid under negotiation. In the meantime, the EU is delivering mostly positive fundamental results as a result of QE and a weak Euro.
• Hurts: Corporate earnings and the U.S. stock market. A cheaper Euro makes dollar denominated goods more expensive. U.S. multi-nationals lose sales to substitute local goods, which lowers earnings.
• Helps: European exporters and European economies.• Interconnected Collateral Damage:
– U.S. oil and gas companies export less.– China’s currency is tied to the dollar, making Chinese exports more expensive slowing its economy.
• Market Play: Look for strong dollar, weak Euro plays.– Seek: Companies with mostly domestic sales, which favors small and midcap companies. European multinationals.– Avoid: Commodities and multi-nationals that generate most of their sales outside the U.S., such as semiconductors.

2Q15 REVIEW & 2015 OUTLOOK
4350 Brownsboro Rd.Suite 210Louisville, KY 40207
p (502) 259-2500 f (502) 259-1501 www.cbandt.com
Please Note: Statements made in this commentary are drawn from Commonwealth’s internal research and with the permission of outside research providers. The content of this commentary is copyrighted and reproduction or distribution of this material is prohibited and all rights
are reserved. Nothing herein should be construed as a prediction or guarantee of either investment results or account specific actions. Copyright Commonwealth Bank & Trust Company, Bloomberg, Standard and Poors, and Litman/Gregory.
NOT FDIC INSURED / NOT BANK GUARANTEED / MAY LOSE VALUE / NOT GUARANTEED BY ANY GOVERNMENT AGENCY / NOT A BANK DEPOSIT
SUMMER2015
Page 4
2. Fed Rate Increase: The much anticipated increase in the Fed Funds rates seems more likely at the Fed’s December meeting than the September meeting. Interest rate futures imply three to four separate 0.25% rate increases between now and the end of 2016. The 10-year Treasury forecasts imply it will end 2016 around 3.00% from its current rate of ~2.25%.
• Hurts: Corporate earnings and the bond market as interest rates rise for corporate borrowers and prices of bonds fall. The impact on corporate earnings will likely affect few early on, because most floating securities have “LIBOR Floors”, where the rates cannot fall below 2% or 3%, even though the LIBOR rate may be 0.30%. It may be a few years before LIBOR rates rise above these minimum floors. A rising rate environment hurts issuers of debt to finance acquisitions or share buybacks as well as serial debt issuers, such as telecom, utility and REIT companies, to finance large capital projects.
• Helps: Financial institutions generating most of their earnings from net interest margin spreads (banks, brokerages, etc.). Older and retired consumers dependent on bond and CD yields for income.
• Interconnected Collateral Damage:– Raising rates further strengthens the dollar.– Countries and regions, such as Japan and the EU, undergoing quantitative easing as higher U.S. rates pressure their
rates higher.– Emerging market countries with dollar denominated debt are forced to make higher payments. The level of dollar
denominated debt is now a fraction of the level in the 1990’s, when dollar strength caused currency crises.• Market Play: Most managers are advocating duration strategies for fixed income portfolios.
– Seek: Companies that benefit from a rising rate environment (financial institutions).– Avoid: Utilities, REITs and other interest rate sensitive companies.
3. Oil Prices: We believe oil supply is likely to remain higher than demand for some time. Four developments are pushing oil supply expectations higher: 1) U.S. oil producers have used technology to lower extraction and production costs keeping more supply on the market. 2). A nuclear standstill deal will enable Iran to boost production by 25%. 3) Oil production in Iraq, Libya and other countries emerging from conflicts is coming back on line. 4) Saudi Arabia announced a firm commitment to maintain its market share of global output as others increase production. Improving demand in the U.S. and EU, on the other hand, is not expected to offset slowing demand from China and Emerging Markets. One expert believes that Saudi Arabia only has two years of financial wherewithal to afford pumping at its current record levels.
• Hurts: Immediately reduces corporate earnings of oil companies and industrial companies that manufacture products for the oil patch. As a result, the S&P energy sector has fallen 22% over the last 12 months. Securities of countries dependent on oil revenues (Russia, Brazil, etc.).
• Helps: Eventually helps industries and companies where oil is a large input cost (airlines, trucking, etc.).
• Interconnected Collateral Damage:– Lower oil tends to be deflationary counteracting monetary policy efforts of countries trying to “reflate” their economies.– Reduces demand of EU goods from oil producing countries slowing EU recovery.
• Market Play: We hope that oil prices will rebound from the $45/bbl. level for a third time since oil started falling late last summer. The next technical support level is $40/bbl. followed by $30/bbl. if oil breaks through $40.– Seek: Companies that benefit from low oil (airlines, trucking).– Avoid: Energy companies with significant debt as well as service companies that take longer time to recover from a drop
in prices and require oil production to come back on line.

2Q15 REVIEW & 2015 OUTLOOK
4350 Brownsboro Rd.Suite 210Louisville, KY 40207
p (502) 259-2500 f (502) 259-1501 www.cbandt.com
Please Note: Statements made in this commentary are drawn from Commonwealth’s internal research and with the permission of outside research providers. The content of this commentary is copyrighted and reproduction or distribution of this material is prohibited and all rights
are reserved. Nothing herein should be construed as a prediction or guarantee of either investment results or account specific actions. Copyright Commonwealth Bank & Trust Company, Bloomberg, Standard and Poors, and Litman/Gregory.
NOT FDIC INSURED / NOT BANK GUARANTEED / MAY LOSE VALUE / NOT GUARANTEED BY ANY GOVERNMENT AGENCY / NOT A BANK DEPOSIT
SUMMER2015
Page 5
4. The Shanghai Stock Market and its Impact on the Chinese Economy. At its peak on June 12, China’s Shanghai exchange reached 5,178, a 152% increase over the prior year. Prior to this 12-month market boom, the index was range-bound at the 2,000 level from 2011-2014. The closed, “Chinese Investors Only” Shanhai market has been making headlines since mid-June as it fell 43% to a low near 2900. The government intervened to stabilize the market by forcing banks and brokerages to make purchases and halt trading in certain stocks. The bubble started like a of lot bubbles with the help of leverage. Brokerages started touting purchasing with 20% margins (5x leverage) last year. As the market doubled, brokerages started increasing margin requirements escalating to 60%-80% in May, precipitating the fall. Neophyte Chinese investors learned about margin calls the hard way in June and July. It has been reported that individual Chinese investors make up 80% of the holders of the stocks in the index, but these holders represent less than 10% of the Chinese population, but may represent as much as 15% of household assets according to some accounts or make up a negligible amount of household assets according to other sources. The big concern is how much the unknown loss of wealth in markets impact consumer spending and, in turn, China’s GDP growth. It is difficult to determine. First, the market is still up over 50%, since last year. Second, the Chinese consumer makes up 36% of GDP vs. 65%-70% in developed countries. The market is beginning to digest the likelihood there will be a much smaller than expected impact on the Chinese consumer or the economy vs. the magnitude of the correction. As pointed out above, we believe slower credit growth and the impact of a currency pegged to the dollar (albeit pegged at a lower level now) are likely to offset spending stimulus. Therefore, we think Chinese fundamentals will mostly disappoint and estimates for its economy and its companies will decline below current levels.
• Hurts:– Chinese investors, but damage to the consumer and economy unknown and likely much lower than the impact of a
crash of developed country’s exchange.– The credibility of the Chinese government’s ability to implement monetary and fiscal policy to move to an open,
consumer-based economy over the coming decades.– We have a greater concern about the stability of the Chinese
banking system, which recently bailed out local governments from overspending on infrastructure and real estate development, and is now bailing out the markets. China will need a healthy lending market to maintain its GDP growth.
• Helps: Chalk one up for free-market democracies. We have never thought the Yuan will replace the U.S. Dollar as the world’s reserve currency, but recent policy blunders and reticence to allow its currency to float, make it unlikely for the IMF to include the Yuan in the basket of reserve currencies that set exchange rates any time soon.
• Interconnected Collateral Damage: More negative pressure on the slowing Chinese economy reduces its demand for oil as well as goods from the U.S., EU and Emerging Markets countries.
2Q15 REVIEW & 2015 OUTLOOK
4350 Brownsboro Rd.Suite 210Louisville, KY 40207
p (502) 259-2500 f (502) 259-1501 www.cbandt.com
Please Note: Statements made in this commentary are drawn from Commonwealth’s internal research and with the permission of outside research providers. The content of this commentary is copyrighted and reproduction or distribution of this material is prohibited and all rights
are reserved. Nothing herein should be construed as a prediction or guarantee of either investment results or account specific actions. Copyright Commonwealth Bank & Trust Company, Bloomberg, Standard and Poors, and Litman/Gregory.
NOT FDIC INSURED / NOT BANK GUARANTEED / MAY LOSE VALUE / NOT GUARANTEED BY ANY GOVERNMENT AGENCY / NOT A BANK DEPOSIT
SUMMER2015
Page 6
• Market Play: We will likely never know the broad effects this market correction will have on the Chinese economy. Just as China is known for knock-offs and counterfeit goods, its government is known for counterfeit or falsified economic data.– Seek: U.S. companies with mostly domestic sales (small and mid-cap stocks).– Avoid: Chinese ADRs with domestic revenues. U.S. companies where most of their revenue growth is dependent on China.
Commodity-based Emerging Markets countries.
Market Valuations & Returns• Fixed Income/Interest Rates: If there is no action taken by the Fed in 2015, we think the 10-year treasury could finish the year
in its current 2.00%-2.25% range. In this scenario, the Barclay’s Aggregate Bond index may generate similar returns to 2014 returns, which were bolstered by long-term bonds within the index. Our fixed income investments remain short to intermediate in duration. A rate increase of 0.25% to 0.50% can cause a 30-year bond to lose 5% to 10% in value. We think trying to move in and out of long term bonds ahead of an eventual Fed rate hike is like trying to out run a train – not worth the risk. When action is taken, the Fed has signaled it would make smaller and gradual increases, which is being read as a 0.25% increase every other Fed meeting by most.
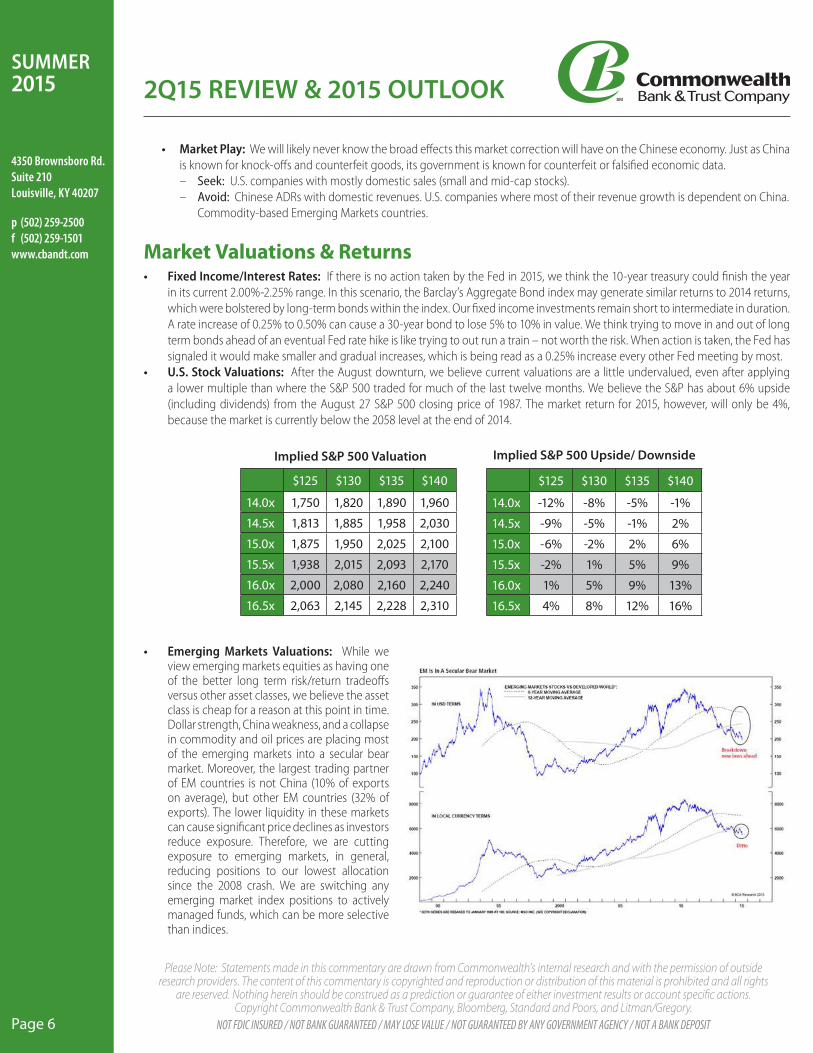
• U.S. Stock Valuations: After the August downturn, we believe current valuations are a little undervalued, even after applying a lower multiple than where the S&P 500 traded for much of the last twelve months. We believe the S&P has about 6% upside (including dividends) from the August 27 S&P 500 closing price of 1987. The market return for 2015, however, will only be 4%, because the market is currently below the 2058 level at the end of 2014.
• Emerging Markets Valuations: While we view emerging markets equities as having one of the better long term risk/return tradeoffs versus other asset classes, we believe the asset class is cheap for a reason at this point in time. Dollar strength, China weakness, and a collapse in commodity and oil prices are placing most of the emerging markets into a secular bear market. Moreover, the largest trading partner of EM countries is not China (10% of exports on average), but other EM countries (32% of exports). The lower liquidity in these markets can cause significant price declines as investors reduce exposure. Therefore, we are cutting exposure to emerging markets, in general, reducing positions to our lowest allocation since the 2008 crash. We are switching any emerging market index positions to actively managed funds, which can be more selective than indices.
$125 $130 $135 $140
14.0x 1,750 1,820 1,890 1,960
14.5x 1,813 1,885 1,958 2,030
15.0x 1,875 1,950 2,025 2,100
15.5x 1,938 2,015 2,093 2,170
16.0x 2,000 2,080 2,160 2,240
16.5x 2,063 2,145 2,228 2,310
Implied S&P 500 Valuation
$125 $130 $135 $140
14.0x -12% -8% -5% -1%
14.5x -9% -5% -1% 2%
15.0x -6% -2% 2% 6%
15.5x -2% 1% 5% 9%
16.0x 1% 5% 9% 13%
16.5x 4% 8% 12% 16%
Implied S&P 500 Upside/ Downside