Embed Size (px)
Citation preview
SMIP09 Seminar Proceedings
39
SEISMIC ANALYSIS OF BUILDINGS TO RECORDED MOTIONS: MODELING AND SOFTWARE CHALLENGES
Rakesh K. Goel1 and Karen Nishimoto2
Department of Civil and Environmental Engineering
California Polytechnic State University, San Luis Obispo
Abstract
This investigation focused on developing an improved understanding of challenges associated with computation of nonlinear response of three-dimensional building to recorded ground motions, and if the inertial base shear is an accurate indicator of the true base shear. For this purpose, three-dimensional models of two buildings – one reinforced-concrete building and one steel building – are developed in OpenSees and Perform3D. The analysis of these models included pushover analysis for lateral force distribution proportional to the first mode in each of the two principle directions, and RHA to compute response for 30 ground motions recorded during past earthquakes. It was found that modeling assumptions as well as different software may lead to significantly different pushover curves: concentrated plasticity model leads to lower strength, early initiation of yielding, and post yielding strength loss in pushover curves compared to spread plasticity model, strength loss model for beams/columns leads to significant post yielding strength loss in the pushover curve, and differences in solution schemes and convergence criteria available in different software programs also affect the pushover curves. It was also found that there prediction of median peak response from different software can differ from 10% to 40%. Finally, the median inertial base shear exceeds the true base shear by 10% to 20% with the value exceeding by as much as 50% for individual earthquake and even a small time delay between different recording channels may lead to significant error in the inertial base shear. Therefore, inertial base shear should be used with caution as an estimate of the true base shear.
Introduction
Buildings are typically instrumented with accelerometers at selected number of floors: low-rise buildings (1 to 3 stories) at every floor; and mid- and high-rise buildings at base, roof, and a few intermediate floors. The raw (or uncorrected) acceleration recorded during earthquakes from these accelerometers are processed using well-established procedures to obtain base-line corrected (or processed) accelerations, velocity, and displacements. The processed floor accelerations and displacements may be used to estimate additional engineering demand parameters such as inter-story drift ratio defined as the differential displacement between two adjacent floors divided by the story height, and base shear defined as the summation of floor inertial forces above the base; the floor inertial forces are computed as the product of floor acceleration and floor mass. The engineering demand parameters thus estimated from recorded
1 Professor and Chair 2 Former Graduate Student

SMIP09 Seminar Proceedings
40
motions of buildings may be compared to those computed from various analytical procedures, such as nonlinear static pushover and nonlinear response history analysis, to evaluate the accuracy of these analytical procedures. These parameters may also be compared with limiting values to check if the building suffered damage during an earthquake and may need detailed inspection/evaluation.
For buildings with limited number of instrumented floors, estimation of various engineering demand parameters requires that the motions at non-instrumented floors be interpolated from those available at the instrumented floors. Typically, a piece-wise cubic polynomial interpolation procedure is used for conventional buildings (Naeim, 1997; De la Llera and Chopra, 1998; Goel, 2005, 2007; Limongelli, 2003) and a combination of cubic-linear interpolation is recommended for base-isolated buildings (Naeim, et al., 2004). It is generally believed that such interpolation procedures provide reasonable estimates of motions at non-instrumented floors (Naeim, 1997; Naeim et al., 2004; De la Llera and Chopra, 1998).
A recent study by Goel (2008) re-examined the adequacy of the traditionally used cubic polynomial interpolation procedure. It was found that results from the cubic polynomial interpolation procedure are sensitive to location of instrumented floors. While the cubic polynomial interpolation procedure may provide good estimate of floor displacements with proper selection of instrumented floors, this procedure may not accurately predict inter-story drifts and floor accelerations. This finding was also confirmed by Bernal (2007).
Another investigation by Goel and Chadwell (2007) compared the base shear estimated from motions interpolated using the traditional cubic polynomial interpolation procedure with the base shear capacity estimated from nonlinear pushover analysis of buildings. It was found that the base shear estimated from interpolated motions significantly exceeded the base shear capacity for several buildings. However, post earthquake inspection of these buildings did not reveal significant damage. This indicates that such base shear estimates may be questionable and possibly unreliable.
The preceding discussion clearly indicates that there is a need to comprehensively re-evaluate existing interpolation procedures. In particular, it is desirable to establish the level of accuracy that can be achieved in estimates of floor displacements and floor accelerations. Furthermore, it is necessary to examine if the base shear estimated from inertial floor forces is an accurate estimate of the “true” base shear which is defined as summation of shear forces in all columns at the base.
The aforementioned evaluation of interpolation procedures requires that “true” motions of buildings be available at each floor level. Since buildings are rarely instrumented at all floors and thus complete set of recorded responses that is needed for evaluating interpolation procedures is not readily available, response of buildings due to recorded ground motions computed from response history analysis (RHA) offers a viable alternative to recorded motions. However, there are several modeling and software challenges in implementing the RHA for buildings that are expected to be deformed beyond the linear elastic limit during strong ground shaking.
SMIP09 Seminar Proceedings
41
The primary objective of this investigation is to develop an improved understanding of challenges associated with computation of nonlinear response of three-dimensional building to recorded ground motions. Another objective is to evaluate the accuracy of the inertial base shear as an indicator of the true base shear using the results from the RHA. For this purpose, nonlinear response – floor displacements, floor accelerations, and base shear – of two buildings – 20-Story Reinforced Concrete Hotel in North Hollywood, and 19-Story Steel Office Building in Los Angeles – were computed from RHA for 30 ground motions recorded during past earthquakes using two different computer program – OpenSees and Perform3D. Also computed were the pushover curves of these buildings included pushover analysis for lateral force distribution proportional to the first mode in each of the two principal directions. First, challenges associated in computation of nonlinear response from the two computer programs are documented. Next differences in peak responses from the two programs are examined for effects of modeling and software. Finally, peak values of inertial and true base shears are compared to understand if the inertial base shear can provide accurate estimate of true base shear.
Selected Buildings and Ground Motions
Two buildings – 20-Story Hotel in North Hollywood and 19 Story Office Building in Los Angeles – are selected in this investigation (Table 1). This buildings are selected as representative of instrumented mid- to high-rise reinforced-concrete and steel buildings in California.
Table 1. Five concrete buildings selected. Buildings name CSMIP
Station Number of
Stories Structural System
Los Angeles – 19-Story Office Building
24643 19/4 Steel Concentric Brace Frame (Transverse) and Moment Frames (Longitudinal)
North Hollywood – 20-Story Hotel
24464 20/1 Concrete Moment Frames
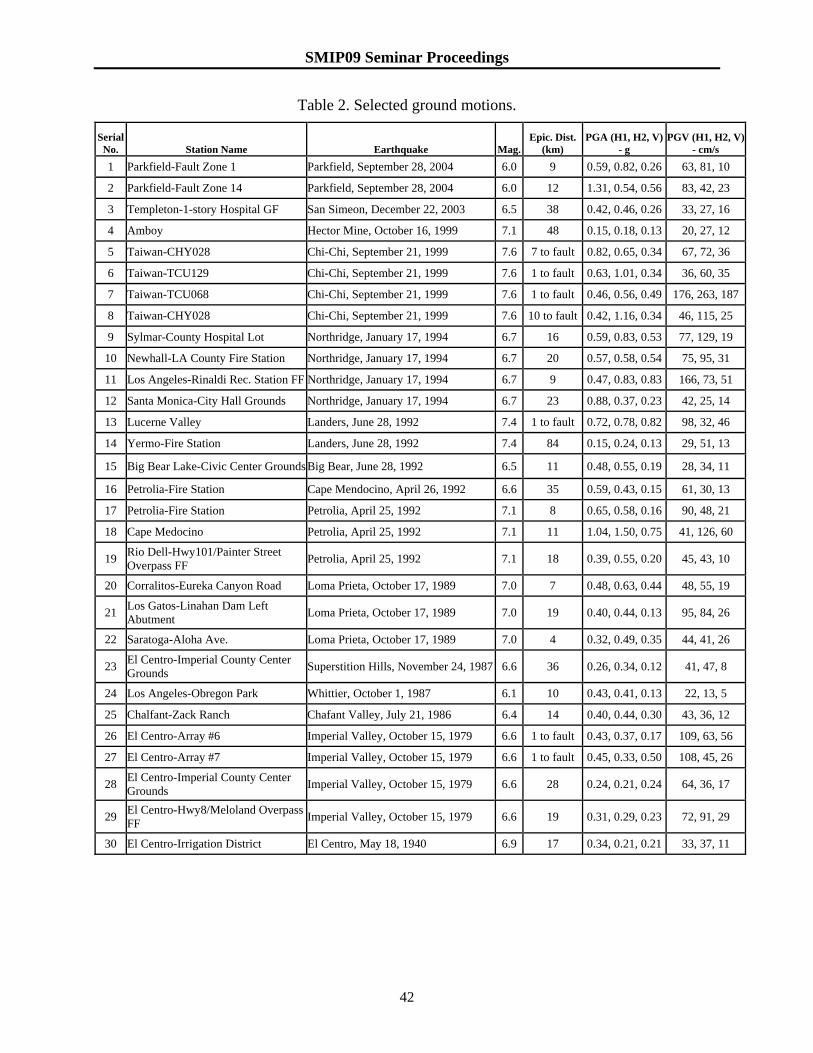
A suite of 30 ground motions have been selected in this investigation (Table 2). Each ground motion consists of a pair of two horizontal components of ground motion recorded during indicated earthquake. These earthquakes are selected for a wide range of parameters: proximity to the fault, magnitude, peak ground accelerations and velocities. These ground motions were not selected to match any design spectrum but to ensure that they will induce different levels of inelastic behavior in the selected buildings: selected buildings are expected to remain within the linear elastic range for a few earthquakes where as these buildings are expected to be deformed well into the nonlinear range, and possibly collapse, during other earthquakes.
Analytical Models
The three-dimensional analytical models of the selected buildings were developed using the structural analysis software Open System for Earthquakes Engineering Simulation (OpenSees) (McKenna and Fenves, 2001) and Perform3D (CSI, 2006). Following is a description of the modeling procedures.
SMIP09 Seminar Proceedings
42
Table 2. Selected ground motions.
Serial No. Station Name Earthquake Mag.
Epic. Dist. (km)
PGA (H1, H2, V) - g
PGV (H1, H2, V) - cm/s
1 Parkfield-Fault Zone 1 Parkfield, September 28, 2004 6.0 9 0.59, 0.82, 0.26 63, 81, 10
2 Parkfield-Fault Zone 14 Parkfield, September 28, 2004 6.0 12 1.31, 0.54, 0.56 83, 42, 23
3 Templeton-1-story Hospital GF San Simeon, December 22, 2003 6.5 38 0.42, 0.46, 0.26 33, 27, 16
4 Amboy Hector Mine, October 16, 1999 7.1 48 0.15, 0.18, 0.13 20, 27, 12
5 Taiwan-CHY028 Chi-Chi, September 21, 1999 7.6 7 to fault 0.82, 0.65, 0.34 67, 72, 36
6 Taiwan-TCU129 Chi-Chi, September 21, 1999 7.6 1 to fault 0.63, 1.01, 0.34 36, 60, 35
7 Taiwan-TCU068 Chi-Chi, September 21, 1999 7.6 1 to fault 0.46, 0.56, 0.49 176, 263, 187
8 Taiwan-CHY028 Chi-Chi, September 21, 1999 7.6 10 to fault 0.42, 1.16, 0.34 46, 115, 25
9 Sylmar-County Hospital Lot Northridge, January 17, 1994 6.7 16 0.59, 0.83, 0.53 77, 129, 19
10 Newhall-LA County Fire Station Northridge, January 17, 1994 6.7 20 0.57, 0.58, 0.54 75, 95, 31
11 Los Angeles-Rinaldi Rec. Station FF Northridge, January 17, 1994 6.7 9 0.47, 0.83, 0.83 166, 73, 51
12 Santa Monica-City Hall Grounds Northridge, January 17, 1994 6.7 23 0.88, 0.37, 0.23 42, 25, 14
13 Lucerne Valley Landers, June 28, 1992 7.4 1 to fault 0.72, 0.78, 0.82 98, 32, 46
14 Yermo-Fire Station Landers, June 28, 1992 7.4 84 0.15, 0.24, 0.13 29, 51, 13
15 Big Bear Lake-Civic Center Grounds Big Bear, June 28, 1992 6.5 11 0.48, 0.55, 0.19 28, 34, 11
16 Petrolia-Fire Station Cape Mendocino, April 26, 1992 6.6 35 0.59, 0.43, 0.15 61, 30, 13
17 Petrolia-Fire Station Petrolia, April 25, 1992 7.1 8 0.65, 0.58, 0.16 90, 48, 21
18 Cape Medocino Petrolia, April 25, 1992 7.1 11 1.04, 1.50, 0.75 41, 126, 60
19 Rio Dell-Hwy101/Painter Street Overpass FF Petrolia, April 25, 1992 7.1 18 0.39, 0.55, 0.20 45, 43, 10
20 Corralitos-Eureka Canyon Road Loma Prieta, October 17, 1989 7.0 7 0.48, 0.63, 0.44 48, 55, 19
21 Los Gatos-Linahan Dam Left Abutment Loma Prieta, October 17, 1989 7.0 19 0.40, 0.44, 0.13 95, 84, 26
22 Saratoga-Aloha Ave. Loma Prieta, October 17, 1989 7.0 4 0.32, 0.49, 0.35 44, 41, 26
23 El Centro-Imperial County Center Grounds Superstition Hills, November 24, 1987 6.6 36 0.26, 0.34, 0.12 41, 47, 8
24 Los Angeles-Obregon Park Whittier, October 1, 1987 6.1 10 0.43, 0.41, 0.13 22, 13, 5
25 Chalfant-Zack Ranch Chafant Valley, July 21, 1986 6.4 14 0.40, 0.44, 0.30 43, 36, 12
26 El Centro-Array #6 Imperial Valley, October 15, 1979 6.6 1 to fault 0.43, 0.37, 0.17 109, 63, 56
27 El Centro-Array #7 Imperial Valley, October 15, 1979 6.6 1 to fault 0.45, 0.33, 0.50 108, 45, 26
28 El Centro-Imperial County Center Grounds Imperial Valley, October 15, 1979 6.6 28 0.24, 0.21, 0.24 64, 36, 17
29 El Centro-Hwy8/Meloland Overpass FF Imperial Valley, October 15, 1979 6.6 19 0.31, 0.29, 0.23 72, 91, 29
30 El Centro-Irrigation District El Centro, May 18, 1940 6.9 17 0.34, 0.21, 0.21 33, 37, 11
SMIP09 Seminar Proceedings
43
20-Story Hotel in North Hollywood
OpenSees Model The beams and columns for the North Hollywood Hotel were modeled with
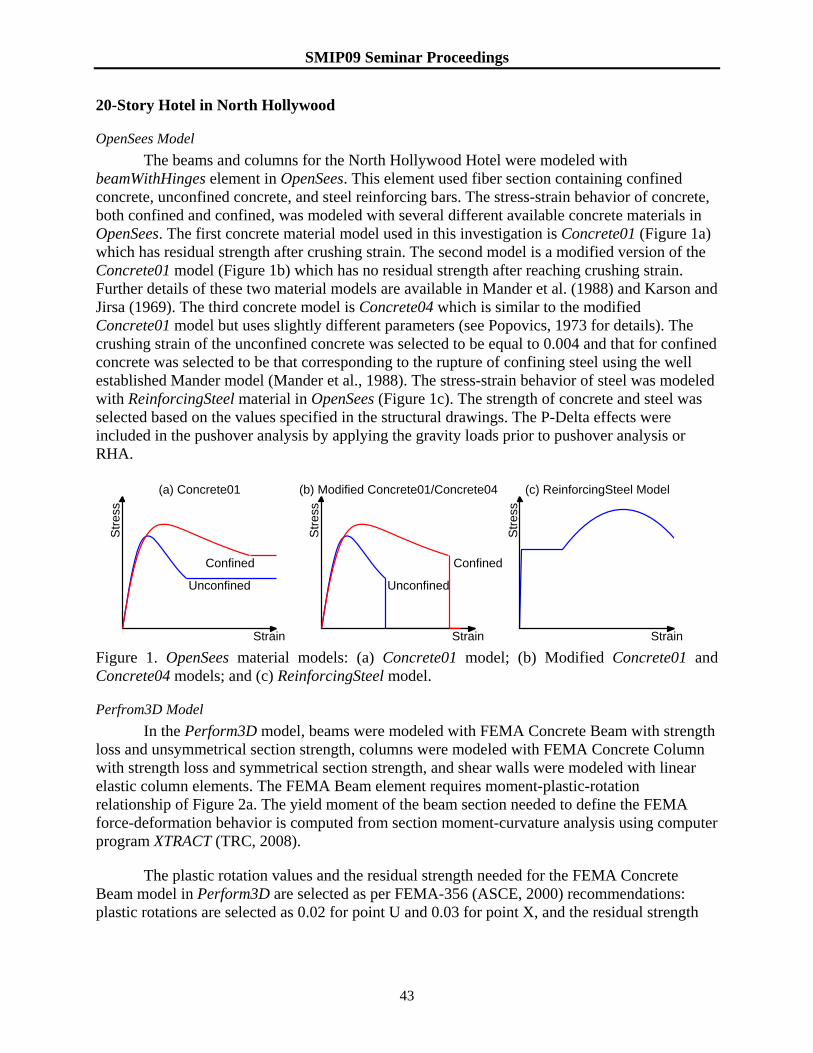
beamWithHinges element in OpenSees. This element used fiber section containing confined concrete, unconfined concrete, and steel reinforcing bars. The stress-strain behavior of concrete, both confined and confined, was modeled with several different available concrete materials in OpenSees. The first concrete material model used in this investigation is Concrete01 (Figure 1a) which has residual strength after crushing strain. The second model is a modified version of the Concrete01 model (Figure 1b) which has no residual strength after reaching crushing strain. Further details of these two material models are available in Mander et al. (1988) and Karson and Jirsa (1969). The third concrete model is Concrete04 which is similar to the modified Concrete01 model but uses slightly different parameters (see Popovics, 1973 for details). The crushing strain of the unconfined concrete was selected to be equal to 0.004 and that for confined concrete was selected to be that corresponding to the rupture of confining steel using the well established Mander model (Mander et al., 1988). The stress-strain behavior of steel was modeled with ReinforcingSteel material in OpenSees (Figure 1c). The strength of concrete and steel was selected based on the values specified in the structural drawings. The P-Delta effects were included in the pushover analysis by applying the gravity loads prior to pushover analysis or RHA.
Strain
Str
ess
(a) Concrete01
Unconfined
Confined
Strain
Str
ess
(b) Modified Concrete01/Concrete04
Unconfined
Confined
Strain
Str
ess
(c) ReinforcingSteel Model
Figure 1. OpenSees material models: (a) Concrete01 model; (b) Modified Concrete01 and Concrete04 models; and (c) ReinforcingSteel model.
Perfrom3D Model In the Perform3D model, beams were modeled with FEMA Concrete Beam with strength
loss and unsymmetrical section strength, columns were modeled with FEMA Concrete Column with strength loss and symmetrical section strength, and shear walls were modeled with linear elastic column elements. The FEMA Beam element requires moment-plastic-rotation relationship of Figure 2a. The yield moment of the beam section needed to define the FEMA force-deformation behavior is computed from section moment-curvature analysis using computer program XTRACT (TRC, 2008).
The plastic rotation values and the residual strength needed for the FEMA Concrete Beam model in Perform3D are selected as per FEMA-356 (ASCE, 2000) recommendations: plastic rotations are selected as 0.02 for point U and 0.03 for point X, and the residual strength
SMIP09 Seminar Proceedings
44
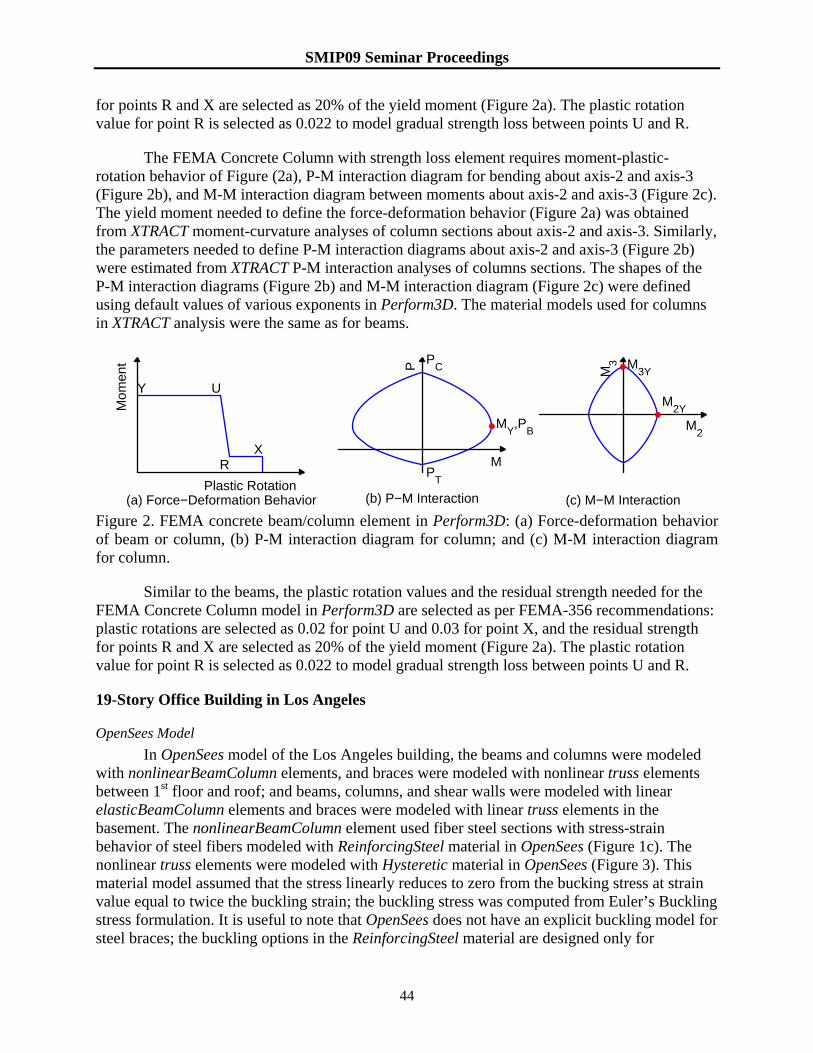
for points R and X are selected as 20% of the yield moment (Figure 2a). The plastic rotation value for point R is selected as 0.022 to model gradual strength loss between points U and R.
The FEMA Concrete Column with strength loss element requires moment-plastic-rotation behavior of Figure (2a), P-M interaction diagram for bending about axis-2 and axis-3 (Figure 2b), and M-M interaction diagram between moments about axis-2 and axis-3 (Figure 2c). The yield moment needed to define the force-deformation behavior (Figure 2a) was obtained from XTRACT moment-curvature analyses of column sections about axis-2 and axis-3. Similarly, the parameters needed to define P-M interaction diagrams about axis-2 and axis-3 (Figure 2b) were estimated from XTRACT P-M interaction analyses of columns sections. The shapes of the P-M interaction diagrams (Figure 2b) and M-M interaction diagram (Figure 2c) were defined using default values of various exponents in Perform3D. The material models used for columns in XTRACT analysis were the same as for beams.
Plastic Rotation
Mom
ent
Y U
RX
(a) Force−Deformation Behavior
PT
PC
MY,P
B
(b) P−M Interaction
M
PM
2Y
M3Y
(c) M−M Interaction
M2
M3
Figure 2. FEMA concrete beam/column element in Perform3D: (a) Force-deformation behavior of beam or column, (b) P-M interaction diagram for column; and (c) M-M interaction diagram for column.
Similar to the beams, the plastic rotation values and the residual strength needed for the FEMA Concrete Column model in Perform3D are selected as per FEMA-356 recommendations: plastic rotations are selected as 0.02 for point U and 0.03 for point X, and the residual strength for points R and X are selected as 20% of the yield moment (Figure 2a). The plastic rotation value for point R is selected as 0.022 to model gradual strength loss between points U and R.
19-Story Office Building in Los Angeles
OpenSees Model In OpenSees model of the Los Angeles building, the beams and columns were modeled
with nonlinearBeamColumn elements, and braces were modeled with nonlinear truss elements between 1st floor and roof; and beams, columns, and shear walls were modeled with linear elasticBeamColumn elements and braces were modeled with linear truss elements in the basement. The nonlinearBeamColumn element used fiber steel sections with stress-strain behavior of steel fibers modeled with ReinforcingSteel material in OpenSees (Figure 1c). The nonlinear truss elements were modeled with Hysteretic material in OpenSees (Figure 3). This material model assumed that the stress linearly reduces to zero from the bucking stress at strain value equal to twice the buckling strain; the buckling stress was computed from Euler’s Buckling stress formulation. It is useful to note that OpenSees does not have an explicit buckling model for steel braces; the buckling options in the ReinforcingSteel material are designed only for

SMIP09 Seminar Proceedings
45
reinforcing bars in reinforced-concrete beams and columns and can not be conveniently used for steel braces.
Strain
Str
ess
εyT
,σyT
εyB
,σyB
Figure 3. OpenSees material model for nonlinear truss element.
Perfrom3D Model In the Perform3D model of the Los Angeles building, beams were modeled with FEMA
Steel Beam with strength loss and symmetrical section strength, columns were modeled with FEMA Steel Column with strength loss and symmetrical section strength, shear walls were modeled with linear elastic column elements, and braces were modeled with Simple Bar element. The material properties for braces were specified by Inelastic Steel Buckling material in Perform3D. The FEMA Steel Beam element requires moment-plastic-rotation relationship of Figure 4a. The yield moment of the steel beam section was computed automatically by Perform3D using section properties and steel strength. The plastic rotation values and the residual strength needed for the FEMA Steel Beam model in Perform3D are selected as per FEMA-356 recommendations: plastic rotations are selected as 9 yθ for point U and 11 yθ for point X in which yθ is the yield rotation, and the residual strength for points R and X are selected as 60% of the yield moment (Figure 4a). The plastic rotation value for point R is selected as 9.5 yθ to model gradual strength loss between points U and R.
Plastic Rotation
Mom
ent
Y U
RX
(a) Force−Deformation Behavior
PT
PC
MY
(b) P−M Interaction
M
P
M2Y
M3Y
(c) M−M Interaction
M2
M3
Figure 4. FEMA steel beam/column element in Perform3D: (a) Force-deformation behavior of beam or column, (b) P-M interaction diagram for column; and (c) M-M interaction diagram for column.
The FEMA Steel Column with strength loss element requires moment-plastic-rotation behavior of Figure (4a), P-M interaction diagram for bending about axis-2 and axis-3 (Figure 4b), and M-M interaction diagram between moments about axis-2 and axis-3 (Figure 4c). The yield moment needed to define the force-deformation behavior (Figure 4a) was automatically
SMIP09 Seminar Proceedings
46
computed by Perform3D based on section properties and material strength. Similar to the beams, the plastic rotation values and the residual strength needed for the FEMA Steel Column model in Perform3D are selected as per FEMA-356 recommendations: plastic rotations are selected as 9 yθ for point U and 11 yθ for point X in which yθ is the yield rotation, and the residual strength for points R and X are selected as 60% of the yield moment (Figure 4a). The shapes of the P-M interaction diagrams (Figure 4b) and M-M interaction diagram (Figure 4c) were also automatically generated in Perform3D based on the specified section properties and material strength.
Pushover Curves
Pushover curves for the selected buildings were developed for transverse and longitudinal direction using height-wise distribution of lateral loads proportional to the first mode in each direction.
20-Story Hotel in North Hollywood
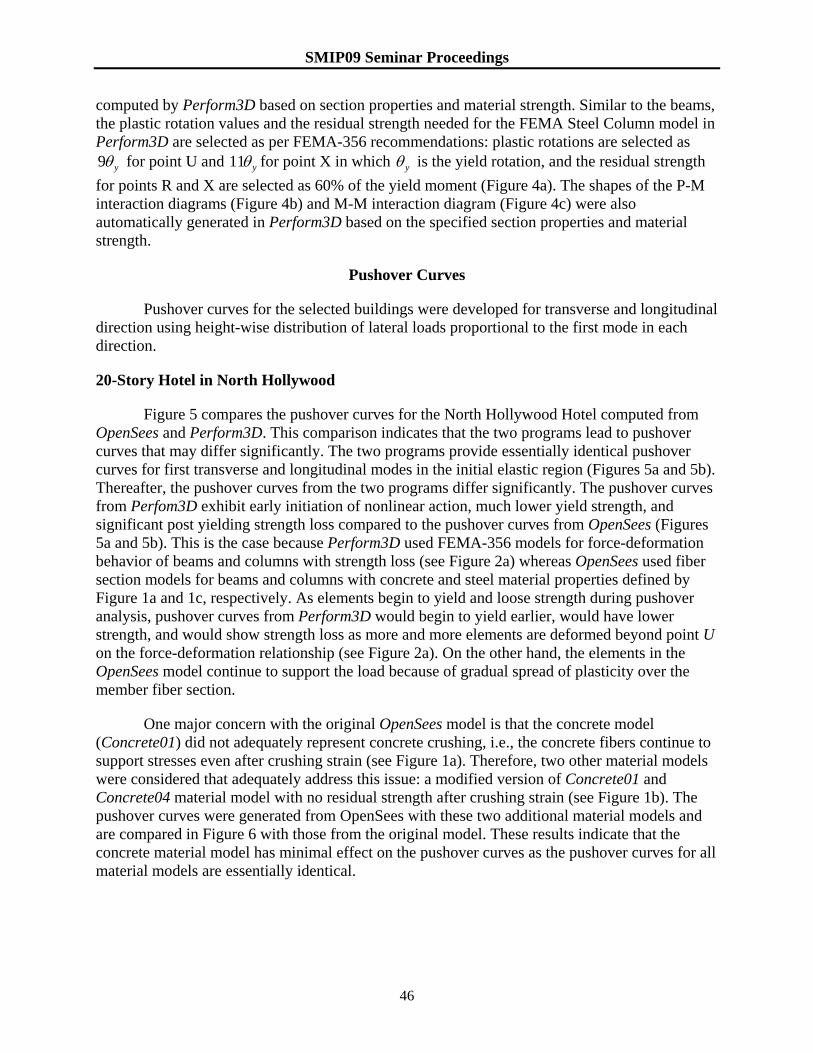
Figure 5 compares the pushover curves for the North Hollywood Hotel computed from OpenSees and Perform3D. This comparison indicates that the two programs lead to pushover curves that may differ significantly. The two programs provide essentially identical pushover curves for first transverse and longitudinal modes in the initial elastic region (Figures 5a and 5b). Thereafter, the pushover curves from the two programs differ significantly. The pushover curves from Perfom3D exhibit early initiation of nonlinear action, much lower yield strength, and significant post yielding strength loss compared to the pushover curves from OpenSees (Figures 5a and 5b). This is the case because Perform3D used FEMA-356 models for force-deformation behavior of beams and columns with strength loss (see Figure 2a) whereas OpenSees used fiber section models for beams and columns with concrete and steel material properties defined by Figure 1a and 1c, respectively. As elements begin to yield and loose strength during pushover analysis, pushover curves from Perform3D would begin to yield earlier, would have lower strength, and would show strength loss as more and more elements are deformed beyond point U on the force-deformation relationship (see Figure 2a). On the other hand, the elements in the OpenSees model continue to support the load because of gradual spread of plasticity over the member fiber section.
One major concern with the original OpenSees model is that the concrete model (Concrete01) did not adequately represent concrete crushing, i.e., the concrete fibers continue to support stresses even after crushing strain (see Figure 1a). Therefore, two other material models were considered that adequately address this issue: a modified version of Concrete01 and Concrete04 material model with no residual strength after crushing strain (see Figure 1b). The pushover curves were generated from OpenSees with these two additional material models and are compared in Figure 6 with those from the original model. These results indicate that the concrete material model has minimal effect on the pushover curves as the pushover curves for all material models are essentially identical.
SMIP09 Seminar Proceedings
47
0 20 40 60 80 1000
2000
4000
6000
8000
10000
Roof Displacement, cm
Bas
e S
hear
, kN
(a) First Transverse Mode
OpenSeesPerform3D
0 20 40 60 80 1000
2000
4000
6000
8000
10000
Roof Displacement, cm
(b) First Longitudinal Mode
Figure 5. Comparison of pushover curves from OpenSees and Perform3D for 20-Story Hotel in North Hollywood.
0 20 40 60 80 1000
2000
4000
6000
8000
10000
Roof Displacement, cm
Bas
e S
hear
, kN
(a) First Transverse Mode
Concrete01Concrete01(Mod)Concrete04
0 20 40 60 80 1000
2000
4000
6000
8000
10000
Roof Displacement, cm
(b) First Longitudinal Mode
Figure 6. Comparison of “modal” pushover curves from OpenSees for three different concrete material models – Concrete01, modified Concrete01, and Concrete04 – for 20-Story Hotel in North Hollywood.
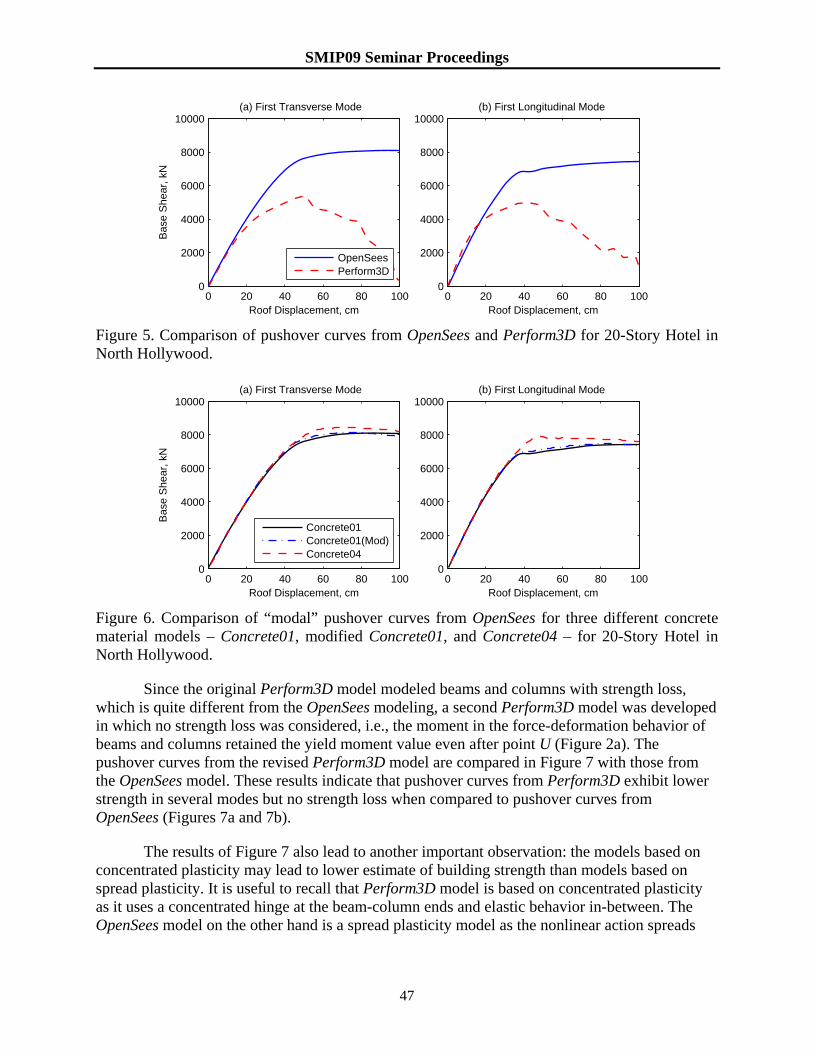
Since the original Perform3D model modeled beams and columns with strength loss, which is quite different from the OpenSees modeling, a second Perform3D model was developed in which no strength loss was considered, i.e., the moment in the force-deformation behavior of beams and columns retained the yield moment value even after point U (Figure 2a). The pushover curves from the revised Perform3D model are compared in Figure 7 with those from the OpenSees model. These results indicate that pushover curves from Perform3D exhibit lower strength in several modes but no strength loss when compared to pushover curves from OpenSees (Figures 7a and 7b).
The results of Figure 7 also lead to another important observation: the models based on concentrated plasticity may lead to lower estimate of building strength than models based on spread plasticity. It is useful to recall that Perform3D model is based on concentrated plasticity as it uses a concentrated hinge at the beam-column ends and elastic behavior in-between. The OpenSees model on the other hand is a spread plasticity model as the nonlinear action spreads
SMIP09 Seminar Proceedings
48
gradually across the beam-column section as material fibers undergo increasing stresses and strains.
0 20 40 60 80 1000
2000
4000
6000
8000
10000
Roof Displacement, cm
Bas
e S
hear
, kN
(a) First Transverse Mode
OpenSeesPerform3D
0 20 40 60 80 1000
2000
4000
6000
8000
10000
Roof Displacement, cm
(b) First Longitudinal Mode
Figure 7. Comparison of pushover curves from OpenSees and Perform3D for 20-Story Hotel in North Hollywood; Perform3D results are using no strength loss model for beams and columns.
19-Story Office Building in Los Angeles
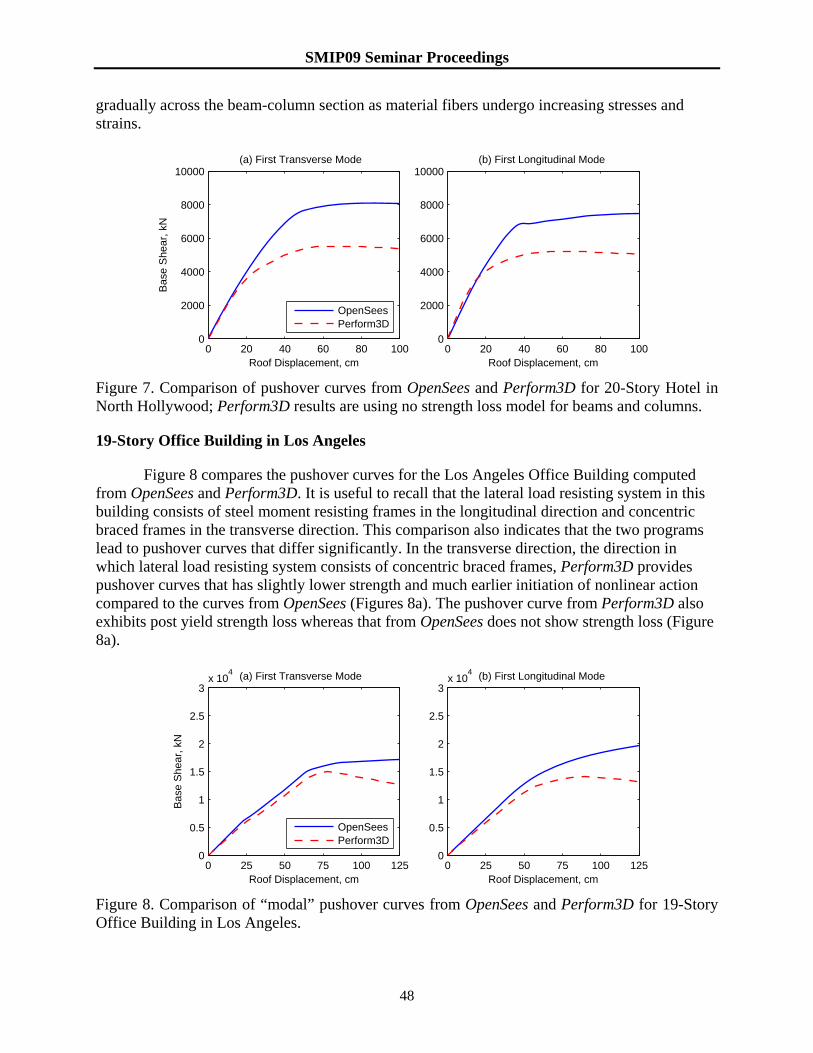
Figure 8 compares the pushover curves for the Los Angeles Office Building computed from OpenSees and Perform3D. It is useful to recall that the lateral load resisting system in this building consists of steel moment resisting frames in the longitudinal direction and concentric braced frames in the transverse direction. This comparison also indicates that the two programs lead to pushover curves that differ significantly. In the transverse direction, the direction in which lateral load resisting system consists of concentric braced frames, Perform3D provides pushover curves that has slightly lower strength and much earlier initiation of nonlinear action compared to the curves from OpenSees (Figures 8a). The pushover curve from Perform3D also exhibits post yield strength loss whereas that from OpenSees does not show strength loss (Figure 8a).
0 25 50 75 100 1250
0.5
1
1.5
2
2.5
3x 10
4
Roof Displacement, cm
Bas
e S
hear
, kN
(a) First Transverse Mode
OpenSeesPerform3D
0 25 50 75 100 1250
0.5
1
1.5
2
2.5
3x 10
4
Roof Displacement, cm
(b) First Longitudinal Mode
Figure 8. Comparison of “modal” pushover curves from OpenSees and Perform3D for 19-Story Office Building in Los Angeles.
SMIP09 Seminar Proceedings
49
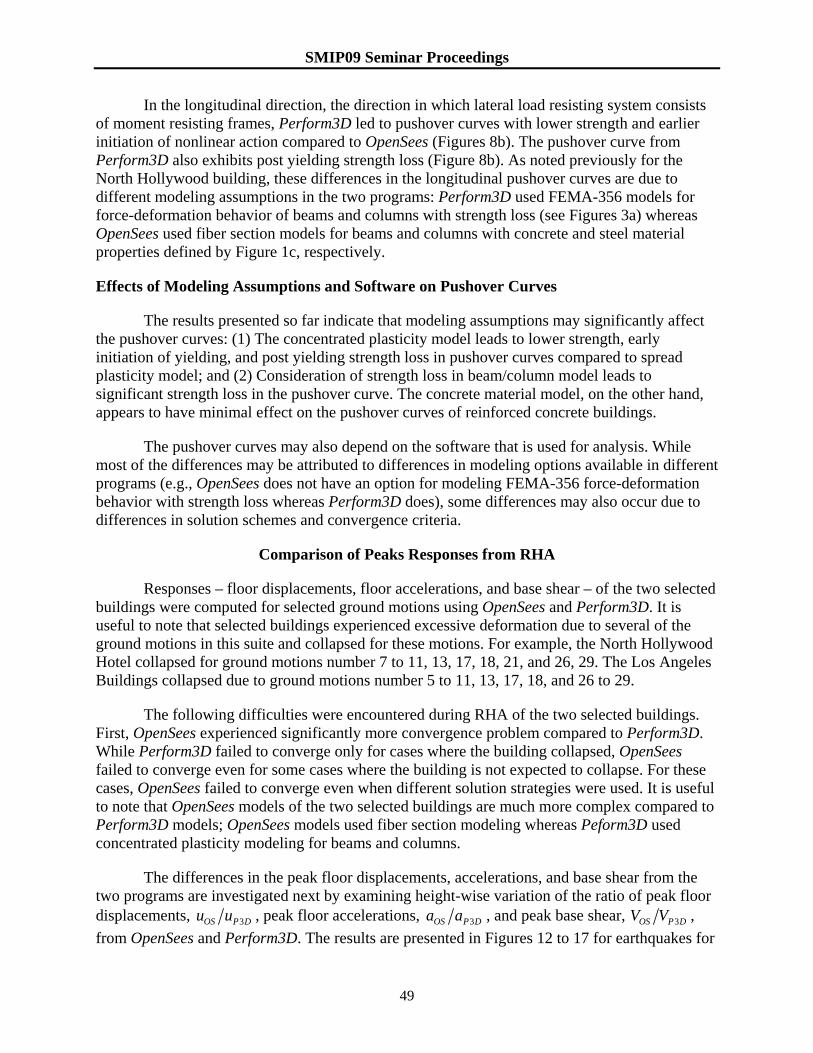
In the longitudinal direction, the direction in which lateral load resisting system consists of moment resisting frames, Perform3D led to pushover curves with lower strength and earlier initiation of nonlinear action compared to OpenSees (Figures 8b). The pushover curve from Perform3D also exhibits post yielding strength loss (Figure 8b). As noted previously for the North Hollywood building, these differences in the longitudinal pushover curves are due to different modeling assumptions in the two programs: Perform3D used FEMA-356 models for force-deformation behavior of beams and columns with strength loss (see Figures 3a) whereas OpenSees used fiber section models for beams and columns with concrete and steel material properties defined by Figure 1c, respectively.
Effects of Modeling Assumptions and Software on Pushover Curves
The results presented so far indicate that modeling assumptions may significantly affect the pushover curves: (1) The concentrated plasticity model leads to lower strength, early initiation of yielding, and post yielding strength loss in pushover curves compared to spread plasticity model; and (2) Consideration of strength loss in beam/column model leads to significant strength loss in the pushover curve. The concrete material model, on the other hand, appears to have minimal effect on the pushover curves of reinforced concrete buildings.
The pushover curves may also depend on the software that is used for analysis. While most of the differences may be attributed to differences in modeling options available in different programs (e.g., OpenSees does not have an option for modeling FEMA-356 force-deformation behavior with strength loss whereas Perform3D does), some differences may also occur due to differences in solution schemes and convergence criteria.
Comparison of Peaks Responses from RHA
Responses – floor displacements, floor accelerations, and base shear – of the two selected buildings were computed for selected ground motions using OpenSees and Perform3D. It is useful to note that selected buildings experienced excessive deformation due to several of the ground motions in this suite and collapsed for these motions. For example, the North Hollywood Hotel collapsed for ground motions number 7 to 11, 13, 17, 18, 21, and 26, 29. The Los Angeles Buildings collapsed due to ground motions number 5 to 11, 13, 17, 18, and 26 to 29.
The following difficulties were encountered during RHA of the two selected buildings. First, OpenSees experienced significantly more convergence problem compared to Perform3D. While Perform3D failed to converge only for cases where the building collapsed, OpenSees failed to converge even for some cases where the building is not expected to collapse. For these cases, OpenSees failed to converge even when different solution strategies were used. It is useful to note that OpenSees models of the two selected buildings are much more complex compared to Perform3D models; OpenSees models used fiber section modeling whereas Peform3D used concentrated plasticity modeling for beams and columns.
The differences in the peak floor displacements, accelerations, and base shear from the two programs are investigated next by examining height-wise variation of the ratio of peak floor displacements, 3OS P Du u , peak floor accelerations, 3OS P Da a , and peak base shear, 3OS P DV V , from OpenSees and Perform3D. The results are presented in Figures 12 to 17 for earthquakes for
SMIP09 Seminar Proceedings
50
which the building did not to collapse. The results for the North Hollywood Hotel are for the OpenSees model which used Concrete01 material model with residual strength and Perform3D model with beams and columns modeled with FEMA-356 force-deformation behavior with strength loss. The other two concrete models – Concrete01 without residual strength and Concrete04 model – led to responses similar to the Concrete01 material model with residual strength when the solution converged. However, OpenSees model with these two concrete materials experienced much more convergence problem compared to the model with Concrete01 material with residual strength. The results for the Los Angeles Building are for the OpenSees Model with Hysteretic steel material for braces to capture post-buckling strength loss and for the Perform3D model with beams and columns modeled with FEMA-356 force-deformation behavior with strength loss.
The presented results include variation of the ratios for individual earthquakes along with the median values and median plus/minus one standard deviation. Median is an indicator of OpenSees over or under predicting response compared to Perform3D whereas the band formed by median plus/minus one standard deviation is an indicator of the dispersion in the response prediction.
20-Story Hotel in North Hollywood
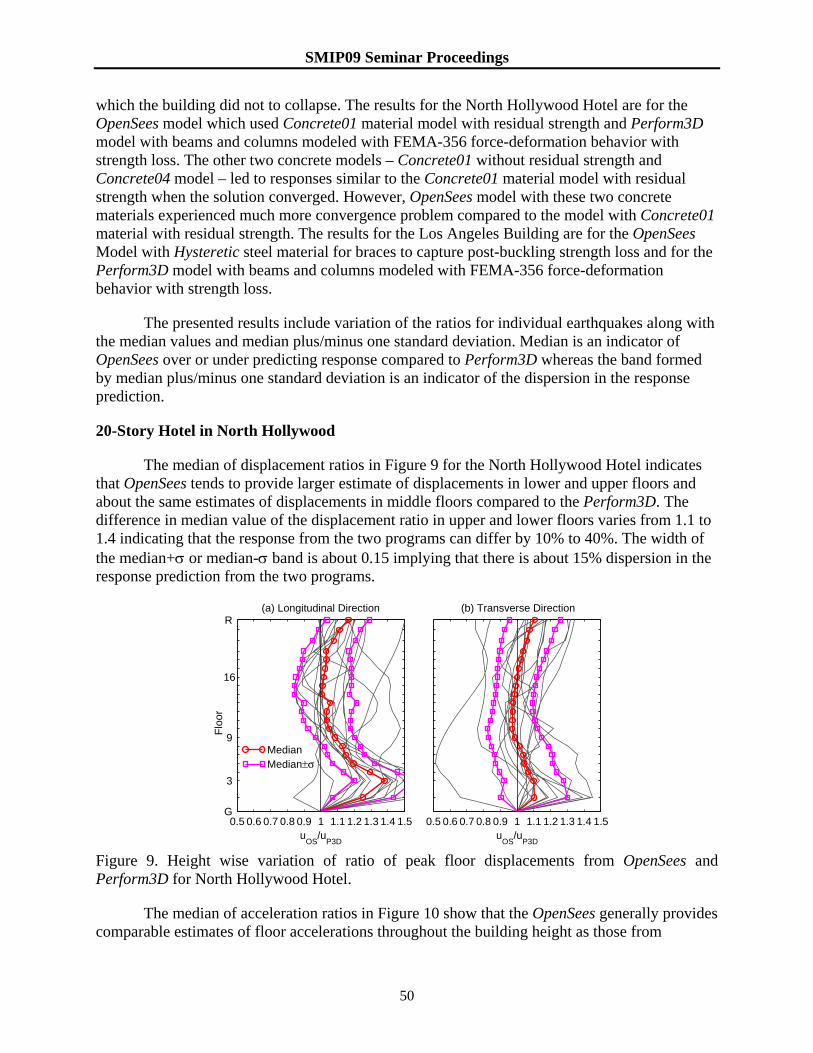
The median of displacement ratios in Figure 9 for the North Hollywood Hotel indicates that OpenSees tends to provide larger estimate of displacements in lower and upper floors and about the same estimates of displacements in middle floors compared to the Perform3D. The difference in median value of the displacement ratio in upper and lower floors varies from 1.1 to 1.4 indicating that the response from the two programs can differ by 10% to 40%. The width of the median+σ or median-σ band is about 0.15 implying that there is about 15% dispersion in the response prediction from the two programs.
0.5 0.6 0.7 0.8 0.9 1 1.1 1.2 1.3 1.4 1.5
(a) Longitudinal Direction
Flo
or
uOS
/uP3D
G
3
9
16
R
MedianMedian±σ
0.5 0.6 0.7 0.8 0.9 1 1.1 1.2 1.3 1.4 1.5
(b) Transverse Direction
uOS
/uP3D
Figure 9. Height wise variation of ratio of peak floor displacements from OpenSees and Perform3D for North Hollywood Hotel.
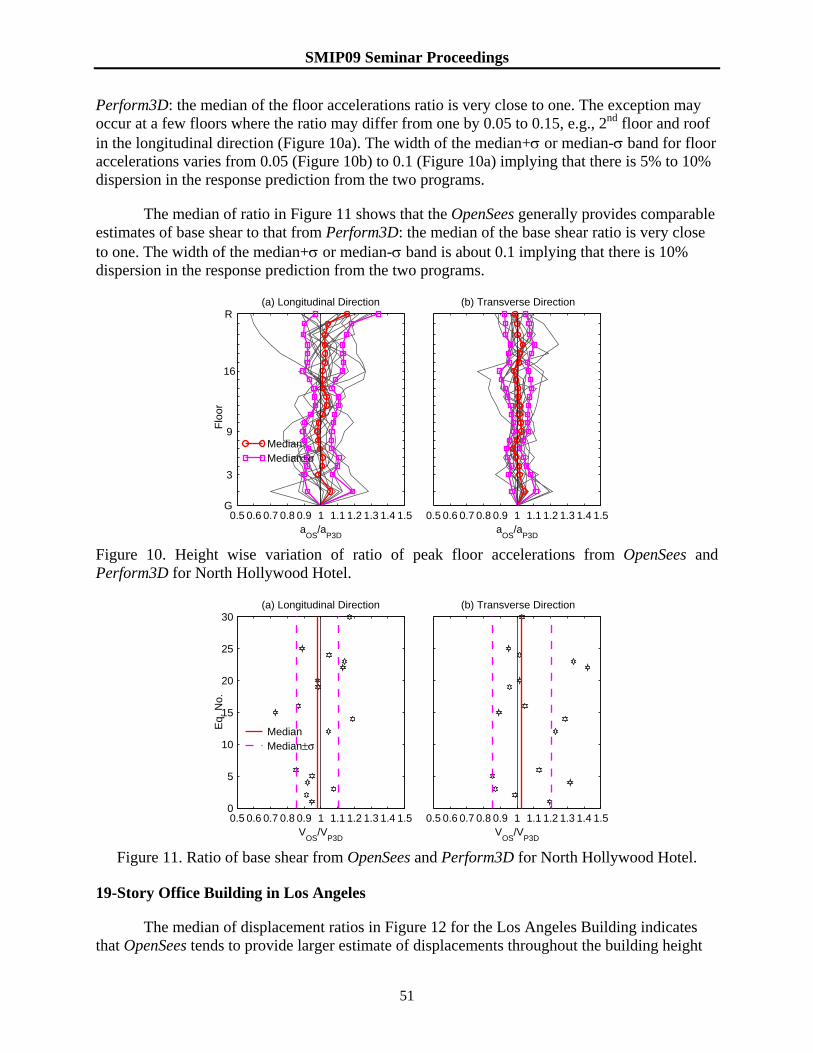
The median of acceleration ratios in Figure 10 show that the OpenSees generally provides comparable estimates of floor accelerations throughout the building height as those from
SMIP09 Seminar Proceedings
51
Perform3D: the median of the floor accelerations ratio is very close to one. The exception may occur at a few floors where the ratio may differ from one by 0.05 to 0.15, e.g., 2nd floor and roof in the longitudinal direction (Figure 10a). The width of the median+σ or median-σ band for floor accelerations varies from 0.05 (Figure 10b) to 0.1 (Figure 10a) implying that there is 5% to 10% dispersion in the response prediction from the two programs.
The median of ratio in Figure 11 shows that the OpenSees generally provides comparable estimates of base shear to that from Perform3D: the median of the base shear ratio is very close to one. The width of the median+σ or median-σ band is about 0.1 implying that there is 10% dispersion in the response prediction from the two programs.
0.5 0.6 0.7 0.8 0.9 1 1.1 1.2 1.3 1.4 1.5
(a) Longitudinal Direction
Flo
or
aOS
/aP3D
G
3
9
16
R
MedianMedian±σ
0.5 0.6 0.7 0.8 0.9 1 1.1 1.2 1.3 1.4 1.5
(b) Transverse Direction
aOS
/aP3D
Figure 10. Height wise variation of ratio of peak floor accelerations from OpenSees and Perform3D for North Hollywood Hotel.
0.5 0.6 0.7 0.8 0.9 1 1.1 1.2 1.3 1.4 1.50
5
10
15
20
25
30(a) Longitudinal Direction
Eq.
No.
VOS
/VP3D
MedianMedian±σ
0.5 0.6 0.7 0.8 0.9 1 1.1 1.2 1.3 1.4 1.5
(b) Transverse Direction
VOS
/VP3D
Figure 11. Ratio of base shear from OpenSees and Perform3D for North Hollywood Hotel.
19-Story Office Building in Los Angeles
The median of displacement ratios in Figure 12 for the Los Angeles Building indicates that OpenSees tends to provide larger estimate of displacements throughout the building height

SMIP09 Seminar Proceedings
52
in the longitudinal direction (Figure 12a) and in upper floors in the transverse direction (Figure 12b) compared to the Perform3D. The difference in median value of the displacement ratio in upper and lower floors varies from 1.05 to 1.1 indicating that the response from the two programs can differ by 5% to 10%. The width of the median+σ or median-σ band is about 0.1 implying that there is 10% dispersion in the response prediction from the two programs.
0.5 0.6 0.7 0.8 0.9 1 1.1 1.2 1.3 1.4 1.5
(a) Longitudinal DirectionF
loor
uOS
/uP3D
1
5
9
13
17 R
MedianMedian±σ
0.5 0.6 0.7 0.8 0.9 1 1.1 1.2 1.3 1.4 1.5
(b) Transverse Direction
uOS
/uP3D
Figure 12. Height wise variation of ratio of peak floor displacements from OpenSees and Perform3D for Los Angeles Building.
The median of acceleration ratios in Figure 13 show that the OpenSees generally provides comparable estimates of upper floor accelerations as those from Perform3D: the median of the floor accelerations ratio is very close to one. For lower floors, where a soft story condition occurs in the Los Angeles building due to taller story height, the ratio may differ from one by 0.1 to 0.25, e.g., 2nd floor (Figures 13a and 13b). The width of the median+σ or median-σ band for floor accelerations varies from 0.05 (Figure 13a) to 0.1 (Figure 13b) implying that there is 5% to 10% dispersion in the response prediction from the two programs.
0.5 0.6 0.7 0.8 0.9 1 1.1 1.2 1.3 1.4 1.5
(a) Longitudinal Direction
Flo
or
aOS
/aP3D
1
5
9
13
17 R
MedianMedian±σ
0.5 0.6 0.7 0.8 0.9 1 1.1 1.2 1.3 1.4 1.5
(b) Transverse Direction
aOS
/aP3D
Figure 13. Height wise variation of ratio of peak floor accelerations from OpenSees and Perform3D for Los Angeles Building.
SMIP09 Seminar Proceedings
53
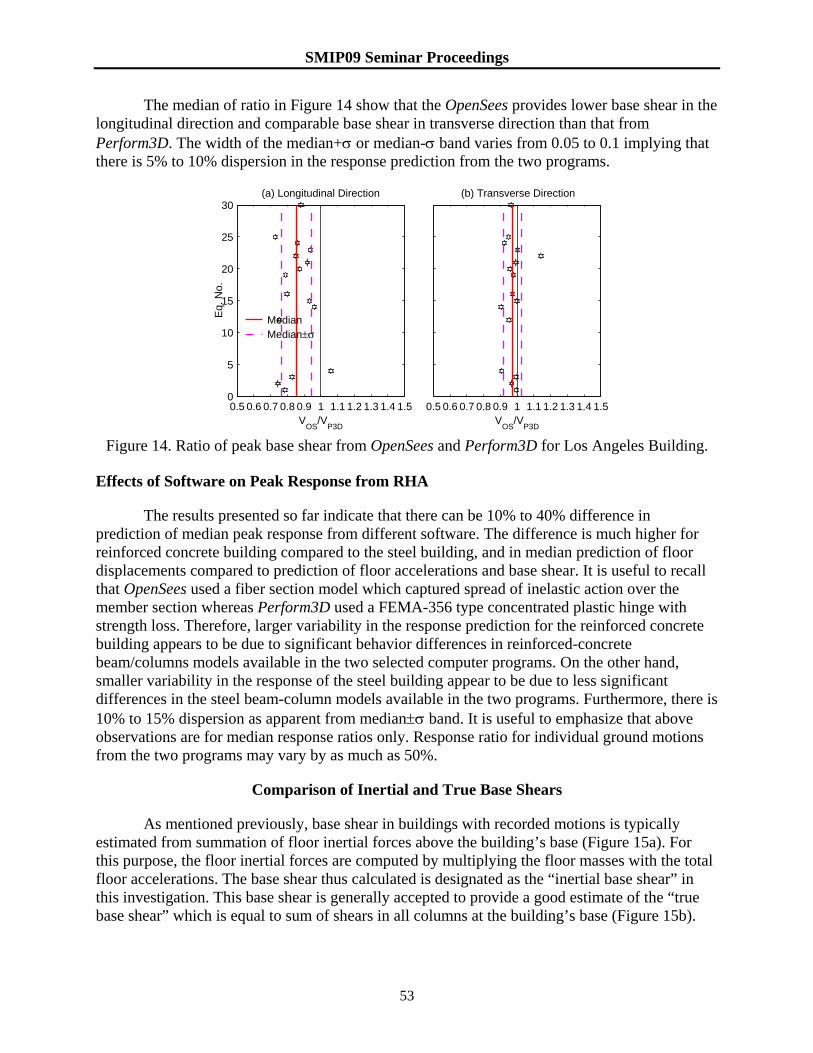
The median of ratio in Figure 14 show that the OpenSees provides lower base shear in the longitudinal direction and comparable base shear in transverse direction than that from Perform3D. The width of the median+σ or median-σ band varies from 0.05 to 0.1 implying that there is 5% to 10% dispersion in the response prediction from the two programs.
0.5 0.6 0.7 0.8 0.9 1 1.1 1.2 1.3 1.4 1.50
5
10
15
20
25
30(a) Longitudinal Direction
Eq.
No.
VOS
/VP3D
MedianMedian±σ
0.5 0.6 0.7 0.8 0.9 1 1.1 1.2 1.3 1.4 1.5
(b) Transverse Direction
VOS
/VP3D
Figure 14. Ratio of peak base shear from OpenSees and Perform3D for Los Angeles Building.
Effects of Software on Peak Response from RHA
The results presented so far indicate that there can be 10% to 40% difference in prediction of median peak response from different software. The difference is much higher for reinforced concrete building compared to the steel building, and in median prediction of floor displacements compared to prediction of floor accelerations and base shear. It is useful to recall that OpenSees used a fiber section model which captured spread of inelastic action over the member section whereas Perform3D used a FEMA-356 type concentrated plastic hinge with strength loss. Therefore, larger variability in the response prediction for the reinforced concrete building appears to be due to significant behavior differences in reinforced-concrete beam/columns models available in the two selected computer programs. On the other hand, smaller variability in the response of the steel building appear to be due to less significant differences in the steel beam-column models available in the two programs. Furthermore, there is 10% to 15% dispersion as apparent from median±σ band. It is useful to emphasize that above observations are for median response ratios only. Response ratio for individual ground motions from the two programs may vary by as much as 50%.
Comparison of Inertial and True Base Shears
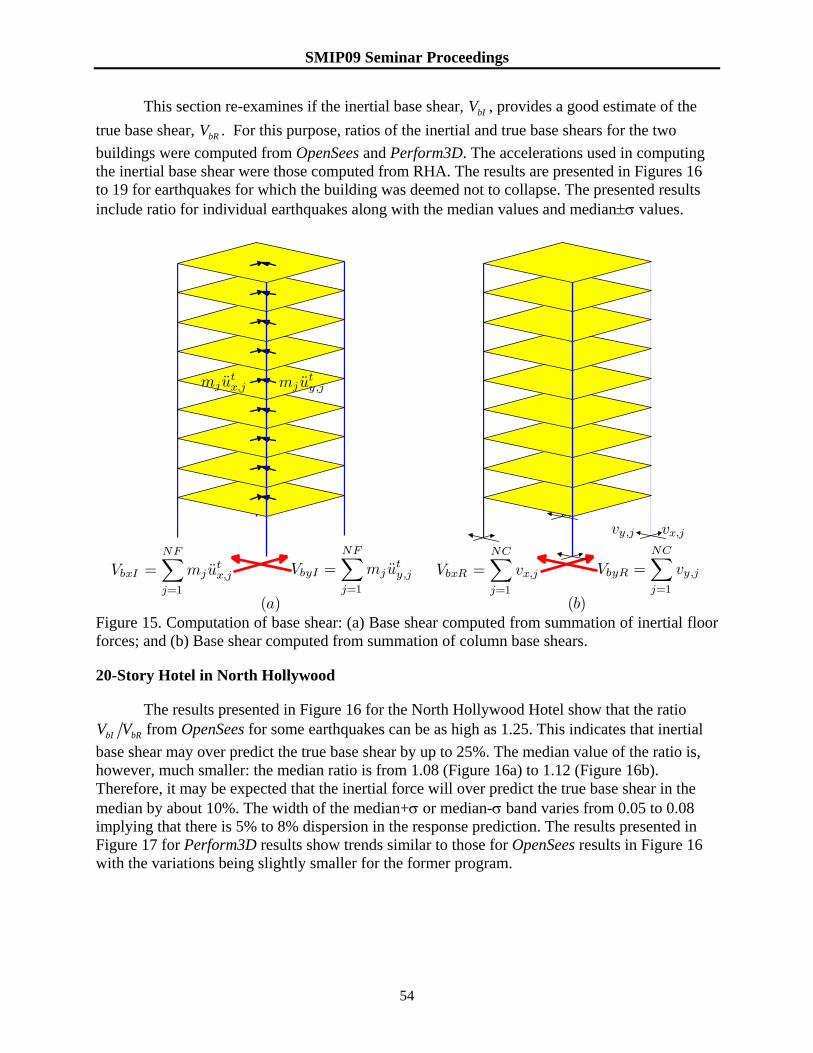
As mentioned previously, base shear in buildings with recorded motions is typically estimated from summation of floor inertial forces above the building’s base (Figure 15a). For this purpose, the floor inertial forces are computed by multiplying the floor masses with the total floor accelerations. The base shear thus calculated is designated as the “inertial base shear” in this investigation. This base shear is generally accepted to provide a good estimate of the “true base shear” which is equal to sum of shears in all columns at the building’s base (Figure 15b).
SMIP09 Seminar Proceedings
54
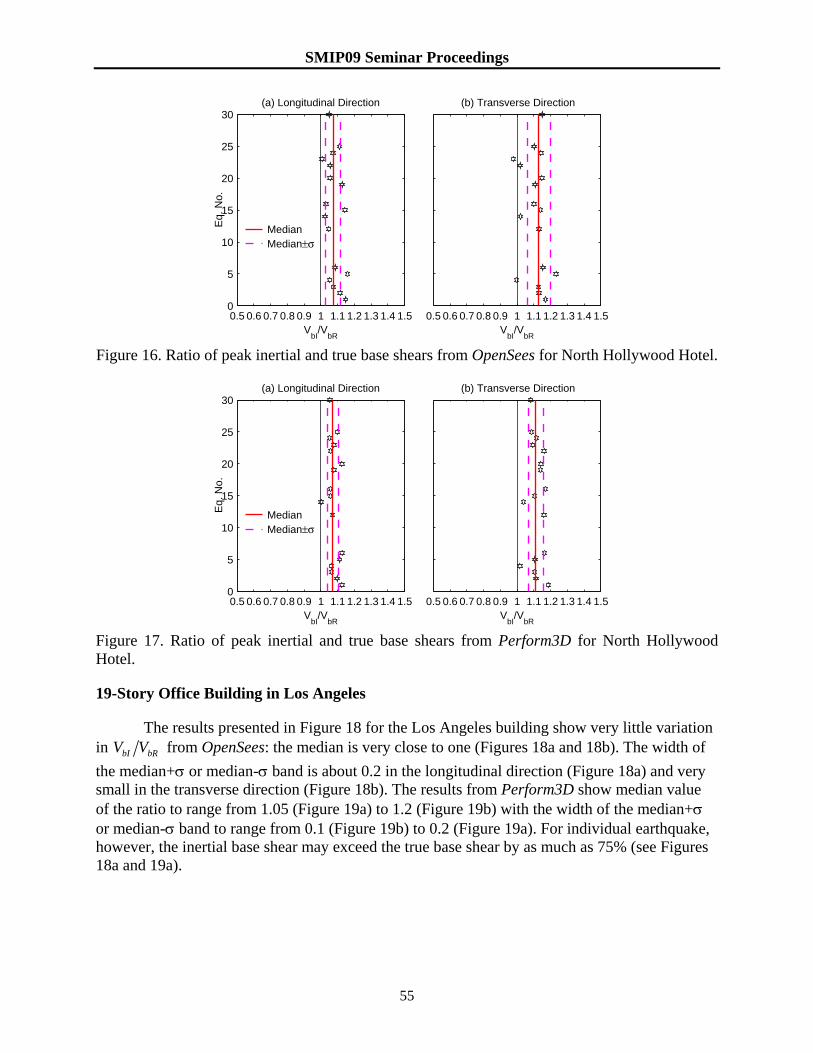
This section re-examines if the inertial base shear, bIV , provides a good estimate of the true base shear, bRV . For this purpose, ratios of the inertial and true base shears for the two buildings were computed from OpenSees and Perform3D. The accelerations used in computing the inertial base shear were those computed from RHA. The results are presented in Figures 16 to 19 for earthquakes for which the building was deemed not to collapse. The presented results include ratio for individual earthquakes along with the median values and median±σ values.
VbyI =NF∑
j=1
mj uty,j
mj uty,j
(a)
mj utx,j
VbxI =NF∑
j=1
mjutx,j
vx,jvy,j
VbyR =NC∑
j=1
vy,j
(b)
VbxR =NC∑
j=1
vx,j
Figure 15. Computation of base shear: (a) Base shear computed from summation of inertial floor forces; and (b) Base shear computed from summation of column base shears.
20-Story Hotel in North Hollywood
The results presented in Figure 16 for the North Hollywood Hotel show that the ratio bI bRV V from OpenSees for some earthquakes can be as high as 1.25. This indicates that inertial
base shear may over predict the true base shear by up to 25%. The median value of the ratio is, however, much smaller: the median ratio is from 1.08 (Figure 16a) to 1.12 (Figure 16b). Therefore, it may be expected that the inertial force will over predict the true base shear in the median by about 10%. The width of the median+σ or median-σ band varies from 0.05 to 0.08 implying that there is 5% to 8% dispersion in the response prediction. The results presented in Figure 17 for Perform3D results show trends similar to those for OpenSees results in Figure 16 with the variations being slightly smaller for the former program.
SMIP09 Seminar Proceedings
55
0.5 0.6 0.7 0.8 0.9 1 1.1 1.2 1.3 1.4 1.50
5
10
15
20
25
30(a) Longitudinal Direction
Eq.
No.
VbI
/VbR
MedianMedian±σ
0.5 0.6 0.7 0.8 0.9 1 1.1 1.2 1.3 1.4 1.5
(b) Transverse Direction
VbI
/VbR
Figure 16. Ratio of peak inertial and true base shears from OpenSees for North Hollywood Hotel.
0.5 0.6 0.7 0.8 0.9 1 1.1 1.2 1.3 1.4 1.50
5
10
15
20
25
30(a) Longitudinal Direction
Eq.
No.
VbI
/VbR
MedianMedian±σ
0.5 0.6 0.7 0.8 0.9 1 1.1 1.2 1.3 1.4 1.5
(b) Transverse Direction
VbI
/VbR
Figure 17. Ratio of peak inertial and true base shears from Perform3D for North Hollywood Hotel.
19-Story Office Building in Los Angeles
The results presented in Figure 18 for the Los Angeles building show very little variation in bI bRV V from OpenSees: the median is very close to one (Figures 18a and 18b). The width of the median+σ or median-σ band is about 0.2 in the longitudinal direction (Figure 18a) and very small in the transverse direction (Figure 18b). The results from Perform3D show median value of the ratio to range from 1.05 (Figure 19a) to 1.2 (Figure 19b) with the width of the median+σ or median-σ band to range from 0.1 (Figure 19b) to 0.2 (Figure 19a). For individual earthquake, however, the inertial base shear may exceed the true base shear by as much as 75% (see Figures 18a and 19a).

SMIP09 Seminar Proceedings
56
0 0.2 0.4 0.6 0.8 1 1.2 1.4 1.6 1.8 20
5
10
15
20
25
30(a) Longitudinal Direction
Eq.
No.
VbI
/VbR
MedianMedian±σ
0 0.2 0.4 0.6 0.8 1 1.2 1.4 1.6 1.8 2
(b) Transverse Direction
VbI
/VbR
Figure 18. Ratio of peak inertial and true base shears from OpenSees for Los Angeles Building.
0 0.25 0.5 0.75 1 1.25 1.5 1.75 20
5
10
15
20
25
30(a) Longitudinal Direction
Eq.
No.
VbI
/VbR
MedianMedian±σ
0 0.25 0.5 0.75 1 1.25 1.5 1.75 2
(b) Transverse Direction
VbI
/VbR
Figure 19. Ratio of peak inertial and true base shears from Perform3D for Los Angeles Building.
The presented so far indicate that the median inertial base shear exceeds the true base shear by 10 to 20%. For individual earthquakes, however, the inertial base shear may overestimate the true base shear by as much as 75%. Therefore, inertial base shear should be used with caution as an estimate of the true base shear.
Effects of Time Shift on Inertial Base Shear
The inertial base shear is typically used to estimate the true base shear in buildings with acceleration recorded during earthquakes. A mid- or high-rise building is instrumented with a large number of accelerometers and all of these accelerometers may not be connected to a single recorder. Although, the recorders are generally time synchronized, there is still a possibility of time shift between different recorders. Examined next is the effect of time shift on inertial base shear. For this purpose, time shift equal to one time step is introduced between the base acceleration and the relative acceleration computed from RHA of the two selected buildings using OpenSees and the inertial base shears are recomputed; recall the inertial base shear requires total floor accelerations which are defined as sum of the base acceleration and relative floor
SMIP09 Seminar Proceedings
57
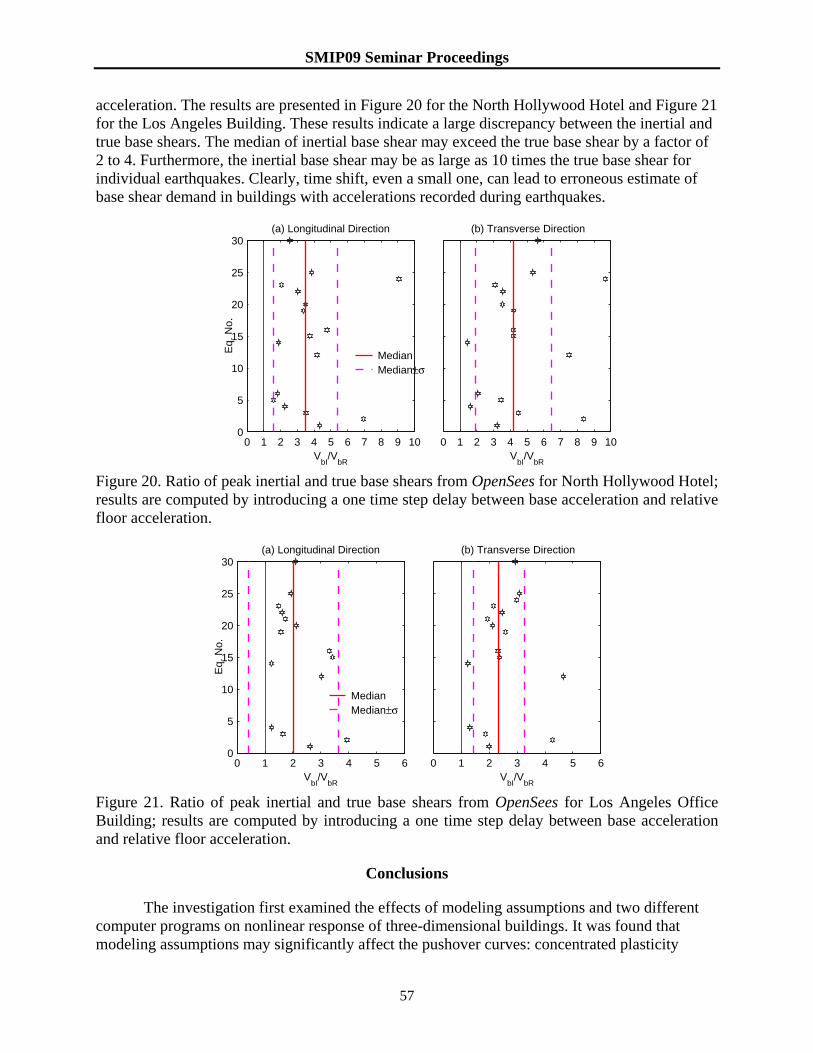
acceleration. The results are presented in Figure 20 for the North Hollywood Hotel and Figure 21 for the Los Angeles Building. These results indicate a large discrepancy between the inertial and true base shears. The median of inertial base shear may exceed the true base shear by a factor of 2 to 4. Furthermore, the inertial base shear may be as large as 10 times the true base shear for individual earthquakes. Clearly, time shift, even a small one, can lead to erroneous estimate of base shear demand in buildings with accelerations recorded during earthquakes.
0 1 2 3 4 5 6 7 8 9 10
0
5
10
15
20
25
30(a) Longitudinal Direction
Eq.
No.
VbI
/VbR
MedianMedian±σ
0 1 2 3 4 5 6 7 8 9 10
(b) Transverse Direction
VbI
/VbR
Figure 20. Ratio of peak inertial and true base shears from OpenSees for North Hollywood Hotel; results are computed by introducing a one time step delay between base acceleration and relative floor acceleration.
0 1 2 3 4 5 60
5
10
15
20
25
30(a) Longitudinal Direction
Eq.
No.
VbI
/VbR
MedianMedian±σ
0 1 2 3 4 5 6
(b) Transverse Direction
VbI
/VbR
Figure 21. Ratio of peak inertial and true base shears from OpenSees for Los Angeles Office Building; results are computed by introducing a one time step delay between base acceleration and relative floor acceleration.
Conclusions
The investigation first examined the effects of modeling assumptions and two different computer programs on nonlinear response of three-dimensional buildings. It was found that modeling assumptions may significantly affect the pushover curves: concentrated plasticity

SMIP09 Seminar Proceedings
58
model leads to lower strength, early initiation of yielding, and post yielding strength loss in pushover curves compared to spread plasticity model; and strength loss model for beams/columns leads to significant post yielding strength loss in the pushover curve. The concrete material model, on the other hand, appears to have minimal effect on the pushover curves of reinforced concrete buildings. While most of the differences may be attributed to differences in modeling options available in different programs (e.g., OpenSees does not have an option for modeling FEMA-356 force-deformation behavior with strength loss whereas Perform3D does), some differences may also occur due to differences in solution schemes and convergence criteria available in different software programs.
It was also found that the prediction of median peak response from different software can differ from 10% to 40%. The difference tends to be much higher for reinforced concrete building compared to the steel building, and for floor displacements compared to floor accelerations and base shear. Furthermore, there is dispersion of about 10% to 15% in the median prediction as apparent from median±σ band. For individual ground motions, the peak responses from different computer programs may vary by as much as 50%.
This investigation also examined if the “inertial base shear”, defined as summation of floor inertial forces above the building’s base with the floor inertial forces computed by multiplying the floor masses with the total floor accelerations, can provide an accurate estimate of the “true base shear” which is equal to sum of shears in all columns at the building’s base. This investigation indicated that the median inertial base shear exceeds the true base shear by 10 to 20%. For individual earthquakes, however, the inertial base shear may overestimate the true base shear by as much as 50%. It was also found that even a small recording time delay between different acceleration channels may lead to large errors if these accelerations are used to estimate base shear demand during an earthquake event. Therefore, inertial base shear should be used with caution as an estimate of the true base shear.
Acknowledgment
This investigation is supported by the California Department of Conservation, California Geological Survey, Strong Motion Instrumentation Program, Contract No. 1007-907. This support is gratefully acknowledged. The author would also like to acknowledge the support provided by Prof. Graham Powell on implementation of Perform3D and by Dr. Charles Chadwell on use of Xtract.
References
ASCE (2000). Prestandard and Commentary for the Seismic Rehabilitation of Buildings. Report No. FEMA-356, Building Seismic Safety Council, Federal Emergency Management Agency, Washington, D.C.
Bernal, D. (2007). Predictive Capability of Nonlinear Static Analysis Procedures for Seismic Evaluation of Buildings, CSMIP Data Interpretation Report, Strong Motion Instrumentation Program, CDMG, Sacramento, CA.
Chadwell, C. (2007). Capacity Analysis and Pushover Program (Capp): Version 1.04. Imbsen & Associates, Inc., <www.imbsen.com)>.
SMIP09 Seminar Proceedings
59
CSI (2006). Perform3D: Nonlinear Analysis and Performance Assessment for 3d Structures: Version 4. Computers and Structures, Inc., Berkeley. <www.csiberkeley.com)>.
De la Llera, J. C. and Chopra, A. K. (1998). “Evaluation of Seismic Code Provisions Using Strong-Motion Building Records from the 1994 Northridge Earthquake,” Report No. UCB/EERC-97/16, Earthquake Engineering Research Center, University of California, Berkeley, CA.
Goel, R.K. (2005). “Evaluation of Modal and FEMA Pushover Procedures Using Strong-Motion Records of Buildings,” Earthquake Spectra, 21(3): 653-684, 2005.
Goel, R.K. (2007). “Evaluation of Current Nonlinear Static Procedures Using Strong Motion Records,” Proceedings of the 2007 Structures Congress, Long Beach, CA, American Society of Civil Engineers, Reston, VA.
Goel, R.K. (2008). “Mode-Based Procedure to Interpolate Strong Motion Records of Instrumented Building.” ISET Journal of Earthquake Technology, 45(3-4), December.
Goel, R.K. and Chadwell, C. (2007). Evaluation of Current Nonlinear Static Procedures for Concrete Buildings Using Recorded Strong-Motion Data, CSMIP Data Interpretation Report, Strong Motion Instrumentation Program, CDMG, Sacramento, CA.
Karsan, I. D., and Jirsa, J. O. (1969). "Behavior of concrete under compressive loading." Journal of Structural Division ASCE, 95(ST12).
Limongelli, M. P. (2003). “Optimal Location of Sensors for Reconstruction of Seismic Response through Spline Function Interpolation,” Earthquake Engineering and Structural Dynamics, 32(7):1055-1074.
Mander, J. B., Priestley, M. J. N., and Park, R. (1988). "Theoretical stress-strain model for confined concrete." Journal of Structural Engineering ASCE, 114(8), 1804-1825.
McKenna, F. and Fenves, G. (2001). The Opensees Command Language Manual: 1.2. Pacific Earthquake Engineering Center, University of California, Berkeley,(http://opensees.berkeley.edu).
Naeim, F., Lee, H., Bhatia, H., Hagie, S., and Skliros, K. (2004). “CSMIP Instrumented Building Response Analysis and 3-D Visualization System (CSMIP-3DV),” Proceedings, SMIP04 Seminar on Utilization of Strong-Motion Data, Strong Motion Instrumentation Program, CDMG, Sacramento, CA.
Naeim, F. (1997). Performance of Extensively Instrumented Buildings During the January 17, 1994 Northridge Earthquake: An Interactive Information System, Report No. 97-7530.68, John A. Martin & Associates, Los Angeles, CA, 1997.
Popovics, S. (1973). "A numerical approach to the complete stress strain curve for concrete." Cement and concrete research, 3(5), 583-599.
TRC (2008), Cross Sectional Analysis of Structural Components, v3.0.8, TRC/Imbsen Software Systems, Rancho Cordova, CA. <http://www.imbsen.com/>

SMIP09 Seminar Proceedings
60