Embed Size (px)
Citation preview
SMIP04 Seminar Proceedings
DESIGN GROUND MOTION LIBRARY
Maurice S. Power, Robert R. Youngs, and Chih-Cheng Chin Geomatrix Consultants, Inc., Oakland, California
Abstract
Criteria and guidelines being utilized to form a Design Ground Motion Library (DGML) are summarized in this paper. The DGML is being formed as an electronic library of selected recorded acceleration time histories considered to be suitable for use by engineering practitioners for the time history dynamic analysis of various facility types in California and other parts of the Western United States (WUS). The broad criterion governing selection of records is that the records be representative of ranges of design earthquakes and ground motions expected for the WUS seismic environment. Separate sets of records are being developed for different ranges of earthquake magnitude and earthquake source-to-site distance, for soil and rock site conditions, and for different period ranges of significance for different types of structures. Ground motion characteristics that are used in criteria for record selection include measures of response spectral shape characteristics and, for near-source record sets, pulsive characteristics of ground motion caused by rupture directivity effects.
Introduction
This paper summarizes criteria and guidelines currently being utilized in the formation of
a Design Ground Motion Library (DGML). The objective of the DGML project is to create an electronic library of selected sets of recorded ground motion acceleration time histories suitable for use by engineering practitioners for time-history dynamic analyses of various facility types in California and other parts of the western United States. The DGML project is jointly sponsored by the California Strong Motion Instrumentation Program (CSMIP) and the Pacific Earthquake Engineering Research Center-Lifelines Program (PEER-LL). The DGML is currently limited to recorded time histories from shallow crustal earthquakes of the types that occur in the western United States. Time histories recorded during subduction zone earthquakes will not be part of the Library during this project. However the project sponsors envision that future development of the DGML will add records from subduction zone earthquakes (appropriate for these types of earthquakes occurring in northwest California, Oregon, Washington, and Alaska) and will also supplement recorded motions with time histories simulated by ground motion modeling methods.
Initial criteria and guidelines for the DGML were developed during late 2002 and 2003. In the spring of 2003, the DGML project was put on hold because of improvements being made to the PEER strong motion data base, which is a data base of strong motion recordings obtained by CSMIP, USGS, and other strong motion network operators. As part of the PEER-LL’s Next Generation of Attenuation Relationships (NGA) project, a large number of records have been added to the ground motion data base along with an expansion of the supporting information on the earthquake sources, travel path, and site conditions associated with the records. The PEER-LL’s strong motion database has been compiled using a systematic quality assurance review
1
SMIP04 Seminar Proceedings
process. This expanded data base is an improved resource from which to select records for the DGML. The data base will be completed in May 2004, and the Library will therefore be completed in the next few months. The criteria and guidelines for developing the Library have been revised and are described herein.
The principal criteria being developed for the DGML pertain to the selection of the records and the formation of record sets for the Library. This paper focuses mainly on these criteria. However, two other aspects of the Library will also be briefly discussed—the quantification of parameters of the records and supporting information to be included for records placed in the Library; and guidelines for utilization of record sets.
The principal strategy in conducting the project is to utilize a team of experts in the selection and use of time history records to develop the criteria for the DGML, select the records for the DGML using these criteria, and develop utilization guidelines. Accordingly, a multi-disciplinary project team of practitioners and researchers in structural engineering, geotechnical engineering, and seismology is conducting the project. The team comprises expertise in the time history dynamic analysis of buildings, bridges, dams, other heavy civil structures, lifeline structures and systems, and base isolated structures. The project team includes the following organizations and individuals: Geomatrix Consultants, Inc., prime contractor (Maurice Power, Robert Youngs, Faiz Makdisi, and Chih-Cheng Chin); Simpson Gumpertz & Heger, Inc. (Ronald Hamburger and Ronald Mayes); T.-Y. Lin International (Roupen Donikian); Quest Structures (Yusof Ghanaat); Pacific Engineering & Analysis (Walter Silva); URS Corporation (Paul Somerville); Earth Mechanics (Ignatius Po Lam); Professor Allin Cornell, Stanford University; and Professor Stephen Mahin, University of California, Berkeley.
Library Concept
Based on input from the project sponsors, the DGML is to be distinctly different from a
ground motion data base. Data bases, such as those of PEER, COSMOS, CSMIP, and USGS, contain large numbers of time history records but do not provide guidance on how to select records for specific application. On the other hand, the DGML will contain small groups of time history records that, based on the criteria and judgment of the project team, are considered to be suitable for use for defined categories of the seismic hazard environment and structure characteristics.
Although record sets for the DGML are selected based on criteria and judgment involving relatively few seismological, ground motion, and site parameters, many more parameters will be quantified or characterized for the records placed in the Library. These parameters include ground motion parameters of the records and characteristics of the earthquake sources, source-to-site travel paths, and site conditions that resulted in the records. This is done to fully describe the records and provide additional information that may be considered when using the records. For example, these additional parameters could be considered in evaluating results from structural analysis for different records in a set.
2
SMIP04 Seminar Proceedings
Having selected a record set from the Library, the user would then scale each record to the level of the design response spectrum for the project site. Scaling of records will be addressed in the utilization guidelines.
Criteria for selecting records and forming record sets for the DGML Overview of Criteria and Process
The criteria and process for selecting records and forming record sets for the DGML is fundamentally related to the characteristics of the seismic environment and ground motions of the design earthquake. Record sets are formed for ranges of earthquake magnitudes (M) and closest source-to-site distances (R) that encompass magnitudes and distances of design earthquakes that are either selected for a deterministic analysis or found to be the dominant contributors to the site hazard through deaggregation of a probabilistic seismic hazard analysis (PSHA). Furthermore, record sets are separately formed for ground motion records recorded on rock or soil. The different magnitude and distance ranges together with the site classification (S) are termed magnitude-distance-site classification (M-R-S) bins. In application, a user of the Library selects a set or sets of records from the M-R-S bin that includes the M, R, and S for his design earthquake.
Spectral shape over a period range of significance to structural response has been found to be closely correlated to inelastic structural response and behavior in studies by PEER and PEER-LL (e.g. Shome et al. 1998; Cordova et al. 2001; Luco and Cornell 2003; Bazzurro and Luco 2003; Cornell et al. 2003; Jalayer 2003; Baker and Cornell 2004; Luco and Bazzurro 2004). The period range may include periods shorter than the fundamental structure period because of higher mode effects and periods longer than the fundamental structure period because of structure softening to longer periods in the inelastic range. Therefore, period ranges are defined encompassing period ranges of significance (period-range sub-bins), and records are selected for each period-range sub-bin within the M-R-S bins as a function of the spectral shape of the records over the defined period range in comparison to the median and variation of spectral shapes for all the records (from the entire data base) in the M-R-S bins.
In the near-source region, the criteria for selecting records also considers the effects of rupture directivity causing strong time-domain pulsive ground motion characteristics (e.g. pulse velocity, pulse period, and number of pulses). These near-source characteristics of ground motion have been shown to be very damaging to structures in studies by Krawinkler and Alavi (1998). Studies by Bazzurro and Luco (2003) have not shown a significant improvement in damage predictability associated with pulse period or velocity over the correlation with response spectral characteristics alone for a data set of spectrum-matched time histories.
The following paragraphs briefly describe the criteria for definition of the M-R-S bins
and the period-range sub-bins and the selection of records and formation for record sets for the DGML. This description is followed by an example indicating how the criteria may be applied.
3

SMIP04 Seminar Proceedings
Definition of Magnitude-Distance-Site Conditions (M-R-S) bins
The general criteria for defining the magnitude and distance ranges of the M-R-S bins are the following:
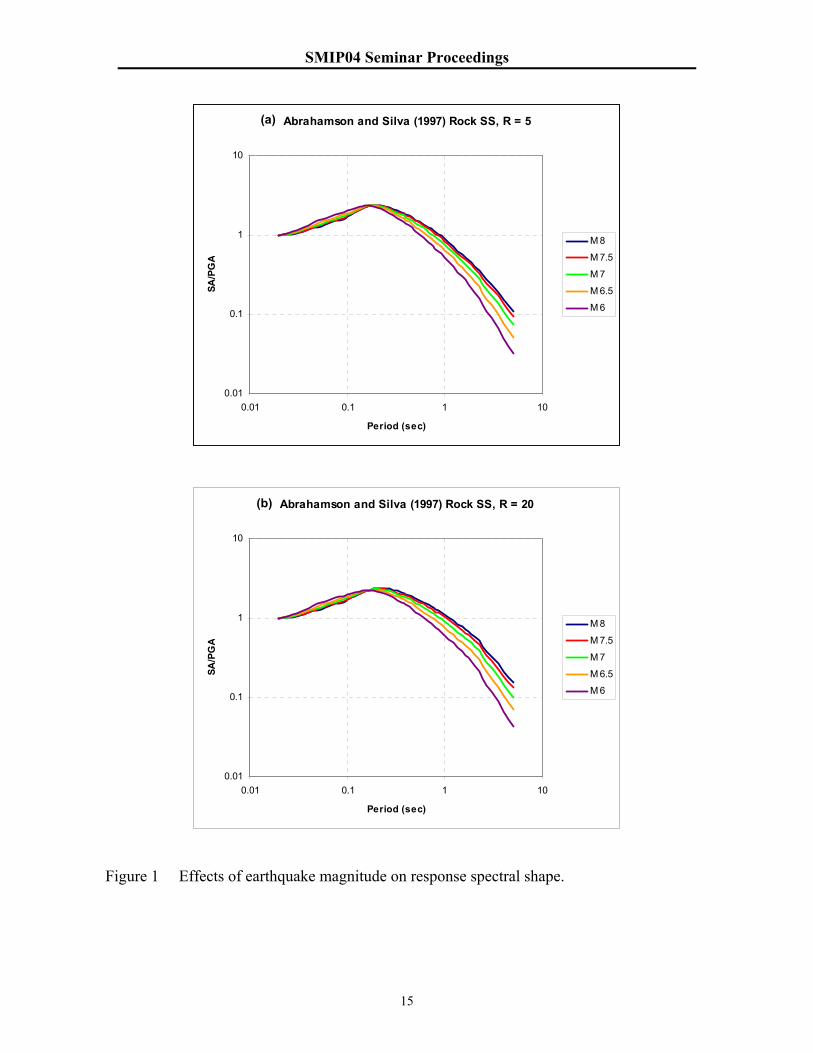
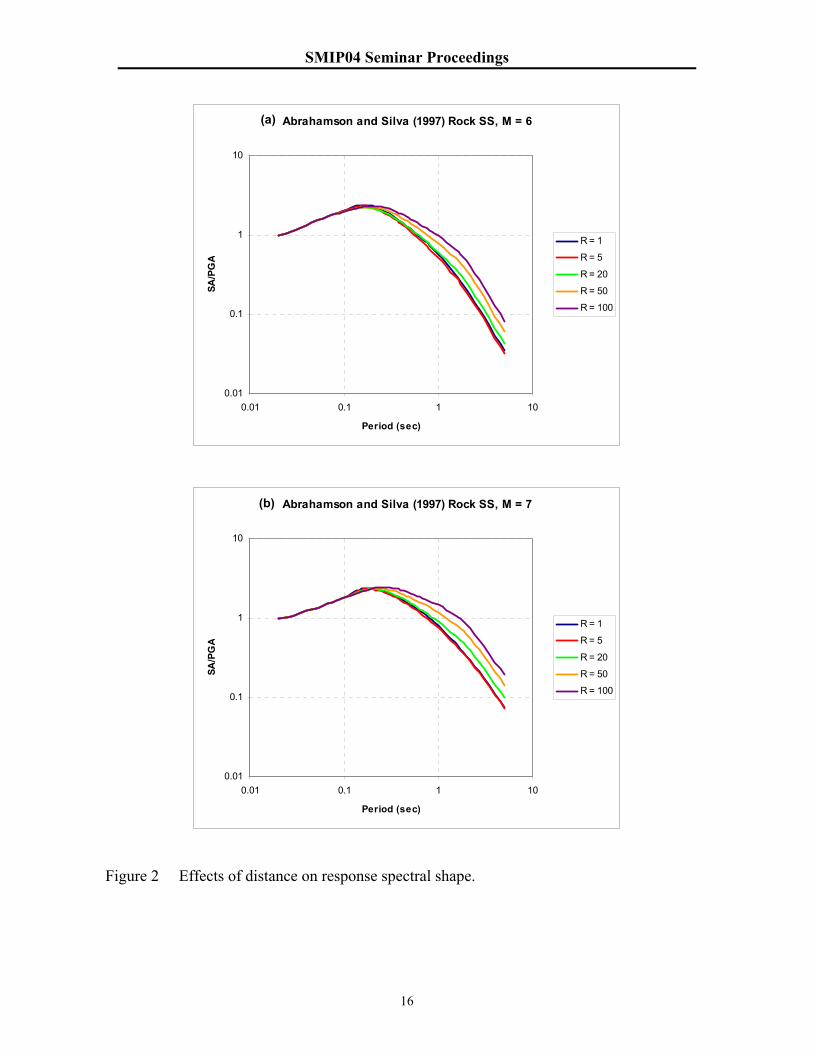
(1) Magnitudes and distance ranges for the bins should be selected such that they define systematic differences in response spectral shapes between the bins. Figures 1 and 2 indicate the effects of magnitude and distance on response spectral shape using the ground motion attenuation relationship of Abrahamson and Silva (1997). Relationships such as shown on these figures as well as statistical analysis of the records in the data base within selected magnitude and distance ranges will be used to define the M and R limits for each bin. For site conditions, a simple soil or rock criteria has been adopted. Further refinement in site classification could be done, but are not adopted for the Library, because it would reduce the number of records to choose from in each bin and because a refined classification is not confidently determined at many recording station sites. (2) The differences in M and R for each bin should be large enough to have an adequate record population to choose from but small enough so that “unreasonable” amounts of scaling of records to the design spectrum would not be required. (3) The farthest distance for near-source M-R-S bins should be large enough to capture records potentially having significant near-source ground motion characteristics. (4) The farthest M-R-S bins may be selected on the basis of ground motion amplitudes (using ground motion attenuation relationships) and the potential use of the records for time history analysis. Time history analyses are unlikely to be done where design ground motions have very low amplitudes. Similarly, the need for M-R-S bins for M less than 6 should be evaluated on the basis of ground motion amplitudes and the likelihood that time history analysis would be done for design earthquakes having M less than 6.
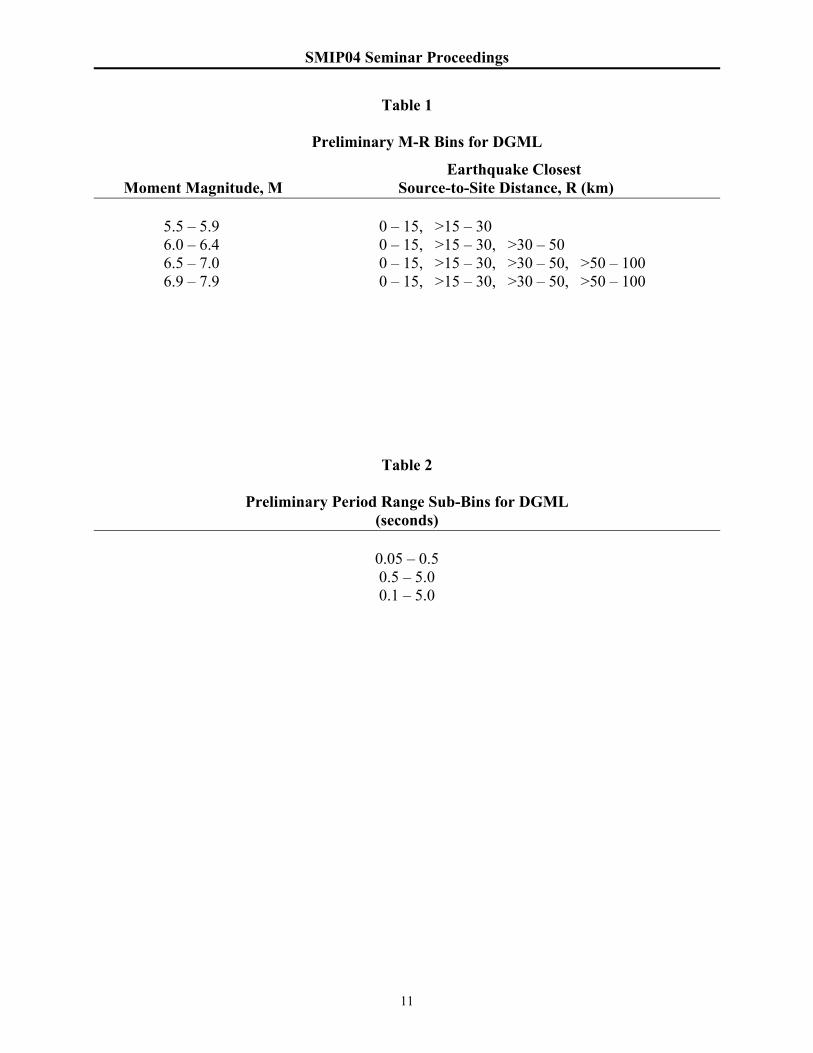
These criteria will be applied to the new data base in the near future. A preliminary selection of M-R-S bins based on judgment and experience is shown in Table 1. The overlapping magnitude of 6.9 in the two highest magnitude bins is done to increase the number of earthquakes and records in the largest magnitude bins. Having overlapping magnitudes in other bins is also being considered. Definition of Period-Range Sub-bins
The definition of period ranges appropriate for evaluating response spectral shapes is based on evaluation of typical period ranges of significance for different structure types. Another consideration is that the period bands should be wide enough that differences in spectral shapes between records would be significant. A third consideration is that some designers might prefer a set of time histories selected on the basis of the entire response spectrum band (say, from 0 to 5 seconds) The judgment of the project team resulted in a short-period band, a long-period band, and a broad band encompassing short and long periods. These bands are shown in Table 2. Consideration is also being given to one or two other bands. Furthermore, it is possible that
4
SMIP04 Seminar Proceedings
records selected in an M-R-S bin for one period band might also be appropriate records for one or more other period bands, thus effectively expanding the number of period-range sub-bins. Definition of Criteria for Evaluating Response Spectral Shape Characteristics Over a Period Band The spectral shape of the records in an M-R-S bin and for the period ranges of the sub-bins is compared to the median spectral shape for the bin and sub-bin. The median spectral shape is determined by statistical analysis of the response spectra for all the records in the bin. In the near-source bins, spectral shapes are expected to vary for fault-normal and fault-parallel components, and this must be evaluated for the bins. These spectral shapes will be smoothed to remove small-scale irregularities using ground motion attenuation relationships to guide the smoothing.
Before evaluating spectral shape characteristics of the records relative to a target median shape for a bin, the records are first scaled to the level of the smooth median spectra. The scaling criterion is that the spectrum of the record has equal differences above and below the median spectrum over the period range for the defined sub-bin. Two measures are then used to calculate and evaluate response spectral shapes of records in comparison to the median spectral shape. The first measure is the mean squared error (MSE) of the differences between the median spectrum and the spectrum of the record after scaling. This measure determines the overall “fit” of the spectrum of the record to the target median spectral shape over the period band. Records with lower MSE more closely match the target spectrum. The equations for scaling and for determining the MSE of a record are given below.
∑ε=ε=i
itn)(1 FactorScale , and
( )∑ ε−ε=i
itn2
)(1MSE ,
where
=ε )(
)(ln)( recording
target
i
ii tSA
tSAt and is period. it
The number of periods n is determined by specifying equally spaced values of ln(t) using fifty points per period decade.
The second measure of the spectral shape of the record relative to the median shape is the
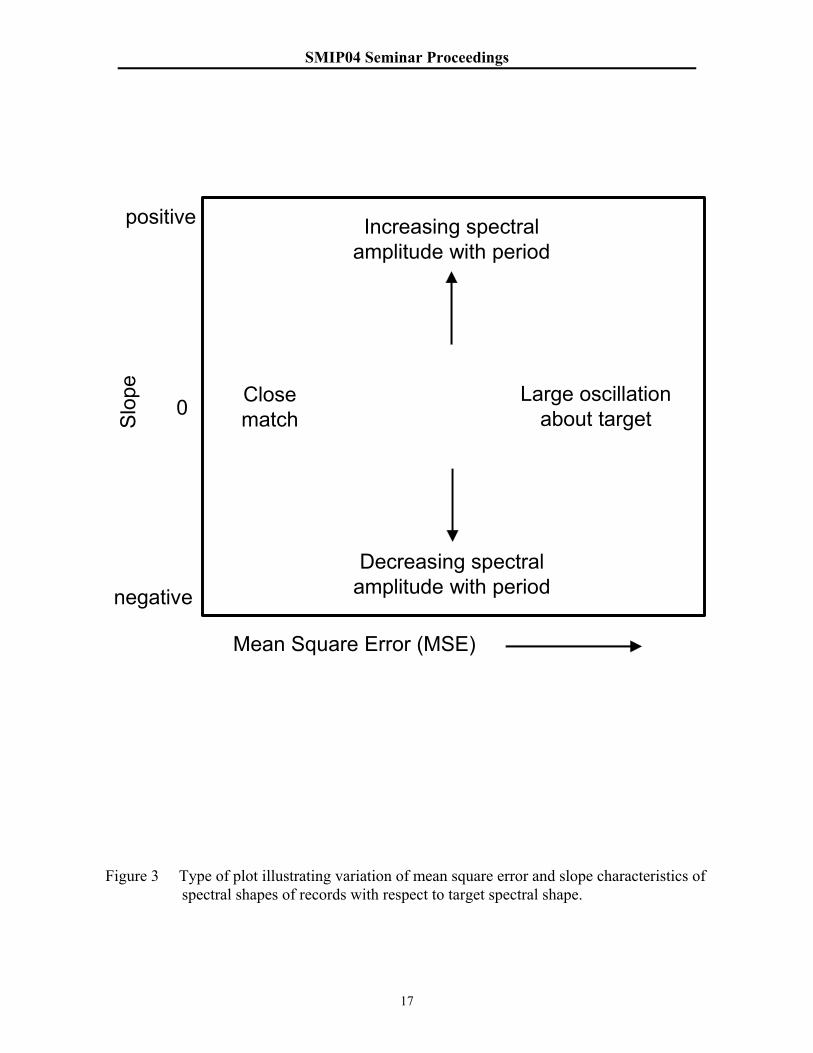
“slope” of the record spectrum compared to the slope of the median spectrum across the period band. It is determined by regressing on the spectral differences with period between an actual record spectrum and the median spectrum. Spectra with larger slopes (positive or negative) relative to the median spectrum are more skewed relative to the median shape. The equations for determining the slope of the spectra of the records are given below.
5
SMIP04 Seminar Proceedings
[ ] [ ][ ]
∑
∑
∑
=
−
−×−=
ii
ii
iii
tn
t
tt
ttt
)ln(1)ln( where
)ln()ln(
)()ln()ln(Slope 2
εε
The MSE and the slope of the spectral shape of a record relative to the target spectral shape can be displayed by plotting the slope versus MSE as shown schematically in Figure 3. Indicated on the figure are regions of the MSE-slope space representing various qualitative descriptions of the degree of agreement between the spectral shape of the individual record and the target spectrum. Development of Record Sets
The following paragraphs summarize different elements of criteria for forming the record sets having established the record binning criteria and the spectral shape characteristics as described above. Criteria for Record Selection as Related to the Number of Records in the Set. Two record sets will generally be defined for each period-range sub-bin within an M-R-S bin. One set will have three records and the second will have ten records. The choice of these numbers of records partly reflects current building code criteria and partly the judgment of the project team with regard to size of record sets relative to the interpretation of building responses when sets of different sizes are used.
For record set sizes of three, the criterion for record set selection would be the closest fit, with respect to MSE and slope of spectral shapes, of the record spectra to the target median spectra. It is recommended, consistent with building code requirements, that when three records are used in time history dynamic analysis, the largest responses given by the three analyses be used for design.
For record set sizes of ten, the criterion for record set selection is that the record sets selected have spectral shapes that vary from the median shape in a similar way as the variation for all the records in the bin. Thus records can be selected by plotting the MSE and slope of each record in the bin in a plot similar to Figure 3, and then selecting records that reasonably sample each region of the plot, considering both the scatter of data throughout the plot and the density of data in sub regions of the plot. Consistent with minimum building code requirements, the user could remove up to three records from the ten provided. Also consistent with the building code requirements, as a guideline, the average responses from time history analyses using seven to ten records could be used in design.
Note that the criteria for record set selection summarized in this section are appropriate for record sets for M-R-S bins at distances greater than the near-source bins. Additional criteria for record sets for the near-source bins are described in a later section.
6
SMIP04 Seminar Proceedings
Supplemental Criteria as Related to Two-Dimensional (2D) or Three-Dimensional (3D) Time History Analyses. For 2D time history analyses where only one horizontal component is required, a record set consists of a set of three or ten horizontal components. The vertical components (if needed) are those for the records selected on the basis of the horizontal component characteristics. Vertical components are scaled by the same factors as the horizontal components of the records. For 3D analyses where two horizontal components are required, the record set consists of both horizontal components scaled together by the same factor. The MSE for the record is determined based on scaling to obtain the minimum MSE for both horizontal components taken together. The slope is determined as the average slope for the two components. The vertical components (if needed) are scaled by the same factors as the horizontal components. Additional Criteria for Near-Source Record Sets. In addition to the criteria based on the representativeness of the spectral shape of the selected records, directivity characteristics of the records in the near-source M-R-S bins must also be considered for period ranges that would be expected to exhibit near-source effects on ground motions. Because near-source effects are generally thought to be prominent only for periods greater than 0.5 seconds, directivity considerations would affect only those sub-bins having periods beyond 0.5 seconds. Only record sets consisting of ten records, each containing a fault-normal and a fault-parallel horizontal component (as well as a vertical component), will be formed for near-source sub-bins requiring considerations of directivity; the project team judged that three records would not adequately sample directivity and fault-normal to fault-parallel variations. Separate fault-normal and a fault parallel target spectra will be defined for the near-source bins based on the statistics of the fault-normal and fault-parallel components, respectively, for the records in the bin.
Two record sets are being considered to be formed for each sub-bin requiring directivity considerations. The records in one set would have directivity considered to be representative of locations subjected to rare design earthquakes in high-seismic areas. Deaggregation on directivity from PSHA’s from such locations indicates that moderate to strong forward directivity, as characterized by the seismological directivity parameters defined by Somerville et al. (1997), may be expected. Thus, most records selected will have been recorded under conditions of moderate to strong forward directivity. For designers who favor the incorporation of available recordings exhibiting the strongest directivity effects with regard to strong velocity pulses and pronounced fault-normal to fault-parallel ground motion ratios, a second set will be formed that includes only those records. Example of Selection of Record Set
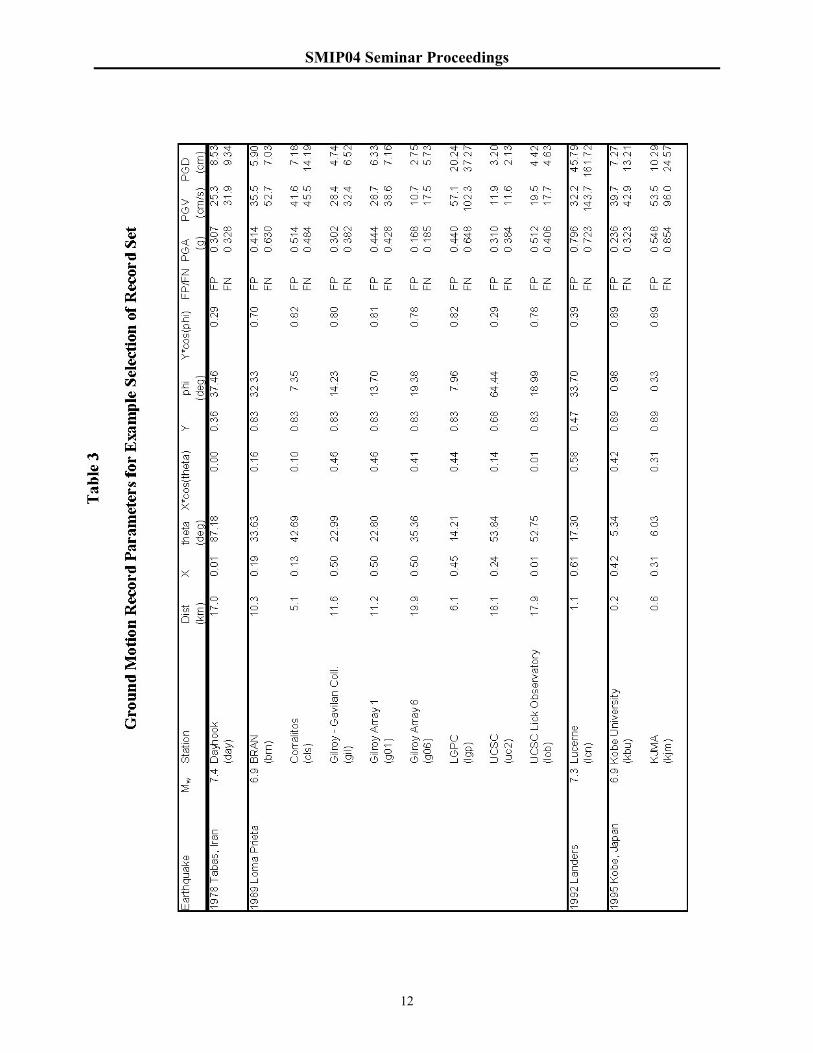
To illustrate the application of the criteria discussed above, an example is presented using the existing PEER data base. The development of actual record sets will be accomplished using the updated PEER-LL NGA data base, as discussed previously. The example is for a near-source M-R-S bin of magnitude equal to or greater than 6.9, distance 0 to 20 km, and rock site conditions. (To increase the sample size of records for this example, the distance range was extended to 20 km). The record set is summarized in Table 3 and consists of 12 records (24 horizontal components). It is noted that the final data base for this M-R-S bin will be
7
SMIP04 Seminar Proceedings
substantially larger and will include records from several additional earthquakes, including the 1999 earthquakes in Duzce and Kocaeli, Turkey , 1999 Chi-Chi, Taiwan earthquake, 2002 Denali, Alaska earthquake, and 1980 Irpinia, Italy earthquake.
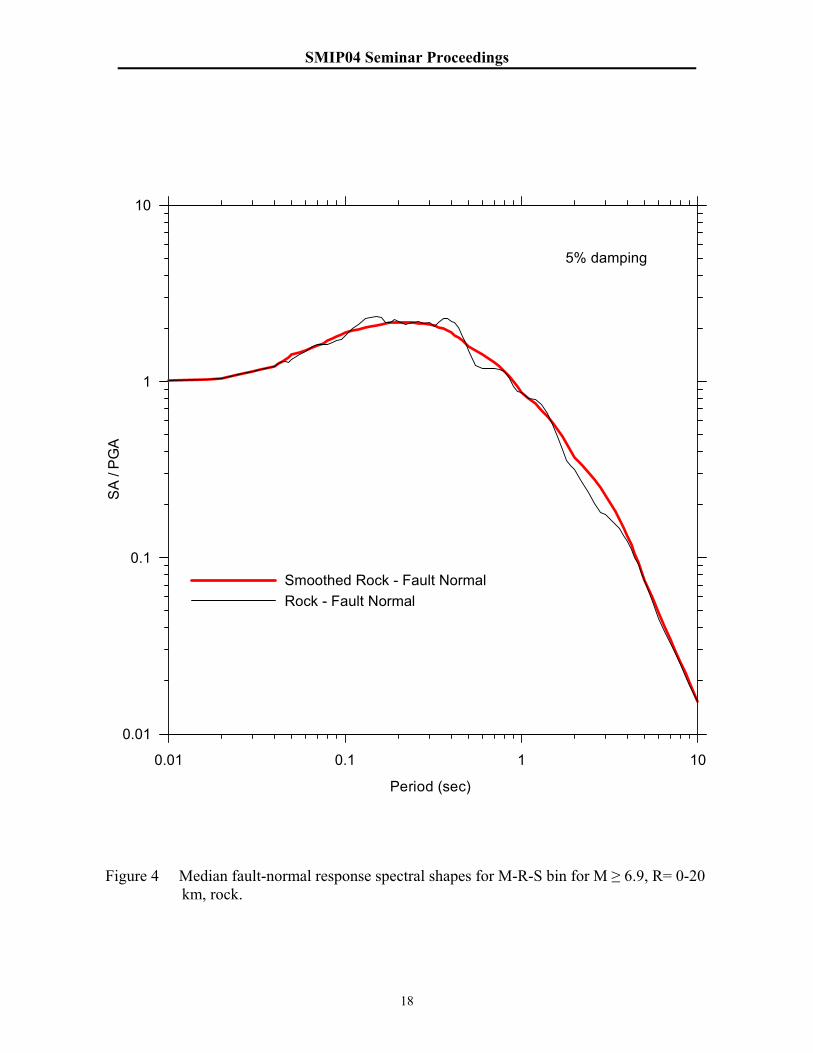
The median spectral shape determined for the M-R-S bin is shown in Figure 4 for the fault-normal component. For purposes of this example, the shape was smoothed using a non-parametric smoothing operator, as illustrated in Figure 4. Spectral shape characteristics were determined for the records for a period-range sub-bin of 0.5 to 4.0 seconds.
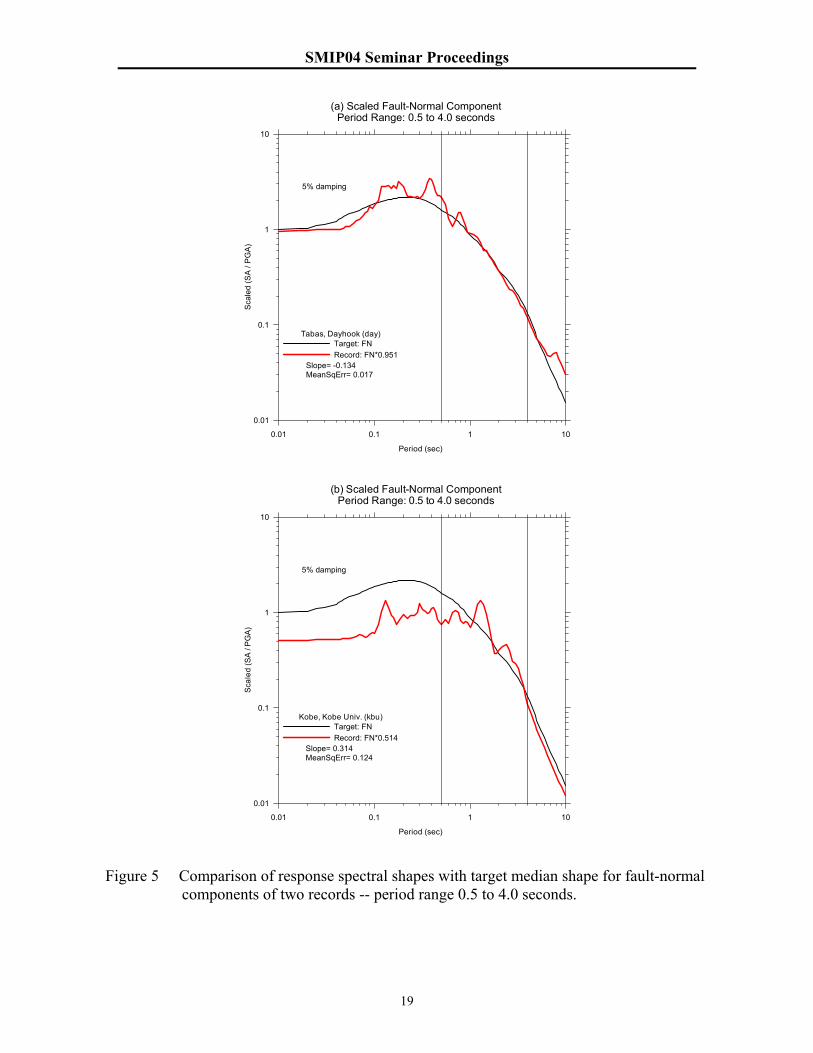
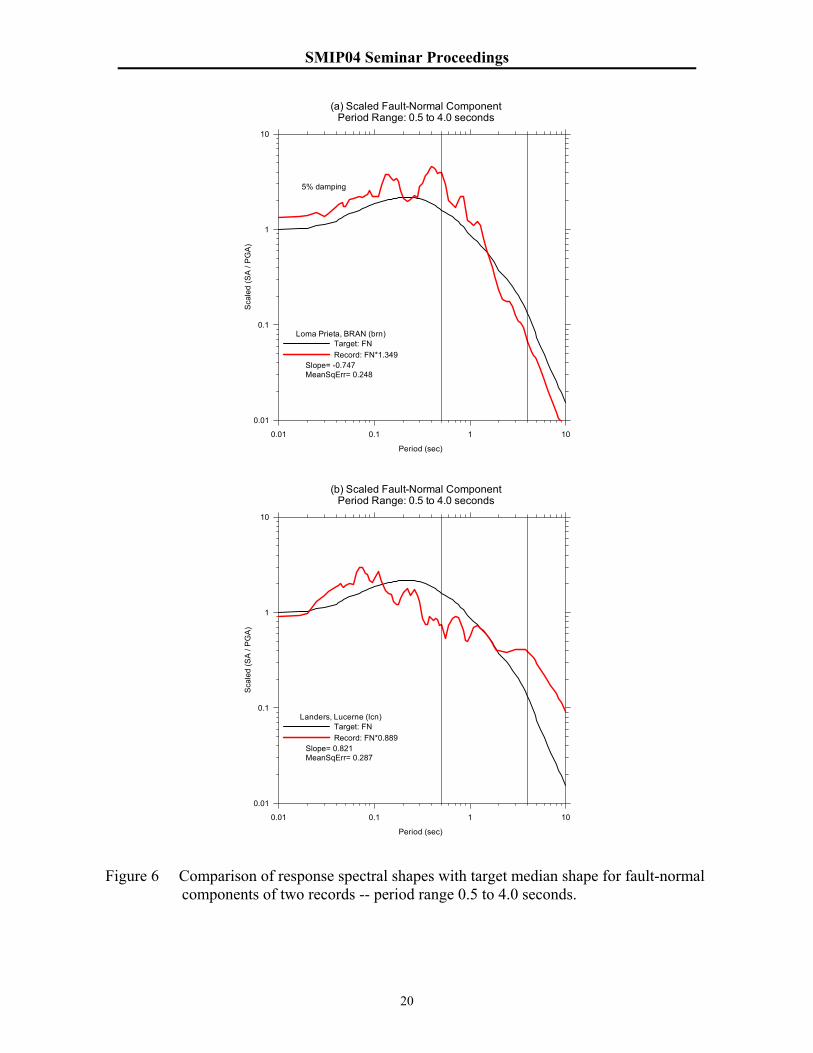
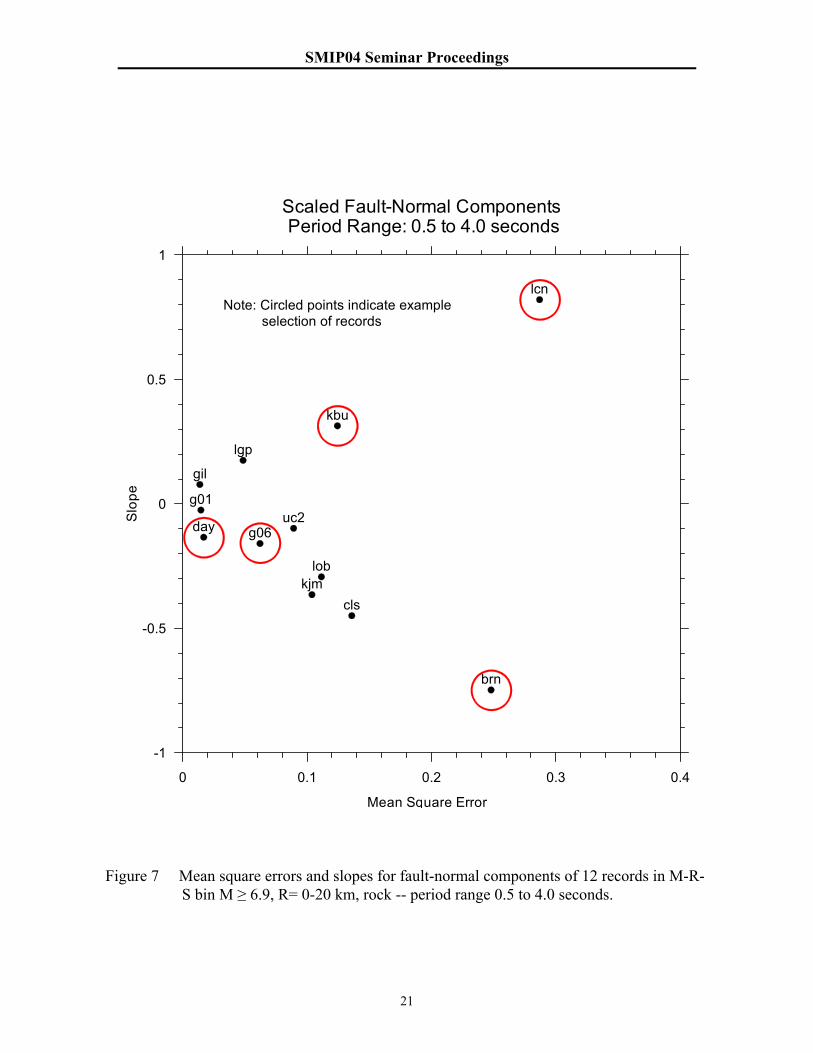
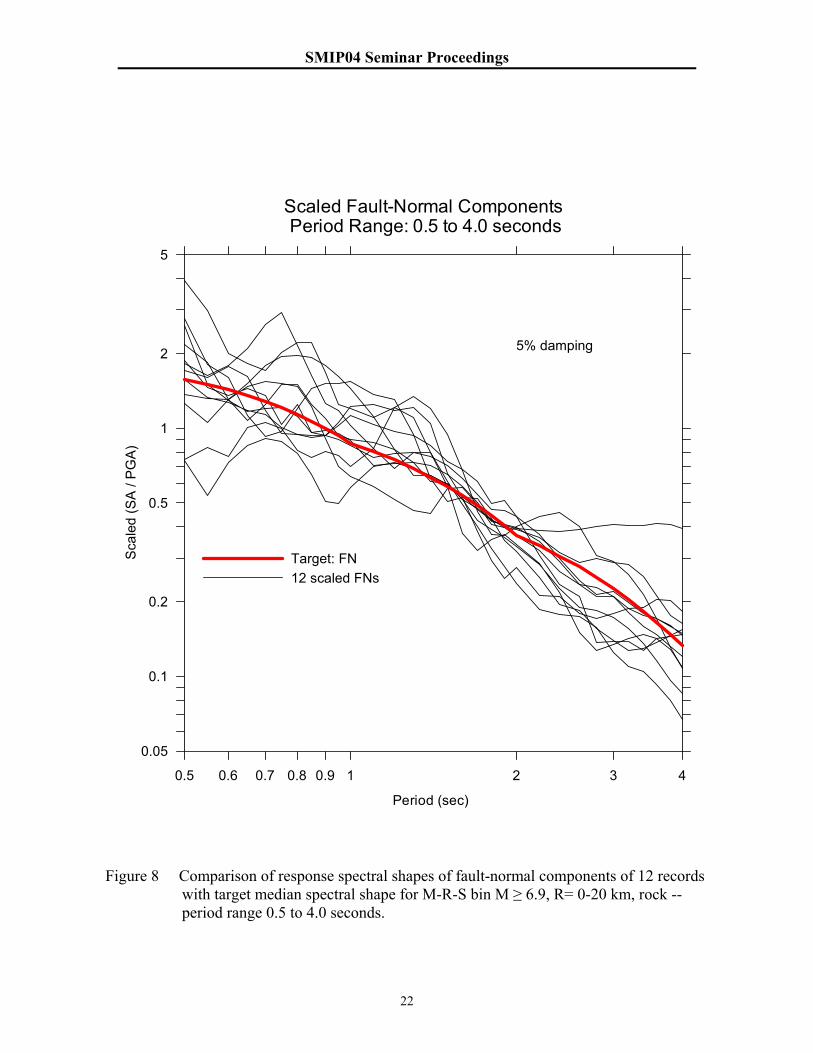
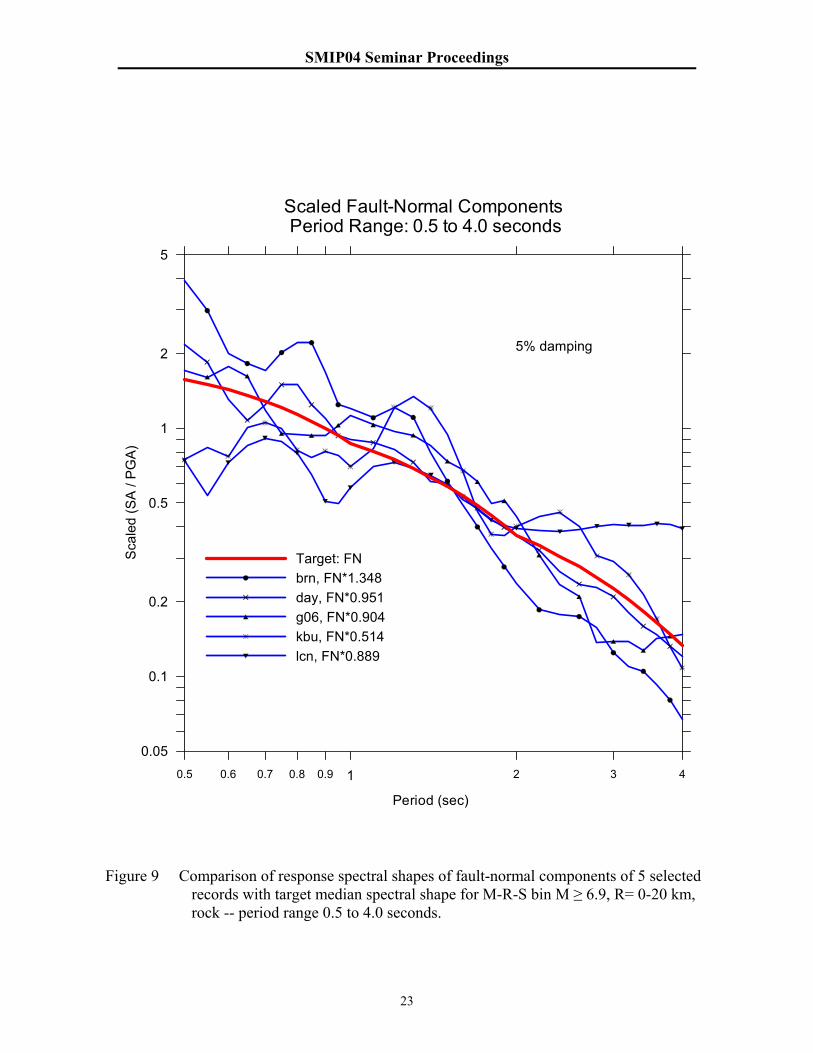
Spectral shapes for two of the records after scaling are compared with the median shape in Figure 5 for the fault-normal component of the Tabbas, Dayhook (day) record and the Kobe University (kbu) record. For the period range of 0.5 to 4.0 seconds, the Dayhook record illustrates a close fit to the target median spectrum based on small values of MSE and slope. The Kobe University record illustrates a moderate MSE and positive slope. Figure 6 compares the spectral shapes of the fault-normal components of the Loma Prieta BRAN (brn) and the Landers Lucerne (lcn) records with the median shape. These spectral comparisons illustrate large MSEs and large slopes for the two records. Figure 7 presents a plot of MSE vs. slope for the fault-normal components. This plot shows the range of fit of the spectra of the records with respect to the target median spectrum in terms of MSE and slope. A “by-eye” selection of five records was made to illustrate how a limited number of records (not the planned full size of ten records because of the limited number of records in the preliminary data base) can be made to approximate the variability of the data base spectral shapes in the M-R-S bin. The “selected” records are denoted by the circled MSE/slope data points in the figure. For the period range 0.5-4.0 second, Figure 8 shows the fit of the spectra of the records with respect to the target median spectrum for all twelve records for the fault-normal component, whereas Figure 9 shows the fit of just the five selected components. It can be seen that the variability of fit is similar for the two plots. This example is limited to illustrating the application of spectral fit criteria in the selection of a data set. Although the seismological directivity parameters of Somerville et al. (1997) are shown in Table 3 as the Xcos(theta) and Ycos(phi) values, these parameters or the time-domain pulsive characteristics of the records were not used in the selection process for the example. For selection of actual record sets for near-source bins, the directivity criteria summarized earlier will be as or more important than the spectral shape criteria in the selection process.
Quantification of parameters for records selected for the DGML
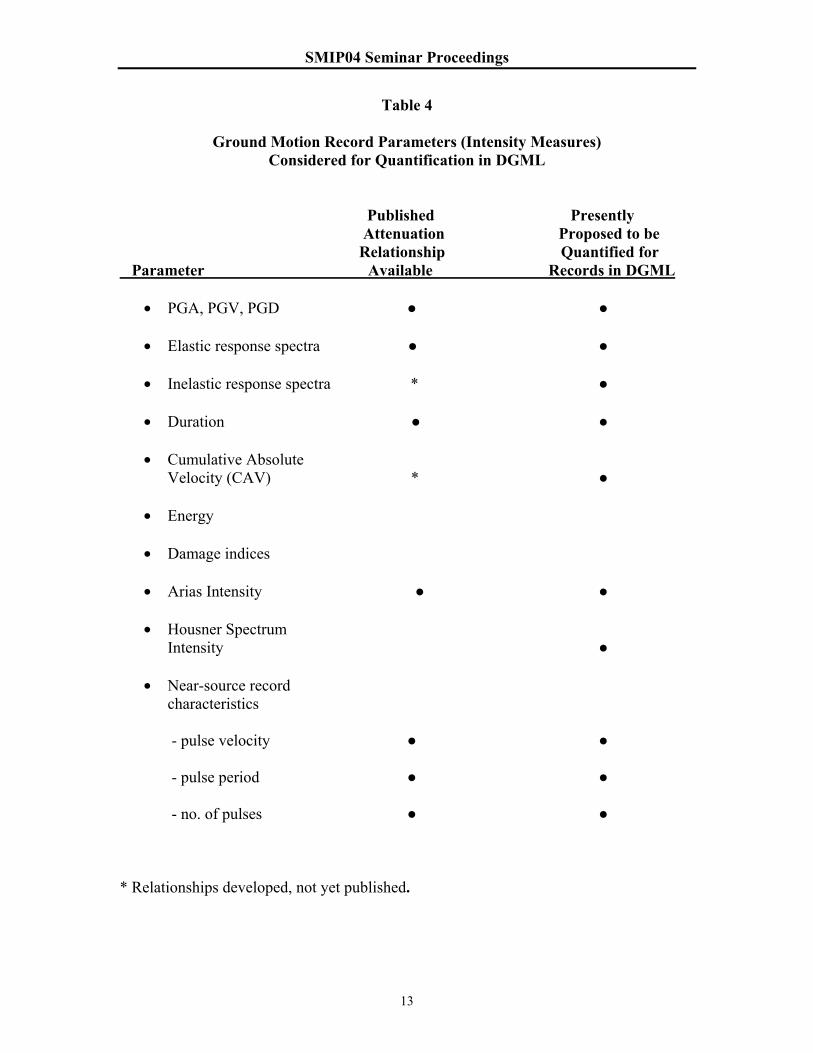
Parameters of the ground motion records selected for the DGML as well as supporting information (metadata) about the earthquake source, path, and site conditions that are of interest to and possible use by users of the Library will be included for records placed in the Library. Ground motion record parameters being considered for quantification include those summarized in Table 4. It is desirable but not essential that there be published ground motion attenuation relationships for parameters to be quantified so that the parameter values for records in the Library could be compared with the statistical variation in parameter values for similar M, R, and S parameters. Parameters for which published attenuation relationships currently exist are indicated in Table 4. In addition, an attenuation relationship for inelastic response spectral values has recently been developed by Tothong and Cornell (2004), and a relationship for cumulative absolute velocity (CAV) has been developed by Mitchell and Kramer (2004).
8
SMIP04 Seminar Proceedings
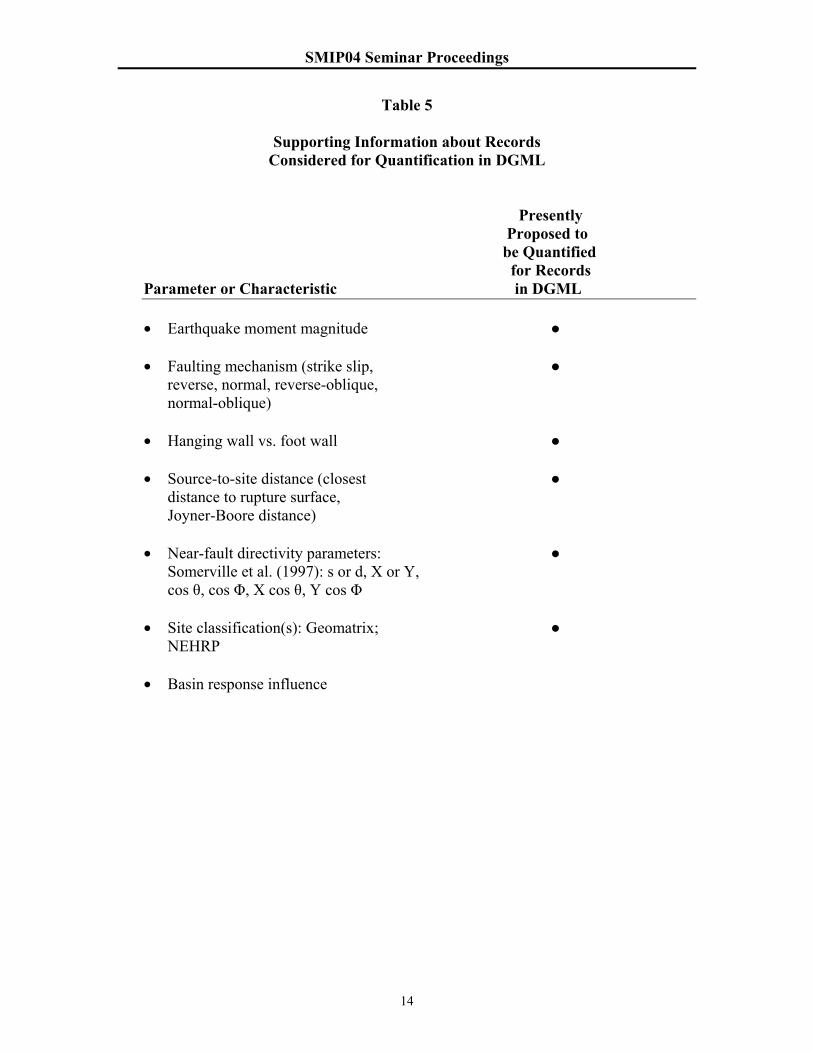
Parameters which the project team presently proposes to quantify are also indicated in Table 4. Similarly, supporting information about the records presently proposed to be quantified for records in the DGML is summarized in Table 5. All these parameters and others will be available from the expanded PEER data base.
Utilization Guidelines for the DGML
Utilization guidelines will be prepared to provide guidance to the engineering practitioner
on the use of the DGML. Topics that will be covered include: (1) Explanation of the criteria, judgments, and processes that were used in developing the various record sets for the DGML so that the Library can be used with full knowledge of the bases on which it was developed. (2) Guidance on the size of record sets as related to the interpretation of time history analysis results for design applications, e.g. interpretation of results for record sets consisting of 3 records or seven to ten records. (3) Any limitations on scaling of records to the design response spectrum. Several studies have been conducted to evaluate whether the amount of scaling of a recorded motion biases the calculated inelastic response of a structure, e.g. Shome et al. (1998), Cornell et al. (2003), and Luco and Bazzurro (2004). Because the records will be selected for the DGML to have certain characteristics considered appropriate for formation of record sets as discussed in this paper, it is not anticipated that limitations on scaling of the records would be recommended. However, this issue will be further examined and results of research on scaling will be discussed as appropriate. (4) Guidance on typical period increments for evaluating the aggregate fit of scaled spectra to a design spectrum and discussion of the degree of fit typically specified in practice.
References Abrahamson, N.A., and Silva, W.J., 1997, Empirical response spectral attenuation relations for shallow crustal earthquakes: Seismological Research Letters, v. 68, no. 1, p. 94-127. Baker, J.W. and Cornell, C.A. 2004, Choice of a vector of ground motion intensity measures for seismic demand hazard analysis, Proceedings 13th World Conference on Earthquake Engineering, Vancouver, Canada, August (in press). Bazzurro, P. and Luco, N. 2003, Parameterization of non-stationary time histories, Draft Report for Task 1G00 to PEER-Lifelines Program. Cordova, P.P., Mehanny, S.S.F. Deierlein, G.G., Cornell, C.A., 2000, Development of a two-parameter seismic intensity measure and probabilistic assessment procedure, Proceedings of the 2nd U.S.-Japan Workshop on Performance-Based Seismic Earthquake Engineering Methodology for Reinforced Concrete Building Structures, Sapporo, Japan, pp. 195-214.
9
SMIP04 Seminar Proceedings
Cornell, A., Jalayer, F., Iervolino, I., and Baker, J., 2003, Record selection for nonlinear time history analysis, Presentation at PEER Annual Meeting, Palm Springs, California. Jalayer, F., 2003, Direct probabilistic seismic analysis: implementing non-linear dynamic assessments, PhD thesis, Department of Civil and Environmental Engineering, Stanford University. Krawinkler, H., and Alavi, B., 1998, Development of improved design procedures for near-fault ground motions, Proceedings SMIP98 Seminar on Utilization of Strong-Motion Data, Oakland, California Strong Motion Instrumentation Program, California Geological Survey, p. 21-41. Luco, N. and Bazzurro, 2004, Effects of ground motion scaling on nonlinear structural response, Presentation at PEER Annual Meeting, Palm Springs, CA, February. Luco, N. and Cornell, C.A., 2003, Structure-specific scalar intensity measures for near-source and ordinary earthquake ground motions, paper under revision for Earthquake Spectra. Mitchell, R.A. and Kramer, S., 2004, Ground motion intensity measures for liquefaction hazards evaluation, paper in preparation. Shome, N. Cornell, C.A., Bazzurro, P., and Carballo, J.E., 1998, Earthquake records and nonlinear response, Earthquake Spectra, v. 14, no. 3, p. 469-500. Somerville, P.G., Smith, N.F., and Graves, R.W., 1997, Modification of empirical strong ground motion attenuation relations to include the amplitude and duration effects of rupture directivity: Seismological Research Letters, v. 68, no. 1, p. 199-222. Tothong, P. and Cornell, C.A., 2004, Ground motion prediction of inelastic spectral displacement, Bi-Annual Affiliates Meeting, John A. Blume Earthquake Engineering Center, Stanford University, April 30.
10
SMIP04 Seminar Proceedings
Table 1
Preliminary M-R Bins for DGML
Earthquake Closest Moment Magnitude, M Source-to-Site Distance, R (km) 5.5 – 5.9 0 – 15, >15 – 30 6.0 – 6.4 0 – 15, >15 – 30, >30 – 50 6.5 – 7.0 0 – 15, >15 – 30, >30 – 50, >50 – 100 6.9 – 7.9 0 – 15, >15 – 30, >30 – 50, >50 – 100
Table 2
Preliminary Period Range Sub-Bins for DGML (seconds)
0.05 – 0.5 0.5 – 5.0 0.1 – 5.0
11
SMIP04 Seminar Proceedings
12
SMIP04 Seminar Proceedings
Table 4
Ground Motion Record Parameters (Intensity Measures) Considered for Quantification in DGML
Published Presently Attenuation Proposed to be Relationship Quantified for Parameter Available Records in DGML
• PGA, PGV, PGD ● ●
• Elastic response spectra ● ●
• Inelastic response spectra * ●
• Duration ● ●
• Cumulative Absolute Velocity (CAV) * ●
• Energy
• Damage indices
• Arias Intensity ● ●
• Housner Spectrum Intensity ●
• Near-source record characteristics
- pulse velocity ● ● - pulse period ● ● - no. of pulses ● ● * Relationships developed, not yet published.
13
SMIP04 Seminar Proceedings
Table 5
Supporting Information about Records Considered for Quantification in DGML
Presently Proposed to be Quantified for Records
Parameter or Characteristic in DGML • Earthquake moment magnitude ●
• Faulting mechanism (strike slip, ● reverse, normal, reverse-oblique, normal-oblique)
• Hanging wall vs. foot wall ●
• Source-to-site distance (closest ● distance to rupture surface, Joyner-Boore distance)
• Near-fault directivity parameters: ● Somerville et al. (1997): s or d, X or Y, cos θ, cos Φ, X cos θ, Y cos Φ
• Site classification(s): Geomatrix; ●
NEHRP
• Basin response influence
14
SMIP04 Seminar Proceedings
Abrahamson and Silva (1997) Rock SS, R = 5
0.01
0.1
1
10
0.01 0.1 1 10
Period (sec)
SA/P
GA
M 8
M 7.5
M 7
M 6.5
M 6
(a)
Abrahamson and Silva (1997) Rock SS, R = 20
0.01
0.1
1
10
0.01 0.1 1 10
Period (sec)
SA/P
GA
M 8
M 7.5
M 7
M 6.5
M 6
(b)
Figure 1 Effects of earthquake magnitude on response spectral shape.
15
SMIP04 Seminar Proceedings
Abrahamson and Silva (1997) Rock SS, M = 6
0.01
0.1
1
10
0.01 0.1 1 10
Period (sec)
SA/P
GA
R = 1
R = 5
R = 20
R = 50
R = 100
(a)
Abrahamson and Silva (1997) Rock SS, M = 7
0.01
0.1
1
10
0.01 0.1 1 10
Period (sec)
SA/P
GA
R = 1
R = 5
R = 20
R = 50
R = 100
(b)
Figure 2 Effects of distance on response spectral shape.
16
SMIP04 Seminar Proceedings
Increasing spectral amplitude with period
Decreasing spectral amplitude with period
Close match
Large oscillation about target
positive
0
negative
Slop
e
Mean Square Error (MSE)
Figure 3 Type of plot illustrating variation of mean square error and slope characteristics of spectral shapes of records with respect to target spectral shape.
17
SMIP04 Seminar Proceedings
0.01 0.1 1 10
Period (sec)
0.01
0.1
1
10
SA
/ PG
A
Smoothed Rock - Fault Normal Rock - Fault Normal
5% damping
Figure 4 Median fault-normal response spectral shapes for M-R-S bin for M ≥ 6.9, R= 0-20 km, rock.
18
SMIP04 Seminar Proceedings
0.01 0.1 1 10
Period (sec)
0.01
0.1
1
10
Sca
led
(SA
/ PG
A)
(a) Scaled Fault-Normal ComponentPeriod Range: 0.5 to 4.0 seconds
Tabas, Dayhook (day)Target: FNRecord: FN*0.951
Slope= -0.134MeanSqErr= 0.017
5% damping
0.01 0.1 1 10
Period (sec)
0.01
0.1
1
10
Scal
ed (S
A /
PG
A)
(b) Scaled Fault-Normal ComponentPeriod Range: 0.5 to 4.0 seconds
Kobe, Kobe Univ. (kbu)Target: FNRecord: FN*0.514
Slope= 0.314MeanSqErr= 0.124
5% damping
Figure 5 Comparison of response spectral shapes with target median shape for fault-normal components of two records -- period range 0.5 to 4.0 seconds.
19
SMIP04 Seminar Proceedings
0.01 0.1 1 10
Period (sec)
0.01
0.1
1
10
Sca
led
(SA
/ PG
A)
(a) Scaled Fault-Normal ComponentPeriod Range: 0.5 to 4.0 seconds
Loma Prieta, BRAN (brn)Target: FNRecord: FN*1.349
Slope= -0.747MeanSqErr= 0.248
5% damping
0.01 0.1 1 10
Period (sec)
0.01
0.1
1
10
Sca
led
(SA
/ PG
A)
(b) Scaled Fault-Normal ComponentPeriod Range: 0.5 to 4.0 seconds
Landers, Lucerne (lcn)Target: FNRecord: FN*0.889
Slope= 0.821MeanSqErr= 0.287
Figure 6 Comparison of response spectral shapes with target median shape for fault-normal components of two records -- period range 0.5 to 4.0 seconds.
20
SMIP04 Seminar Proceedings
0 0.1 0.2 0.3 0.4
Mean Square Error
-1
-0.5
0
0.5
1
Slo
pe
brn
cls
day
g01
g06
gil
kbu
kjm
lcn
lgp
lob
uc2
Scaled Fault-Normal Components Period Range: 0.5 to 4.0 seconds
Note: Circled points indicate example selection of records
Figure 7 Mean square errors and slopes for fault-normal components of 12 records in M-R-S bin M ≥ 6.9, R= 0-20 km, rock -- period range 0.5 to 4.0 seconds.
21
SMIP04 Seminar Proceedings
1 2 30.90.80.70.60.5
Period (sec)
4
0.1
1
0.2
0.5
2
5
0.05
Sca
led
(SA
/ P
GA
)
Scaled Fault-Normal Components Period Range: 0.5 to 4.0 seconds
Target: FN12 scaled FNs
5% damping
Figure 8 Comparison of response spectral shapes of fault-normal components of 12 records with target median spectral shape for M-R-S bin M ≥ 6.9, R= 0-20 km, rock -- period range 0.5 to 4.0 seconds.
22
SMIP04 Seminar Proceedings
1 2 30.90.80.70.60.5
Period (sec)
4
0.1
1
0.2
0.5
2
5
0.05
Sca
led
(SA
/ P
GA
)
Scaled Fault-Normal Components Period Range: 0.5 to 4.0 seconds
Target: FNbrn, FN*1.348day, FN*0.951g06, FN*0.904kbu, FN*0.514lcn, FN*0.889
5% damping
Figure 9 Comparison of response spectral shapes of fault-normal components of 5 selected records with target median spectral shape for M-R-S bin M ≥ 6.9, R= 0-20 km, rock -- period range 0.5 to 4.0 seconds.
23

SMIP04 Seminar Proceedings
24


![[XLS]Permit Statistical Report - Welcome to NYC.gov | City of … · Web viewARUNKUMAR BANGALORE GEOMATRIX SERVICES INC 1018159 381 373-381 PAS ASSOCIATES LLC PETER DICAPUA 555 5](https://img.pdfslide.us/doc/110x75/5ade563a7f8b9a9a768e1aed/xlspermit-statistical-report-welcome-to-nycgov-city-of-viewarunkumar.jpg)