Embed Size (px)
Citation preview
1
b a c h
Bank for the Accounts of Companies Harmonized O U T L O O K
# 1
SMEs in European countries
(October 2013)
SMEs in European countries
BACH Outlook #1, 2013 | Website: http://www.bach.banque-france.fr/?lang=en 2
Disclaimer
_________________________________________________
This analysis is based exclusively on BACH data. Therefore, the situation reflected here is primarily that of
the national samples, which, although being suitably good, may not necessarily represent the total of
enterprises in each country, especially in what concerns some detail
3
FOREWORD
The European Committee of Central Balance-Sheet Data Offices (ECCBSO) is an informal body whose
members consist of experts either from the Central Balance-Sheet Data Offices belonging to or
associated with the National Central Banks of the European Community,
or from National Statistical Institutes.
The Bank for the Accounts of Companies Harmonized Working Group (BACH WG) is one of ECCBSO’s
Working Groups. It was created within the foundation of developing and improving a European
statistical database: the BACH database.
The BACH database provides comparable aggregated data (both economic and financial) based on the
annual accounts of non-financial incorporated companies from European countries. For the time being
BACH includes data from 8 countries: Belgium, Czech Republic, France, Germany, Italy, Poland, Portugal
and Spain.
The BACH database is available for free at http://www.bach.banque-france.fr/?lang=en
In this Outlook #1, SMEs in European countries are analysed making use of data available in the BACH
database, which is complemented, to ease understanding, with some additional details mainly
concerning national specificities (relevant notes are included at the end of the document).
The aim of this report is to improve the general knowledge on European non-financial enterprises by
providing a prototype analysis done with BACH data publicly available. Although methodological aspects
and national sample characteristics are not evident here, they are very much important to better
understand the data. Therefore, we strongly recommend the use of the BACH database Userguide on the
BACH website.
We sincerely hope you can benefit from this analysis and we invite you all to visit the BACH database and
explore it as much as possible as well as make your own analysis.
Margarida Brites (Chairwoman of the BACH WG) |
Reinhard Konczer (AT) | Cécile Buydens (BE) | Miroslav Kalous (CZ) | Lars Holstein (DE) | Timm Koerting (DE) |
Sigrid Koob (DK) | Martin Oksbjerg (DK) | Sebastien Duarte (ECB) | José Ramón Cano (ES) | Jean-Luc Cayssials (FR) |
Karelle Thiebot-Goget (FR) | Franck Lemaire (FR) | Christophe Cahn (FR) | Fabrizio Balda (IT) |
Antonio De Socio (IT) | Patricia Gonzalez (LU) | Chantal Lemmens-Dirix (NL) | Bozena Wtulich (PL) |
Ewa Sokolowska (PL) | Vítor Silveira (PT) | Alina Tarta (RO) | Jan Seman (SK) | Martin Novak (SK)
SMEs in European countries
BACH Outlook #1, 2013 | Website: http://www.bach.banque-france.fr/?lang=en 4
INTRODUCTION
The Bank for the Accounts of Companies Harmonized1 (BACH) is a database that provides comparable
aggregated data (both economic and financial) based on the annual accounts of non-financial
incorporated companies of the following European countries: Belgium, Czech Republic, France,
Germany, Italy, Poland, Portugal and Spain2.
For the sake (i) of consistency with national accounting standards that have been partially evolving
during the last years towards the International Financial Reporting Standards (IFRS) and also (ii) of
improving comparability among countries, a new BACH database has just been released. Although
significant enhancements have already been achieved, total harmonization among countries is not yet a
reality in this renewed BACH database. Divergences among national accounting standards and national
BACH samples are the most underlying reasons.
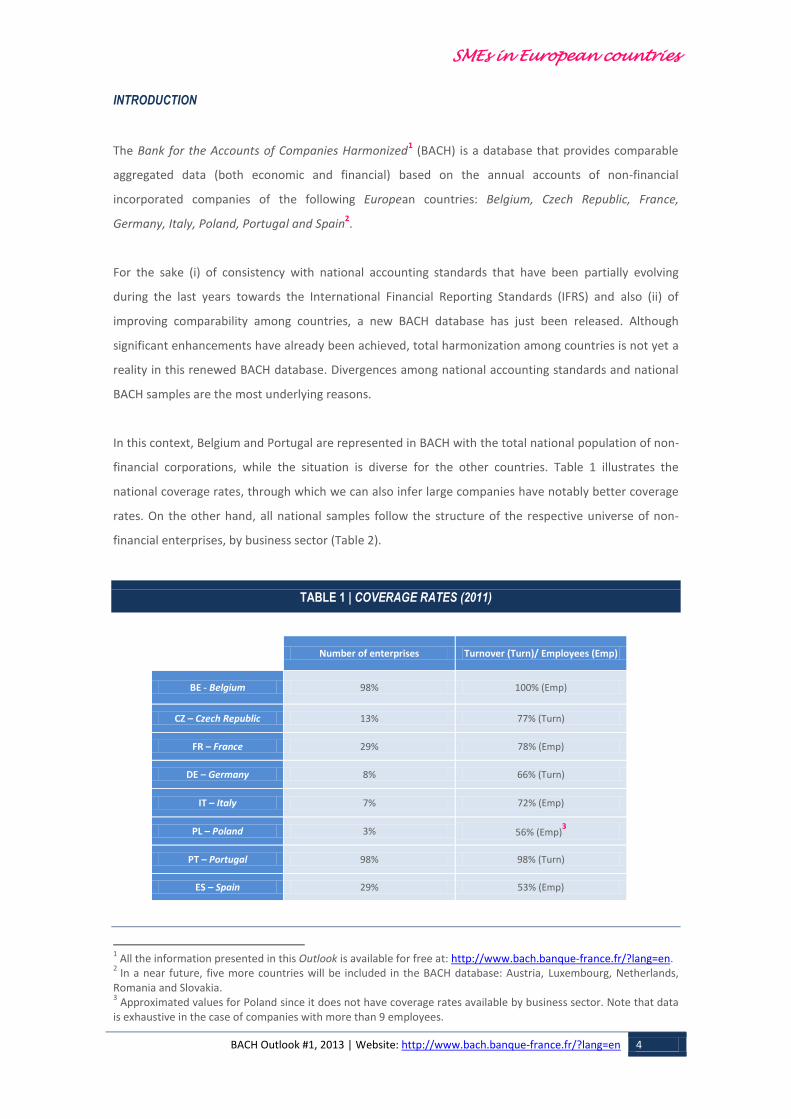
In this context, Belgium and Portugal are represented in BACH with the total national population of non-
financial corporations, while the situation is diverse for the other countries. Table 1 illustrates the
national coverage rates, through which we can also infer large companies have notably better coverage
rates. On the other hand, all national samples follow the structure of the respective universe of non-
financial enterprises, by business sector (Table 2).
TABLE 1 | COVERAGE RATES (2011)
Number of enterprises Turnover (Turn)/ Employees (Emp)
BE - Belgium 98% 100% (Emp)
CZ – Czech Republic 13% 77% (Turn)
FR – France 29% 78% (Emp)
DE – Germany 8% 66% (Turn)
IT – Italy 7% 72% (Emp)
PL – Poland 3% 56% (Emp)3
PT – Portugal 98% 98% (Turn)
ES – Spain 29% 53% (Emp)
1 All the information presented in this Outlook is available for free at: http://www.bach.banque-france.fr/?lang=en.
2 In a near future, five more countries will be included in the BACH database: Austria, Luxembourg, Netherlands,
Romania and Slovakia. 3 Approximated values for Poland since it does not have coverage rates available by business sector. Note that data
is exhaustive in the case of companies with more than 9 employees.
5
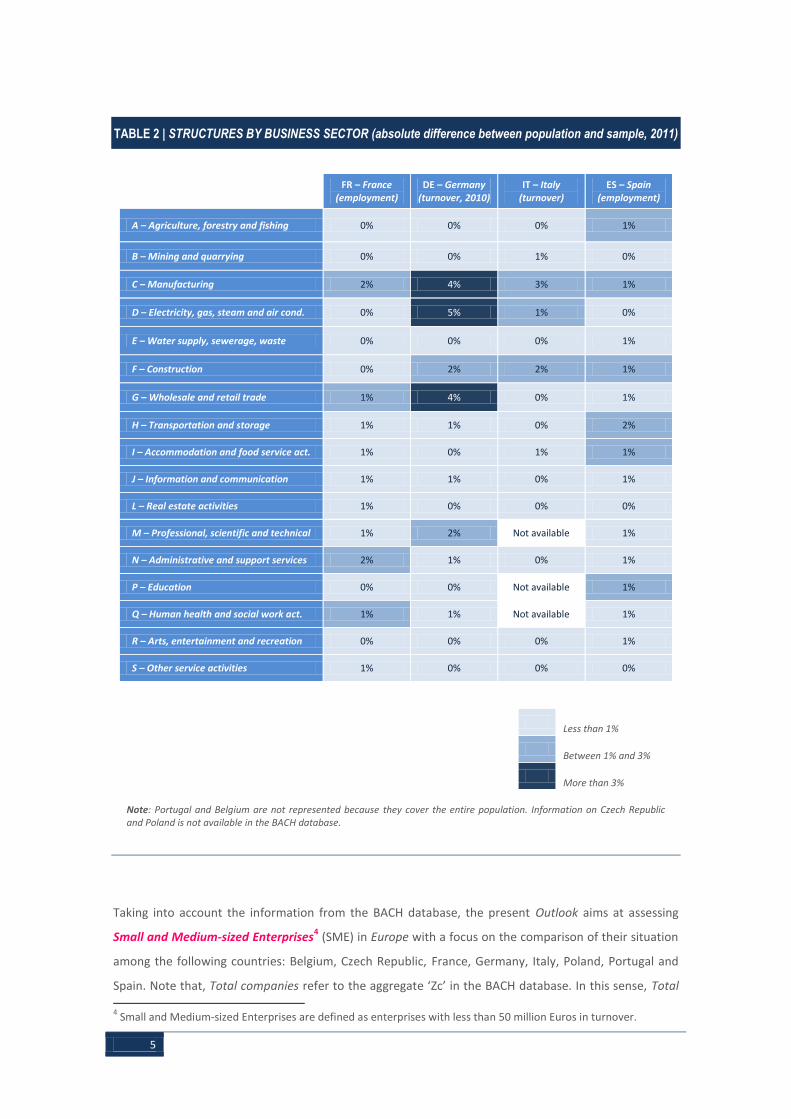
TABLE 2 | STRUCTURES BY BUSINESS SECTOR (absolute difference between population and sample, 2011)
FR – France
(employment) DE – Germany
(turnover, 2010) IT – Italy
(turnover) ES – Spain
(employment)
A – Agriculture, forestry and fishing 0% 0% 0% 1%
B – Mining and quarrying 0% 0% 1% 0%
C – Manufacturing 2% 4% 3% 1%
D – Electricity, gas, steam and air cond. 0% 5% 1% 0%
E – Water supply, sewerage, waste 0% 0% 0% 1%
F – Construction 0% 2% 2% 1%
G – Wholesale and retail trade 1% 4% 0% 1%
H – Transportation and storage 1% 1% 0% 2%
I – Accommodation and food service act. 1% 0% 1% 1%
J – Information and communication 1% 1% 0% 1%
L – Real estate activities 1% 0% 0% 0%
M – Professional, scientific and technical 1% 2% Not available 1%
N – Administrative and support services 2% 1% 0% 1%
P – Education 0% 0% Not available 1%
Q – Human health and social work act. 1% 1% Not available 1%
R – Arts, entertainment and recreation 0% 0% 0% 1%
S – Other service activities 1% 0% 0% 0%
Less than 1%
Between 1% and 3%
More than 3%
Note: Portugal and Belgium are not represented because they cover the entire population. Information on Czech Republic and Poland is not available in the BACH database.
Taking into account the information from the BACH database, the present Outlook aims at assessing
Small and Medium-sized Enterprises4 (SME) in Europe with a focus on the comparison of their situation
among the following countries: Belgium, Czech Republic, France, Germany, Italy, Poland, Portugal and
Spain. Note that, Total companies refer to the aggregate ‘Zc’ in the BACH database. In this sense, Total 4 Small and Medium-sized Enterprises are defined as enterprises with less than 50 million Euros in turnover.
SMEs in European countries
BACH Outlook #1, 2013 | Website: http://www.bach.banque-france.fr/?lang=en 6
companies comprise all business sectors with exception to K642 – Activities of holding companies and
M701 – Activities of head offices.
The BACH database covers only non-financial corporations (represented by the word “company” in this
Outlook). Therefore, sole proprietorships are not taken into account.
In the first part of the Outlook it is described the entrepreneurial structure of the European SMEs:
analysis by business sector, technological intensity of the Manufacturing sector and degree of
specialization of the Manufacturing sector. In the second part some economic and financial indicators
are summarized for the European corporations. In particular, the analysis presents some facts about the
performance and profitability of firms and their financial structure.
At the end of this Outlook national specificities by country are available. The information is meant to
guide the reader to better understand the results of the Outlook.
7
ENTREPRENEURIAL STRUCTURE
“SMEs are the true back-bone of the European economy, being primarily responsible for wealth and
economic growth, next to their key role in innovation and R&D”
European Commission
In conformity with the European Commission, the BACH database recognizes the importance of SMEs in
Europe. Actually, in the majority of the countries under analysis, SMEs account for more than half of
non-financial corporations sector’s employment. In 2011, this weight is higher in Portugal, where SMEs
have 80% of the employment, and lower in Italy (47%) (Table 3).
The significance of SMEs is also observed across business sectors, with the exception of the Electricity
and water where employment is notably assigned to large companies. On the opposite side,
Construction and Agriculture and fisheries are the business sectors where SMEs’ are more relevant.
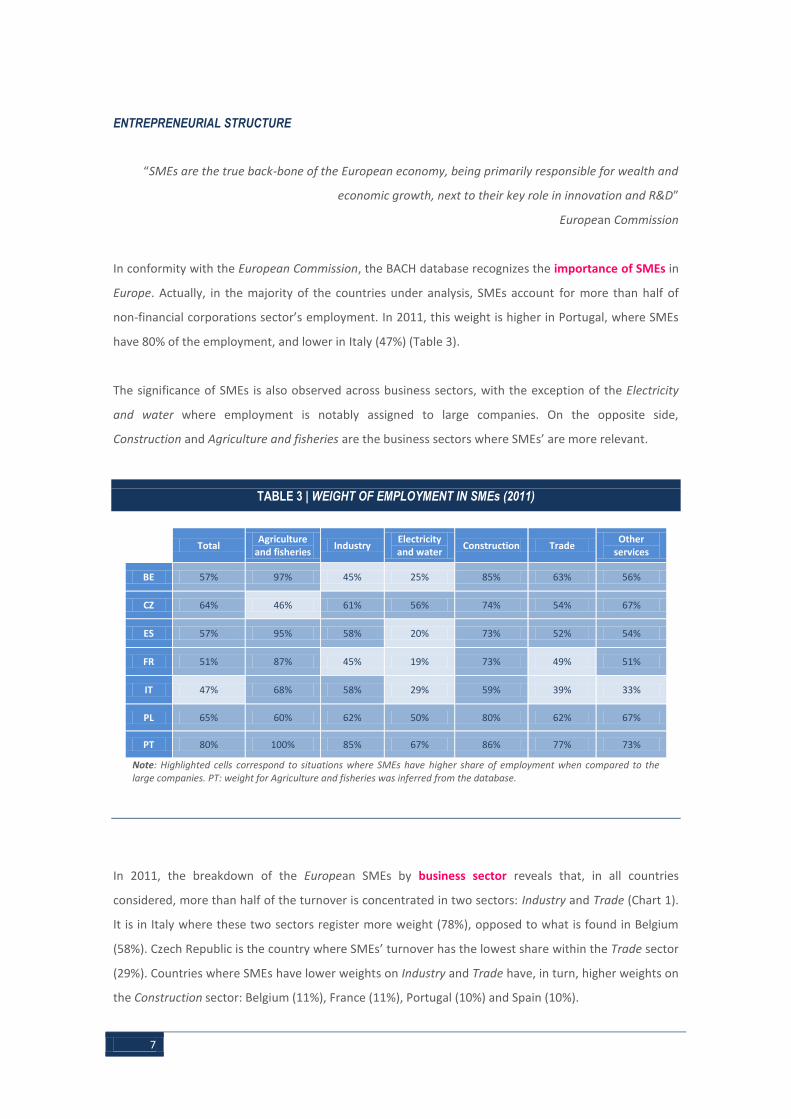
TABLE 3 | WEIGHT OF EMPLOYMENT IN SMEs (2011)
Total Agriculture
and fisheries Industry
Electricity and water
Construction Trade Other
services
BE 57% 97% 45% 25% 85% 63% 56%
CZ 64% 46% 61% 56% 74% 54% 67%
ES 57% 95% 58% 20% 73% 52% 54%
FR 51% 87% 45% 19% 73% 49% 51%
IT 47% 68% 58% 29% 59% 39% 33%
PL 65% 60% 62% 50% 80% 62% 67%
PT 80% 100% 85% 67% 86% 77% 73%
Note: Highlighted cells correspond to situations where SMEs have higher share of employment when compared to the large companies. PT: weight for Agriculture and fisheries was inferred from the database.
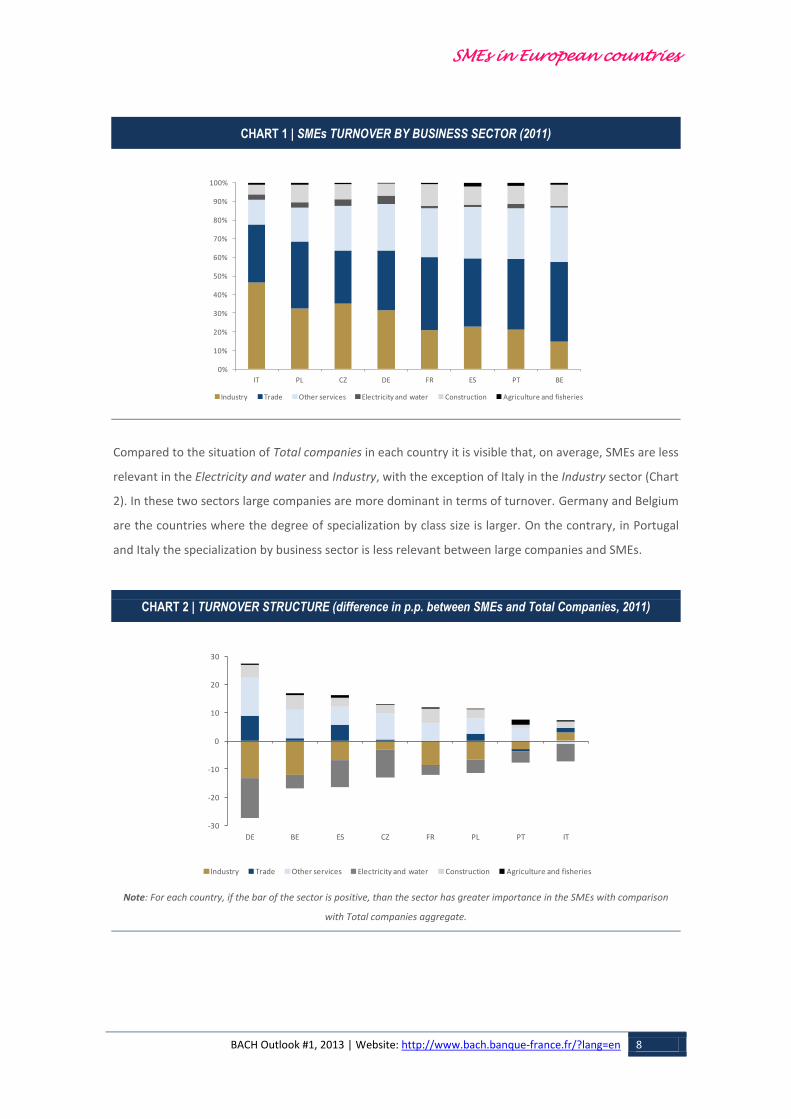
In 2011, the breakdown of the European SMEs by business sector reveals that, in all countries
considered, more than half of the turnover is concentrated in two sectors: Industry and Trade (Chart 1).
It is in Italy where these two sectors register more weight (78%), opposed to what is found in Belgium
(58%). Czech Republic is the country where SMEs’ turnover has the lowest share within the Trade sector
(29%). Countries where SMEs have lower weights on Industry and Trade have, in turn, higher weights on
the Construction sector: Belgium (11%), France (11%), Portugal (10%) and Spain (10%).
SMEs in European countries
BACH Outlook #1, 2013 | Website: http://www.bach.banque-france.fr/?lang=en 8
CHART 1 | SMEs TURNOVER BY BUSINESS SECTOR (2011)
Compared to the situation of Total companies in each country it is visible that, on average, SMEs are less
relevant in the Electricity and water and Industry, with the exception of Italy in the Industry sector (Chart
2). In these two sectors large companies are more dominant in terms of turnover. Germany and Belgium
are the countries where the degree of specialization by class size is larger. On the contrary, in Portugal
and Italy the specialization by business sector is less relevant between large companies and SMEs.
CHART 2 | TURNOVER STRUCTURE (difference in p.p. between SMEs and Total Companies, 2011)
Note: For each country, if the bar of the sector is positive, than the sector has greater importance in the SMEs with comparison
with Total companies aggregate.
0%
10%
20%
30%
40%
50%
60%
70%
80%
90%
100%
IT PL CZ DE FR ES PT BE
Industry Trade Other services Electricity and water Construction Agriculture and fisheries
-30
-20
-10
0
10
20
30
DE BE ES CZ FR PL PT IT
Industry Trade Other services Electricity and water Construction Agriculture and fisheries
9
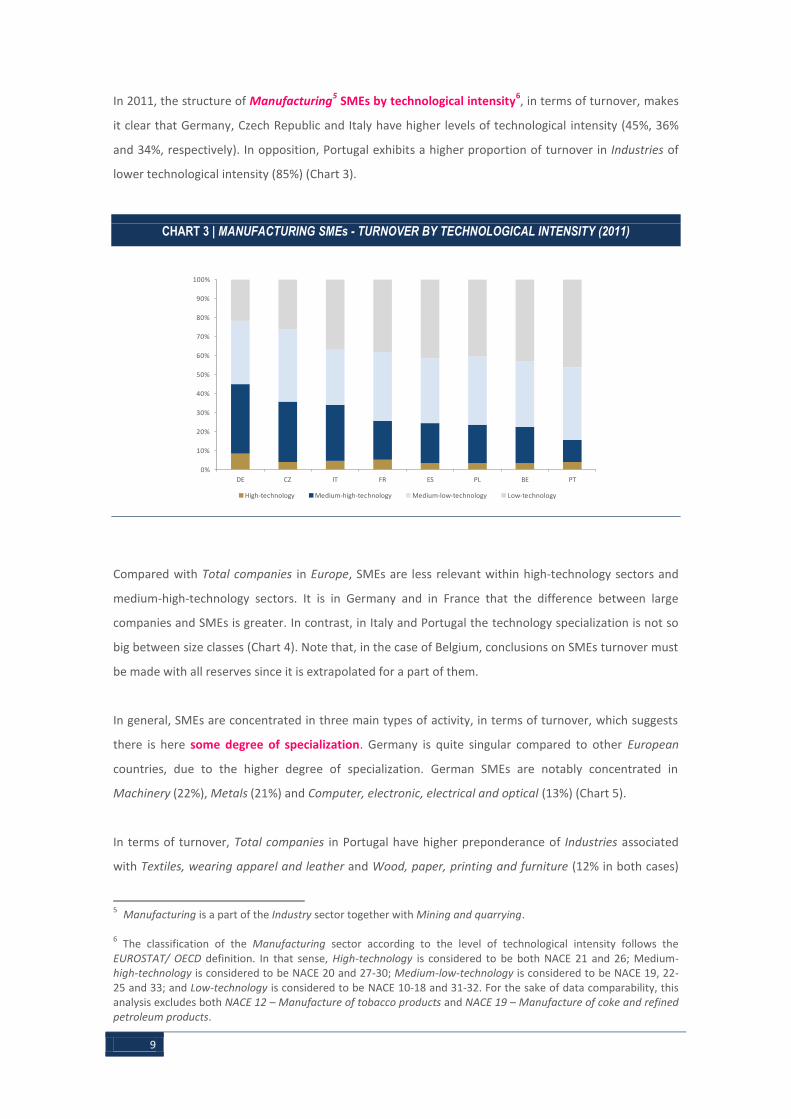
In 2011, the structure of Manufacturing5 SMEs by technological intensity
6, in terms of turnover, makes
it clear that Germany, Czech Republic and Italy have higher levels of technological intensity (45%, 36%
and 34%, respectively). In opposition, Portugal exhibits a higher proportion of turnover in Industries of
lower technological intensity (85%) (Chart 3).
CHART 3 | MANUFACTURING SMEs - TURNOVER BY TECHNOLOGICAL INTENSITY (2011)
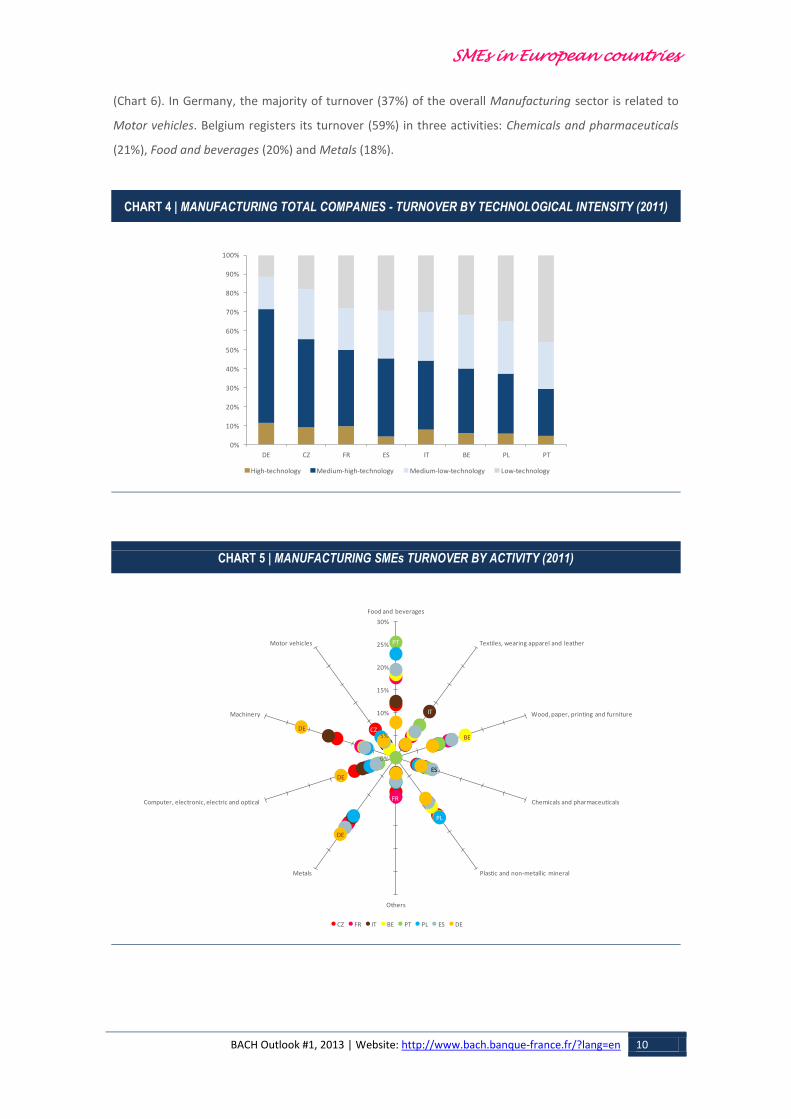
Compared with Total companies in Europe, SMEs are less relevant within high-technology sectors and
medium-high-technology sectors. It is in Germany and in France that the difference between large
companies and SMEs is greater. In contrast, in Italy and Portugal the technology specialization is not so
big between size classes (Chart 4). Note that, in the case of Belgium, conclusions on SMEs turnover must
be made with all reserves since it is extrapolated for a part of them.
In general, SMEs are concentrated in three main types of activity, in terms of turnover, which suggests
there is here some degree of specialization. Germany is quite singular compared to other European
countries, due to the higher degree of specialization. German SMEs are notably concentrated in
Machinery (22%), Metals (21%) and Computer, electronic, electrical and optical (13%) (Chart 5).
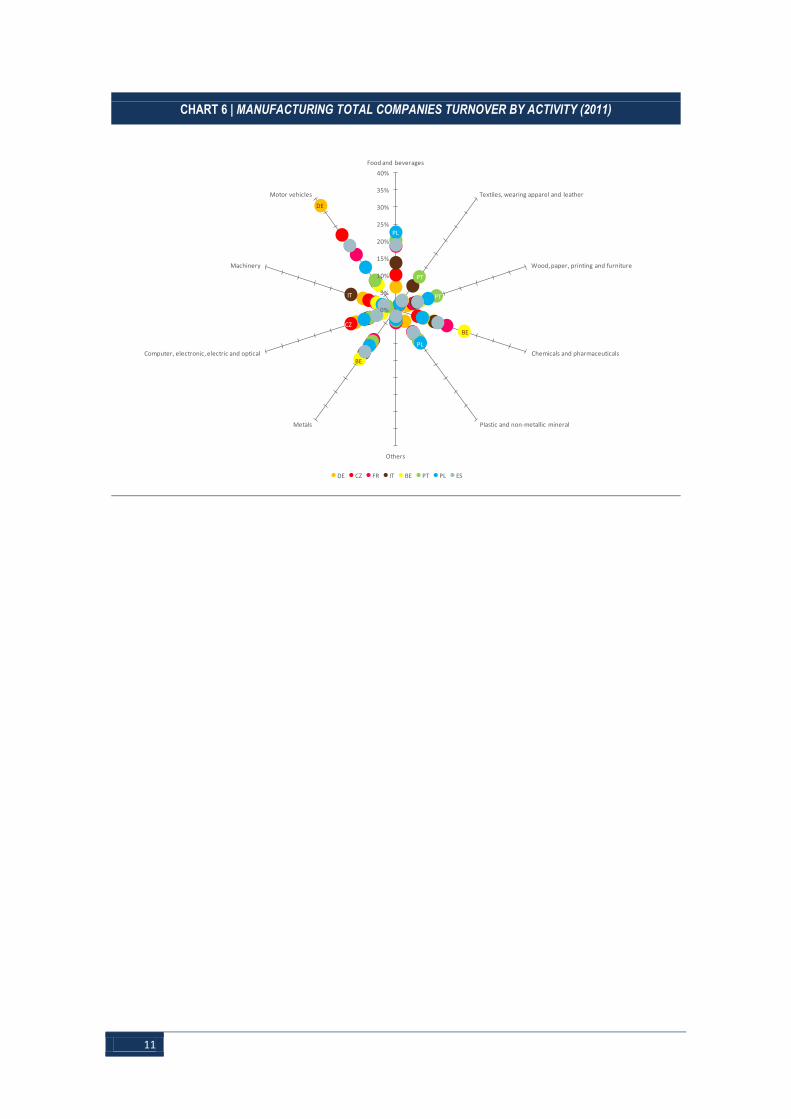
In terms of turnover, Total companies in Portugal have higher preponderance of Industries associated
with Textiles, wearing apparel and leather and Wood, paper, printing and furniture (12% in both cases)
5 Manufacturing is a part of the Industry sector together with Mining and quarrying. 6 The classification of the Manufacturing sector according to the level of technological intensity follows the
EUROSTAT/ OECD definition. In that sense, High-technology is considered to be both NACE 21 and 26; Medium-high-technology is considered to be NACE 20 and 27-30; Medium-low-technology is considered to be NACE 19, 22-25 and 33; and Low-technology is considered to be NACE 10-18 and 31-32. For the sake of data comparability, this analysis excludes both NACE 12 – Manufacture of tobacco products and NACE 19 – Manufacture of coke and refined petroleum products.
0%
10%
20%
30%
40%
50%
60%
70%
80%
90%
100%
DE CZ IT FR ES PL BE PT
High-technology Medium-high-technology Medium-low-technology Low-technology
SMEs in European countries
BACH Outlook #1, 2013 | Website: http://www.bach.banque-france.fr/?lang=en 10
(Chart 6). In Germany, the majority of turnover (37%) of the overall Manufacturing sector is related to
Motor vehicles. Belgium registers its turnover (59%) in three activities: Chemicals and pharmaceuticals
(21%), Food and beverages (20%) and Metals (18%).
CHART 4 | MANUFACTURING TOTAL COMPANIES - TURNOVER BY TECHNOLOGICAL INTENSITY (2011)
CHART 5 | MANUFACTURING SMEs TURNOVER BY ACTIVITY (2011)
0%
10%
20%
30%
40%
50%
60%
70%
80%
90%
100%
DE CZ FR ES IT BE PL PT
High-technology Medium-high-technology Medium-low-technology Low-technology
CZ
FR
IT
BE
PT
PL
ESDE
DE
DE
0%
5%
10%
15%
20%
25%
30%
Food and beverages
Textiles, wearing apparel and leather
Wood, paper, printing and furniture
Chemicals and pharmaceuticals
Plastic and non-metallic mineral
Others
Metals
Computer, electronic, electric and optical
Machinery
Motor vehicles
CZ FR IT BE PT PL ES DE
11
CHART 6 | MANUFACTURING TOTAL COMPANIES TURNOVER BY ACTIVITY (2011)
DE
CZ
IT
BE
BE
PT
PT
PL
PL
0%
5%
10%
15%
20%
25%
30%
35%
40%
Food and beverages
Textiles, wearing apparel and leather
Wood, paper, printing and furniture
Chemicals and pharmaceuticals
Plastic and non-metallic mineral
Others
Metals
Computer, electronic, electric and optical
Machinery
Motor vehicles
DE CZ FR IT BE PT PL ES
SMEs in European countries
BACH Outlook #1, 2013 | Website: http://www.bach.banque-france.fr/?lang=en 12
PERFORMANCE INDICATORS
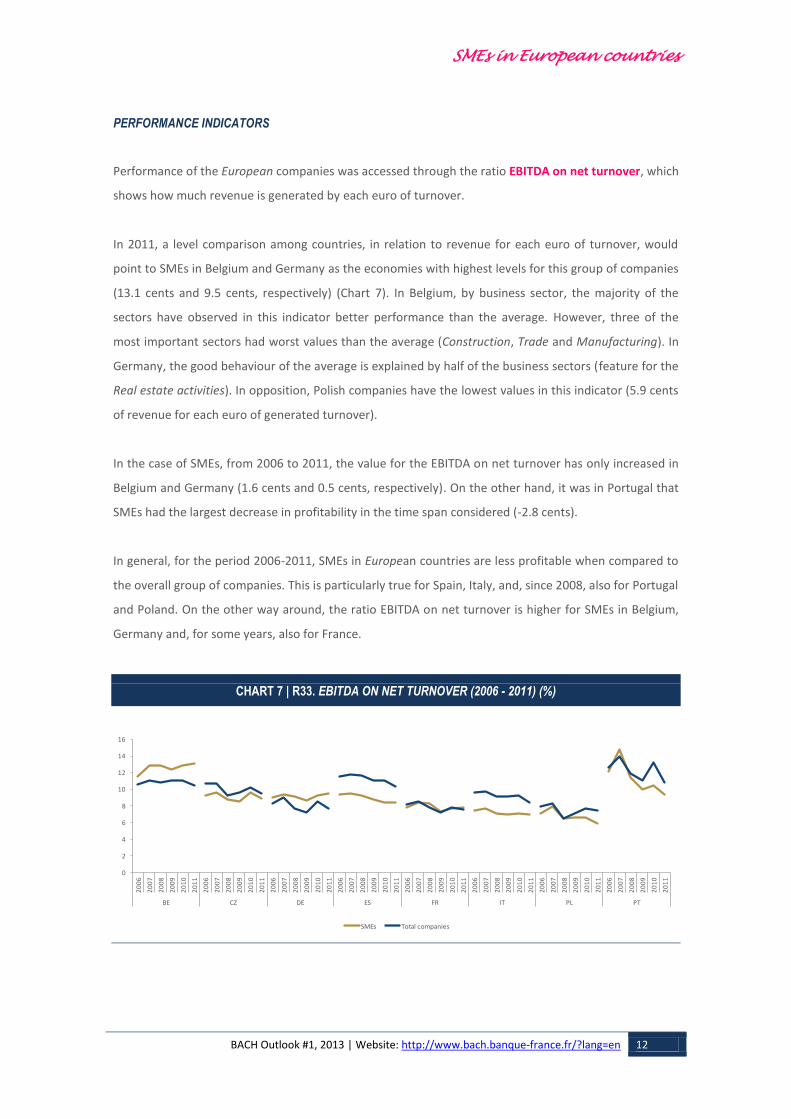
Performance of the European companies was accessed through the ratio EBITDA on net turnover, which
shows how much revenue is generated by each euro of turnover.
In 2011, a level comparison among countries, in relation to revenue for each euro of turnover, would
point to SMEs in Belgium and Germany as the economies with highest levels for this group of companies
(13.1 cents and 9.5 cents, respectively) (Chart 7). In Belgium, by business sector, the majority of the
sectors have observed in this indicator better performance than the average. However, three of the
most important sectors had worst values than the average (Construction, Trade and Manufacturing). In
Germany, the good behaviour of the average is explained by half of the business sectors (feature for the
Real estate activities). In opposition, Polish companies have the lowest values in this indicator (5.9 cents
of revenue for each euro of generated turnover).
In the case of SMEs, from 2006 to 2011, the value for the EBITDA on net turnover has only increased in
Belgium and Germany (1.6 cents and 0.5 cents, respectively). On the other hand, it was in Portugal that
SMEs had the largest decrease in profitability in the time span considered (-2.8 cents).
In general, for the period 2006-2011, SMEs in European countries are less profitable when compared to
the overall group of companies. This is particularly true for Spain, Italy, and, since 2008, also for Portugal
and Poland. On the other way around, the ratio EBITDA on net turnover is higher for SMEs in Belgium,
Germany and, for some years, also for France.
CHART 7 | R33. EBITDA ON NET TURNOVER (2006 - 2011) (%)
0
2
4
6
8
10
12
14
16
20
06
20
07
20
08
20
09
20
10
20
11
20
06
20
07
20
08
20
09
20
10
20
11
20
06
20
07
20
08
20
09
20
10
20
11
20
06
20
07
20
08
20
09
20
10
20
11
20
06
20
07
20
08
20
09
20
10
20
11
20
06
20
07
20
08
20
09
20
10
20
11
20
06
20
07
20
08
20
09
20
10
20
11
20
06
20
07
20
08
20
09
20
10
20
11
BE CZ DE ES FR IT PL PT
SMEs Total companies
13
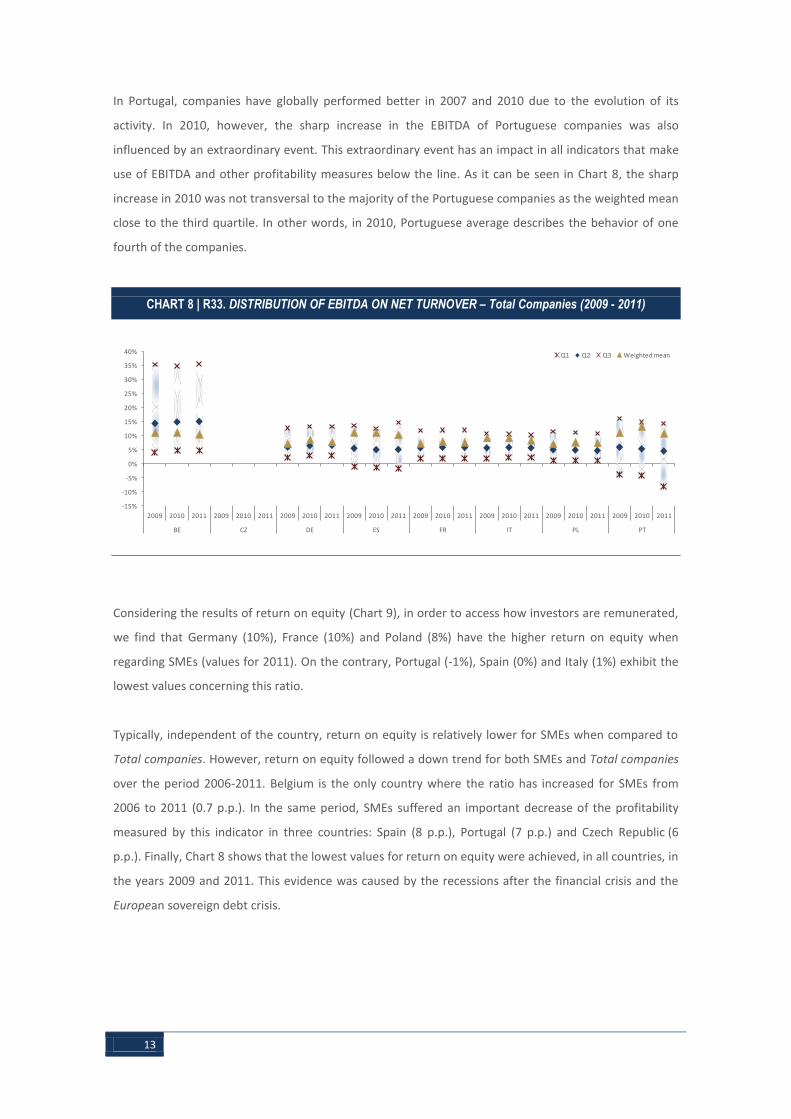
In Portugal, companies have globally performed better in 2007 and 2010 due to the evolution of its
activity. In 2010, however, the sharp increase in the EBITDA of Portuguese companies was also
influenced by an extraordinary event. This extraordinary event has an impact in all indicators that make
use of EBITDA and other profitability measures below the line. As it can be seen in Chart 8, the sharp
increase in 2010 was not transversal to the majority of the Portuguese companies as the weighted mean
close to the third quartile. In other words, in 2010, Portuguese average describes the behavior of one
fourth of the companies.
CHART 8 | R33. DISTRIBUTION OF EBITDA ON NET TURNOVER – Total Companies (2009 - 2011)
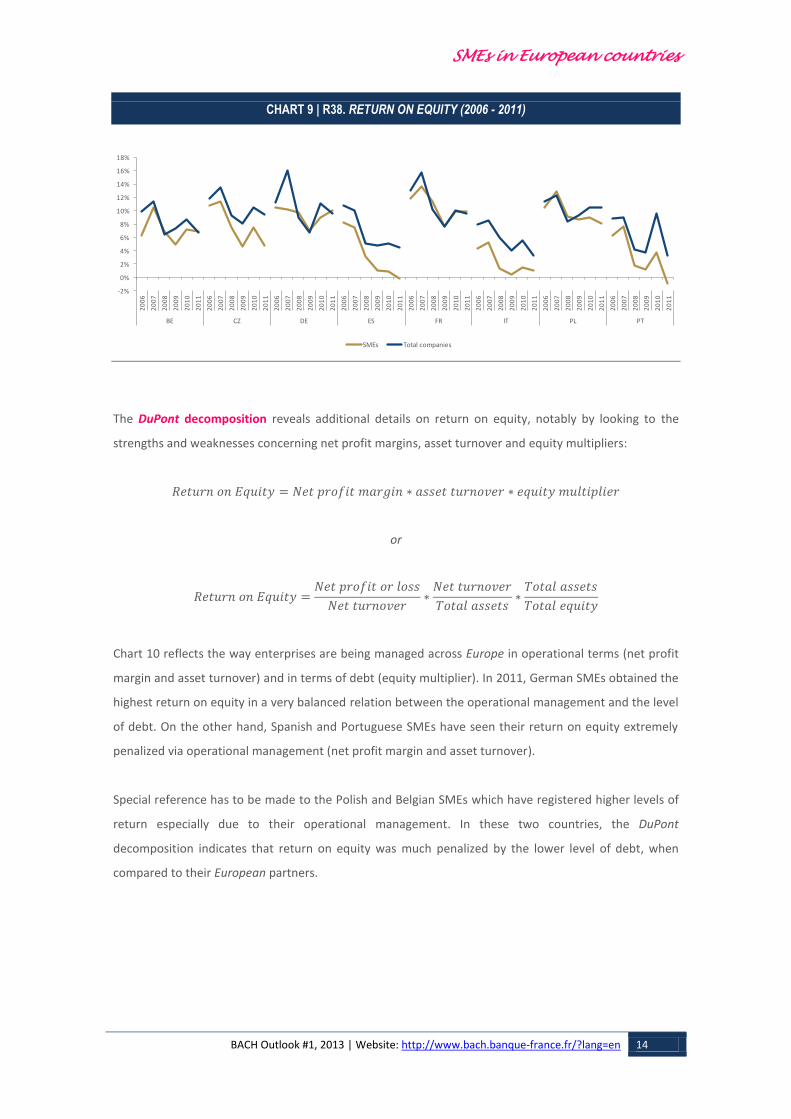
Considering the results of return on equity (Chart 9), in order to access how investors are remunerated,
we find that Germany (10%), France (10%) and Poland (8%) have the higher return on equity when
regarding SMEs (values for 2011). On the contrary, Portugal (-1%), Spain (0%) and Italy (1%) exhibit the
lowest values concerning this ratio.
Typically, independent of the country, return on equity is relatively lower for SMEs when compared to
Total companies. However, return on equity followed a down trend for both SMEs and Total companies
over the period 2006-2011. Belgium is the only country where the ratio has increased for SMEs from
2006 to 2011 (0.7 p.p.). In the same period, SMEs suffered an important decrease of the profitability
measured by this indicator in three countries: Spain (8 p.p.), Portugal (7 p.p.) and Czech Republic (6
p.p.). Finally, Chart 8 shows that the lowest values for return on equity were achieved, in all countries, in
the years 2009 and 2011. This evidence was caused by the recessions after the financial crisis and the
European sovereign debt crisis.
-15%
-10%
-5%
0%
5%
10%
15%
20%
25%
30%
35%
40%
2009 2010 2011 2009 2010 2011 2009 2010 2011 2009 2010 2011 2009 2010 2011 2009 2010 2011 2009 2010 2011 2009 2010 2011
BE CZ DE ES FR IT PL PT
Q1 Q2 Q3 Weighted mean
SMEs in European countries
BACH Outlook #1, 2013 | Website: http://www.bach.banque-france.fr/?lang=en 14
CHART 9 | R38. RETURN ON EQUITY (2006 - 2011)
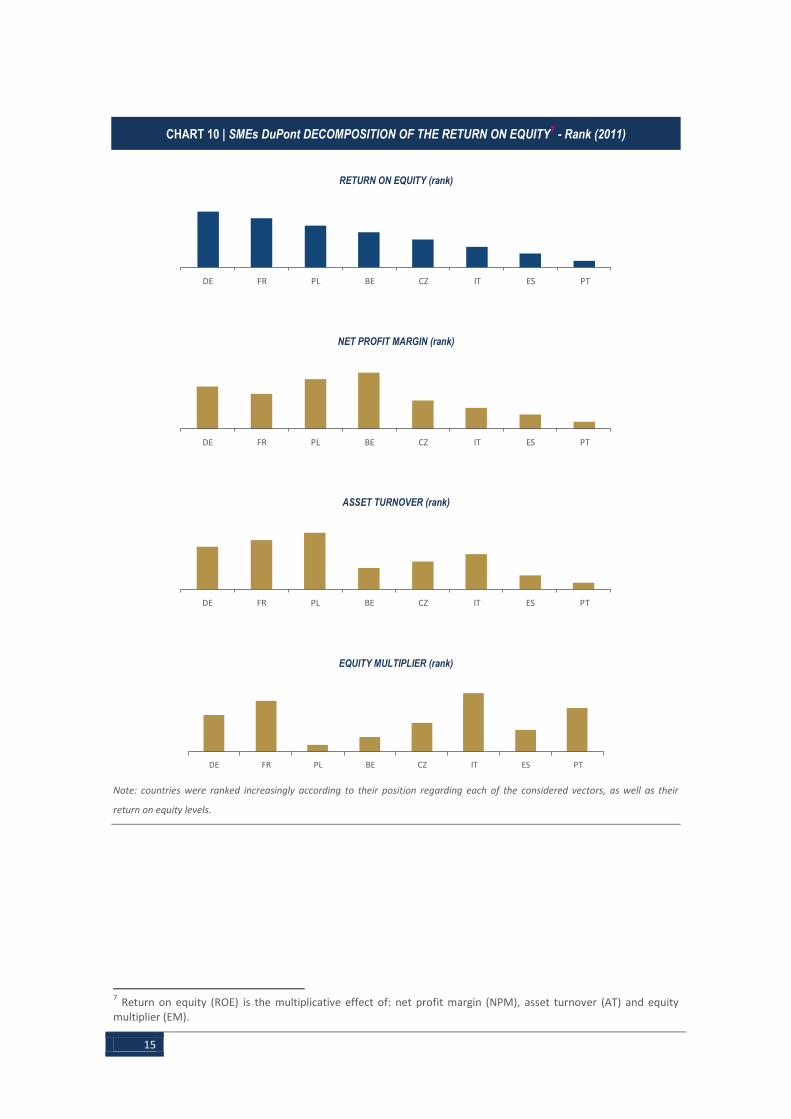
The DuPont decomposition reveals additional details on return on equity, notably by looking to the
strengths and weaknesses concerning net profit margins, asset turnover and equity multipliers:
or
Chart 10 reflects the way enterprises are being managed across Europe in operational terms (net profit
margin and asset turnover) and in terms of debt (equity multiplier). In 2011, German SMEs obtained the
highest return on equity in a very balanced relation between the operational management and the level
of debt. On the other hand, Spanish and Portuguese SMEs have seen their return on equity extremely
penalized via operational management (net profit margin and asset turnover).
Special reference has to be made to the Polish and Belgian SMEs which have registered higher levels of
return especially due to their operational management. In these two countries, the DuPont
decomposition indicates that return on equity was much penalized by the lower level of debt, when
compared to their European partners.
-2%
0%
2%
4%
6%
8%
10%
12%
14%
16%
18%
20
06
20
07
20
08
20
09
20
10
20
11
20
06
20
07
20
08
20
09
20
10
20
11
20
06
20
07
20
08
20
09
20
10
20
11
20
06
20
07
20
08
20
09
20
10
20
11
20
06
20
07
20
08
20
09
20
10
20
11
20
06
20
07
20
08
20
09
20
10
20
11
20
06
20
07
20
08
20
09
20
10
20
11
20
06
20
07
20
08
20
09
20
10
20
11
BE CZ DE ES FR IT PL PT
SMEs Total companies
15
CHART 10 | SMEs DuPont DECOMPOSITION OF THE RETURN ON EQUITY7 - Rank (2011)
RETURN ON EQUITY (rank)
NET PROFIT MARGIN (rank)
ASSET TURNOVER (rank)
EQUITY MULTIPLIER (rank)
Note: countries were ranked increasingly according to their position regarding each of the considered vectors, as well as their
return on equity levels.
7 Return on equity (ROE) is the multiplicative effect of: net profit margin (NPM), asset turnover (AT) and equity
multiplier (EM).
DE FR PL BE CZ IT ES PT
DE FR PL BE CZ IT ES PT
DE FR PL BE CZ IT ES PT
DE FR PL BE CZ IT ES PT
SMEs in European countries
BACH Outlook #1, 2013 | Website: http://www.bach.banque-france.fr/?lang=en 16
FINANCIAL SITUATION
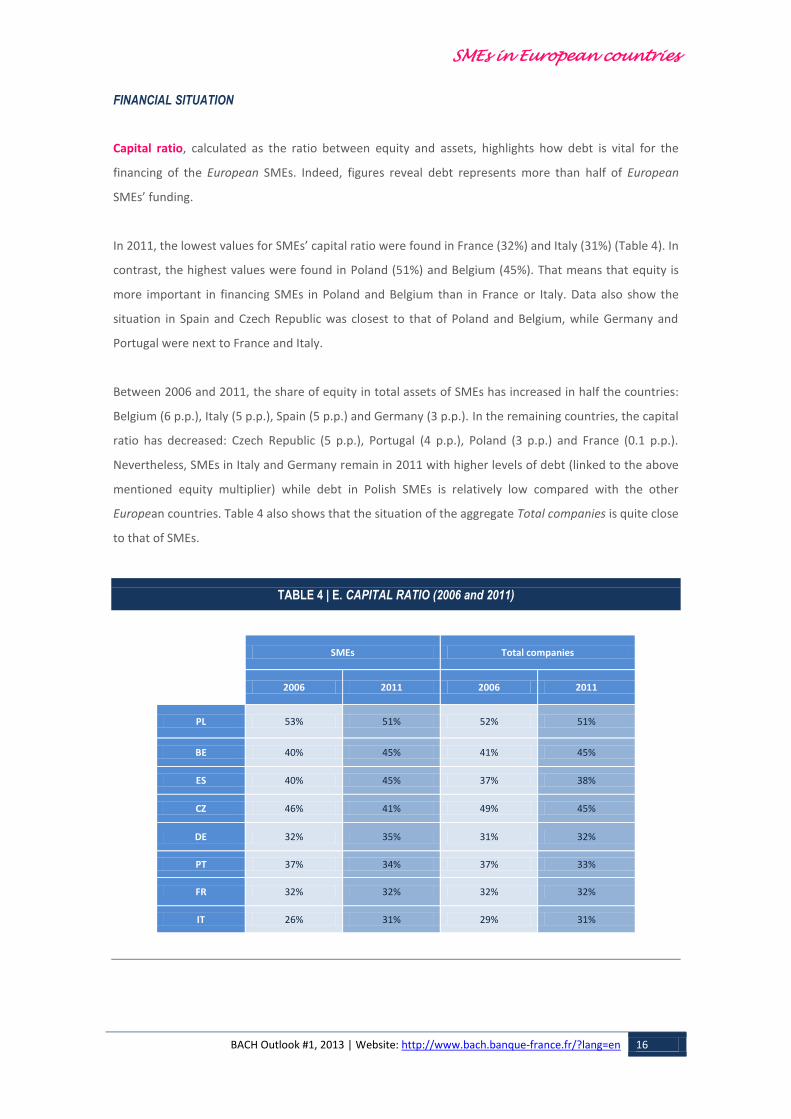
Capital ratio, calculated as the ratio between equity and assets, highlights how debt is vital for the
financing of the European SMEs. Indeed, figures reveal debt represents more than half of European
SMEs’ funding.
In 2011, the lowest values for SMEs’ capital ratio were found in France (32%) and Italy (31%) (Table 4). In
contrast, the highest values were found in Poland (51%) and Belgium (45%). That means that equity is
more important in financing SMEs in Poland and Belgium than in France or Italy. Data also show the
situation in Spain and Czech Republic was closest to that of Poland and Belgium, while Germany and
Portugal were next to France and Italy.
Between 2006 and 2011, the share of equity in total assets of SMEs has increased in half the countries:
Belgium (6 p.p.), Italy (5 p.p.), Spain (5 p.p.) and Germany (3 p.p.). In the remaining countries, the capital
ratio has decreased: Czech Republic (5 p.p.), Portugal (4 p.p.), Poland (3 p.p.) and France (0.1 p.p.).
Nevertheless, SMEs in Italy and Germany remain in 2011 with higher levels of debt (linked to the above
mentioned equity multiplier) while debt in Polish SMEs is relatively low compared with the other
European countries. Table 4 also shows that the situation of the aggregate Total companies is quite close
to that of SMEs.
TABLE 4 | E. CAPITAL RATIO (2006 and 2011)
SMEs Total companies
2006 2011 2006 2011
PL 53% 51% 52% 51%
BE 40% 45% 41% 45%
ES 40% 45% 37% 38%
CZ 46% 41% 49% 45%
DE 32% 35% 31% 32%
PT 37% 34% 37% 33%
FR 32% 32% 32% 32%
IT 26% 31% 29% 31%
17
In the case of Belgium it is interesting to be aware that the increasing share of equity in the total assets
between 2006 and 2008 is mainly explained by the system of national interest deduction that has the
objective of reduce tax discrimination between debt financing and equity financing.
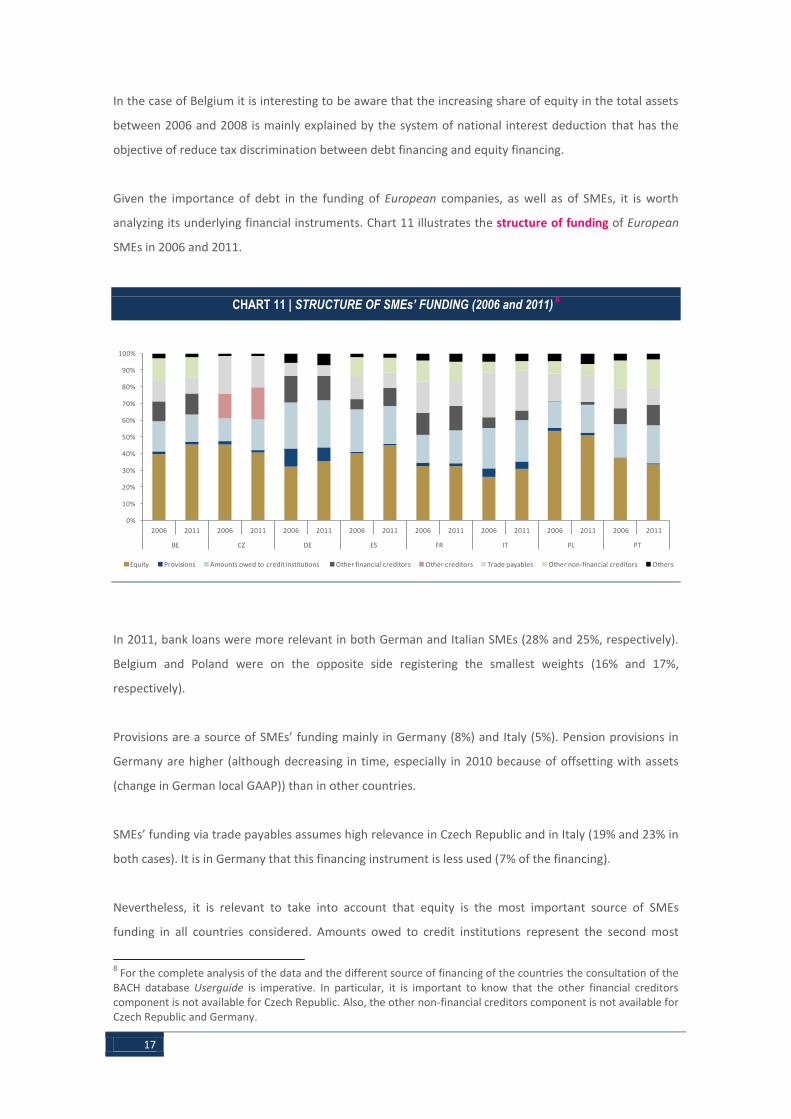
Given the importance of debt in the funding of European companies, as well as of SMEs, it is worth
analyzing its underlying financial instruments. Chart 11 illustrates the structure of funding of European
SMEs in 2006 and 2011.
CHART 11 | STRUCTURE OF SMEs’ FUNDING (2006 and 2011) 8
In 2011, bank loans were more relevant in both German and Italian SMEs (28% and 25%, respectively).
Belgium and Poland were on the opposite side registering the smallest weights (16% and 17%,
respectively).
Provisions are a source of SMEs’ funding mainly in Germany (8%) and Italy (5%). Pension provisions in
Germany are higher (although decreasing in time, especially in 2010 because of offsetting with assets
(change in German local GAAP)) than in other countries.
SMEs’ funding via trade payables assumes high relevance in Czech Republic and in Italy (19% and 23% in
both cases). It is in Germany that this financing instrument is less used (7% of the financing).
Nevertheless, it is relevant to take into account that equity is the most important source of SMEs
funding in all countries considered. Amounts owed to credit institutions represent the second most
8 For the complete analysis of the data and the different source of financing of the countries the consultation of the
BACH database Userguide is imperative. In particular, it is important to know that the other financial creditors component is not available for Czech Republic. Also, the other non-financial creditors component is not available for Czech Republic and Germany.
0%
10%
20%
30%
40%
50%
60%
70%
80%
90%
100%
2006 2011 2006 2011 2006 2011 2006 2011 2006 2011 2006 2011 2006 2011 2006 2011
BE CZ DE ES FR IT PL PT
Equity Provisions Amounts owed to credit institutions Other financial creditors Other creditors Trade payables Other non-financial creditors Others
SMEs in European countries
BACH Outlook #1, 2013 | Website: http://www.bach.banque-france.fr/?lang=en 18
common source of SMEs’ funding, with the exception of Czech Republic, where trade payables are in
second place.
When the structures of 2011 and 2006 are compared it is important to see that trade payables have
decreased in terms of importance in all countries under analysis. This phenomenon was more evident in
Czech Republic and France.
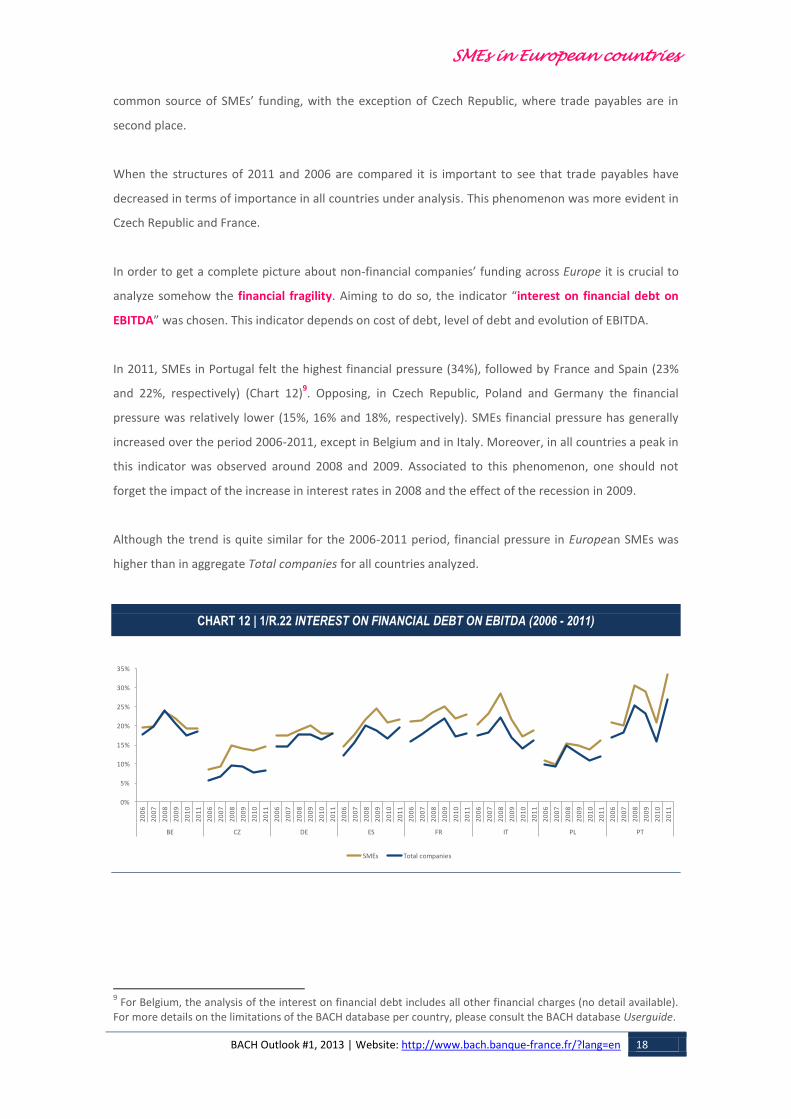
In order to get a complete picture about non-financial companies’ funding across Europe it is crucial to
analyze somehow the financial fragility. Aiming to do so, the indicator “interest on financial debt on
EBITDA” was chosen. This indicator depends on cost of debt, level of debt and evolution of EBITDA.
In 2011, SMEs in Portugal felt the highest financial pressure (34%), followed by France and Spain (23%
and 22%, respectively) (Chart 12)9. Opposing, in Czech Republic, Poland and Germany the financial
pressure was relatively lower (15%, 16% and 18%, respectively). SMEs financial pressure has generally
increased over the period 2006-2011, except in Belgium and in Italy. Moreover, in all countries a peak in
this indicator was observed around 2008 and 2009. Associated to this phenomenon, one should not
forget the impact of the increase in interest rates in 2008 and the effect of the recession in 2009.
Although the trend is quite similar for the 2006-2011 period, financial pressure in European SMEs was
higher than in aggregate Total companies for all countries analyzed.
CHART 12 | 1/R.22 INTEREST ON FINANCIAL DEBT ON EBITDA (2006 - 2011)
9 For Belgium, the analysis of the interest on financial debt includes all other financial charges (no detail available).
For more details on the limitations of the BACH database per country, please consult the BACH database Userguide.
0%
5%
10%
15%
20%
25%
30%
35%
20
06
20
07
20
08
20
09
20
10
20
11
20
06
20
07
20
08
20
09
20
10
20
11
20
06
20
07
20
08
20
09
20
10
20
11
20
06
20
07
20
08
20
09
20
10
20
11
20
06
20
07
20
08
20
09
20
10
20
11
20
06
20
07
20
08
20
09
20
10
20
11
20
06
20
07
20
08
20
09
20
10
20
11
20
06
20
07
20
08
20
09
20
10
20
11
BE CZ DE ES FR IT PL PT
SMEs Total companies
19
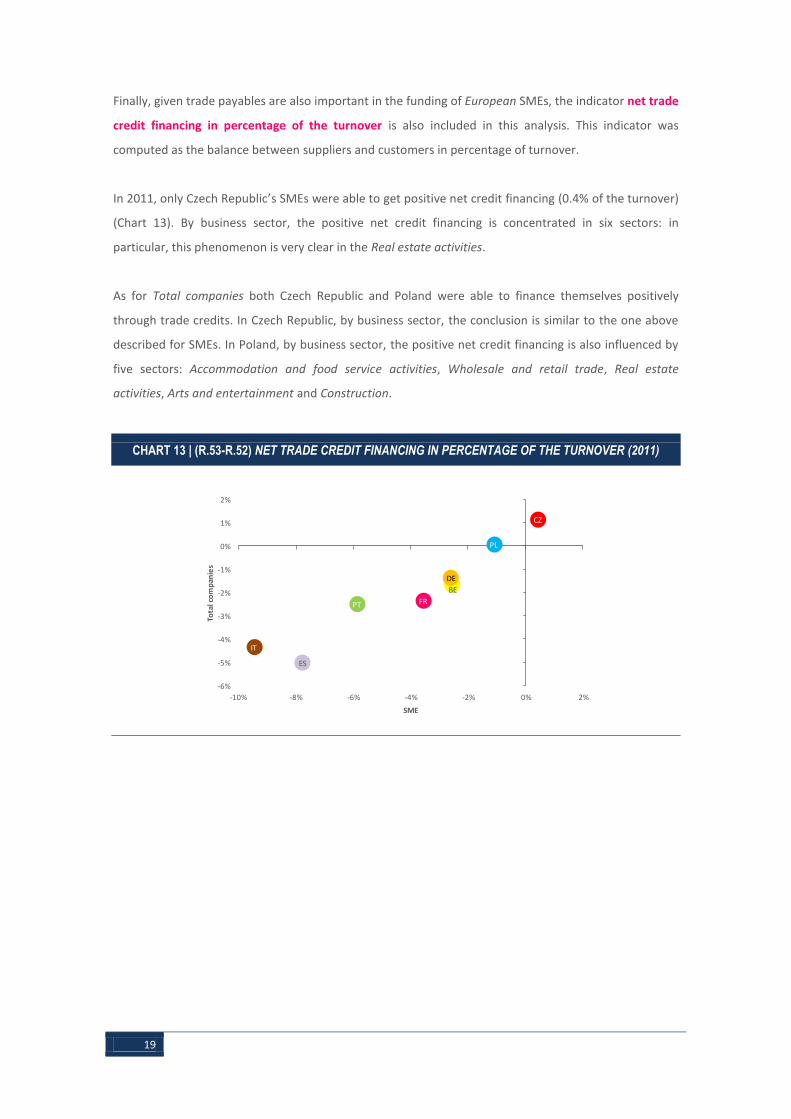
Finally, given trade payables are also important in the funding of European SMEs, the indicator net trade
credit financing in percentage of the turnover is also included in this analysis. This indicator was
computed as the balance between suppliers and customers in percentage of turnover.
In 2011, only Czech Republic’s SMEs were able to get positive net credit financing (0.4% of the turnover)
(Chart 13). By business sector, the positive net credit financing is concentrated in six sectors: in
particular, this phenomenon is very clear in the Real estate activities.
As for Total companies both Czech Republic and Poland were able to finance themselves positively
through trade credits. In Czech Republic, by business sector, the conclusion is similar to the one above
described for SMEs. In Poland, by business sector, the positive net credit financing is also influenced by
five sectors: Accommodation and food service activities, Wholesale and retail trade, Real estate
activities, Arts and entertainment and Construction.
CHART 13 | (R.53-R.52) NET TRADE CREDIT FINANCING IN PERCENTAGE OF THE TURNOVER (2011)
BE
CZ
DE
ES
FR
IT
PL
PT
-6%
-5%
-4%
-3%
-2%
-1%
0%
1%
2%
-10% -8% -6% -4% -2% 0% 2%
Tota
l co
mp
anie
s
SME
SMEs in European countries
BACH Outlook #1, 2013 | Website: http://www.bach.banque-france.fr/?lang=en 20
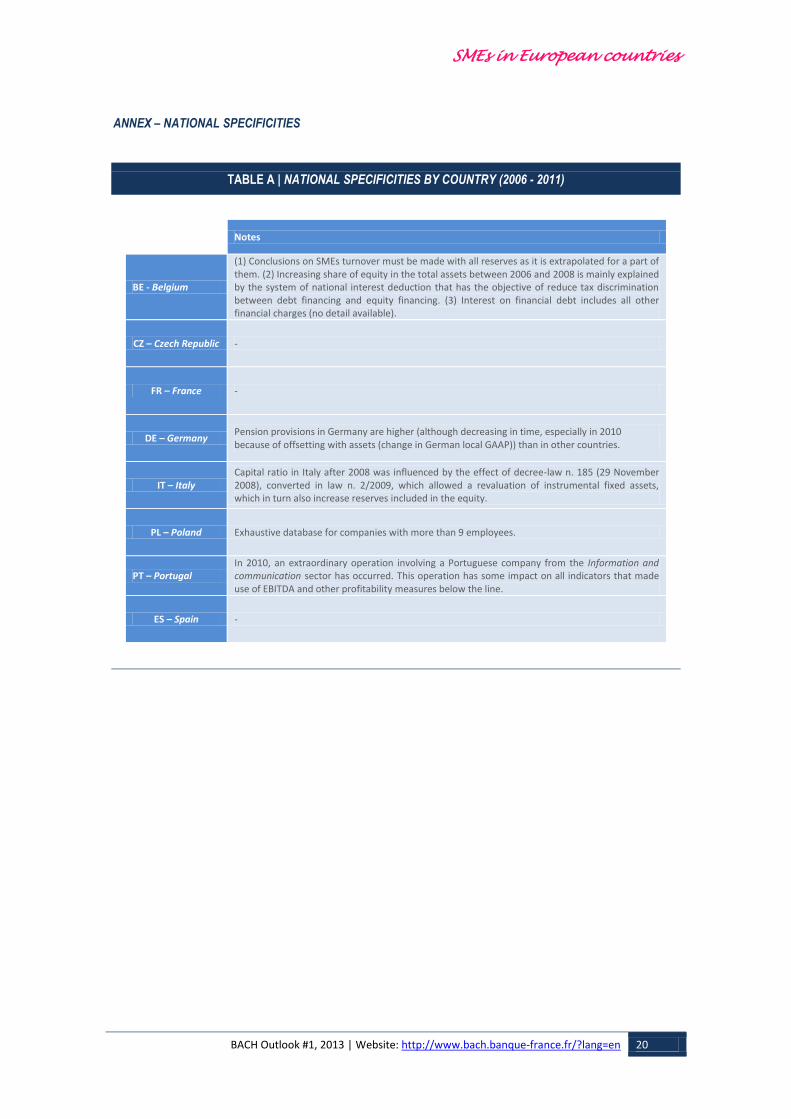
ANNEX – NATIONAL SPECIFICITIES
TABLE A | NATIONAL SPECIFICITIES BY COUNTRY (2006 - 2011)
Notes
BE - Belgium
(1) Conclusions on SMEs turnover must be made with all reserves as it is extrapolated for a part of them. (2) Increasing share of equity in the total assets between 2006 and 2008 is mainly explained by the system of national interest deduction that has the objective of reduce tax discrimination between debt financing and equity financing. (3) Interest on financial debt includes all other financial charges (no detail available).
CZ – Czech Republic -
FR – France -
DE – Germany Pension provisions in Germany are higher (although decreasing in time, especially in 2010 because of offsetting with assets (change in German local GAAP)) than in other countries.
IT – Italy Capital ratio in Italy after 2008 was influenced by the effect of decree-law n. 185 (29 November 2008), converted in law n. 2/2009, which allowed a revaluation of instrumental fixed assets, which in turn also increase reserves included in the equity.
PL – Poland Exhaustive database for companies with more than 9 employees.
PT – Portugal In 2010, an extraordinary operation involving a Portuguese company from the Information and communication sector has occurred. This operation has some impact on all indicators that made use of EBITDA and other profitability measures below the line.
ES – Spain -

21