Embed Size (px)
Citation preview
8/14/2019 SME 4th Progress report on SMEs participation in the 7th r&D Framework Programme
http://slidepdf.com/reader/full/sme-4th-progress-report-on-smes-participation-in-the-7th-rd-framework-programme 1/87
4 t h P r o g r e s s r e P o r t o n s M e sP a r t i c i P a t i o n i n t h e 7 t h r & DF r a M e w o r k P r o g r a M M e
B r u s s e l s , 1 D e c e m B e r 2 0 0 9
For further information, please see http://ec.europa.eu/research/sme-techweb online ,or contact [email protected] via email.
8/14/2019 SME 4th Progress report on SMEs participation in the 7th r&D Framework Programme
http://slidepdf.com/reader/full/sme-4th-progress-report-on-smes-participation-in-the-7th-rd-framework-programme 2/87
EUROPEAN COMMISSIONRESEARCH DIRECTORATE-GENERAL
Relations with the REA agency; Marie Curie, SME and NEST, policy and actionsSMEs
Brussels, 1 December 2009RTD.T.4
4 th Progress Report on SMEs participation inthe 7 th R&D Framework Programme
8/14/2019 SME 4th Progress report on SMEs participation in the 7th r&D Framework Programme
http://slidepdf.com/reader/full/sme-4th-progress-report-on-smes-participation-in-the-7th-rd-framework-programme 3/87
8/14/2019 SME 4th Progress report on SMEs participation in the 7th r&D Framework Programme
http://slidepdf.com/reader/full/sme-4th-progress-report-on-smes-participation-in-the-7th-rd-framework-programme 4/87
3
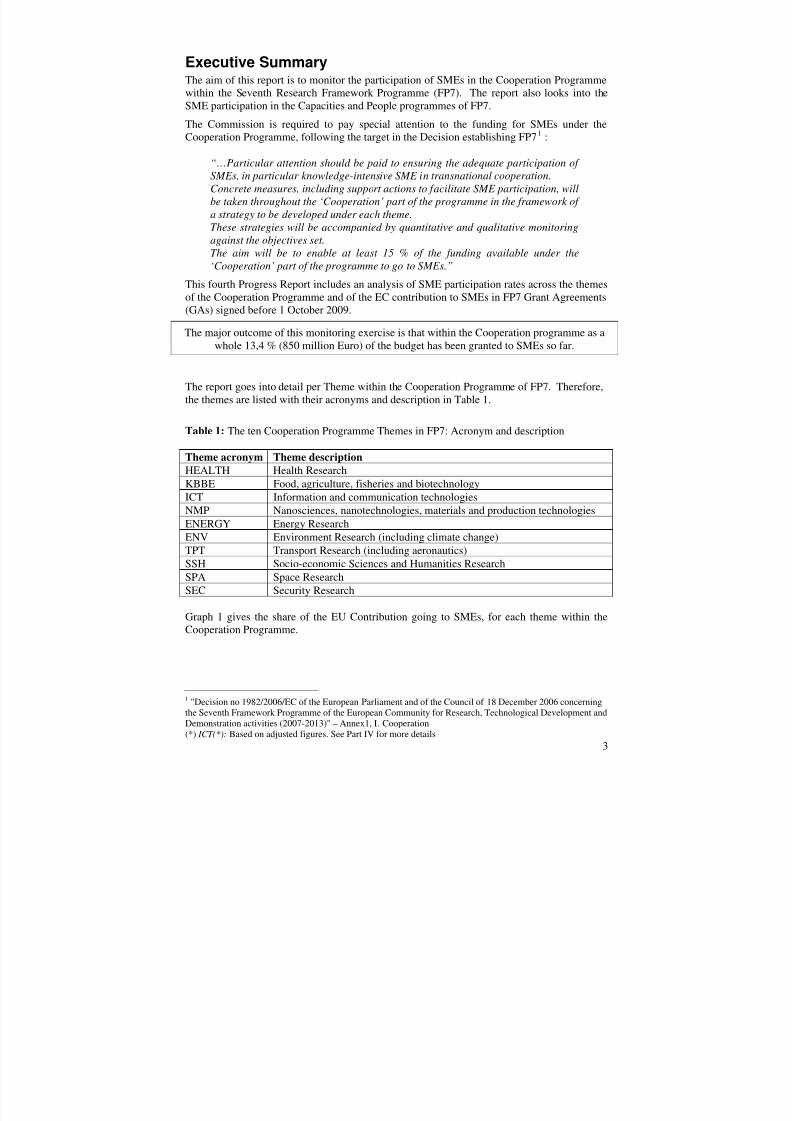
Executive SummaryThe aim of this report is to monitor the participation of SMEs in the Cooperation Programmewithin the Seventh Research Framework Programme (FP7). The report also looks into theSME participation in the Capacities and People programmes of FP7.The Commission is required to pay special attention to the funding for SMEs under the
Cooperation Programme, following the target in the Decision establishing FP71
:“…Particular attention should be paid to ensuring the adequate participation of SMEs, in particular knowledge-intensive SME in transnational cooperation.Concrete measures, including support actions to facilitate SME participation, willbe taken throughout the ‘Cooperation’ part of the programme in the framework of a strategy to be developed under each theme.These strategies will be accompanied by quantitative and qualitative monitoringagainst the objectives set.The aim will be to enable at least 15 % of the funding available under the‘Cooperation’ part of the programme to go to SMEs.”
This fourth Progress Report includes an analysis of SME participation rates across the themesof the Cooperation Programme and of the EC contribution to SMEs in FP7 Grant Agreements(GAs) signed before 1 October 2009.
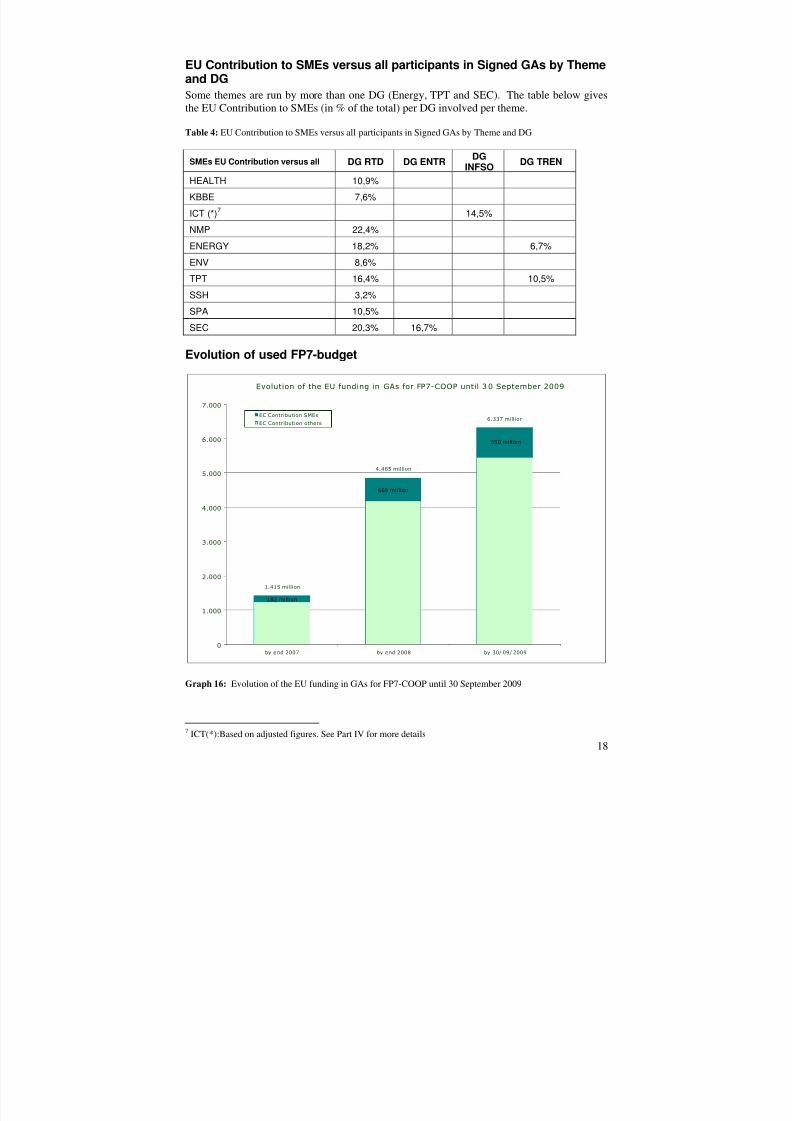
The major outcome of this monitoring exercise is that within the Cooperation programme as awhole 13,4 % (850 million Euro) of the budget has been granted to SMEs so far.
The report goes into detail per Theme within the Cooperation Programme of FP7. Therefore,the themes are listed with their acronyms and description in Table 1.
Table 1: The ten Cooperation Programme Themes in FP7: Acronym and description
Theme acronym Theme descriptionHEALTH Health ResearchKBBE Food, agriculture, fisheries and biotechnologyICT Information and communication technologiesNMP Nanosciences, nanotechnologies, materials and production technologiesENERGY Energy ResearchENV Environment Research (including climate change)
TPT Transport Research (including aeronautics)SSH Socio-economic Sciences and Humanities ResearchSPA Space ResearchSEC Security Research
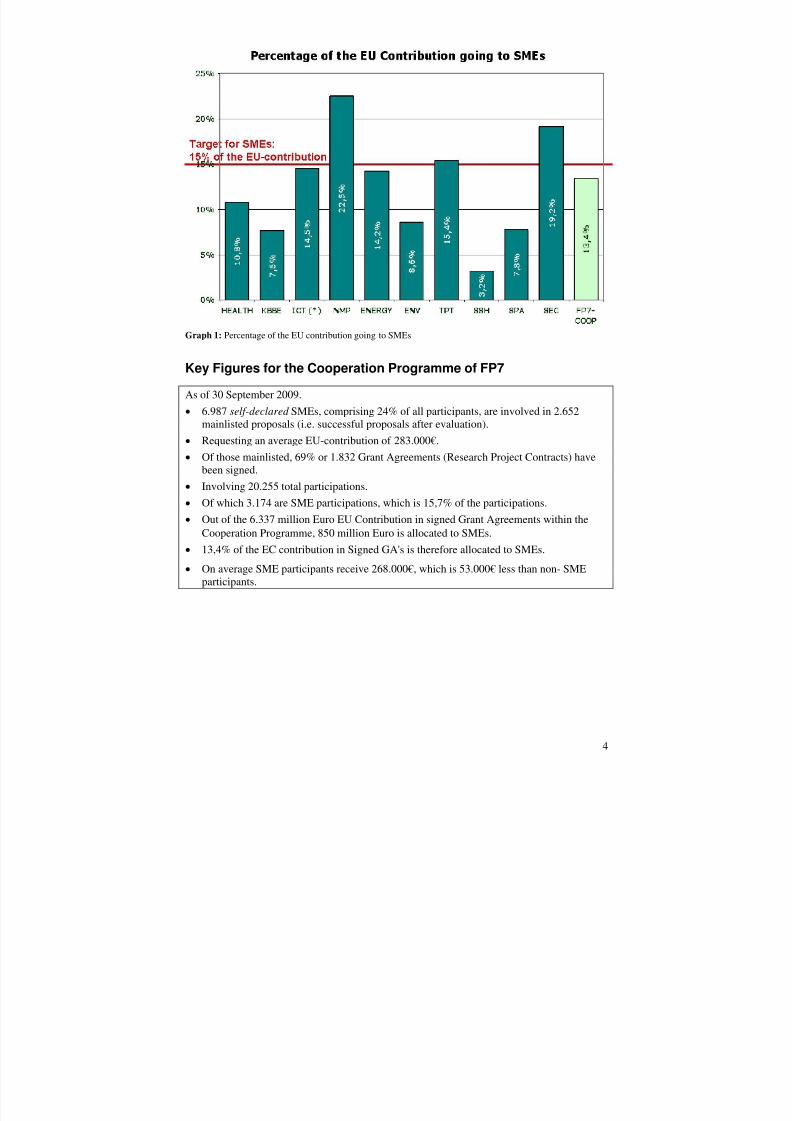
Graph 1 gives the share of the EU Contribution going to SMEs, for each theme within theCooperation Programme.
1 "Decision no 1982/2006/EC of the European Parliament and of the Council of 18 December 2006 concerningthe Seventh Framework Programme of the European Community for Research, Technological Development andDemonstration activities (2007-2013)" – Annex1, I. Cooperation(*) ICT(*): Based on adjusted figures. See Part IV for more details
8/14/2019 SME 4th Progress report on SMEs participation in the 7th r&D Framework Programme
http://slidepdf.com/reader/full/sme-4th-progress-report-on-smes-participation-in-the-7th-rd-framework-programme 5/87
Graph 1: Percentage of the EU contribution going to SMEs
Key Figures for the Cooperation Programme of FP7
As of 30 September 2009.
6.987self-declared SMEs, comprising 24% of all participants, are involved in 2.652mainlisted proposals (i.e. successful proposals after evaluation). Requesting an average EU-contribution of 283.000€. Of those mainlisted, 69% or 1.832 Grant Agreements (Research Project Contracts) have
been signed. Involving 20.255 total participations. Of which 3.174 are SME participations, which is 15,7% of the participations. Out of the 6.337 million Euro EU Contribution in signed Grant Agreements within the
Cooperation Programme, 850 million Euro is allocated to SMEs.
13,4% of the EC contribution in Signed GA's is therefore allocated to SMEs. On average SME participants receive 268.000€, which is 53.000€ less than non- SME
participants.
4
8/14/2019 SME 4th Progress report on SMEs participation in the 7th r&D Framework Programme
http://slidepdf.com/reader/full/sme-4th-progress-report-on-smes-participation-in-the-7th-rd-framework-programme 6/87
5
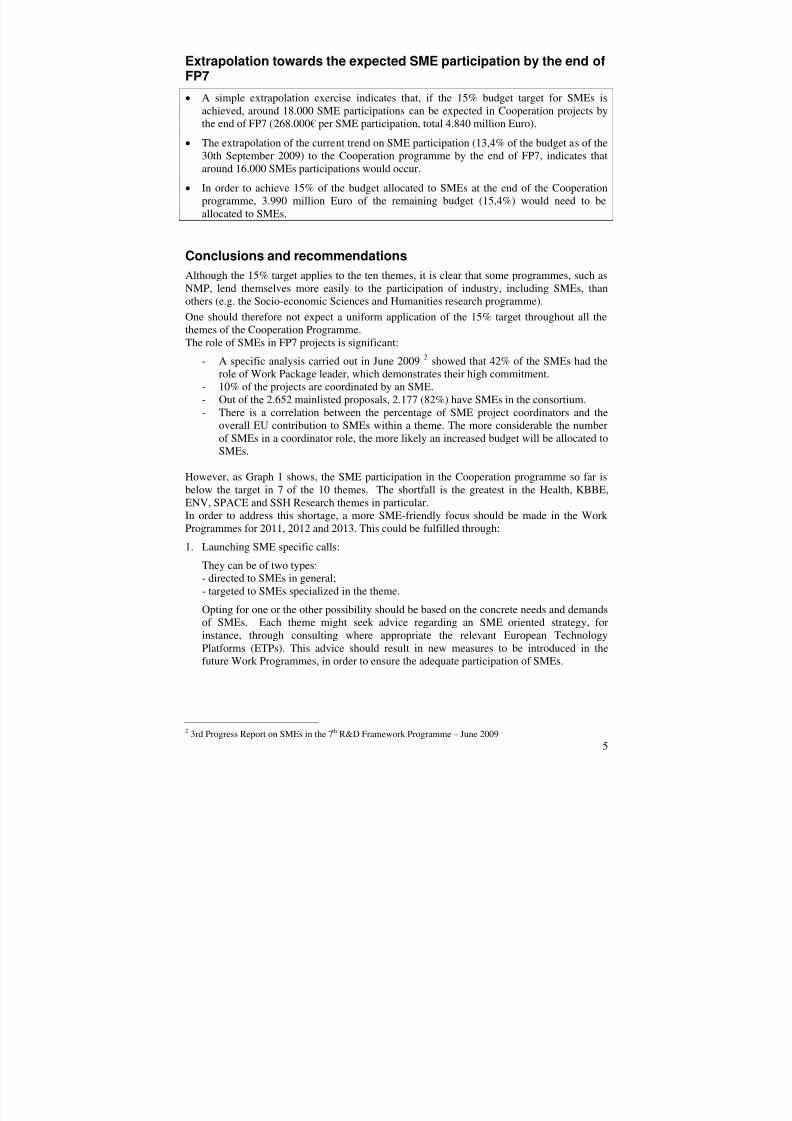
Extrapolation towards the expected SME participation by the end ofFP7
A simple extrapolation exercise indicates that, if the 15% budget target for SMEs isachieved, around 18.000 SME participations can be expected in Cooperation projects bythe end of FP7 (268.000€ per SME participation, total 4.840 million Euro).
The extrapolation of the current trend on SME participation (13,4% of the budget as of the30th September 2009) to the Cooperation programme by the end of FP7, indicates thataround 16.000 SMEs participations would occur.
In order to achieve 15% of the budget allocated to SMEs at the end of the Cooperationprogramme, 3.990 million Euro of the remaining budget (15,4%) would need to beallocated to SMEs.
Conclusions and recommendations
Although the 15% target applies to the ten themes, it is clear that some programmes, such asNMP, lend themselves more easily to the participation of industry, including SMEs, thanothers (e.g. the Socio-economic Sciences and Humanities research programme).One should therefore not expect a uniform application of the 15% target throughout all thethemes of the Cooperation Programme.The role of SMEs in FP7 projects is significant:
- A specific analysis carried out in June 20092 showed that 42% of the SMEs had therole of Work Package leader, which demonstrates their high commitment.
- 10% of the projects are coordinated by an SME.- Out of the 2.652 mainlisted proposals, 2.177 (82%) have SMEs in the consortium.
- There is a correlation between the percentage of SME project coordinators and theoverall EU contribution to SMEs within a theme. The more considerable the numberof SMEs in a coordinator role, the more likely an increased budget will be allocated toSMEs.
However, as Graph 1 shows, the SME participation in the Cooperation programme so far isbelow the target in 7 of the 10 themes. The shortfall is the greatest in the Health, KBBE,ENV, SPACE and SSH Research themes in particular.In order to address this shortage, a more SME-friendly focus should be made in the WorkProgrammes for 2011, 2012 and 2013. This could be fulfilled through:1. Launching SME specific calls:
They can be of two types:- directed to SMEs in general;- targeted to SMEs specialized in the theme. Opting for one or the other possibility should be based on the concrete needs and demandsof SMEs. Each theme might seek advice regarding an SME oriented strategy, forinstance, through consulting where appropriate the relevant European TechnologyPlatforms (ETPs). This advice should result in new measures to be introduced in thefuture Work Programmes, in order to ensure the adequate participation of SMEs.
2 3rd Progress Report on SMEs in the 7th R&D Framework Programme – June 2009
8/14/2019 SME 4th Progress report on SMEs participation in the 7th r&D Framework Programme
http://slidepdf.com/reader/full/sme-4th-progress-report-on-smes-participation-in-the-7th-rd-framework-programme 7/87
6
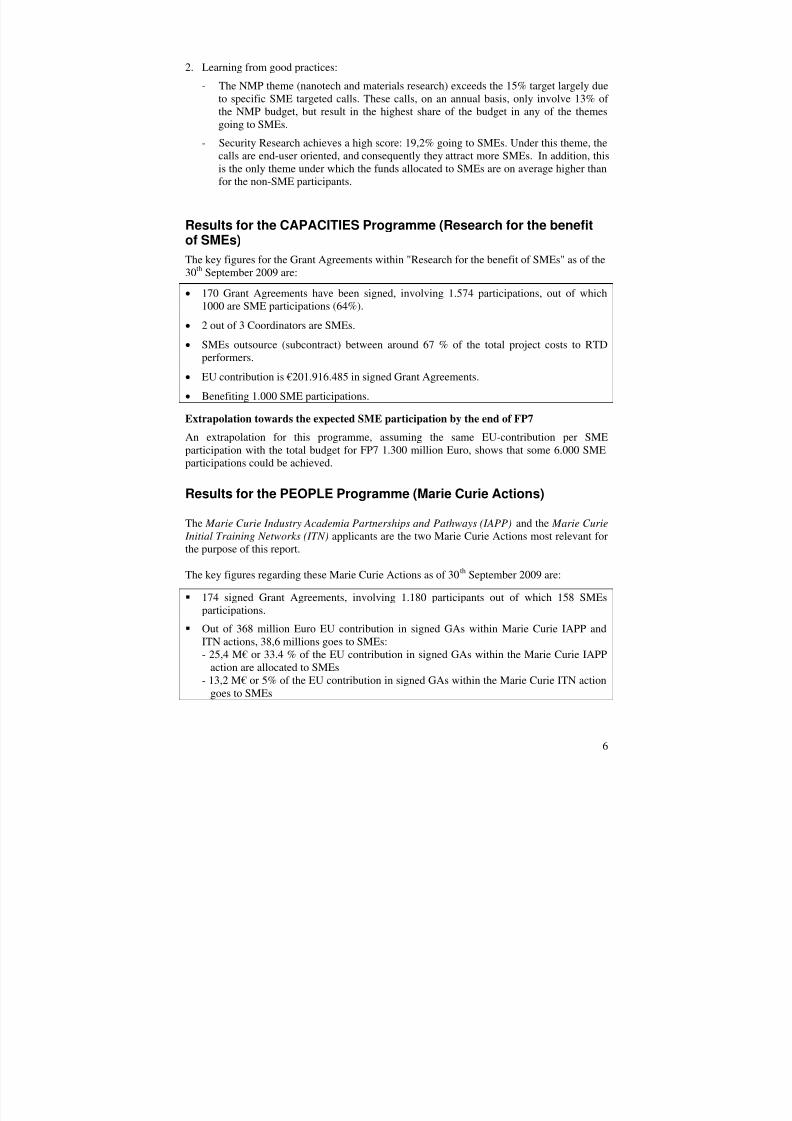
2. Learning from good practices:
- The NMP theme (nanotech and materials research) exceeds the 15% target largely dueto specific SME targeted calls. These calls, on an annual basis, only involve 13% of the NMP budget, but result in the highest share of the budget in any of the themesgoing to SMEs.
- Security Research achieves a high score: 19,2% going to SMEs. Under this theme, thecalls are end-user oriented, and consequently they attract more SMEs. In addition, thisis the only theme under which the funds allocated to SMEs are on average higher thanfor the non-SME participants.
Results for the CAPACITIES Programme (Research for the benefitof SMEs)The key figures for the Grant Agreements within "Research for the benefit of SMEs" as of the
30th
September 2009 are: 170 Grant Agreements have been signed, involving 1.574 participations, out of which
1000 are SME participations (64%). 2 out of 3 Coordinators are SMEs. SMEs outsource (subcontract) between around 67 % of the total project costs to RTD
performers. EU contribution is €201.916.485 in signed Grant Agreements. Benefiting 1.000 SME participations.
Extrapolation towards the expected SME participation by the end of FP7
An extrapolation for this programme, assuming the same EU-contribution per SMEparticipation with the total budget for FP7 1.300 million Euro, shows that some 6.000 SMEparticipations could be achieved.
Results for the PEOPLE Programme (Marie Curie Actions)
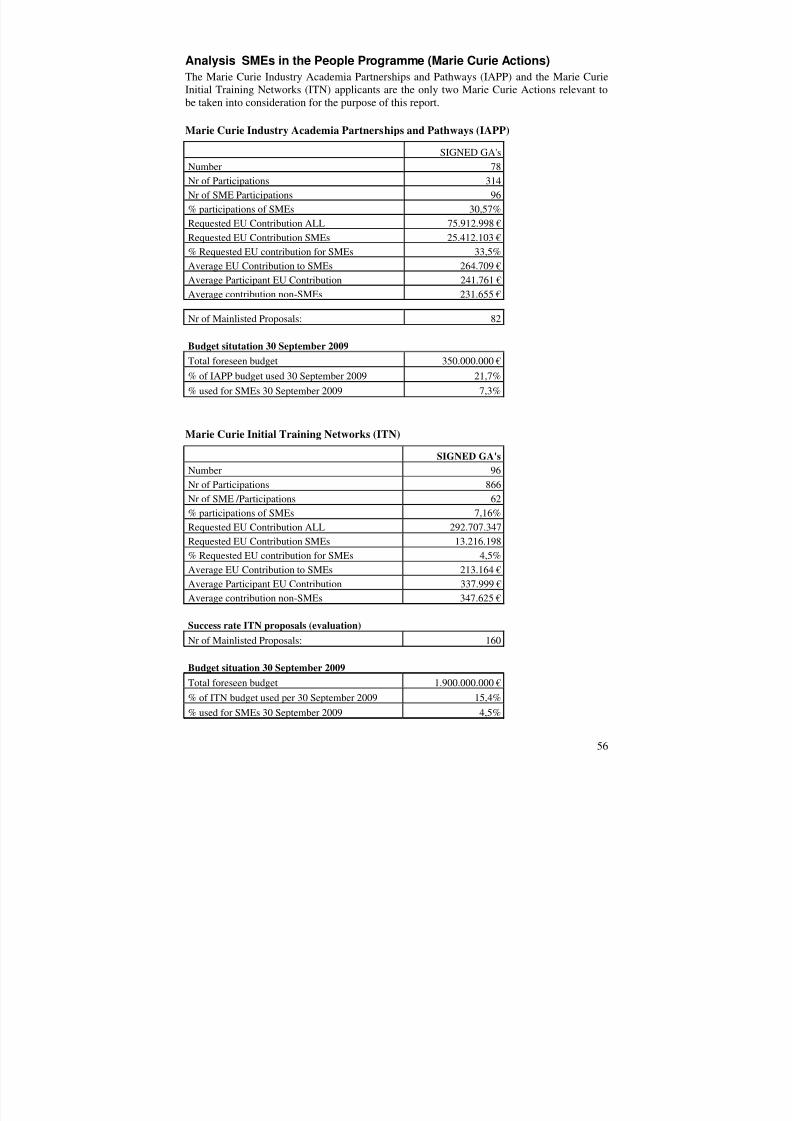
The Marie Curie Industry Academia Partnerships and Pathways (IAPP) and the Marie Curie Initial Training Networks (ITN) applicants are the two Marie Curie Actions most relevant for
the purpose of this report.The key figures regarding these Marie Curie Actions as of 30th September 2009 are:
174 signed Grant Agreements, involving 1.180 participants out of which 158 SMEsparticipations.
Out of 368 million Euro EU contribution in signed GAs within Marie Curie IAPP andITN actions, 38,6 millions goes to SMEs:- 25,4 M€ or 33.4 % of the EU contribution in signed GAs within the Marie Curie IAPP
action are allocated to SMEs- 13,2 M€ or 5% of the EU contribution in signed GAs within the Marie Curie ITN action
goes to SMEs
8/14/2019 SME 4th Progress report on SMEs participation in the 7th r&D Framework Programme
http://slidepdf.com/reader/full/sme-4th-progress-report-on-smes-participation-in-the-7th-rd-framework-programme 8/87
7
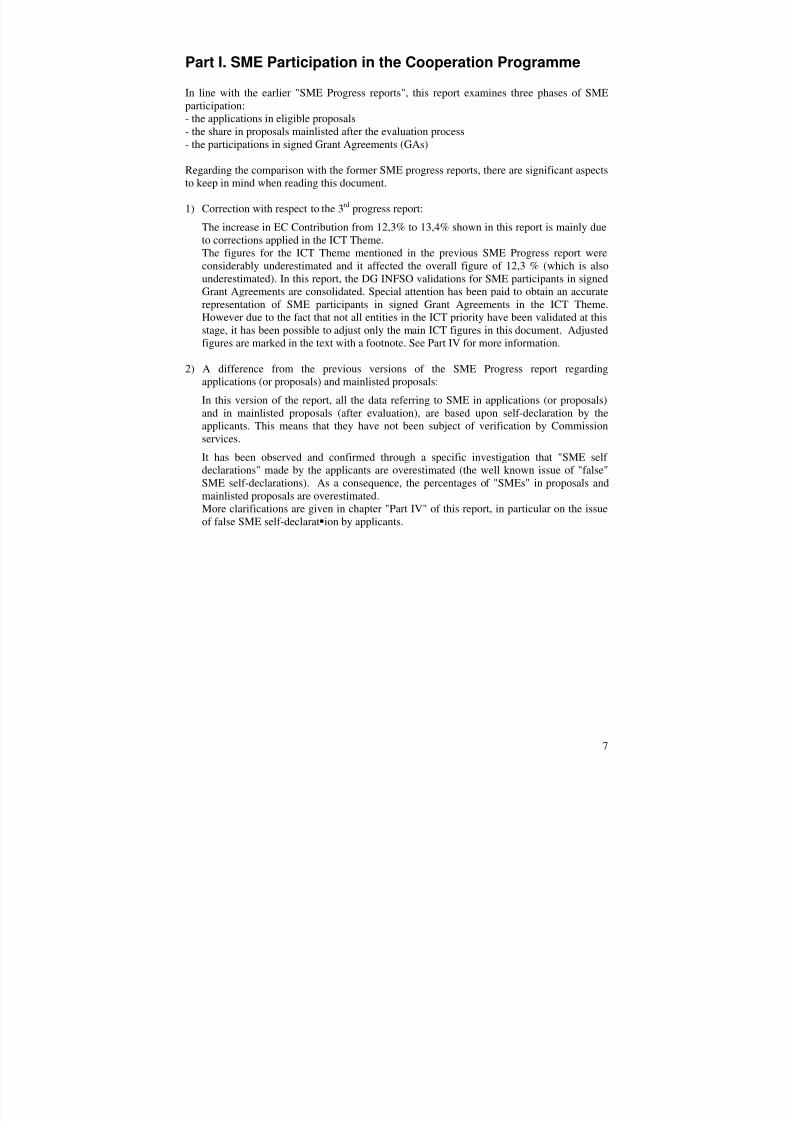
Part I. SME Participation in the Cooperation Programme
In line with the earlier "SME Progress reports", this report examines three phases of SMEparticipation:- the applications in eligible proposals- the share in proposals mainlisted after the evaluation process- the participations in signed Grant Agreements (GAs)
Regarding the comparison with the former SME progress reports, there are significant aspectsto keep in mind when reading this document.
1) Correction with respect to the 3rd progress report:The increase in EC Contribution from 12,3% to 13,4% shown in this report is mainly dueto corrections applied in the ICT Theme.The figures for the ICT Theme mentioned in the previous SME Progress report wereconsiderably underestimated and it affected the overall figure of 12,3 % (which is alsounderestimated). In this report, the DG INFSO validations for SME participants in signedGrant Agreements are consolidated. Special attention has been paid to obtain an accuraterepresentation of SME participants in signed Grant Agreements in the ICT Theme.However due to the fact that not all entities in the ICT priority have been validated at thisstage, it has been possible to adjust only the main ICT figures in this document. Adjustedfigures are marked in the text with a footnote. See Part IV for more information.
2) A difference from the previous versions of the SME Progress report regardingapplications (or proposals) and mainlisted proposals:In this version of the report, all the data referring to SME in applications (or proposals)
and in mainlisted proposals (after evaluation), are based upon self-declaration by theapplicants. This means that they have not been subject of verification by Commissionservices.It has been observed and confirmed through a specific investigation that "SME self declarations" made by the applicants are overestimated (the well known issue of "false"SME self-declarations). As a consequence, the percentages of "SMEs" in proposals andmainlisted proposals are overestimated.More clarifications are given in chapter "Part IV" of this report, in particular on the issueof false SME self-declaration by applicants.
8/14/2019 SME 4th Progress report on SMEs participation in the 7th r&D Framework Programme
http://slidepdf.com/reader/full/sme-4th-progress-report-on-smes-participation-in-the-7th-rd-framework-programme 9/87
A. SME applications in eligible proposals
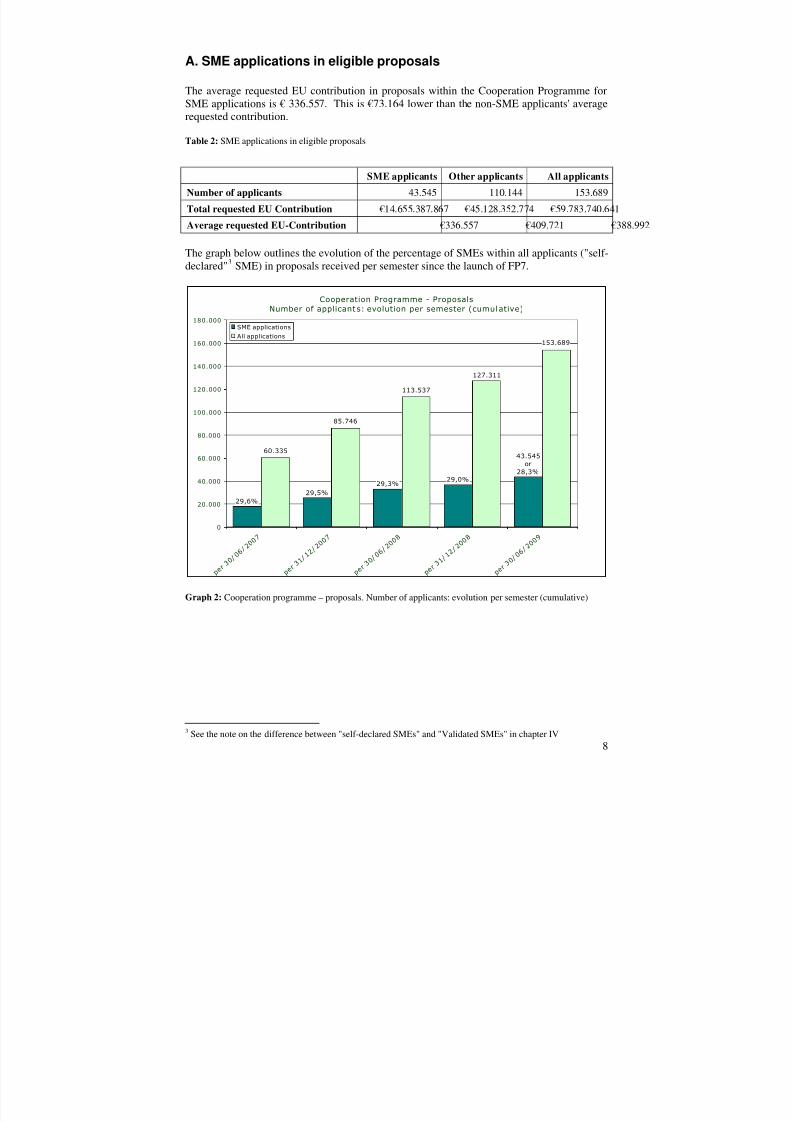
The average requested EU contribution in proposals within the Cooperation Programme forSME applications is € 336.557. This is €73.164 lower than the non-SME applicants' averagerequested contribution.
Table 2: SME applications in eligible proposals
SME applicants Other applicants All applicants
Number of applicants 43.545 110.144 153.689Total requested EU Contribution €14.655.387.867 €45.128.352.774 €59.783.740.641Average requested EU-Contribution €336.557 €409.721 €388.992 The graph below outlines the evolution of the percentage of SMEs within all applicants ("self-declared"3 SME) in proposals received per semester since the launch of FP7.
Cooperation Programme - ProposalsNumber of applicant s: evolution per semester (cumul ative)
8
29,0%29,3%
29,5%29,6%
0
20.000
40.000
60.000
80.000
100.000
120.000
140.000
160.000
180.000
p e r 3
0 / 0 6 / 2
0
SME applicationsAll applications
153.689
127.311
113.537
85.746
60.33543.545
or28,3%
0 7
p e r 3
1 / 1 2 / 2
0 0 7
p e r 3
0 / 0 6 / 2
0 0 8
p e r 3
1 / 1 2 / 2
0 0 8
p e r 3
0 / 0 6 / 2
0 0 9
Graph 2: Cooperation programme – proposals. Number of applicants: evolution per semester (cumulative)
3 See the note on the difference between "self-declared SMEs" and "Validated SMEs" in chapter IV

8/14/2019 SME 4th Progress report on SMEs participation in the 7th r&D Framework Programme
http://slidepdf.com/reader/full/sme-4th-progress-report-on-smes-participation-in-the-7th-rd-framework-programme 10/87
8/14/2019 SME 4th Progress report on SMEs participation in the 7th r&D Framework Programme
http://slidepdf.com/reader/full/sme-4th-progress-report-on-smes-participation-in-the-7th-rd-framework-programme 11/87
B. SME applications in mainlisted proposals (after evaluation)
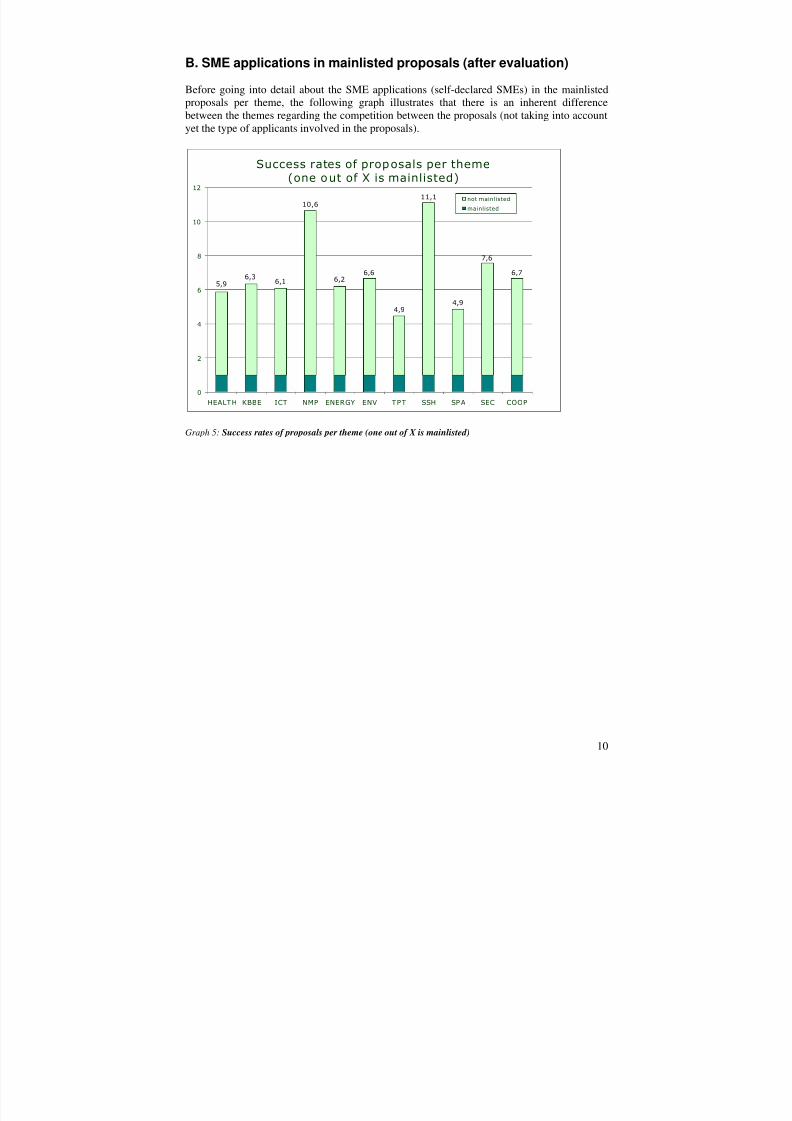
Before going into detail about the SME applications (self-declared SMEs) in the mainlistedproposals per theme, the following graph illustrates that there is an inherent differencebetween the themes regarding the competition between the proposals (not taking into accountyet the type of applicants involved in the proposals).
Success rates of prop osals per theme(one o ut of X is mainlisted)
0
2
4
6
8
10
12
HEALT H KBBE ICT NMP ENERGY ENV T PT SSH SP A SEC COOP
6,7
7,6
4,9
11,1
4,9
6,66,2
10,6
6,16,35,9
not mainlisted
mainlisted
Graph 5: Success rates of proposals per theme (one out of X is mainlisted)
10
8/14/2019 SME 4th Progress report on SMEs participation in the 7th r&D Framework Programme
http://slidepdf.com/reader/full/sme-4th-progress-report-on-smes-participation-in-the-7th-rd-framework-programme 12/87
Key data on SME applications in mainlisted proposals
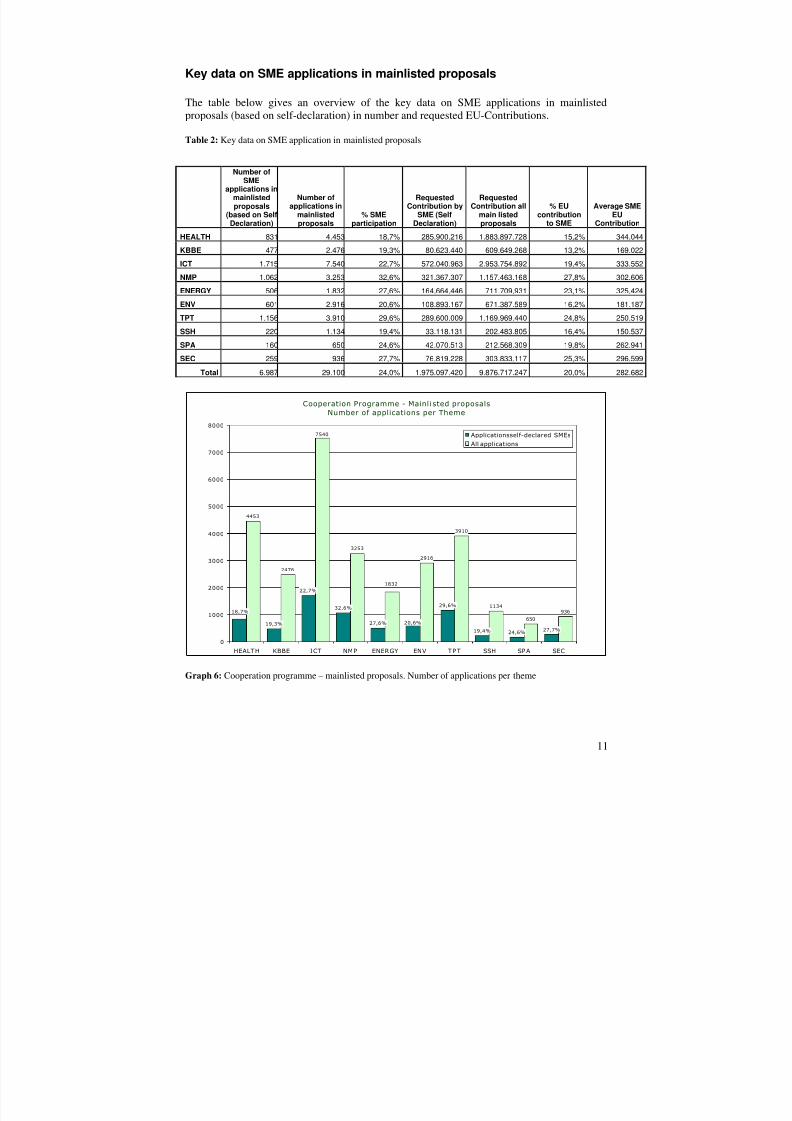
The table below gives an overview of the key data on SME applications in mainlistedproposals (based on self-declaration) in number and requested EU-Contributions.
Table 2: Key data on SME application in mainlisted proposals
Number ofSME
applications inmainlistedproposals
(based on SelfDeclaration)
Number ofapplications in
mainlistedproposals
% SMEparticipation
RequestedContribution by
SME (SelfDeclaration)
RequestedContribution all
main listedproposals
% EUcontribution
to SME
Average SMEEU
Contribution
HEALTH 831 4.453 18,7% 285.900.216 1.883.897.728 15,2% 344.044
KBBE 477 2.476 19,3% 80.623.440 609.649.268 13,2% 169.022
ICT 1.715 7.540 22,7% 572.040.963 2.953.754.892 19,4% 333.552
NMP 1.062 3.253 32,6% 321.367.307 1.157.463.168 27,8% 302.606ENERGY 506 1.832 27,6% 164.664.446 711.709.931 23,1% 325.424
ENV 601 2.916 20,6% 108.893.167 671.387.589 16,2% 181.187
TPT 1.156 3.910 29,6% 289.600.009 1.169.969.440 24,8% 250.519
SSH 220 1.134 19,4% 33.118.131 202.483.805 16,4% 150.537
SPA 160 650 24,6% 42.070.513 212.568.309 19,8% 262.941
SEC 259 936 27,7% 76.819.228 303.833.117 25,3% 296.599
Total 6.987 29.100 24,0% 1.975.097.420 9.876.717.247 20,0% 282.682
Cooperation Programme - Mainli sted proposals
Number of applications per Theme
11
2916
3910
1134
650936
27,7%24,6%19,4%
29,6%
20,6%27,6%
32,6%
22,7%
19,3%
18,7%
4453
2476
7540
3253
1832
0
1000
2000
3000
4000
5000
6000
7000
8000
HEALT H KBBE ICT NMP ENERGY ENV T P T SSH SP A SEC
Applicationsself-declared SMEsAll applications
Graph 6: Cooperation programme – mainlisted proposals. Number of applications per theme
8/14/2019 SME 4th Progress report on SMEs participation in the 7th r&D Framework Programme
http://slidepdf.com/reader/full/sme-4th-progress-report-on-smes-participation-in-the-7th-rd-framework-programme 13/87
8/14/2019 SME 4th Progress report on SMEs participation in the 7th r&D Framework Programme
http://slidepdf.com/reader/full/sme-4th-progress-report-on-smes-participation-in-the-7th-rd-framework-programme 14/87
8/14/2019 SME 4th Progress report on SMEs participation in the 7th r&D Framework Programme
http://slidepdf.com/reader/full/sme-4th-progress-report-on-smes-participation-in-the-7th-rd-framework-programme 15/87
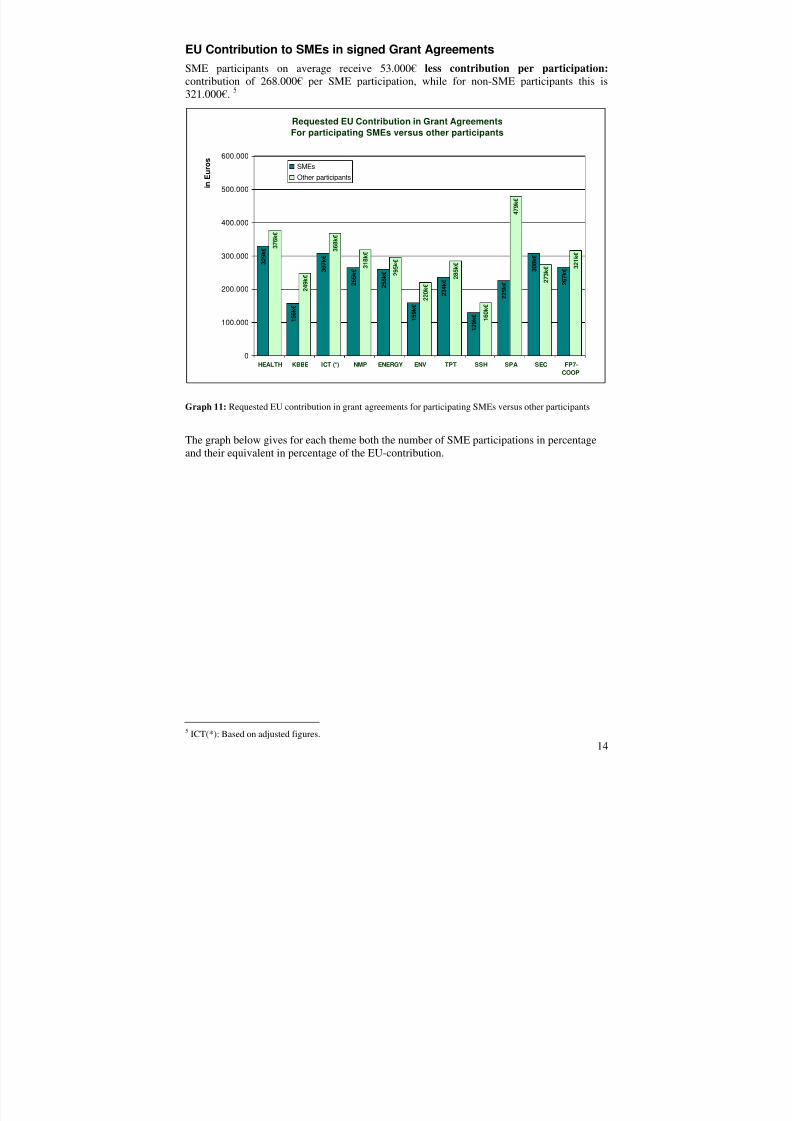
EU Contribution to SMEs in signed Grant AgreementsSME participants on average receive 53.000€less contribution per participation:contribution of 268.000€ per SME participation, while for non-SME participants this is321.000€.5
Requested EU Contribution in Grant AgreementsFor participating SMEs versus other participants
3 2 1 k €
2 7 3 k €
4 7 9 k €
1 6 0 k €
2 8 5 k €
2 2 0 k €
2 9 5 k € 3 1 8 k €
3 6 8 k €
2 4 9 k €
3 7 6 k €
HEALTH KBBE ICT (*) NMP ENERGY ENV TPT SSH SPA SEC FP7-COOP
2 6 7 k € 3 0 8 k €
2 2 5 k €
1 2 9 k €
2 3 4 k €
1 5 9 k €
2 5 8 k €
2 6 5 k € 3 0 7 k €
1 5 6 k €
3 2 9 k €
0
100.000
200.000
300.000
400.000
500.000
600.000
i n E u r o s
SMEsOther participants
Graph 11: Requested EU contribution in grant agreements for participating SMEs versus other participants
The graph below gives for each theme both the number of SME participations in percentageand their equivalent in percentage of the EU-contribution.
145 ICT(*): Based on adjusted figures.
8/14/2019 SME 4th Progress report on SMEs participation in the 7th r&D Framework Programme
http://slidepdf.com/reader/full/sme-4th-progress-report-on-smes-participation-in-the-7th-rd-framework-programme 16/87
Cooperation Programme - Signed Grant AgreementsPercentage of SME participations / EC contribution to SMEs
15,7%
8,6%
15,4%
3,2%
7,8%
19,2%
13,4%12,1%
11,7
16,6%
25,8%
15,9%
11,5%
18,26%
3,9%
15,3%
17,4%
14,2%
22,5%
14,4%
7,6%
10,8%
0%
5%
10%
15%
20%
25%
30%
HEALTH KBBE ICT NMP ENERGY ENV TPT SSH SPA SEC FP7-COOP
%of SM E participations
%EC contribution to SMEs
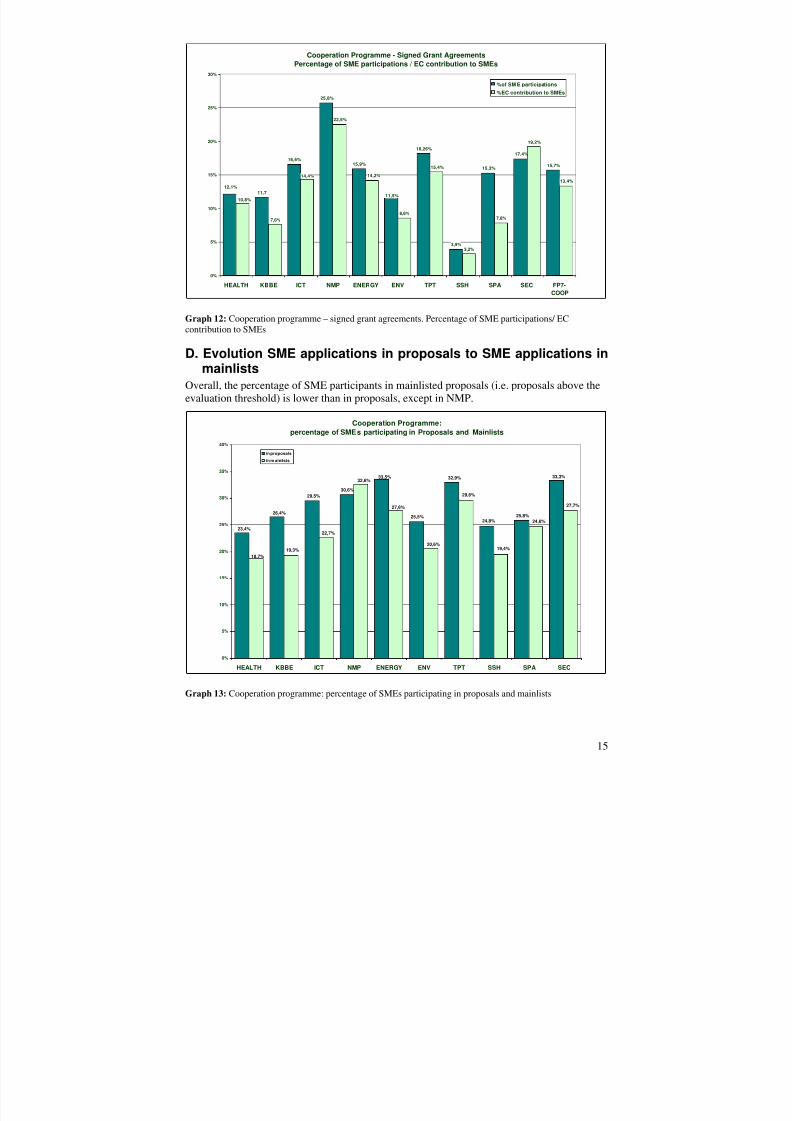
Graph 12: Cooperation programme – signed grant agreements. Percentage of SME participations/ ECcontribution to SMEs
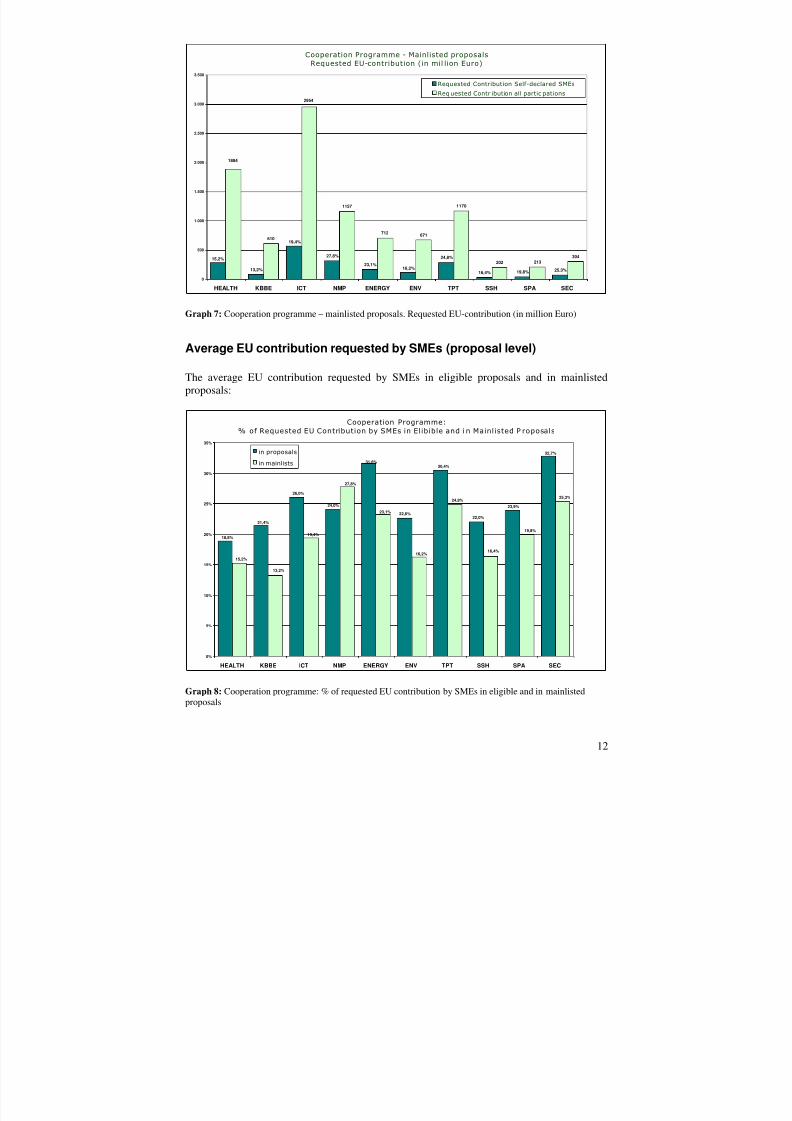
D. Evolution SME applications in proposals to SME applications inmainlists
Overall, the percentage of SME participants in mainlisted proposals (i.e. proposals above theevaluation threshold) is lower than in proposals, except in NMP.
Cooperation Programme:percentage of SMEs participating in Proposals and Mainlists
0%
5%
10%
15%
20%
25%
30%
35%
40%
HEALTH KBBE ICT NMP ENERGY ENV TPT SSH SPA SEC
in proposals
in m ainlists
30,6%
25,5%
32,9%33,5%
29,5%
25,8%24,8%
23,4%
26,4%
33,3%
22,7%
32,6%
19,3%
27,6%
20,6%
24,6%
29,6%
18,7%
19,4%
27,7%
Graph 13: Cooperation programme: percentage of SMEs participating in proposals and mainlists
15
8/14/2019 SME 4th Progress report on SMEs participation in the 7th r&D Framework Programme
http://slidepdf.com/reader/full/sme-4th-progress-report-on-smes-participation-in-the-7th-rd-framework-programme 17/87
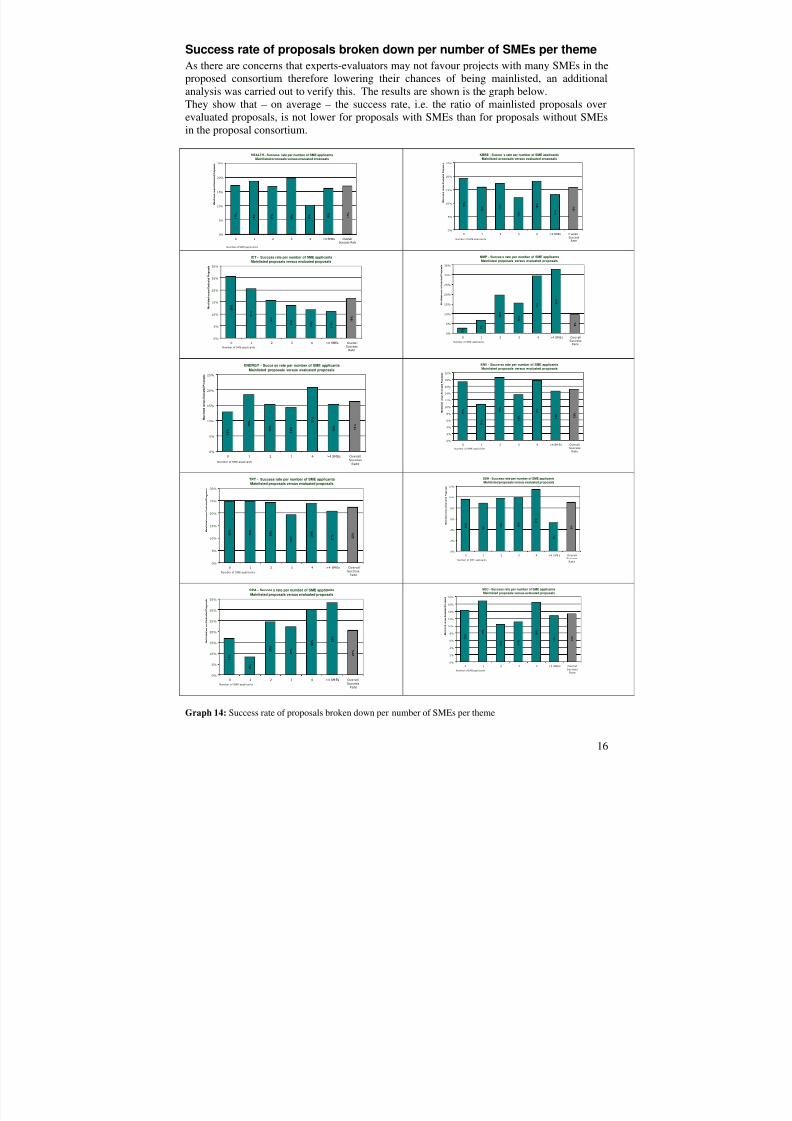
Success rate of proposals broken down per number of SMEs per themeAs there are concerns that experts-evaluators may not favour projects with many SMEs in theproposed consortium therefore lowering their chances of being mainlisted, an additionalanalysis was carried out to verify this. The results are shown is the graph below.They show that – on average – the success rate, i.e. the ratio of mainlisted proposals overevaluated proposals, is not lower for proposals with SMEs than for proposals without SMEsin the proposal consortium.
16
HEALTH - Success rate per number of SME applicantsMainlisted proposals versus evaluated proposals
0%
5%
10%
15%
20%
25%
KBBE - Succes s rate per number of SME applicantsMainlisted proposals versus evaluated proposals
0%
5%
10%
15%
20%
25%
1 9 %
1 6 % 1
7 %
1 2 %
1 8 %
1 3 % 1
6 %
0 1 2 3 4 >4 SMEs OverallSuccess
RateNumber of SME applicants
M a
i n l i s t e d v e r s u s
E v a
l u a t e
d P r o p o s a
l s
1 7 % 1 6 %
1 0 % 2 0 %
1 7 %
1 7 %
1 9 %
0 1 2 3 4 >4 SMEs OverallSuccess Rate
Number of SME applicants
M a i n
l i s t e d v e r s u s
E v a l u a t e d
P r o p o s a l s
ICT - Success rate per number of SME applicantsMainlisted proposals versus evaluated proposals
0%
5%
10%
15%
20%
25%
30%
NMP - Succes s rate per number of SME applicantsMainlisted proposals versus evaluated proposals
0%
5%
10%
15%
20%
25%
30%
35%
3 %
7 %
1 9 %
1 5 %
2 9 % 3 3 %
9 %
0 1 2 3 4 >4 SMEs OverallSuccess
RateNumber of SME applicants
M a
i n l i s t e d v e r s u s
E v a
l u a t e d
P r o p o s a l s
2 6 %
2 1 %
1 6 %
1 3 %
1 2 %
1 1 %
1 6 %
0 1 2 3 4 >4 SMEs OverallSuccess
RateNumber of SME applicants
M a i n
l i s t e d v e r s u s
E v a l u a t e
d P r o p o s a l s
ENERGY - Succe ss rate per number of SME applicants
Mainlisted proposals versus evaluated proposals
0%
5%
10%
15%
20%
25%
ENV - Succe ss rate per number of SME applicantsMainlisted proposals versus evaluated proposals
0%
2%
4%
6%
8%
10%
12%
14%
16%
18%
20%
1 7 %
1 1 %
1 9 %
1 3 %
1 8 %
1 4 % 1 5 %
0 1 2 3 4 >4 SMEs OverallSuccess
RateNumber of SME applicants
M a
i n l i s t e d v e r s u s
E v a
l u a t e
d P r o p o s a l s
1 3 %
1 8 %
1 5 %
1 4 %
2 1 %
1 5 %
1 6 %
0 1 2 3 4 >4 SMEs OverallSuccess
RateNumber of SME applicants
M a i n
l i s t e d v e r s u s
E v a l u a t e d
P r o p o s a l s
TPT - Success rate per number of SME applicantsMainlisted proposals versus evaluated proposals
0%
5%
10%
15%
20%
25%
30%
SSH - Success rate per number of SME applicantsMainlisted proposals versus evaluated proposals
0%
2%
4%
6%
8%
10%
12%
1 0 %
9 % 1 0 %
1 0 % 1 1
%
5 %
9 %
0 1 2 3 4 >4 SMEs OverallSuccess
RateNumber of SME applicants
M a
i n l i s t e d v e r s u s
E v a
l u a
t e d P r o p o s a
l s
2 5 % 2 5 %
2 4 %
1 9 %
2 4 %
2 1 % 2 2 %
0 1 2 3 4 >4 SMEs Overa llSuccess
RateNumber of SME applicants
M a i n
l i s t e d v e r s u s
E v a l u a t e
d P r o p o s a l s
SPA - Succes s rate per number of SME applicantsMainlisted proposals versus evaluated proposals
0%
5%
10%
15%
20%
25%
30%
35%
SEC - Success rate per number of SME applicantsMainlisted proposals versus evaluated proposals
0%
2%
4%
6%
8%
10%
12%
14%
16%
18%
1 4 %
1 7 %
1 0 %
1 1 %
1 6 %
1 3 %
1 3 %
0 1 2 3 4 >4 SMEs OverallSuccess
RateNumber of SME applicants
M a i n
l i s t e d v e r s u s
E v a l u a t e d
P r o p o s a l s
1 7 %
8 %
2 4 %
2 2 %
3 0 % 3
3 %
2 1 %
0 1 2 3 4 >4 SMEs OverallSuccess
RateNumber of SME applicants
M a
i n l i s t e d v e r s u s
E v a l u a t e
d P r o p o s a
l s
Graph 14: Success rate of proposals broken down per number of SMEs per theme
8/14/2019 SME 4th Progress report on SMEs participation in the 7th r&D Framework Programme
http://slidepdf.com/reader/full/sme-4th-progress-report-on-smes-participation-in-the-7th-rd-framework-programme 18/87
Overall:FP7-COOP - Success rate per number of SME applicants
Percentage of mainlisted proposals versus evaluated proposals(with total number of mainlisted proposals in the category)
0%
2%
4%
6%
8%
10 %
12 %
14 %
16 %
18 %
1 5 % -
2 . 6
5 2
1 6 % -
4 4 9
1 6 % -
2 8 3
1 5 % -
3 6 6
1 7 % -
5 2 1
1 6 % -
5 5 8
1 2 %
- 4 7 5
0 1 2 3 4 >4 SMEs OverallSuccess Rate
Number of SME applicants
M a
i n l i s t e d v e r s u s
E v a
l u a
t e d P r o p o s a
l s
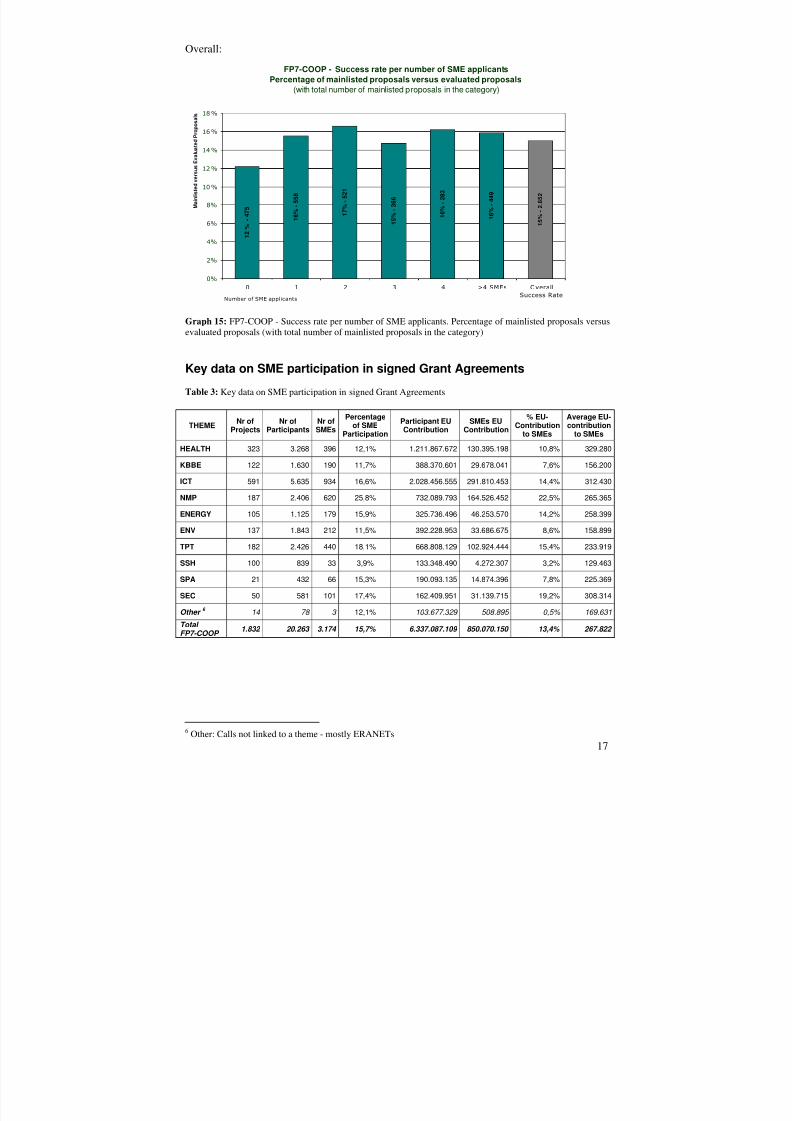
Graph 15: FP7-COOP - Success rate per number of SME applicants. Percentage of mainlisted proposals versusevaluated proposals (with total number of mainlisted proposals in the category)
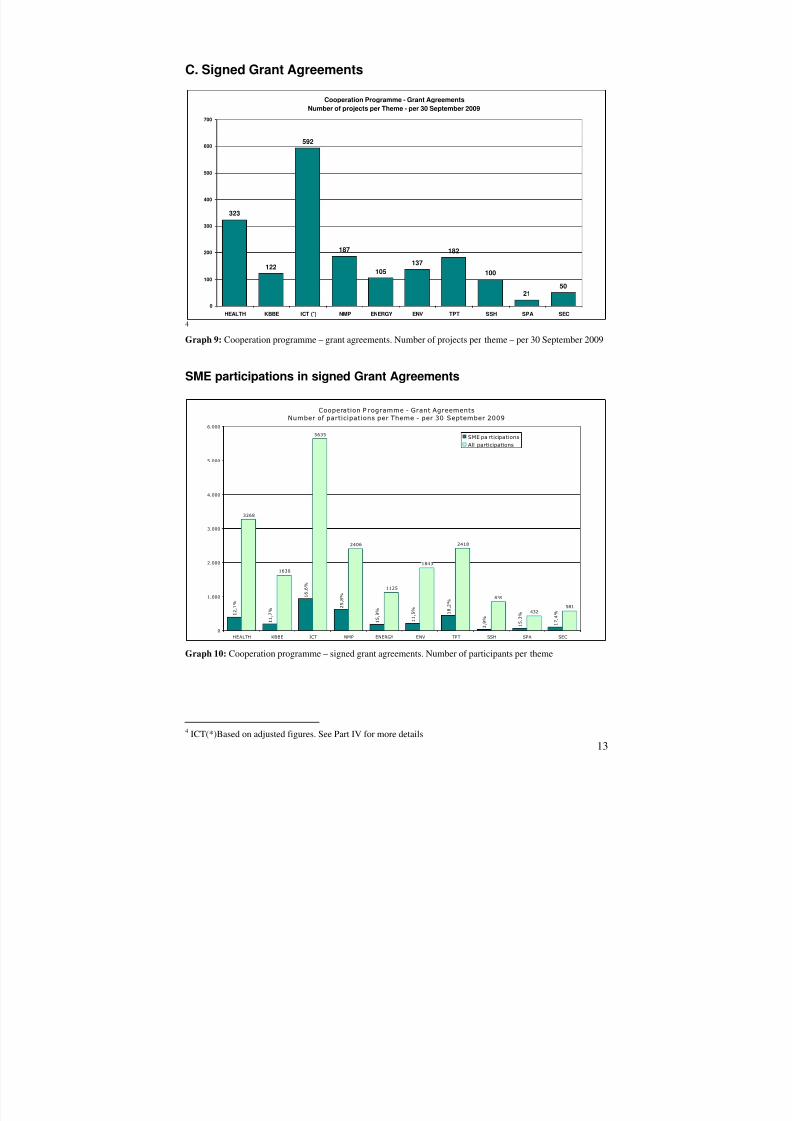
Key data on SME participation in signed Grant Agreements
Table 3: Key data on SME participation in signed Grant Agreements
THEME Nr ofProjects
Nr ofParticipants
Nr ofSMEs
Percentageof SME
Participation
Participant EUContribution
SMEs EUContribution
% EU-Contribution
to SMEs
Average EU-contribution
to SMEs
HEALTH 323 3.268 396 12,1% 1.211.867.672 130.395.198 10,8% 329.280
KBBE 122 1.630 190 11,7% 388.370.601 29.678.041 7,6% 156.200
ICT 591 5.635 934 16,6% 2.028.456.555 291.810.453 14,4% 312.430
NMP 187 2.406 620 25,8% 732.089.793 164.526.452 22,5% 265.365
ENERGY 105 1.125 179 15,9% 325.736.496 46.253.570 14,2% 258.399
ENV 137 1.843 212 11,5% 392.228.953 33.686.675 8,6% 158.899
TPT 182 2.426 440 18,1% 668.808.129 102.924.444 15,4% 233.919
SSH 100 839 33 3,9% 133.348.490 4.272.307 3,2% 129.463
SPA 21 432 66 15,3% 190.093.135 14.874.396 7,8% 225.369
SEC 50 581 101 17,4% 162.409.951 31.139.715 19,2% 308.314
Other 6 14 78 3 12,1% 103.677.329 508.895 0,5% 169.631
Total FP7-COOP 1.832 20.263 3.174 15,7% 6.337.087.109 850.070.150 13,4% 267.822
176 Other: Calls not linked to a theme - mostly ERANETs
8/14/2019 SME 4th Progress report on SMEs participation in the 7th r&D Framework Programme
http://slidepdf.com/reader/full/sme-4th-progress-report-on-smes-participation-in-the-7th-rd-framework-programme 19/87
8/14/2019 SME 4th Progress report on SMEs participation in the 7th r&D Framework Programme
http://slidepdf.com/reader/full/sme-4th-progress-report-on-smes-participation-in-the-7th-rd-framework-programme 20/87
E. Types of SMEs participating in FP7-COOP
In June 2009 an in-depth analysis into the type of SMEs participating in FP7 showed twoaspects related to the nature of SMEs.
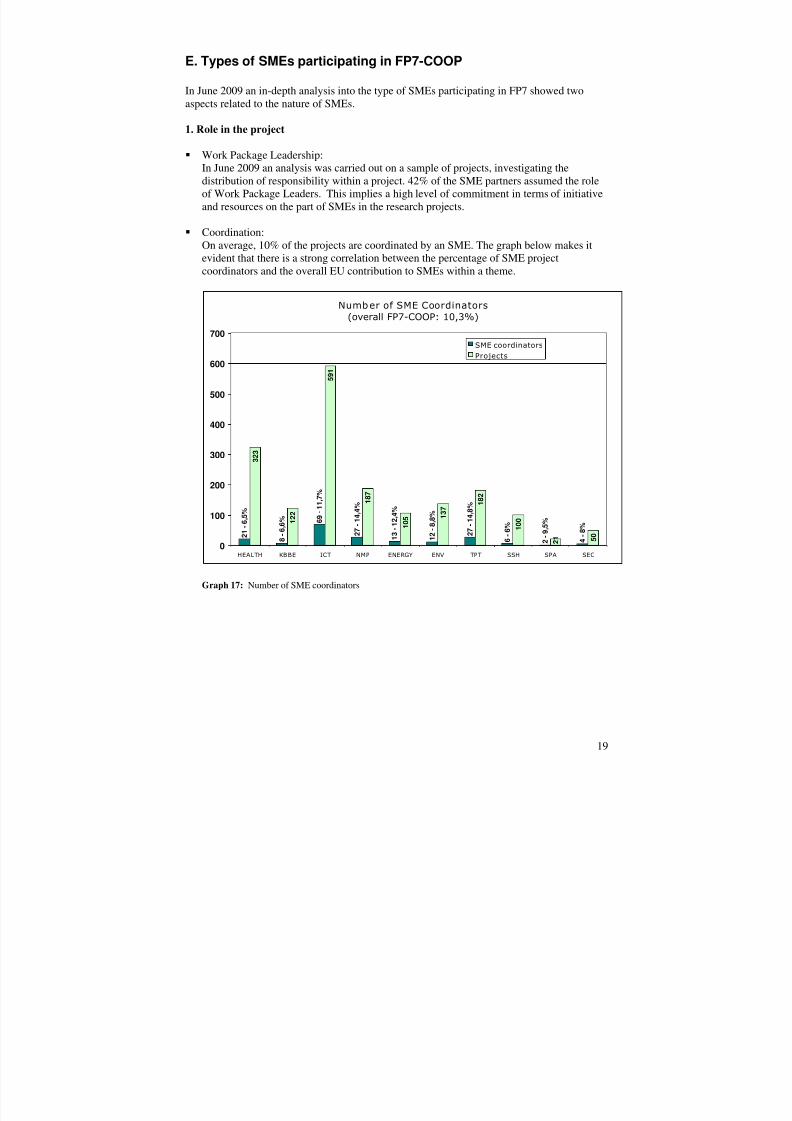
1. Role in the project
Work Package Leadership:In June 2009 an analysis was carried out on a sample of projects, investigating thedistribution of responsibility within a project. 42% of the SME partners assumed the roleof Work Package Leaders. This implies a high level of commitment in terms of initiativeand resources on the part of SMEs in the research projects.
Coordination:On average, 10% of the projects are coordinated by an SME. The graph below makes itevident that there is a strong correlation between the percentage of SME projectcoordinators and the overall EU contribution to SMEs within a theme.
Numb er of SME Coordinators(overall FP7-COOP: 10,3%)
3 2 3
1 2 2
5 9 1
1 8 7
1 0 5 1 3
7 1 8 2
1 0 0
2 1 5 0
4 - 8
%
2 -
9 , 5 %
6 -
6 % 2 7 -
1 4 , 8 %
1 2 - 8 , 8
%
1 3 - 1
2 , 4 %
2 7 -
1 4 , 4 %
6 9 - 1
1 , 7 %
8 - 6 , 6
%
2 1 - 6 , 5 %
0
100
200
300
400
500
600
700
HEALTH KBBE ICT NMP ENERGY ENV TPT SSH SPA SEC
SME coordinatorsProjects
Graph 17: Number of SME coordinators
19
8/14/2019 SME 4th Progress report on SMEs participation in the 7th r&D Framework Programme
http://slidepdf.com/reader/full/sme-4th-progress-report-on-smes-participation-in-the-7th-rd-framework-programme 21/87
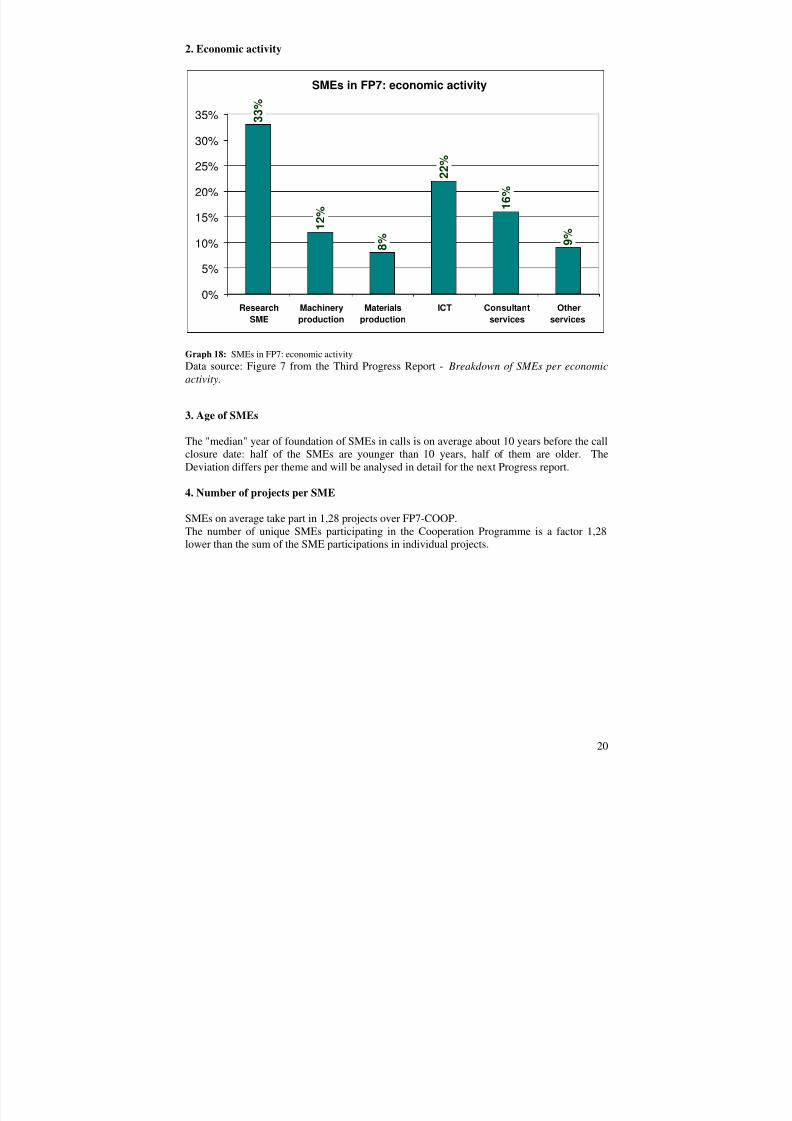
2. Economic activity
SMEs in FP7: economic activity
3 3 %
1 2 %
8 %
2 2 %
1 6 %
9 %
0%
5%
10%
15%
20%
25%
30%
35%
ResearchSME
Machineryproduction
Materialsproduction
ICT Consultantservices
Otherservices
Graph 18: SMEs in FP7: economic activityData source: Figure 7 from the Third Progress Report - Breakdown of SMEs per economicactivity.
3. Age of SMEs
The "median" year of foundation of SMEs in calls is on average about 10 years before the callclosure date: half of the SMEs are younger than 10 years, half of them are older. TheDeviation differs per theme and will be analysed in detail for the next Progress report.
4. Number of projects per SME
SMEs on average take part in 1,28 projects over FP7-COOP.The number of unique SMEs participating in the Cooperation Programme is a factor 1,28lower than the sum of the SME participations in individual projects.
20
8/14/2019 SME 4th Progress report on SMEs participation in the 7th r&D Framework Programme
http://slidepdf.com/reader/full/sme-4th-progress-report-on-smes-participation-in-the-7th-rd-framework-programme 22/87
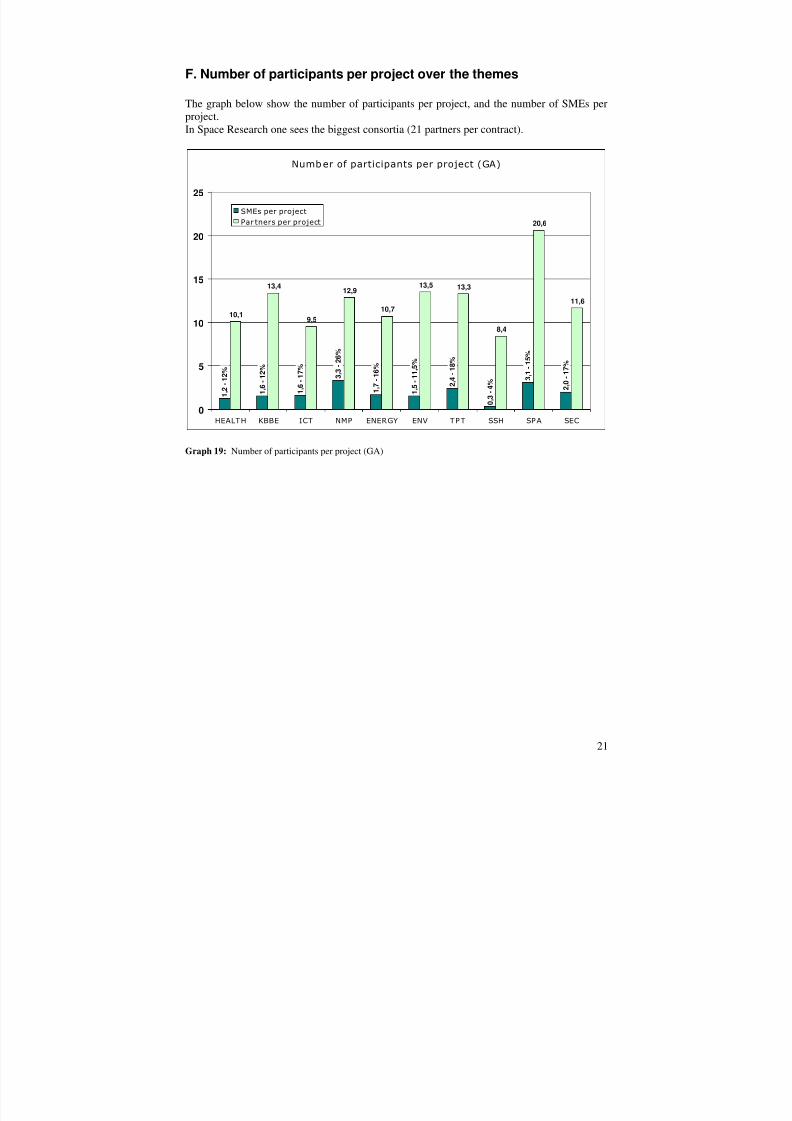
F. Number of participants per project over the themes
The graph below show the number of participants per project, and the number of SMEs perproject.In Space Research one sees the biggest consortia (21 partners per contract).
Numb er of participants per project (GA)
10,1
13,4
9,5
12,9
10,7
13,5 13,3
8,4
20,6
11,6
2 , 0 - 1
7 %
3 , 1
- 1 5 %
0 , 3
- 4 % 2 ,
4 -
1 8 %
1 , 5
- 1 1
, 5 %
1 , 7 -
1 6 %
3 , 3 -
2 6 %
1 , 6 - 1
7 %
1 , 6
- 1 2 %
1 , 2
- 1 2 %
0
5
10
15
20
25
HEALT H KBBE ICT NMP ENERGY ENV T P T SSH SP A SEC
SMEs per projectPar tners per project
Graph 19: Number of participants per project (GA)
21
8/14/2019 SME 4th Progress report on SMEs participation in the 7th r&D Framework Programme
http://slidepdf.com/reader/full/sme-4th-progress-report-on-smes-participation-in-the-7th-rd-framework-programme 23/87
22
G. Analysis per theme in FP7-COOPFor each theme an overview is made with the key figures of proposals and signed GrantAgreements. 30 September 2009 was the cut-off date.
Please note that all data on SME applications in proposals are based upon self-declaration. Atthe level of Grant Agreements, their SME-status has been validated8.
Extrapolation of the number of SME participations within reach:
Each analysis includes an extrapolation of the number of participations of SMEswhich can be reached within the theme during FP7. This extrapolation assumes thatthe average EC contribution to SMEs will stay at the same level, as is made for the15% target and for the current % of contribution to SMEs.This means that in some programmes, such as NMP and SEC, more SMEs are reachedthan with the 15% target (the "Flagship" themes), and for other, such as KBBE andSPACE, EU contribution to SMEs falls below 15%.
The final analysis is an overall view of the Cooperation programme, where the extrapolationgoes a step further, taking into account the "recurrence" of SME participation:
Within the Cooperation Programme, an "average SME" participates in 1,28 projects. This means that the number of "unique SMEs" is the number of SME participations
divided by 1,28The extrapolations are done both for the target of 15% of the budget and with the currentpercentage of the budget allocation per theme.
8 For clarification on the differences between Self-declared SMEs and Validated SMEs, see chapter IV
8/14/2019 SME 4th Progress report on SMEs participation in the 7th r&D Framework Programme
http://slidepdf.com/reader/full/sme-4th-progress-report-on-smes-participation-in-the-7th-rd-framework-programme 24/87
23
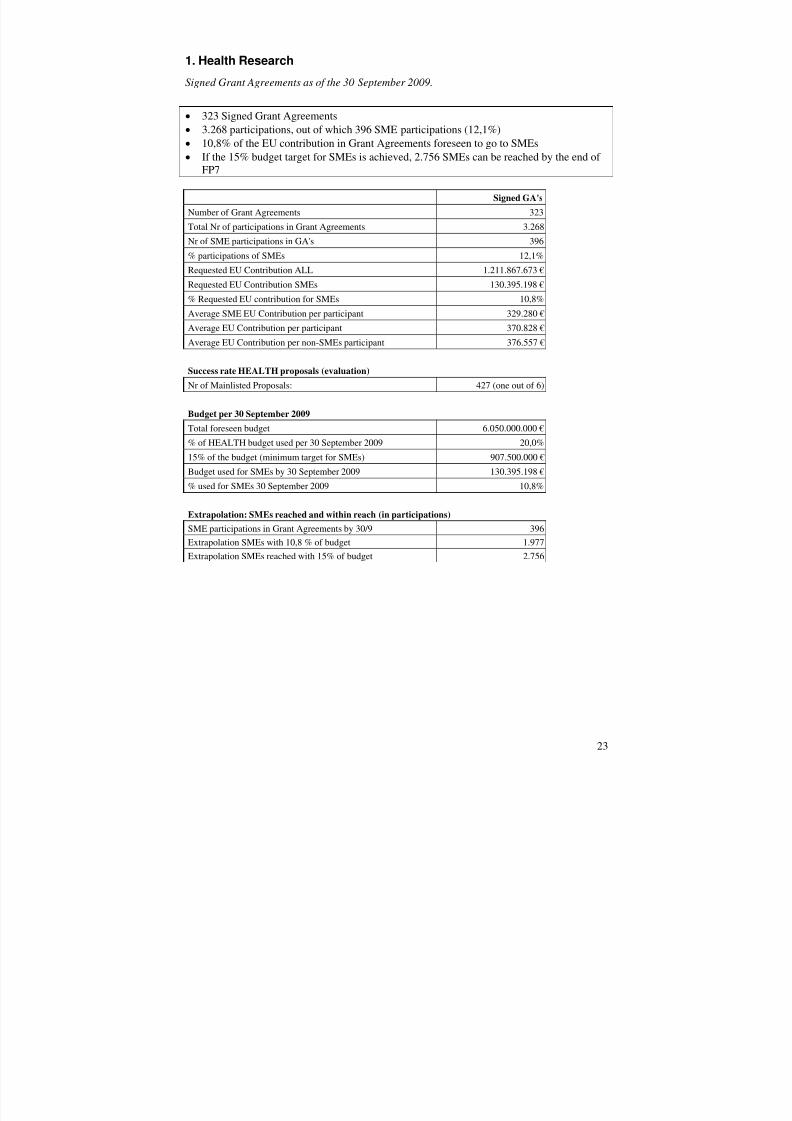
1. Health Research
Signed Grant Agreements as of the 30 September 2009.
323 Signed Grant Agreements 3.268 participations, out of which 396 SME participations (12,1%) 10,8% of the EU contribution in Grant Agreements foreseen to go to SMEs If the 15% budget target for SMEs is achieved, 2.756 SMEs can be reached by the end of
FP7
Signed GA's
Number of Grant Agreements 323Total Nr of participations in Grant Agreements 3.268Nr of SME participations in GA's 396% participations of SMEs 12,1%Requested EU Contribution ALL 1.211.867.673 €Requested EU Contribution SMEs 130.395.198 €% Requested EU contribution for SMEs 10,8%Average SME EU Contribution per participant 329.280 €Average EU Contribution per participant 370.828 €Average EU Contribution per non-SMEs participant 376.557 €
Success rate HEALTH proposals (evaluation)
Nr of Mainlisted Proposals: 427 (one out of 6)
Budget per 30 September 2009Total foreseen budget 6.050.000.000 €% of HEALTH budget used per 30 September 2009 20,0%15% of the budget (minimum target for SMEs) 907.500.000 €Budget used for SMEs by 30 September 2009 130.395.198 €% used for SMEs 30 September 2009 10,8%
Extrapolation: SMEs reached and within reach (in participations) SME participations in Grant Agreements by 30/9 396Extrapolation SMEs with 10,8 % of budget 1.977
Extrapolation SMEs reached with 15% of budget 2.756
8/14/2019 SME 4th Progress report on SMEs participation in the 7th r&D Framework Programme
http://slidepdf.com/reader/full/sme-4th-progress-report-on-smes-participation-in-the-7th-rd-framework-programme 25/87
HEALTH - Success rate per number of SME applicants
Mainlisted proposals versus evaluated proposals
0%
5%
10%
15%
20%
25%
1 7 %
1 6 %
1 0 %
2 0 %
1 7 %
1 7 %
1 9 %
0 1 2 3 4 >4 SMEs OverallSuccess Rate
Number of SME applicants
M a
i n l i s t e d v e r s u s
E v a
l u a
t e d P r o p o s a
l s
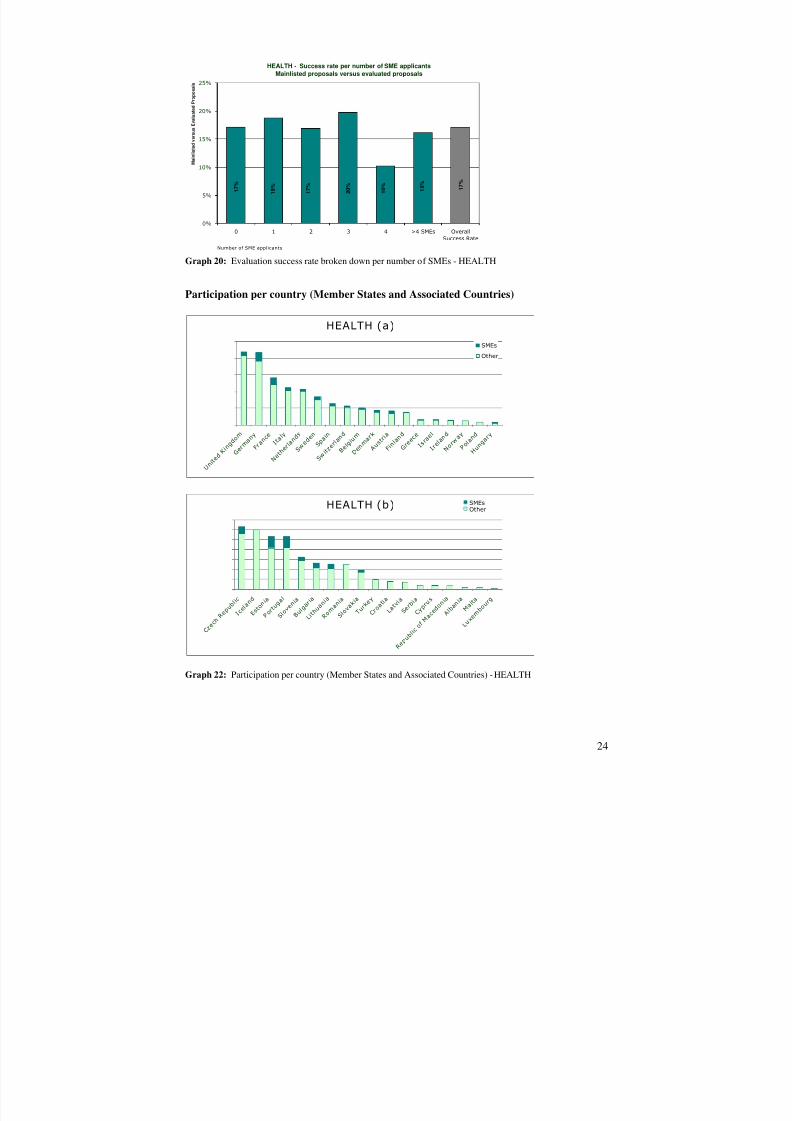
Graph 20: Evaluation success rate broken down per number of SMEs - HEALTH
Participation per country (Member States and Associated Countries)
HEALTH (a)
SMEs
Other
U n i t e
d K i n
g d o m
G e r m
a n y
F r a n
c e I t a
l y
N e t h
e r l a n
d s
S w e d
e n S p
a i n
S w i t z
e r l a n
d
B e l g i
u m
D e n m
a r k
A u s t
r i a
F i n l a n
d
G r e e
c e I s
r a e l
I r e l a
n d
N o r w
a y
P o l a
n d
H u n g
a r y
HEALTH (b) SMEsOther
C z e c
h R e p
u b l i c
I c e l a
n d
E s t o
n i a
P o r t u
g a l
S l o v
e n i a
B u l g
a r i a
L i t h u
a n i a
R o
i a
S l o v
a k i a
T u r k
e y
C r o a
t i a
L a t v
i a
S e r b
i a
C y p r
u s
R e p u
b l i c
o f M a c
e d o n
i a
A l b a
n i a
M a l t a
L u x e
m b o
u r g
m a n
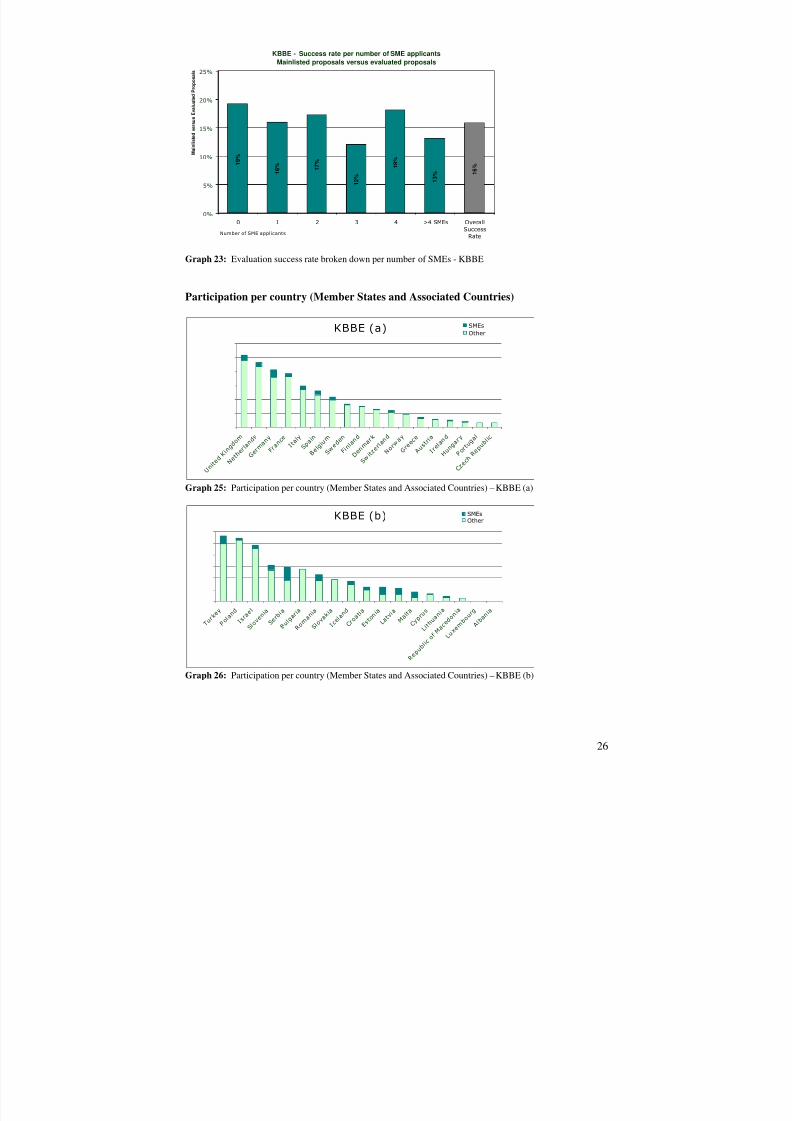
Graph 22: Participation per country (Member States and Associated Countries) - HEALTH
24
8/14/2019 SME 4th Progress report on SMEs participation in the 7th r&D Framework Programme
http://slidepdf.com/reader/full/sme-4th-progress-report-on-smes-participation-in-the-7th-rd-framework-programme 26/87
25
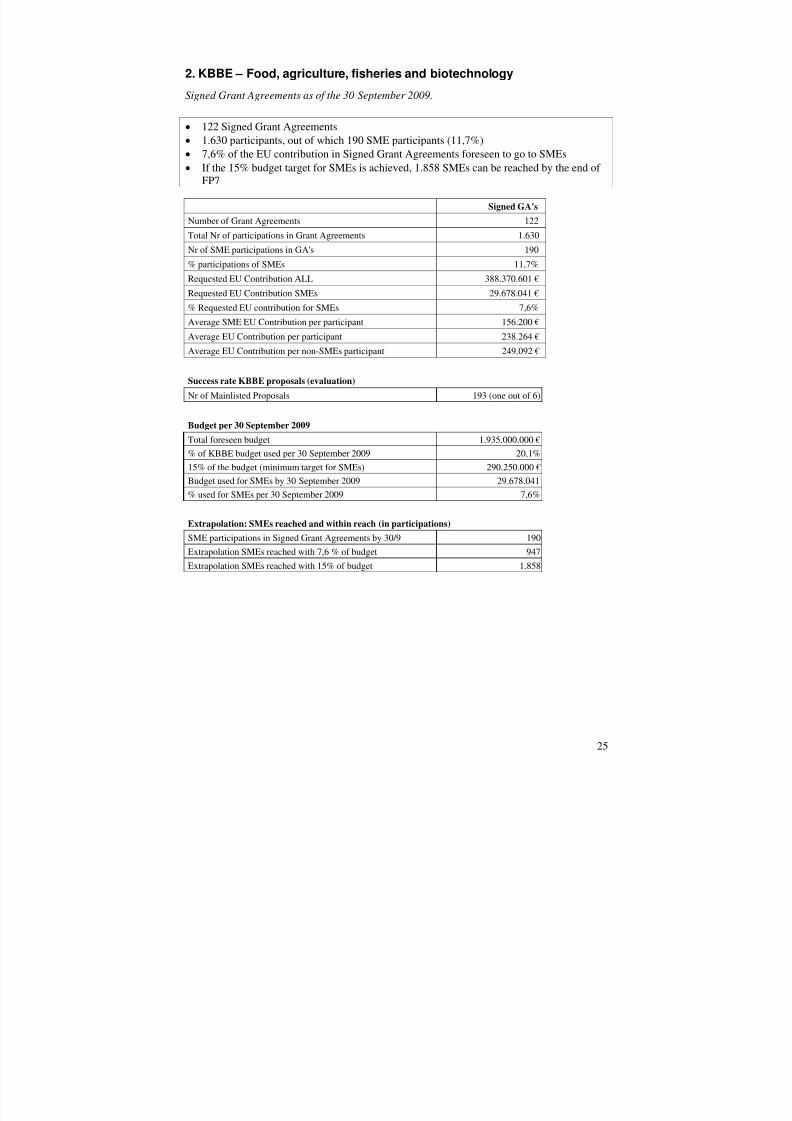
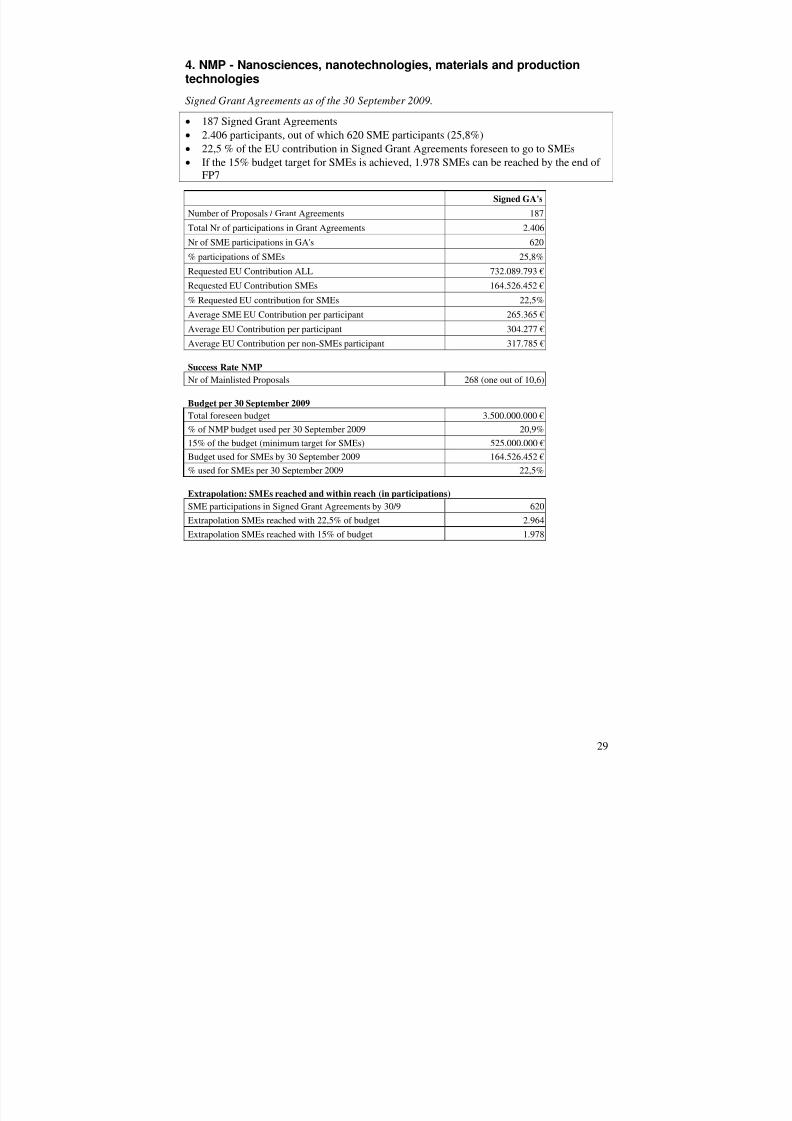
2. KBBE – Food, agriculture, fisheries and biotechnology
Signed Grant Agreements as of the 30 September 2009.
122 Signed Grant Agreements 1.630 participants, out of which 190 SME participants (11,7%) 7,6% of the EU contribution in Signed Grant Agreements foreseen to go to SMEs If the 15% budget target for SMEs is achieved, 1.858 SMEs can be reached by the end of
FP7
Signed GA's
Number of Grant Agreements 122Total Nr of participations in Grant Agreements 1.630Nr of SME participations in GA's 190% participations of SMEs 11,7%
Requested EU Contribution ALL 388.370.601 €Requested EU Contribution SMEs 29.678.041 €% Requested EU contribution for SMEs 7,6%Average SME EU Contribution per participant 156.200 €Average EU Contribution per participant 238.264 €Average EU Contribution per non-SMEs participant 249.092 €
Success rate KBBE proposals (evaluation)
Nr of Mainlisted Proposals 193 (one out of 6)
Budget per 30 September 2009
Total foreseen budget 1.935.000.000 €% of KBBE budget used per 30 September 2009 20,1%15% of the budget (minimum target for SMEs) 290.250.000 €Budget used for SMEs by 30 September 2009 29.678.041 % used for SMEs per 30 September 2009 7,6%
Extrapolation: SMEs reached and within reach (in participations) SME participations in Signed Grant Agreements by 30/9 190
Extrapolation SMEs reached with 7,6 % of budget 947Extrapolation SMEs reached with 15% of budget 1.858
8/14/2019 SME 4th Progress report on SMEs participation in the 7th r&D Framework Programme
http://slidepdf.com/reader/full/sme-4th-progress-report-on-smes-participation-in-the-7th-rd-framework-programme 27/87
8/14/2019 SME 4th Progress report on SMEs participation in the 7th r&D Framework Programme
http://slidepdf.com/reader/full/sme-4th-progress-report-on-smes-participation-in-the-7th-rd-framework-programme 28/87
27
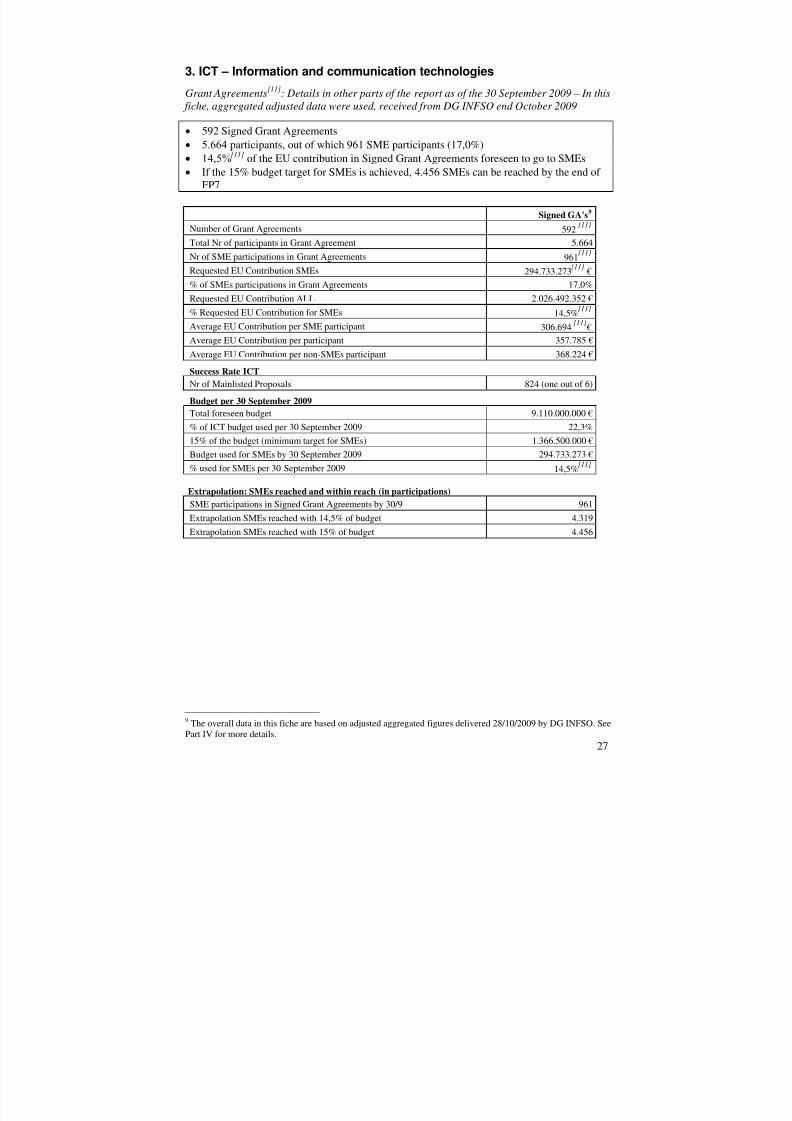
3. ICT – Information and communication technologies
Grant Agreements [11] : Details in other parts of the report as of the 30 September 2009 – In this fiche, aggregated adjusted data were used, received from DG INFSO end October 2009
592 Signed Grant Agreements participants, out of which 961 SME participants (17,0%) [11] of the EU contribution in Signed Grant Agreements foreseen to go to SMEs If the 15% budget target for SMEs is achieved, 4.456 SMEs can be reached by the end of
FP7
Signed GA's 9
Number of Grant Agreements 592[11] Total Nr of participants in Grant Agreement 5.664Nr of SME participations in Grant Agreements 961[11] Requested EU Contribution SMEs 294.733.273[11] €% of SMEs participations in Grant Agreements 17,0%Requested EU Contribution ALL 2.026.492.352 €% Requested EU Contribution for SMEs 14,5%[11] Average EU Contribution per SME participant 306.694[11] €Average EU Contribution per participant 357.785 €Average EU Contribution per non-SMEs participant 368.224 €
Success Rate ICTNr of Mainlisted Proposals 824 (one out of 6)
Budget per 30 September 2009
Total foreseen budget 9.110.000.000 €% of ICT budget used per 30 September 2009 22,3%15% of the budget (minimum target for SMEs) 1.366.500.000 €Budget used for SMEs by 30 September 2009 294.733.273 €% used for SMEs per 30 September 2009 14,5%[11]
Extrapolation: SMEs reached and within reach (in participations) SME participations in Signed Grant Agreements by 30/9 961Extrapolation SMEs reached with 14,5% of budget 4.319Extrapolation SMEs reached with 15% of budget 4.456
9 The overall data in this fiche are based on adjusted aggregated figures delivered 28/10/2009 by DG INFSO. SeePart IV for more details.
8/14/2019 SME 4th Progress report on SMEs participation in the 7th r&D Framework Programme
http://slidepdf.com/reader/full/sme-4th-progress-report-on-smes-participation-in-the-7th-rd-framework-programme 29/87
ICT - Success rate per number of SME applicantsMainlisted proposals versus evaluated proposals
0%
5%
10%
15%
20%
25%
30%
2 6 %
2 1 %
1 6 %
1 3 %
1 2 %
1 1 %
1 6 %
0 1 2 3 4 >4 SMEs OverallSuccess
RateNumber of SME a pplicants
M a i n
l i s t e d v e r s u s
E v a l u a t e d
P r o p o s a l s
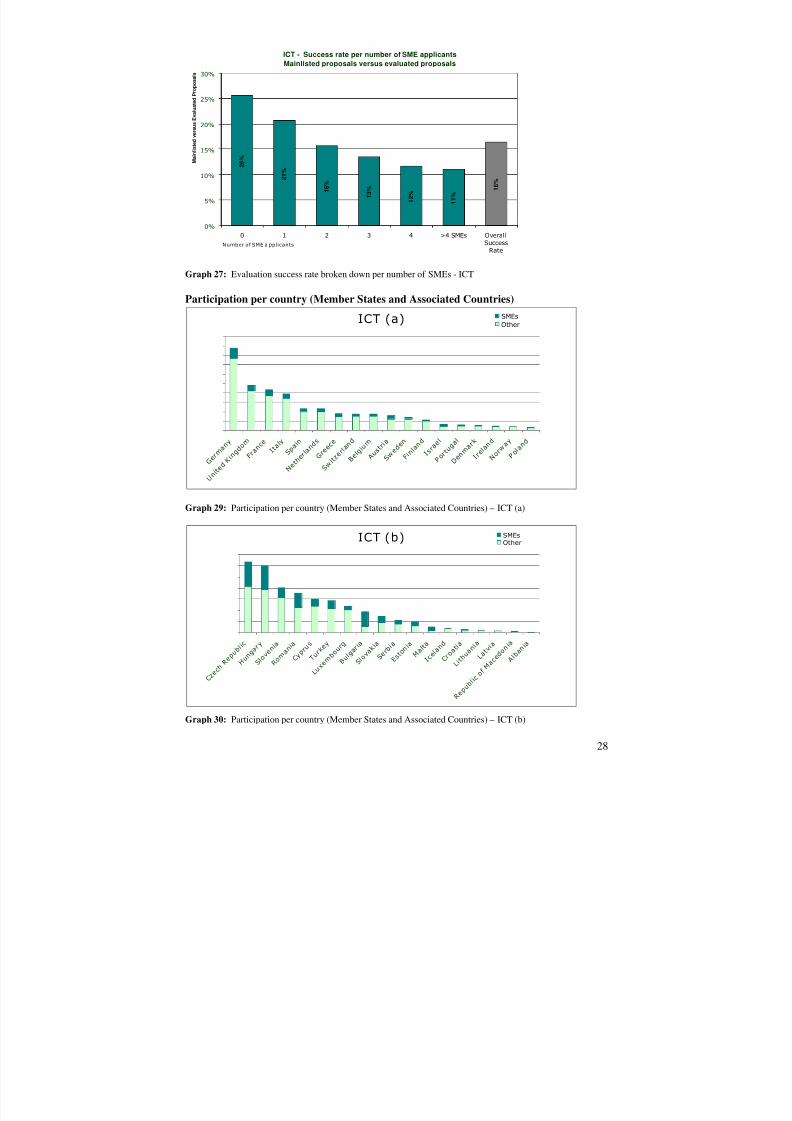
Graph 27: Evaluation success rate broken down per number of SMEs - ICT
Participation per country (Member States and Associated Countries)
ICT (a) SMEsOther
G e r m
a n y
U n i t e
d K i n
g d o m
F r a n
c e I t a
l y S p
a i n
N e t h
e r l a n
d s
G r e e
c e
S w i t z
e r l a n
d
B e l g i
u m
A u s t
r i a
S w e d
e n
F i n l a n
d
I s r a
e l
P o r t u
g a l
D e n m
a r k
I r e l a
n d
N o r w
a y
P o l a
n d
Graph 29: Participation per country (Member States and Associated Countries) – ICT (a)
ICT (b) SMEsOther
C z e c
h R e p
u b l i c
H u n g
a r y
S l o v
e n i a
R o m
a n i a
C y p r
u s
T u r k
e y
L u x e
m b o
u r g
B u l g
a r i a
S l o v
a k i a
S e r b
i a
E s t o
n i a
M a l t a
I c e l a
n d
C r o a
t i a
L i t h u
a n i a
L a t v
i a
R e p u b
l i c o f
M a c
e d o n
i a
A l b a
n i a
Graph 30: Participation per country (Member States and Associated Countries) – ICT (b)
28
8/14/2019 SME 4th Progress report on SMEs participation in the 7th r&D Framework Programme
http://slidepdf.com/reader/full/sme-4th-progress-report-on-smes-participation-in-the-7th-rd-framework-programme 30/87
8/14/2019 SME 4th Progress report on SMEs participation in the 7th r&D Framework Programme
http://slidepdf.com/reader/full/sme-4th-progress-report-on-smes-participation-in-the-7th-rd-framework-programme 31/87
NMP - Success rate per number of SME applicantsMainlisted proposals versus evaluated proposals
0%
5%
10%
15%
20%
25%
30%
35%
3 %
7 %
1 9 %
1 5 %
2 9 % 3
3 %
9 %
0 1 2 3 4 >4 SMEs OverallSuccess
RateNumber of SME applicants
M a
i n l i s t e d v e r s u s
E v a l u a t e d
P r o p o s a l s
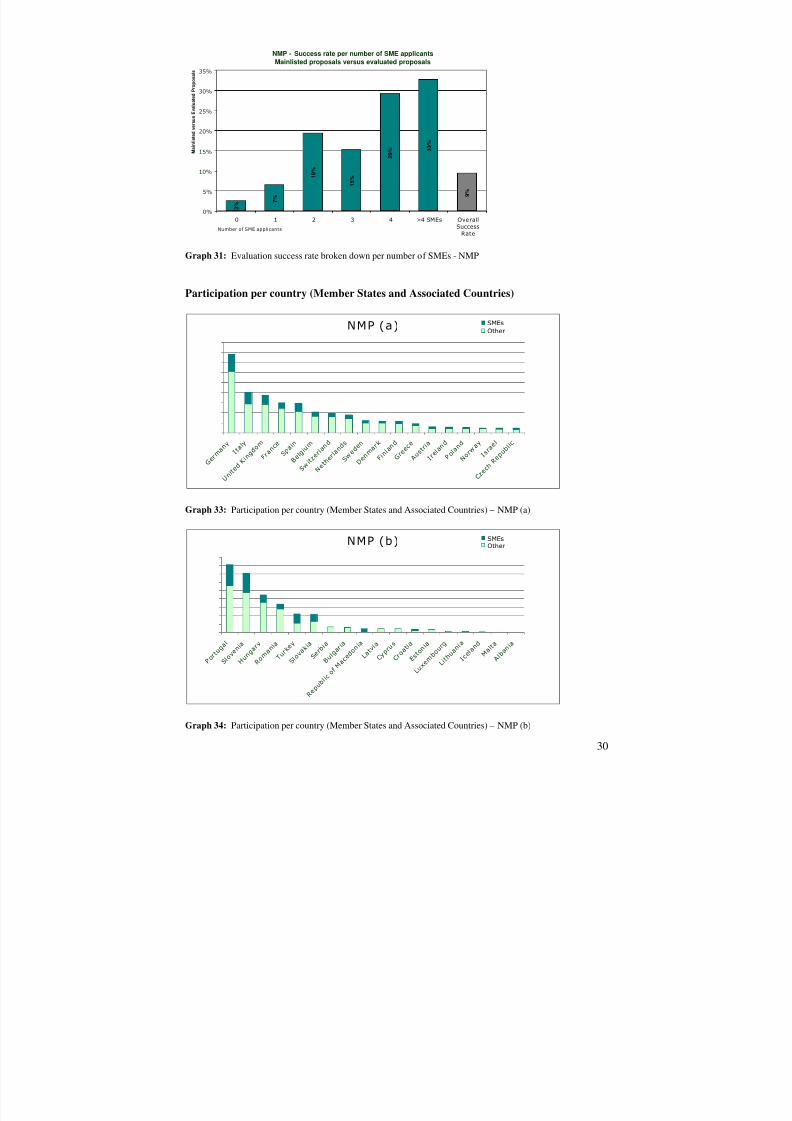
Graph 31: Evaluation success rate broken down per number of SMEs - NMP
Participation per country (Member States and Associated Countries)
NMP (a)
G e
SMEsOther
r m a n
y I t
a l y
U n i t e
d K i
n g d
F r a n
c e S p
a i n
B e l g i
u m
S w i t z
e r l a n
d
N e t h
e r l a
n d s
S w e d
e n
D e n m
a r k
F i n l
a n d
G r e e
c e
A u s t
r i a
I r e l a
n d
P o l a
n d
N o r w
a y
I s r a
e l
C z e c
h R e p
u b l i c o m
Graph 33: Participation per country (Member States and Associated Countries) – NMP (a)
NMP (b) SMEsOther
P o r t u
g a l
S l o v
e n i a
H u n g
a r y
R o m
a n i a
T u r k
e y
S l o v
a k i a
S e r b
i a
B u l g
a r i a
R e p u
b l i c
o f M a c
e d o n
i a
L a t v
i a
C y p r
u s
C r o a
t i a
E s t o
n i a
L u x e
m b o
u r g
L i t h u
a n i a
I c e l a
n d M a
l t a
A l b a
n i a
Graph 34: Participation per country (Member States and Associated Countries) – NMP (b)
30
8/14/2019 SME 4th Progress report on SMEs participation in the 7th r&D Framework Programme
http://slidepdf.com/reader/full/sme-4th-progress-report-on-smes-participation-in-the-7th-rd-framework-programme 32/87
31
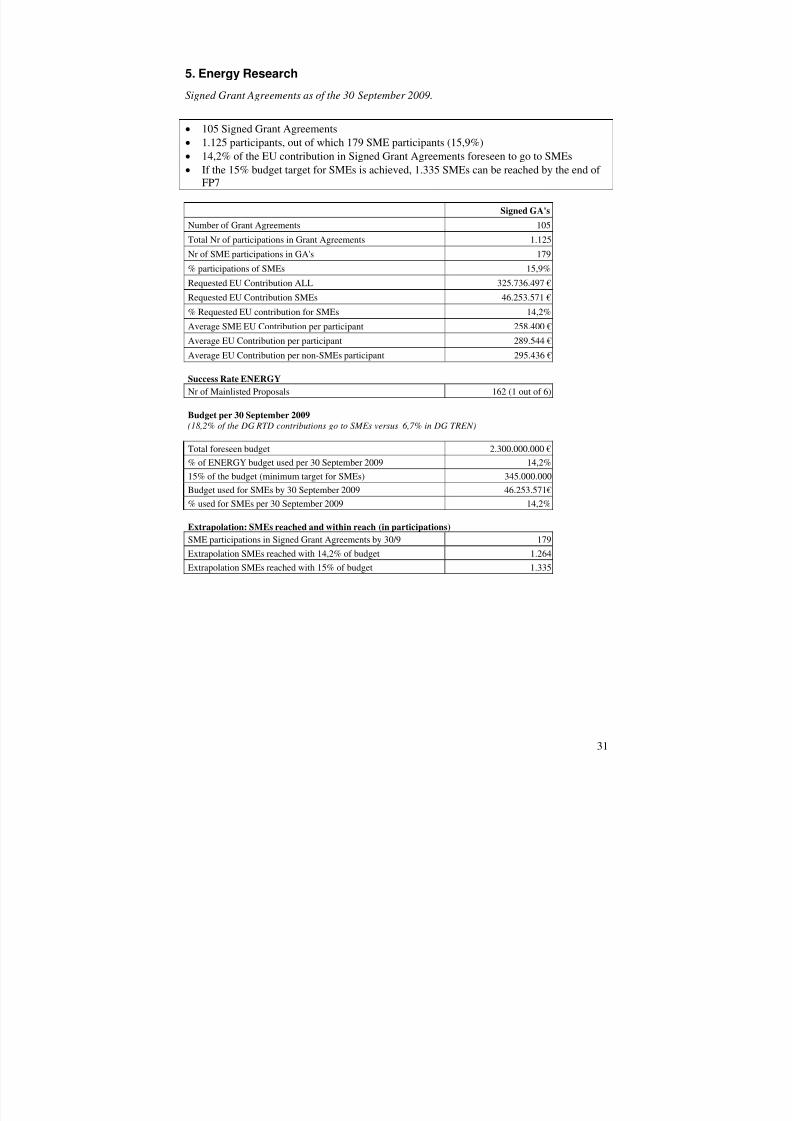
5. Energy Research
Signed Grant Agreements as of the 30 September 2009.
105 Signed Grant Agreements 1.125 participants, out of which 179 SME participants (15,9%) 14,2% of the EU contribution in Signed Grant Agreements foreseen to go to SMEs If the 15% budget target for SMEs is achieved, 1.335 SMEs can be reached by the end of
FP7
Signed GA's
Number of Grant Agreements 105Total Nr of participations in Grant Agreements 1.125Nr of SME participations in GA's 179% participations of SMEs 15,9%Requested EU Contribution ALL 325.736.497 €Requested EU Contribution SMEs 46.253.571 €% Requested EU contribution for SMEs 14,2%Average SME EU Contribution per participant 258.400 €Average EU Contribution per participant 289.544 €Average EU Contribution per non-SMEs participant 295.436 €
Success Rate ENERGYNr of Mainlisted Proposals 162 (1 out of 6)
Budget per 30 September 2009(18,2% of the DG RTD contributions go to SMEs versus 6,7% in DG TREN)
Total foreseen budget 2.300.000.000 €% of ENERGY budget used per 30 September 2009 14,2%15% of the budget (minimum target for SMEs) 345.000.000Budget used for SMEs by 30 September 2009 46.253.571€% used for SMEs per 30 September 2009 14,2%
Extrapolation: SMEs reached and within reach (in participations) SME participations in Signed Grant Agreements by 30/9 179
Extrapolation SMEs reached with 14,2% of budget 1.264Extrapolation SMEs reached with 15% of budget 1.335
8/14/2019 SME 4th Progress report on SMEs participation in the 7th r&D Framework Programme
http://slidepdf.com/reader/full/sme-4th-progress-report-on-smes-participation-in-the-7th-rd-framework-programme 33/87
8/14/2019 SME 4th Progress report on SMEs participation in the 7th r&D Framework Programme
http://slidepdf.com/reader/full/sme-4th-progress-report-on-smes-participation-in-the-7th-rd-framework-programme 34/87
33
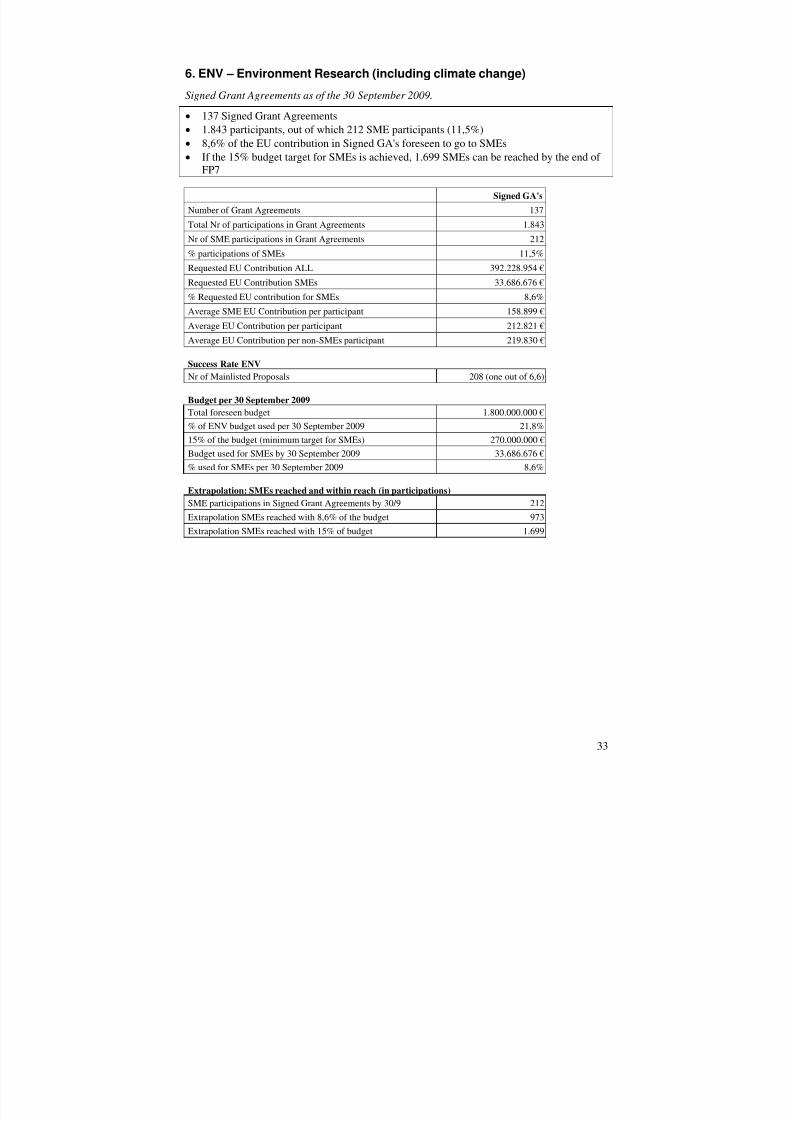
6. ENV – Environment Research (including climate change)
Signed Grant Agreements as of the 30 September 2009.
137 Signed Grant Agreements 1.843 participants, out of which 212 SME participants (11,5%) % of the EU contribution in Signed GA's foreseen to go to SMEs If the 15% budget target for SMEs is achieved, 1.699 SMEs can be reached by the end of
FP7
Signed GA's
Number of Grant Agreements 137Total Nr of participations in Grant Agreements 1.843Nr of SME participations in Grant Agreements 212% participations of SMEs 11,5%Requested EU Contribution ALL 392.228.954 €Requested EU Contribution SMEs 33.686.676 €% Requested EU contribution for SMEs 8,6%Average SME EU Contribution per participant 158.899 €Average EU Contribution per participant 212.821 €Average EU Contribution per non-SMEs participant 219.830 €
Success Rate ENVNr of Mainlisted Proposals 208 (one out of 6,6)
Budget per 30 September 2009
Total foreseen budget 1.800.000.000 €% of ENV budget used per 30 September 2009 21,8%15% of the budget (minimum target for SMEs) 270.000.000 €Budget used for SMEs by 30 September 2009 33.686.676 €% used for SMEs per 30 September 2009 8,6%
Extrapolation: SMEs reached and within reach (in participations) SME participations in Signed Grant Agreements by 30/9 212Extrapolation SMEs reached with 8,6% of the budget 973Extrapolation SMEs reached with 15% of budget 1.699
8/14/2019 SME 4th Progress report on SMEs participation in the 7th r&D Framework Programme
http://slidepdf.com/reader/full/sme-4th-progress-report-on-smes-participation-in-the-7th-rd-framework-programme 35/87
ENV - Success rate per number of SME applicantsMainlisted proposals versus evaluated proposals
0%
2%
4%
6%
8%
10%
12%
14%
16%
18%
20%
1 7 %
1 1 %
1 9 %
1 3 %
1 8 %
1 4 %
1 5 %
0 1 2 3 4 >4 SMEs OverallSuccess
RateNumber of SME applicants
M a
i n l i s t e d v e r s u s
E v a l u a t e d
P r o p o s a
l s
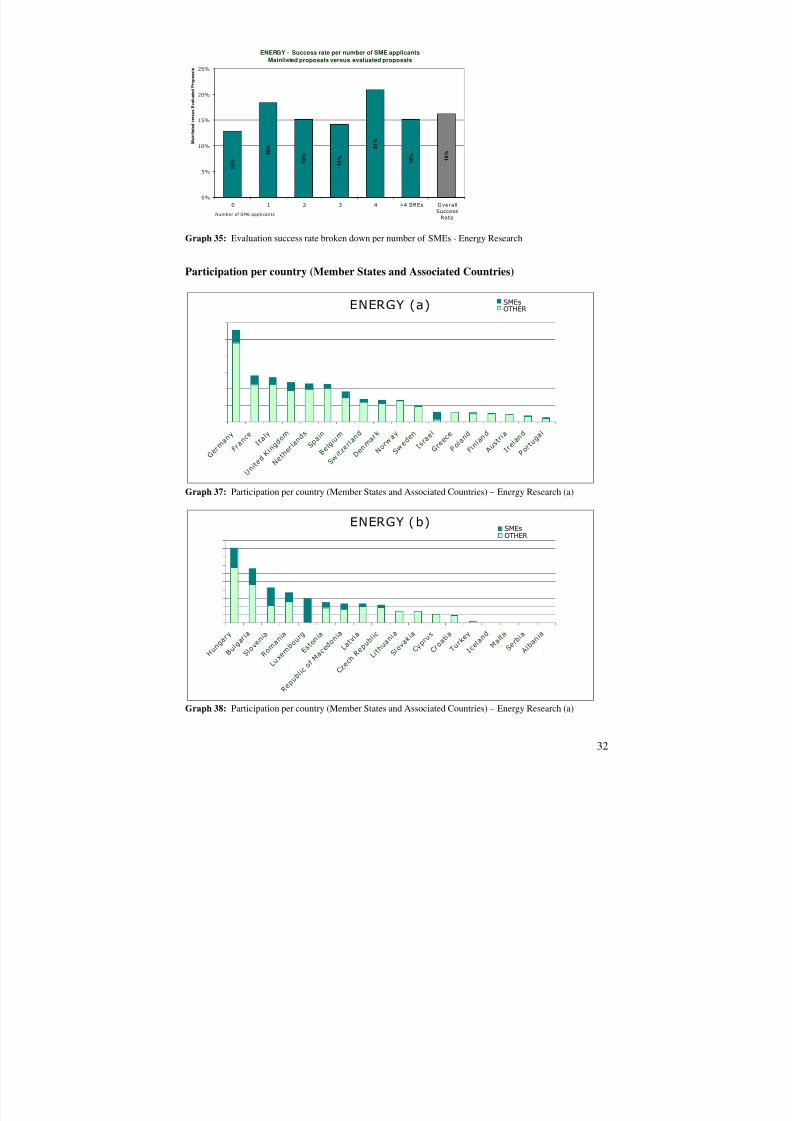
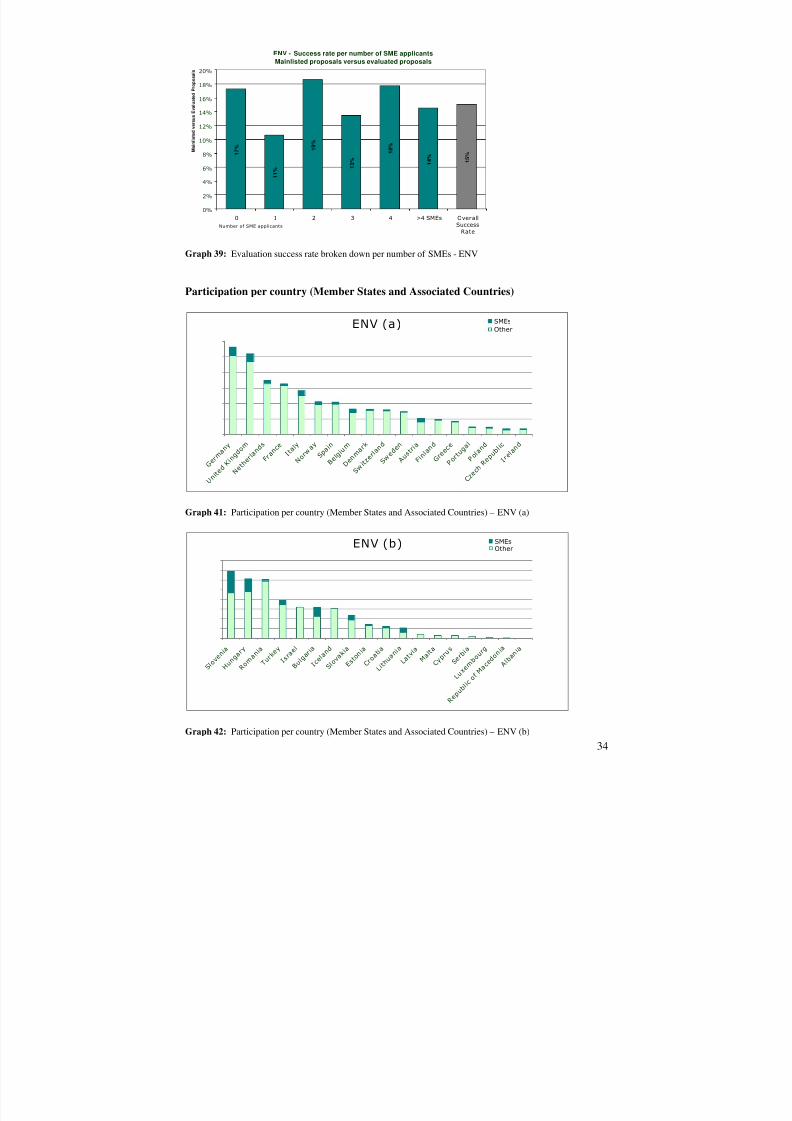
Graph 39: Evaluation success rate broken down per number of SMEs - ENV
Participation per country (Member States and Associated Countries)
ENV (a) SMEsOther
G e r m
a n y
U n i t e
d K i n
g d o m
N e t h
e r l a n
d s
F r a
e I t a
l y
N o r w
a y S p
a i n
B e l g i
u m
D e n m
a r k
S w i t z
e r l a n
d
S w e d
e n
A u s t
r i a
F i n l a n
d
G r e e
c e
P o r t u
g a l
P o l a
n d
C z e c
h R e p
u b l i c
I r e l a
n d n c
Graph 41: Participation per country (Member States and Associated Countries) – ENV (a)
ENV (b) SMEsOther
S l o v
e n i a
H u n g
a r y
R a n
i a
T u r k
e y
I s r a
e l
B u l g
a r i a
I c e l a
n d
S l o v
a k i a
E s t o
n i a
C r o a
t i a
L i t h u
a n i a
L a t v
i a M a
l t a
C y p r
u s
S e r b
i a
L u x e
m b o
u r g
R e p u b l
i c o f
M a c
e d o n
i a
A l b a
n i a
o m
Graph 42: Participation per country (Member States and Associated Countries) – ENV (b)34
8/14/2019 SME 4th Progress report on SMEs participation in the 7th r&D Framework Programme
http://slidepdf.com/reader/full/sme-4th-progress-report-on-smes-participation-in-the-7th-rd-framework-programme 36/87
35
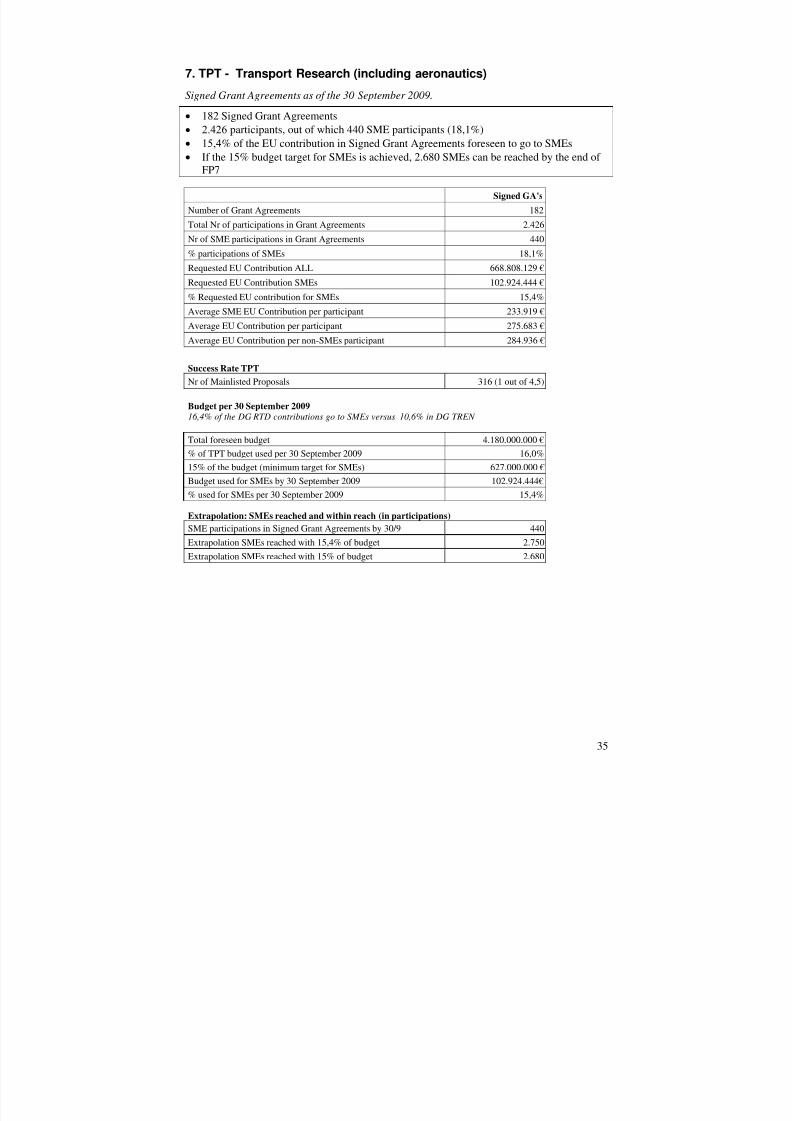
7. TPT - Transport Research (including aeronautics)
Signed Grant Agreements as of the 30 September 2009.
182 Signed Grant Agreements participants, out of which 440 SME participants (18,1%) % of the EU contribution in Signed Grant Agreements foreseen to go to SMEs If the 15% budget target for SMEs is achieved, 2.680 SMEs can be reached by the end of
FP7
Signed GA's
Number of Grant Agreements 182Total Nr of participations in Grant Agreements 2.426Nr of SME participations in Grant Agreements 440% participations of SMEs 18,1%Requested EU Contribution ALL 668.808.129 €Requested EU Contribution SMEs 102.924.444 €% Requested EU contribution for SMEs 15,4%Average SME EU Contribution per participant 233.919 €Average EU Contribution per participant 275.683 €Average EU Contribution per non-SMEs participant 284.936 €
Success Rate TPTNr of Mainlisted Proposals 316 (1 out of 4,5)
Budget per 30 September 200916,4% of the DG RTD contributions go to SMEs versus 10,6% in DG TREN
Total foreseen budget 4.180.000.000 €% of TPT budget used per 30 September 2009 16,0%15% of the budget (minimum target for SMEs) 627.000.000 €Budget used for SMEs by 30 September 2009 102.924.444€ % used for SMEs per 30 September 2009 15,4%
Extrapolation: SMEs reached and within reach (in participations) SME participations in Signed Grant Agreements by 30/9 440Extrapolation SMEs reached with 15,4% of budget 2.750
Extrapolation SMEs reached with 15% of budget 2.680
8/14/2019 SME 4th Progress report on SMEs participation in the 7th r&D Framework Programme
http://slidepdf.com/reader/full/sme-4th-progress-report-on-smes-participation-in-the-7th-rd-framework-programme 37/87
TPT - Success rate per number of SME applicantsMainlisted proposals versus evaluated proposals
0%
5%
10%
15%
20%
25%
30%
2 5 %
2 5 %
2 4 %
1 9 %
2 4 %
2 1 % 2
2 %
0 1 2 3 4 >4 SMEs OverallSuccess
RateNumber of SME applicants
M a i n
l i s t e d v e r s u s
E v a l u a
t e d P r o p o s a l s
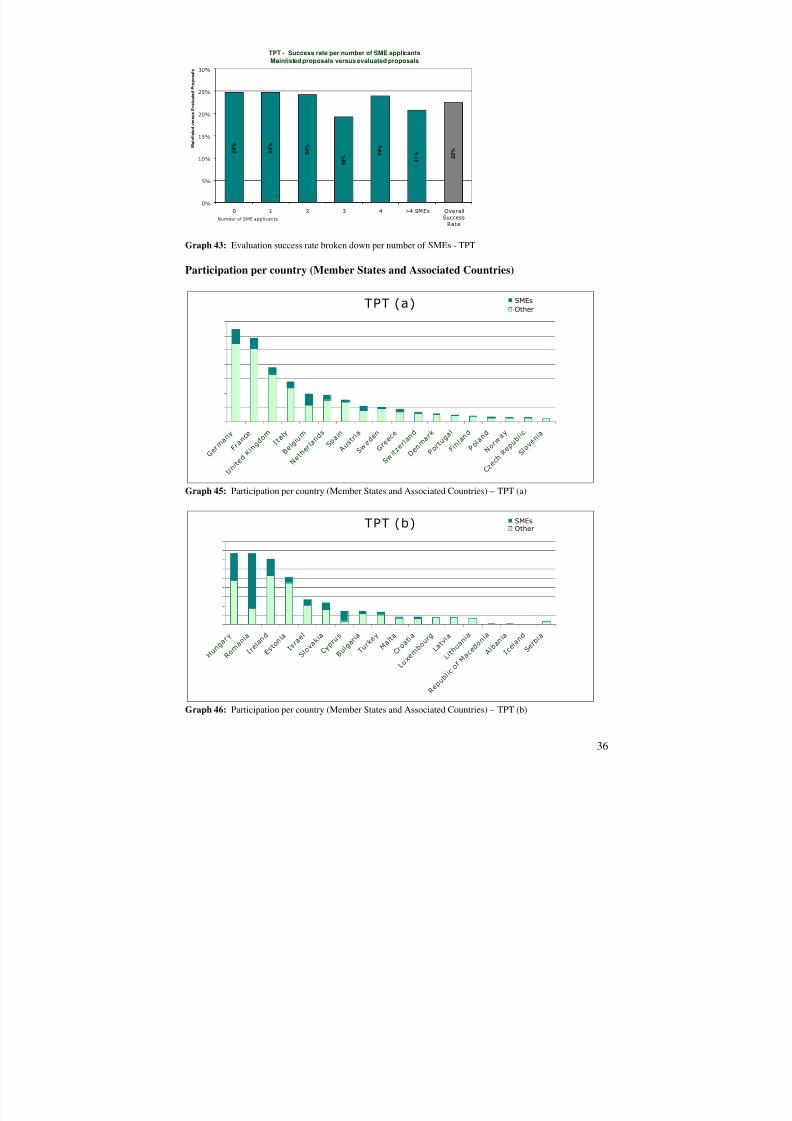
Graph 43: Evaluation success rate broken down per number of SMEs - TPT
Participation per country (Member States and Associated Countries)
TPT (a) SMEs
Other
G e r m
a n y
F r a n
c e
U n i t e
d K i n
g d o m I t a
l y
B e l g i
u m
N e t h
e r l a n
d s S p
a i n
A u s t
r i a
S w e d
e n
G r e e
c e
S w i t z
e r l a n
d
D e n m
a r k
P o r t u
g a l
F i n l a n
d
P o l a
n d
N o r w
a y
C z e c
h R e p
u b l i c
S l o v
e n i a
Graph 45: Participation per country (Member States and Associated Countries) – TPT (a)
TPT (b) SMEsOther
H u n g
a r y
R o m
a n i a
I r e l a
n d
E s t o
n i a
I s r a
e l
S l o v
a k i a
C y p r
u s
B u l g
a r i a
T u r k
e y M a
l t a
C r o a
t i a
L u x e
m b o
u r g
L a t v
i a
L i t h u
a n i a
R e p
u b l i c
o f M a c
e d o n
i a
A l b a
n i a
I c e l a
n d
S e i a
r b
Graph 46: Participation per country (Member States and Associated Countries) – TPT (b)
36
8/14/2019 SME 4th Progress report on SMEs participation in the 7th r&D Framework Programme
http://slidepdf.com/reader/full/sme-4th-progress-report-on-smes-participation-in-the-7th-rd-framework-programme 38/87
37
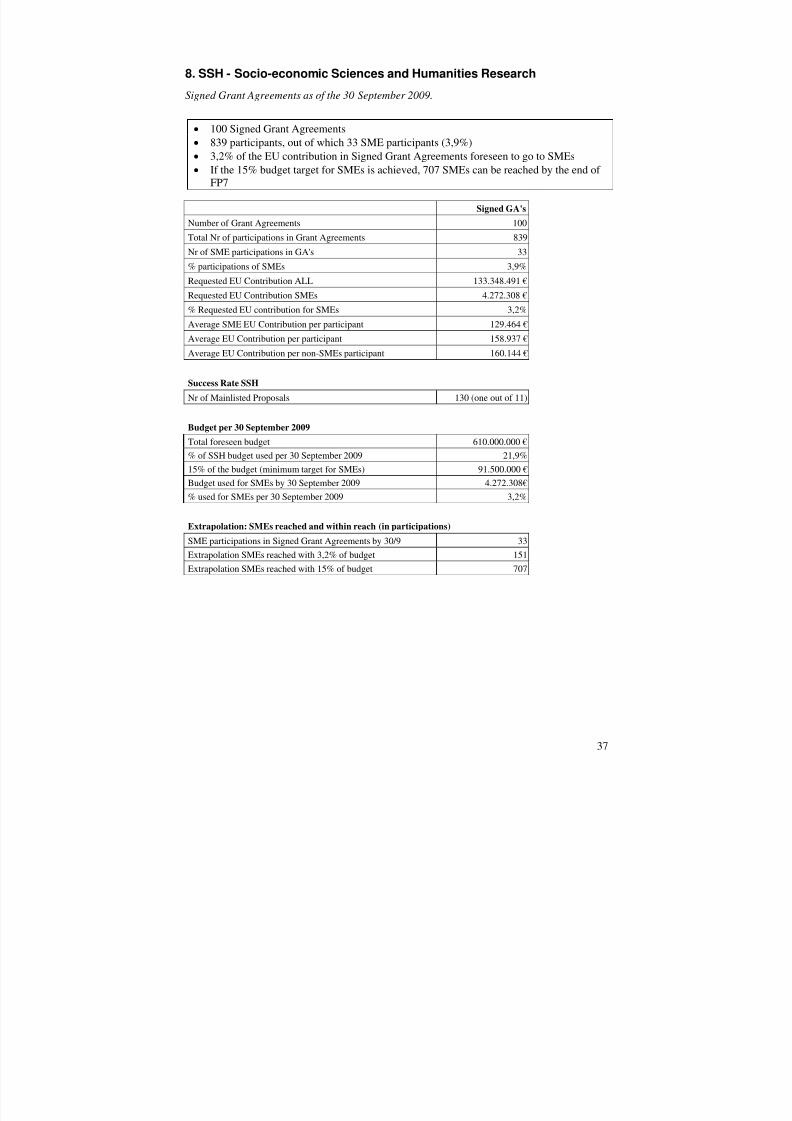
8. SSH - Socio-economic Sciences and Humanities Research
Signed Grant Agreements as of the 30 September 2009.
100 Signed Grant Agreements 839 participants, out of which 33 SME participants (3,9%) 3,2% of the EU contribution in Signed Grant Agreements foreseen to go to SMEs If the 15% budget target for SMEs is achieved, 707 SMEs can be reached by the end of
FP7
Signed GA's
Number of Grant Agreements 100Total Nr of participations in Grant Agreements 839Nr of SME participations in GA's 33% participations of SMEs 3,9%Requested EU Contribution ALL 133.348.491 €Requested EU Contribution SMEs 4.272.308 €% Requested EU contribution for SMEs 3,2%Average SME EU Contribution per participant 129.464 €Average EU Contribution per participant 158.937 €Average EU Contribution per non-SMEs participant 160.144 €
Success Rate SSH
Nr of Mainlisted Proposals 130 (one out of 11)
Budget per 30 September 2009
Total foreseen budget 610.000.000 €% of SSH budget used per 30 September 2009 21,9%15% of the budget (minimum target for SMEs) 91.500.000 €Budget used for SMEs by 30 September 2009 4.272.308€% used for SMEs per 30 September 2009 3,2%
Extrapolation: SMEs reached and within reach (in participations) SME participations in Signed Grant Agreements by 30/9 33
Extrapolation SMEs reached with 3,2% of budget 151Extrapolation SMEs reached with 15% of budget 707
8/14/2019 SME 4th Progress report on SMEs participation in the 7th r&D Framework Programme
http://slidepdf.com/reader/full/sme-4th-progress-report-on-smes-participation-in-the-7th-rd-framework-programme 39/87
SSH - Success rate per number of SME applicantsMainlisted proposals versus evaluated proposals
0%
2%
4%
6%
8%
10%
12%
1 0 %
9 % 1
0 %
1 0 % 1 1
%
5 %
9 %
0 1 2 3 4 >4 SMEs OverallSuccess
RateNumber of SME applicants
M a i n
l i s t e d v e r s u s
E v a l u a t e d
P r o p o s a
l s
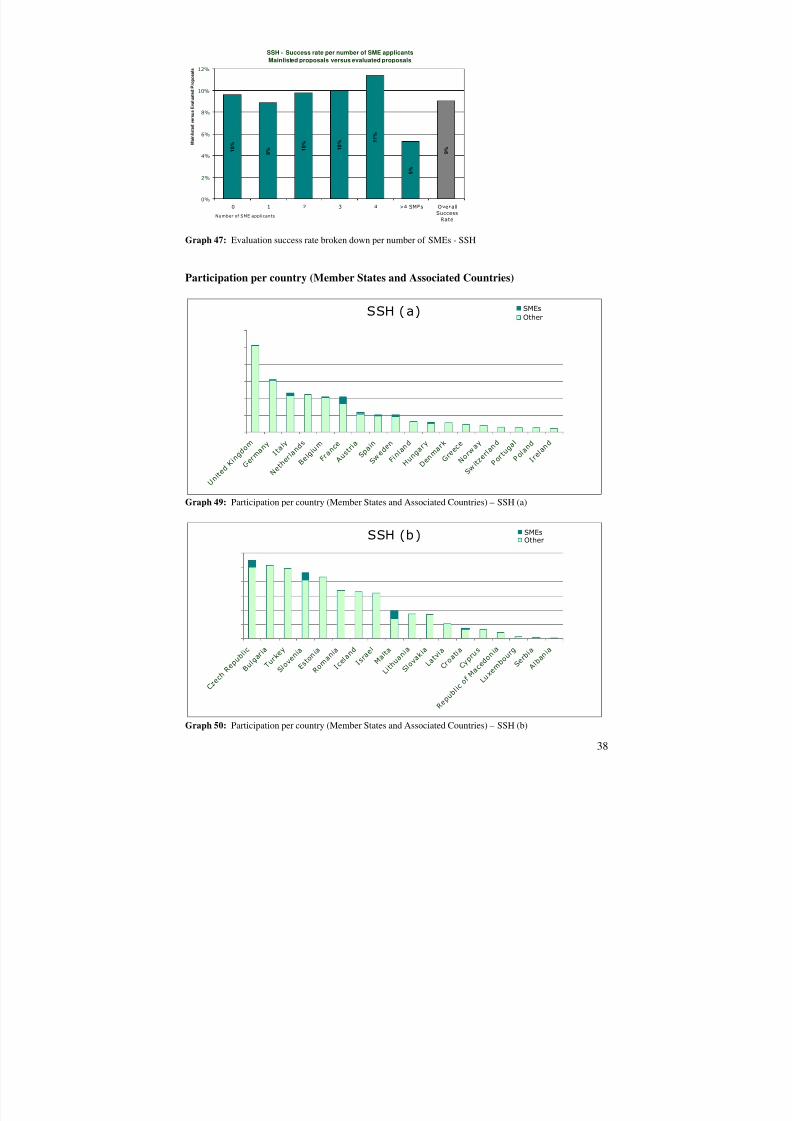
Graph 47: Evaluation success rate broken down per number of SMEs - SSH
Participation per country (Member States and Associated Countries)
SSH ( a)
U n i
SMEsOther
t e d
K i n g
d o m
G e r m
a n y
I t a l y
N e t h
e r l a n
d s
B e l g i
u m
F r a n
c e
A u s t
r i a S p
a i n
S w e d
e n
F i n l
a n d
H u n g
a r y
D e n m
a r k
G r e e
c e
N o r w
a y
S w i t z
e r l a n
d
P o r t u
g a l
P o l a
n d
I r e l
a n d
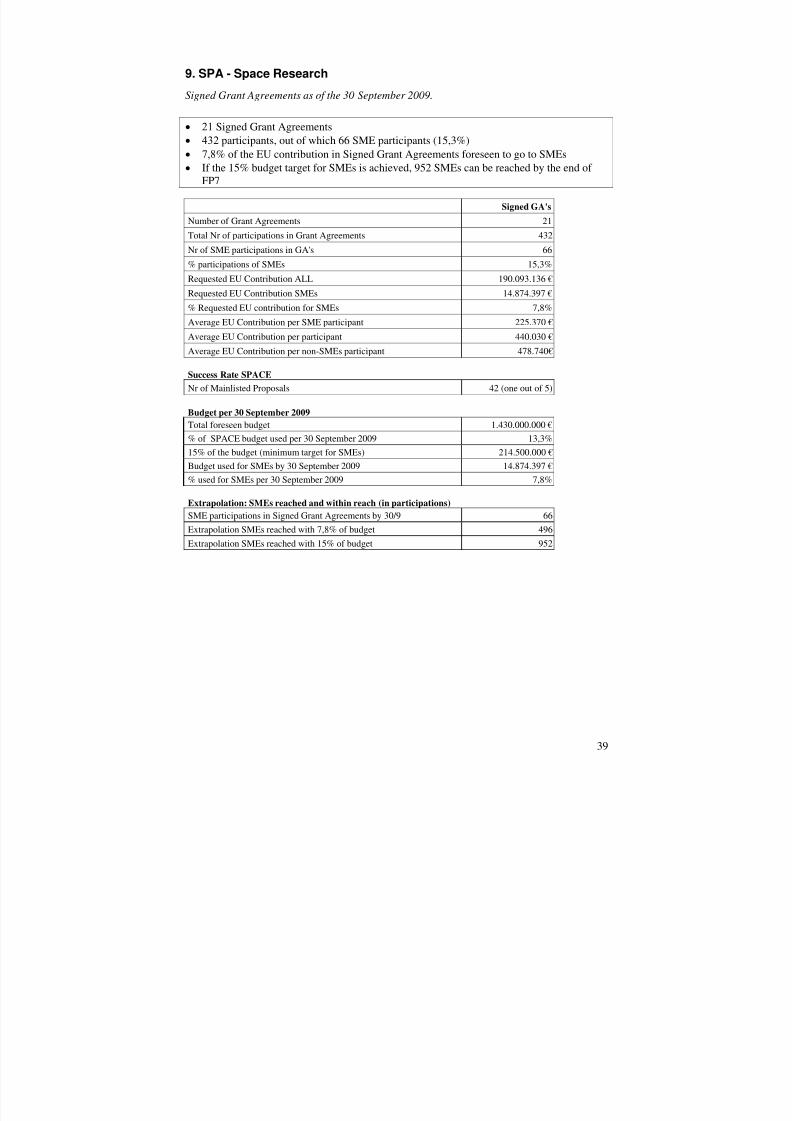
Graph 49: Participation per country (Member States and Associated Countries) – SSH (a)
SSH (b )
C z
SMEsOther
e c h R
e p u b
l i c
B u l g
a r i a
T u r
y
S l o v
e n i a
E s t o
n i a
R o
i a
I c e l a
n d
I s r a
e l
M a l t a
L i t h u
a n i a
S l o v
a k i a
L a t v
i a
C r o a
t i a
C y p r
u s
R e p
l i c o f
M a c
e d o n
i a
L u x e
m b o
u r g
S e r b
i a
A l b a
n i a
k e m
a n
u b
Graph 50: Participation per country (Member States and Associated Countries) – SSH (b)
38
8/14/2019 SME 4th Progress report on SMEs participation in the 7th r&D Framework Programme
http://slidepdf.com/reader/full/sme-4th-progress-report-on-smes-participation-in-the-7th-rd-framework-programme 40/87
39
9. SPA - Space Research
Signed Grant Agreements as of the 30 September 2009.
Signed Grant Agreements participants, out of which 66 SME participants (15,3%) % of the EU contribution in Signed Grant Agreements foreseen to go to SMEs If the 15% budget target for SMEs is achieved, 952 SMEs can be reached by the end of
FP7
Signed GA's
Number of Grant Agreements 21Total Nr of participations in Grant Agreements 432Nr of SME participations in GA's 66% participations of SMEs 15,3%
Requested EU Contribution ALL 190.093.136 €Requested EU Contribution SMEs 14.874.397 €% Requested EU contribution for SMEs 7,8%Average EU Contribution per SME participant 225.370 €Average EU Contribution per participant 440.030 €Average EU Contribution per non-SMEs participant 478.740€
Success Rate SPACENr of Mainlisted Proposals 42 (one out of 5)
Budget per 30 September 2009Total foreseen budget 1.430.000.000 €% of SPACE budget used per 30 September 2009 13,3%15% of the budget (minimum target for SMEs) 214.500.000 €Budget used for SMEs by 30 September 2009 14.874.397 €% used for SMEs per 30 September 2009 7,8%
Extrapolation: SMEs reached and within reach (in participations) SME participations in Signed Grant Agreements by 30/9 66Extrapolation SMEs reached with 7,8% of budget 496Extrapolation SMEs reached with 15% of budget 952
8/14/2019 SME 4th Progress report on SMEs participation in the 7th r&D Framework Programme
http://slidepdf.com/reader/full/sme-4th-progress-report-on-smes-participation-in-the-7th-rd-framework-programme 41/87
SPA - S uccess rate per number of SME applicantsMainlisted proposals versus evaluated proposals
0%
5%
10%
15%
20%
25%
30%
35%
1 7 %
8 %
2 4 %
2 2 %
3 0 % 3
3 %
2 1 %
0 1 2 3 4 >4 SMEs Overa llSuccess
RateNumber of SME applicants
M a i n
l i s t e d v e r s u s
E v a l u a
t e d P r o p o s a l s
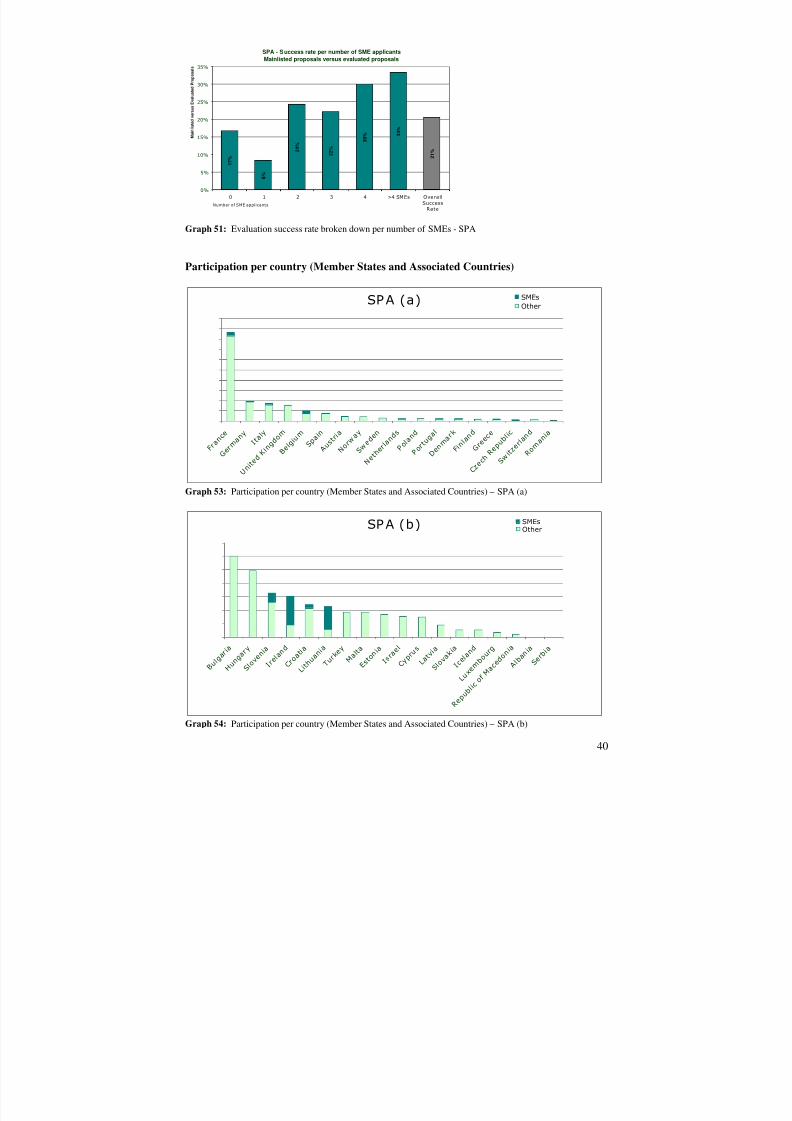
Graph 51: Evaluation success rate broken down per number of SMEs - SPA
Participation per country (Member States and Associated Countries)
SP A (a) SMEsOther
F r a n
c e
G e r m
a n y
I t a l y
U n i t e
d K i n
g d o m
B e l g i
u m S p
a i n
A u s t
r i a
N o r w
a y
S d e
n
N e t h
e r l a n
d s
P o l a
n d
P o r t u
g a l
D e n m
a r k
F i n l a n
d
G r e e
c e
C z e c
h R e p
u b l i c
S w i t z
e r l a n
d
R o m
a n i a
w e
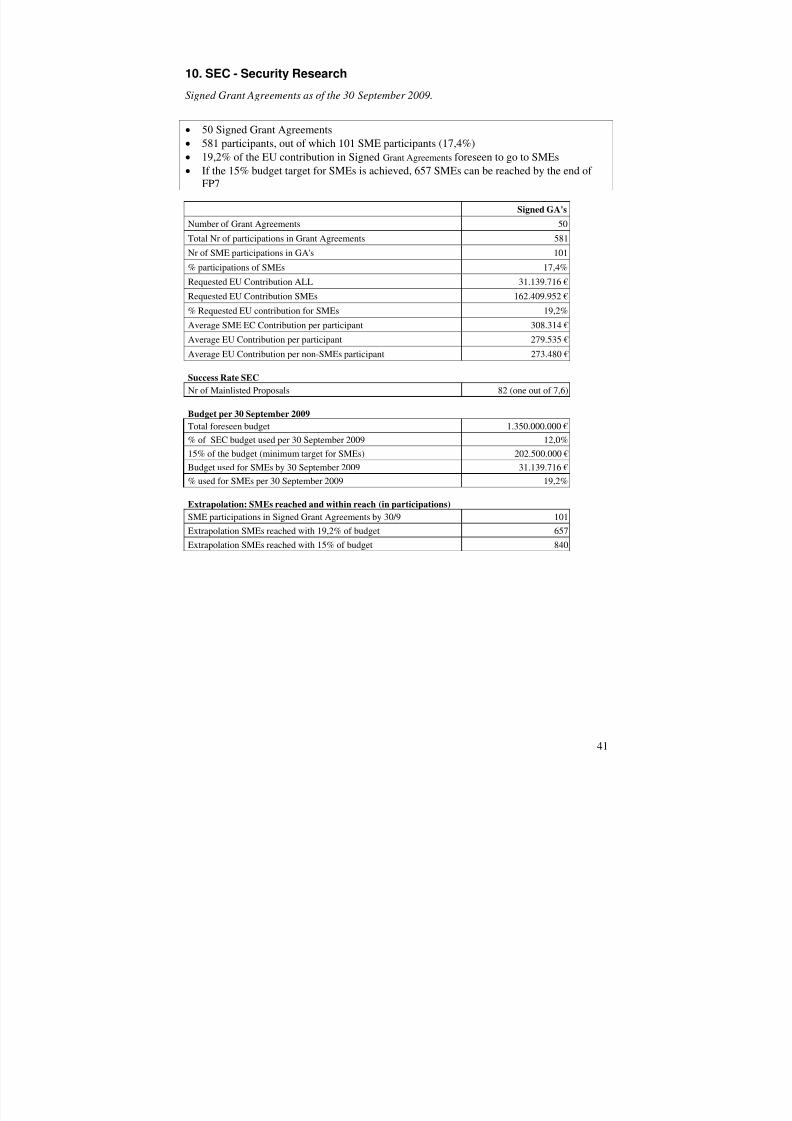
Graph 53: Participation per country (Member States and Associated Countries) – SPA (a)
SP A (b)
B u
SMEsOther
l g a r
i a
H
a r y
S l o v
e n i a
I r e l a
n d
C r o a
t i a
L i t h u
a n i a
T u r k
e y M a
l t a
E s t o
n i a
I s r a
e l
C y p r
u s
L a t v
i a
S l o v
a k i a
I c e l a
n d
L u x e
m b
r g
R e b l i c
o f M a c
e d o n
i a
A l b a
n i a
S e r b
i a
u n g o u
p u
Graph 54: Participation per country (Member States and Associated Countries) – SPA (b)
40
8/14/2019 SME 4th Progress report on SMEs participation in the 7th r&D Framework Programme
http://slidepdf.com/reader/full/sme-4th-progress-report-on-smes-participation-in-the-7th-rd-framework-programme 42/87
41
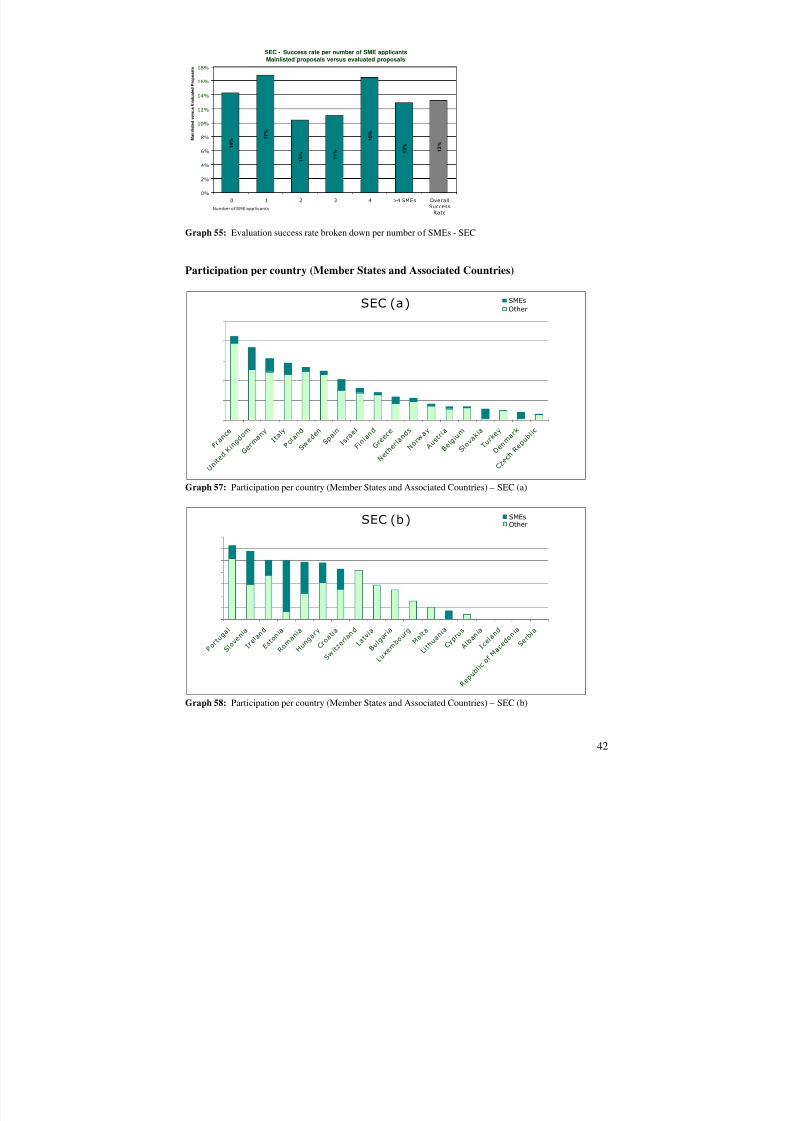
10. SEC - Security Research
Signed Grant Agreements as of the 30 September 2009.
Signed Grant Agreements 581 participants, out of which 101 SME participants (17,4%) % of the EU contribution in SignedGrant Agreementsforeseen to go to SMEs If the 15% budget target for SMEs is achieved, 657 SMEs can be reached by the end of
FP7
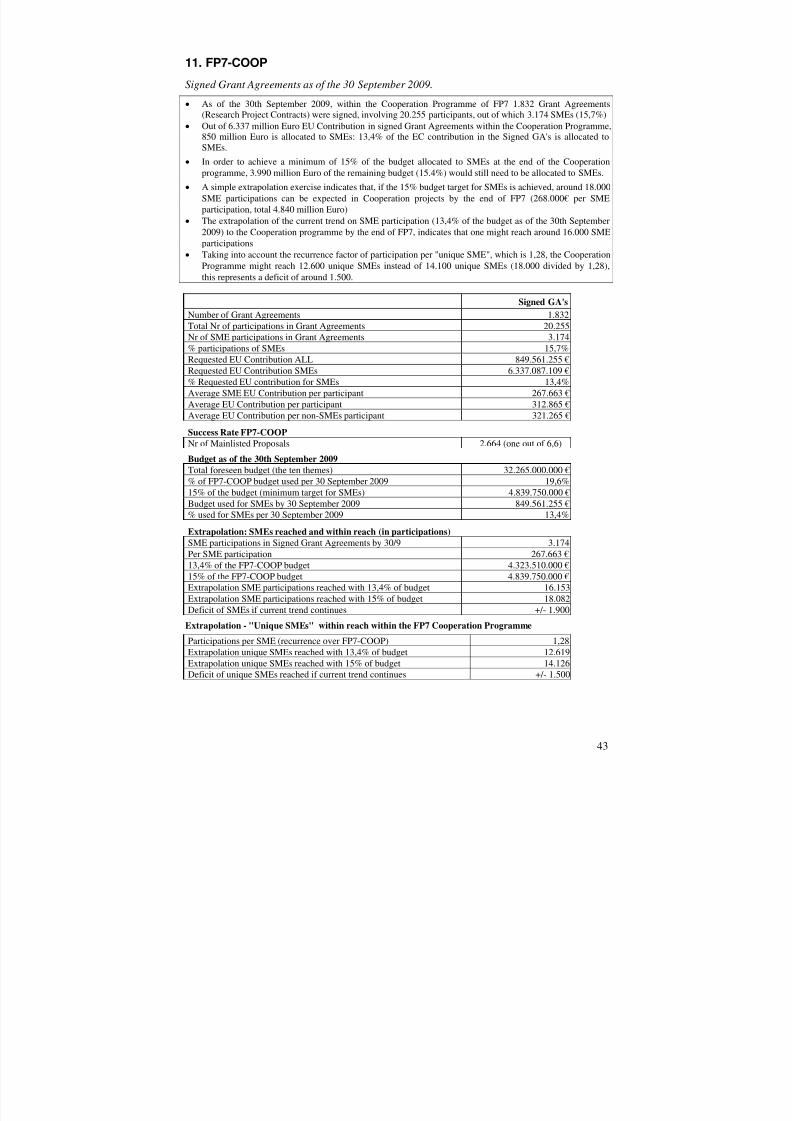
Signed GA's
Number of Grant Agreements 50Total Nr of participations in Grant Agreements 581Nr of SME participations in GA's 101% participations of SMEs 17,4%Requested EU Contribution ALL 31.139.716 €Requested EU Contribution SMEs 162.409.952 €% Requested EU contribution for SMEs 19,2%Average SME EC Contribution per participant 308.314 €Average EU Contribution per participant 279.535 €Average EU Contribution per non-SMEs participant 273.480 €
Success Rate SECNr of Mainlisted Proposals 82 (one out of 7,6)
Budget per 30 September 2009Total foreseen budget 1.350.000.000 €% of SEC budget used per 30 September 2009 12,0%15% of the budget (minimum target for SMEs) 202.500.000 €Budget used for SMEs by 30 September 2009 31.139.716 €% used for SMEs per 30 September 2009 19,2%
Extrapolation: SMEs reached and within reach (in participations) SME participations in Signed Grant Agreements by 30/9 101Extrapolation SMEs reached with 19,2% of budget 657Extrapolation SMEs reached with 15% of budget 840
8/14/2019 SME 4th Progress report on SMEs participation in the 7th r&D Framework Programme
http://slidepdf.com/reader/full/sme-4th-progress-report-on-smes-participation-in-the-7th-rd-framework-programme 43/87
8/14/2019 SME 4th Progress report on SMEs participation in the 7th r&D Framework Programme
http://slidepdf.com/reader/full/sme-4th-progress-report-on-smes-participation-in-the-7th-rd-framework-programme 44/87
8/14/2019 SME 4th Progress report on SMEs participation in the 7th r&D Framework Programme
http://slidepdf.com/reader/full/sme-4th-progress-report-on-smes-participation-in-the-7th-rd-framework-programme 45/87
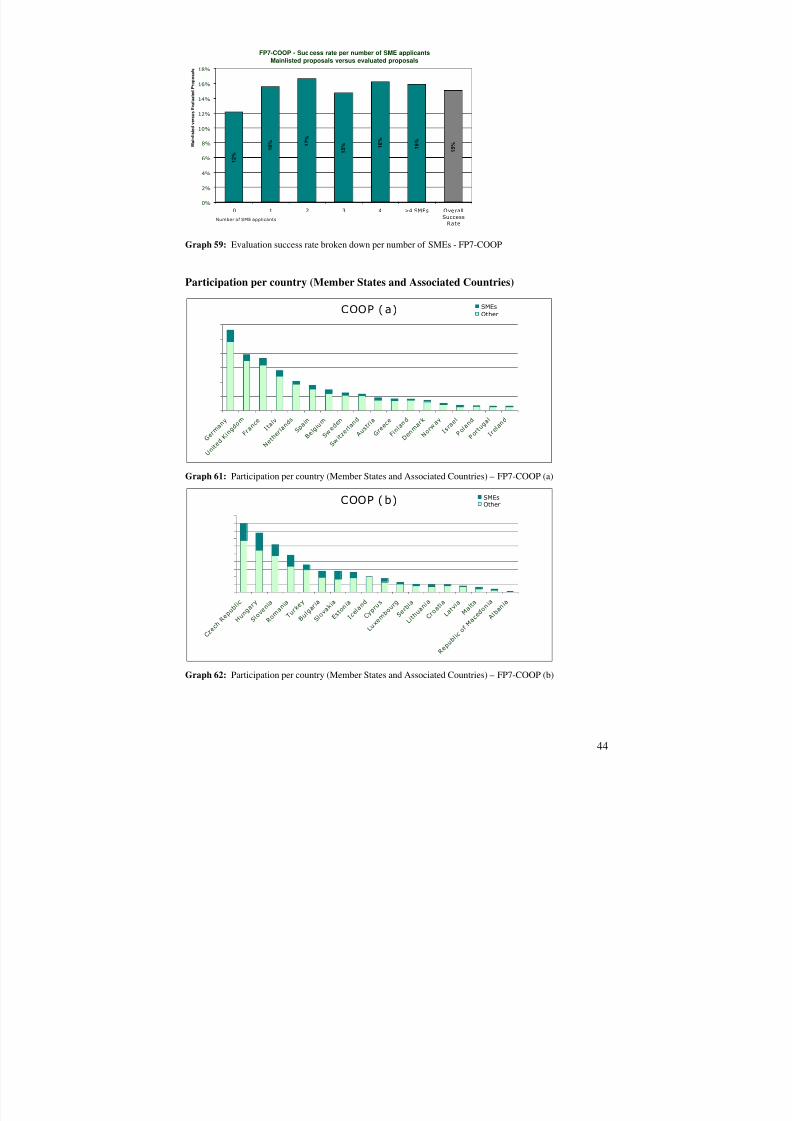
FP7-COOP - Suc cess rate per number of SME applicantsMainlisted proposals versus evaluated proposals
0%
2%
4%
6%
8%
10%
12%
14%
16%
18%
1 2 %
1 6 % 1
7 %
1 5 % 1 6 %
1 6 %
1 5 %
0 1 2 3 4 >4 SMEs Overa llSuccess
RateNumber of SME applicants
M a i n
l i s t e d v e r s u s
E v a l u a
t e d P r o p o s a l s
Graph 59: Evaluation success rate broken down per number of SMEs - FP7-COOP
Participation per country (Member States and Associated Countries)
COOP ( a) SMEsOther
G e r m
a n y
U n i t e
d K i n
g d o m
F r a n
c e I t a
l y
N e t h
e r l a n
d s
S p a i n
B e l g i
u m
S w e d
e n
S w i t z
e r l a n
d
A u s t
r i a
G r e e
c e
F i n l a n
d
D e n m
a r k
N o r w
a y
I s r a
e l
P o l a
n d
P o r t u
g a l
I r e l a
n d
Graph 61: Participation per country (Member States and Associated Countries) – FP7-COOP (a)
COOP ( b) SMEsOther
C z e c
h R e
b l i c
H u n g
a r y
S l o v
e n i a
R o m
a n i a
T u r k
e y
B u l g
a r i a
S l o v
a k i a
E s t o
n i a
I c e l a
n d
C y p r
u s
L u x e
m b o
u r g
S e r b
i a
L i t h u
a n i a
C r o a
t i a
L a t v
i a M a
l t a
R e p u
b l i c
o f M a c
e d o n
i a
A l b a
n i a
p u
Graph 62: Participation per country (Member States and Associated Countries) – FP7-COOP (b)
44
8/14/2019 SME 4th Progress report on SMEs participation in the 7th r&D Framework Programme
http://slidepdf.com/reader/full/sme-4th-progress-report-on-smes-participation-in-the-7th-rd-framework-programme 46/87
8/14/2019 SME 4th Progress report on SMEs participation in the 7th r&D Framework Programme
http://slidepdf.com/reader/full/sme-4th-progress-report-on-smes-participation-in-the-7th-rd-framework-programme 47/87
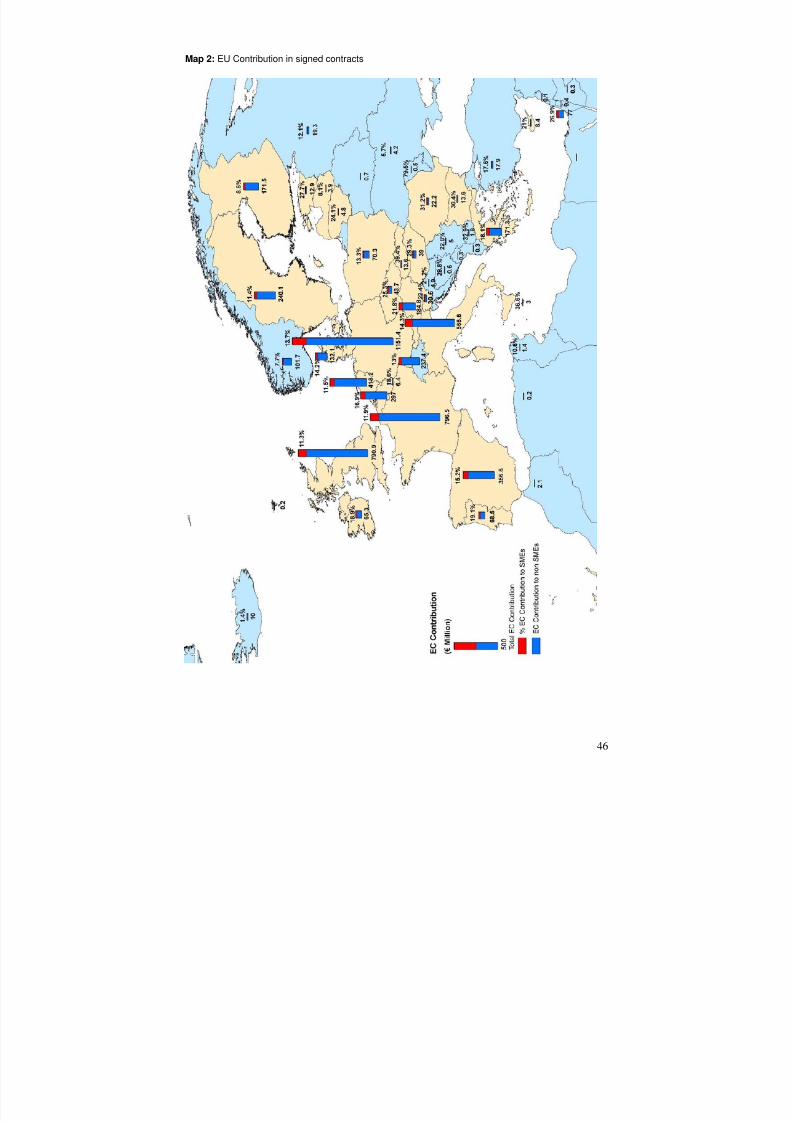
Map 2: EU Contribution in signed contracts
46
8/14/2019 SME 4th Progress report on SMEs participation in the 7th r&D Framework Programme
http://slidepdf.com/reader/full/sme-4th-progress-report-on-smes-participation-in-the-7th-rd-framework-programme 48/87
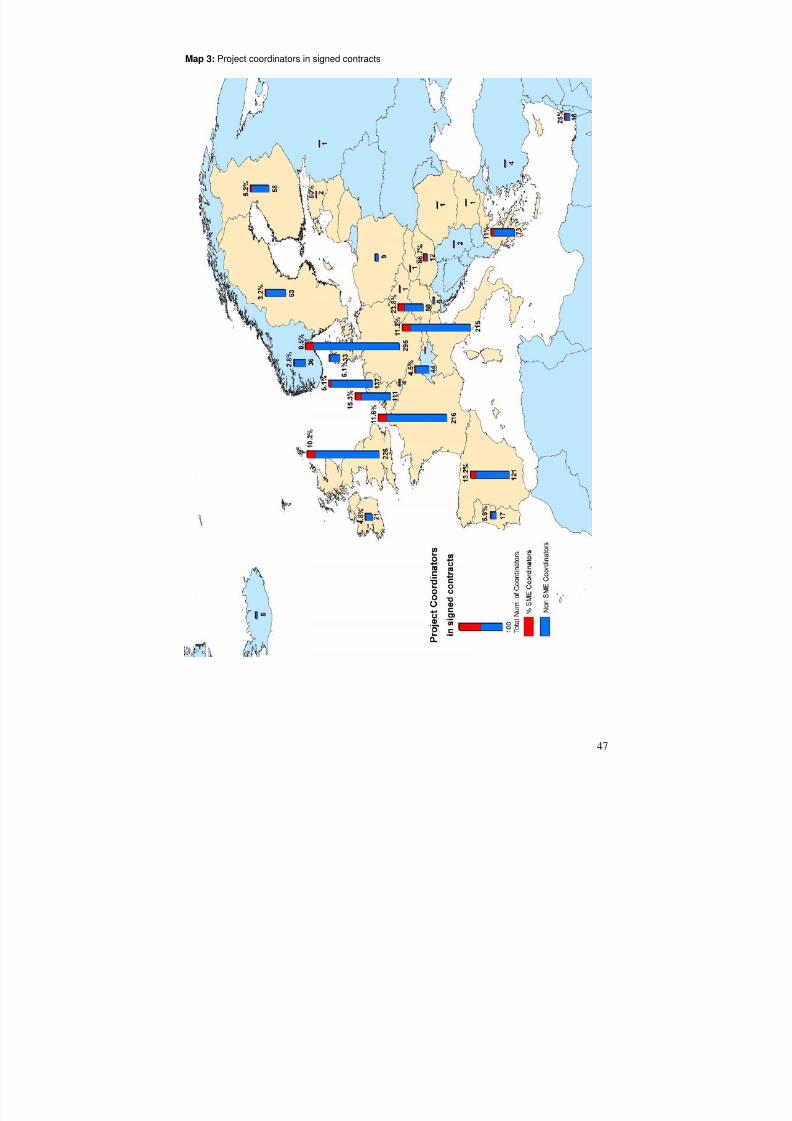
Map 3: Project coordinators in signed contracts
47
8/14/2019 SME 4th Progress report on SMEs participation in the 7th r&D Framework Programme
http://slidepdf.com/reader/full/sme-4th-progress-report-on-smes-participation-in-the-7th-rd-framework-programme 49/87
8/14/2019 SME 4th Progress report on SMEs participation in the 7th r&D Framework Programme
http://slidepdf.com/reader/full/sme-4th-progress-report-on-smes-participation-in-the-7th-rd-framework-programme 50/87
49
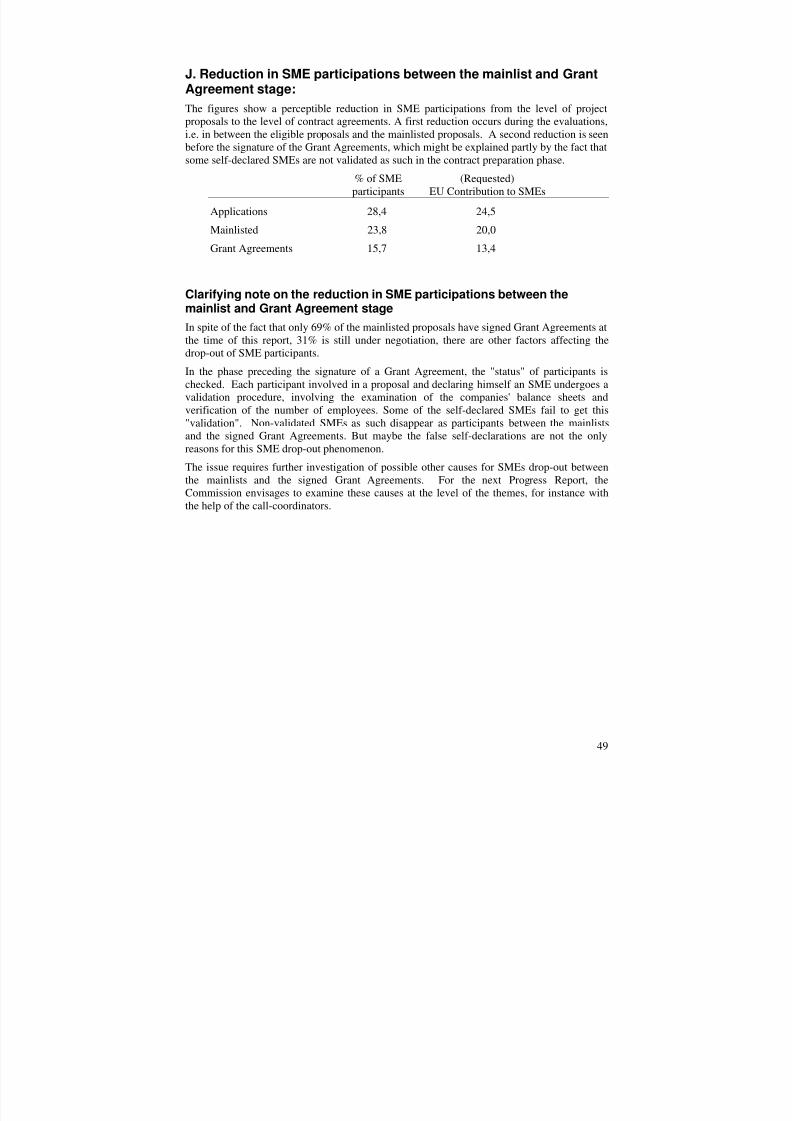
J. Reduction in SME participations between the mainlist and GrantAgreement stage:The figures show a perceptible reduction in SME participations from the level of projectproposals to the level of contract agreements. A first reduction occurs during the evaluations,
i.e. in between the eligible proposals and the mainlisted proposals. A second reduction is seenbefore the signature of the Grant Agreements, which might be explained partly by the fact thatsome self-declared SMEs are not validated as such in the contract preparation phase.
% of SME (Requested)participants EU Contribution to SMEs
Applications 28,4 24,5Mainlisted 23,8 20,0Grant Agreements 15,7 13,4
Clarifying note on the reduction in SME participations between themainlist and Grant Agreement stageIn spite of the fact that only 69% of the mainlisted proposals have signed Grant Agreements atthe time of this report, 31% is still under negotiation, there are other factors affecting thedrop-out of SME participants.In the phase preceding the signature of a Grant Agreement, the "status" of participants ischecked. Each participant involved in a proposal and declaring himself an SME undergoes avalidation procedure, involving the examination of the companies' balance sheets and
verification of the number of employees. Some of the self-declared SMEs fail to get this"validation". Non-validated SMEs as such disappear as participants between the mainlistsand the signed Grant Agreements. But maybe the false self-declarations are not the onlyreasons for this SME drop-out phenomenon.The issue requires further investigation of possible other causes for SMEs drop-out betweenthe mainlists and the signed Grant Agreements. For the next Progress Report, theCommission envisages to examine these causes at the level of the themes, for instance withthe help of the call-coordinators.
8/14/2019 SME 4th Progress report on SMEs participation in the 7th r&D Framework Programme
http://slidepdf.com/reader/full/sme-4th-progress-report-on-smes-participation-in-the-7th-rd-framework-programme 51/87
8/14/2019 SME 4th Progress report on SMEs participation in the 7th r&D Framework Programme
http://slidepdf.com/reader/full/sme-4th-progress-report-on-smes-participation-in-the-7th-rd-framework-programme 52/87
51
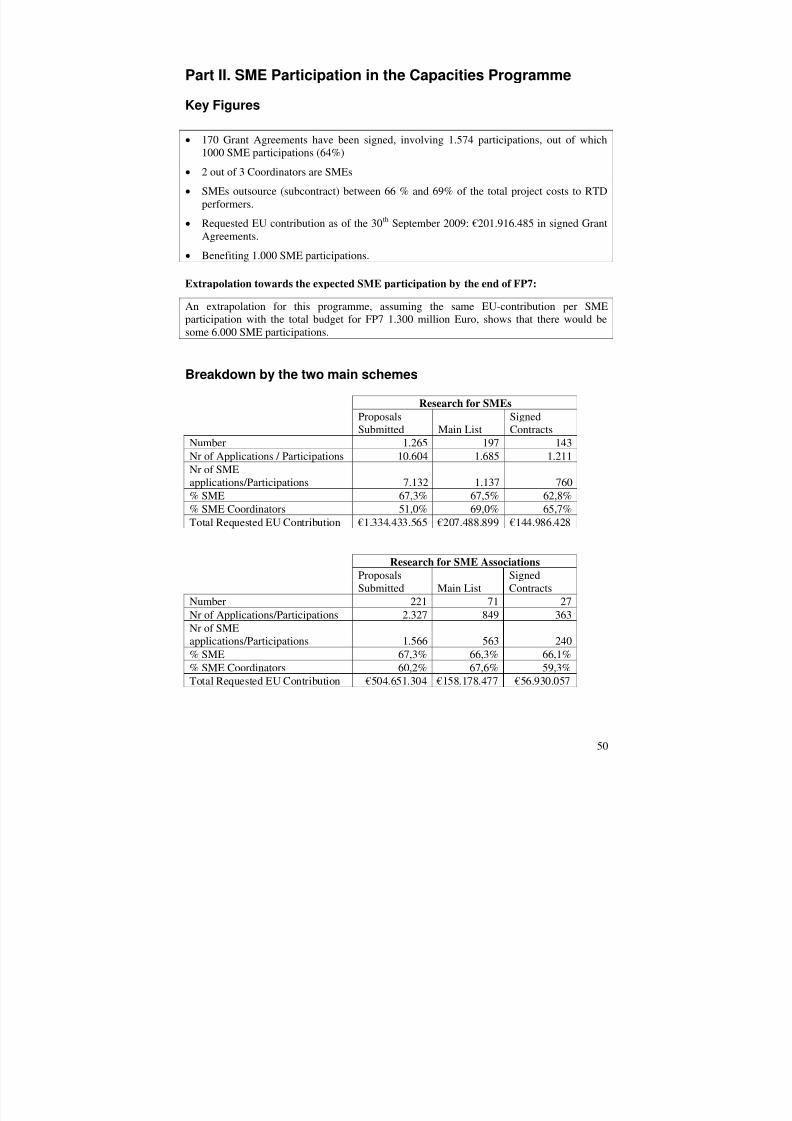
Overall picture for the two schemes
Research for the Benefit of SMEsTotals for both schemes Signed ContractsNumber 170Nr of Applications / Participations 1.574Nr of SME applications/Participations 1.000% SME 63,5%% SME Coordinators 64,7%Total EU Contribution €201.916.485
Average Project Cost BreakdownResearch for SMEs
Total Costs Subcontracted
to RTDsRTD Costs Demonstration
Costs
Management
Cost
Other
Costs
RequestedEU
Contribution €1.422.137 €936.106 €1.191.577 €74.052 €84.169 €72.339 €1.021.264
100% 65,8% 83,8% 5,2% 5,9% 5,1% 71,8%
Research for SME Associations
Total Costs Subcontractedto RTDs RTD Costs Demonstration
CostsManagement
CostOtherCosts
RequestedEU
Contribution €3.055.685 €2.105.911 €2.307.521 €251.091 €193.068 €304.005 €2.272.614
100% 68,9% 75,5% 8,2% 6,3% 9,9% 74,4%
8/14/2019 SME 4th Progress report on SMEs participation in the 7th r&D Framework Programme
http://slidepdf.com/reader/full/sme-4th-progress-report-on-smes-participation-in-the-7th-rd-framework-programme 53/87
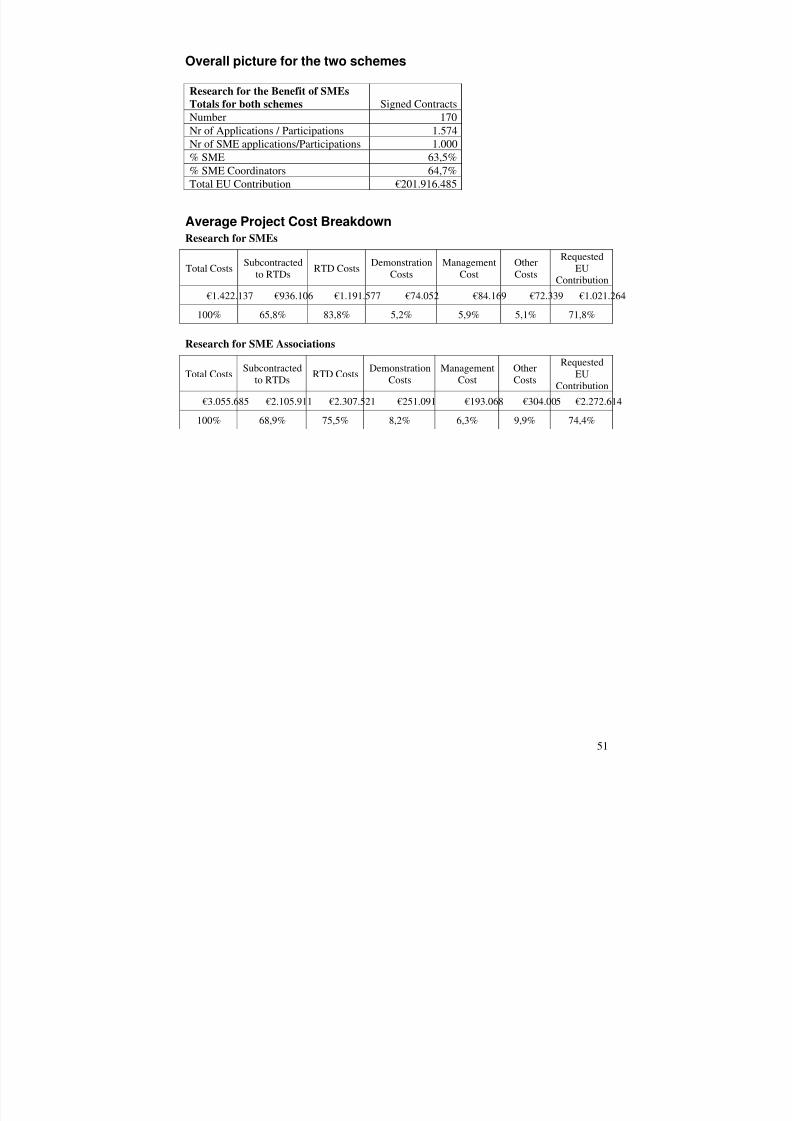
Summary in Maps
Map 4: Research for the benefit of SMEs – Beneficiaries in Signed Contracts
52
8/14/2019 SME 4th Progress report on SMEs participation in the 7th r&D Framework Programme
http://slidepdf.com/reader/full/sme-4th-progress-report-on-smes-participation-in-the-7th-rd-framework-programme 54/87
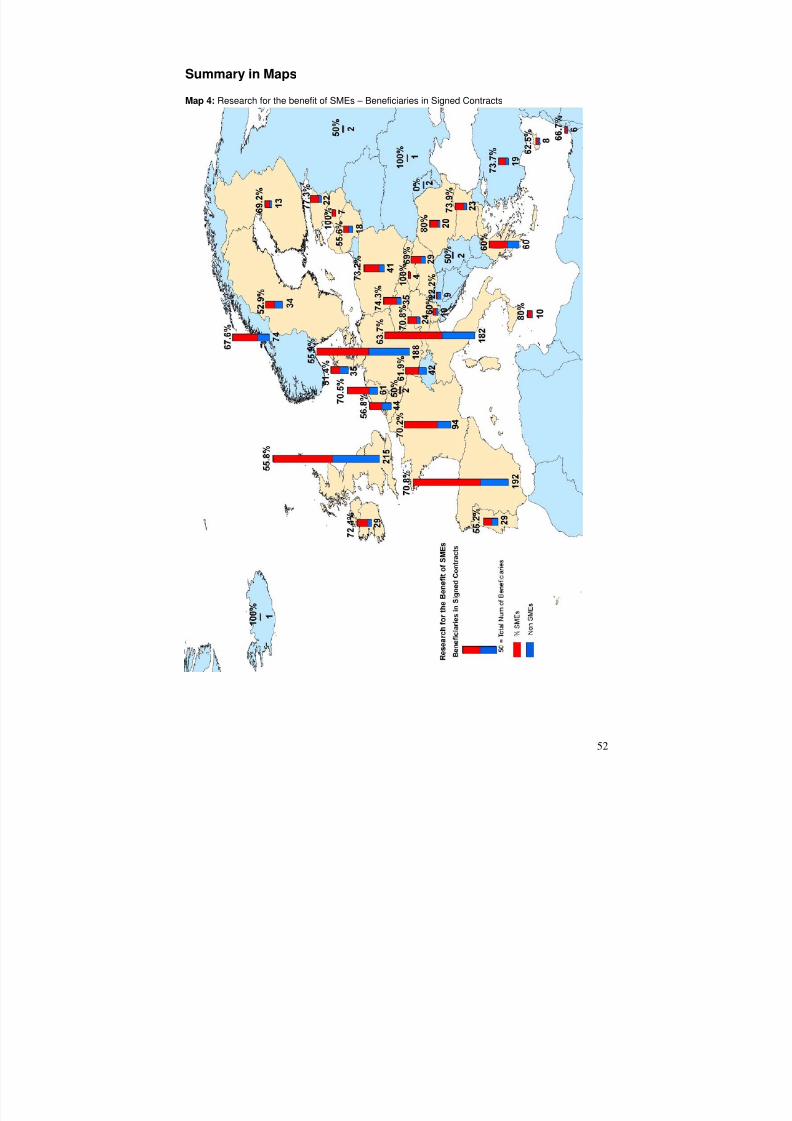
Map 5: Research for the benefit of SMEs - Coordinators in Signed Contracts
53

8/14/2019 SME 4th Progress report on SMEs participation in the 7th r&D Framework Programme
http://slidepdf.com/reader/full/sme-4th-progress-report-on-smes-participation-in-the-7th-rd-framework-programme 55/87
54
Part III. SME Participation in the People Programme
In FP7 the 'People ' specific programme is implemented through actions under four categoriesas follows: Initial training of researchers, Life-long training & career development, Industry-academia pathways, and partnerships and International dimension.
These actions can be further divided into host driven actions and actions for individualresearchers.
Apart from IRSES and COFUND all the other Marie Curie actions are open to participationsfrom companies (large or small). However, although participation for SMEs is possiblethroughout the People Programme, the actions for individual researchers mobility are mainlytargeting universities and research centres without any specific incentive for enterprisesparticipation. As a consequence, the number of SMEs involved in these staff exchangeschemes is always negligible when compared to the great number of proposal submitted andprojects funded. On the other hand, in theMarie Curie Industry Academia Partnerships
and Pathways (IAPP) and theMarie Curie Initial Training Networks (ITN ) applicants areaware of the added value coming from a balanced participation of research entities andenterprises, in particular SMEs. For this reason IAPP and ITN will be the only two MarieCurie Actions to be taken into consideration for the purpose of this report.
Industry academia partnerships and pathways
This action seeks to open and foster dynamic pathways between public research organisationsand private commercial enterprises, in particular SMEs, including traditional manufacturingindustries, based on longer term co-operation programmes with a high potential for increasingknowledge-sharing and mutual understanding of the different cultural settings and skillrequirements of both sectors. It is implemented through targeted and flexible support forhuman resources interactions within co-operation programmes between at least twoorganisations, one from each sector and from at least two different Member States orAssociated countries.
The IAPP action was initiated with the launch of FP7 and to date three calls have been closed.The first in 2007 worth €38,5M received 102 applications (involving some 152 SMEs).The 39contracts signed involve 155 participants out of which 42 are SMEs (27,1%) with 3 SMEs co-ordinators, with an average of 1,1 SME per project. The share of EU contribution allocated toSMEs in signed Grant Agreements amounts to 28,9%.
The 2008 call was worth €48M. This call received 141 applications involving 230 SMEs.Within the 39 resulting grant agreements, out of 159 participants (34%) 8 SMEs were co-ordinating projects and a further 54 SMEs received funding as partners As we can see, notonly has the absolute number of funded SME participants increased compared to the first call,but a fifth of all successful projects were led by SMEs. The share of EU contribution allocatedto SMEs in signed Grant Agreements amounts to 38,2%.
The 2009 call is worth €65M and closed on 27 July 2009. It received 356 eligible proposalsand the results available so far show 1.473 applicants out of which 503 are SMEs (34%), with
74 SMEs co-ordinators (21%).In total the IAPP consortia having signed a grant agreement up to the 30/09/2009 allocate25,4 M€ or 33,4 % of the EU budget to SMEs.
8/14/2019 SME 4th Progress report on SMEs participation in the 7th r&D Framework Programme
http://slidepdf.com/reader/full/sme-4th-progress-report-on-smes-participation-in-the-7th-rd-framework-programme 56/87
55
Although the IAPP action is not SME targeted, the flexibility of the programme and the factthat the contribution of the private sector is compulsory, facilitate the SMEs participation inthe IAPP action. The environment created by this funding scheme seems to be particularlywelcoming towards the participation of these stakeholders.
Initial training
This action aims to improve the career prospects of early-stage researchers both in the publicand private sectors, thereby making research careers more attractive to young people. Thisinitial research training will be achieved through transnational networking mechanismwhereby networks, typically of 5-10 partners, receive funding to train early stage researchers.The typical network receives €3,5 million Euros over 4 years to train up to 20 early stageresearchers. Within Marie Curie actions, all fields of research are eligible for support andthere is a strong emphasis on industry-relevant training. However it is important to underlinethat within the ITN programme the participation of the private sector as full partner is higlyrecommended but not compulsory.
In 2007 75 "Initial Training Networks" were funded from the €280 million available. Thesenetworks must include the private sector and of the 675 participants funded in the successfulconsortia, 50 or 7.4% of the total participants were SMEs having allocated €11.441.341 or4,7% EC contribution
The second call in 2008 was worth €343 million. Negotiations lead so far to 21 signed GrantAgreements. These consortia contain 191 research institutions, of which 12 or 6,3% are SMEswith €1.774.857 or 3,8% of EC contribution.
In total the ITNs consortia having signed a grant agreement up to the 30/09/2009 allocate
13,2 M€ or 5 % of the EC contribution to SMEs.
8/14/2019 SME 4th Progress report on SMEs participation in the 7th r&D Framework Programme
http://slidepdf.com/reader/full/sme-4th-progress-report-on-smes-participation-in-the-7th-rd-framework-programme 57/87
56
Analysis SMEs in the People Programme (Marie Curie Actions)The Marie Curie Industry Academia Partnerships and Pathways (IAPP)and theMarie CurieInitial Training Networks (ITN)applicants are the only two Marie Curie Actions relevant tobe taken into consideration for the purpose of this report.
Marie Curie Industry Academia Partnerships and Pathways (IAPP)
SIGNED GA'sNumber 78Nr of Participations 314Nr of SME Participations 96% participations of SMEs 30,57%Requested EU Contribution ALL 75.912.998 €Requested EU Contribution SMEs 25.412.103 €% Requested EU contribution for SMEs 33,5%Average EU Contribution to SMEs 264.709 €Average Participant EU Contribution 241.761 €Average contribution non-SMEs 231.655 €
Nr of Mainlisted Proposals: 82
Budget situtation 30 September 2009Total foreseen budget 350.000.000 €% of IAPP budget used 30 September 2009 21,7%% used for SMEs 30 September 2009 7,3%
Marie Curie Initial Training Networks (ITN)
SIGNED GA'sNumber 96Nr of Participations 866Nr of SME /Participations 62% participations of SMEs 7,16%Requested EU Contribution ALL 292.707.347Requested EU Contribution SMEs 13.216.198
% Requested EU contribution for SMEs 4,5%Average EU Contribution to SMEs 213.164 €Average Participant EU Contribution 337.999 €Average contribution non-SMEs 347.625 € Success rate ITN proposals (evaluation)Nr of Mainlisted Proposals: 160 Budget situation 30 September 2009Total foreseen budget 1.900.000.000 €% of ITN budget used per 30 September 2009 15,4%% used for SMEs 30 September 2009 4,5%
8/14/2019 SME 4th Progress report on SMEs participation in the 7th r&D Framework Programme
http://slidepdf.com/reader/full/sme-4th-progress-report-on-smes-participation-in-the-7th-rd-framework-programme 58/87
8/14/2019 SME 4th Progress report on SMEs participation in the 7th r&D Framework Programme
http://slidepdf.com/reader/full/sme-4th-progress-report-on-smes-participation-in-the-7th-rd-framework-programme 59/87
58
Part V. Extra Focus
1. Focus on IPR:Transaction issues in "Research for the benefit of SMEs"
The aim of this section is to provide an analysis on how actions in Research for SMEs andSME Associations10 deal with the "Transaction".The "Transaction" is fully integrated in the "Description of Work (DoW)" of the Project GrantAgreement and refers to the partners' agreement on the ownership of the generatedIntellectual Property Rights (IPR), the access rights to participants, and the remuneration to bepaid by SMEs or SME Associations (SME-AGs) to the RTD Performers.As a reminder, Background (BG) refers to Intellectual Property owned by the partners beforethe project, and Foreground (FG) to Intellectual Property generated by the project.
General figures
The "Description of Work" specifies how much SMEs will invest in the Project in cash and inkind, and which commercial rights they will retain. In the checked DoWs, participant SMEsseem to obtain full clarity on the access to and the use of Background and Foreground forProject implementation and possible commercial exploitation of results.The terms and the conditions of the "Transaction" are generally well spelled out, so that theSMEs can easily perform a cost-benefit analysis on their participation in the Project.
Background
BG during the Project:
Most of the Projects align to a default scheme for Calls under "Research for Benefit of SMEs", which provides SMEs with royalty-free access rights to the RTD Performers' formerknow-how.However, a not negligible number of Projects do not provide information in the GrantAgreement.
BG for use after the Project:
In a rather high number of Grant Agreements there are no specifications on how Partners will
deal with access to BG after the Project's completion (48% Projects in the Associations Call).However, in most of those cases where an agreement is set up, free access rights are grantedto SMEs.
10 The 158 Projects checked for this analysis refer to the Grant Agreements signed by July 2009.
8/14/2019 SME 4th Progress report on SMEs participation in the 7th r&D Framework Programme
http://slidepdf.com/reader/full/sme-4th-progress-report-on-smes-participation-in-the-7th-rd-framework-programme 60/87
59
Foreground
FG for the Project:
Ownership of the generated Foreground is usually well described. The most commonagreement privileges the SMEs' ownership (default regime ), which remunerate the RTDPerformers for their job accordingly.Ownership is generally either shared between the SMEs, or attributed to one single SME.
FG for use – Exploitation:
Exploitation of the Project results is generally devolved to the SMEs, either as the solebeneficiaries or along with other (mainly external) bodies.An important distinction concerns the Associations Call, where the exploitation is attributedto the SME-AGs, which usually sub-licence access rights to their members and in most of thecases also to the participant SMEs (not members of the Associations).
IPR for RTD performers: This aspect concerns the possibility for RTD Performers to be provided with access rights toForeground after the Project, to perform further R&D activities.An agreement is included in the majority of DoWs, mostly providing access rights forresearch purposes to the RTD Performers.
IPR Manager
The IPR Manager is responsible for managing the overall Consortium decisions about IPR.The checked DoWs mostly contain relevant information, and show that SMEs have been
appointed to perform these tasks in the majority of cases.
Conclusion
The analysis shows that the SMEs' business interest is successfully taken into account in theanalysed Descriptions of Work.Participant SMEs are therefore fully aware of the level of investment required and theexpected commercial return.
8/14/2019 SME 4th Progress report on SMEs participation in the 7th r&D Framework Programme
http://slidepdf.com/reader/full/sme-4th-progress-report-on-smes-participation-in-the-7th-rd-framework-programme 61/87
60
2. SME participation in Joint Technology Initiatives (JTIs)
JTIs support trans-national cooperation in fields of key importance to industry. JTIs are legalentities established under Article 171 of the Treaty11. JTIs arise primarily from the work of European Technology Platforms (ETPs), informal networks that bring together stakeholders,led by industry, to define and implement medium to long-term strategic research agendas.
In a small number of cases, ETPs achieve such an ambitious scale and scope that they requirepublic-private partnerships in the form of legal entities to be created in order to mobiliselarge-scale public and private investments as well as the substantial research resourcesrequired to implement important elements of their Strategic Research Agendas. JTIs are aneffective way of meeting the needs of this small number of ETPs.
Based on the identification process detailed in the Cooperation Specific Programme, six areasemerged where JTIs could have particular relevance: Fuel Cells and Hydrogen ("FCH"),Aeronautics and Air Transport ("Clean Sky"); Innovative Medicines ("IMI"); Nano-electronics ("ENIAC"); Embedded Computing Systems ("ARTEMIS"), and GlobalMonitoring for Environment and Security ("GMES"). The first 5 of these have beenestablished following council regulations from December 2007 and May 2008.
GMES will follow a different approach to the other JTIs. In May 2009 the Commission madeits proposal to the Council and the Parliament on the GMES programme and its initialoperations (2011-2013).
Following the mid-term review of FP7, additional proposals for JTIs may be identified andproposed for funding.
The implementing structures and the manner in which the R&D will be financed differbetween the various JTIs. The EU contribution will come from the Cooperation Programmeand for the 5 JTIs the requested EU contribution comes to €3 Billion i.e. a little under 10% of the total Cooperation Programme budget. In all cases the council regulations commit the JTIsto promote the involvement of SMEs in its activities in line with the objectives of theFramework Programme.
Furthermore, as outlined in the JTIs communication to Collège12, industry contributions areexpected to be higher than those for traditional instruments within the FrameworkProgramme. For example, within IMI, the industry partners –except SMEs- will pay 100% of their costs, whereas under the Framework Programme instruments, industry only pays 50% of its costs. It is also expected that JTIs, through increased networking between large companiesand SMEs, may facilitate greater investment in research by SMEs.
All 5 JTIs allow SMEs partake in the research activity. The overall SME dimension and themeasures taken to integrate SMEs in the various JTIs are quite different. For example ENIAC,ARTEMIS, and IMI foresee a range of measures to integrate SMEs including the involvementof an SME federation in promoting SME participation and in the overall management of theJTI. On the other hand within IMI no companies other than SMEs will receive funding fromthe IMI Joint Undertaking. JTIs may have a significant impact on the overall participation of SMEs in the Cooperation Programme.
11 Article 171 states that "The Community may set up joint undertakings or any other structure necessary for theefficient execution of Community research, technological development and demonstration programmes" 12 May 2007 OJ 1787 – point D8
8/14/2019 SME 4th Progress report on SMEs participation in the 7th r&D Framework Programme
http://slidepdf.com/reader/full/sme-4th-progress-report-on-smes-participation-in-the-7th-rd-framework-programme 62/87
61
The first Expression of Interests launched by IMI for €122.7 Million closed in July 2008 andinvolved almost 1300 applying organisations, including 220 SMEs (17%). However, for fullproposals, closing in January 2009, the number of SMEs that applied dropped to 14.7%overall, while the requested budget came to 17.2%. On 30 October 2009, the 2nd IMI call willbe launched, with an expected call budget of EUR 76,8 million.
ARTEMIS and ENIAC published their first calls in May 2008 for €35.1 and €90 Millionrespectively. The ARTEMIS call post evaluation stage came to 154 participants in the 12selected projects, of which 57 (37%) were SMEs, requesting 15% of the joint public and EUfunding contribution. For ENIAC, 12 proposals were received, involving 265 organisations,out of which 62 SMEs (23,4%). Post evaluation the ENIAC call accounted for 121 differentorganisations, of which 44 (36%) were SMEs, requesting 16% of the combined public andprivate contribution. For 2009, both ARTEMIS and ENIAC have already closed theirrespective call for project outlines. Full project proposals for ARTEMIS and ENIAC neededto be submitted by 3 September 2009.
The first call for proposals for FCH with an indicative budget of EUR 28.1 million closed on15 January 2009. Out of the 124 partners in the 16 main-listed projects, 22 (18%) are SMEs.There are 4 SME coordinators (25%). 14 out of the 16 main-listed projects include at leastone SME. These projects are currently under negotiation. The second call (FCH-JU-2009-1)has been launched with a deadline on 15 October 2009; it has an indicative budget of EUR71,3 million.
CLEAN SKY launched a call for proposals with a budget of EUR 26,5 million, which closedon 31 August 2009.
While the monitoring of SME participation in the FP7 call for proposal is facilitated through acentral database such facilities do not exist at the level of the JTIs. The statutes of the JTIshowever, prescribe that the Annual Activity Report shall include information on theparticipation of SMEs in Joint Undertaking's R&D Activities. Given the budgetary weightthat JTIs have in Cooperation, Commission services intend to closely monitor SME-participation therein.
8/14/2019 SME 4th Progress report on SMEs participation in the 7th r&D Framework Programme
http://slidepdf.com/reader/full/sme-4th-progress-report-on-smes-participation-in-the-7th-rd-framework-programme 63/87
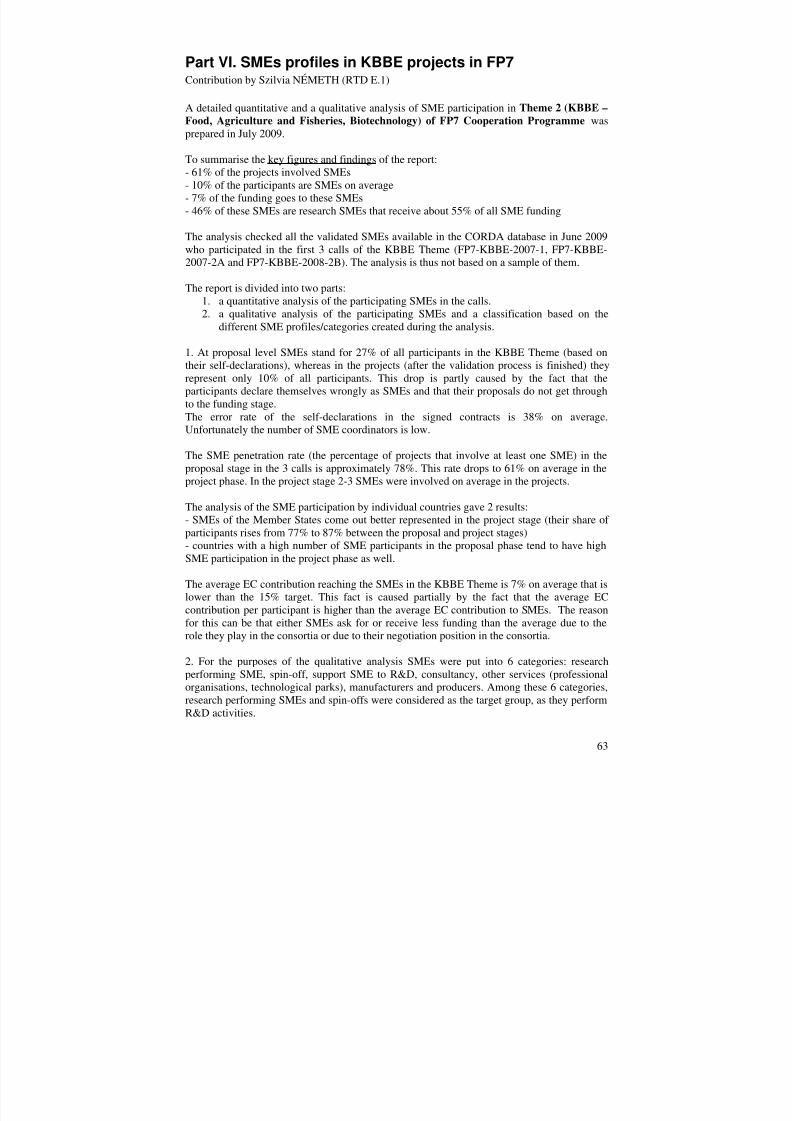
8/14/2019 SME 4th Progress report on SMEs participation in the 7th r&D Framework Programme
http://slidepdf.com/reader/full/sme-4th-progress-report-on-smes-participation-in-the-7th-rd-framework-programme 64/87
63
Part VI. SMEs profiles in KBBE projects in FP7Contribution by Szilvia NÉMETH (RTD E.1)
A detailed quantitative and a qualitative analysis of SME participation inTheme 2 (KBBE –Food, Agriculture and Fisheries, Biotechnology) of FP7 Cooperation Programme was
prepared in July 2009.To summarise the key figures and findings of the report:- 61% of the projects involved SMEs- 10% of the participants are SMEs on average- 7% of the funding goes to these SMEs- 46% of these SMEs are research SMEs that receive about 55% of all SME funding
The analysis checked all the validated SMEs available in the CORDA database in June 2009who participated in the first 3 calls of the KBBE Theme (FP7-KBBE-2007-1, FP7-KBBE-2007-2A and FP7-KBBE-2008-2B). The analysis is thus not based on a sample of them.
The report is divided into two parts:1. a quantitative analysis of the participating SMEs in the calls.2. a qualitative analysis of the participating SMEs and a classification based on the
different SME profiles/categories created during the analysis.
1. At proposal level SMEs stand for 27% of all participants in the KBBE Theme (based ontheir self-declarations), whereas in the projects (after the validation process is finished) theyrepresent only 10% of all participants. This drop is partly caused by the fact that theparticipants declare themselves wrongly as SMEs and that their proposals do not get throughto the funding stage.The error rate of the self-declarations in the signed contracts is 38% on average.Unfortunately the number of SME coordinators is low.
The SME penetration rate (the percentage of projects that involve at least one SME) in theproposal stage in the 3 calls is approximately 78%. This rate drops to 61% on average in theproject phase. In the project stage 2-3 SMEs were involved on average in the projects.
The analysis of the SME participation by individual countries gave 2 results:- SMEs of the Member States come out better represented in the project stage (their share of participants rises from 77% to 87% between the proposal and project stages)- countries with a high number of SME participants in the proposal phase tend to have highSME participation in the project phase as well.
The average EC contribution reaching the SMEs in the KBBE Theme is 7% on average that islower than the 15% target. This fact is caused partially by the fact that the average ECcontribution per participant is higher than the average EC contribution to SMEs. The reasonfor this can be that either SMEs ask for or receive less funding than the average due to therole they play in the consortia or due to their negotiation position in the consortia.
2. For the purposes of the qualitative analysis SMEs were put into 6 categories: researchperforming SME, spin-off, support SME to R&D, consultancy, other services (professional
organisations, technological parks), manufacturers and producers. Among these 6 categories,research performing SMEs and spin-offs were considered as the target group, as they performR&D activities.
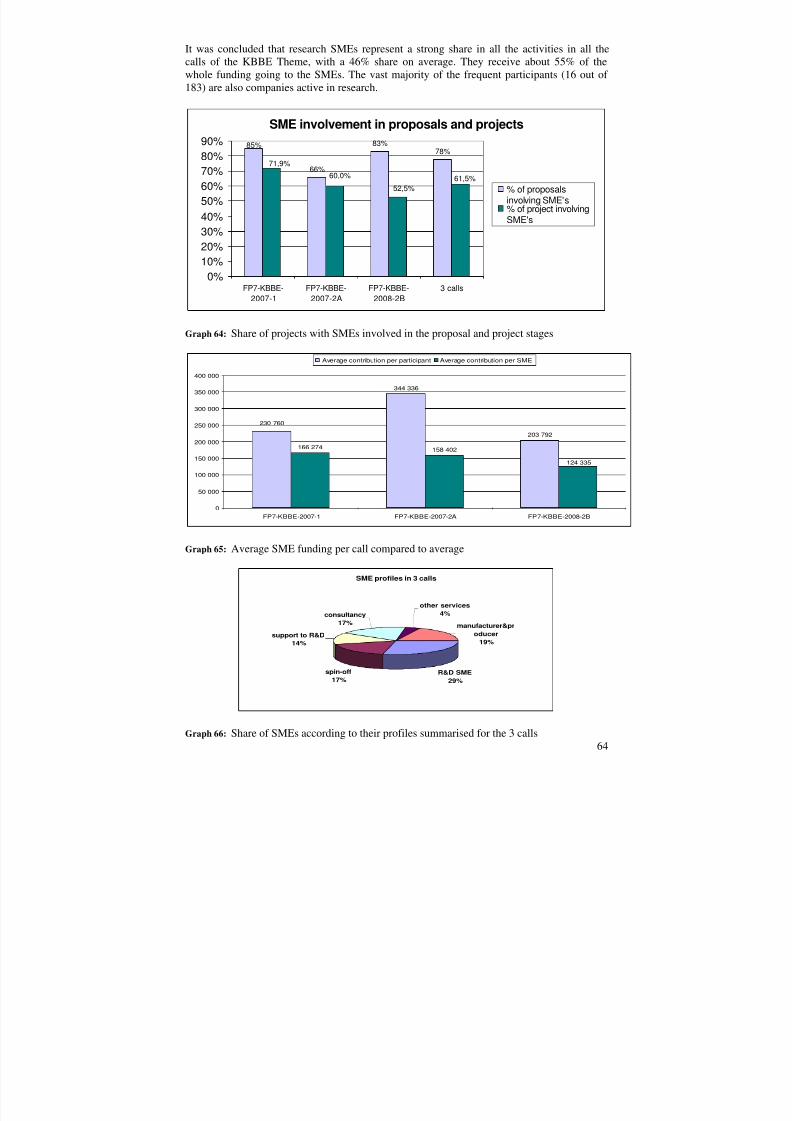
8/14/2019 SME 4th Progress report on SMEs participation in the 7th r&D Framework Programme
http://slidepdf.com/reader/full/sme-4th-progress-report-on-smes-participation-in-the-7th-rd-framework-programme 65/87
It was concluded that research SMEs represent a strong share in all the activities in all thecalls of the KBBE Theme, with a 46% share on average. They receive about 55% of thewhole funding going to the SMEs. The vast majority of the frequent participants (16 out of 183) are also companies active in research.
SME involvement in proposals and projects
66%
83%78%
85%
61,5%52,5%
60,0%
71,9%
0%
10%20%30%40%50%60%70%80%90%
FP7-KBBE-2007-1
FP7-KBBE-2007-2A
FP7-KBBE-2008-2B
3 calls
% of proposalsinvolving SME's% of project involvingSME's
Graph 64: Share of projects with SMEs involved in the proposal and project stages
344 336
203 792
166 274 158 402
230 760
124 335
0
50 000
100 000
150 000
200 000
250 000
300 000
350 000
400 000
FP7-KBBE-2007-1 FP7-KBBE-2007-2A FP7-KBBE-2008-2B
Average contribution per participant Average contribution per SME
Graph 65: Average SME funding per call compared to average
SME profiles in 3 calls
R&D SME29%
spin-off17%
support to R&D14%
consultancy17%
other services4%
manufacturer&producer
19%
64Graph 66: Share of SMEs according to their profiles summarised for the 3 calls
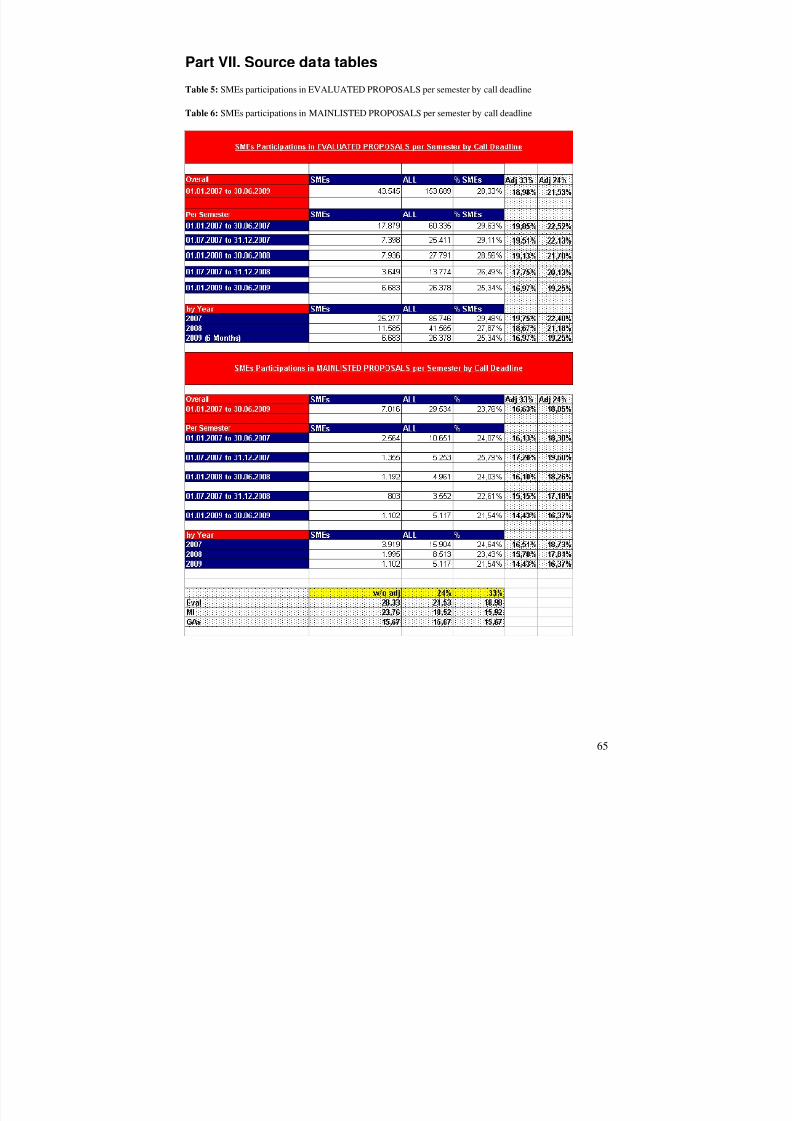
8/14/2019 SME 4th Progress report on SMEs participation in the 7th r&D Framework Programme
http://slidepdf.com/reader/full/sme-4th-progress-report-on-smes-participation-in-the-7th-rd-framework-programme 66/87
Part VII. Source data tables
Table 5: SMEs participations in EVALUATED PROPOSALS per semester by call deadline
Table 6: SMEs participations in MAINLISTED PROPOSALS per semester by call deadline
65
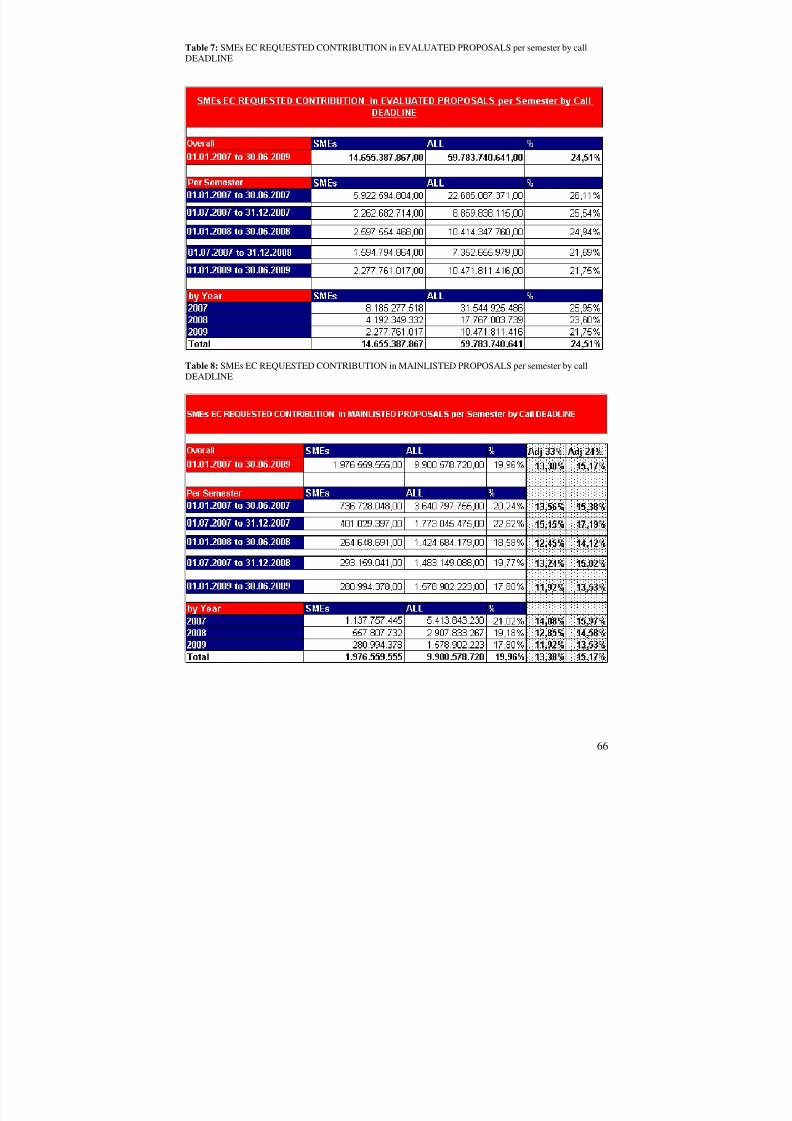
8/14/2019 SME 4th Progress report on SMEs participation in the 7th r&D Framework Programme
http://slidepdf.com/reader/full/sme-4th-progress-report-on-smes-participation-in-the-7th-rd-framework-programme 67/87
Table 7: SMEs EC REQUESTED CONTRIBUTION in EVALUATED PROPOSALS per semester by callDEADLINE
Table 8: SMEs EC REQUESTED CONTRIBUTION in MAINLISTED PROPOSALS per semester by callDEADLINE
66
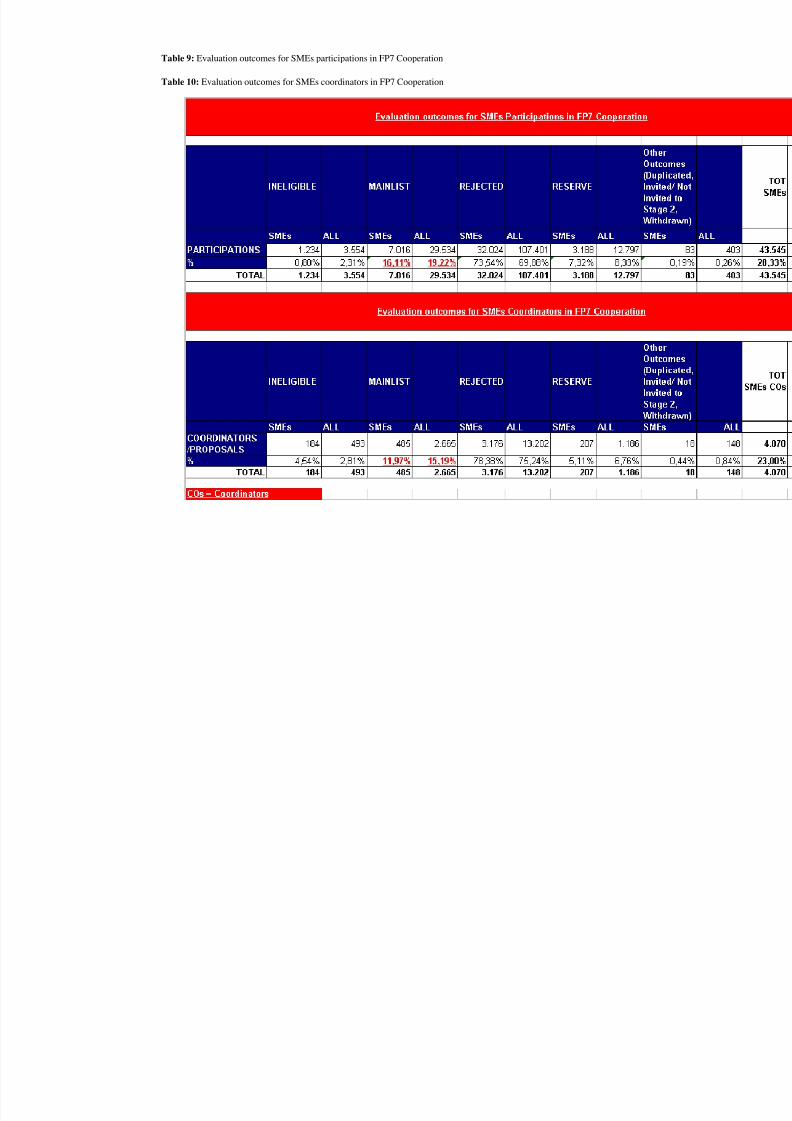
8/14/2019 SME 4th Progress report on SMEs participation in the 7th r&D Framework Programme
http://slidepdf.com/reader/full/sme-4th-progress-report-on-smes-participation-in-the-7th-rd-framework-programme 68/87
Table 9: Evaluation outcomes for SMEs participations in FP7 Cooperation
Table 10: Evaluation outcomes for SMEs coordinators in FP7 Cooperation
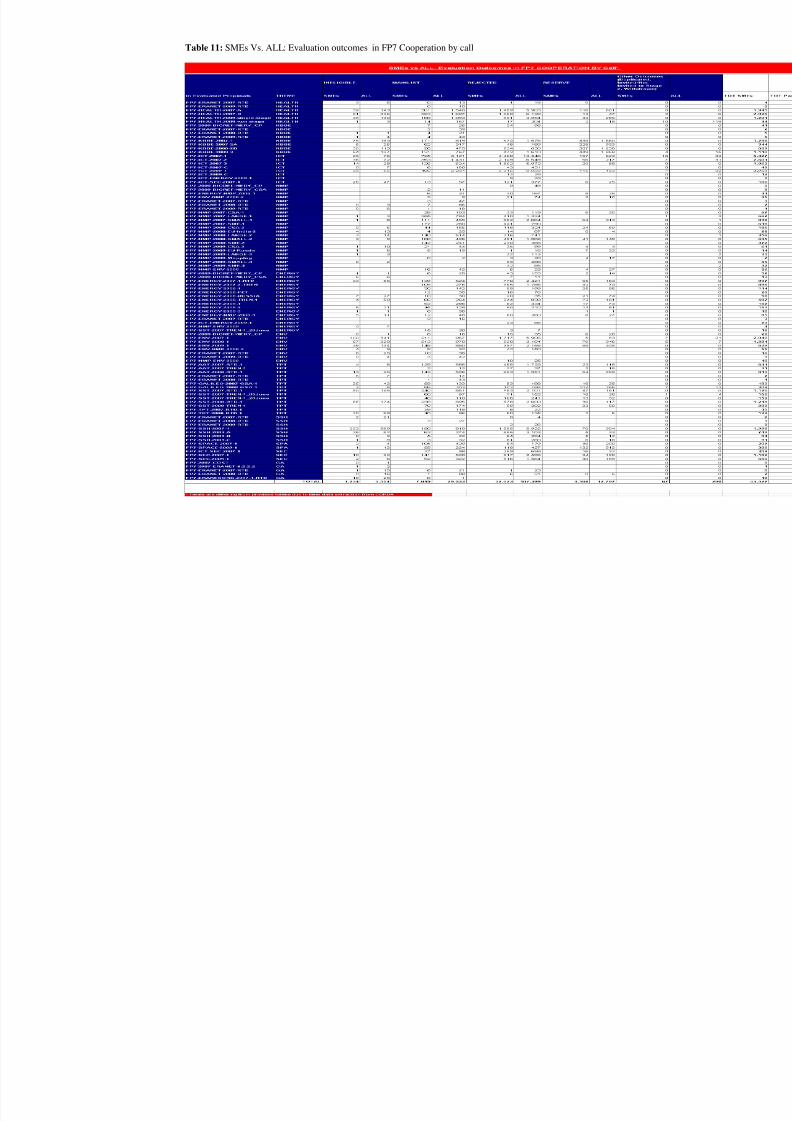
8/14/2019 SME 4th Progress report on SMEs participation in the 7th r&D Framework Programme
http://slidepdf.com/reader/full/sme-4th-progress-report-on-smes-participation-in-the-7th-rd-framework-programme 69/87
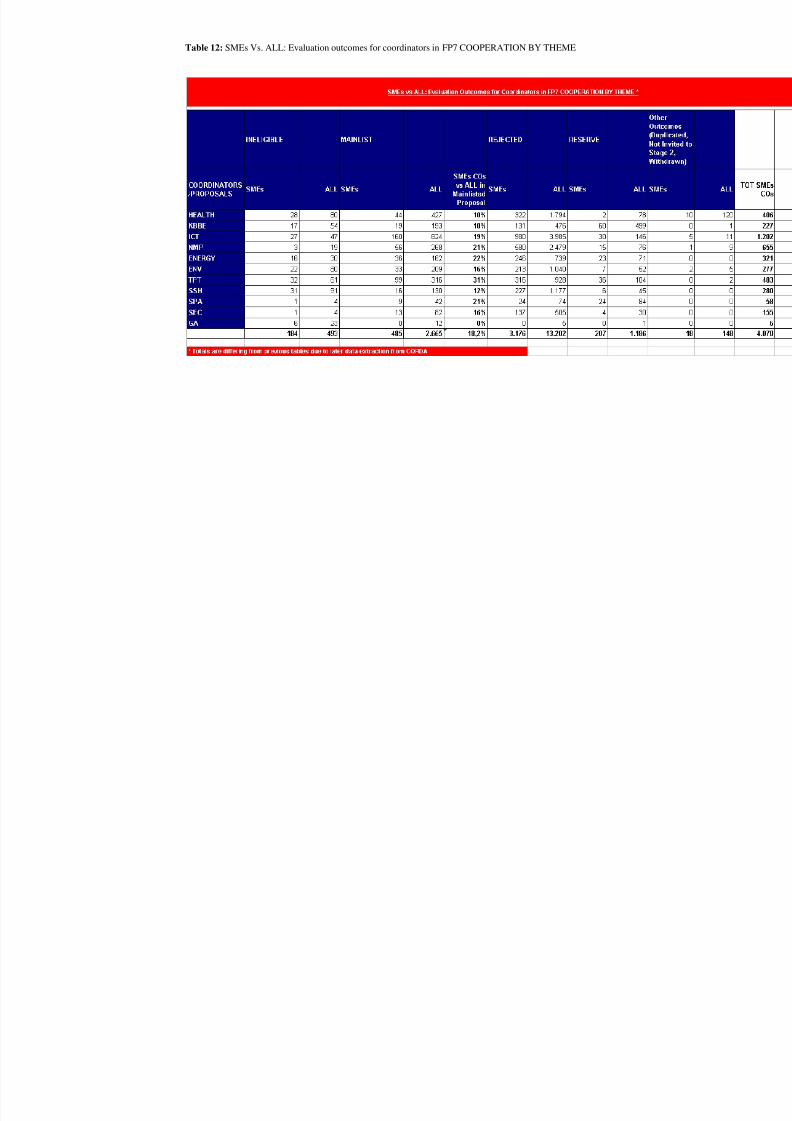
8/14/2019 SME 4th Progress report on SMEs participation in the 7th r&D Framework Programme
http://slidepdf.com/reader/full/sme-4th-progress-report-on-smes-participation-in-the-7th-rd-framework-programme 70/87
Table 12: SMEs Vs. ALL: Evaluation outcomes for coordinators in FP7 COOPERATION BY THEME
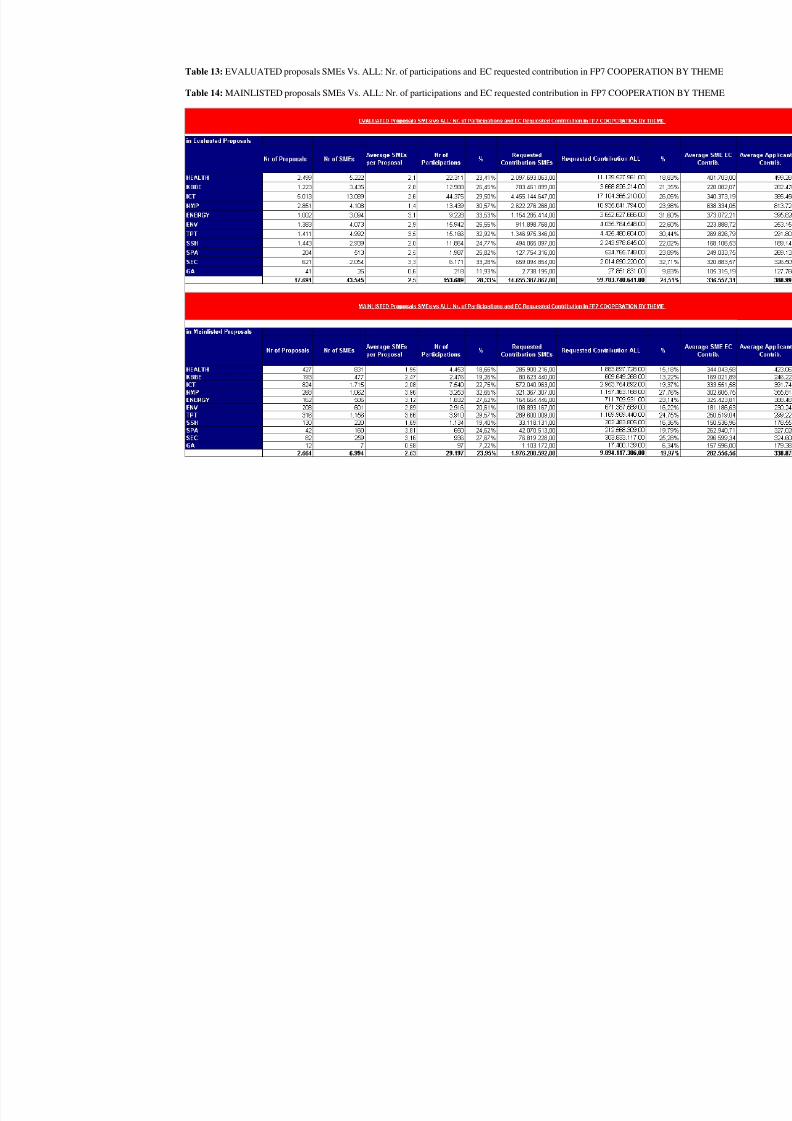
8/14/2019 SME 4th Progress report on SMEs participation in the 7th r&D Framework Programme
http://slidepdf.com/reader/full/sme-4th-progress-report-on-smes-participation-in-the-7th-rd-framework-programme 71/87
Table 13: EVALUATED proposals SMEs Vs. ALL: Nr. of participations and EC requested contribution in FP7 COOPER
Table 14: MAINLISTED proposals SMEs Vs. ALL: Nr. of participations and EC requested contribution in FP7 COOPE
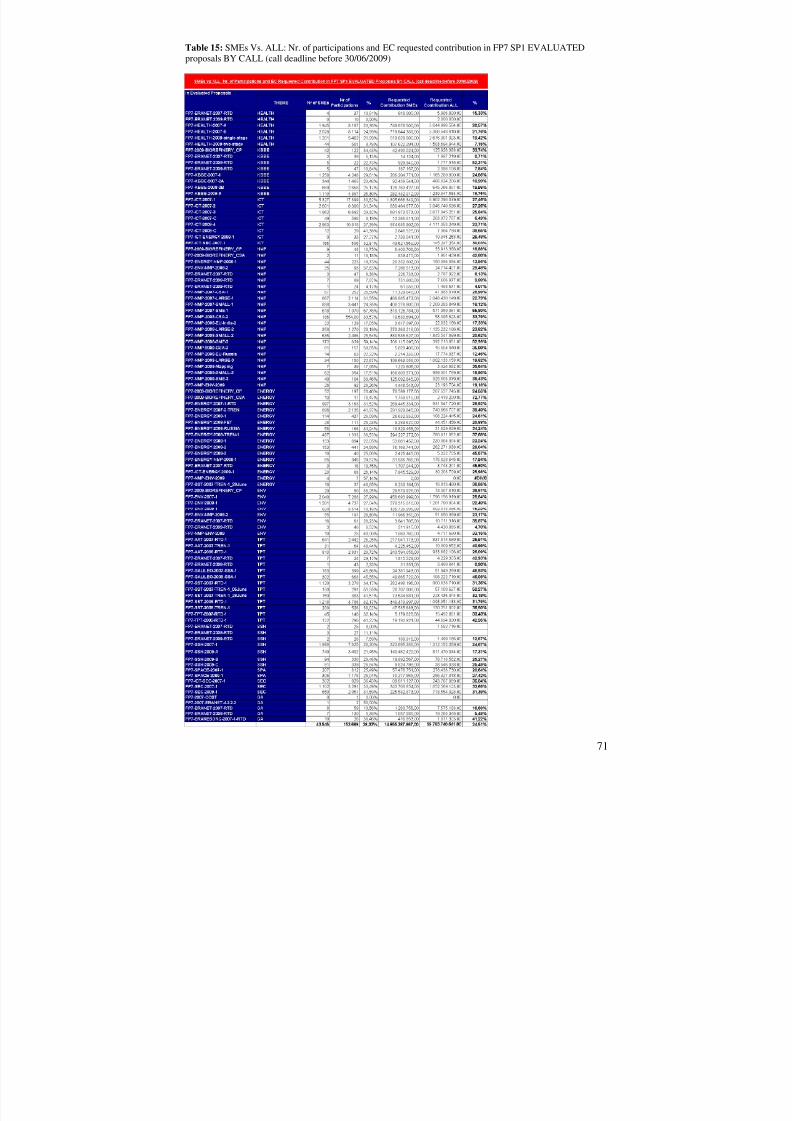
8/14/2019 SME 4th Progress report on SMEs participation in the 7th r&D Framework Programme
http://slidepdf.com/reader/full/sme-4th-progress-report-on-smes-participation-in-the-7th-rd-framework-programme 72/87
Table 15: SMEs Vs. ALL: Nr. of participations and EC requested contribution in FP7 SP1 EVALUATEDproposals BY CALL (call deadline before 30/06/2009)
71
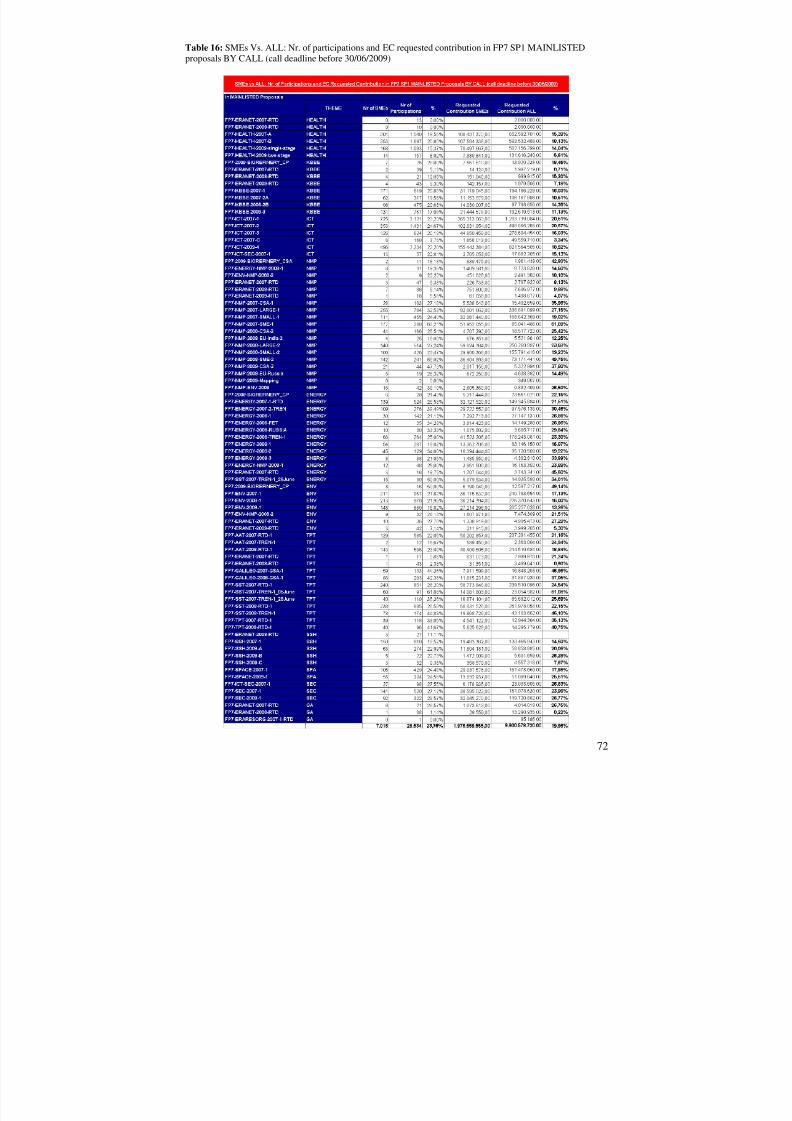
8/14/2019 SME 4th Progress report on SMEs participation in the 7th r&D Framework Programme
http://slidepdf.com/reader/full/sme-4th-progress-report-on-smes-participation-in-the-7th-rd-framework-programme 73/87
Table 16: SMEs Vs. ALL: Nr. of participations and EC requested contribution in FP7 SP1 MAINLISTEDproposals BY CALL (call deadline before 30/06/2009)
72
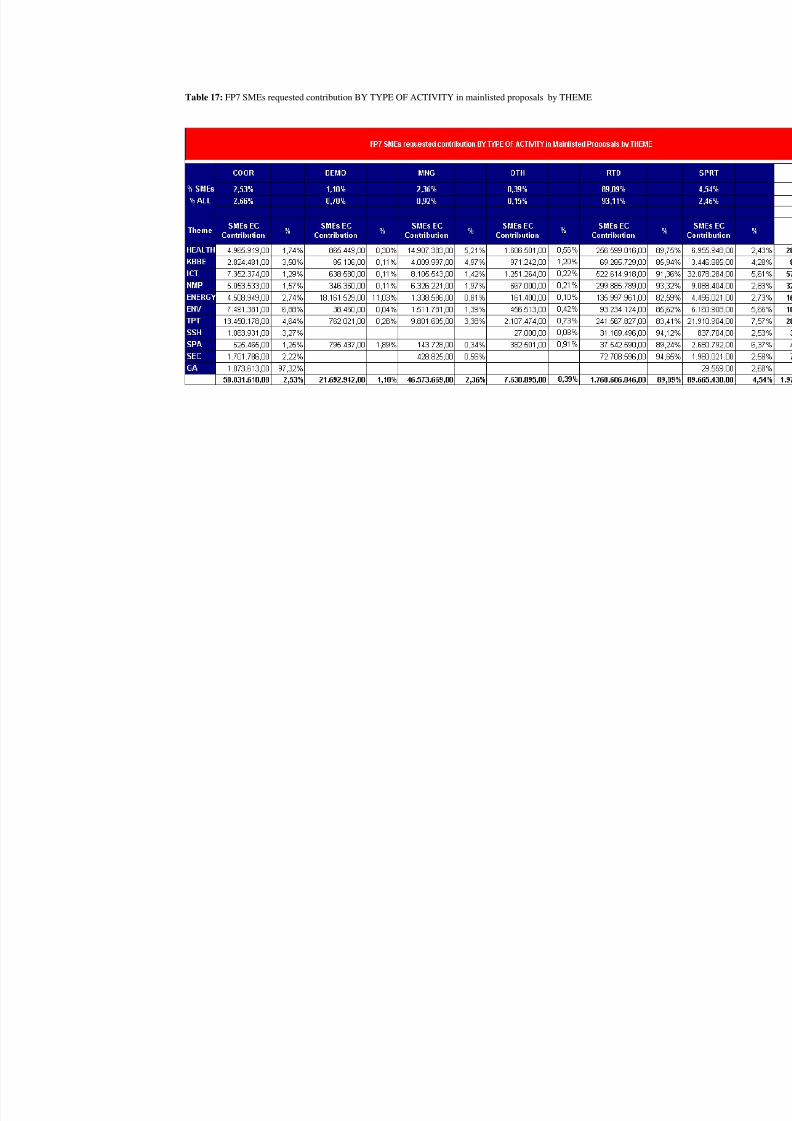
8/14/2019 SME 4th Progress report on SMEs participation in the 7th r&D Framework Programme
http://slidepdf.com/reader/full/sme-4th-progress-report-on-smes-participation-in-the-7th-rd-framework-programme 74/87
Table 17: FP7 SMEs requested contribution BY TYPE OF ACTIVITY in mainlisted proposals by THEME
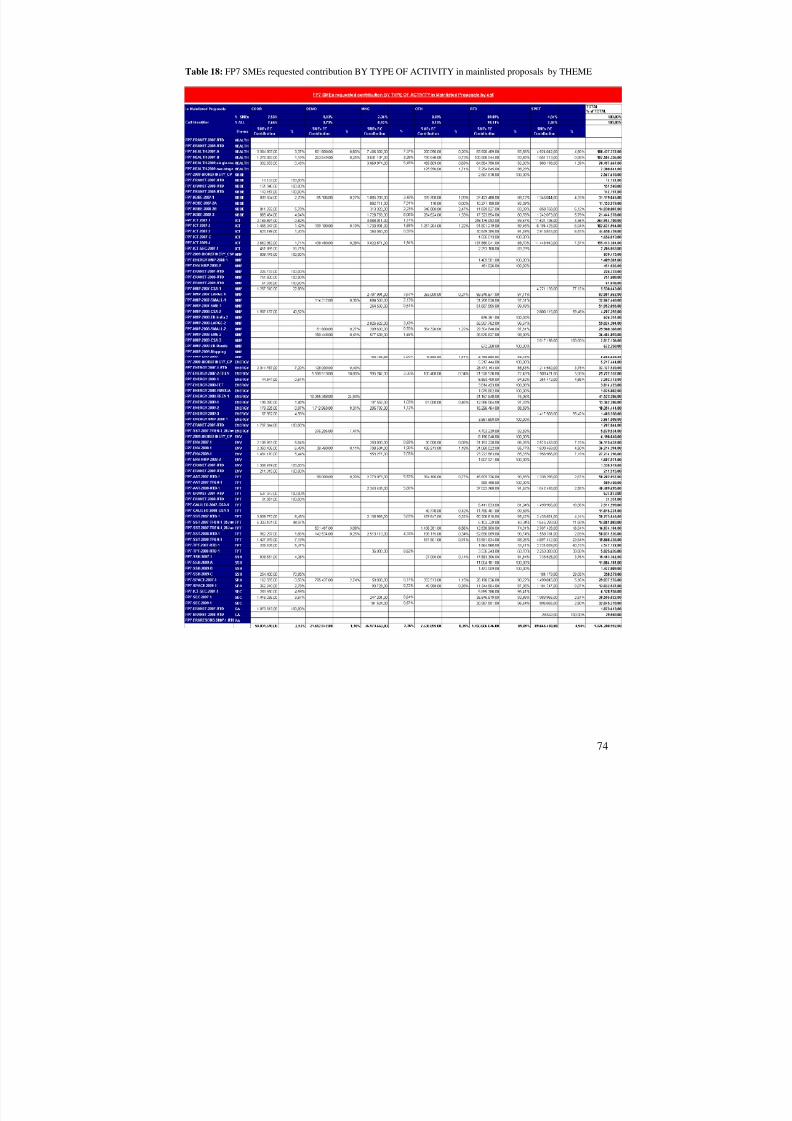
8/14/2019 SME 4th Progress report on SMEs participation in the 7th r&D Framework Programme
http://slidepdf.com/reader/full/sme-4th-progress-report-on-smes-participation-in-the-7th-rd-framework-programme 75/87
Table 18: FP7 SMEs requested contribution BY TYPE OF ACTIVITY in mainlisted proposals by THEME
74
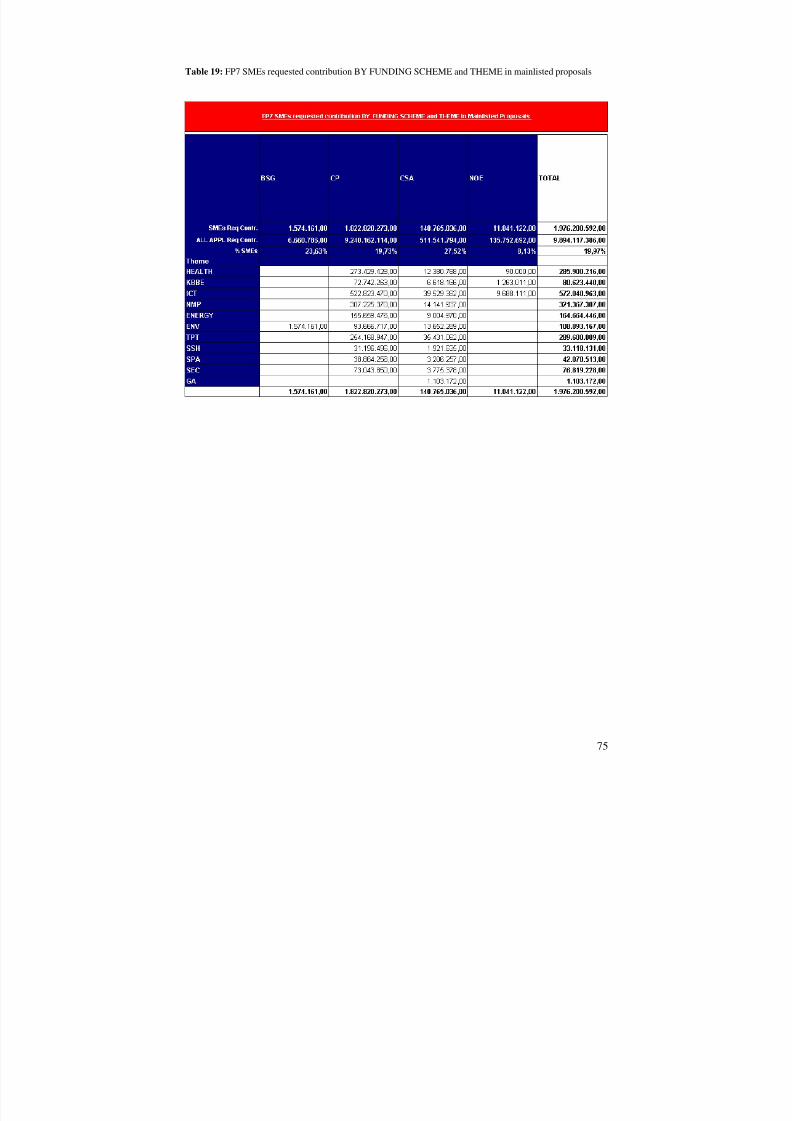
8/14/2019 SME 4th Progress report on SMEs participation in the 7th r&D Framework Programme
http://slidepdf.com/reader/full/sme-4th-progress-report-on-smes-participation-in-the-7th-rd-framework-programme 76/87
Table 19: FP7 SMEs requested contribution BY FUNDING SCHEME and THEME in mainlisted proposals
75
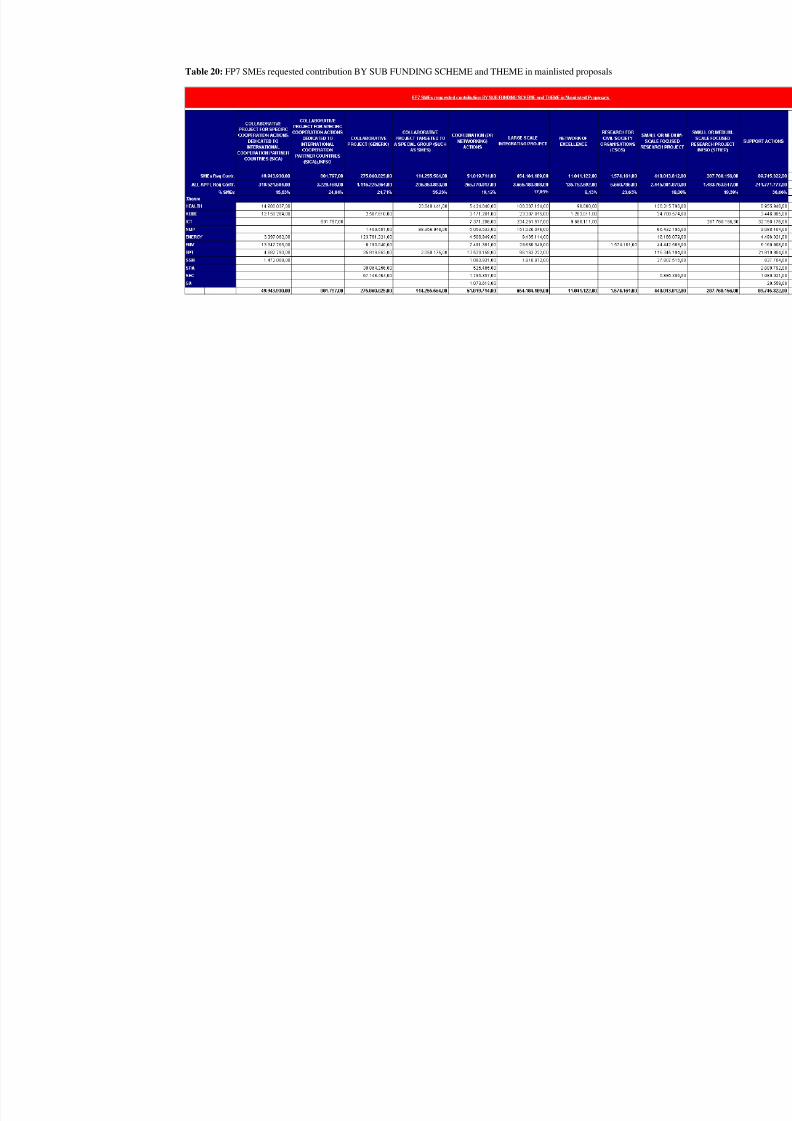
8/14/2019 SME 4th Progress report on SMEs participation in the 7th r&D Framework Programme
http://slidepdf.com/reader/full/sme-4th-progress-report-on-smes-participation-in-the-7th-rd-framework-programme 77/87
Table 20: FP7 SMEs requested contribution BY SUB FUNDING SCHEME and THEME in mainlisted proposals
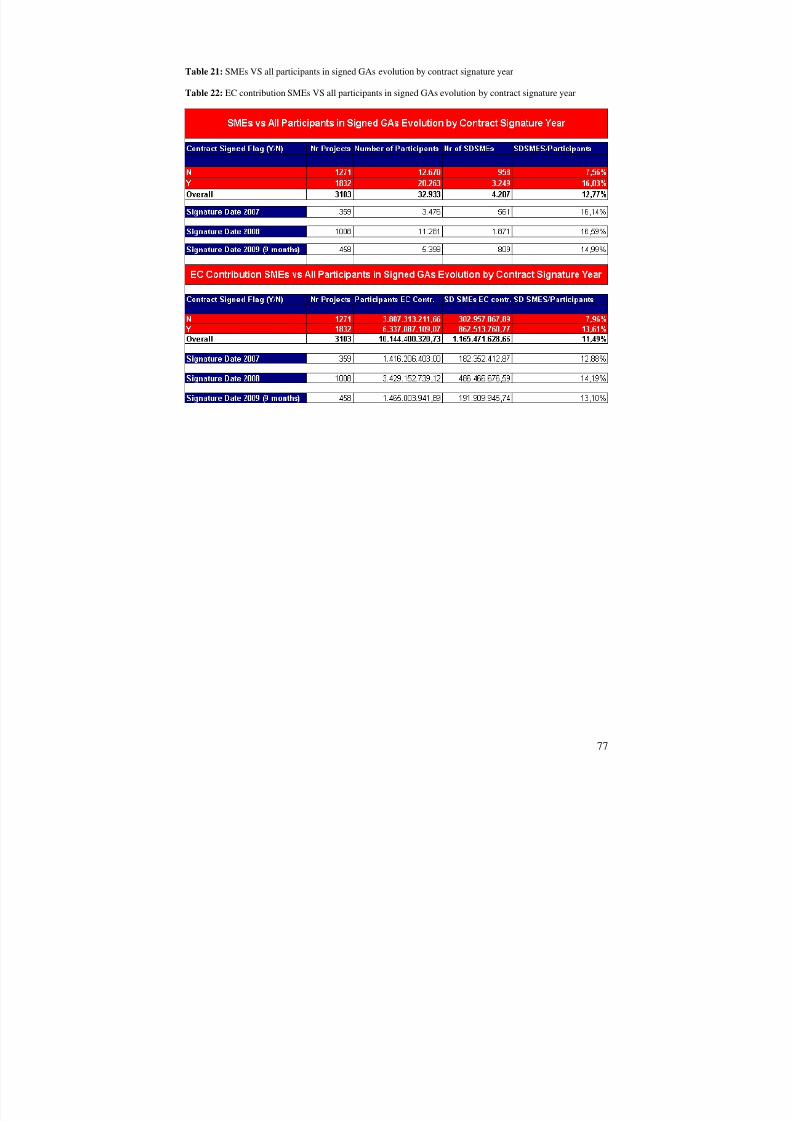
8/14/2019 SME 4th Progress report on SMEs participation in the 7th r&D Framework Programme
http://slidepdf.com/reader/full/sme-4th-progress-report-on-smes-participation-in-the-7th-rd-framework-programme 78/87
Table 21: SMEs VS all participants in signed GAs evolution by contract signature year
Table 22: EC contribution SMEs VS all participants in signed GAs evolution by contract signature year
77
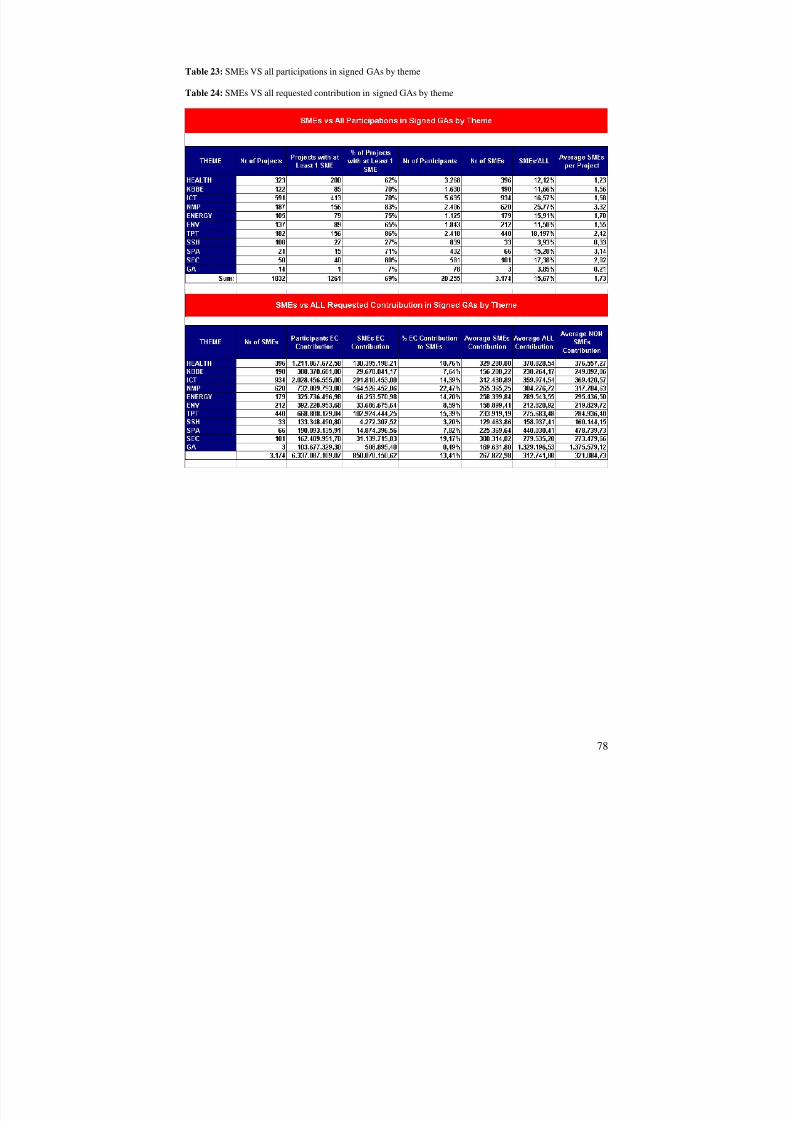
8/14/2019 SME 4th Progress report on SMEs participation in the 7th r&D Framework Programme
http://slidepdf.com/reader/full/sme-4th-progress-report-on-smes-participation-in-the-7th-rd-framework-programme 79/87
Table 23: SMEs VS all participations in signed GAs by theme
Table 24: SMEs VS all requested contribution in signed GAs by theme
78
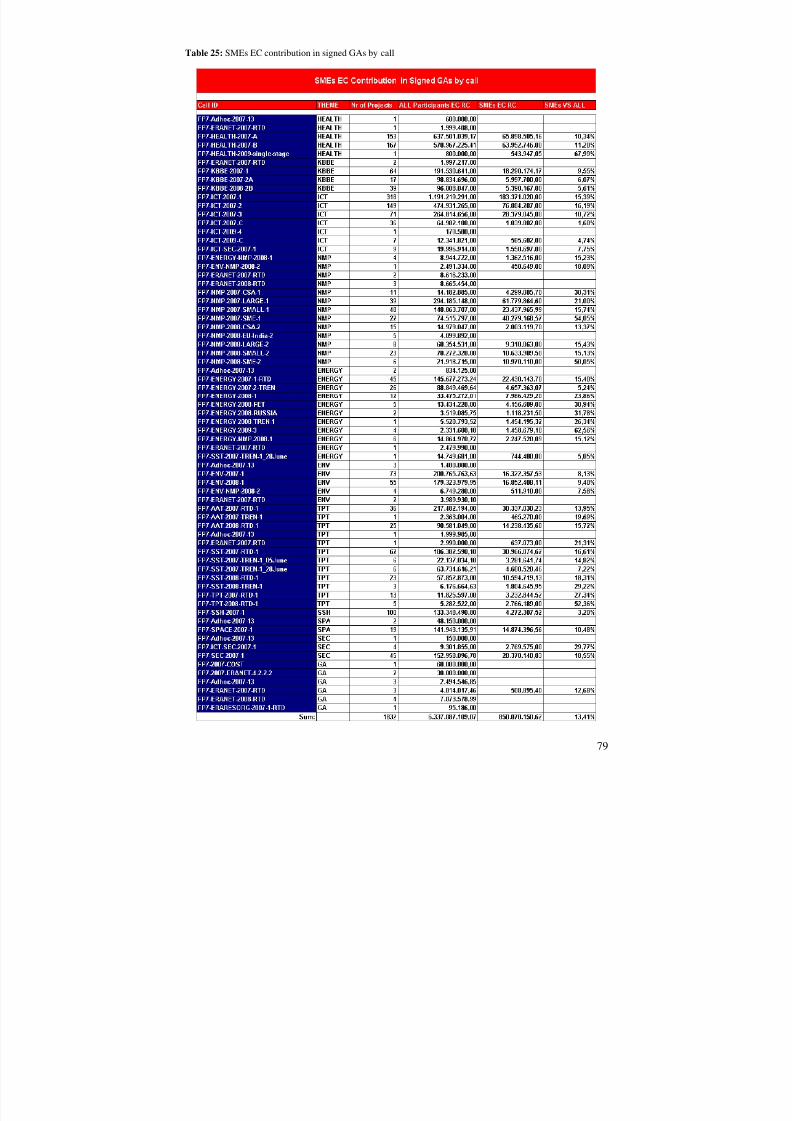
8/14/2019 SME 4th Progress report on SMEs participation in the 7th r&D Framework Programme
http://slidepdf.com/reader/full/sme-4th-progress-report-on-smes-participation-in-the-7th-rd-framework-programme 80/87
Table 25: SMEs EC contribution in signed GAs by call
79
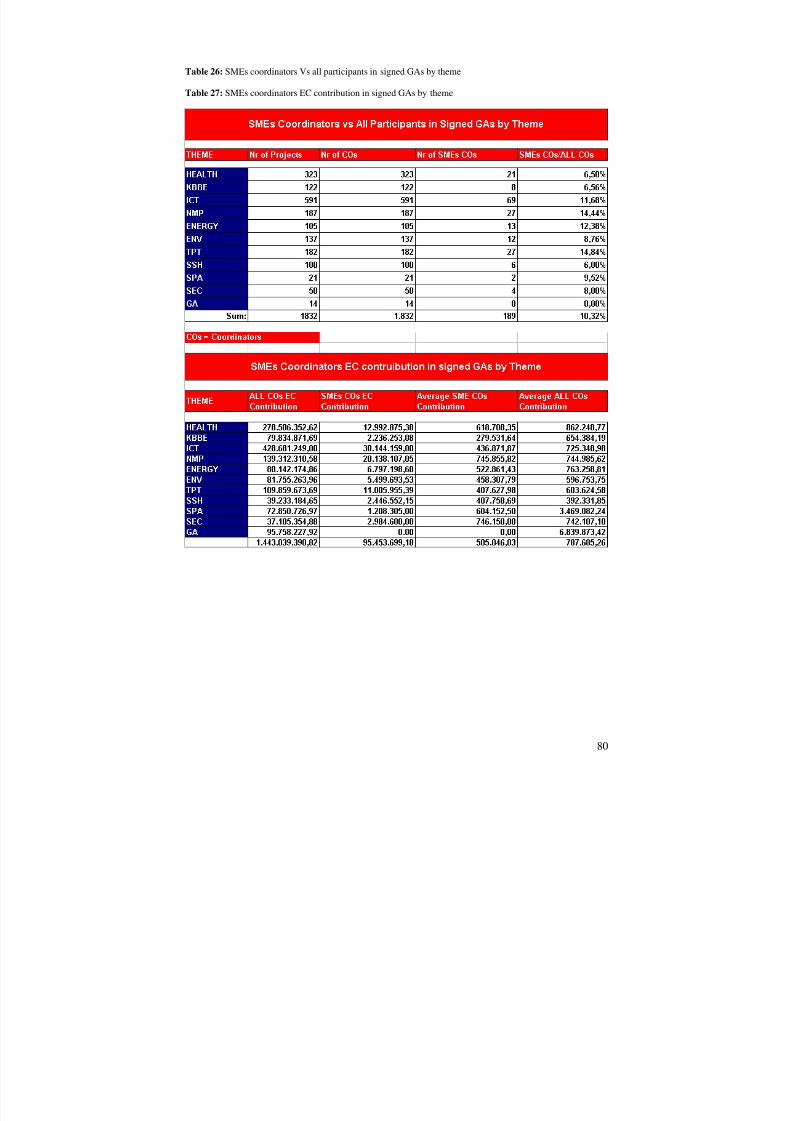
8/14/2019 SME 4th Progress report on SMEs participation in the 7th r&D Framework Programme
http://slidepdf.com/reader/full/sme-4th-progress-report-on-smes-participation-in-the-7th-rd-framework-programme 81/87
Table 26: SMEs coordinators Vs all participants in signed GAs by theme
Table 27: SMEs coordinators EC contribution in signed GAs by theme
80
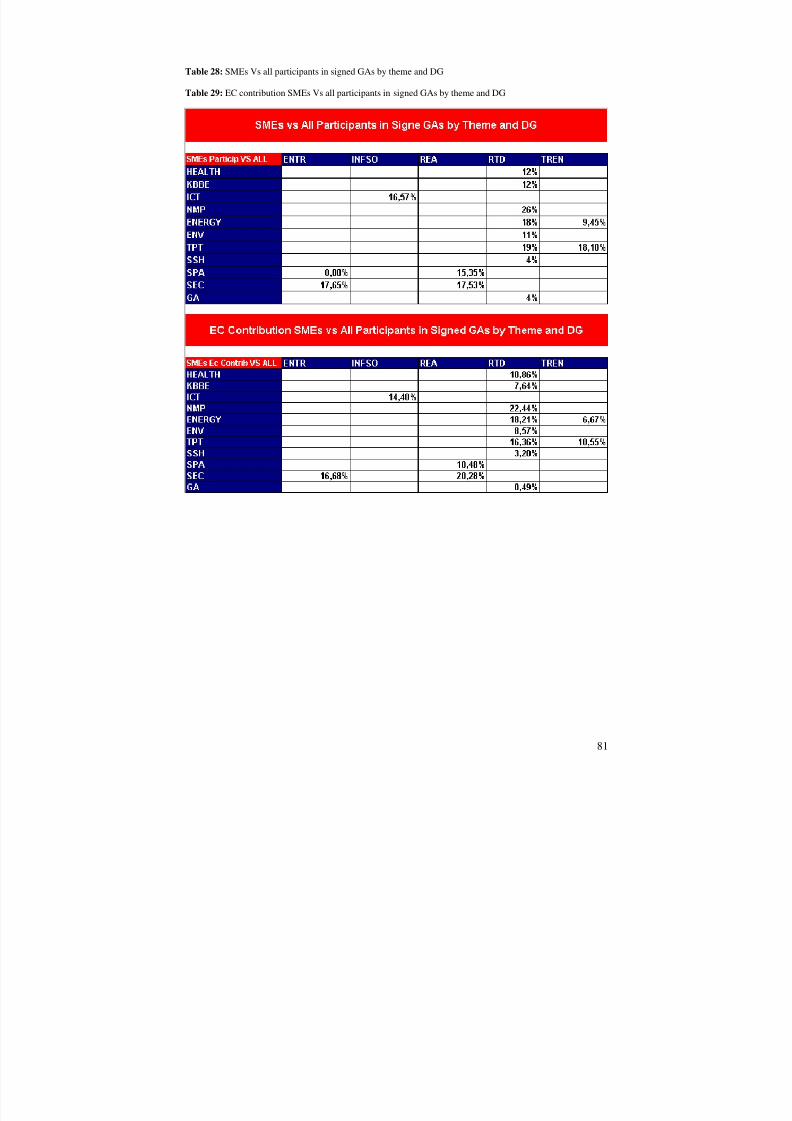
8/14/2019 SME 4th Progress report on SMEs participation in the 7th r&D Framework Programme
http://slidepdf.com/reader/full/sme-4th-progress-report-on-smes-participation-in-the-7th-rd-framework-programme 82/87
Table 28: SMEs Vs all participants in signed GAs by theme and DG
Table 29: EC contribution SMEs Vs all participants in signed GAs by theme and DG
81
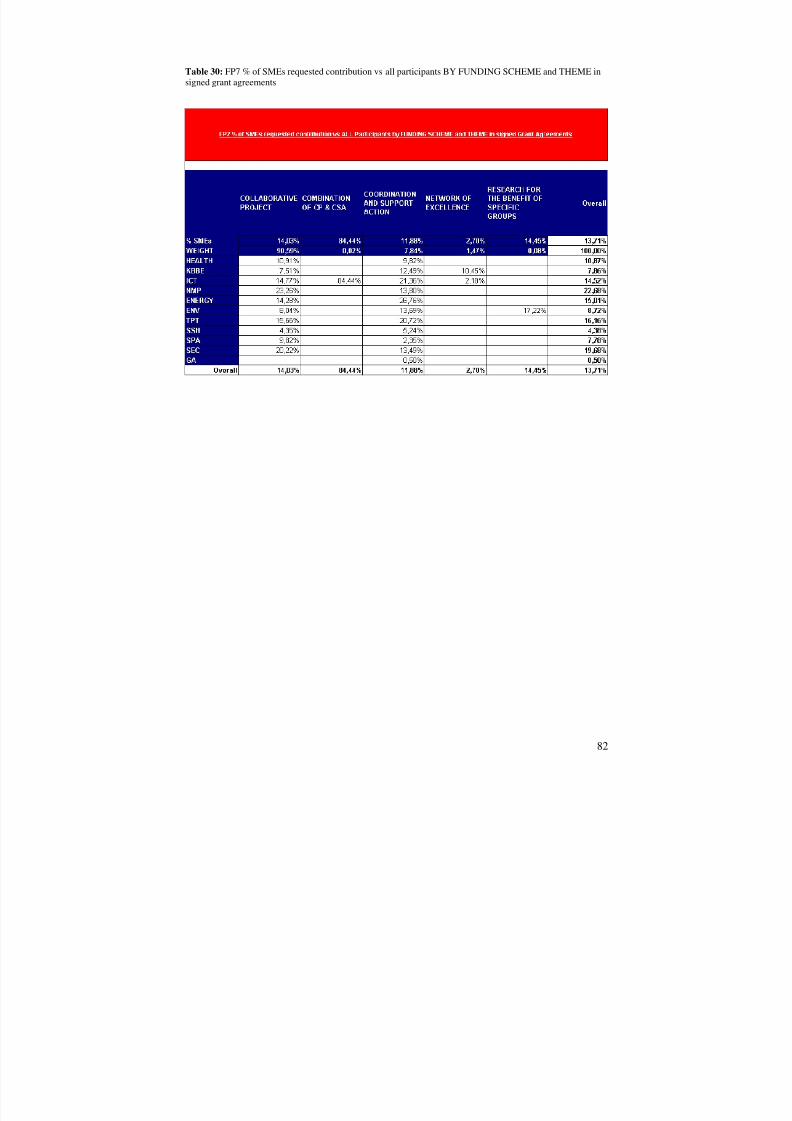
8/14/2019 SME 4th Progress report on SMEs participation in the 7th r&D Framework Programme
http://slidepdf.com/reader/full/sme-4th-progress-report-on-smes-participation-in-the-7th-rd-framework-programme 83/87
Table 30: FP7 % of SMEs requested contribution vs all participants BY FUNDING SCHEME and THEME insigned grant agreements
82
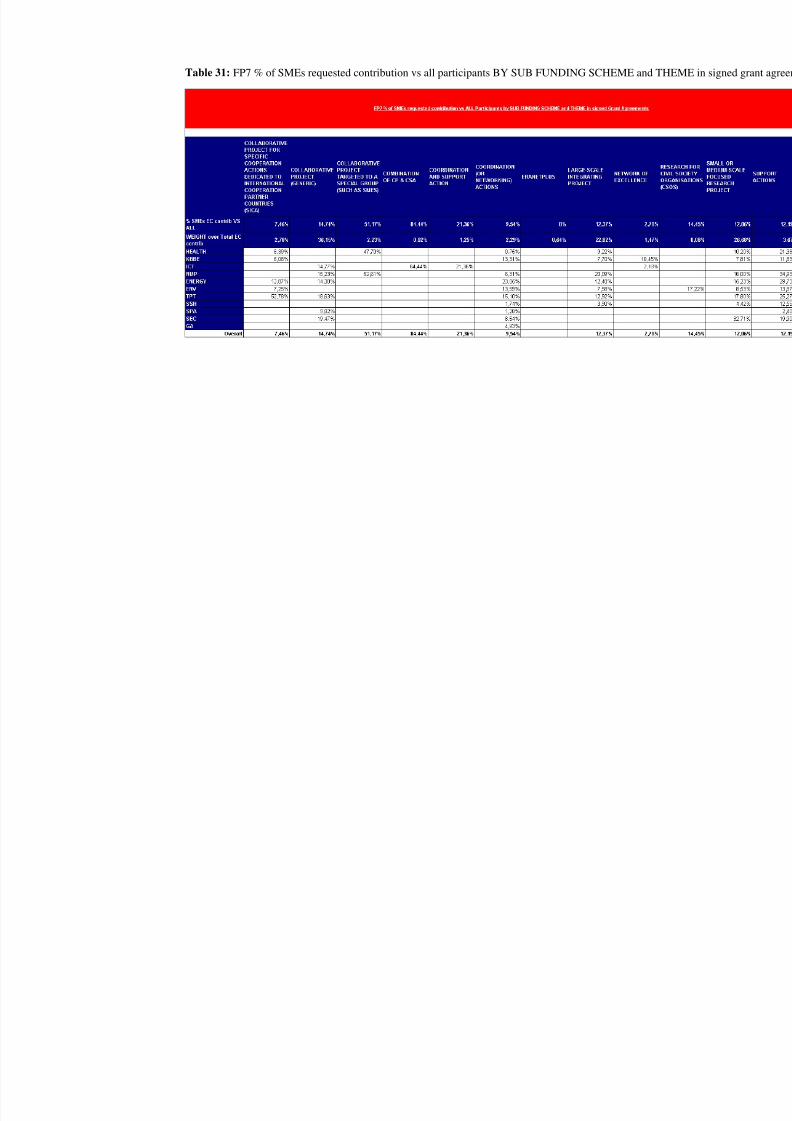
8/14/2019 SME 4th Progress report on SMEs participation in the 7th r&D Framework Programme
http://slidepdf.com/reader/full/sme-4th-progress-report-on-smes-participation-in-the-7th-rd-framework-programme 84/87
Table 31: FP7 % of SMEs requested contribution vs all participants BY SUB FUNDING SCHEME
8/14/2019 SME 4th Progress report on SMEs participation in the 7th r&D Framework Programme
http://slidepdf.com/reader/full/sme-4th-progress-report-on-smes-participation-in-the-7th-rd-framework-programme 85/87
8/14/2019 SME 4th Progress report on SMEs participation in the 7th r&D Framework Programme
http://slidepdf.com/reader/full/sme-4th-progress-report-on-smes-participation-in-the-7th-rd-framework-programme 86/87
Index of Graphs
Graph 1 : Percentage of the EU-contribution going to SMEs
Graph 2: Cooperation programme – proposals. Number of applicants: evolution per semester (cumulative)Graph 3: Cooperation programme: applications in proposals per theme – self-declared SMEs versus allapplications
Graph 4: Cooperation programme – requested EU contributions: for self-declared SME applications versusall apllications.
Graph 5: Success rates of proposals per theme (one out of X is mainlisted)Graph 6: Cooperation programme – mainlisted proposals. Number of applications per themeGraph 7: Cooperation programme – mainlisted proposals. Requested EU-contribution (in million Euro)Graph 8: Cooperation programme: % of requested EU contribution by SMEs in eligible and in mainlisted
proposalsGraph 9: Cooperation programme – grant agreements. Number of projects per theme – per 30 September
2009Graph 10: Cooperation programme – signed grant agreements. Number of participants per themeGraph 11: Requested EU contribution in grant agreements for participating SMEs versus other participantsGraph 12: Cooperation programme – signed grant agreements. Percentage of SME participations/ EC
contribution to SMEsGraph 13: Cooperation programme: percentage of SMEs participating in proposals and mainlistsGraph 14: Success rate of proposals broken down per number of SMEs involved per themeGraph 15: FP7-COOP - Success rate per number of SME applicants. Percentage of mainlisted proposals
versus evaluated proposals (with total number of mainlisted proposals in the category)Graph 16: Evolution of the EU funding in GAs for FP7-COOP until 30 September 2009Graph 17: Number of SME coordinatorsGraph 18: SMEs in FP7: economic activityGraph 19: Number of participants per project (GA)Graph 20: Evaluation success rate broken down per number of SMEs - HEALTHGraph 22: Participation per country (Member States and Associated Countries) - HEALTH Graph 23: Evaluation success rate broken down per number of SMEs - KBBEGraph 25: Participation per country (Member States and Associated Countries) – KBBE (a)Graph 26: Participation per country (Member States and Associated Countries) – KBBE (b) Graph 27: Evaluation success rate broken down per number of SMEs - ICTGraph 29: Participation per country (Member States and Associated Countries) – ICT (a)Graph 30: Participation per country (Member States and Associated Countries) – ICT (b)
Graph 31: Evaluation success rate broken down per number of SMEs - NMPGraph 33: Participation per country (Member States and Associated Countries) – NMP (a)Graph 34: Participation per country (Member States and Associated Countries) – NMP (b)Graph 35: Evaluation success rate broken down per number of SMEs - Energy ResearchGraph 37: Participation per country (Member States and Associated Countries) – Energy Research (a)Graph 38: Participation per country (Member States and Associated Countries) – Energy Research (b)Graph 39: Evaluation success rate broken down per number of SMEs - ENVGraph 41: Participation per country (Member States and Associated Countries) – ENV (a)Graph 42: Participation per country (Member States and Associated Countries) – ENV (b)Graph 43: Evaluation success rate broken down per number of SMEs - TPTGraph 45: Participation per country (Member States and Associated Countries) – TPT (a)Graph 46: Participation per country (Member States and Associated Countries) – TPT (b)Graph 47: Evaluation success rate broken down per number of SMEs - SSH
8/14/2019 SME 4th Progress report on SMEs participation in the 7th r&D Framework Programme
http://slidepdf.com/reader/full/sme-4th-progress-report-on-smes-participation-in-the-7th-rd-framework-programme 87/87
Graph 49: Participation per country (Member States and Associated Countries) – SSH (a)Graph 50: Participation per country (Member States and Associated Countries) – SSH (b)Graph 51: Evaluation success rate broken down per number of SMEs - SPAGraph 53: Participation per country (Member States and Associated Countries) – SPA (a)Graph 54: Participation per country (Member States and Associated Countries) – SPA (b)Graph 55: Evaluation success rate broken down per number of SMEs - SECGraph 57: Participation per country (Member States and Associated Countries) – SEC (a)Graph 58: Participation per country (Member States and Associated Countries) – SEC (b)Graph 59: Evaluation success rate broken down per number of SMEs - FP7-COOPGraph 61: Participation per country (Member States and Associated Countries) – FP7-COOP (a)Graph 62: Participation per country (Member States and Associated Countries) – FP7-COOP (b)Graph 64: Share of projects with SMEs involved in the proposal and project stages (KBBE)Graph 65: Average SME funding per call compared to average (KBBE)Graph 66: Share of SMEs according to their profiles summarised for the 3 calls (KBBE)
Index of Maps
Map 1 : Beneficiaries in signed contractsMap 2: EU Contribution in signed contractsMap 3: Project coordinators in signed contractsMap 4: Research for the benefit of SMEs – Beneficiaries in Signed ContractsMap 5 : Research for the benefit of SMEs - Coordinators in Signed Contracts