Embed Size (px)
Citation preview

Copyright © 2015 Splunk Inc.
Jeff Champagne, Splunk Kate Engel, Morgan Stanley
Smart Splunking

Who’s this dude?
2
Jeff [email protected] Architect
Splunk user since 2011Started with Splunk in Fall 2014
Former Splunk customer in the Financial Services Industry
Lived previous lives as a Systems Administrator, Engineer, and Architect

Who’s this gal?
3
Kate EngelAnalyst at Morgan Stanley
Started with Morgan Stanley in Summer 2014– Currently supporting the Splunk for Telecommunications globally
Former Splunk partner Professional Services ConsultantPhiladelphia Sports FanJ

Am I in the right place?
You should be…Familiar with SPL (Splunk Query Language)Comfortable creating visualizations and dashboardsNot afraid of a tiny bit of XMLA nice person
4

Agenda
Formatting your search results to fit your needsSearch & Viz. TicksLooking at Splunk’s internal dataQ&A
5

Make your data look as good as it feels

Scenario #1
7
You run a basic Splunk search to calculate average latency and end up with a value of 4.238765.
How do you turn this into something useful????

Solution #1 -‐ Round ‘em Up
8
| eval latency=round(latency,2).”ms”Store the output of this evalcommand into the latency field
Round the value of the existing latency field to two decimal places
Concatenate the output of the round function with the string value “ms”
4.238765 4.24ms
http://docs.splunk.com/Documentation/Splunk/6.2.5/SearchReference/CommonEvalFunctions#Mathematical_functions

Scenario #2
9
That’s great, but I actually need to format a big number.
Specifically, Count_of_hits=3458826

Solution #2 – Comma-‐tose
10
| eval Count_of_hits=tostring(Count_of_hits,”commas”).” hits”
Store the output of this evalcommand into the Count_of_hits field
Convert the value of the existing Count_of_hits field to a string and use commas formatting
Concatenate the output of the tostring function with the string value “ hits”
3458826 3,458,826 hits
http://docs.splunk.com/Documentation/Splunk/6.2.5/SearchReference/CommonEvalFunctions#Conversion_functions

Scenario #3
11
Cool story bro, but now my number columns don’t sort properly.
What the HECK!?

Solution #3 – Just for Looks
12
| fieldformat Count_of_hits=tostring(Count_of_hits,”commas”).” hits”
Instead of using eval, use the fieldformatcommand. It will change the appearance of the field without modifying the underlying value.
http://docs.splunk.com/Documentation/Splunk/latest/SearchReference/Fieldformat

Scenario #4
13
Your web server logs have these fields: UserName, Product, Value, Region, City, IPAddress.
How can you easily report how many products are being purchased per region?

Solution #4 – Stats+Eval to the Rescue!
14
index=my_index sourcetype=my_sourcetype| fields Region Product | stats count(eval(Region==“APAC”)) AS APAC count(eval(Region==“EMEA”)) AS EMEA count(eval(Region==“AMER”)) AS AMER by Product
Keep only the fields we need
http://docs.splunk.com/Documentation/Splunk/latest/SearchReference/Stats
Use stats to count the number of events where the Region field equals a specific value. Label those counts as APAC, EMEA, or AMER.
Group the regional counts by the values of the Product field

Scenario #5
15
You have a new tool to monitor activity on your website. You want to compare it’s logs with the
current tool’s logs but the field names are different…How can you easily create an apples to apples
search?

Solution #5 – Coalesce…
16
(sourcetype=“old_tool" OR sourcetype=“new_tool")(source_ip=* AND message=*) OR (ip=* AND messageType =*) =*)| eval Key1 = (source_ip + "_" + message) | eval Key2 = (ip + "_" + messageType) | eval KEY=coalesce(Key1,Key2)
Return the two fields in each sourcetype
http://docs.splunk.com/Documentation/Splunk/latest/SearchReference/Eval#9._Coalesce_a_field_from_two_di fferent_sour ce_types.2C_create_a_transaction_of_events
Create key fields for each sourcetype
Create a master key field to use for reporting.

Scenario #6
17
My month column contains string values (Jan, Feb, Mar, etc…)
How do I sort these chronologically instead of alphabetically?

Solution #6 – Let me count the days
18
index=myData| eval month_num=strftime(_time,"%m") | sort month_num
Store the output of this evalcommand into a new field called month_num
Take the epochtime value in the _time field and return the Month number
Sort by the numerical value of our new month_num field
http://docs.splunk.com/Documentation/Splunk/latest/SearchReference/CommonEvalFunctions#Date_and_Time_functions

Scenario #7
19
I have a table of items, how can I add line numbers?
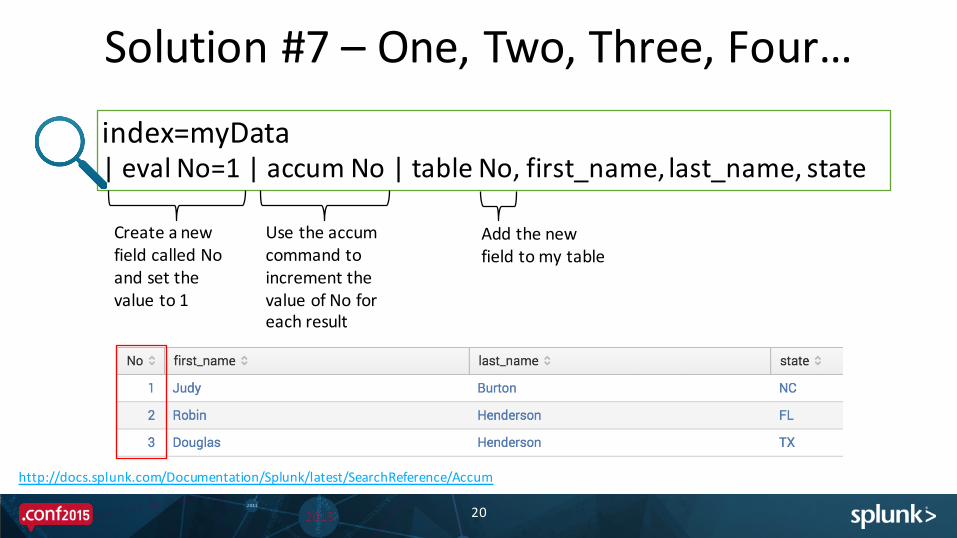
Solution #7 – One, Two, Three, Four…
20
index=myData| eval No=1 | accum No | table No, first_name, last_name, state
Create a new field called No and set the value to 1
Use the accumcommand to increment the value of No for each result
Add the new field to my table
http://docs.splunk.com/Documentation/Splunk/latest/SearchReference/Accum

Getting’ Tricky With It

Scenario #1
22
I need to join multiple sourcetypes by a common field
Solution #1 – Getting Values
23
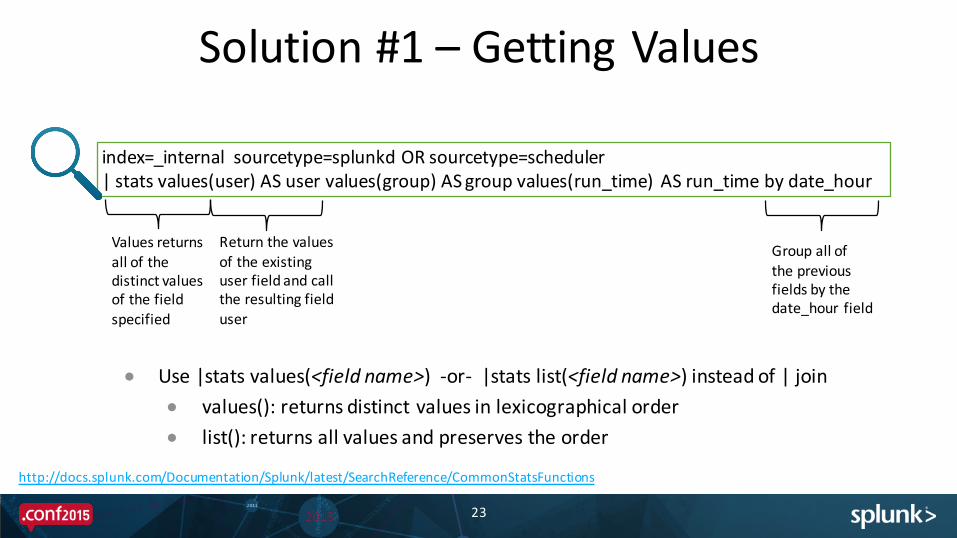
index=_internal sourcetype=splunkd OR sourcetype=scheduler | stats values(user) AS user values(group) AS group values(run_time) AS run_time by date_hour
Values returns all of the distinct values of the field specified
Return the values of the existing user field and call the resulting field user
Group all of the previous fields by the date_hour field
http://docs.splunk.com/Documentation/Splunk/latest/SearchReference/CommonStatsFunctions
● Use |stats values(<field name>) -‐or-‐ |stats list(<field name>) instead of | join● values(): returns distinct values in lexicographical order● list(): returns all values and preserves the order

Scenario #2
24
How can I email these sweet results to my coworker super fast?

Solution #2 – You’ve Got Mail
25
index=myData result_type=sweet| sendemail to=“[email protected]” subject=“Sweet Results” sendresults=true
Send your results out via the configured email provider
There are several parameters available, with the “to” parameter being required
http://docs.splunk.com/Documentation/Splunk/latest/SearchReference/Sendemail

Scenario #3
26
How can I plot firewall attacks on a map with bubbles the grow and change color based on the
# of attacks?

Solution #3 – Hack the Map
27
index=security sourcetype=firewall| iplocation clientip| where isnotnull(Country) | geostats count as PLOT | eval redCount=if(PLOT >= 500,PLOT,0) | eval yellowCount=if(PLOT >= 100 AND PLOT < 500,PLOT,0) | eval greenCount=if(PLOT < 100,PLOT,0)| fields -‐ PLOT
Lookup the location info for the IP
Create three new range fields for each location on the map.
Get rid of the PLOT field, we don’t want it on the map
Filter out results without a Country
Count the results and format for a map
| eval redCount=if(PLOT >= 500,PLOT,0)
Holds the count for red values at this map location
If the value of PLOT at this map location is greater than or equal to 500, then set the value of redCount at this map location to the value of PLOT. If it is less than 500, set redCount to 0, as the count at this location is not a value that should be red.

Solution #3 – Hack the Map
28
index=security sourcetype=firewall | iplocation clientip | where isnotnull(Country) | geostats count as PLOT | evalredCount=if(PLOT >= 500,PLOT,0) | eval yellowCount=if(PLOT >= 100 AND PLOT < 500,PLOT,0) | evalgreenCount=if(PLOT < 100,PLOT,0) | fields -‐ PLOT
To make the dots specific colors, you’ll need to add the following line to your dashboard panel XML:<option name="mapping.fieldColors">{"redCount":0x8f0017,"yellowCount":0xCCCC00, "greenCount":0x006700}</option>

Finding Beauty on the Inside

Scenario #1
30
How can I look at the volume of data my Universal Forwarders are sending?

Solution #1 – Turn up the Volume
31
index=_internal source=*metrics.log group=tcpin_connections| eval Forwarder=coalesce(sourceHost,hostname)| timechart limit=500 span=1d sum(kb) as DailyKB by Forwarder
Look at Splunk’s internal metrics logSet Forwarder value to sourceHost or hostnameTimechart the average daily KB by forwarder per day

Scenario #2
32
That looks good, but how can I compare today’s volume to last week?

Solution #2 – If I could turn back time
33
index=_internal source=*metrics.log group=tcpin_connections| eval Forwarder=coalesce(sourceHost,hostname)| bucket span=1d _time | stats sum(kb) AS DailyKB by Forwarder _time | stats earliest(DailyKB) AS EarliestVolume latest(DailyKB) AS LatestVolume by Forwarder | eval PercChange=round(((LatestVolume-‐EarliestVolume)/EarliestVolume)*100,2)
Look at Splunk’s internal metrics log
Sum the kb field grouped by Forwarder
Set Forwarder value to sourceHost or hostname
Bucket the results by day
Get the DailyKB value from last week and today for each Forwarder
Calculate the % change, round to two decimal places, and put the value in the PercChangefield
Search Time Range: 1 Week

Scenario #3
34
How can I quickly see details about the hosts, sourcetypes, and sources
in an index?

Solution #3 – That’s so META
35
| metadata type=sourcetypes index=MyIndex
The metadata command searches summary data instead of the raw events…so its really fast!
Specify the index and type of data you’d like to return. Splunks keeps summary information on the sources, sourcetypes, and hosts in every index.
http://docs.splunk.com/Documentation/Splunk/latest/SearchReference/Metadata

Scenario #4
36
What if I want to see detail about all of the sourcetypes in an index?

Solution #4– Sourcetype Detail
37
| metadata type=sourcetypes index=myIndex| eval current_time = now()| eval seconds_since_last_event=(current_time – lastTime)| convert ctime(lastTime) as LastTime| convert ctime(firstTime) as FirstTime| convert ctime(recentTime) as RecentTime| convert ctime(current_time) | eval hours_since_last_event= round(seconds_since_last_event/(60*60),3) | table sourcetype seconds_since_last_event hours_since_last_eventRecentTime FirstTime LastTime totalCount
Get the metadata for sourcetypesSet current_time to the current time
Format the time so we can read it
Convert seconds to hours
Create a table with the fields we want
Calculate the seconds since the last event
http://docs.splunk.com/Documentation/Splunk/latest/SearchReference/Metadata

Scenario #5
38
Nice! What if I wanted to determine if there is a delay
indexing events from my hosts?

Solution #5– Keep up the pace
39
| metadata type=hosts | eval seconds_lag=(recentTime -‐ lastTime)| convert ctime(lastTime) as LastTime| convert ctime(firstTime) as FirstTime| convert ctime(recentTime) as IndexTime| rangemap field=seconds_lag low=0-‐1800 elevated=1801-‐3600| fields host,FirstTime,LastTime,IndexTime,seconds_lag,range
Get the metadata for hostsCalculate the difference between the timestamp on the latest event and the time it was indexedFormat the time so we can read it
Assign a severity based on the lag
Filter down to the fields we want
http://docs.splunk.com/Documentation/Splunk/latest/SearchReference/Metadata

Scenario #6
40
How can I get a list of all indexes?

Solution #6 – Take a REST
41
| rest /services/data/indexes | search eai:acl.app=my_app title=*| stats sum(totalEventCount) AS totalEventCount by title
Query the indexes REST endpointLimit to the app context my_app and return all indexesCalculate the total event count per index
http://docs.splunk.com/Documentation/Splunk/latest/SearchReference/Rest

Scenario #6
42
Awesome!Can I see anything else cool?

Solution #6 – Take a REST
43
|rest /services/data/lookup-‐table-‐files |search eai:acl.app=fantastic_lookups* |dedup title | rename title as LookupTable |table LookupTable
Query the lookups REST endpoint
Limit to my app context
Dedup the list and create a table
Lookup Tables:
| rest /servicesNS/-‐/-‐/data/ui/views | search eai:acl.app=my_awesomeApp| table title
Query the views REST endpoint
Limit to my app context
Create a table
Dashboards:
http://docs.splunk.com/Documentation/Splunk/6.2.5/SearchReference/Rest

Resources
44
Search Command Referencehttp://docs.splunk.com/Documentation/Splunk/latest/SearchReference
Splunk Answershttp://answers.splunk.com/
Smart Answers Blog – Patrick Pablo, Community Content Managerhttp://blogs.splunk.com/2014/11/24/smart-‐answers
Splunk Book – Exploring Splunkhttp://www.splunk.com/goto/book

What Now?
45
Related breakout sessions and activities…
Today4:15 -‐ Beyond the Lookup Glass – Room 3205:15 – Search Efficiency Optimization – Room 320
Tomorrow10:00 & 5:15 – Getting Started with Maps – Room 31811:15 – Building Powerful Analytics with Ease – Room 1133:15 – Search Efficiency Optimization – Room 3184:15 – SPLing Bee – Community Theatre Marquee Ballroom

THANK YOU