Embed Size (px)
Citation preview
Kim Verup, John Morten Klingsheim, Simen Slotta, Weixiao Yang
MTM – Master of Technology Management with specialization in Geoinformatics and Geoinformation Management
4. semester, 2013
Aalborg University
Smartphone PPGIS
for Oil Spill Information Exchange

Title: Smartphone PPGIS for Oil Spill Information Exchange
Education: MTM – Master in Geoinformation Management
Theme: Smartphone PPGIS web app for oil spill information exchange; Prototype development
Project period: 5.September 2013 - 9. January 2014
Project team:
MTM group 3
Attendees:
……………………………………………..
Kim Verup
……………………………………………..
Simen Slotta
John Morten Klingsheim
……………………………………………..
Weixiao Yang
Counsellors: Supervisor: Henning Sten Hansen Secondary supervisor: Lise Schrøder Synopsis:
Educational organisation: Department of Development and Planning Aalborg University A.C. Meyers Vænge 15 2450 København SV 9. January 2014 Report information: Edition: 10 Number of pages: 136 Enclosures: 5 appendices
A functional prototype of a smartphone web app is developed to promote oil spill information exchange with citizens. Based on a client-server system design, the prototype is developed on open source platform by integrating state-of-art geographic information technologies, like HTML5, PostGIS, jQuery and Leaflet. The prototype enables user reporting of oil spill observation as well as capturing of image and geolocation. Use cases and user stories together with personas are used for system design and interactive testing. The agile framework Scrum is applied as development methodology. Opportunities and challenges regarding both technologies and organizational issues are discussed during the development. The major contribution of this project is the demonstration of the potential of smartphone PPGIS for information exchange and citizen’s reports as decision support for authorities during large oil spill clean-up operations.

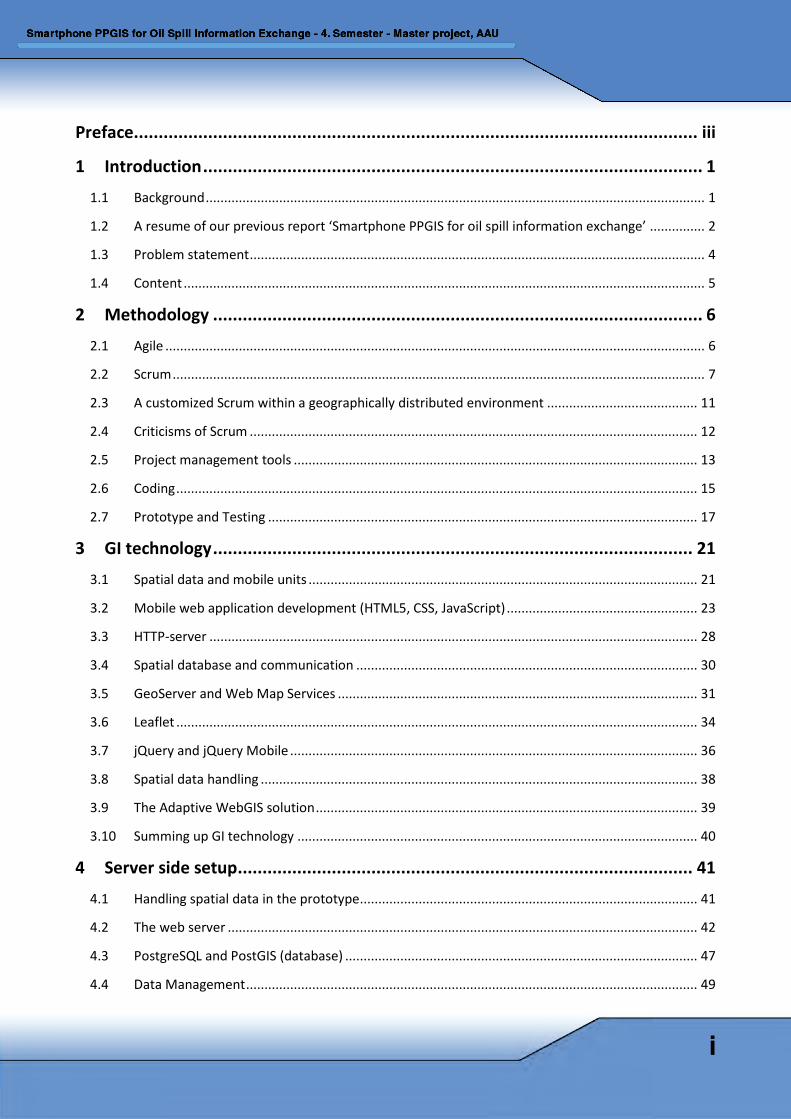
Preface .................................................................................................................. iii
1 Introduction ..................................................................................................... 1
1.1 Background ........................................................................................................................................ 1
1.2 A resume of our previous report ‘Smartphone PPGIS for oil spill information exchange’ ............... 2
1.3 Problem statement ............................................................................................................................ 4
1.4 Content .............................................................................................................................................. 5
2 Methodology ................................................................................................... 6
2.1 Agile ................................................................................................................................................... 6
2.2 Scrum ................................................................................................................................................. 7
2.3 A customized Scrum within a geographically distributed environment ......................................... 11
2.4 Criticisms of Scrum .......................................................................................................................... 12
2.5 Project management tools .............................................................................................................. 13
2.6 Coding .............................................................................................................................................. 15
2.7 Prototype and Testing ..................................................................................................................... 17
3 GI technology ................................................................................................. 21
3.1 Spatial data and mobile units .......................................................................................................... 21
3.2 Mobile web application development (HTML5, CSS, JavaScript) .................................................... 23
3.3 HTTP-server ..................................................................................................................................... 28
3.4 Spatial database and communication ............................................................................................. 30
3.5 GeoServer and Web Map Services .................................................................................................. 31
3.6 Leaflet .............................................................................................................................................. 34
3.7 jQuery and jQuery Mobile ............................................................................................................... 36
3.8 Spatial data handling ....................................................................................................................... 38
3.9 The Adaptive WebGIS solution ........................................................................................................ 39
3.10 Summing up GI technology ............................................................................................................. 40
4 Server side setup ............................................................................................ 41
4.1 Handling spatial data in the prototype ............................................................................................ 41
4.2 The web server ................................................................................................................................ 42
4.3 PostgreSQL and PostGIS (database) ................................................................................................ 47
4.4 Data Management ........................................................................................................................... 49
i
4.5 GeoServer ........................................................................................................................................ 54
5 The smartphone application .......................................................................... 61
5.1 Basic setup ....................................................................................................................................... 61
5.2 The start page .................................................................................................................................. 67
5.3 The report oil spill page ................................................................................................................... 70
5.4 The map page .................................................................................................................................. 82
5.5 Map solution for NCA’ verification of oil spill reports ..................................................................... 95
6 Organisational implementation and distribution requirements ..................... 99
6.1 Organisational implementation ....................................................................................................... 99
6.2 Integration with existing information systems .............................................................................. 102
6.3 Distribution of the smartphone PPGIS application ....................................................................... 105
6.4 A SWOT analysis and a business model canvas ............................................................................. 107
7 Discussion .................................................................................................... 111
7.1 Critical functionality....................................................................................................................... 111
7.2 Leaflet and jQuery as major parts of the system .......................................................................... 114
7.3 Recommendations for organisational implementations and further development ..................... 119
7.4 Scrum for the project management .............................................................................................. 121
8 Conclusions .................................................................................................. 124
9 Proposals for further work ........................................................................... 126
10 Abbreviations .............................................................................................. 128
11 References ................................................................................................... 130
11.1 Literature: ...................................................................................................................................... 130
11.2 Webpages: ..................................................................................................................................... 133
11.3 Presentations and personal communication ................................................................................. 136
12 Appendices ................................................................................................. A - 1
ii
Preface This report was written at fourth semester of the Master of Technology Management education in Geoinformation Management at the University of Aalborg. Through the last four months a full functioning prototype of a smartphone PPGIS is developed with this report as documentation. The prototype is for oil spill information exchange between the government and citizens during oil spill clean-up operations after major accidents at sea. To understand the environmental, social and economical consequences of major oil spills, and how oil spill clean-up operations are handled, we recommend a movie published on Youtube that presents the oil spill clean-up operation after the Full City accident at Såstein southwest of Langesund 31st July 2009 - Link.
The project group participants are involved daily in geographic information systems. In addition, we are engaged in the environmental and social consequences we have seen to be the result of the major oil spill accidents that have occurred in recent years, both in Scandinavia and worldwide.
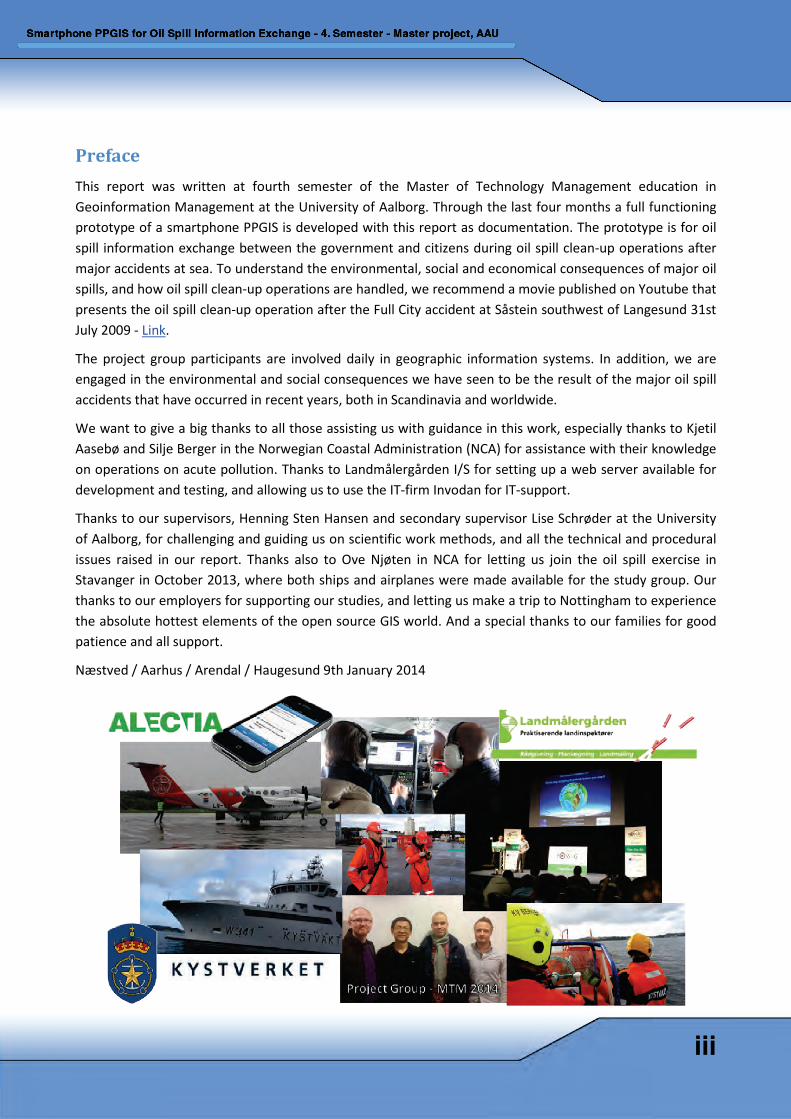
We want to give a big thanks to all those assisting us with guidance in this work, especially thanks to Kjetil Aasebø and Silje Berger in the Norwegian Coastal Administration (NCA) for assistance with their knowledge on operations on acute pollution. Thanks to Landmålergården I/S for setting up a web server available for development and testing, and allowing us to use the IT-firm Invodan for IT-support.
Thanks to our supervisors, Henning Sten Hansen and secondary supervisor Lise Schrøder at the University of Aalborg, for challenging and guiding us on scientific work methods, and all the technical and procedural issues raised in our report. Thanks also to Ove Njøten in NCA for letting us join the oil spill exercise in Stavanger in October 2013, where both ships and airplanes were made available for the study group. Our thanks to our employers for supporting our studies, and letting us make a trip to Nottingham to experience the absolute hottest elements of the open source GIS world. And a special thanks to our families for good patience and all support.
Næstved / Aarhus / Arendal / Haugesund 9th January 2014
iii
iv
1 Introduction Based on interest from the Norwegian Coastal Administration (NCA), this report is presenting technical development of a smartphone PPGIS (Public Participation Geographical Information System) application supporting information exchange between responsible authorities and citizens during large oil spill clean-up operations.
1.1 Background Four major ship accidents have happened in Norwegian coastal waters the last decade causing major oil spills: the “Rocknes” in 2004, the “Server” in 2007, the “Full City” in 2009 and the “Godafoss” in 2011, all causing large clean-up operations (Boitsov, Klungsøyr & Dolva 2013).
“Full City” grounded 31 July 2009 at Såstein southwest of Langesund. 293 tonnes of heavy oil leaked out and 75 km of coastline were polluted, spread on approximately 200 locations in the archipelago southwest and east of Langesund. The initial clean-up operation lasted until November 2009, with final clean-up spring/summer 2010. 16 vessels were assisting the clean-up operation, including assistance from the Swedish coastguard, and approximately 1000 volunteers participated together with the standard available oil spill response groups1.
The four major accidents in Norwegian coastal waters all caused high attention and engagement among local citizens. A public engagement is caused by both environmental and economic consequences. Large oil spills can especially cause deaths of seabirds and sea mammals, and economical losses for coastal businesses, as reviewed after the grounding of “Full City” (Boitsov, Klungsøyr & Dolva 2013). Each incident however, is unique in terms of environmental impacts. The grounding of “Full City” caused a clean-up operation costing more than 234 million Norwegian kroner (PricewaterhouseCoopers 2010), plus the environmental and economic damages.
NCA is responsible for the national oil spill response in Norway, and have established routines for involving volunteers in clean-up operations. Our report on citizen’s involvement during coastal oil spills ‘PPGIS - Borgerinddragelse ved olieforurening’ (Verup et al. 2013a) documented a requirement for a better information exchange between NCA and the general public, especially when oil spills contaminate large coastal areas. The survey pinpointed several requirements and issues that should be focused when a national oil spill actor as NCA consider to increase the involvement of the general public. In brief the study documented that the vast majority of the citizens want to contribute with information and oil spill reports during an oil spill situation, if they had an appropriate tool available. A map-based smartphone application was found to be the most ideal tool, and interviews with the oil spill actors showed that public reports benefitting an oil spill clean-up operation, should include picture, geolocation and some short descriptions.
PPGIS has become a general term to include modern GIS applications to assist public participation in governmental issues. A limited level of involvement is however found as best practice, as the oil spill
1 The Norwegian governmental preparedness against oil pollution consists of a response unit in the NCA, and regional Intermunicipality response units (IUA).
1
emergency response mainly is based on professional decisions. Citizen involvement should therefore include ‘public participation in defining interests, actors and determining agenda’, referred to as Tokenism in Arnstein’s Ladder of Participatory level (Hansen & Prosperi 2006). Several successful examples of crowd sourcing as source for spatial information and the adoption of the EU INSPIRE-directive establishing common spatial data standards (Hansen et al. 2011) are also factors settling good grounds for a smartphone PPGIS.
The findings from our first study (Verup et al. 2013a) combined with continued interests from the NCA, led to our follow-up study – ‘Smartphone PPGIS for oil spill information exchange’ (Verup et al. 2013b) that focused more on the details regarding technical framework for smartphone application development, development methodology and organisational implementation issues. This study’s conclusions form the backbone for this report, and a resume is given below.
1.2 A resume of our previous report ‘Smartphone PPGIS for oil spill information exchange’
The aim of our previous report ‘Smartphone PPGIS for oil spill information exchange’ (Verup et al. 2013b) was primarily to establish increased knowledge and to reach conclusions about preferred process for software development and appropriate GI (Geographical Information) technologies for building a platform independent PPGIS smartphone application. In addition, existing procedures and routines in NCA’s oil spill emergency response was analyzed to identify potential challenges regarding implementation of a smartphone PPGIS tool in their organisation.
Seven use cases were developed to structure and refine the user requirements identified in our first study Verup et al. (2013a):
- A citizen residing coastal areas should be able to send oil spill reports including pictures and geolocation from the GPS to NCA, using a smartphone (use case 1).
- A citizen should be able to set geolocation to the oil spill reports also by navigating in a map on the smartphone (use case 2).
- A citizen should be able to check his oil spill reports, and eventually change, delete or update previous reports (use case 3).
- A citizen should be able to update on oil spill situation and prognoses with his smartphone on site when he or she are present at the contaminated site. He should also have access to an updated status of the present oil spill clean-up operation (use case 4).
- A citizen should be able to report bird or sea mammal observations (birds and sea mammals without oil spill) to NCA to increase awareness of environmental risk in an oil spill situation (use case 5).
- NCA should have access to verify and update oil spill reports given by citizens (use case 6).
- NCA’s personnel should also be able to send oil spill reports in an efficient way to the database with oil spill reports (use case 7).
2
While five use cases are related to citizens’ contributions or information receiving in an ongoing operation, the study also documented a clear need for NCA to validate the oil spill reports. Confirming and eventually classifying the reports to ensure proper use of the information during NCA’s oil spill emergency operations was found most important. Secondly, the validation process should also include a feedback from NCA to the reporters. To ensure a high level of quality, and a uniform management of the reported data, development of proper documentation of needed routines for handling the information flow, and seeing this as a necessary part of the system implementation within NCA was also found important. The study also identified that validation routines should be implemented within NCA’s Centre for Emergency Preparedness in Horten. Three units; ‘Operation unit’, ‘Function Leader Communication’ and the Operation Leader’s ‘ICT-staff’, should be considered to have a role in the management of the application.
Our technology review including development of a low-level application prototype used both open source and ESRI components. The result showed that the technical requirements of a smartphone PPGIS application ideally should be solved out within the framework of a HTML5 (HyperText Markup Language version 5) based web-app2, to ensure cross platform compatibility. The study showed that both open source and ESRI were capable as development platforms. The open source environment, however, were found most suitable because of the rich access to code examples on user forums, free components etc. The use of free open source components is also an aspect regarding the possibilities to demonstrate a development that does not require big investments in basic GI-infrastructure for realising a solution (which will be the case with an ESRI-based solution).
As proposal for further development a pure web-app concept was found very interesting. The study showed that the open source solutions utilize HTML5, CSS (Cascading Style Sheets) and JavaScript which together can build up applications with access to equipment on the smartphone, especially the GPS, the camera and local storage. Open source components like these are key elements to build up a web-app based smartphone application, serving out the defined user requirements. In addition to the above technologies, the Leaflet JS and jQuery Mobile were found to be promising JavaScript libraries to fulfil a front-end development with high usability potential. PostgreSQL with PostGIS extension and Geoserver were found to be the most appropriate component to use as database and map server, respectively.
HTML5 opens many doors we did not have access to in previous versions of HTML. Some of the HTML5 related API’s, e.g. ‘Web Storage’, ‘Device Orientation’ etc., is in a premature phase in that they are in a so-called ‘working draft’ or ‘candidate recommendation’ stage regarding becoming W3C recommendations (Taft 2011). This means that these APIs were not broadly adopted and implemented by the different developers of operating systems (OS) and browser solutions, which therefore provides a degree of uncertainty about their real capabilities, at that particular time. It will, however, even after approval to a ‘W3C Recommendation’, still be a variation in e.g. browser and OS support. This uncertainty will, however, be reduced after formal approvals, and future support should be the rule rather than the exception. Because of this variation in the HTML5 APIs taxonomy and degree of adoption, further testing of their possibilities were found to be necessary parts for study and prototype development. This challenge is taken as the case for our master project in our 4th semester.
2 Web-app: Mobile app written with web technologies as HTML5, CSS3 JavaScript etc., runs on a web server and viewable on multiple devices without platform specific adaptations (Capaxglobal 2013).
3
Regarding methods and framework for effective system development, we found that an agile approach, in combination with use cases, Personas and mock-up’s (low level prototypes) to conceptualize the user requirements of the smartphone PPGIS application, was very effective. Any further development should definitively have a strong agile profile, where changes in user- and system requirements caused by test results, continuously could be brought directly into the next loop of development.
1.3 Problem statement In our previous report, which we just have given a summary of, we demonstrate that today’s open source GI-technology for smartphones opens up appealing possibilities to improve the information exchange between the NCA, responsible for oil spill clean-up, and citizens affected by the oil spill threatening their coast. In addition to provide NCA with a useful decision- and information support tool, a smartphone application, using GI-technology for information exchange, would also be an excellent example of the concept PPGIS – facilitating public involvement in governmental matters, in this case the oil spill response.
A realisation of a PPGIS tool should ideally take place within a framework that provides a platform-independent solution in order to involve all citizens, regardless what type of smartphone they use. With this as a backbone for our further work and master thesis, as this project is about, the problem statement we address is:
‘How can we apply a web-app framework to develop a functional prototype demonstrating the potential of a smartphone PPGIS for decision support and information exchange between responsible authorities and citizens during large oil spill clean-up operations, and use this as basis for an implementation recommendation?’
The term ‘large oil spill’ here means oil spill situations taken over by national authorities (NCA) because of high potential of environmental damages, extensive need of resources and response management. Furthermore, based on conclusions from our previous report regarding appropriate and promising web-app development components (Verup et al. 2013b), we choose the JavaScript libraries Leaflet and jQuery as basis for the front-end, and PostgreSQL PostGIS and GeoServer as basis for the back-end development. Regarding development methodology, we choose the strong agile framework Scrum as backbone for our project management.
To achieve an answer to the problem statement within the frame of above assumptions, we have pinpointed four major questions:
- How can we handle critical functionality regarding client-server communication, including camera and GPS, within the chosen framework?
- How can Leaflet and jQuery be utilized for development of good user interfaces which encourages citizen involvement, including a good map view?
- Can we recommend the chosen GI technology components for further development and organisational implementation for responsible authorities?
- How can we handle the teamwork following Scrum within a geographically distributed environment?
4
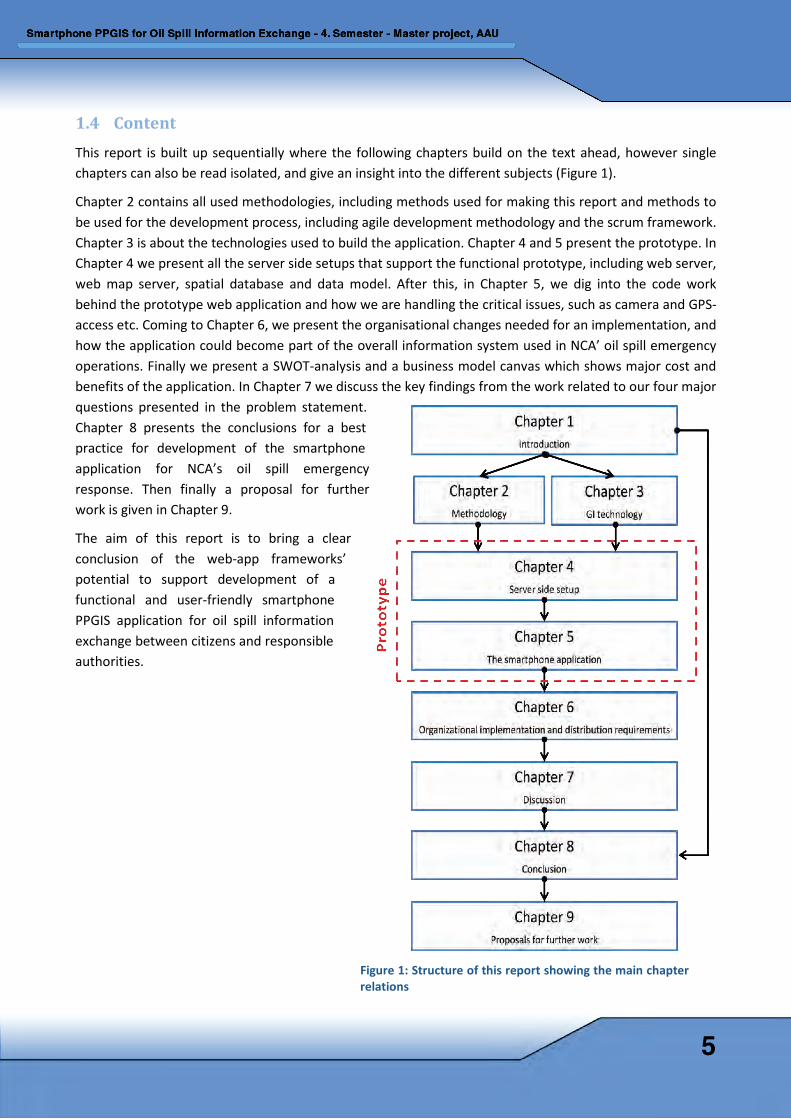
1.4 Content This report is built up sequentially where the following chapters build on the text ahead, however single chapters can also be read isolated, and give an insight into the different subjects (Figure 1).
Chapter 2 contains all used methodologies, including methods used for making this report and methods to be used for the development process, including agile development methodology and the scrum framework. Chapter 3 is about the technologies used to build the application. Chapter 4 and 5 present the prototype. In Chapter 4 we present all the server side setups that support the functional prototype, including web server, web map server, spatial database and data model. After this, in Chapter 5, we dig into the code work behind the prototype web application and how we are handling the critical issues, such as camera and GPS-access etc. Coming to Chapter 6, we present the organisational changes needed for an implementation, and how the application could become part of the overall information system used in NCA’ oil spill emergency operations. Finally we present a SWOT-analysis and a business model canvas which shows major cost and benefits of the application. In Chapter 7 we discuss the key findings from the work related to our four major questions presented in the problem statement. Chapter 8 presents the conclusions for a best practice for development of the smartphone application for NCA’s oil spill emergency response. Then finally a proposal for further work is given in Chapter 9.
The aim of this report is to bring a clear conclusion of the web-app frameworks’ potential to support development of a functional and user-friendly smartphone PPGIS application for oil spill information exchange between citizens and responsible authorities.
Figure 1: Structure of this report showing the main chapter relations
5
2 Methodology In this project we deal with four major problems. Shortly mentioned; how one can handle the teamwork following Scrum in a geographic distributed environment, how critical functionality within the chosen technical framework can be handle, how the technical framework can be utilized for development of a good user interface, and at last, will the chosen GI Technology components be recommended for further development and organisational implementation. All issues are directly relevant to software development, which makes an agile approach to our task highly relevant. Agile as the general methodology approach to our project management and Scrum as the framework for our technical development have therefore been chosen. This chapter also present our chosen way of coding for a smartphone application, and how testing is a major part of our human centred system design.
2.1 Agile The Agile methodology is primarily used in software engineering development, but it has also been seen in other types of projects. Agile has over the past few years had a success, and therefore more and more project leaders stick to it. The method was constructed as a response to the traditional project methods, which normally is slower, more comprehensive and often contains a lot of documentation and planning like larger IT (Information Technology) projects (Benyon 2010). The method is considered to be formally established in 2001, where 17 software developers were gathered to discuss lightweight development methods. The result was the ‘Manifesto for Agile Software Development’ that described the basic agile methodology and its values (Fowler and Highsmith 2001):
• Individuals and interactions over processes and tools
• Working software over comprehensive documentation
• Customer collaboration over contract negotiation
• Responding to change over following a plan
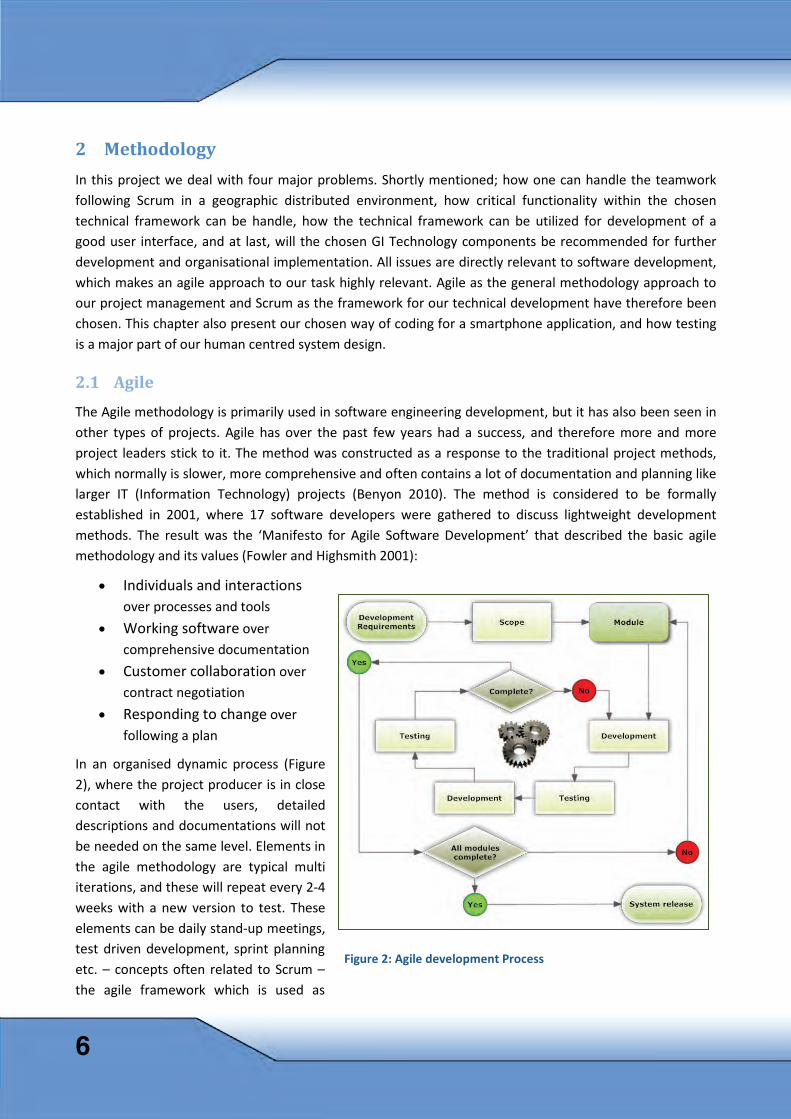
In an organised dynamic process (Figure 2), where the project producer is in close contact with the users, detailed descriptions and documentations will not be needed on the same level. Elements in the agile methodology are typical multi iterations, and these will repeat every 2-4 weeks with a new version to test. These elements can be daily stand-up meetings, test driven development, sprint planning etc. – concepts often related to Scrum – the agile framework which is used as
Figure 2: Agile development Process
6
basic for the development process documented in this report, and described in detail in the next chapter.
2.2 Scrum Basic ideas of the agile framework called Scrum, originates from Takeuchi and Nonaka’s (1986) article ‘The New New Product Development Game’, which presented study results of some industries changing approach to product development in the mid eighties. Scrum was, however, formally developed as a project framework by Jeff Sutherland and Ken Schwaber in 1995, and is today by far the most used agile framework in software development. Scrum is used as an essential framework for this project, and it is therefore given a detailed description. Schwaber and Sutherland (2013) are used as source for this chapter, unless other references are mentioned.
2.2.1 Why Scrum?
The method has grown in recognition that traditional waterfall methods rarely produce the desired result, neither regarding timeliness, flexibility and accuracy. According to studies, software development still struggling with budget overruns delays and poor quality. However, the findings suggest that agile development methodologies can help reduce overruns, partly because it is through such methods amenities cooperation between customer and supplier take place. By building up the developer’s ownership of the finished product, continuous reconciliation of progress, close cooperation with the client and not least through call for changes along the way, the Scrum framework facilitate good production and customer satisfaction. The Scrum achieve as well as adaptability to customer also firm and fast delivery cycles with high quality. The main idea behind Scrum is that complex processes such as the development of software, is best handled by an empirical approach, which require transparency, inspection and customization.
Transparency means that the factors that control the outcome of the process must be visible to those who govern the process. The various part of an empirical process must be inspected frequently enough so that unacceptably large variance is captured whereupon adjustment and customization can take place as soon as possible.
2.2.2 The Scrum team The Scrum team consist of three roles, namely product owner, development team, and a Scrum master – all with distinct defined responsibilities. The product owner The product owner is responsible for representing all stakeholders of the project and the finished product. The product owner provides funding and support to the project by creating project's overall requirements, return-on-investment goals and general release plans. The product owner is the sole person responsible for managing the product backlog. Product backlog management includes clearly expressing product backlog items and orders them to achieve goals and mission, ensuring that the product backlog is visible, transparent and clear to all so the development team clearly knows what to work with. It is critical that the product owner is committed and provide feedback on the team members producing. Product owner should also attend sprint demos and testing new product features as they are completed.
7
The development team The development team is responsible for developing functionality, and they are characterized by the fact that they are self-organising and cross-functional, with all necessary skills. There are no titles for the team members other than developer, and there are no sub-teams. Optimal team size is small enough to remain nimble and large enough to complete significant work within a sprint. Fewer than three members decrease interaction and results in smaller productivity gains. Small teams may also encounter skill constraints, causing them unable to deliver a potentially releasable increment. Large teams (more than 9 members) require too much coordination, and generate too much complexity for an empirical process to manage. The Scrum master The Scrum master is responsible for ensuring Scrum is understood and that the Scrum team adheres to Scrum theory, practices and rules. The Scrum master is a servant-leader for the Scrum team, and helps those outside the Scrum team understand which of their interactions with the Scrum team are helpful or which are not. The Scrum master helps everyone change these interactions to maximize the value created by the Scrum team. The Scrum master serves the product owner by finding techniques for effective product backlog management, understand empirical product planning, ensuring the product owner knows how to arrange the product backlog to maximize value and facilitating Scrum events as requested and needed. The Scrum master also serves the development team by coaching them in self-organisation and cross-functionality, helping them creates high-value products, removing impediments and facilitating Scrum events as requested or needed. The Scrum roles in this project In this project, we have chosen to focus on the Scrum master and the development team. The group as a whole maintains the product owner role, because we all have a clear understanding of the vision and objectives of our development, based on the previous survey (Verup et al. 2013b), and that everyone shall have an equal ownership of the app we are developing.
8
2.2.3 The workflow in Scrum
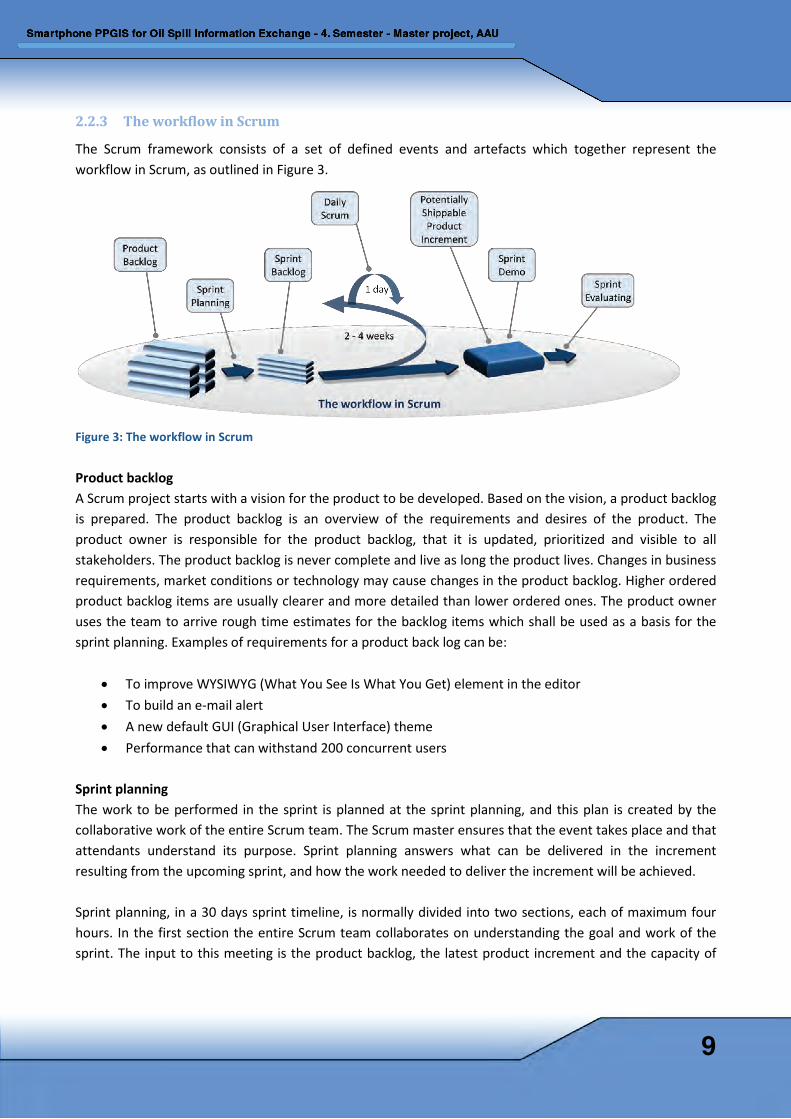
The Scrum framework consists of a set of defined events and artefacts which together represent the workflow in Scrum, as outlined in Figure 3.
Figure 3: The workflow in Scrum
Product backlog A Scrum project starts with a vision for the product to be developed. Based on the vision, a product backlog is prepared. The product backlog is an overview of the requirements and desires of the product. The product owner is responsible for the product backlog, that it is updated, prioritized and visible to all stakeholders. The product backlog is never complete and live as long the product lives. Changes in business requirements, market conditions or technology may cause changes in the product backlog. Higher ordered product backlog items are usually clearer and more detailed than lower ordered ones. The product owner uses the team to arrive rough time estimates for the backlog items which shall be used as a basis for the sprint planning. Examples of requirements for a product back log can be:
• To improve WYSIWYG (What You See Is What You Get) element in the editor • To build an e-mail alert • A new default GUI (Graphical User Interface) theme • Performance that can withstand 200 concurrent users
Sprint planning The work to be performed in the sprint is planned at the sprint planning, and this plan is created by the collaborative work of the entire Scrum team. The Scrum master ensures that the event takes place and that attendants understand its purpose. Sprint planning answers what can be delivered in the increment resulting from the upcoming sprint, and how the work needed to deliver the increment will be achieved. Sprint planning, in a 30 days sprint timeline, is normally divided into two sections, each of maximum four hours. In the first section the entire Scrum team collaborates on understanding the goal and work of the sprint. The input to this meeting is the product backlog, the latest product increment and the capacity of
9
the team members. The first section ends with the Scrum team crafts a goal for the sprint. In section two, the team members prepare the sprint. It is up to the team members to decide in which manner they will break down the requirements for the tasks to be carried out in the sprint. The result of the second section of the sprint planning meeting is a list of tasks and estimates – the sprint backlog. Sprint backlog The sprint backlog is the set of product backlog items selected for the sprint, plus a plan for delivering the product increment and realizing the sprint goal. Only the development team is allowed to change the sprint backlog. The sprint backlog is a visual, real-time representation of the work the development team will complete during the sprint. Sprint goal The sprint goal is an objective set for the sprint that can be met through the implementation of product backlog, and it is created during the sprint planning meeting. It provides guidance to the team members on why it is building the increment. Sprint goals may well correspond to a milestone in a larger product plan. The sprint The heart of Scrum is the sprint, a time-box of 30 days or less during which a finalized usable and potentially releasable product increment is created. A new sprint starts immediately after the conclusion of the previous sprint. Sprints contain and consist of the sprint planning, daily Scrums, system development, sprint review and sprint retrospective, and should not have a longer timeline than 30 days. When a sprint’s horizon is too long the definition of what is being built may change, complexity may rise, and risk may increase. Daily Scrum The daily Scrum, which originated from rugby3, is a 15-minute time-boxed event for the development team and the Scrum master to synchronize activities and create a plan for the next 24 hours. The daily Scrum is ideally held at the same time and places each day to reduce complexity. During the meeting, the team members explain; what did I do yesterday, what will I do today, and do I see any impediments that prevent me from do my work? The daily Scrum optimizes the probability that the team will meet the sprint goal. Sprint demo A sprint ends with a review, but before this, a sprint demonstration meeting is held. At the demonstrating meeting the whole Scrum team and often also different stakeholders participate. Demonstration meeting lasts maximum four hours (in a 30 days sprint timeline), and the team will not spend more than an hour to the preparation of the demonstration. The purpose with demonstration meeting is that the team shows off the functionality that is built in the sprint. After the presentation, all stakeholders, in turn are asked to share their impressions, or update requirements and their priority. Product owner then goes through the product back log to ensure that it is properly prioritized based on the feedback given. Sprint review
3 Under the rugby approach, the product development process emerges from the constant interaction of a hand-picked, multidisciplinary team whose members work together from start to finish (Takeuchi and Nonaka 1986).
10
Straight after the demonstration meeting is conducted, a sprint review/evaluating meeting of maximum three hours is carried out. The review meeting is attended by the development team and the Scrum master. Product owner may be invited as necessary. The meeting focus; what worked well and what can be improved in the next sprint? The improvement the team agrees on is added to the product backlog. It is important that the evaluation meeting concludes with specific improvements. Definition of ‘done’ When a product backlog item or an increment is described as ‘done’, everyone must understand what this means. The Scrum team with the product owner defines ‘done’. Example of definition of done; designed, coded, code review, device tested, acceptance tested, performance tested etc. In this project, all backlog items which include coding should be tested and seen running properly from server. The code should also be documented according to guidelines given in Chapter 2.6. The result from each Sprint should also be tested and seen running properly from server with the appropriate sprint number at the end of the server address, e.g. for Sprint 1, the URL will be: http://geoserver.landmaalergaarden.dk/sprint1/. Other backlog items belonging to a sprint which not included coding, e.g. literature studies of ‘best practice’ of coding, should be reviewed by another team member before the status can be set to done.
2.3 A customized Scrum within a geographically distributed environment Scrum requires close contact between the team members during development. In our case - four master students located miles apart and with few opportunities to meet physically, we really face the development part of this project as quite challenging. On the one hand, we face a, for us, complex and intense system development process, which requires close interaction and effective work within the group. On the other hand, we are thus dispersed geographically. Just the thought that we are to conduct ‘daily Scrum’ in our project, was initially enough that we questioned our self if Scrum really was a suitable framework for our project. Can four students complete the required roles, such as Scrum requires?
After further study of the Scrum framework, however, we came to the conclusion that Scrum is adaptable and that even if the roles are not so easy to fill, we should be able focus on the Scrum process and the appropriate tools. Good tools are particularly important because we are geographically distributed, with a strong need for collaboration and shared understanding during the human centred system design.
In terms of roles, we have as mentioned, chosen to focus on the Scrum master and the development team. The group as a whole maintains the product owner role, because we all have a clear understanding of the vision and objectives of our development, based on the previous survey (Verup et al. 2013), and that everyone shall have an equal ownership of the app we are developing. In an ordinary project – we as the consultant and NCA as the costumer – a person within the NCA would have the product owner role.
In terms of process, we have chosen to keep as close to Scrum as possible. The major modification has been to replace the daily Scrum with ‘weekly Scrum’. This is because it would not be practical for the team members who have regular jobs and family in addition to the study, to conduct a meeting every day at the same time for a talk for 15 minutes. In addition, not all team members will have the opportunity to be able
11
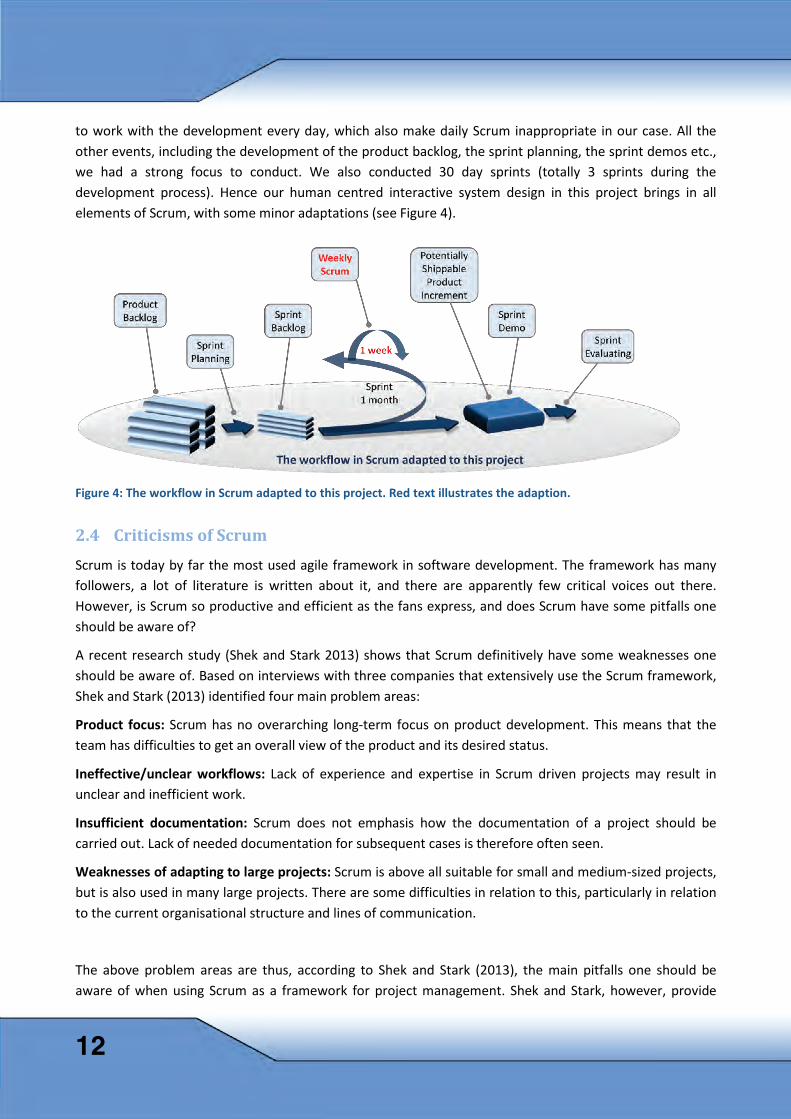
to work with the development every day, which also make daily Scrum inappropriate in our case. All the other events, including the development of the product backlog, the sprint planning, the sprint demos etc., we had a strong focus to conduct. We also conducted 30 day sprints (totally 3 sprints during the development process). Hence our human centred interactive system design in this project brings in all elements of Scrum, with some minor adaptations (see Figure 4).
Figure 4: The workflow in Scrum adapted to this project. Red text illustrates the adaption.
2.4 Criticisms of Scrum Scrum is today by far the most used agile framework in software development. The framework has many followers, a lot of literature is written about it, and there are apparently few critical voices out there. However, is Scrum so productive and efficient as the fans express, and does Scrum have some pitfalls one should be aware of?
A recent research study (Shek and Stark 2013) shows that Scrum definitively have some weaknesses one should be aware of. Based on interviews with three companies that extensively use the Scrum framework, Shek and Stark (2013) identified four main problem areas:
Product focus: Scrum has no overarching long-term focus on product development. This means that the team has difficulties to get an overall view of the product and its desired status.
Ineffective/unclear workflows: Lack of experience and expertise in Scrum driven projects may result in unclear and inefficient work.
Insufficient documentation: Scrum does not emphasis how the documentation of a project should be carried out. Lack of needed documentation for subsequent cases is therefore often seen.
Weaknesses of adapting to large projects: Scrum is above all suitable for small and medium-sized projects, but is also used in many large projects. There are some difficulties in relation to this, particularly in relation to the current organisational structure and lines of communication.
The above problem areas are thus, according to Shek and Stark (2013), the main pitfalls one should be aware of when using Scrum as a framework for project management. Shek and Stark, however, provide
12
clear recommendations for what organisations adopting Scrum should focus on to avoid these pitfalls, namely:
Keep product focus consistently by close costumer dialog and ongoing feedback, clear and well defined test phases, getting the customer engaged in the project and in the test phases. Use prototypes and feasibility studies as required.
Ensure work processes by appointing a technical advisor and a work allocator to the project, adjusting the development team after the projects knowledge needs, cut out daily Scrum if it not fill any needs, hire expertise if needed and secure integration of it in the team.
Maintain needed level of documentation by focusing documentation both in planning meetings and during development, use of tools that support documentation, the development team should see documentation as part of their work, use of progress measuring tools such as burn down charts.
Ensure adapting to large projects by spending more time on planning and communicating, enlarge use of feasibility studies and prototypes to ensure needed foundation and understanding of the product across the organisation.
Beyond the result of Shek and Stark’ study (2013) it also seems to be directed some critics of one of the key elements of Scrum – the concept of self organising development team. The concept assumes that management is not supposed to tell the people what to do, just sure that the development team has everything it needs to get the work done and removing impediments for their work. Critics argue that this can be successful only in homogenous team of talented people where everyone is a team player and works well together, and that the problem is that Scrum does not have tools for when politics, vanity and other human characteristics come in the way (Domingos 2008). Furthermore, some argue that estimating, which is a common part of the Scrum approach regarding sprint planning, has limitations that one should be aware of, especially regarding that estimates of software tasks are inherently unreliable and that the benefits of estimates often are outweighed by the time required to make them (Singleton 2012).
Criticism directed at Scrum clear that Scrum is a framework for software development, and not a method in itself. Should Scrum-driven projects be successful, it is probably important to use appropriate methods, tailored to the individual Scrum project, and also have a strong focus on the pitfalls in Scrum, so that efforts to mitigate these can be done.
2.5 Project management tools Because the team is geographically distributed, but at the same time focusing Scrum processes, it is important to have good tools for interaction tailored to the Scrum framework. There are several relevant web-based Scrum tools such as Scrumwise, Jira Agile and Team Foundation Service. All have in common that they are built to support Scrum. After some further investigation, we chose to use Team Foundation Service (TFS) in our project because this is totally free for up to five team members and it contain needed functionality and a good user interface. Scrumwise apparently has a simpler and better user interface, but was rejected because this tools is not provided free of charge for more than 30 days.
TFS was used as our major project management tool throughout the development period, from setting up the product backlog to sprint planning and documentation and progress measuring. Below is a screenshot
13
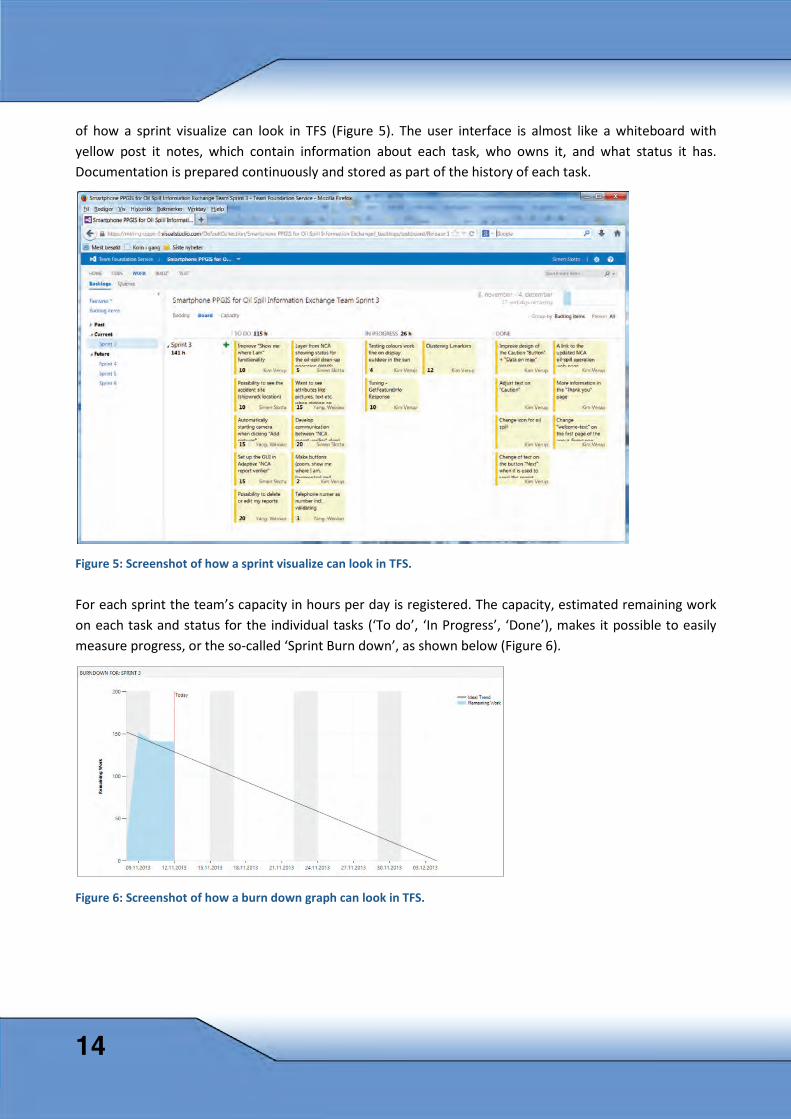
of how a sprint visualize can look in TFS (Figure 5). The user interface is almost like a whiteboard with yellow post it notes, which contain information about each task, who owns it, and what status it has. Documentation is prepared continuously and stored as part of the history of each task.
Figure 5: Screenshot of how a sprint visualize can look in TFS.
For each sprint the team’s capacity in hours per day is registered. The capacity, estimated remaining work on each task and status for the individual tasks (‘To do’, ‘In Progress’, ‘Done’), makes it possible to easily measure progress, or the so-called ‘Sprint Burn down’, as shown below (Figure 6).
Figure 6: Screenshot of how a burn down graph can look in TFS.
14
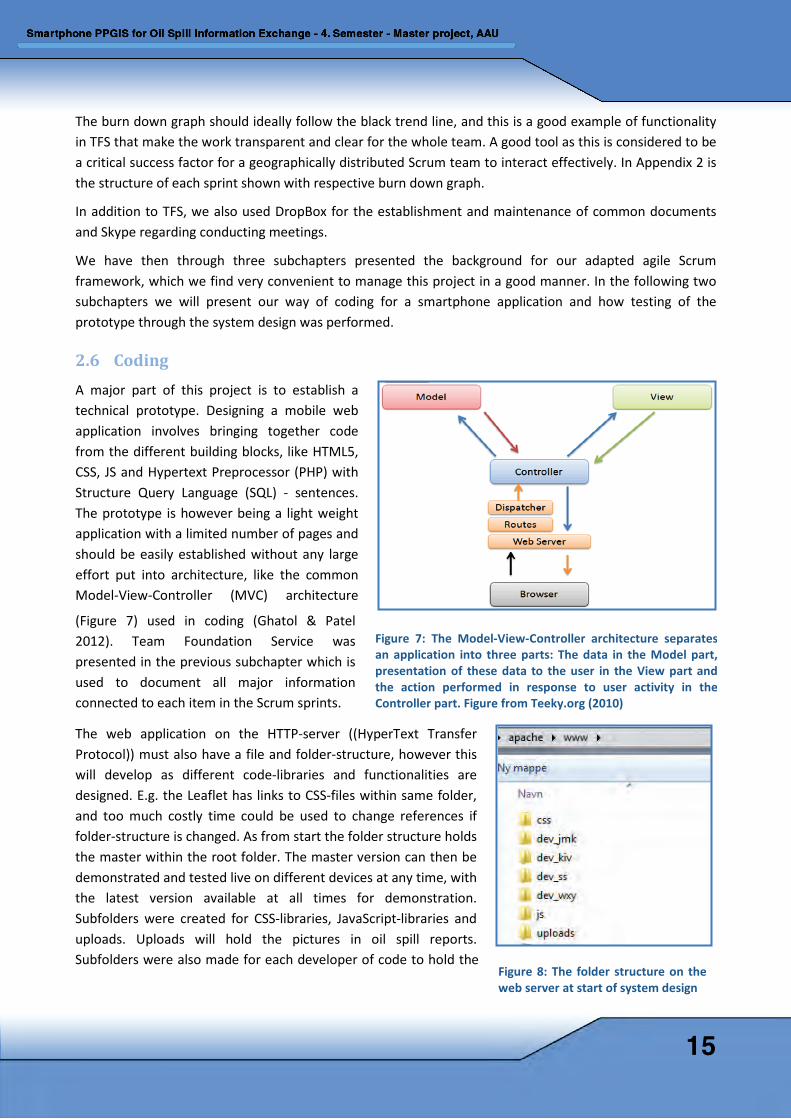
The burn down graph should ideally follow the black trend line, and this is a good example of functionality in TFS that make the work transparent and clear for the whole team. A good tool as this is considered to be a critical success factor for a geographically distributed Scrum team to interact effectively. In Appendix 2 is the structure of each sprint shown with respective burn down graph.
In addition to TFS, we also used DropBox for the establishment and maintenance of common documents and Skype regarding conducting meetings.
We have then through three subchapters presented the background for our adapted agile Scrum framework, which we find very convenient to manage this project in a good manner. In the following two subchapters we will present our way of coding for a smartphone application and how testing of the prototype through the system design was performed.
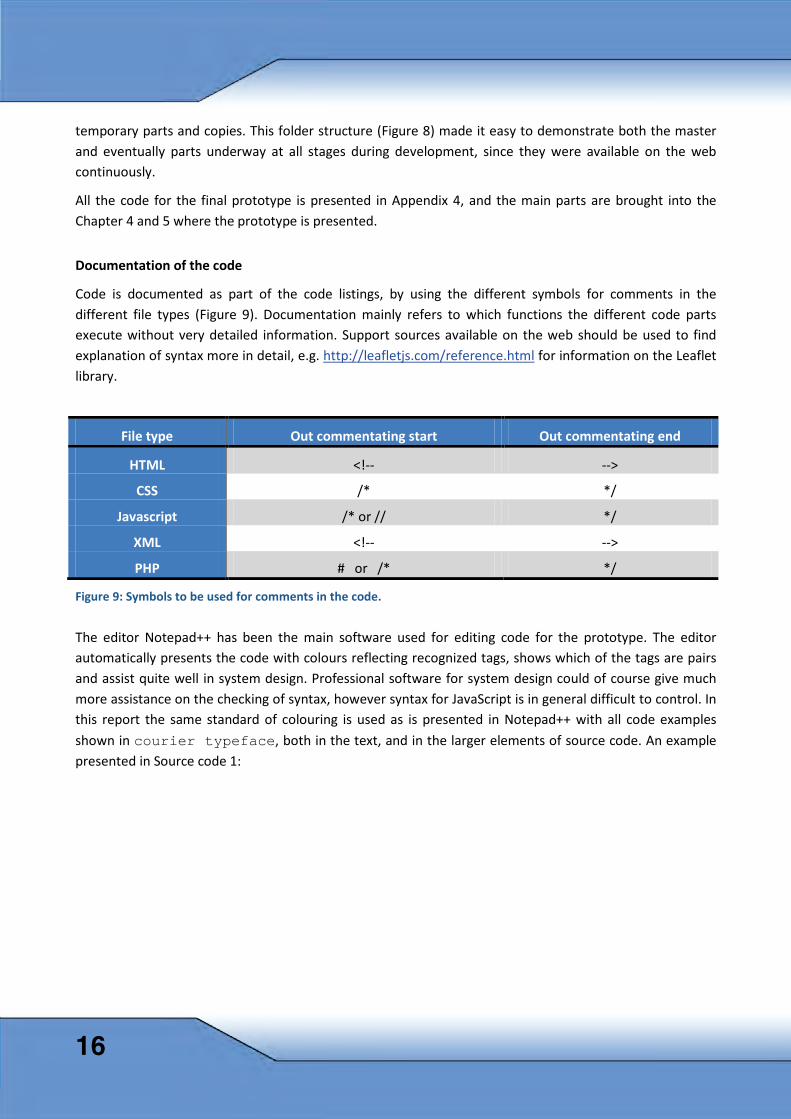
2.6 Coding A major part of this project is to establish a technical prototype. Designing a mobile web application involves bringing together code from the different building blocks, like HTML5, CSS, JS and Hypertext Preprocessor (PHP) with Structure Query Language (SQL) - sentences. The prototype is however being a light weight application with a limited number of pages and should be easily established without any large effort put into architecture, like the common Model-View-Controller (MVC) architecture
(Figure 7) used in coding (Ghatol & Patel 2012). Team Foundation Service was presented in the previous subchapter which is used to document all major information connected to each item in the Scrum sprints.
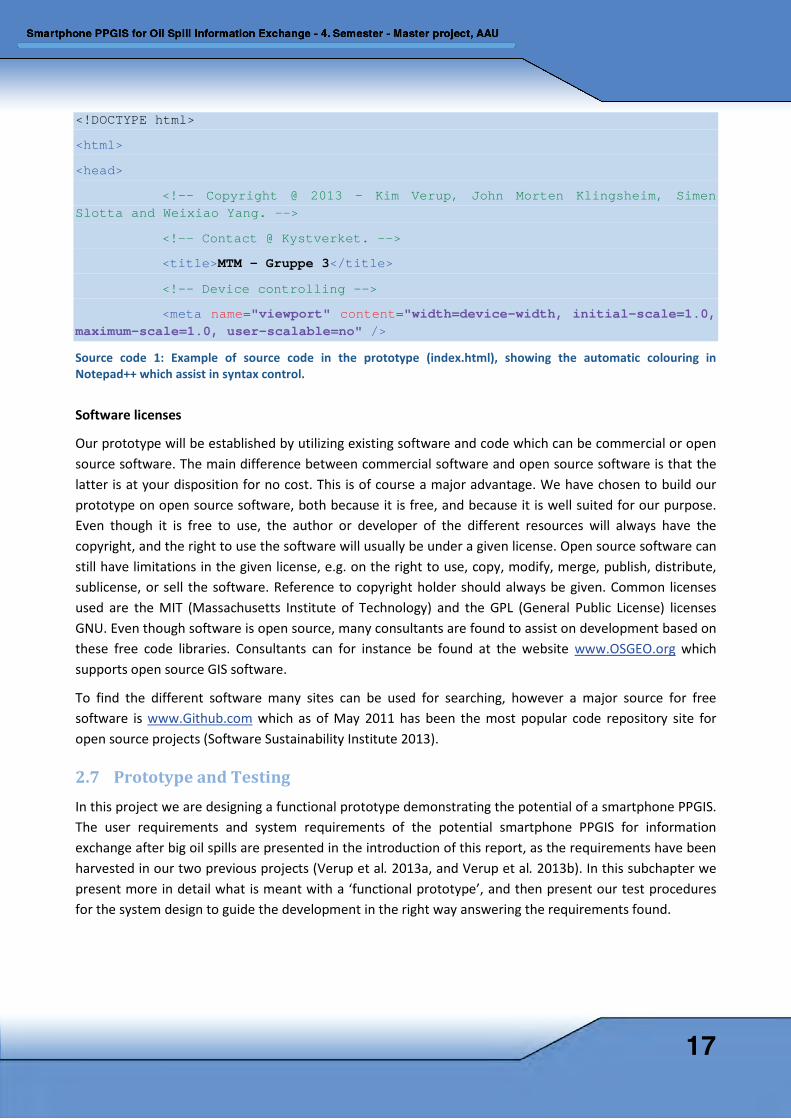
The web application on the HTTP-server ((HyperText Transfer Protocol)) must also have a file and folder-structure, however this will develop as different code-libraries and functionalities are designed. E.g. the Leaflet has links to CSS-files within same folder, and too much costly time could be used to change references if folder-structure is changed. As from start the folder structure holds the master within the root folder. The master version can then be demonstrated and tested live on different devices at any time, with the latest version available at all times for demonstration. Subfolders were created for CSS-libraries, JavaScript-libraries and uploads. Uploads will hold the pictures in oil spill reports. Subfolders were also made for each developer of code to hold the
Figure 8: The folder structure on the web server at start of system design
Figure 7: The Model-View-Controller architecture separates an application into three parts: The data in the Model part, presentation of these data to the user in the View part and the action performed in response to user activity in the Controller part. Figure from Teeky.org (2010)
15
temporary parts and copies. This folder structure (Figure 8) made it easy to demonstrate both the master and eventually parts underway at all stages during development, since they were available on the web continuously.
All the code for the final prototype is presented in Appendix 4, and the main parts are brought into the Chapter 4 and 5 where the prototype is presented.
Documentation of the code
Code is documented as part of the code listings, by using the different symbols for comments in the different file types (Figure 9). Documentation mainly refers to which functions the different code parts execute without very detailed information. Support sources available on the web should be used to find explanation of syntax more in detail, e.g. http://leafletjs.com/reference.html for information on the Leaflet library.
File type Out commentating start Out commentating end
HTML <!-- -->
CSS /* */
Javascript /* or // */
XML <!-- -->
PHP # or /* */
Figure 9: Symbols to be used for comments in the code.
The editor Notepad++ has been the main software used for editing code for the prototype. The editor automatically presents the code with colours reflecting recognized tags, shows which of the tags are pairs and assist quite well in system design. Professional software for system design could of course give much more assistance on the checking of syntax, however syntax for JavaScript is in general difficult to control. In this report the same standard of colouring is used as is presented in Notepad++ with all code examples shown in courier typeface, both in the text, and in the larger elements of source code. An example presented in Source code 1:
16
<!DOCTYPE html>
<html>
<head>
<!-- Copyright @ 2013 - Kim Verup, John Morten Klingsheim, Simen Slotta and Weixiao Yang. -->
<!-- Contact @ Kystverket. -->
<title>MTM - Gruppe 3</title>
<!-- Device controlling -->
<meta name="viewport" content="width=device-width, initial-scale=1.0, maximum-scale=1.0, user-scalable=no" />
Source code 1: Example of source code in the prototype (index.html), showing the automatic colouring in Notepad++ which assist in syntax control.
Software licenses
Our prototype will be established by utilizing existing software and code which can be commercial or open source software. The main difference between commercial software and open source software is that the latter is at your disposition for no cost. This is of course a major advantage. We have chosen to build our prototype on open source software, both because it is free, and because it is well suited for our purpose. Even though it is free to use, the author or developer of the different resources will always have the copyright, and the right to use the software will usually be under a given license. Open source software can still have limitations in the given license, e.g. on the right to use, copy, modify, merge, publish, distribute, sublicense, or sell the software. Reference to copyright holder should always be given. Common licenses used are the MIT (Massachusetts Institute of Technology) and the GPL (General Public License) licenses GNU. Even though software is open source, many consultants are found to assist on development based on these free code libraries. Consultants can for instance be found at the website www.OSGEO.org which supports open source GIS software.
To find the different software many sites can be used for searching, however a major source for free software is www.Github.com which as of May 2011 has been the most popular code repository site for open source projects (Software Sustainability Institute 2013).
2.7 Prototype and Testing In this project we are designing a functional prototype demonstrating the potential of a smartphone PPGIS. The user requirements and system requirements of the potential smartphone PPGIS for information exchange after big oil spills are presented in the introduction of this report, as the requirements have been harvested in our two previous projects (Verup et al. 2013a, and Verup et al. 2013b). In this subchapter we present more in detail what is meant with a ‘functional prototype’, and then present our test procedures for the system design to guide the development in the right way answering the requirements found.
17
2.7.1 Prototype
Lim, Stoltermann & Tenenberg (2008) presents a view of prototypes as ‘tools for traversing a design space where all possible design alternatives and their rationales can be explored... Prototypes stimulate reflections, and designers use them to frame, refine, and discover possibilities in a design space’ (p.7). We will especially bring up two sides of prototypes. Firstly, the prototype gives the design team a good way to refine and discover the possibilities given. This helps us to explore both the rationale and the possibilities for the given smartphone PPGIS. Secondly, the functional prototype is a brilliant way to communicate the idea to others. To make it a functional prototype takes a much higher effort than bringing up mock-ups, low-fi or hi-fi non functional prototypes. We will also bring in as many of the given user and system requirements as possible, and such bring up a prototype which is both horizontal and vertical. Being horizontal as it should look into all the major functionalities, both for the citizen requirements and the NCA requirements. Being vertical meaning it also digs into the details of the suggested smartphone PPGIS (Benyon 2010). With all this comes a requirement of a good user experience, which generally means easy to learn, effective to use, and providing an enjoyable interaction with the prototype (Rogers, Sharp & Preece 2011). Testing of performance in the field, has however not been be a part of this study.
2.7.2 System testing
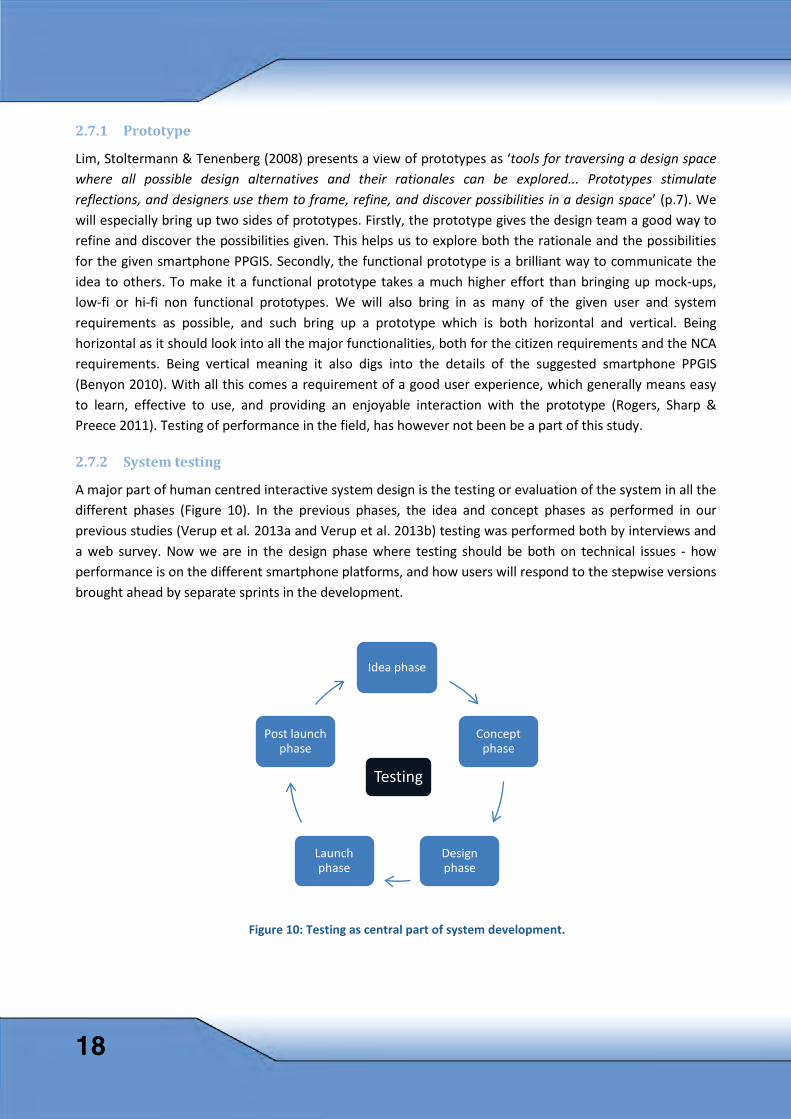
A major part of human centred interactive system design is the testing or evaluation of the system in all the different phases (Figure 10). In the previous phases, the idea and concept phases as performed in our previous studies (Verup et al. 2013a and Verup et al. 2013b) testing was performed both by interviews and a web survey. Now we are in the design phase where testing should be both on technical issues - how performance is on the different smartphone platforms, and how users will respond to the stepwise versions brought ahead by separate sprints in the development.
Figure 10: Testing as central part of system development.
Testing
18
Idea phase
Concept phase
Design phase
Launch phase
Post launch phase
Technical testing
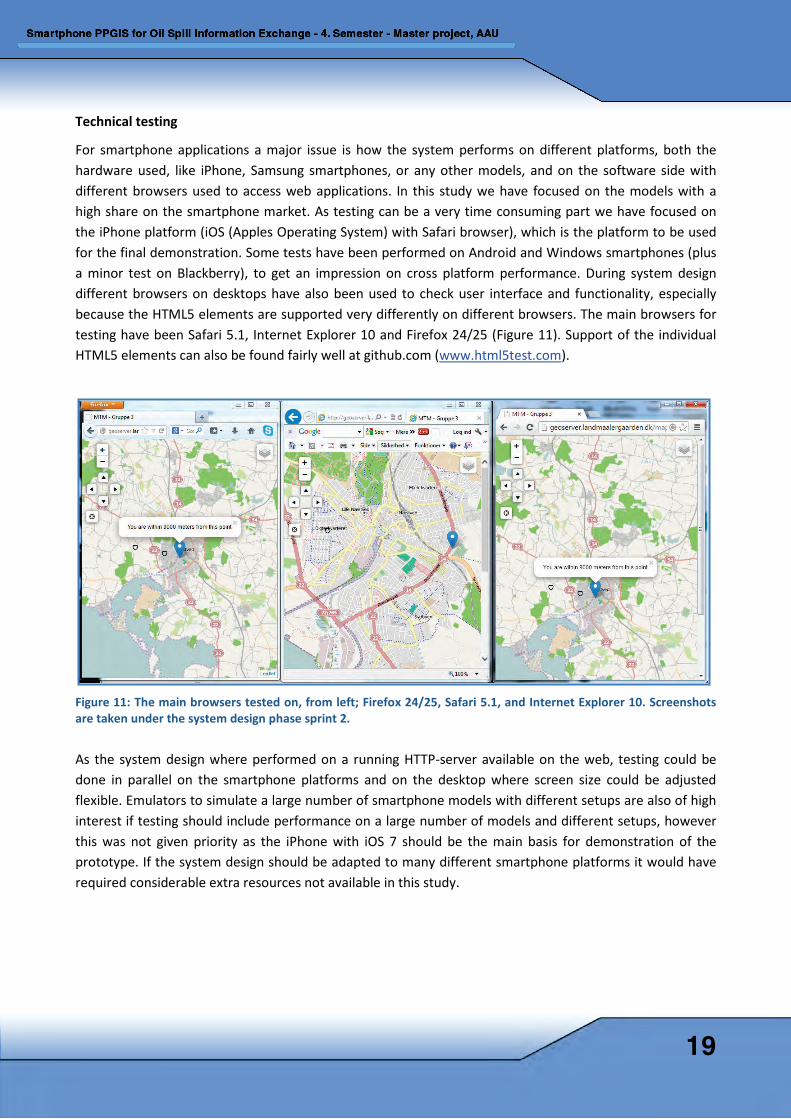
For smartphone applications a major issue is how the system performs on different platforms, both the hardware used, like iPhone, Samsung smartphones, or any other models, and on the software side with different browsers used to access web applications. In this study we have focused on the models with a high share on the smartphone market. As testing can be a very time consuming part we have focused on the iPhone platform (iOS (Apples Operating System) with Safari browser), which is the platform to be used for the final demonstration. Some tests have been performed on Android and Windows smartphones (plus a minor test on Blackberry), to get an impression on cross platform performance. During system design different browsers on desktops have also been used to check user interface and functionality, especially because the HTML5 elements are supported very differently on different browsers. The main browsers for testing have been Safari 5.1, Internet Explorer 10 and Firefox 24/25 (Figure 11). Support of the individual HTML5 elements can also be found fairly well at github.com (www.html5test.com).
Figure 11: The main browsers tested on, from left; Firefox 24/25, Safari 5.1, and Internet Explorer 10. Screenshots are taken under the system design phase sprint 2.
As the system design where performed on a running HTTP-server available on the web, testing could be done in parallel on the smartphone platforms and on the desktop where screen size could be adjusted flexible. Emulators to simulate a large number of smartphone models with different setups are also of high interest if testing should include performance on a large number of models and different setups, however this was not given priority as the iPhone with iOS 7 should be the main basis for demonstration of the prototype. If the system design should be adapted to many different smartphone platforms it would have required considerable extra resources not available in this study.
19
Performance according to the user requirements
As the prototype should be giving a good experience when demonstrated, it was also essential that actual users were to test the system. However bringing in real living persons representing the diversity among all citizens relevant for the application would be very time and resource consuming. Because of this the method Personas (Benyon 2010) presented more in detail in our previous study (Verup et al. 2013b) were utilized. Four personas were established representing the variation in expected involvement and knowledge on oil spill clean-up operations, ecological knowhow and pollution consequences, and experience level on smart phones (Table 1). A more detailed description of the personas is given in Appendix 3.
The personas Espen, Benny, Laila and Kari were then brought in after sprint no. 2, when the prototype where including a large part of the requested functionalities. They went through a number of defined user scenarios based on some of the use cases settled ahead of the system design. In this way we got both the advantage of the extensive preparation ahead of this system design, and the flexibility of utilizing user scenarios which are more adapted to agile development (Sæther 2009).
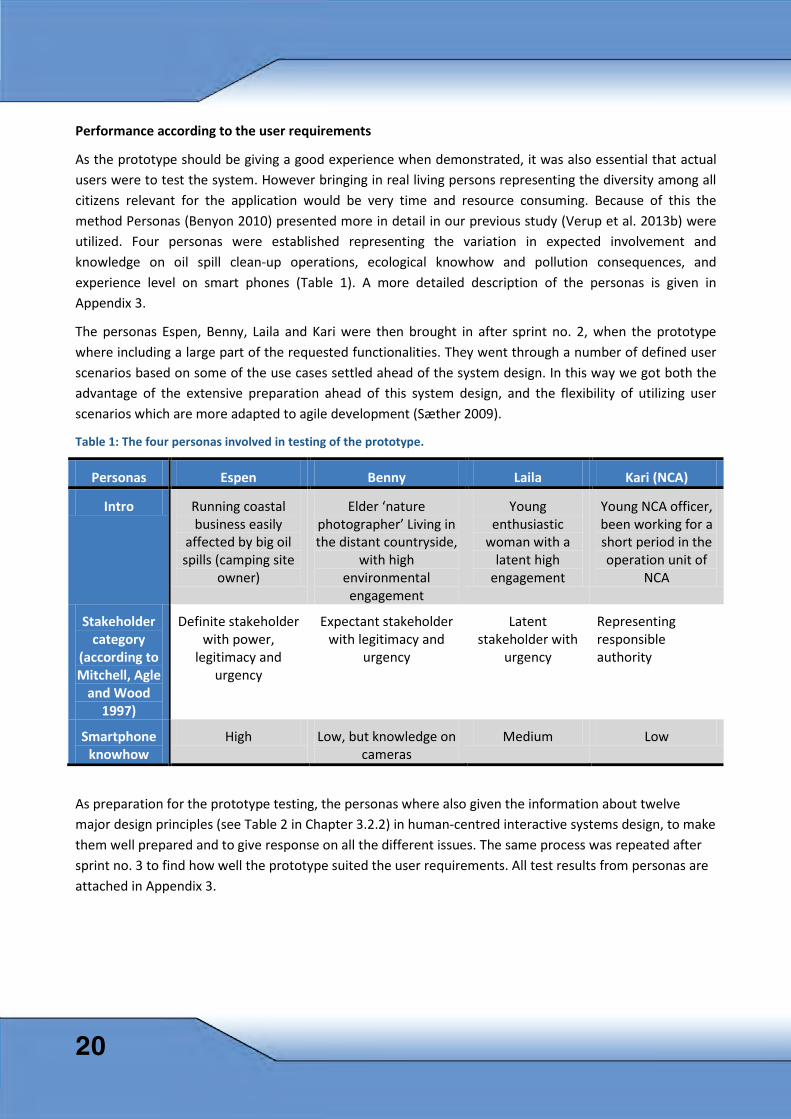
Table 1: The four personas involved in testing of the prototype.
Personas Espen Benny Laila Kari (NCA)
Intro Running coastal business easily
affected by big oil spills (camping site
owner)
Elder ‘nature photographer’ Living in the distant countryside,
with high environmental engagement
Young enthusiastic
woman with a latent high
engagement
Young NCA officer, been working for a short period in the operation unit of
NCA
Stakeholder category
(according to Mitchell, Agle
and Wood 1997)
Definite stakeholder with power,
legitimacy and urgency
Expectant stakeholder with legitimacy and
urgency
Latent stakeholder with
urgency
Representing responsible authority
Smartphone knowhow
High Low, but knowledge on cameras
Medium Low
As preparation for the prototype testing, the personas where also given the information about twelve major design principles (see Table 2 in Chapter 3.2.2) in human-centred interactive systems design, to make them well prepared and to give response on all the different issues. The same process was repeated after sprint no. 3 to find how well the prototype suited the user requirements. All test results from personas are attached in Appendix 3.
20
3 GI technology The methods used to bring up a smartphone PPGIS prototype have been presented in the previous chapter. Chapter 3 will present the technologies used to build the application. Chapter 3.1 introduces spatial data and the issues on GIS for smartphones. Chapter 3.2 - 3.7 presents the main software elements utilized in the web app prototype. The main elements of the web app consists of HTML5, CSS and JavaScript (Chapter 3.2), an HTTP-server, a PostGIS-database and PHP server-side scripting language (Chapter 3.3 – 3.4), the GeoServer as map server (Chapter 3.5), and the JavaScript libraries Leaflet and jQuery/jQuery Mobile (Chapter 3.6 – 3.7). After the spatial data (Chapter 3.8) and adaptive web GIS (Chapter 3.9) are presented a short summary is given in Chapter 3.10.
3.1 Spatial data and mobile units Spatial data, also known as geographic information, is the data or information that identifies the geographic location of features and boundaries on Earth. Spatial data is usually stored as coordinates and topology. Besides the geographic location, it often contains non-location based attributes about a feature. These attributes may be viewed as descriptive information that is used to classify and/or describe a particular feature.
3.1.1 Characteristics of spatial data
Compared with non-spatial data, spatial data has many characteristics. According to Tang (2013), the following aspects shall be considered in the management of spatial data:
• Spatial distributed: Each data object has its coordinates, which implies the object’s spatial distribution. It means that the spatial distributions are essential in organisation of spatial data. Spatial index must be established in addition to primary and secondary keyword index.
• Unstructured: In a relational database management system, each data record is in fixed length (structured) and data items cannot be divided. Furthermore, nested records are not allowed. However, the spatial data cannot meet this length (structured) requirements. In an expression of a spatial object record, the length of data items may vary, i.e. an expression of an arc may contains two pairs of coordinates, or hundreds or thousands pairs; Another feature t is an spatial object may contain one or more additional objects, such as a polygon, may contain a plurality of arcs. If an arc represents a record, the record of the polygon may be nested record of multiple arcs, so it does not meet the requirements of structured relational data model, which makes it difficult for spatial pattern to fit directly into a typical relational data management system.
• Spatial related: As coordinates of spatial data imply spatial distribution, topological data structures can express the multiple spatial relations between data objects. Using topology data structure makes it easier to facilitate the analysis of spatial data and spatial query, but it increases complexity of maintenance of spatial data consistency and integrity. As far as spatial data like multidimensional object is
21
concerned, search, display, and analysis operations require manipulating and retrieving multiple data files.
• Multi-scale and multi-form: Different observations have their own scales and precisions. A same spatial object will be observed and expressed as different features in different context. For example, a city can in a larger scale be observed as urban space occupying a certain range, but in smaller scale, the same city will be handled as a point-like object.
• Classification and coding: Each space object has normally a classification code that is often encoded in accordance with national standards, industry standards or local standards. The number of attributes for each feature type may vary according to standards. Furthermore, the value of a same attribute may vary from standards to standards.
• Massive data: Size of spatial data is typically large compared with non-spatial data. Geographic information of a city is typically up to dozens of GB, if image data is included, data size may reach hundreds of GB. Organisation of such a data sizes therefore requires dividing blocks on a two-dimensional map sheet or dividing layers in the vertical direction.
3.1.2 Map projection and spatial reference
World maps in an atlas provide a spatial referencing system, but the same pieces of the earth can look different according to the map projection used for map (Robinson et al. 1984). A map projection is a systematic transformation of the latitudes and longitudes of locations on the surface of a sphere or an ellipsoid into locations on a plane (Synder 1987).
Spatial reference is typically expressed by coordinate systems. There are two types of coordinate systems used in GIS: geographic coordinate systems and projected coordinate systems: geographic coordinate system and projected coordinate system (scholarportal.org 2013). Geographic coordinate systems use a three-dimensional spherical surface (spheroid) to represent the earth and define locations on it, which are referenced by longitude and latitude values. Projected coordinate systems use projections that transfer the earth's round surface into a flat surface, such as map or computer screen. Projected coordinate systems are always based on geographic coordinate systems.
In this project, three major coordinate systems are involved.
• WGS84 (World Geodetic System; based on the WGS 1984 spheroid) with an SRID (spatial reference system identifier) EPSG4:4326. WGS84 is a geographic coordinate system with latitude and longitude as coordinates. WGS84 bounds are -180.0000, -90.0000, 180.0000, 90.0000. This coordinate system is also used in smartphones for geolocation, and for smartphone cameras as geotags.
4 EPSG (European Petroleum Survey Group) parameters are used to define unique CRS’s like EPSG4326 and many others. The OGP (International Association of Oil & Gas Producers) Geomatics Committee, through its Geodesy Subcommittee, maintains and publishes a dataset of parameters for CRS and coordinate transformation descriptions (http://www.epsg.org/).
22
• WGS84 Web Mercator (Auxiliary Sphere) with an SRID EPSG:3857. WGS84 Web Mercator, also known as Google Mercator, is a projected coordinated system that is based on WGS84 and widely used in web mapping such as Google Maps, Bing Maps etc. Bounds are -20037508.34, -20037508.34, 20037508.34, 20037508.34.
• UTM33N EUREF895 with an SRID EPSG:25833. UTM33N ETRS896 is an universal transverse Mercator based on European Terrestrial Reference System 1989. It is the official geodata reference standard used in Norway. That means most geodata in NCA is published in this format. Its projected bounds are 227879.8880, 3932632.6543, 1044484.3835, 8893131.0281.
It shall be noted that WGS84 and WGS 84 Web Mercator coordinate systems can easily be mixed up. For example, OpenStreetMap is used as background map in our prototype. Data in Open Street Maps database are stored in a geographic coordinate system of WGS84 (EPSG:4326). However, the Open Street Map tiles and the WMS services are in the projected coordinate system that is based on the WGS84 Web Mercator (EPSG 3857). As shown in Figure 16, spatial references and relevant transformations are essential parts in GIS applications, handling spatioal data in spatial databases, web map services and on displays. Coordinate systems and projection transformations are therefore handled with care in the development of our prototype as described in the given figure.
Most of the smartphones people buy today include a GPS (556 of 612 models presented on www.findthebest.com 20 Dec 2013). Therefore using smartphones to collect spatial data becomes very interesting. Loads of applications are launched to utilize this, and the prototype for smartphone PPGIS should as well. As we are going into the web application domain, access to the different features on the smartphone has to be solved using HTML5 and scripting languages for web applications. Mobile GIS have been rapidly growing the last years, and smart touch devices are very well suited for many tasks in the field. Mobile GIS is an ideal platform for capturing information and updating it, and therefore many organisations, including utility and infrastructure companies, public safety and law enforcement agencies completes a lot of different task hereby (Fu & Sun 2011).
3.2 Mobile web application development (HTML5, CSS, JavaScript) Applications for smartphones can be divided into three main categories, native applications, web applications and hybrid applications (Capax Global 2013). Based on conclusions in our survey of the smartphone applications (Verup et al. 2013b), the prototype for a smartphone PPGIS for oils spill information exchange will be developed as a mobile web application. Development of mobile web applications has its pros and cons (Cowart 2013), where the main pros are: The broadest reach. We can re-use existing responsively designed sites. The code base is re-usable between platforms, and finding necessary skills is not difficult. The main cons are: Extremely limited access to device APIs. Limited discoverability (no app store presence), and tend to be more difficult to monetize.
5 the European sub-commission of the International Association of Geodesy (IAG) 6 European Terrestrial Reference System 1989
23
3.2.1 Mobile Web Applications
HTML5, CSS and JavaScript are the three main elements of mobile web applications. HTML5 can be understood as an umbrella term that describes a set of related technologies to make modern and rich web content (Freeman 2011). HTML5 was announced as ‘Candidate Recommendation’ in December 2012, and is planned to get status ‘Recommended’ for a first version in 2014 fourth quarter (http://www.w3.org/html/wg/). For the development of a smartphone PPGIS application this new standard brings several relevant API’s for the web app development, especially to access smartphone features (Chapter 3.2).
Web applications should also be based on the common ‘Document Object Model’ (DOM) which is an API for accessing and manipulating documents (W3C 2013a). The DOM gives a structure for the presentation on the user platform by using defined elements like ‘header’, ‘footer’ and ‘map’. See more about the different DOM’s for our prototype in Chapter 3.6 and 3.7 describing functionality of Leaflet, jQuery and jQuery Mobile.
3.2.2 User interface and interaction
Development for smartphone devices is first and foremost about communication (Castledine, Eftos & Wheeler 2011). The smartphone application must be well suited for getting information and sending information, which is the main mission. Which context the application is used within must also be taken into account. Usability and user-friendliness is therefore of high importance, especially where the user should be self-taught through use of the application, and even more as the users of the application should include ‘all citizens’. Usability is in the ISO7 9241 standard defined as: ‘The extent to which a product can be used by specified users to achieve specified goals with effectiveness, efficiency, and satisfaction in a specified context of use’ (Quesenbery 2001). User-friendliness can be defined as ‘easy to learn, use, understand, or deal with’ (Merriam-Webster, n.d.). Benyon (2010) have brought the main issues of usability and user-friendliness into twelve design principles within four categories which should all be brought into the process of system design (Table 2). The four categories set up are: Learnability – The system should be easy to learn and easy to use; Effectiveness – That it contains the appropriate functions and information; Safe and secure – That it will be safe and secure to operate in the relevant context; Accommodation – To accommodate differences between people and respecting those differences.
7 ISO: International Standards Organization
24
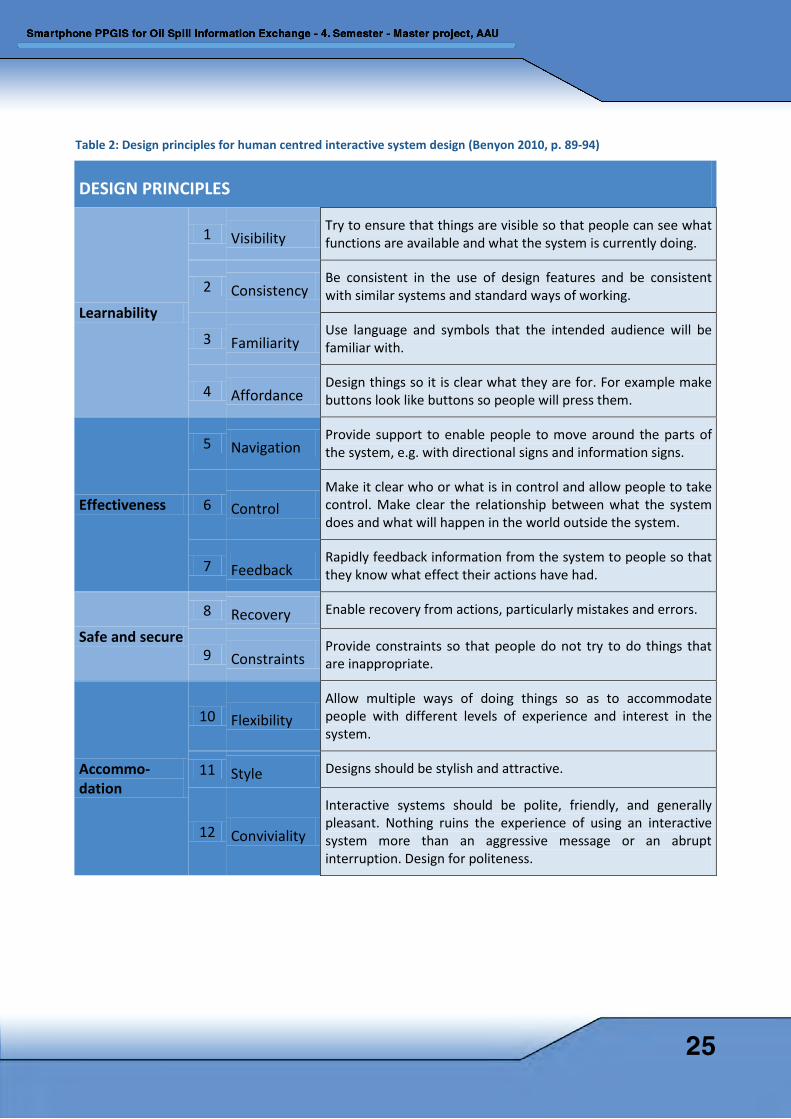
Table 2: Design principles for human centred interactive system design (Benyon 2010, p. 89-94)
DESIGN PRINCIPLES
Learnability
1 Visibility Try to ensure that things are visible so that people can see what functions are available and what the system is currently doing.
2 Consistency Be consistent in the use of design features and be consistent with similar systems and standard ways of working.
3 Familiarity Use language and symbols that the intended audience will be familiar with.
4 Affordance Design things so it is clear what they are for. For example make buttons look like buttons so people will press them.
Effectiveness
5 Navigation Provide support to enable people to move around the parts of the system, e.g. with directional signs and information signs.
6 Control Make it clear who or what is in control and allow people to take control. Make clear the relationship between what the system does and what will happen in the world outside the system.
7 Feedback Rapidly feedback information from the system to people so that they know what effect their actions have had.
Safe and secure
8 Recovery Enable recovery from actions, particularly mistakes and errors.
9 Constraints Provide constraints so that people do not try to do things that are inappropriate.
Accommo-dation
10 Flexibility Allow multiple ways of doing things so as to accommodate people with different levels of experience and interest in the system.
11 Style Designs should be stylish and attractive.
12 Conviviality
Interactive systems should be polite, friendly, and generally pleasant. Nothing ruins the experience of using an interactive system more than an aggressive message or an abrupt interruption. Design for politeness.
25
Benyon (2010) refers only to some degree to system design of smartphone applications. We have therefore also had an eye to Cesani & Dranka’s (2013) presentation of ten principles especially relevant for system design on mobile devices:
1. Don’t miniaturize (icon size etc.)
2. Context
3. Integrity aesthetics
4. Consistency (Internal/External)
5. Multitouch
6. Feedback
7. Metaphors
8. Rapid selections
9. User control
10. Minimize the pain
Smartphone have generally small displays for communication. Findthebest (2013) referring to 391 out of 612 models having displays less or equal to 4 inches, also the size of new I-phone models, which is the main platform tested for in this system design. Button size on mobile units should fit for purpose, and a size of 9 mm is recommended for buttons (Komine & Nakanishi 2013), and even bigger if elder people are an important part of the user group (Hsiao, Liu & Wang 2013). We suppose outdoor use also urge the need of big icons, as the sun easily decrease the visibility, and use of the smartphone PPGIS is highly relevant in quite harsh environment.
The touch events of smartphones make a very different interface than the traditional mouse events on PC’s. The touch events cause reduced sight of the display during the touch command. Originally the touch gestures were limited, but including more sensitive touch and multi-touch functionality brings new gestures available to use for navigation on the smart-phone display (Castledine, Eftos & Wheeler 2011).
For design of user interface familiarity and consistency are major principles. Therefore knowledge of the trends for smartphone applications is of high importance. Traditionally the different OS releases on Windows, iOS, and now also Android lead the way for user interface, and these should be followed to give a modern and pleasant design.
Performance in terms of response time is also of major importance on smartphone devices. Any issues to decrease the actual response time should be looked into, to minimize the pain for the user.
3.2.3 Using the smartphone device features
HTML5 together with JavaScript give access to the device features in smartphones. For the Smartphone PPGIS application access to GPS, camera, and local storage (Chapter 3.2.4) are of high importance.
26
Geolocation The HTML5 method getCurrentPosition() is today supported in all major browsers (IE 9.0+, FireFox 3.5+, Opera 10.6+, Chrome 5+, Safari 5+, iPhone 3.0+, Android 2.0+ ) (Pilgrim 2010), and should be used to find the position from the smartphone unit, this being brought in by GPS-unit or by triangulation of signals from mobile antennas and WiFi-antennas. The precision of position is also in many situations of good use to know within which area the point of interest could be lying. Accuracy of geolocation in HTML5 shall be specified in meters, and should correspond to a 95 % confidence interval (W3C 2013b).
Camera The HTML5 method getUserMedia() is giving access to the smartphone camera, however this method only have status as a working draft in W3C and is to a limited degree supported for smartphones. Deveria (2013) refers to Firefox 23+, Chrome 29+, Opera 18+, Android 4.4, and Blackberry 10.0+ to be supporting this method, and the method not to be supported by iOS Safari. The alternative for access on smartphones through other browsers must adapt to the built-in methods within each separate browser version on the different OS’s.
3.2.4 Application Storage
Web application often contains data exchanges between server and client. Application storage or data cache can help to speed up the performance or avoid data loss in case of server client communication failure. With the development of browser technologies, the data cache has also experience improvements from cookies to web storage.
Cookie A cookie, also known as an HTTP cookie, web cookie, or browser cookie, is a very small text file placed on the client side by a Web Page server. It is essentially for identification purpose, and cannot be executed as code or deliver viruses. It is uniquely to the client and can only be read by the server that creates the cookie. All browsers are expected to support cookies with a size of 4KB (IETF 2011). A cookie can typically be allocated the following attributes (Google developers 2013):
• Name — The cookie's name. • Value — The cookie's value. • Domain — The domain that the cookie applies to. • Path — The path that the cookie applies to. • Expires / Maximum Age— The cookie's expiration time, or maximum age. For session cookies, this
field is always "Session". • Size — The size of the cookie's data in bytes. • HTTP — If present, indicates that cookies should be used only over HTTP, and JavaScript
modification is not allowed. • Secure — If present, indicates that communication for this cookie must be over an encrypted
transmission.
For web developers, cookie can be a precious possibility to save essential information on client side locally. But for IT security experts, tracking cookies and especially third-party tracking cookies are used as ways to
27
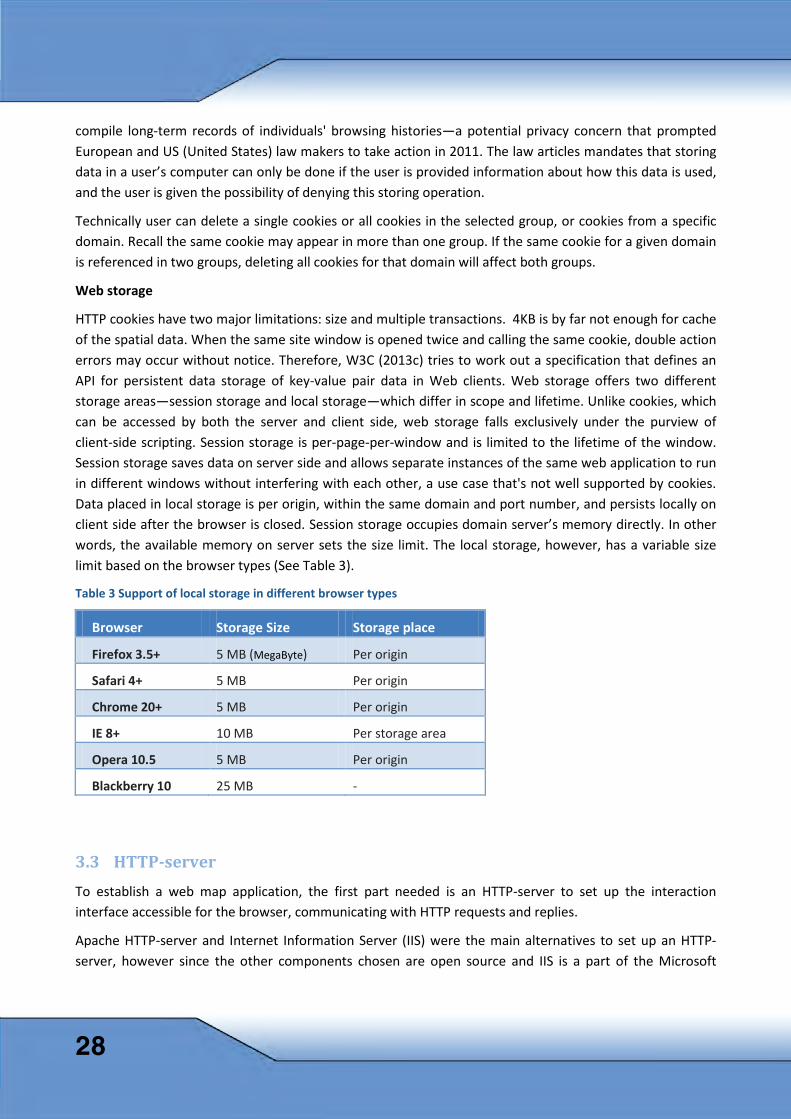
compile long-term records of individuals' browsing histories—a potential privacy concern that prompted European and US (United States) law makers to take action in 2011. The law articles mandates that storing data in a user’s computer can only be done if the user is provided information about how this data is used, and the user is given the possibility of denying this storing operation.
Technically user can delete a single cookies or all cookies in the selected group, or cookies from a specific domain. Recall the same cookie may appear in more than one group. If the same cookie for a given domain is referenced in two groups, deleting all cookies for that domain will affect both groups.
Web storage
HTTP cookies have two major limitations: size and multiple transactions. 4KB is by far not enough for cache of the spatial data. When the same site window is opened twice and calling the same cookie, double action errors may occur without notice. Therefore, W3C (2013c) tries to work out a specification that defines an API for persistent data storage of key-value pair data in Web clients. Web storage offers two different storage areas—session storage and local storage—which differ in scope and lifetime. Unlike cookies, which can be accessed by both the server and client side, web storage falls exclusively under the purview of client-side scripting. Session storage is per-page-per-window and is limited to the lifetime of the window. Session storage saves data on server side and allows separate instances of the same web application to run in different windows without interfering with each other, a use case that's not well supported by cookies. Data placed in local storage is per origin, within the same domain and port number, and persists locally on client side after the browser is closed. Session storage occupies domain server’s memory directly. In other words, the available memory on server sets the size limit. The local storage, however, has a variable size limit based on the browser types (See Table 3).
Table 3 Support of local storage in different browser types
Browser Storage Size Storage place
Firefox 3.5+ 5 MB (MegaByte) Per origin
Safari 4+ 5 MB Per origin
Chrome 20+ 5 MB Per origin
IE 8+ 10 MB Per storage area
Opera 10.5 5 MB Per origin
Blackberry 10 25 MB -
3.3 HTTP-server To establish a web map application, the first part needed is an HTTP-server to set up the interaction interface accessible for the browser, communicating with HTTP requests and replies.
Apache HTTP-server and Internet Information Server (IIS) were the main alternatives to set up an HTTP-server, however since the other components chosen are open source and IIS is a part of the Microsoft
28
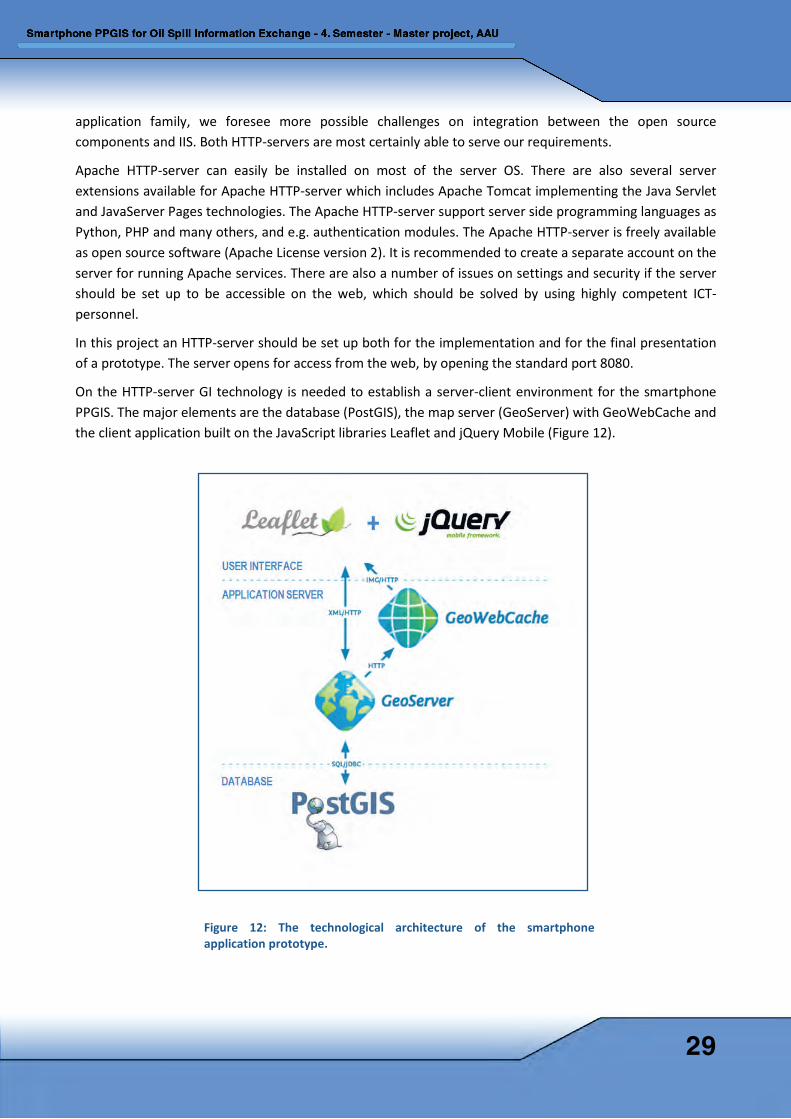
application family, we foresee more possible challenges on integration between the open source components and IIS. Both HTTP-servers are most certainly able to serve our requirements.
Apache HTTP-server can easily be installed on most of the server OS. There are also several server extensions available for Apache HTTP-server which includes Apache Tomcat implementing the Java Servlet and JavaServer Pages technologies. The Apache HTTP-server support server side programming languages as Python, PHP and many others, and e.g. authentication modules. The Apache HTTP-server is freely available as open source software (Apache License version 2). It is recommended to create a separate account on the server for running Apache services. There are also a number of issues on settings and security if the server should be set up to be accessible on the web, which should be solved by using highly competent ICT-personnel.
In this project an HTTP-server should be set up both for the implementation and for the final presentation of a prototype. The server opens for access from the web, by opening the standard port 8080.
On the HTTP-server GI technology is needed to establish a server-client environment for the smartphone PPGIS. The major elements are the database (PostGIS), the map server (GeoServer) with GeoWebCache and the client application built on the JavaScript libraries Leaflet and jQuery Mobile (Figure 12).
Figure 12: The technological architecture of the smartphone application prototype.
29
3.4 Spatial database and communication To establish a management system of crowd sourced oil spill reports and other spatial data, the PPGIS application require a spatial database and a programming language to read, write, edit and delete information within the system. Out of several options, PostGIS as spatial database and PHP as programming language was pointed out as best choices for a prototype development by Verup et al. (2013b).
3.4.1 PostGIS
The PostGIS database consist of the open source object-relational database PostgreSQL and the spatial extender PostGIS.
The PostGIS extender adds support for geographic objects allowing location queries to be run in SQL. The additional SQL functionalities in spatial databases include operations as search by region, overlay, nearest neighbour, distance, adjacency, perimeter (Shekhar & Chawla 2002).
PostgreSQL and PostGIS are available under open source licenses, the PostgreSQL License, similar to the MIT license, and the GNU General Public License v2 respectively, giving access to a professional database without license costs. In the rest of this document the term PostGIS is used to refer to PostgreSQL with the spatial extender PostGIS if no other reference is specified or otherwise obvious.
In our prototype the PostGIS will store the oil spill reports and eventually other spatial and non-spatial data, including pictures as main part of the oil spill reports. The database must also provide spatial querries and offer data interfaces to both map servers and server side script languages to give access to data from smartphone clients. Map servers should be able to read and write to the PostGIS database, and publish data as WMS. Server script language should have access to read and write to the database, to assist on smartphones read and write functionalities. Any other tools for accessing and transferring spatial data over the web could also be of interest.
Documentation of PostgreSQL is extensive. An active community offers support to users. The Open Source Geospatial foundation (OSGeo) provides a list over companies that yield commercial support and hosting (OSGeo 2013). Besides a secure authentication, communication between client and server can be encrypted and furthermore the database itself can also be encrypted using the pgCrypto extension. PostGIS supports all Feature Manipulation Engine (FME) formats and makes spatial data easy to be analysed, visualised and published on the web via map servers like GeoServer and MapServer (Ramsey 2006).
As PostGIS supports a well of map servers, has an extensive library for spatial functionality, and supports important Open Geospatial Consortium (OGC) standards (Boston GIS 2013), PostGIS is found as the best choice. This especially because of extensive geometry output functions of particular importance for web-development when using various JavaScript APIs (Boston GIS 2013). The administrator user interface for PostGIS is intuitive and easy to navigate. The main options, Microsoft (MS) SQL Server 2008 included in the Microsoft Server license and the open source database MySQL, have been left out mainly because of less spatial functionality.
30
3.4.2 PHP for database access
PHP is a powerful open-source server scripting language for making dynamic and interactive web pages. One of the defining features of PHP is the ease for developers to connect and manipulate a database. PHP prepares the functions for database manipulation however the database management is done by SQL (Supaartagorn 2011). PHP works fine together with HTML to make web sites adjust and interact with the user. What distinguishes PHP from client-side JavaScript is that the code is executed on the server, generating HTML which is then sent to the client. The PHP code, stored in PHP-files, is also hidden for users accessing the website. PHP can therefore give some security for usernames and passwords when PHP is used to connect to databases and manage data stored in a database.
PHP is chosen as a part of the smartphone PPGIS because this has been used together with HTML web applications for a long time and an extensive number of samples are available for use in system design. Forms in JavaScript also assist efficiently to bring data into the database. Many open source examples to access and exploit on web like e.g. www.Github.com (searching for PHP give 10-fold the results compared to Application Service Provider (ASP). Results were found to be 69.858 and 6.579 respectively, 1. Dec 2013). Based on this, PHP is chosen as scripting language among many alternatives giving similar support. The different solutions utilizing PHP in the prototype will be presented in Chapter 5.3.
3.5 GeoServer and Web Map Services Web Map Services is an essential part of the prototype that should be developed in this project. A number of standards are set for how to set up map services, e.g WMS, WFS (Web Feature Service), and WFS-T (Transactional Web Feature Service). WMS set grounds for us to include an enormous amount of spatial data into our web application. Without knowing much on the given technology behind the different services or the data models of the spatial data, defined maps and spatial information can be brought into our application together with our own data. WFS-T especially opens for transfer of spatial data between server and client. We here shortly present the relevant standards before giving an introduction to the GeoServer software as one of the essential parts of our prototype.
3.5.1 WMS and WFS
WMS specifies a standard for requests and responses to give map visualizations, specified by OGC (OGC 2006). WMS is broadly used and supported by most web browsers (Fu & Sun 2010), and mainly respond to the requests by sending a georeferenced picture to be included in a map visualization. The map can then be established by several WMS responses plus other georeferenced data to in sum give the wanted visualization of a geographic area.
The WMS standard defines geospatial related data from three operators:
• GetCapabilities gives the service metadata, as a description of which map information’s that the service offers and which queries parameters it accepts.
• GetMap creates and returns a map based on parameters. • GetFeatureInfo returns the attribute information’s of the individual object.
31
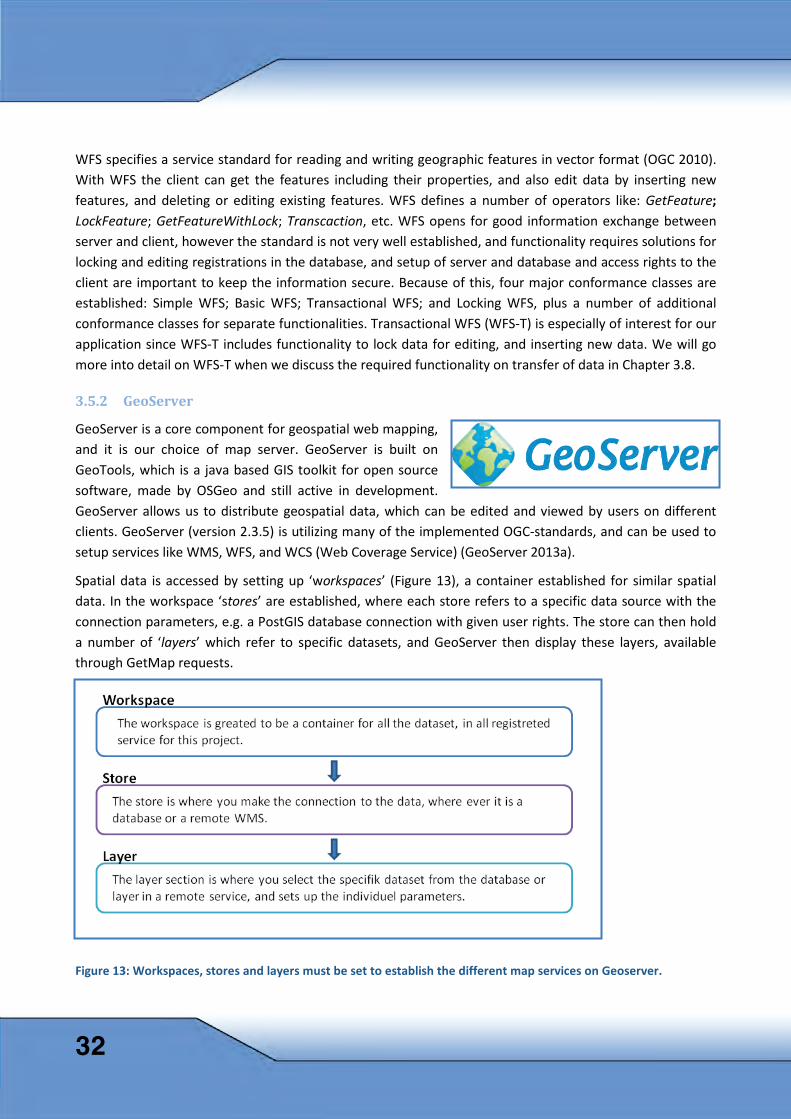
WFS specifies a service standard for reading and writing geographic features in vector format (OGC 2010). With WFS the client can get the features including their properties, and also edit data by inserting new features, and deleting or editing existing features. WFS defines a number of operators like: GetFeature; LockFeature; GetFeatureWithLock; Transcaction, etc. WFS opens for good information exchange between server and client, however the standard is not very well established, and functionality requires solutions for locking and editing registrations in the database, and setup of server and database and access rights to the client are important to keep the information secure. Because of this, four major conformance classes are established: Simple WFS; Basic WFS; Transactional WFS; and Locking WFS, plus a number of additional conformance classes for separate functionalities. Transactional WFS (WFS-T) is especially of interest for our application since WFS-T includes functionality to lock data for editing, and inserting new data. We will go more into detail on WFS-T when we discuss the required functionality on transfer of data in Chapter 3.8.
3.5.2 GeoServer
GeoServer is a core component for geospatial web mapping, and it is our choice of map server. GeoServer is built on GeoTools, which is a java based GIS toolkit for open source software, made by OSGeo and still active in development. GeoServer allows us to distribute geospatial data, which can be edited and viewed by users on different clients. GeoServer (version 2.3.5) is utilizing many of the implemented OGC-standards, and can be used to setup services like WMS, WFS, and WCS (Web Coverage Service) (GeoServer 2013a).
Spatial data is accessed by setting up ‘workspaces’ (Figure 13), a container established for similar spatial data. In the workspace ‘stores’ are established, where each store refers to a specific data source with the connection parameters, e.g. a PostGIS database connection with given user rights. The store can then hold a number of ‘layers’ which refer to specific datasets, and GeoServer then display these layers, available through GetMap requests.
Figure 13: Workspaces, stores and layers must be set to establish the different map services on Geoserver.
32
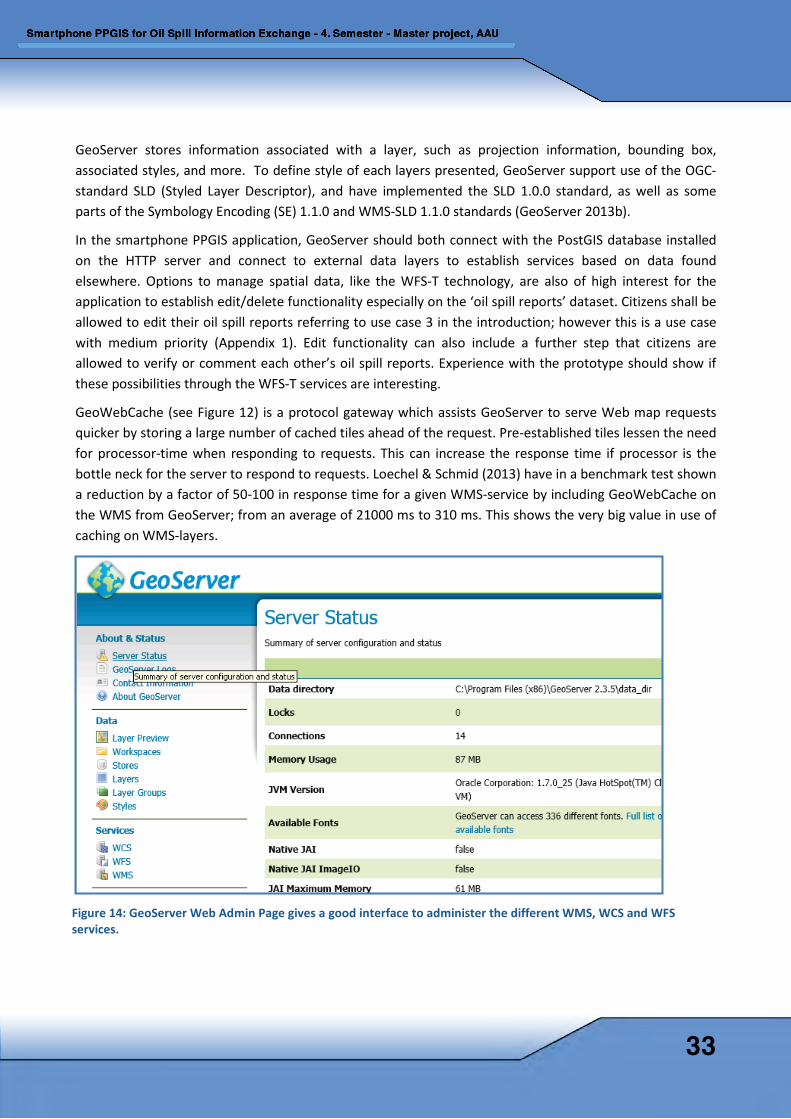
GeoServer stores information associated with a layer, such as projection information, bounding box, associated styles, and more. To define style of each layers presented, GeoServer support use of the OGC-standard SLD (Styled Layer Descriptor), and have implemented the SLD 1.0.0 standard, as well as some parts of the Symbology Encoding (SE) 1.1.0 and WMS-SLD 1.1.0 standards (GeoServer 2013b).
In the smartphone PPGIS application, GeoServer should both connect with the PostGIS database installed on the HTTP server and connect to external data layers to establish services based on data found elsewhere. Options to manage spatial data, like the WFS-T technology, are also of high interest for the application to establish edit/delete functionality especially on the ‘oil spill reports’ dataset. Citizens shall be allowed to edit their oil spill reports referring to use case 3 in the introduction; however this is a use case with medium priority (Appendix 1). Edit functionality can also include a further step that citizens are allowed to verify or comment each other’s oil spill reports. Experience with the prototype should show if these possibilities through the WFS-T services are interesting.
GeoWebCache (see Figure 12) is a protocol gateway which assists GeoServer to serve Web map requests quicker by storing a large number of cached tiles ahead of the request. Pre-established tiles lessen the need for processor-time when responding to requests. This can increase the response time if processor is the bottle neck for the server to respond to requests. Loechel & Schmid (2013) have in a benchmark test shown a reduction by a factor of 50-100 in response time for a given WMS-service by including GeoWebCache on the WMS from GeoServer; from an average of 21000 ms to 310 ms. This shows the very big value in use of caching on WMS-layers.
Figure 14: GeoServer Web Admin Page gives a good interface to administer the different WMS, WCS and WFS services.
33
GeoServer also comes with a number of extensions (GeoServer 2013c) where we especially find the INSPIRE (INfrastructure for SPatial InfoRmation in Europe) extension and the export of reports on Excel format to be possible elements for the prototype, as well as possible support for creation time series of data in map services, which is under development (GeoServer 2013d). The INSPIRE-extension can be found to assist in support of transnational solutions for information exchange, and the excel-format is highly valuable as format to citizens with an interest in looking more into the data available, more than just seeing the reports on the map. Time series can be used to show the change in situation over time to the citizens in a very good way. GeoServer is found to be a good tool to establish the smartphone PPGIS prototype, and also promising to solve possible future user- and system requirements.
Opposed to alternatives GeoServer was chosen for our prototype development because it has a good Web Admin Page for administration (Figure 14), and follows the various web mapping standards closely. It’s also found to be the most supported web map server at the moment at the international conference for open source GIS software (FOSS4G8 September 2013, Nottingham), with a big team of volunteering developers.
3.6 Leaflet The Leaflet JS is a library that generates the map interface by using JavaScript. Leaflet is a very young and modern open source library that is developed by Vladimir Agafonkin and his team (Derrough 2013). Leaflet differs from many other map API’s with the high focus on elements like performance, usability, simplicity and full mobile support, with the tiny size of only 33KB of JS-code (Leaflet 2013a).
For this system design Leaflet version 0.6.2 is included into the local file structure, making it easy also to modify parts of the library if necessary for this project. This version was released as a stable version 26. June 2013. Leaflet is used for the XYupdate.html and the map page. A combination of Leaflet, jQuery and jQuery mobile is basis for XYupdate.html (Chapter 5.3.2), while Leaflet together with jQuery, excluding jQuery mobile, is basis for the map page (Chapter 5.4). Leaflet is a leight weighted library, and solve this very well by having a small kernel library, and then offers over 90+ of third-party functionalities extensions as addons and plugins. This structure makes Leaflet flexible for system design for specific applications, opposed to other map code libraries like Open Layers which consist of a much larger kernel.
Leaflet is found as the best choice for this project, because of the high performance from a small code library. Limited internet access in the field over mobile networks (Verup et al. 2013b) makes the amount of code and data transfer very important for the performance. The small Leaflet code bundle will support a good user experience, with an effective application, and minimizing the users pain caused by waiting and download errors (Chapter 3.2.2). This project aims for the smartphone users, which fits perfect into to the focus areas of the Leaflet development community. As the prototype is a mobile web application it is
8 FOSS4G (Free and Open Source Software for Geospatial)
34

important for the prototype to support as many browsers as possible, to prevent a bad user experience. Leaflet supports all the major mobile browsers (Leaflet 2013a):
• Safari for iOS 3–7+ • Android browser 2.2+, 3.1+, 4+ • Chrome for Android 4+ and iOS • Firefox for Android • Other WebKit browsers (webOS, Blackberry 7+, etc.) • IE10/11 for Win8 devices
The Leaflet’s DOM support is bringing a good framework for this project, and it is overlapping fine with jQuery (Chapter 3.7). The map is using the full screen, which is very important for small devices. The DOM also has good placing of buttons and the layer control. When creating new buttons, it is important to include these as part of the Leaflets DOM, so the overall design stays familiar and easy to use for the user.
The Leaflet library comes with a set of standard features (http://leafletjs.com/features.html). In this project we introduce some of the major features needed, based on the given user and system requirements (Chapter 1). The signature of Leaflet API is ‘L.’. This is used in front of all the functionalities which are part of the Leaflet API.
In the map we have used WMS layers, tiled WMS layers, and vector layers, which represent 3 different ways of adding map layers with Leaflet, which are further described in Chapter 5.4.4. Features from vector layers will hold information for each individual feature. This information can easily be shown on the display by using popup (L.popup) functionality, when they are introduced as markers (L.markers). They will reveal when touching/clicking the feature.
Leaflet also comes with a set of already defined projections, and include the transformation of geographical points to the most common CRS used on web maps - Spherical Mercator projection (EPSG:3857). This makes it easy to add spatial data with georeference (WGS84). Some further transformations are included in the plugin Proj4Leaflet, however we find GeoServer to have better support for transformation, and being a preferred element to use for possible transformations.
As most other maps, Leaflet brings a set of standard buttons for map control: • Zoom buttons • Attribution, to show feature attributions • Layer switcher • Scale
These map controls are standard part of the code, but only the zoom buttons and the attribution function are brought into the standard frontend. The layer switcher and scale must be activated and added as layers to be visualized in the frontend. Leaflet also comes with some interaction features which primarily increase the user experience on touch units. These features are multi-touch zoom, double tap zoom and different various events, like clicking and context-menu etc.
35
To increase the performance in Leaflet, some other features are built into the Leaflet code. These are hardware acceleration in iOS, utilizing CSS3 features to make panning and zooming really smooth, smart polyline/polygon rendering with dynamic simplification, a modular design and a build system which allows you to reduce the library size by leaving out features you not needed. Also worth mentioning, a tap delay elimination on mobile devices makes controls and layers respond to taps immediately. All these features improve the user experience especially on mobile units and smartphones. This project does not contain any of the Leaflet plugins, but they are found easy to add in when needed. For example the Leaflet.markercluster by Danzel posted for free on GitHub, would support a cluster-functionally which could be a further development of the prototype to better show information if a large number of oil spill reports are received from the application users.
Altogether the Leaflet is found as a brilliant code-library for development of maps and map functionality for a smartphone PPGIS for oil spill information exchange.
3.7 jQuery and jQuery Mobile jQuery is an open source library that is split up in different sections and purposes to make the individual library small and fast. All libraries are feature-rich and made on JavaScript, which handles events, animations and Ajax in a much simpler way than writing a new Java-code from the basic. The API works cross a multitude of browsers, which is a great force with all the different browsers that are in use today. With jQuery, our project gets a quick start by including jQuery themes and ordering them in the different sections of the HTML pages. The jQuery foundation being responsible for further development of the code-library jQuery, also holds other projects which add functionality to the basic jQuery (jQuery Foundation 2013a):
• jQuery user interface - A set of user interface interactions, effects, widgets, and themes built on top of the jQuery JavaScript
• QUnit js unit testing - A powerful, easy-to-use JavaScript unit testing framework • Sizzle CSS selector engine - A standalone CSS selector engine designed to be easily dropped in to a
host library. • jQuery mobile - a HTML5-based user interface system designed to make responsive web sites and
apps that are accessible on all smartphone, tablet and desktop devices.
In the application we use the basic jQuery plus the jQuery mobile framework which holds the Themeroller system, to make a responsive web site. The Themeroller system makes it possible to create themes unique for a given project. The Themeroller also gives a system designer a very good start on the application, because it is a downloadable builder that is customized for high performance with limited amount of data transferred over the web. The builder generates a custom JavaScript-file, along with a full structured style sheet, which can be published including all the given properties for the chosen design. The result therefore includes a very limited part of all optional code from jQuery mobile, and suits the limited bandwidth which mobile networks offer in many situations.
36
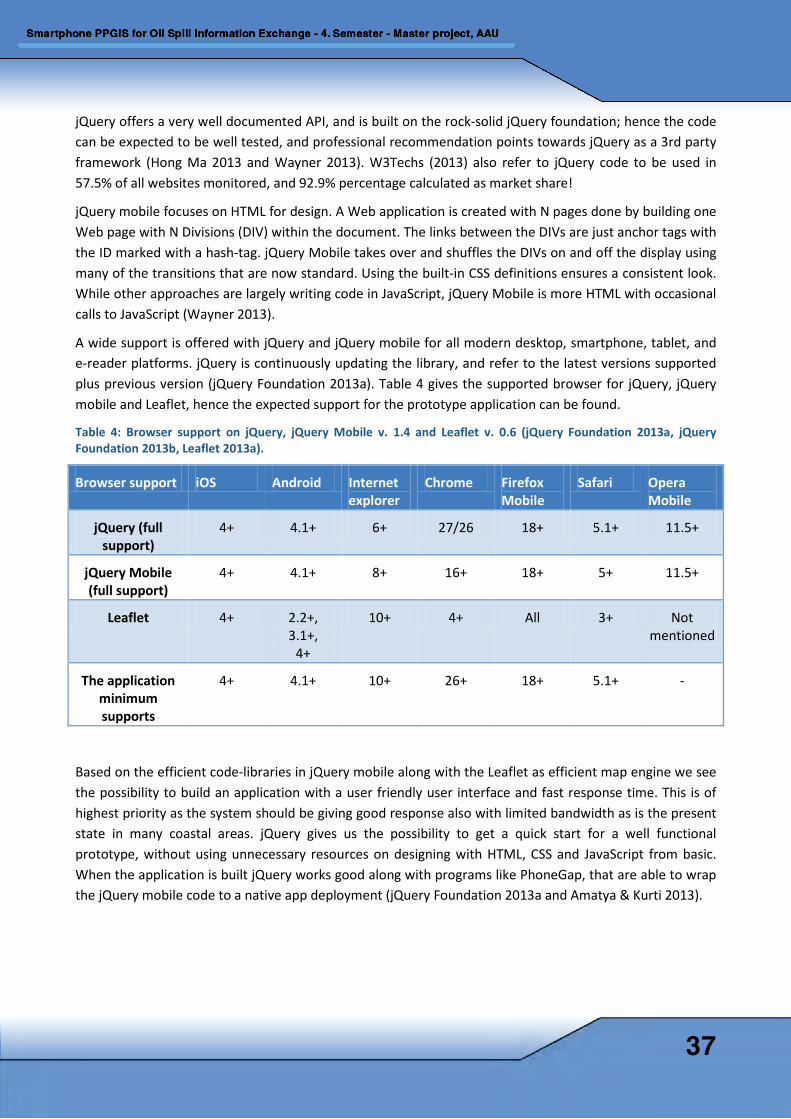
jQuery offers a very well documented API, and is built on the rock-solid jQuery foundation; hence the code can be expected to be well tested, and professional recommendation points towards jQuery as a 3rd party framework (Hong Ma 2013 and Wayner 2013). W3Techs (2013) also refer to jQuery code to be used in 57.5% of all websites monitored, and 92.9% percentage calculated as market share!
jQuery mobile focuses on HTML for design. A Web application is created with N pages done by building one Web page with N Divisions (DIV) within the document. The links between the DIVs are just anchor tags with the ID marked with a hash-tag. jQuery Mobile takes over and shuffles the DIVs on and off the display using many of the transitions that are now standard. Using the built-in CSS definitions ensures a consistent look. While other approaches are largely writing code in JavaScript, jQuery Mobile is more HTML with occasional calls to JavaScript (Wayner 2013).
A wide support is offered with jQuery and jQuery mobile for all modern desktop, smartphone, tablet, and e-reader platforms. jQuery is continuously updating the library, and refer to the latest versions supported plus previous version (jQuery Foundation 2013a). Table 4 gives the supported browser for jQuery, jQuery mobile and Leaflet, hence the expected support for the prototype application can be found.
Table 4: Browser support on jQuery, jQuery Mobile v. 1.4 and Leaflet v. 0.6 (jQuery Foundation 2013a, jQuery Foundation 2013b, Leaflet 2013a).
Browser support iOS Android Internet explorer
Chrome Firefox Mobile
Safari Opera Mobile
jQuery (full support)
4+ 4.1+ 6+ 27/26 18+ 5.1+ 11.5+
jQuery Mobile (full support)
4+ 4.1+ 8+ 16+ 18+ 5+ 11.5+
Leaflet 4+ 2.2+, 3.1+,
4+
10+ 4+ All 3+ Not mentioned
The application minimum supports
4+ 4.1+ 10+ 26+ 18+ 5.1+ -
Based on the efficient code-libraries in jQuery mobile along with the Leaflet as efficient map engine we see the possibility to build an application with a user friendly user interface and fast response time. This is of highest priority as the system should be giving good response also with limited bandwidth as is the present state in many coastal areas. jQuery gives us the possibility to get a quick start for a well functional prototype, without using unnecessary resources on designing with HTML, CSS and JavaScript from basic. When the application is built jQuery works good along with programs like PhoneGap, that are able to wrap the jQuery mobile code to a native app deployment (jQuery Foundation 2013a and Amatya & Kurti 2013).
37
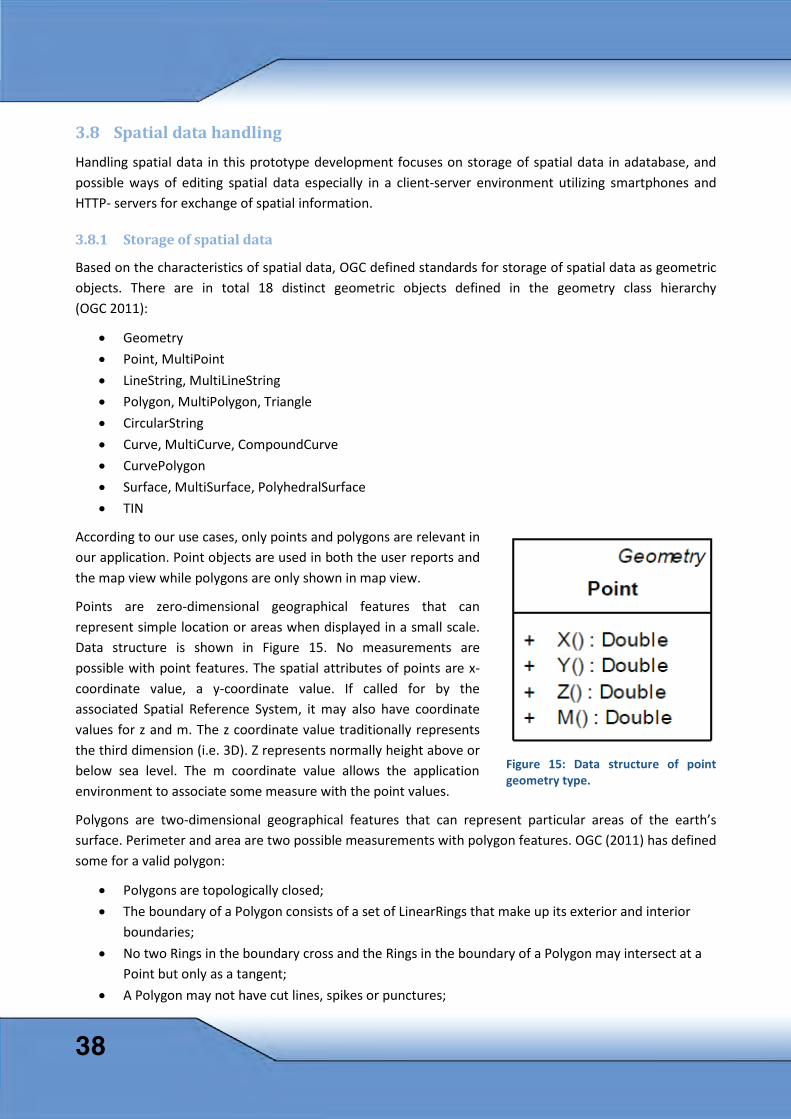
3.8 Spatial data handling Handling spatial data in this prototype development focuses on storage of spatial data in adatabase, and possible ways of editing spatial data especially in a client-server environment utilizing smartphones and HTTP- servers for exchange of spatial information.
3.8.1 Storage of spatial data
Based on the characteristics of spatial data, OGC defined standards for storage of spatial data as geometric objects. There are in total 18 distinct geometric objects defined in the geometry class hierarchy (OGC 2011):
• Geometry • Point, MultiPoint • LineString, MultiLineString • Polygon, MultiPolygon, Triangle • CircularString • Curve, MultiCurve, CompoundCurve • CurvePolygon • Surface, MultiSurface, PolyhedralSurface • TIN
According to our use cases, only points and polygons are relevant in our application. Point objects are used in both the user reports and the map view while polygons are only shown in map view.
Points are zero-dimensional geographical features that can represent simple location or areas when displayed in a small scale. Data structure is shown in Figure 15. No measurements are possible with point features. The spatial attributes of points are x-coordinate value, a y-coordinate value. If called for by the associated Spatial Reference System, it may also have coordinate values for z and m. The z coordinate value traditionally represents the third dimension (i.e. 3D). Z represents normally height above or below sea level. The m coordinate value allows the application environment to associate some measure with the point values.
Polygons are two-dimensional geographical features that can represent particular areas of the earth’s surface. Perimeter and area are two possible measurements with polygon features. OGC (2011) has defined some for a valid polygon:
• Polygons are topologically closed; • The boundary of a Polygon consists of a set of LinearRings that make up its exterior and interior
boundaries; • No two Rings in the boundary cross and the Rings in the boundary of a Polygon may intersect at a
Point but only as a tangent; • A Polygon may not have cut lines, spikes or punctures;
Figure 15: Data structure of point geometry type.
38
• The interior of every Polygon is a connected point set; • The exterior of a Polygon with 1 or more holes is not connected. Each hole defines a connected
component of the exterior.
In OpenGIS Implementation Standard of Geographic information (OGC 2011), Well-known text (WKT) is defined to be used both to construct new instances of geometry type and to convert existing instances to textual form for alphanumeric display. In practical, WKT is a text markup language for human reading and represents vector geometry objects on a map, spatial reference systems of spatial objects and transformations between spatial reference systems. At the same document, well-known Binary (WKB) is defined. On the contrary of WKT, WKB is designed for computer reading and provides a portable representation of a geometric object as a continuous stream of bytes. It permits geometric object to be exchanged between an SQL client and an SQL-implementation in binary form. Based on the characteristics of spatial data described in Chapter 3.1.1, many database systems have adapted or extended including spatial features and functions. WKB is now supported in most spatial database systems such as PostGIS and Microsoft SQL Server. In the system design practice, WKT is often used in SQL scripts, while WKB is the binary data saved in a spatial database.
3.8.2 Online editing of spatial data
Online editing of spatial data requires directly access to the data set. As for now, the popular ways to handle the request are transactional Web Feature Service (WFS-T) and GeoJSON (Geographical JavaScript Object Notation).
WFS-T is a web service that first allows spatial data to be presented in different format. Moreover it allows creation, deletion, and updating of spatial features. Data passed between a Web Feature Server and a client is encoded with Geography Markup Language (GML), an Extensible Markup Language (XML) dialect which can be used to model geographic features. WFS-T is official and standardized way to access vector data, which means it is widely support by servers, clients and applications. As a service, advanced filtering capabilities are already included.
GeoJSON is a geospatial data interchange format based on JavaScript Object Notation (JSON). It supports most of the geometric objects mentioned in Chapter 3.1: ‘Point’, ‘MultiPoint’, ‘LineString’, ‘MultiLineString’, ‘Polygon’, ‘MultiPolygon’, or ‘GeometryCollection’ (GeoJSON.org 2013). GeoJSON is supported by major mapping and GIS software packages, including OpenLayers, Leaflet and GeoServer. GeoJSON can also be used with PostGIS, which handle the format via the GDAL (Geospatial Data Abstraction Library) OGR (OpenGIS simple features Reference implementation) conversion library. Bing Maps, Yahoo! and Google also support GeoJSON in their API services.
GeoJSON is not a service, but a data format. In other words, it exposes the whole data set as plain text (see code example below). GeoJSON is more flexible in revising individual data and customize data presentation and application.
3.9 The Adaptive WebGIS solution Adaptive is a WebGIS solution developed by the Norwegian IT/GIS company Asplan Viak Internet AS. Adaptive is used as the main WebGIS solution in the NCA – http://kart.kystverket.no.
39
Adaptive is a product built up with basis in the three open source components: MapServer and PostGIS as map server and database respectively; and the JavaScript library OpenLayers as front end map engine. In addition, the GDAL/OGR toolset is also a major part of Adaptive for manipulation of raster and vector data. Adaptive has been used as NCA’s main WebGIS solution since 2004, and is continuously developed and adjusted to NCA specific needs.
The major advantages with Adaptive is that it provides capabilities to easily set up new GUI adjusted to a specific task or field of study, capturing and edit data through a user friendly GUI, and its scalabilities regarding no limitation of number of instances one can install within the licence agreement. The latter is a huge advantage in relation to scaling the solution, establishing of redundant environment etc., without incurring increased licensing costs.
In this project, Adaptive is used to set up a WMS of a dataset showing status for NCA’s oil spill cleanup operation during the Godafoss accident in 2012. This accident is used as case for our app showing status for the subsequent cleanup operation, and these data, made available as a WMS for consumption in the smartphone PPGIS application, thus represent the real data from this accident.
Adaptive is also used as framework for conceptualising a solution for NCA to verify and managing the oil spill reports submitted from the smartphone PPGIS application (Chapter 5.5).
In addition to Adaptive, NCA have GI infrastructure from ESRI, including the WebGIS solution framework Geocortex Essentials. Adaptive however, is chosen for the above mentioned tasks because NCA’s oil spill emergency department have used Adaptive the last years as support tool, and because the use and of it will increase in the near future because this framework is chosen for development of a new comprehensive map-based emergency support system that includes mobile solutions. A conceptualizing within this framework is therefore the closest up to NCA’s existing solutions that we come.
3.10 Summing up GI technology GI technologies discussed above cover all the needs for building our mobile application in a server-client structure. As for server side, we choose Apache for providing HTTP service and GeoServer for providing web map service. As for client side, we are fully aware of the cross browser capabilities and choose HTML5, CSS and jQuery (JavaScript) combination for design the user interface.
Based on characteristics of spatial data, PostGIS is chosen for spatial data management. Leaflet map control is applied for presentation of the geometric objects from Web map services. By applying PHP script, data communication between mobile clients and spatial database on the server is assured by scalability and performance.
In the following two chapters, the prototype application, utilizing these technologies, is discussed in depth together with detailed descriptions of our system design.
40
4 Server side setup The documentation of the server side setup in this chapter and the presentation of the smartphone application in the next chapter are tightly connected and together gives the implementation of a prototype, hence the chapters should be read together in order to achieve the insight of system build-up.
This chapter presents the all the server side setups that supports the functional prototype. Web server Apache, web map server GeoServer, spatial database PostGIS and data model of prototype is documented. How images are handled as data elements on server is also included. Data communications among server software is described in depth focusing on use of server side scripting like PHP. However, before starting the presentation of the GIS elements, we present the overall structure for the spatial reference as this is a major issue concerning all the GIS elements and how they handle spatial reference for the spatial information.
4.1 Handling spatial data in the prototype Several sets of spatial data are to be included in the prototype, and with different spatial references. Spatial data should be shown in a good manner to the users, and should be a combination of data from different sources. The spatial data include base maps, spatial data produced by the users (reports of oil spill), and spatial data presenting the situation of the clean-up operation. The application should also work cross country. Based on these requirements a projection to work well in at least all Scandinavian countries is chosen as bases for the map user interface. To lessen the burden for transformations of base maps, which can cause heavy processing and extra setup of software, we found the main projection supported by open source map layers to be best practice. This gives a minor drawback that national WMS-services of interest eventually must be transformed if they should be included, as they use CRS’ best performing for each nation. The requirements of the prototype however do not imply need of the most updated satellite or aerial photos. The open source base maps are also found to give a good presentation of the places we have checked within Norway and Denmark. The choice in the prototype has therefore been to use the Web Mercator projection (EPSG:3857) for the map page in the web map page (Figure 16).
For the oil spill reports produced on the smartphone the location variable can be established in three possible ways (Chapter 5.3). The location variable will however always be sent from the smartphone in geographic coordinates (EPSG:4326). This was chosen as the location for reports from the smartphones to the spatial database to limit the change in precision caused by any transformation in the original stored in the database. The GeoServer establish map services to include spatial data into the smartphone application. These services are set to deliver pictures (WMS) with the Web Mercator projection so they can be combined with the base map layers, hence transformation of the different data sources are needed within GeoServer.
41
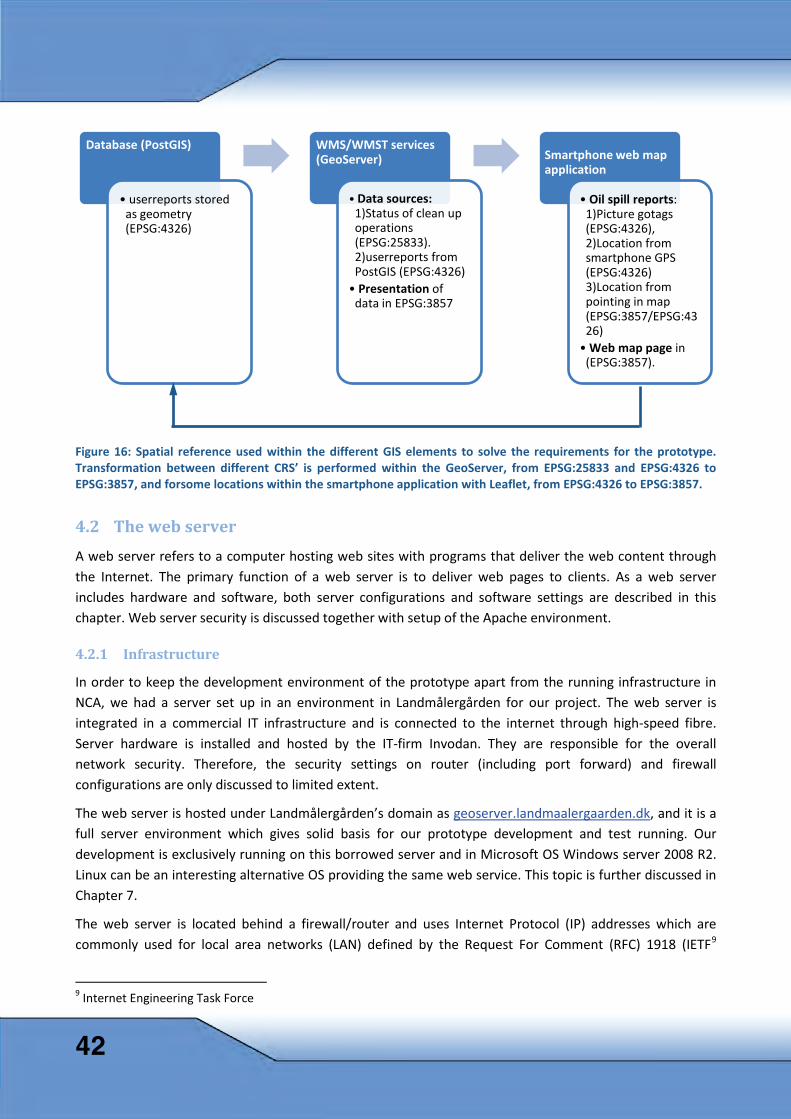
Figure 16: Spatial reference used within the different GIS elements to solve the requirements for the prototype. Transformation between different CRS’ is performed within the GeoServer, from EPSG:25833 and EPSG:4326 to EPSG:3857, and forsome locations within the smartphone application with Leaflet, from EPSG:4326 to EPSG:3857.
4.2 The web server A web server refers to a computer hosting web sites with programs that deliver the web content through the Internet. The primary function of a web server is to deliver web pages to clients. As a web server includes hardware and software, both server configurations and software settings are described in this chapter. Web server security is discussed together with setup of the Apache environment.
4.2.1 Infrastructure
In order to keep the development environment of the prototype apart from the running infrastructure in NCA, we had a server set up in an environment in Landmålergården for our project. The web server is integrated in a commercial IT infrastructure and is connected to the internet through high-speed fibre. Server hardware is installed and hosted by the IT-firm Invodan. They are responsible for the overall network security. Therefore, the security settings on router (including port forward) and firewall configurations are only discussed to limited extent.
The web server is hosted under Landmålergården’s domain as geoserver.landmaalergaarden.dk, and it is a full server environment which gives solid basis for our prototype development and test running. Our development is exclusively running on this borrowed server and in Microsoft OS Windows server 2008 R2. Linux can be an interesting alternative OS providing the same web service. This topic is further discussed in Chapter 7.
The web server is located behind a firewall/router and uses Internet Protocol (IP) addresses which are commonly used for local area networks (LAN) defined by the Request For Comment (RFC) 1918 (IETF9
9 Internet Engineering Task Force
Database (PostGIS)
• userreports stored as geometry (EPSG:4326)
WMS/WMST services (GeoServer)
• Data sources: 1)Status of clean up operations (EPSG:25833). 2)userreports from PostGIS (EPSG:4326) • Presentation of
data in EPSG:3857
Smartphone web map application
• Oil spill reports: 1)Picture gotags (EPSG:4326), 2)Location from smartphone GPS (EPSG:4326) 3)Location from pointing in map (EPSG:3857/EPSG:4326) • Web map page in
(EPSG:3857).
42
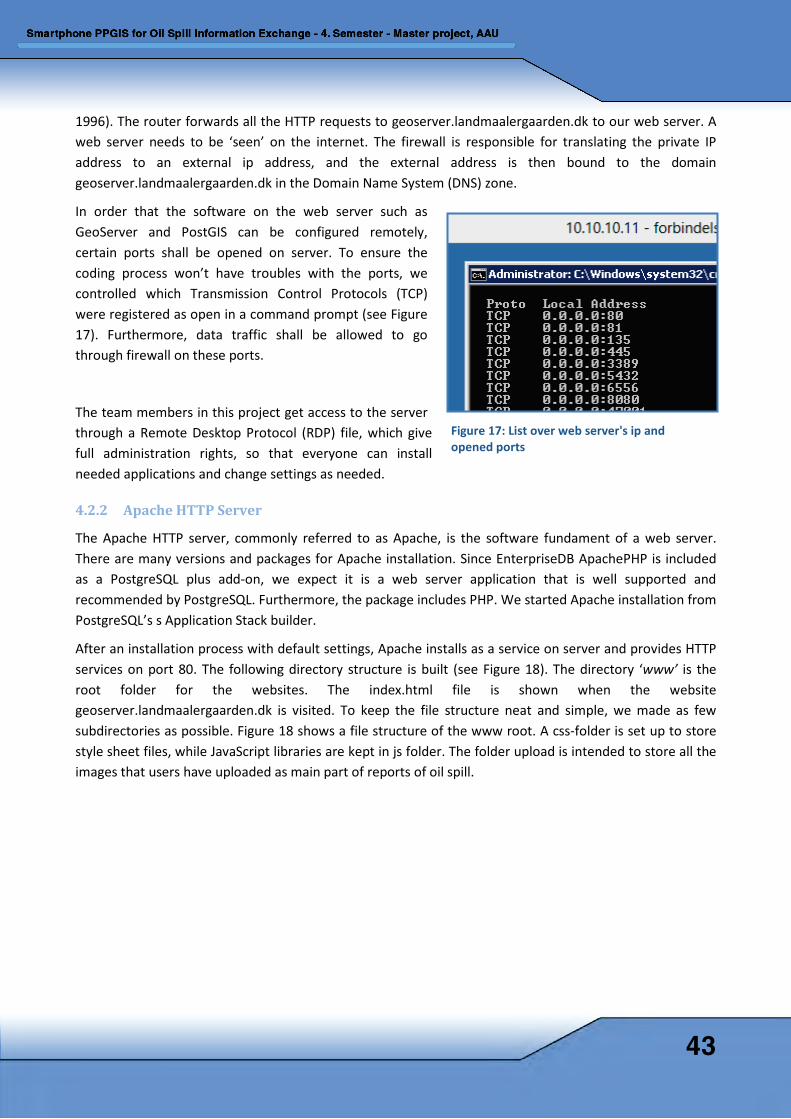
Figure 17: List over web server's ip and opened ports
1996). The router forwards all the HTTP requests to geoserver.landmaalergaarden.dk to our web server. A web server needs to be ‘seen’ on the internet. The firewall is responsible for translating the private IP address to an external ip address, and the external address is then bound to the domain geoserver.landmaalergaarden.dk in the Domain Name System (DNS) zone.
In order that the software on the web server such as GeoServer and PostGIS can be configured remotely, certain ports shall be opened on server. To ensure the coding process won’t have troubles with the ports, we controlled which Transmission Control Protocols (TCP) were registered as open in a command prompt (see Figure 17). Furthermore, data traffic shall be allowed to go through firewall on these ports.
The team members in this project get access to the server through a Remote Desktop Protocol (RDP) file, which give full administration rights, so that everyone can install needed applications and change settings as needed.
4.2.2 Apache HTTP Server
The Apache HTTP server, commonly referred to as Apache, is the software fundament of a web server. There are many versions and packages for Apache installation. Since EnterpriseDB ApachePHP is included as a PostgreSQL plus add-on, we expect it is a web server application that is well supported and recommended by PostgreSQL. Furthermore, the package includes PHP. We started Apache installation from PostgreSQL’s s Application Stack builder.
After an installation process with default settings, Apache installs as a service on server and provides HTTP services on port 80. The following directory structure is built (see Figure 18). The directory ‘www’ is the root folder for the websites. The index.html file is shown when the website geoserver.landmaalergaarden.dk is visited. To keep the file structure neat and simple, we made as few subdirectories as possible. Figure 18 shows a file structure of the www root. A css-folder is set up to store style sheet files, while JavaScript libraries are kept in js folder. The folder upload is intended to store all the images that users have uploaded as main part of reports of oil spill.
43
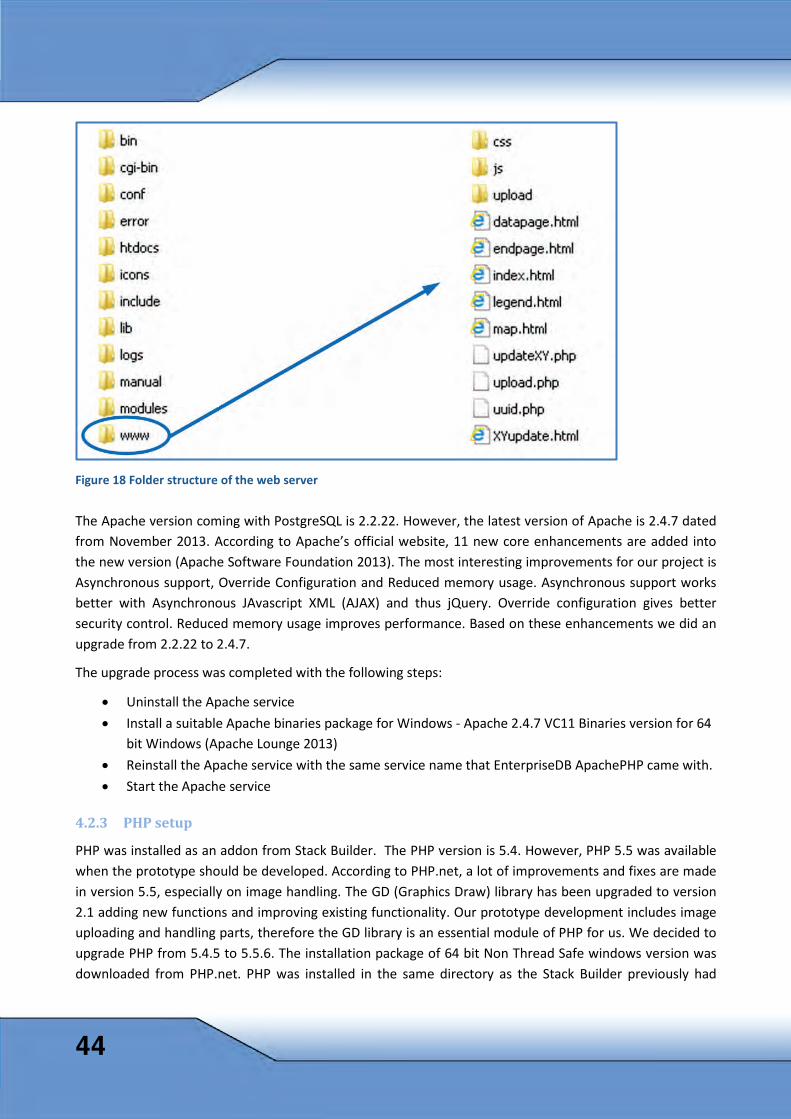
Figure 18 Folder structure of the web server
The Apache version coming with PostgreSQL is 2.2.22. However, the latest version of Apache is 2.4.7 dated from November 2013. According to Apache’s official website, 11 new core enhancements are added into the new version (Apache Software Foundation 2013). The most interesting improvements for our project is Asynchronous support, Override Configuration and Reduced memory usage. Asynchronous support works better with Asynchronous JAvascript XML (AJAX) and thus jQuery. Override configuration gives better security control. Reduced memory usage improves performance. Based on these enhancements we did an upgrade from 2.2.22 to 2.4.7.
The upgrade process was completed with the following steps:
• Uninstall the Apache service • Install a suitable Apache binaries package for Windows - Apache 2.4.7 VC11 Binaries version for 64
bit Windows (Apache Lounge 2013) • Reinstall the Apache service with the same service name that EnterpriseDB ApachePHP came with. • Start the Apache service
4.2.3 PHP setup
PHP was installed as an addon from Stack Builder. The PHP version is 5.4. However, PHP 5.5 was available when the prototype should be developed. According to PHP.net, a lot of improvements and fixes are made in version 5.5, especially on image handling. The GD (Graphics Draw) library has been upgraded to version 2.1 adding new functions and improving existing functionality. Our prototype development includes image uploading and handling parts, therefore the GD library is an essential module of PHP for us. We decided to upgrade PHP from 5.4.5 to 5.5.6. The installation package of 64 bit Non Thread Safe windows version was downloaded from PHP.net. PHP was installed in the same directory as the Stack Builder previously had
44
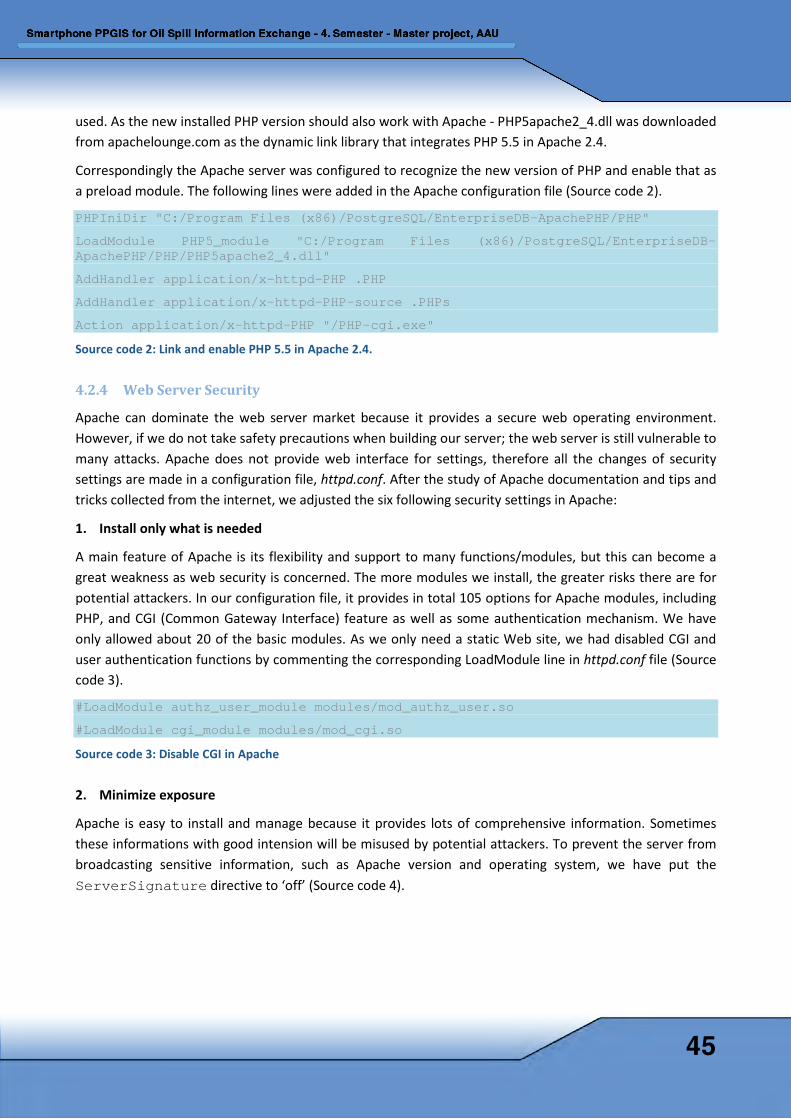
used. As the new installed PHP version should also work with Apache - PHP5apache2_4.dll was downloaded from apachelounge.com as the dynamic link library that integrates PHP 5.5 in Apache 2.4.
Correspondingly the Apache server was configured to recognize the new version of PHP and enable that as a preload module. The following lines were added in the Apache configuration file (Source code 2).
PHPIniDir "C:/Program Files (x86)/PostgreSQL/EnterpriseDB-ApachePHP/PHP"
LoadModule PHP5_module "C:/Program Files (x86)/PostgreSQL/EnterpriseDB-ApachePHP/PHP/PHP5apache2_4.dll"
AddHandler application/x-httpd-PHP .PHP
AddHandler application/x-httpd-PHP-source .PHPs
Action application/x-httpd-PHP "/PHP-cgi.exe"
Source code 2: Link and enable PHP 5.5 in Apache 2.4.
4.2.4 Web Server Security
Apache can dominate the web server market because it provides a secure web operating environment. However, if we do not take safety precautions when building our server; the web server is still vulnerable to many attacks. Apache does not provide web interface for settings, therefore all the changes of security settings are made in a configuration file, httpd.conf. After the study of Apache documentation and tips and tricks collected from the internet, we adjusted the six following security settings in Apache:
1. Install only what is needed
A main feature of Apache is its flexibility and support to many functions/modules, but this can become a great weakness as web security is concerned. The more modules we install, the greater risks there are for potential attackers. In our configuration file, it provides in total 105 options for Apache modules, including PHP, and CGI (Common Gateway Interface) feature as well as some authentication mechanism. We have only allowed about 20 of the basic modules. As we only need a static Web site, we had disabled CGI and user authentication functions by commenting the corresponding LoadModule line in httpd.conf file (Source code 3).
#LoadModule authz_user_module modules/mod_authz_user.so
#LoadModule cgi_module modules/mod_cgi.so
Source code 3: Disable CGI in Apache
2. Minimize exposure
Apache is easy to install and manage because it provides lots of comprehensive information. Sometimes these informations with good intension will be misused by potential attackers. To prevent the server from broadcasting sensitive information, such as Apache version and operating system, we have put the ServerSignature directive to ‘off’ (Source code 4).
45
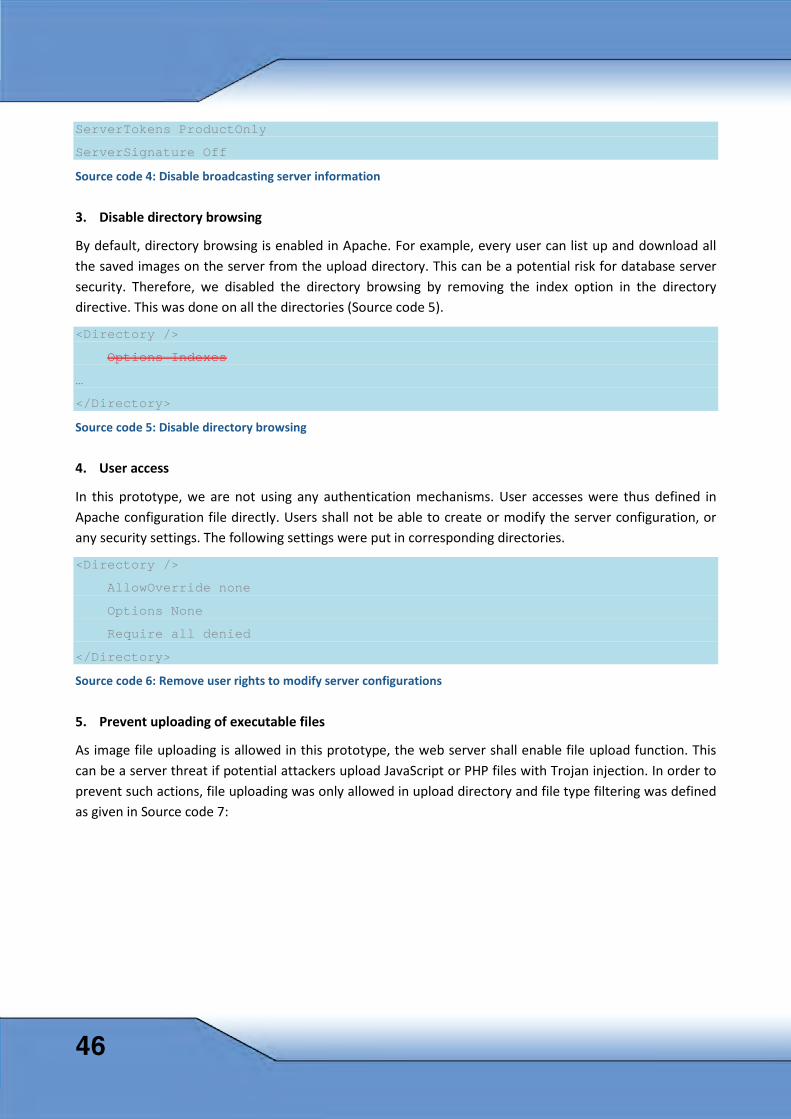
ServerTokens ProductOnly
ServerSignature Off
Source code 4: Disable broadcasting server information
3. Disable directory browsing
By default, directory browsing is enabled in Apache. For example, every user can list up and download all the saved images on the server from the upload directory. This can be a potential risk for database server security. Therefore, we disabled the directory browsing by removing the index option in the directory directive. This was done on all the directories (Source code 5).
<Directory />
Options Indexes
…
</Directory>
Source code 5: Disable directory browsing
4. User access
In this prototype, we are not using any authentication mechanisms. User accesses were thus defined in Apache configuration file directly. Users shall not be able to create or modify the server configuration, or any security settings. The following settings were put in corresponding directories.
<Directory />
AllowOverride none
Options None
Require all denied
</Directory>
Source code 6: Remove user rights to modify server configurations
5. Prevent uploading of executable files
As image file uploading is allowed in this prototype, the web server shall enable file upload function. This can be a server threat if potential attackers upload JavaScript or PHP files with Trojan injection. In order to prevent such actions, file uploading was only allowed in upload directory and file type filtering was defined as given in Source code 7:
46
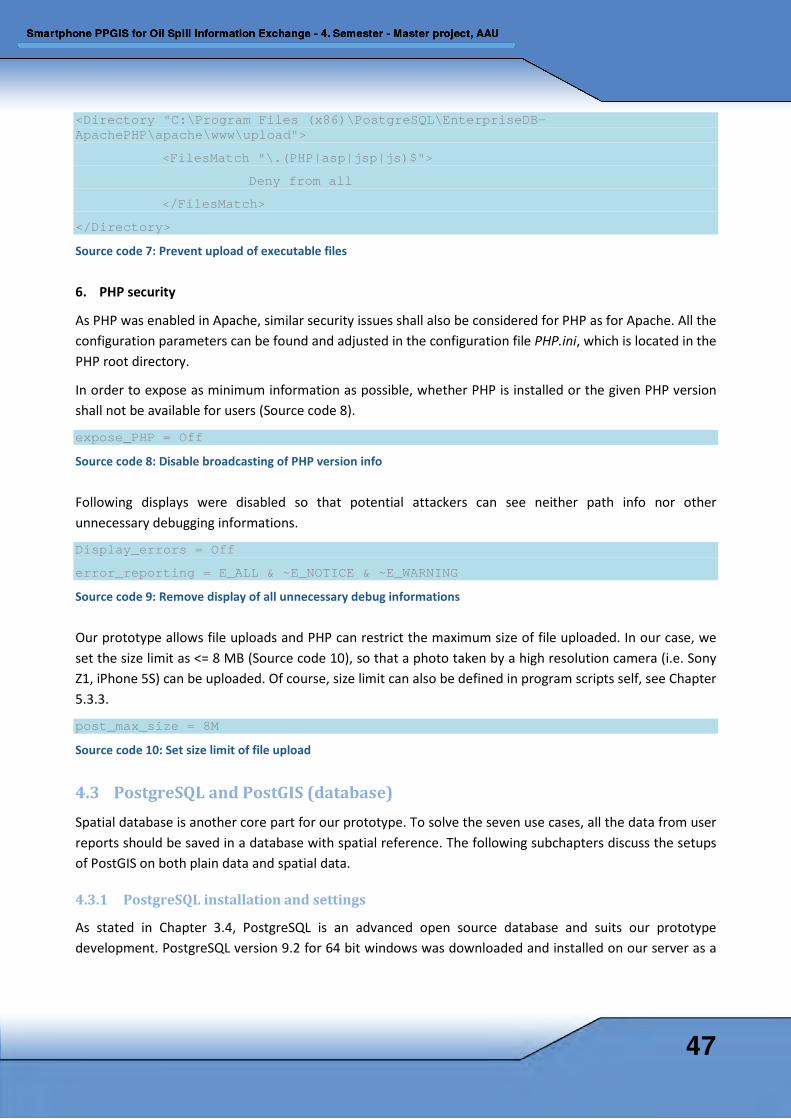
<Directory "C:\Program Files (x86)\PostgreSQL\EnterpriseDB-ApachePHP\apache\www\upload">
<FilesMatch "\.(PHP|asp|jsp|js)$">
Deny from all
</FilesMatch>
</Directory>
Source code 7: Prevent upload of executable files
6. PHP security
As PHP was enabled in Apache, similar security issues shall also be considered for PHP as for Apache. All the configuration parameters can be found and adjusted in the configuration file PHP.ini, which is located in the PHP root directory.
In order to expose as minimum information as possible, whether PHP is installed or the given PHP version shall not be available for users (Source code 8).
expose_PHP = Off
Source code 8: Disable broadcasting of PHP version info
Following displays were disabled so that potential attackers can see neither path info nor other unnecessary debugging informations.
Display_errors = Off
error_reporting = E_ALL & ~E_NOTICE & ~E_WARNING
Source code 9: Remove display of all unnecessary debug informations
Our prototype allows file uploads and PHP can restrict the maximum size of file uploaded. In our case, we set the size limit as <= 8 MB (Source code 10), so that a photo taken by a high resolution camera (i.e. Sony Z1, iPhone 5S) can be uploaded. Of course, size limit can also be defined in program scripts self, see Chapter 5.3.3.
post_max_size = 8M
Source code 10: Set size limit of file upload
4.3 PostgreSQL and PostGIS (database) Spatial database is another core part for our prototype. To solve the seven use cases, all the data from user reports should be saved in a database with spatial reference. The following subchapters discuss the setups of PostGIS on both plain data and spatial data.
4.3.1 PostgreSQL installation and settings
As stated in Chapter 3.4, PostgreSQL is an advanced open source database and suits our prototype development. PostgreSQL version 9.2 for 64 bit windows was downloaded and installed on our server as a
47
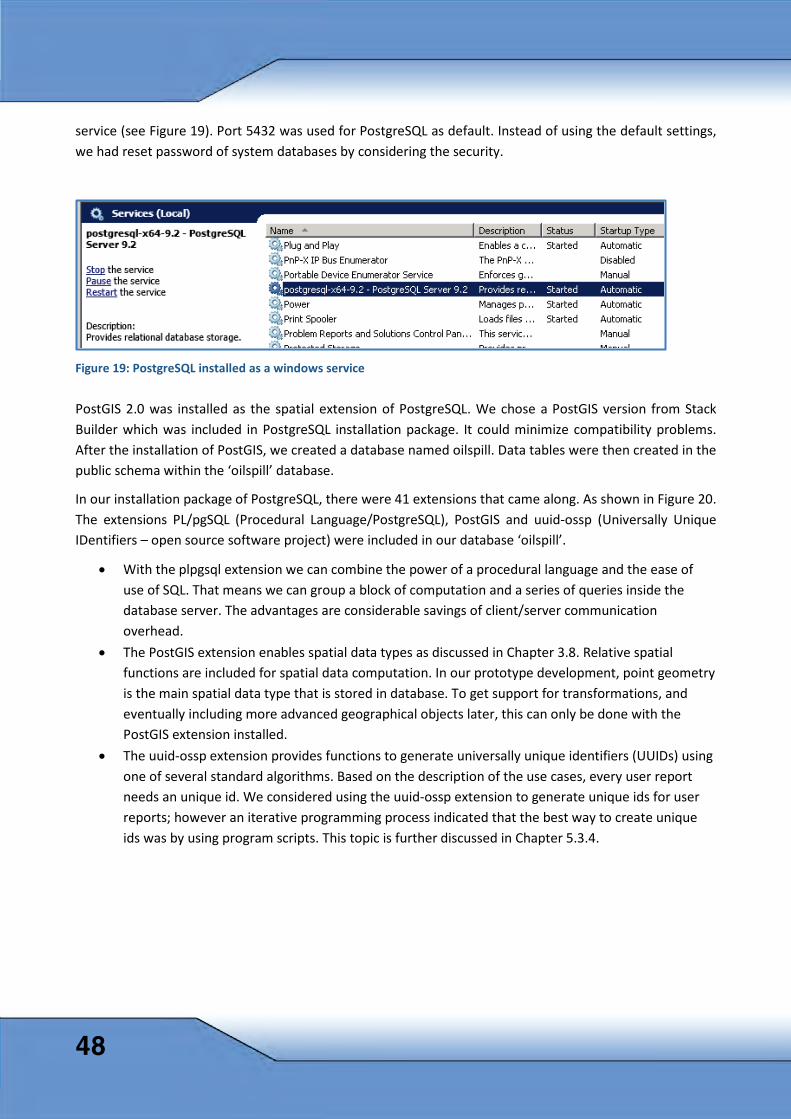
service (see Figure 19). Port 5432 was used for PostgreSQL as default. Instead of using the default settings, we had reset password of system databases by considering the security.
Figure 19: PostgreSQL installed as a windows service
PostGIS 2.0 was installed as the spatial extension of PostgreSQL. We chose a PostGIS version from Stack Builder which was included in PostgreSQL installation package. It could minimize compatibility problems. After the installation of PostGIS, we created a database named oilspill. Data tables were then created in the public schema within the ‘oilspill’ database.
In our installation package of PostgreSQL, there were 41 extensions that came along. As shown in Figure 20. The extensions PL/pgSQL (Procedural Language/PostgreSQL), PostGIS and uuid-ossp (Universally Unique IDentifiers – open source software project) were included in our database ‘oilspill’.
• With the plpgsql extension we can combine the power of a procedural language and the ease of use of SQL. That means we can group a block of computation and a series of queries inside the database server. The advantages are considerable savings of client/server communication overhead.
• The PostGIS extension enables spatial data types as discussed in Chapter 3.8. Relative spatial functions are included for spatial data computation. In our prototype development, point geometry is the main spatial data type that is stored in database. To get support for transformations, and eventually including more advanced geographical objects later, this can only be done with the PostGIS extension installed.
• The uuid-ossp extension provides functions to generate universally unique identifiers (UUIDs) using one of several standard algorithms. Based on the description of the use cases, every user report needs an unique id. We considered using the uuid-ossp extension to generate unique ids for user reports; however an iterative programming process indicated that the best way to create unique ids was by using program scripts. This topic is further discussed in Chapter 5.3.4.
48
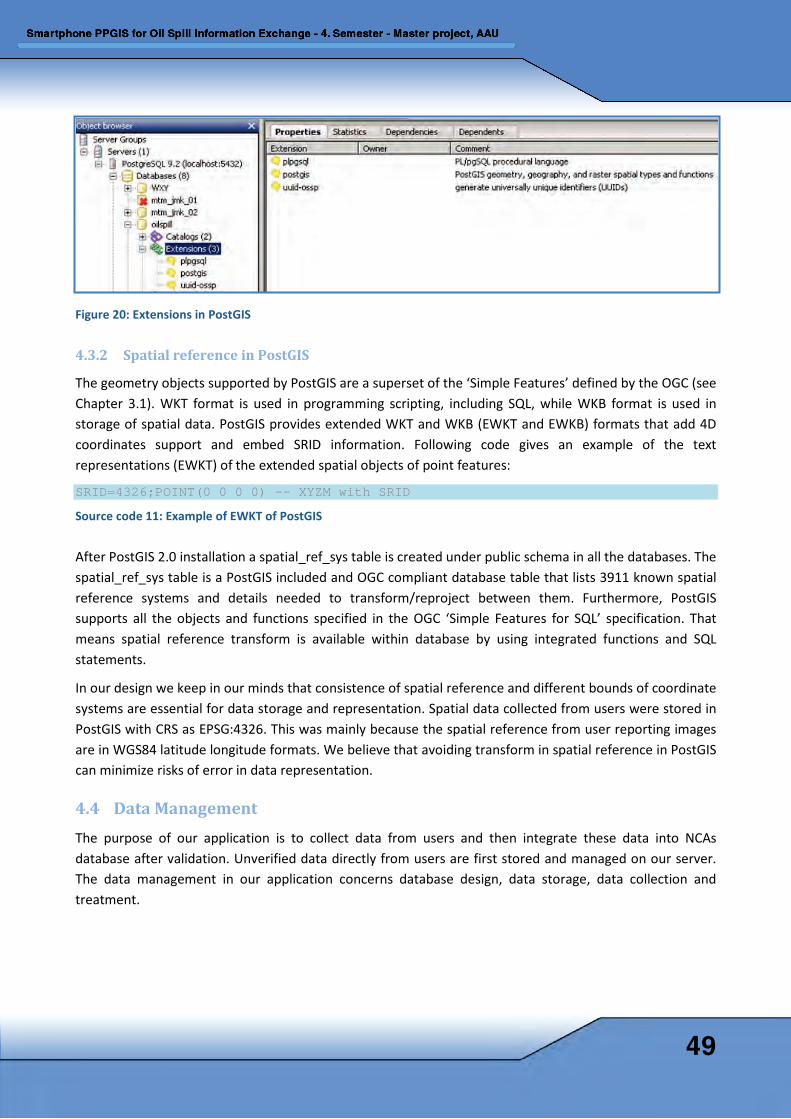
Figure 20: Extensions in PostGIS
4.3.2 Spatial reference in PostGIS
The geometry objects supported by PostGIS are a superset of the ‘Simple Features’ defined by the OGC (see Chapter 3.1). WKT format is used in programming scripting, including SQL, while WKB format is used in storage of spatial data. PostGIS provides extended WKT and WKB (EWKT and EWKB) formats that add 4D coordinates support and embed SRID information. Following code gives an example of the text representations (EWKT) of the extended spatial objects of point features:
SRID=4326;POINT(0 0 0 0) –- XYZM with SRID
Source code 11: Example of EWKT of PostGIS
After PostGIS 2.0 installation a spatial_ref_sys table is created under public schema in all the databases. The spatial_ref_sys table is a PostGIS included and OGC compliant database table that lists 3911 known spatial reference systems and details needed to transform/reproject between them. Furthermore, PostGIS supports all the objects and functions specified in the OGC ‘Simple Features for SQL’ specification. That means spatial reference transform is available within database by using integrated functions and SQL statements.
In our design we keep in our minds that consistence of spatial reference and different bounds of coordinate systems are essential for data storage and representation. Spatial data collected from users were stored in PostGIS with CRS as EPSG:4326. This was mainly because the spatial reference from user reporting images are in WGS84 latitude longitude formats. We believe that avoiding transform in spatial reference in PostGIS can minimize risks of error in data representation.
4.4 Data Management The purpose of our application is to collect data from users and then integrate these data into NCAs database after validation. Unverified data directly from users are first stored and managed on our server. The data management in our application concerns database design, data storage, data collection and treatment.
49
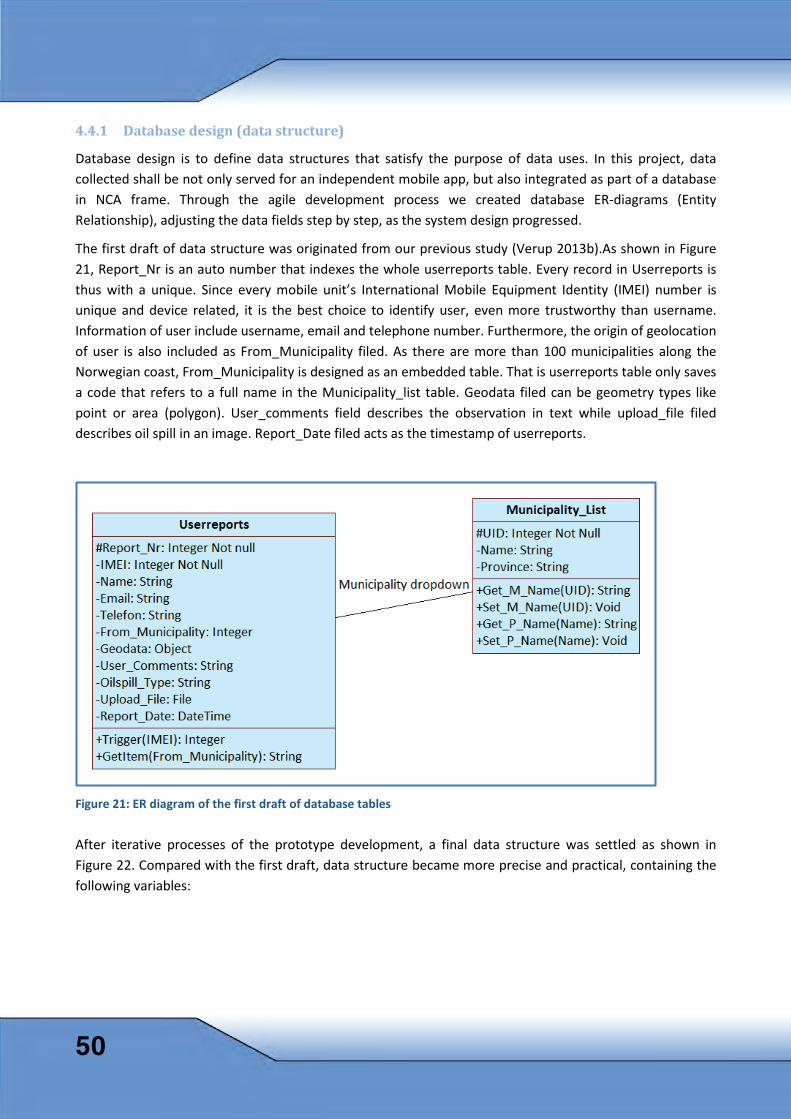
4.4.1 Database design (data structure)
Database design is to define data structures that satisfy the purpose of data uses. In this project, data collected shall be not only served for an independent mobile app, but also integrated as part of a database in NCA frame. Through the agile development process we created database ER-diagrams (Entity Relationship), adjusting the data fields step by step, as the system design progressed.
The first draft of data structure was originated from our previous study (Verup 2013b).As shown in Figure 21, Report_Nr is an auto number that indexes the whole userreports table. Every record in Userreports is thus with a unique. Since every mobile unit’s International Mobile Equipment Identity (IMEI) number is unique and device related, it is the best choice to identify user, even more trustworthy than username. Information of user include username, email and telephone number. Furthermore, the origin of geolocation of user is also included as From_Municipality filed. As there are more than 100 municipalities along the Norwegian coast, From_Municipality is designed as an embedded table. That is userreports table only saves a code that refers to a full name in the Municipality_list table. Geodata filed can be geometry types like point or area (polygon). User_comments field describes the observation in text while upload_file filed describes oil spill in an image. Report_Date filed acts as the timestamp of userreports.
Figure 21: ER diagram of the first draft of database tables
After iterative processes of the prototype development, a final data structure was settled as shown in Figure 22. Compared with the first draft, data structure became more precise and practical, containing the following variables:
50
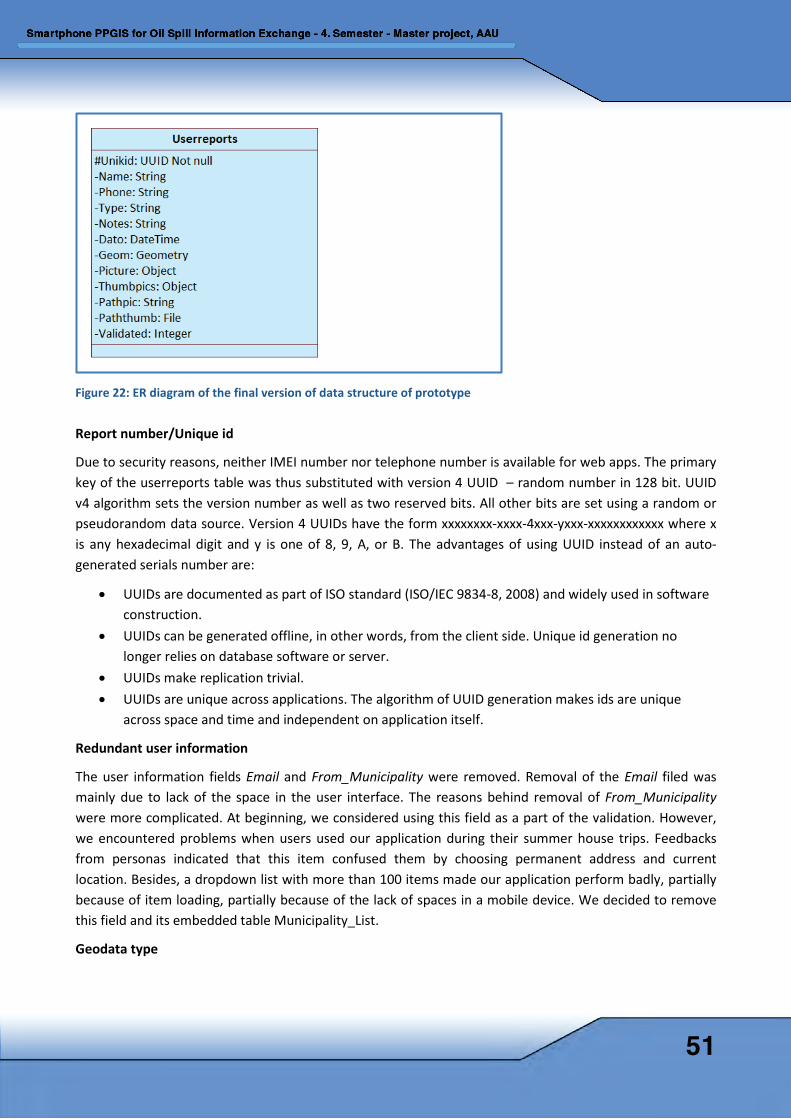
Figure 22: ER diagram of the final version of data structure of prototype
Report number/Unique id
Due to security reasons, neither IMEI number nor telephone number is available for web apps. The primary key of the userreports table was thus substituted with version 4 UUID – random number in 128 bit. UUID v4 algorithm sets the version number as well as two reserved bits. All other bits are set using a random or pseudorandom data source. Version 4 UUIDs have the form xxxxxxxx-xxxx-4xxx-yxxx-xxxxxxxxxxxx where x is any hexadecimal digit and y is one of 8, 9, A, or B. The advantages of using UUID instead of an auto-generated serials number are:
• UUIDs are documented as part of ISO standard (ISO/IEC 9834-8, 2008) and widely used in software construction.
• UUIDs can be generated offline, in other words, from the client side. Unique id generation no longer relies on database software or server.
• UUIDs make replication trivial. • UUIDs are unique across applications. The algorithm of UUID generation makes ids are unique
across space and time and independent on application itself.
Redundant user information
The user information fields Email and From_Municipality were removed. Removal of the Email filed was mainly due to lack of the space in the user interface. The reasons behind removal of From_Municipality were more complicated. At beginning, we considered using this field as a part of the validation. However, we encountered problems when users used our application during their summer house trips. Feedbacks from personas indicated that this item confused them by choosing permanent address and current location. Besides, a dropdown list with more than 100 items made our application perform badly, partially because of item loading, partially because of the lack of spaces in a mobile device. We decided to remove this field and its embedded table Municipality_List.
Geodata type
51
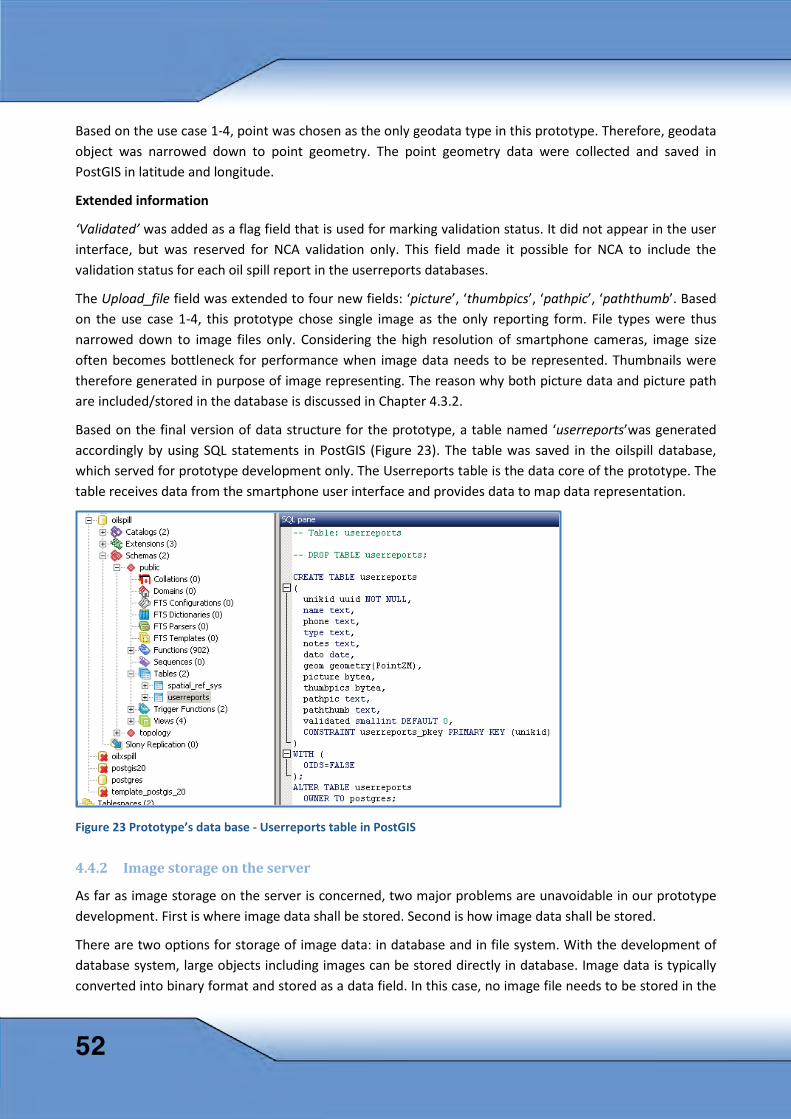
Based on the use case 1-4, point was chosen as the only geodata type in this prototype. Therefore, geodata object was narrowed down to point geometry. The point geometry data were collected and saved in PostGIS in latitude and longitude.
Extended information
‘Validated’ was added as a flag field that is used for marking validation status. It did not appear in the user interface, but was reserved for NCA validation only. This field made it possible for NCA to include the validation status for each oil spill report in the userreports databases.
The Upload_file field was extended to four new fields: ‘picture’, ‘thumbpics’, ‘pathpic’, ‘paththumb’. Based on the use case 1-4, this prototype chose single image as the only reporting form. File types were thus narrowed down to image files only. Considering the high resolution of smartphone cameras, image size often becomes bottleneck for performance when image data needs to be represented. Thumbnails were therefore generated in purpose of image representing. The reason why both picture data and picture path are included/stored in the database is discussed in Chapter 4.3.2.
Based on the final version of data structure for the prototype, a table named ‘userreports’was generated accordingly by using SQL statements in PostGIS (Figure 23). The table was saved in the oilspill database, which served for prototype development only. The Userreports table is the data core of the prototype. The table receives data from the smartphone user interface and provides data to map data representation.
Figure 23 Prototype’s data base - Userreports table in PostGIS
4.4.2 Image storage on the server
As far as image storage on the server is concerned, two major problems are unavoidable in our prototype development. First is where image data shall be stored. Second is how image data shall be stored.
There are two options for storage of image data: in database and in file system. With the development of database system, large objects including images can be stored directly in database. Image data is typically converted into binary format and stored as a data field. In this case, no image file needs to be stored in the
52
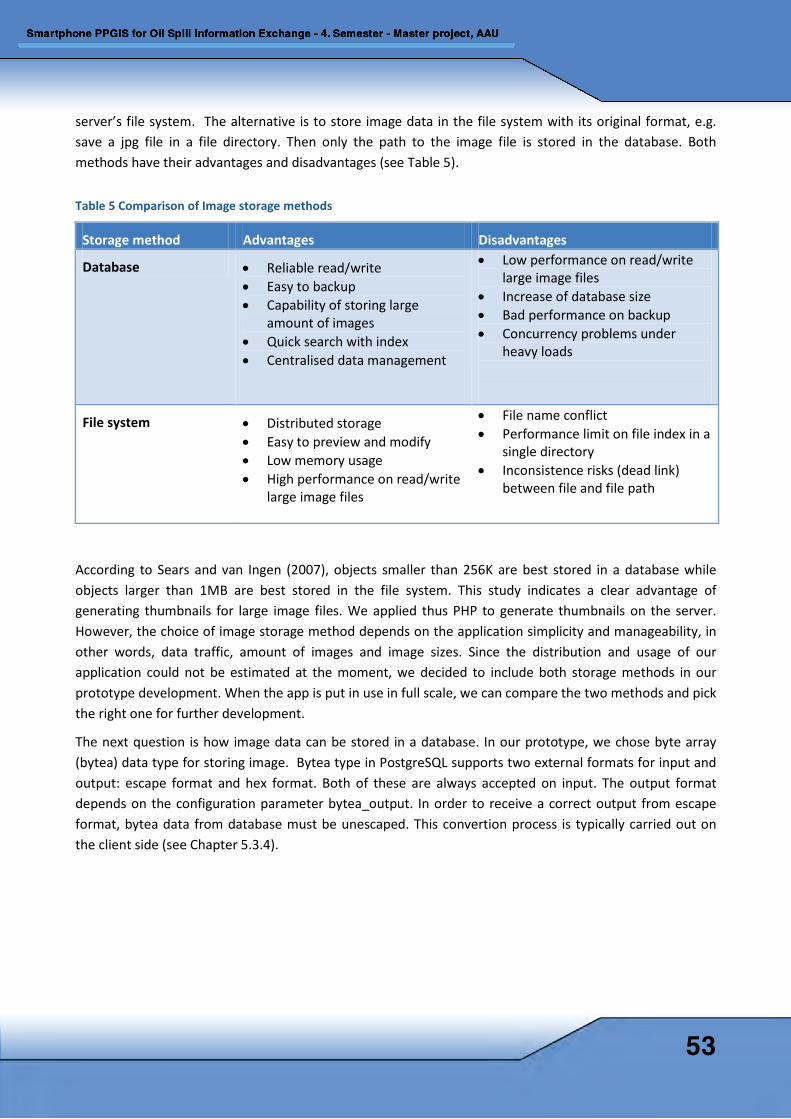
server’s file system. The alternative is to store image data in the file system with its original format, e.g. save a jpg file in a file directory. Then only the path to the image file is stored in the database. Both methods have their advantages and disadvantages (see Table 5).
Table 5 Comparison of Image storage methods
Storage method Advantages Disadvantages
Database • Reliable read/write • Easy to backup • Capability of storing large
amount of images • Quick search with index • Centralised data management
• Low performance on read/write large image files
• Increase of database size • Bad performance on backup • Concurrency problems under
heavy loads
File system • Distributed storage • Easy to preview and modify • Low memory usage • High performance on read/write
large image files
• File name conflict • Performance limit on file index in a
single directory • Inconsistence risks (dead link)
between file and file path
According to Sears and van Ingen (2007), objects smaller than 256K are best stored in a database while objects larger than 1MB are best stored in the file system. This study indicates a clear advantage of generating thumbnails for large image files. We applied thus PHP to generate thumbnails on the server. However, the choice of image storage method depends on the application simplicity and manageability, in other words, data traffic, amount of images and image sizes. Since the distribution and usage of our application could not be estimated at the moment, we decided to include both storage methods in our prototype development. When the app is put in use in full scale, we can compare the two methods and pick the right one for further development.
The next question is how image data can be stored in a database. In our prototype, we chose byte array (bytea) data type for storing image. Bytea type in PostgreSQL supports two external formats for input and output: escape format and hex format. Both of these are always accepted on input. The output format depends on the configuration parameter bytea_output. In order to receive a correct output from escape format, bytea data from database must be unescaped. This convertion process is typically carried out on the client side (see Chapter 5.3.4).
53
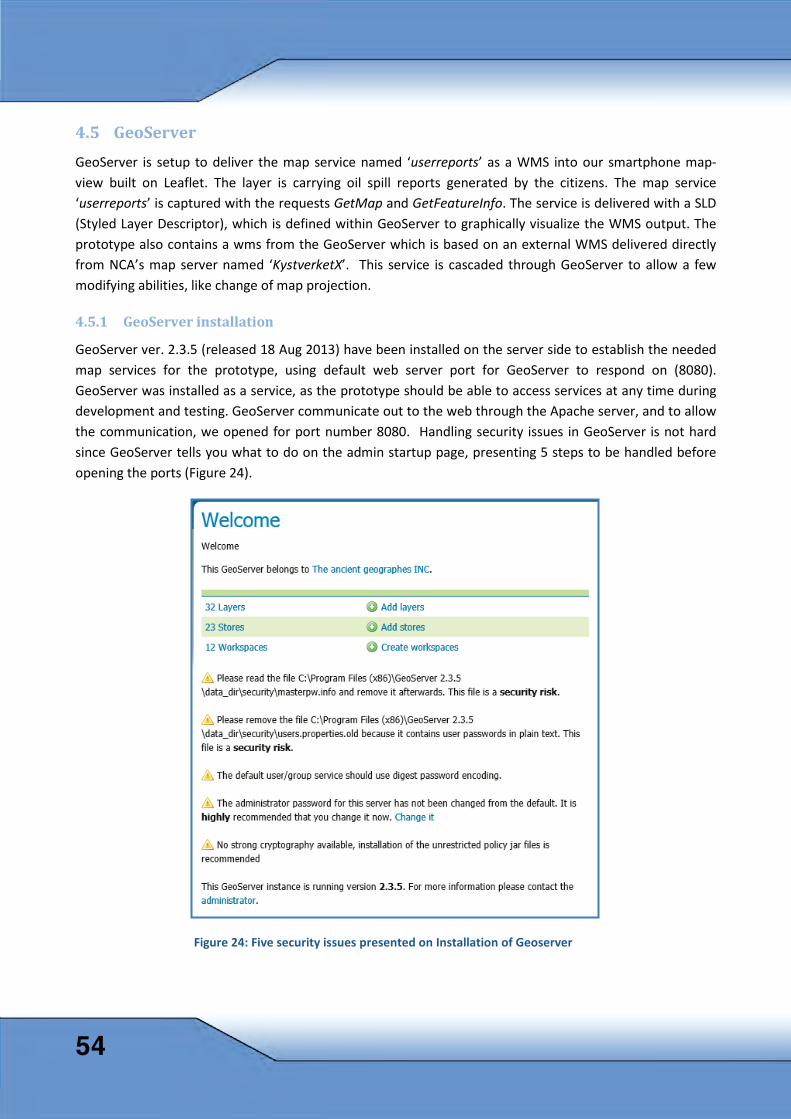
4.5 GeoServer GeoServer is setup to deliver the map service named ‘userreports’ as a WMS into our smartphone map-view built on Leaflet. The layer is carrying oil spill reports generated by the citizens. The map service ‘userreports’ is captured with the requests GetMap and GetFeatureInfo. The service is delivered with a SLD (Styled Layer Descriptor), which is defined within GeoServer to graphically visualize the WMS output. The prototype also contains a wms from the GeoServer which is based on an external WMS delivered directly from NCA’s map server named ‘KystverketX’. This service is cascaded through GeoServer to allow a few modifying abilities, like change of map projection.
4.5.1 GeoServer installation
GeoServer ver. 2.3.5 (released 18 Aug 2013) have been installed on the server side to establish the needed map services for the prototype, using default web server port for GeoServer to respond on (8080). GeoServer was installed as a service, as the prototype should be able to access services at any time during development and testing. GeoServer communicate out to the web through the Apache server, and to allow the communication, we opened for port number 8080. Handling security issues in GeoServer is not hard since GeoServer tells you what to do on the admin startup page, presenting 5 steps to be handled before opening the ports (Figure 24).
Figure 24: Five security issues presented on Installation of Geoserver
54
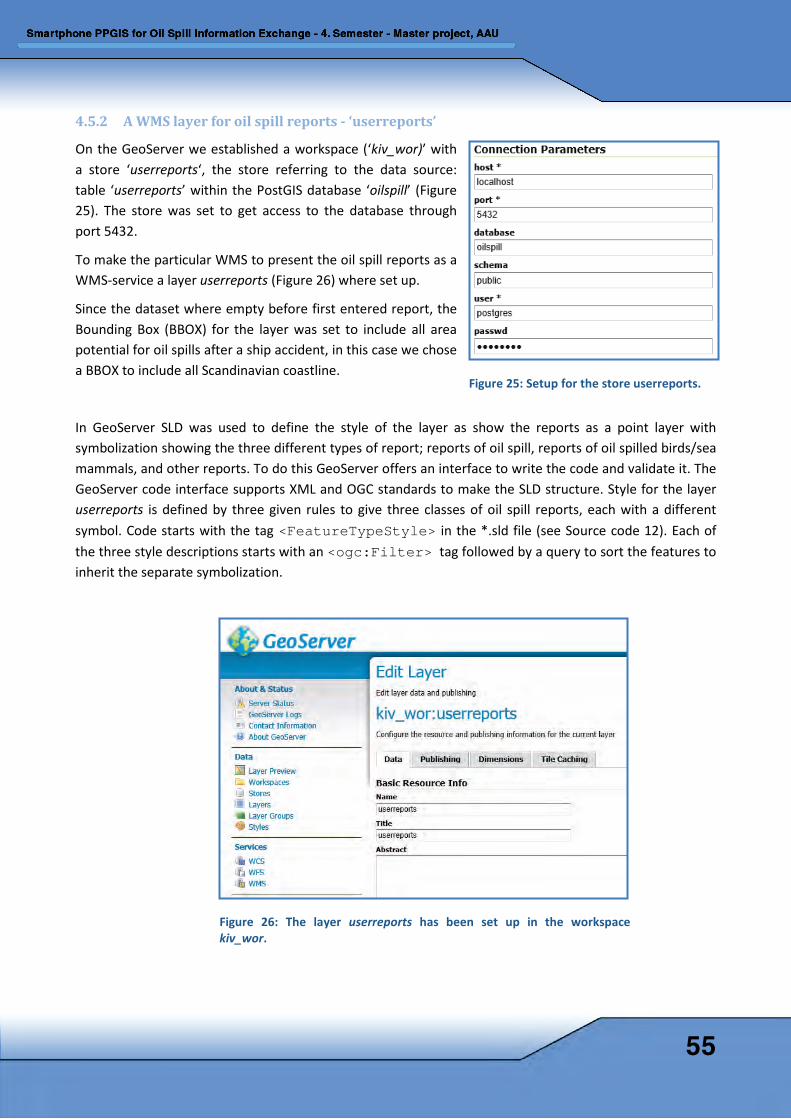
4.5.2 A WMS layer for oil spill reports - ‘userreports’
On the GeoServer we established a workspace (‘kiv_wor)’ with a store ‘userreports‘, the store referring to the data source: table ‘userreports’ within the PostGIS database ‘oilspill’ (Figure 25). The store was set to get access to the database through port 5432.
To make the particular WMS to present the oil spill reports as a WMS-service a layer userreports (Figure 26) where set up.
Since the dataset where empty before first entered report, the Bounding Box (BBOX) for the layer was set to include all area potential for oil spills after a ship accident, in this case we chose a BBOX to include all Scandinavian coastline.
In GeoServer SLD was used to define the style of the layer as show the reports as a point layer with symbolization showing the three different types of report; reports of oil spill, reports of oil spilled birds/sea mammals, and other reports. To do this GeoServer offers an interface to write the code and validate it. The GeoServer code interface supports XML and OGC standards to make the SLD structure. Style for the layer userreports is defined by three given rules to give three classes of oil spill reports, each with a different symbol. Code starts with the tag <FeatureTypeStyle> in the *.sld file (see Source code 12). Each of the three style descriptions starts with an <ogc:Filter> tag followed by a query to sort the features to inherit the separate symbolization.
Figure 26: The layer userreports has been set up in the workspace kiv_wor.
Figure 25: Setup for the store userreports.
55
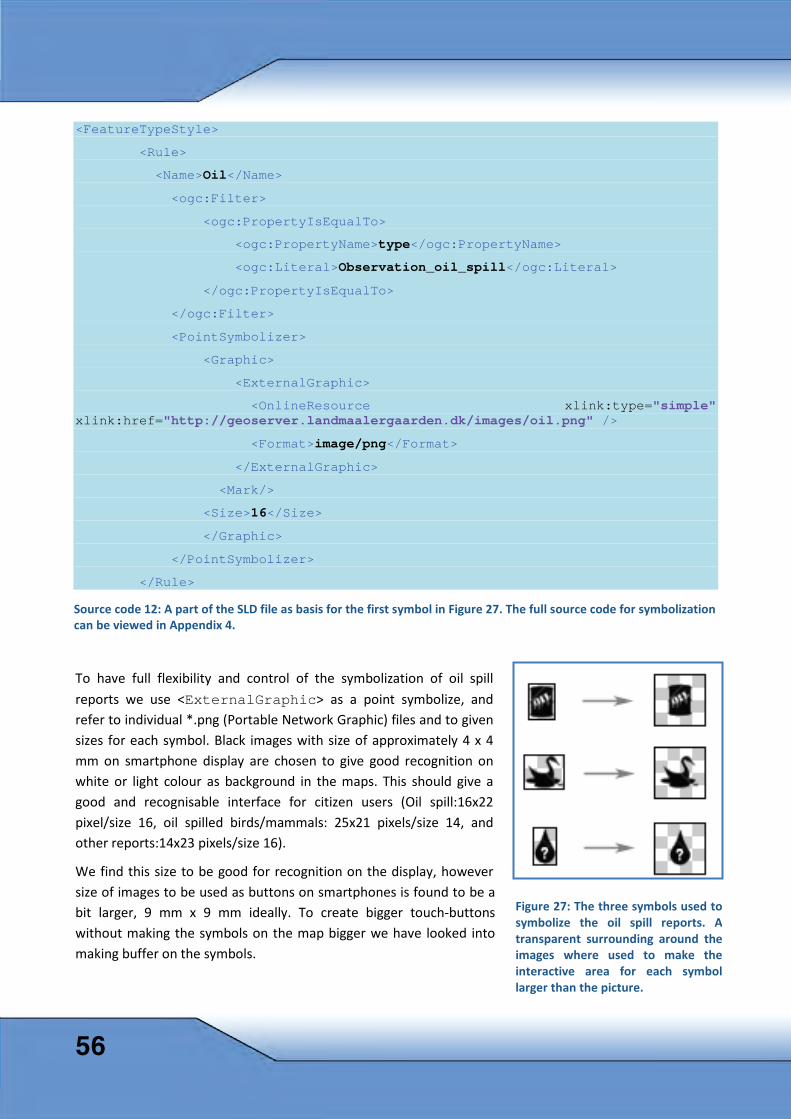
<FeatureTypeStyle>
<Rule>
<Name>Oil</Name>
<ogc:Filter>
<ogc:PropertyIsEqualTo>
<ogc:PropertyName>type</ogc:PropertyName>
<ogc:Literal>Observation_oil_spill</ogc:Literal>
</ogc:PropertyIsEqualTo>
</ogc:Filter>
<PointSymbolizer>
<Graphic>
<ExternalGraphic>
<OnlineResource xlink:type="simple" xlink:href="http://geoserver.landmaalergaarden.dk/images/oil.png" />
<Format>image/png</Format>
</ExternalGraphic>
<Mark/>
<Size>16</Size>
</Graphic>
</PointSymbolizer>
</Rule>
To have full flexibility and control of the symbolization of oil spill reports we use <ExternalGraphic> as a point symbolize, and refer to individual *.png (Portable Network Graphic) files and to given sizes for each symbol. Black images with size of approximately 4 x 4 mm on smartphone display are chosen to give good recognition on white or light colour as background in the maps. This should give a good and recognisable interface for citizen users (Oil spill:16x22 pixel/size 16, oil spilled birds/mammals: 25x21 pixels/size 14, and other reports:14x23 pixels/size 16).
We find this size to be good for recognition on the display, however size of images to be used as buttons on smartphones is found to be a bit larger, 9 mm x 9 mm ideally. To create bigger touch-buttons without making the symbols on the map bigger we have looked into making buffer on the symbols.
Source code 12: A part of the SLD file as basis for the first symbol in Figure 27. The full source code for symbolization can be viewed in Appendix 4.
Figure 27: The three symbols used to symbolize the oil spill reports. A transparent surrounding around the images where used to make the interactive area for each symbol larger than the picture.
56
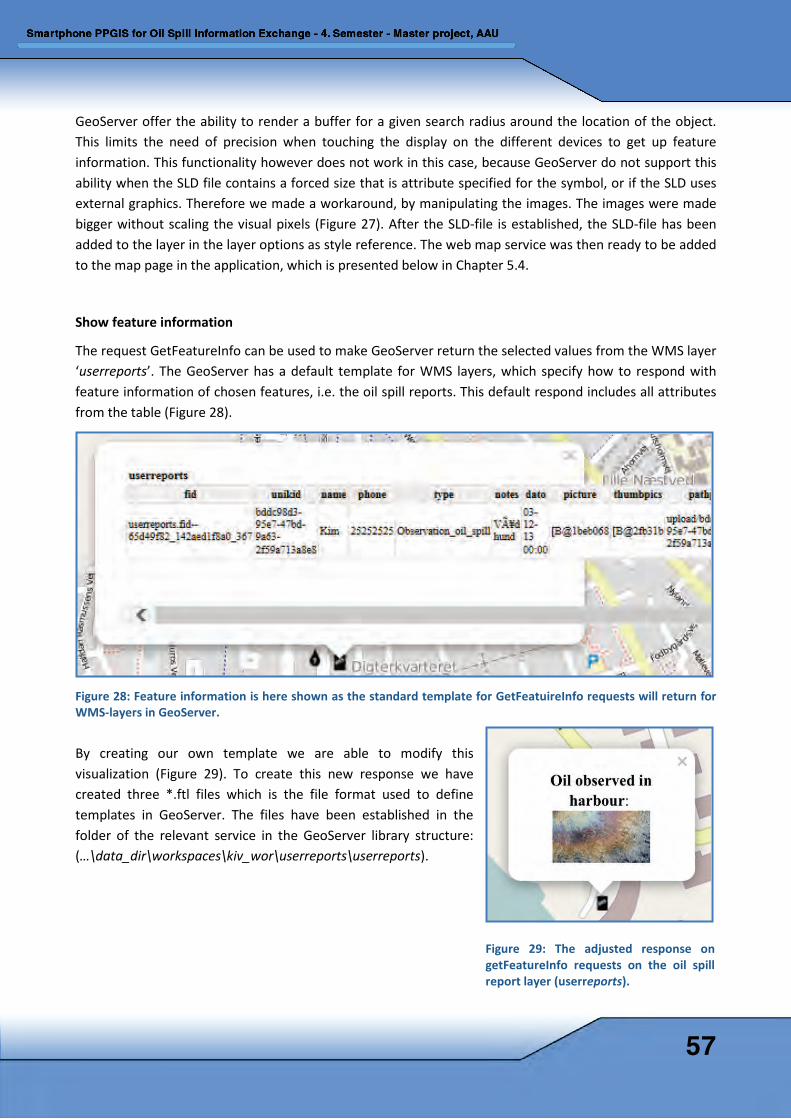
GeoServer offer the ability to render a buffer for a given search radius around the location of the object. This limits the need of precision when touching the display on the different devices to get up feature information. This functionality however does not work in this case, because GeoServer do not support this ability when the SLD file contains a forced size that is attribute specified for the symbol, or if the SLD uses external graphics. Therefore we made a workaround, by manipulating the images. The images were made bigger without scaling the visual pixels (Figure 27). After the SLD-file is established, the SLD-file has been added to the layer in the layer options as style reference. The web map service was then ready to be added to the map page in the application, which is presented below in Chapter 5.4.
Show feature information
The request GetFeatureInfo can be used to make GeoServer return the selected values from the WMS layer ‘userreports’. The GeoServer has a default template for WMS layers, which specify how to respond with feature information of chosen features, i.e. the oil spill reports. This default respond includes all attributes from the table (Figure 28).
Figure 28: Feature information is here shown as the standard template for GetFeatuireInfo requests will return for WMS-layers in GeoServer.
By creating our own template we are able to modify this visualization (Figure 29). To create this new response we have created three *.ftl files which is the file format used to define templates in GeoServer. The files have been established in the folder of the relevant service in the GeoServer library structure: (…\data_dir\workspaces\kiv_wor\userreports\userreports).
Figure 29: The adjusted response on getFeatureInfo requests on the oil spill report layer (userreports).
57
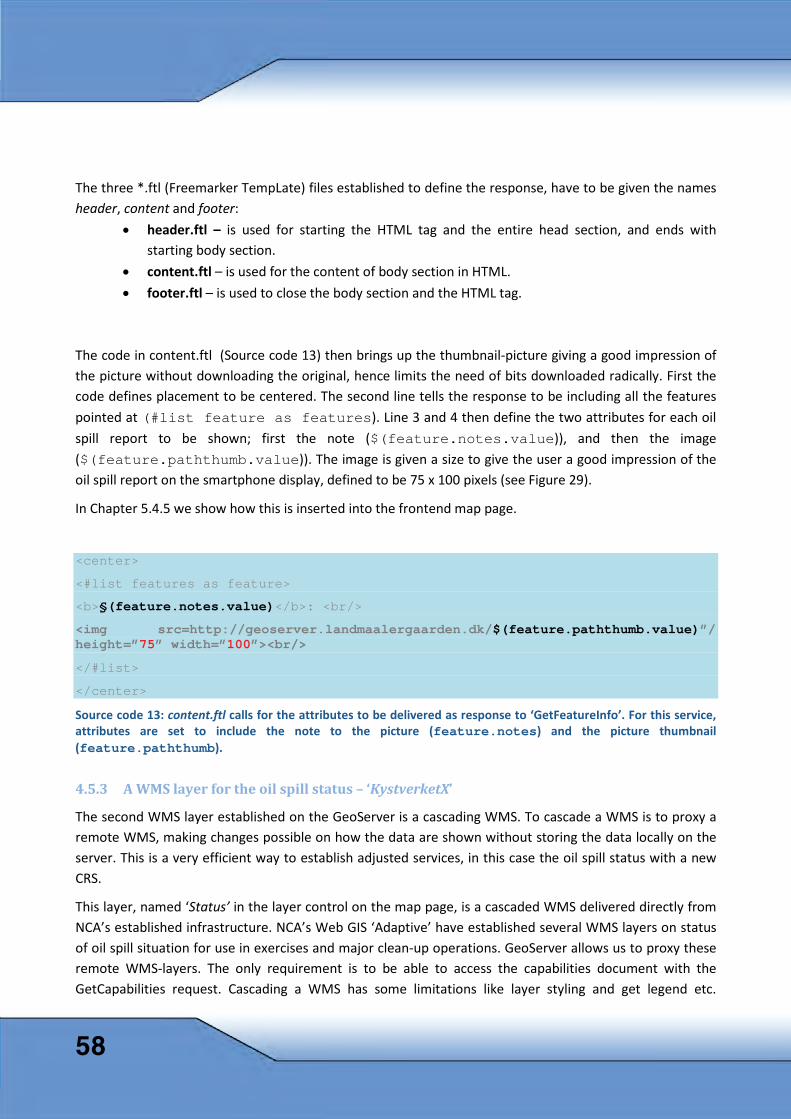
The three *.ftl (Freemarker TempLate) files established to define the response, have to be given the names header, content and footer:
• header.ftl – is used for starting the HTML tag and the entire head section, and ends with starting body section.
• content.ftl – is used for the content of body section in HTML. • footer.ftl – is used to close the body section and the HTML tag.
The code in content.ftl (Source code 13) then brings up the thumbnail-picture giving a good impression of the picture without downloading the original, hence limits the need of bits downloaded radically. First the code defines placement to be centered. The second line tells the response to be including all the features pointed at (#list feature as features). Line 3 and 4 then define the two attributes for each oil spill report to be shown; first the note ($(feature.notes.value)), and then the image ($(feature.paththumb.value)). The image is given a size to give the user a good impression of the oil spill report on the smartphone display, defined to be 75 x 100 pixels (see Figure 29).
In Chapter 5.4.5 we show how this is inserted into the frontend map page.
<center>
<#list features as feature>
<b>§(feature.notes.value)</b>: <br/>
<img src=http://geoserver.landmaalergaarden.dk/$(feature.paththumb.value)”/ height=”75” width=”100”><br/>
</#list>
</center>
Source code 13: content.ftl calls for the attributes to be delivered as response to ‘GetFeatureInfo’. For this service, attributes are set to include the note to the picture (feature.notes) and the picture thumbnail (feature.paththumb).
4.5.3 A WMS layer for the oil spill status – ‘KystverketX’
The second WMS layer established on the GeoServer is a cascading WMS. To cascade a WMS is to proxy a remote WMS, making changes possible on how the data are shown without storing the data locally on the server. This is a very efficient way to establish adjusted services, in this case the oil spill status with a new CRS.
This layer, named ‘Status’ in the layer control on the map page, is a cascaded WMS delivered directly from NCA’s established infrastructure. NCA’s Web GIS ‘Adaptive’ have established several WMS layers on status of oil spill situation for use in exercises and major clean-up operations. GeoServer allows us to proxy these remote WMS-layers. The only requirement is to be able to access the capabilities document with the GetCapabilities request. Cascading a WMS has some limitations like layer styling and get legend etc.
58
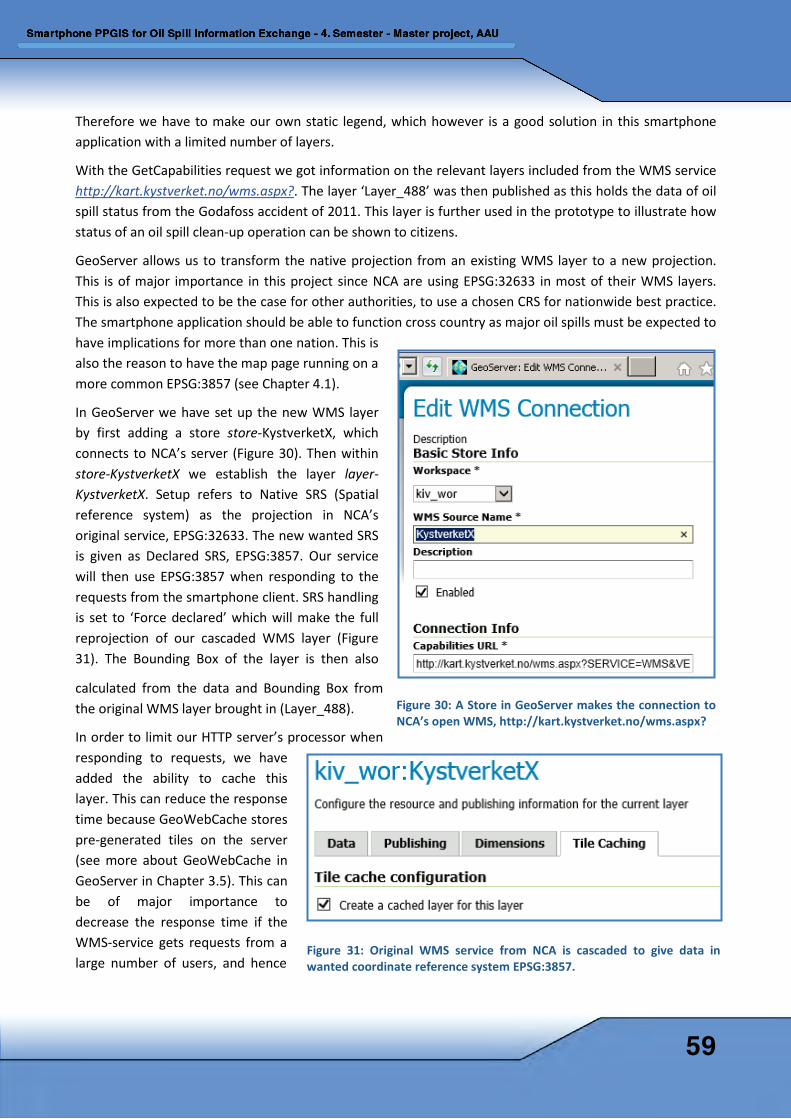
Therefore we have to make our own static legend, which however is a good solution in this smartphone application with a limited number of layers.
With the GetCapabilities request we got information on the relevant layers included from the WMS service http://kart.kystverket.no/wms.aspx?. The layer ‘Layer_488’ was then published as this holds the data of oil spill status from the Godafoss accident of 2011. This layer is further used in the prototype to illustrate how status of an oil spill clean-up operation can be shown to citizens.
GeoServer allows us to transform the native projection from an existing WMS layer to a new projection. This is of major importance in this project since NCA are using EPSG:32633 in most of their WMS layers. This is also expected to be the case for other authorities, to use a chosen CRS for nationwide best practice. The smartphone application should be able to function cross country as major oil spills must be expected to have implications for more than one nation. This is also the reason to have the map page running on a more common EPSG:3857 (see Chapter 4.1).
In GeoServer we have set up the new WMS layer by first adding a store store-KystverketX, which connects to NCA’s server (Figure 30). Then within store-KystverketX we establish the layer layer-KystverketX. Setup refers to Native SRS (Spatial reference system) as the projection in NCA’s original service, EPSG:32633. The new wanted SRS is given as Declared SRS, EPSG:3857. Our service will then use EPSG:3857 when responding to the requests from the smartphone client. SRS handling is set to ‘Force declared’ which will make the full reprojection of our cascaded WMS layer (Figure 31). The Bounding Box of the layer is then also
calculated from the data and Bounding Box from the original WMS layer brought in (Layer_488).
In order to limit our HTTP server’s processor when responding to requests, we have added the ability to cache this layer. This can reduce the response time because GeoWebCache stores pre-generated tiles on the server (see more about GeoWebCache in GeoServer in Chapter 3.5). This can be of major importance to decrease the response time if the WMS-service gets requests from a large number of users, and hence
Figure 31: Original WMS service from NCA is cascaded to give data in wanted coordinate reference system EPSG:3857.
Figure 30: A Store in GeoServer makes the connection to NCA’s open WMS, http://kart.kystverket.no/wms.aspx?
59
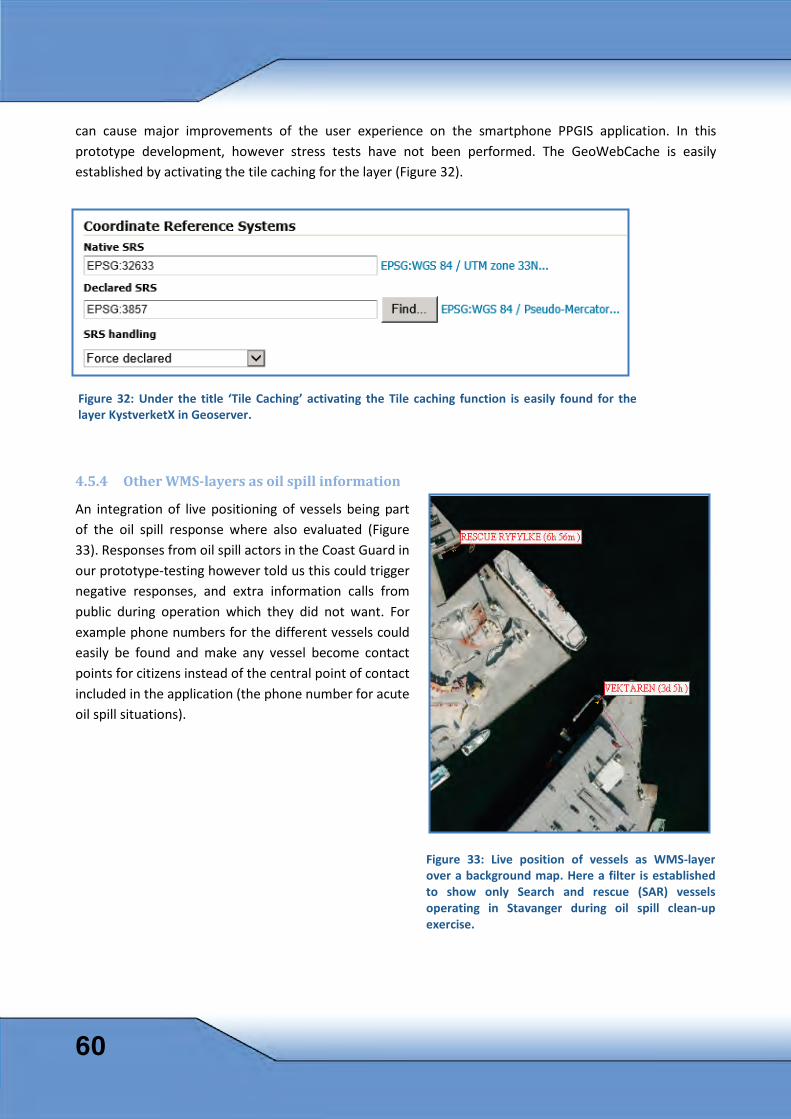
can cause major improvements of the user experience on the smartphone PPGIS application. In this prototype development, however stress tests have not been performed. The GeoWebCache is easily established by activating the tile caching for the layer (Figure 32).
4.5.4 Other WMS-layers as oil spill information
An integration of live positioning of vessels being part of the oil spill response where also evaluated (Figure 33). Responses from oil spill actors in the Coast Guard in our prototype-testing however told us this could trigger negative responses, and extra information calls from public during operation which they did not want. For example phone numbers for the different vessels could easily be found and make any vessel become contact points for citizens instead of the central point of contact included in the application (the phone number for acute oil spill situations).
Figure 32: Under the title ‘Tile Caching’ activating the Tile caching function is easily found for the layer KystverketX in Geoserver.
Figure 33: Live position of vessels as WMS-layer over a background map. Here a filter is established to show only Search and rescue (SAR) vessels operating in Stavanger during oil spill clean-up exercise.
60
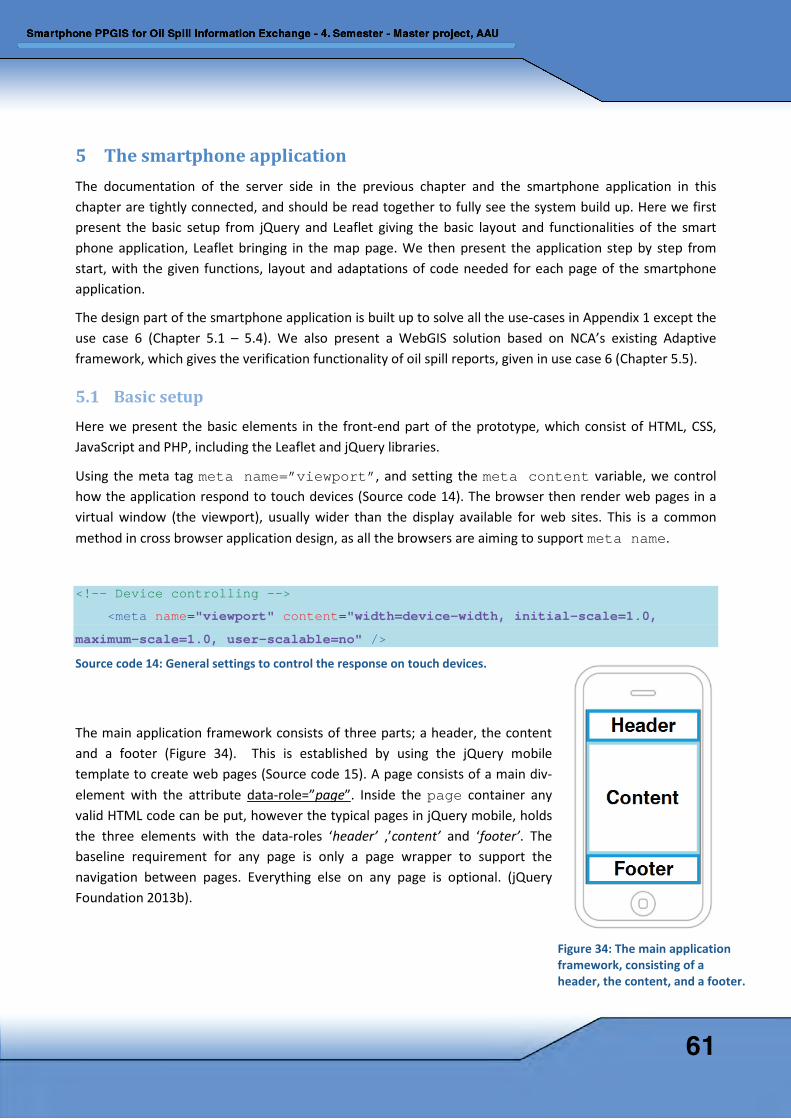
5 The smartphone application The documentation of the server side in the previous chapter and the smartphone application in this chapter are tightly connected, and should be read together to fully see the system build up. Here we first present the basic setup from jQuery and Leaflet giving the basic layout and functionalities of the smart phone application, Leaflet bringing in the map page. We then present the application step by step from start, with the given functions, layout and adaptations of code needed for each page of the smartphone application.
The design part of the smartphone application is built up to solve all the use-cases in Appendix 1 except the use case 6 (Chapter 5.1 – 5.4). We also present a WebGIS solution based on NCA’s existing Adaptive framework, which gives the verification functionality of oil spill reports, given in use case 6 (Chapter 5.5).
5.1 Basic setup Here we present the basic elements in the front-end part of the prototype, which consist of HTML, CSS, JavaScript and PHP, including the Leaflet and jQuery libraries.
Using the meta tag meta name=”viewport”, and setting the meta content variable, we control how the application respond to touch devices (Source code 14). The browser then render web pages in a virtual window (the viewport), usually wider than the display available for web sites. This is a common method in cross browser application design, as all the browsers are aiming to support meta name.
<!-- Device controlling -->
<meta name="viewport" content="width=device-width, initial-scale=1.0,
maximum-scale=1.0, user-scalable=no" />
Source code 14: General settings to control the response on touch devices.
The main application framework consists of three parts; a header, the content and a footer (Figure 34). This is established by using the jQuery mobile template to create web pages (Source code 15). A page consists of a main div-element with the attribute data-role=”page”. Inside the page container any valid HTML code can be put, however the typical pages in jQuery mobile, holds the three elements with the data-roles ‘header’ ,’content’ and ‘footer’. The baseline requirement for any page is only a page wrapper to support the navigation between pages. Everything else on any page is optional. (jQuery Foundation 2013b).
Figure 34: The main application framework, consisting of a header, the content, and a footer.
61
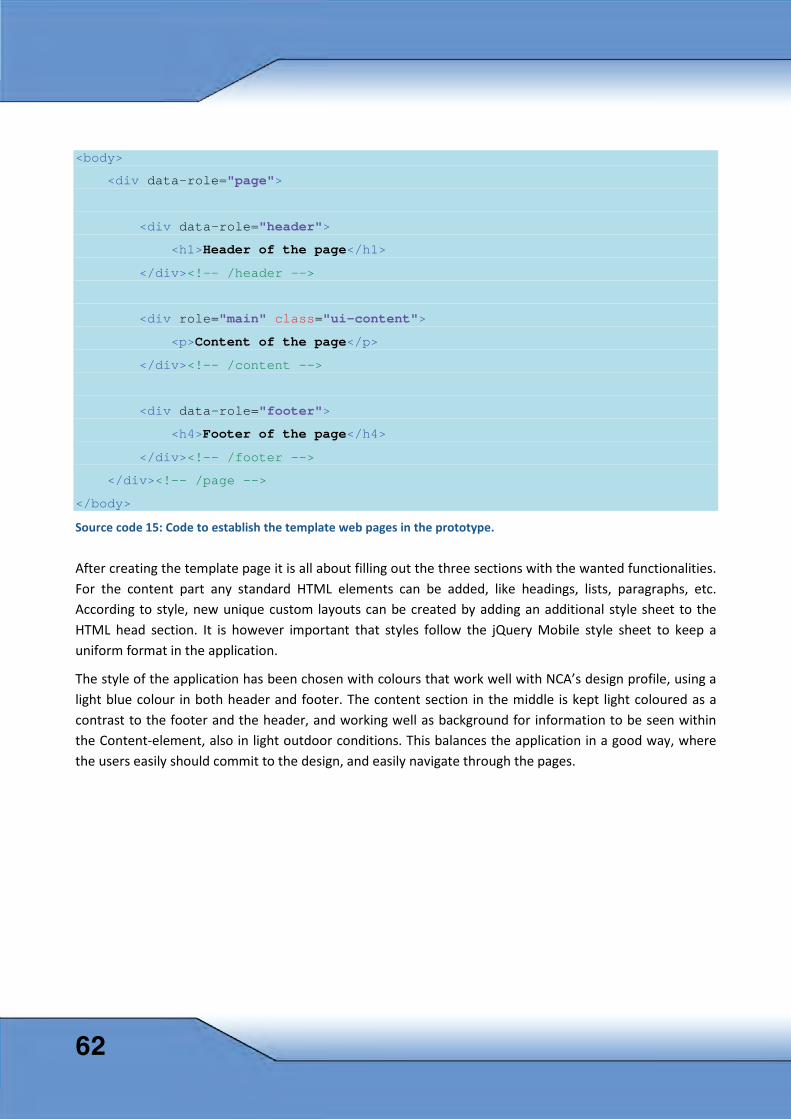
<body>
<div data-role="page">
<div data-role="header">
<h1>Header of the page</h1>
</div><!-- /header -->
<div role="main" class="ui-content">
<p>Content of the page</p>
</div><!-- /content -->
<div data-role="footer">
<h4>Footer of the page</h4>
</div><!-- /footer -->
</div><!-- /page -->
</body> Source code 15: Code to establish the template web pages in the prototype.
After creating the template page it is all about filling out the three sections with the wanted functionalities. For the content part any standard HTML elements can be added, like headings, lists, paragraphs, etc. According to style, new unique custom layouts can be created by adding an additional style sheet to the HTML head section. It is however important that styles follow the jQuery Mobile style sheet to keep a uniform format in the application.
The style of the application has been chosen with colours that work well with NCA’s design profile, using a light blue colour in both header and footer. The content section in the middle is kept light coloured as a contrast to the footer and the header, and working well as background for information to be seen within the Content-element, also in light outdoor conditions. This balances the application in a good way, where the users easily should commit to the design, and easily navigate through the pages.
62
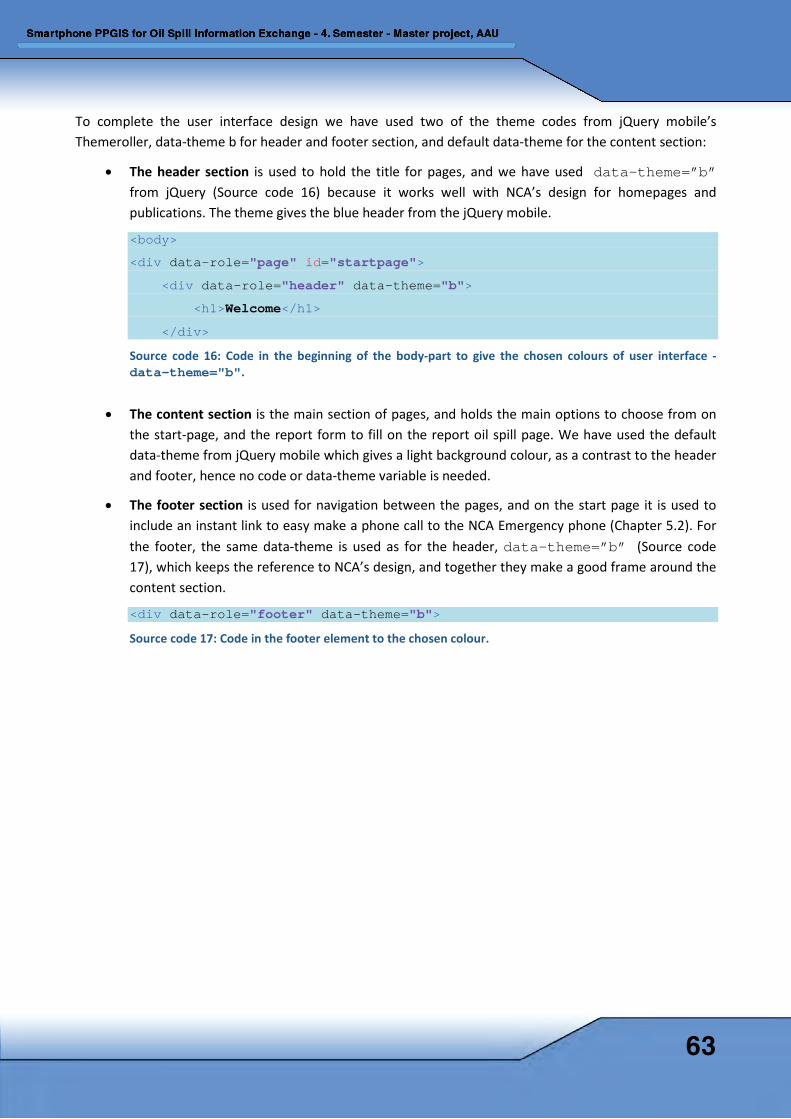
To complete the user interface design we have used two of the theme codes from jQuery mobile’s Themeroller, data-theme b for header and footer section, and default data-theme for the content section:
• The header section is used to hold the title for pages, and we have used data-theme=”b” from jQuery (Source code 16) because it works well with NCA’s design for homepages and publications. The theme gives the blue header from the jQuery mobile.
<body>
<div data-role="page" id="startpage">
<div data-role="header" data-theme="b">
<h1>Welcome</h1>
</div> Source code 16: Code in the beginning of the body-part to give the chosen colours of user interface - data-theme="b".
• The content section is the main section of pages, and holds the main options to choose from on the start-page, and the report form to fill on the report oil spill page. We have used the default data-theme from jQuery mobile which gives a light background colour, as a contrast to the header and footer, hence no code or data-theme variable is needed.
• The footer section is used for navigation between the pages, and on the start page it is used to include an instant link to easy make a phone call to the NCA Emergency phone (Chapter 5.2). For the footer, the same data-theme is used as for the header, data-theme=”b” (Source code 17), which keeps the reference to NCA’s design, and together they make a good frame around the content section.
<div data-role="footer" data-theme="b"> Source code 17: Code in the footer element to the chosen colour.
63
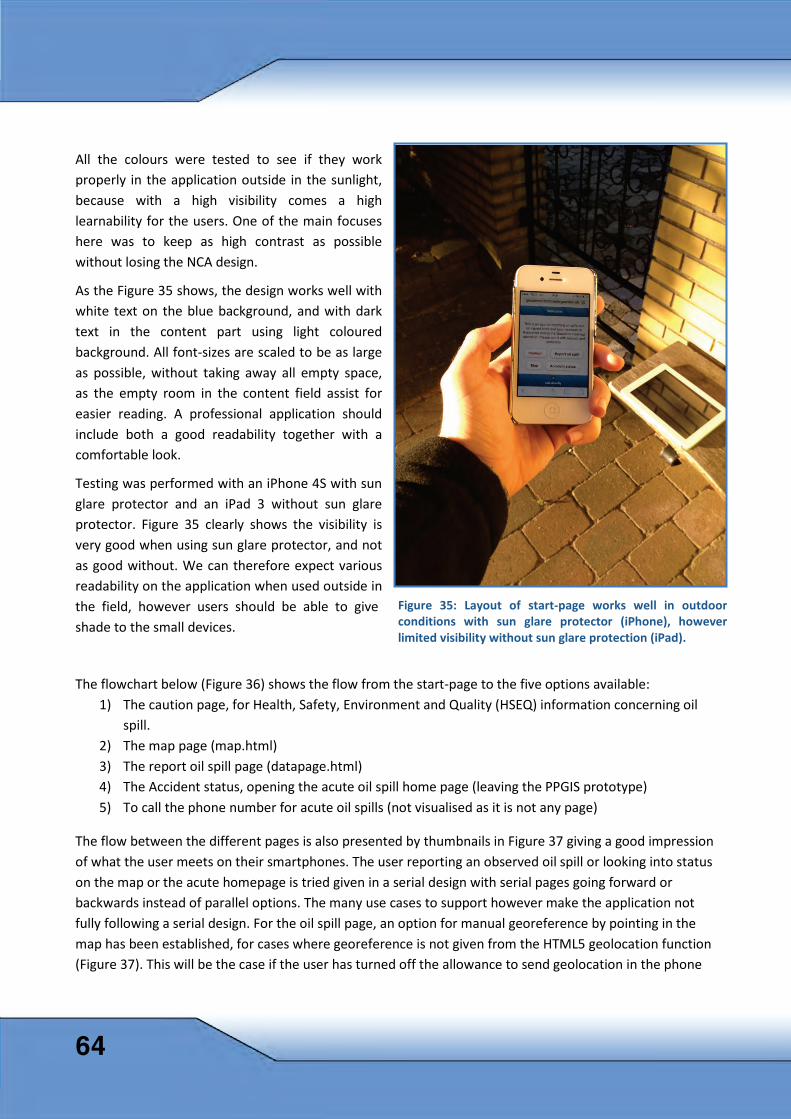
All the colours were tested to see if they work properly in the application outside in the sunlight, because with a high visibility comes a high learnability for the users. One of the main focuses here was to keep as high contrast as possible without losing the NCA design.
As the Figure 35 shows, the design works well with white text on the blue background, and with dark text in the content part using light coloured background. All font-sizes are scaled to be as large as possible, without taking away all empty space, as the empty room in the content field assist for easier reading. A professional application should include both a good readability together with a comfortable look.
Testing was performed with an iPhone 4S with sun glare protector and an iPad 3 without sun glare protector. Figure 35 clearly shows the visibility is very good when using sun glare protector, and not as good without. We can therefore expect various readability on the application when used outside in the field, however users should be able to give shade to the small devices.
The flowchart below (Figure 36) shows the flow from the start-page to the five options available: 1) The caution page, for Health, Safety, Environment and Quality (HSEQ) information concerning oil
spill. 2) The map page (map.html) 3) The report oil spill page (datapage.html) 4) The Accident status, opening the acute oil spill home page (leaving the PPGIS prototype) 5) To call the phone number for acute oil spills (not visualised as it is not any page)
The flow between the different pages is also presented by thumbnails in Figure 37 giving a good impression of what the user meets on their smartphones. The user reporting an observed oil spill or looking into status on the map or the acute homepage is tried given in a serial design with serial pages going forward or backwards instead of parallel options. The many use cases to support however make the application not fully following a serial design. For the oil spill page, an option for manual georeference by pointing in the map has been established, for cases where georeference is not given from the HTML5 geolocation function (Figure 37). This will be the case if the user has turned off the allowance to send geolocation in the phone
Figure 35: Layout of start-page works well in outdoor conditions with sun glare protector (iPhone), however limited visibility without sun glare protection (iPad).
64
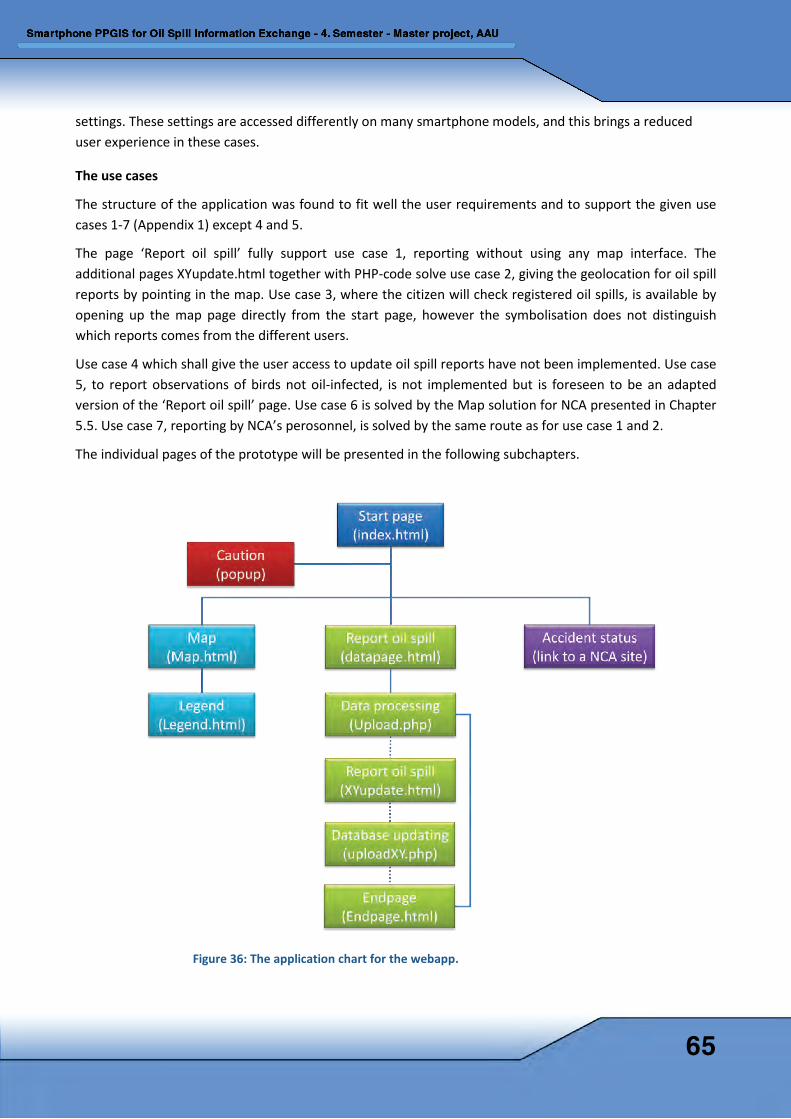
settings. These settings are accessed differently on many smartphone models, and this brings a reduced user experience in these cases.
The use cases
The structure of the application was found to fit well the user requirements and to support the given use cases 1-7 (Appendix 1) except 4 and 5.
The page ‘Report oil spill’ fully support use case 1, reporting without using any map interface. The additional pages XYupdate.html together with PHP-code solve use case 2, giving the geolocation for oil spill reports by pointing in the map. Use case 3, where the citizen will check registered oil spills, is available by opening up the map page directly from the start page, however the symbolisation does not distinguish which reports comes from the different users.
Use case 4 which shall give the user access to update oil spill reports have not been implemented. Use case 5, to report observations of birds not oil-infected, is not implemented but is foreseen to be an adapted version of the ‘Report oil spill’ page. Use case 6 is solved by the Map solution for NCA presented in Chapter 5.5. Use case 7, reporting by NCA’s perosonnel, is solved by the same route as for use case 1 and 2.
The individual pages of the prototype will be presented in the following subchapters.
Figure 36: The application chart for the webapp.
65
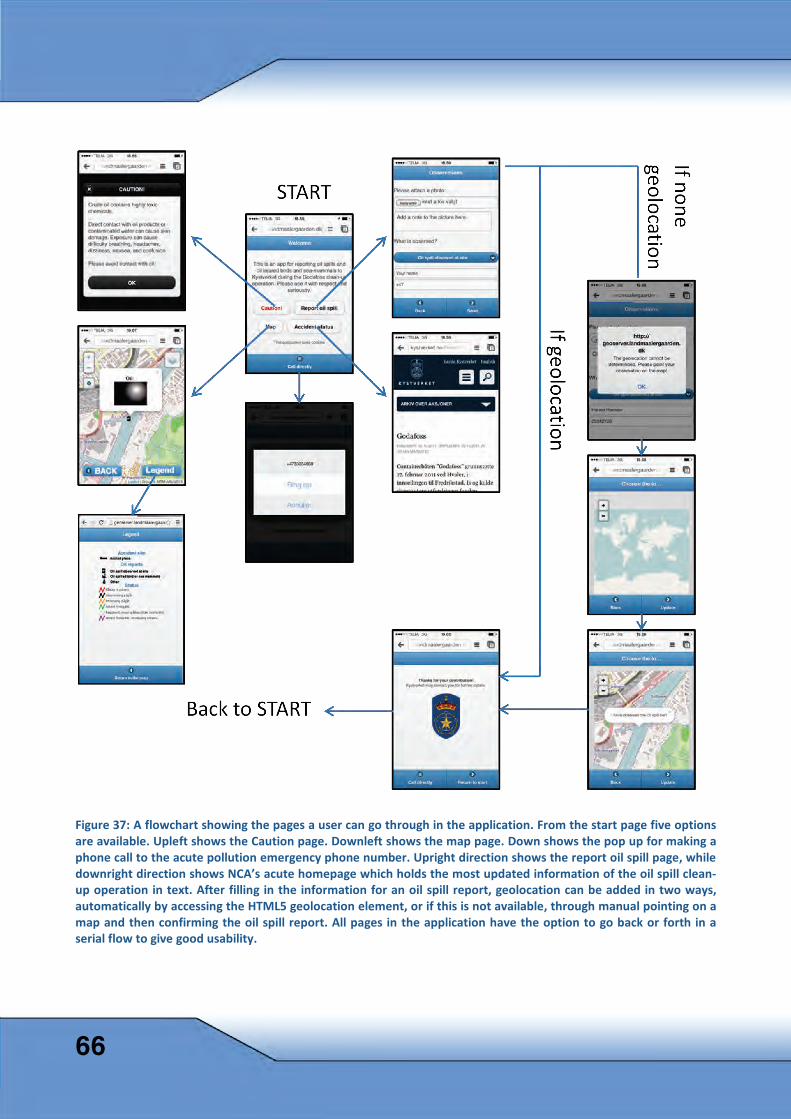
Figure 37: A flowchart showing the pages a user can go through in the application. From the start page five options are available. Upleft shows the Caution page. Downleft shows the map page. Down shows the pop up for making a phone call to the acute pollution emergency phone number. Upright direction shows the report oil spill page, while downright direction shows NCA’s acute homepage which holds the most updated information of the oil spill clean-up operation in text. After filling in the information for an oil spill report, geolocation can be added in two ways, automatically by accessing the HTML5 geolocation element, or if this is not available, through manual pointing on a map and then confirming the oil spill report. All pages in the application have the option to go back or forth in a serial flow to give good usability.
66
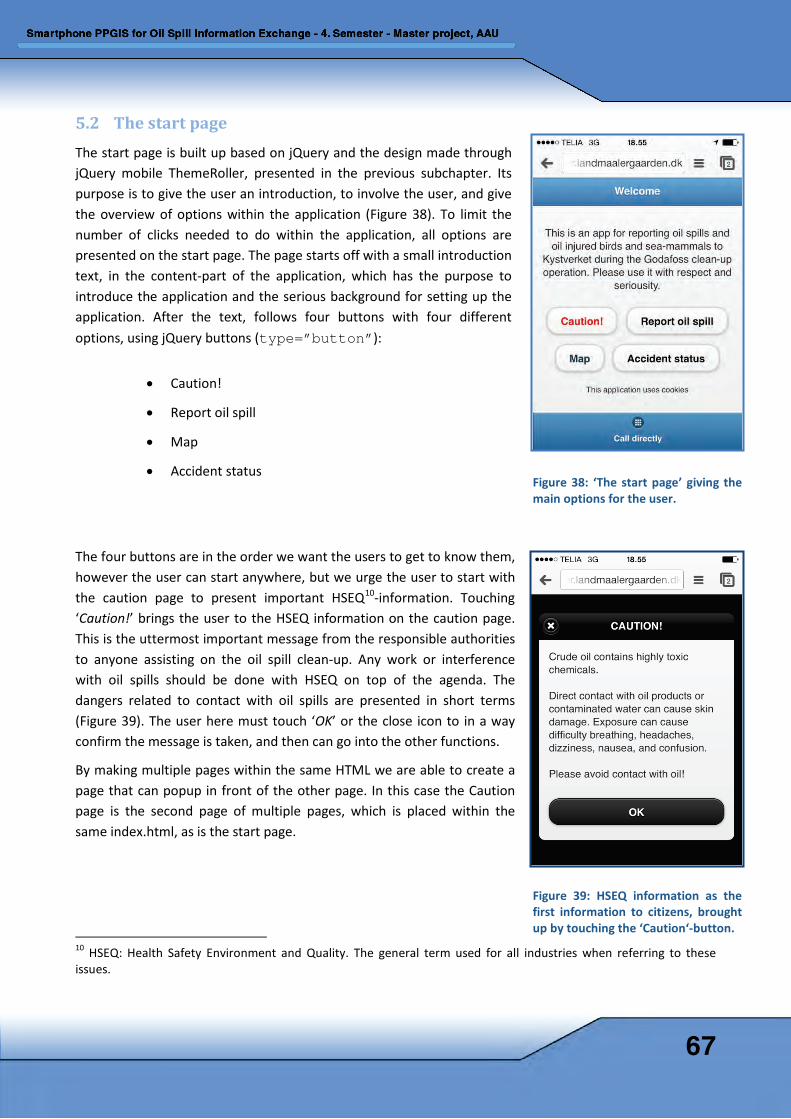
5.2 The start page The start page is built up based on jQuery and the design made through jQuery mobile ThemeRoller, presented in the previous subchapter. Its purpose is to give the user an introduction, to involve the user, and give the overview of options within the application (Figure 38). To limit the number of clicks needed to do within the application, all options are presented on the start page. The page starts off with a small introduction text, in the content-part of the application, which has the purpose to introduce the application and the serious background for setting up the application. After the text, follows four buttons with four different options, using jQuery buttons (type=”button”):
• Caution!
• Report oil spill
• Map
• Accident status
The four buttons are in the order we want the users to get to know them, however the user can start anywhere, but we urge the user to start with the caution page to present important HSEQ10-information. Touching ‘Caution!’ brings the user to the HSEQ information on the caution page. This is the uttermost important message from the responsible authorities to anyone assisting on the oil spill clean-up. Any work or interference with oil spills should be done with HSEQ on top of the agenda. The dangers related to contact with oil spills are presented in short terms (Figure 39). The user here must touch ‘OK’ or the close icon to in a way confirm the message is taken, and then can go into the other functions.
By making multiple pages within the same HTML we are able to create a page that can popup in front of the other page. In this case the Caution page is the second page of multiple pages, which is placed within the same index.html, as is the start page.
10 HSEQ: Health Safety Environment and Quality. The general term used for all industries when referring to these issues.
Figure 38: ‘The start page’ giving the main options for the user.
Figure 39: HSEQ information as the first information to citizens, brought up by touching the ‘Caution‘-button.
67
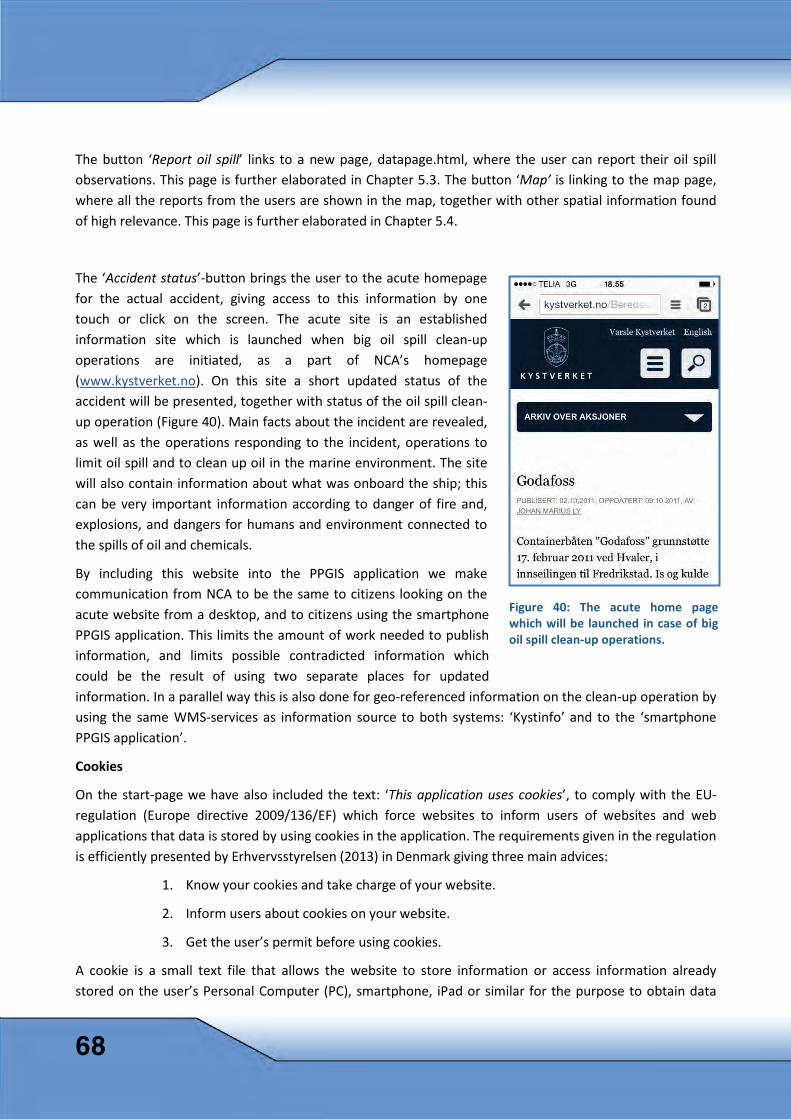
The button ‘Report oil spill’ links to a new page, datapage.html, where the user can report their oil spill observations. This page is further elaborated in Chapter 5.3. The button ‘Map’ is linking to the map page, where all the reports from the users are shown in the map, together with other spatial information found of high relevance. This page is further elaborated in Chapter 5.4.
The ‘Accident status’-button brings the user to the acute homepage for the actual accident, giving access to this information by one touch or click on the screen. The acute site is an established information site which is launched when big oil spill clean-up operations are initiated, as a part of NCA’s homepage (www.kystverket.no). On this site a short updated status of the accident will be presented, together with status of the oil spill clean-up operation (Figure 40). Main facts about the incident are revealed, as well as the operations responding to the incident, operations to limit oil spill and to clean up oil in the marine environment. The site will also contain information about what was onboard the ship; this can be very important information according to danger of fire and, explosions, and dangers for humans and environment connected to the spills of oil and chemicals.
By including this website into the PPGIS application we make communication from NCA to be the same to citizens looking on the acute website from a desktop, and to citizens using the smartphone PPGIS application. This limits the amount of work needed to publish information, and limits possible contradicted information which could be the result of using two separate places for updated information. In a parallel way this is also done for geo-referenced information on the clean-up operation by using the same WMS-services as information source to both systems: ‘Kystinfo’ and to the ‘smartphone PPGIS application’.
Cookies
On the start-page we have also included the text: ‘This application uses cookies’, to comply with the EU-regulation (Europe directive 2009/136/EF) which force websites to inform users of websites and web applications that data is stored by using cookies in the application. The requirements given in the regulation is efficiently presented by Erhvervsstyrelsen (2013) in Denmark giving three main advices:
1. Know your cookies and take charge of your website.
2. Inform users about cookies on your website.
3. Get the user’s permit before using cookies.
A cookie is a small text file that allows the website to store information or access information already stored on the user’s Personal Computer (PC), smartphone, iPad or similar for the purpose to obtain data
Figure 40: The acute home page which will be launched in case of big oil spill clean-up operations.
68
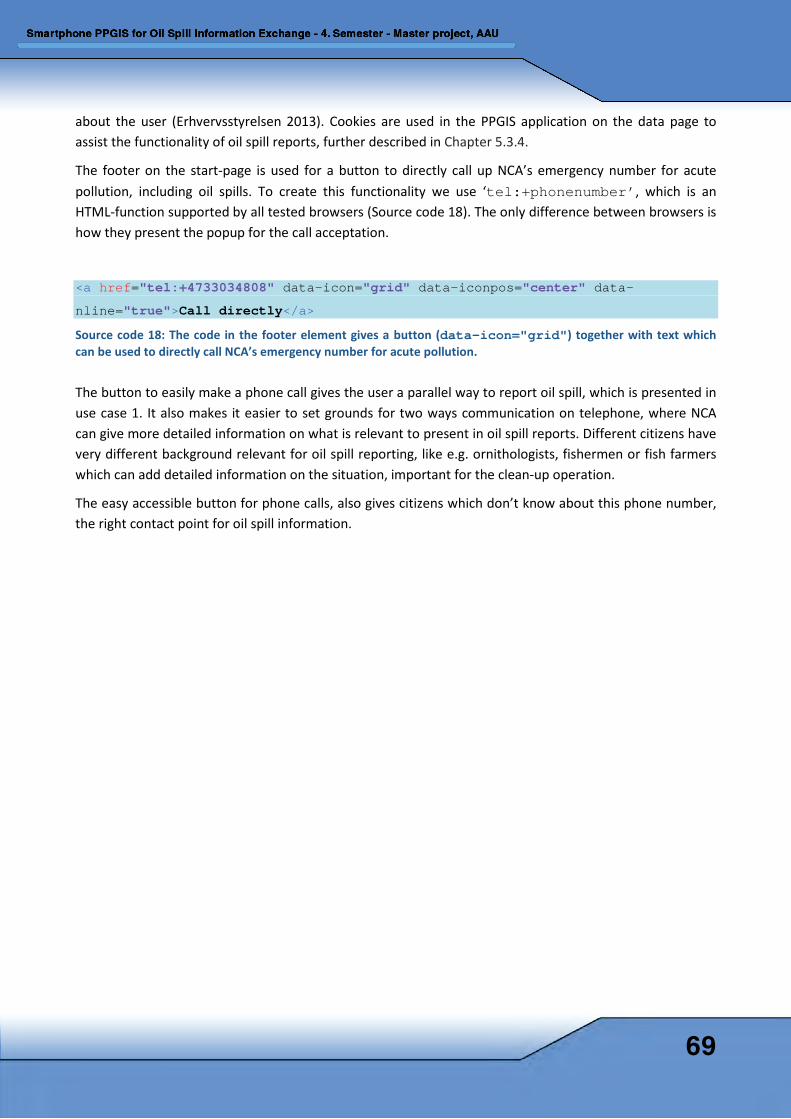
about the user (Erhvervsstyrelsen 2013). Cookies are used in the PPGIS application on the data page to assist the functionality of oil spill reports, further described in Chapter 5.3.4.
The footer on the start-page is used for a button to directly call up NCA’s emergency number for acute pollution, including oil spills. To create this functionality we use ‘tel:+phonenumber’, which is an HTML-function supported by all tested browsers (Source code 18). The only difference between browsers is how they present the popup for the call acceptation.
<a href="tel:+4733034808" data-icon="grid" data-iconpos="center" data-
nline="true">Call directly</a> Source code 18: The code in the footer element gives a button (data-icon="grid") together with text which can be used to directly call NCA’s emergency number for acute pollution.
The button to easily make a phone call gives the user a parallel way to report oil spill, which is presented in use case 1. It also makes it easier to set grounds for two ways communication on telephone, where NCA can give more detailed information on what is relevant to present in oil spill reports. Different citizens have very different background relevant for oil spill reporting, like e.g. ornithologists, fishermen or fish farmers which can add detailed information on the situation, important for the clean-up operation.
The easy accessible button for phone calls, also gives citizens which don’t know about this phone number, the right contact point for oil spill information.
69
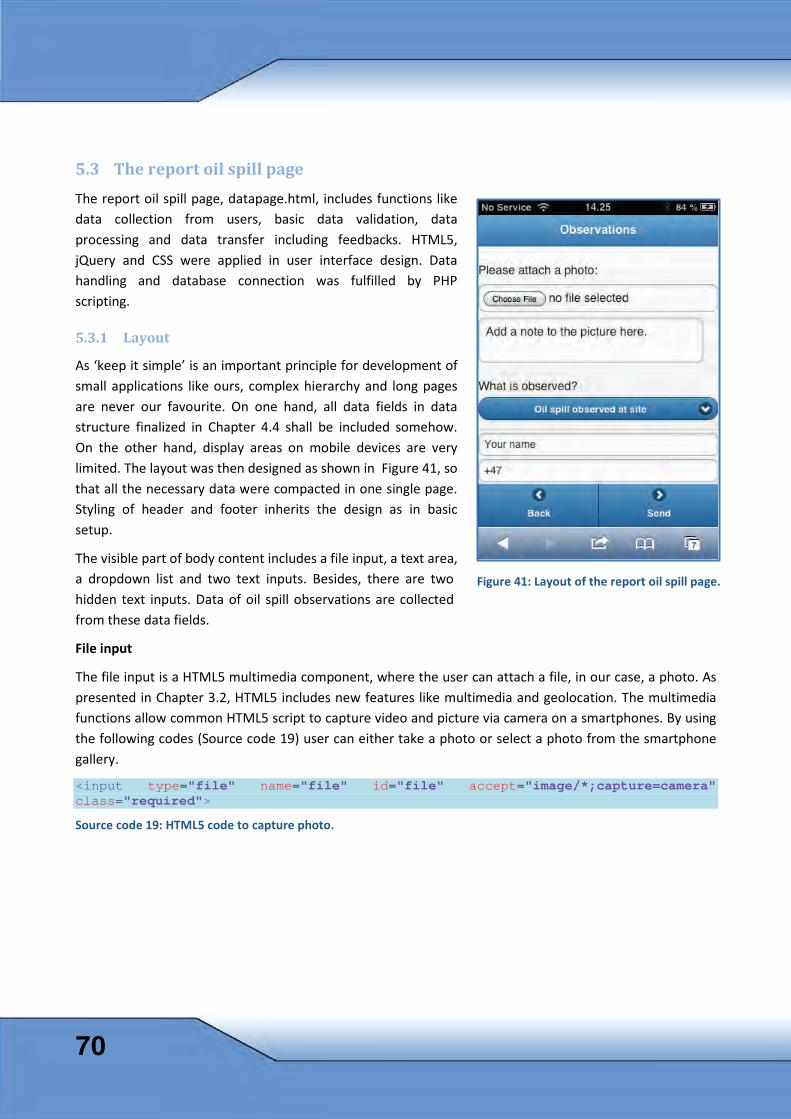
5.3 The report oil spill page The report oil spill page, datapage.html, includes functions like data collection from users, basic data validation, data processing and data transfer including feedbacks. HTML5, jQuery and CSS were applied in user interface design. Data handling and database connection was fulfilled by PHP scripting.
5.3.1 Layout
As ‘keep it simple’ is an important principle for development of small applications like ours, complex hierarchy and long pages are never our favourite. On one hand, all data fields in data structure finalized in Chapter 4.4 shall be included somehow. On the other hand, display areas on mobile devices are very limited. The layout was then designed as shown in Figure 41, so that all the necessary data were compacted in one single page. Styling of header and footer inherits the design as in basic setup.
The visible part of body content includes a file input, a text area, a dropdown list and two text inputs. Besides, there are two hidden text inputs. Data of oil spill observations are collected from these data fields.
File input
The file input is a HTML5 multimedia component, where the user can attach a file, in our case, a photo. As presented in Chapter 3.2, HTML5 includes new features like multimedia and geolocation. The multimedia functions allow common HTML5 script to capture video and picture via camera on a smartphones. By using the following codes (Source code 19) user can either take a photo or select a photo from the smartphone gallery.
<input type="file" name="file" id="file" accept="image/*;capture=camera" class="required">
Source code 19: HTML5 code to capture photo.
Figure 41: Layout of the report oil spill page.
70
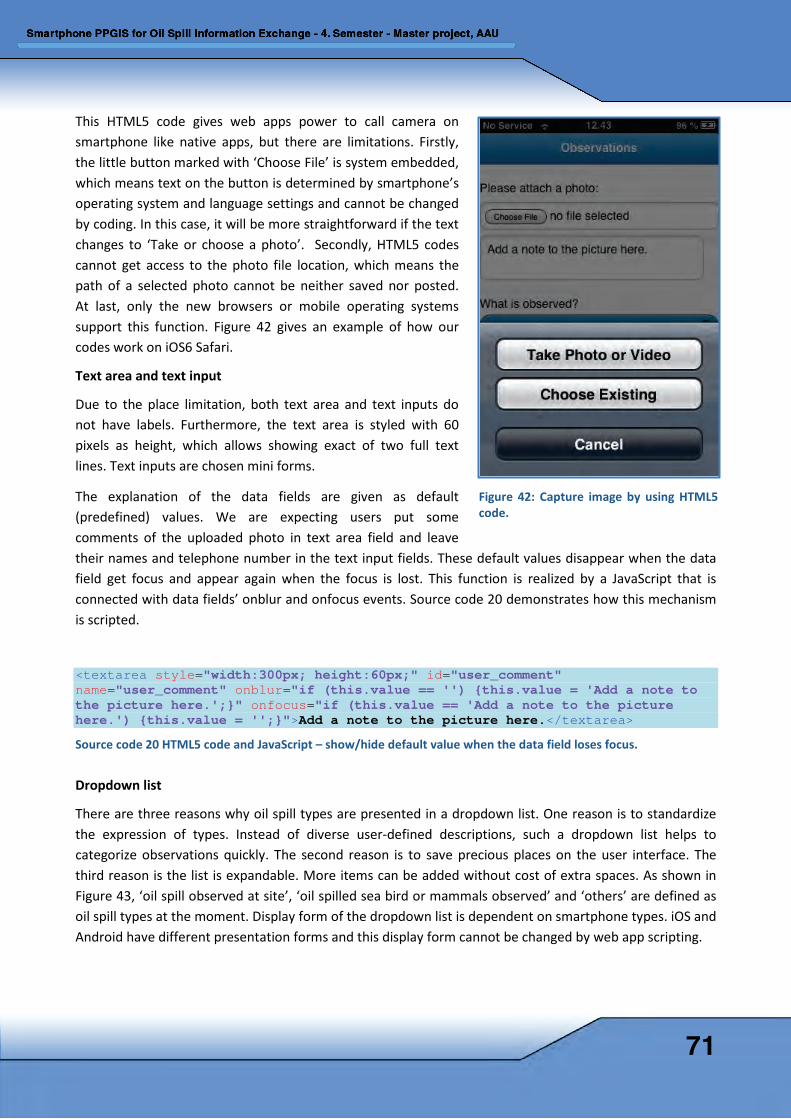
This HTML5 code gives web apps power to call camera on smartphone like native apps, but there are limitations. Firstly, the little button marked with ‘Choose File’ is system embedded, which means text on the button is determined by smartphone’s operating system and language settings and cannot be changed by coding. In this case, it will be more straightforward if the text changes to ‘Take or choose a photo’. Secondly, HTML5 codes cannot get access to the photo file location, which means the path of a selected photo cannot be neither saved nor posted. At last, only the new browsers or mobile operating systems support this function. Figure 42 gives an example of how our codes work on iOS6 Safari.
Text area and text input
Due to the place limitation, both text area and text inputs do not have labels. Furthermore, the text area is styled with 60 pixels as height, which allows showing exact of two full text lines. Text inputs are chosen mini forms.
The explanation of the data fields are given as default (predefined) values. We are expecting users put some comments of the uploaded photo in text area field and leave their names and telephone number in the text input fields. These default values disappear when the data field get focus and appear again when the focus is lost. This function is realized by a JavaScript that is connected with data fields’ onblur and onfocus events. Source code 20 demonstrates how this mechanism is scripted.
<textarea style="width:300px; height:60px;" id="user_comment" name="user_comment" onblur="if (this.value == '') {this.value = 'Add a note to the picture here.';}" onfocus="if (this.value == 'Add a note to the picture here.') {this.value = '';}">Add a note to the picture here.</textarea>
Source code 20 HTML5 code and JavaScript – show/hide default value when the data field loses focus.
Dropdown list
There are three reasons why oil spill types are presented in a dropdown list. One reason is to standardize the expression of types. Instead of diverse user-defined descriptions, such a dropdown list helps to categorize observations quickly. The second reason is to save precious places on the user interface. The third reason is the list is expandable. More items can be added without cost of extra spaces. As shown in Figure 43, ‘oil spill observed at site’, ‘oil spilled sea bird or mammals observed’ and ‘others’ are defined as oil spill types at the moment. Display form of the dropdown list is dependent on smartphone types. iOS and Android have different presentation forms and this display form cannot be changed by web app scripting.
Figure 42: Capture image by using HTML5 code.
71
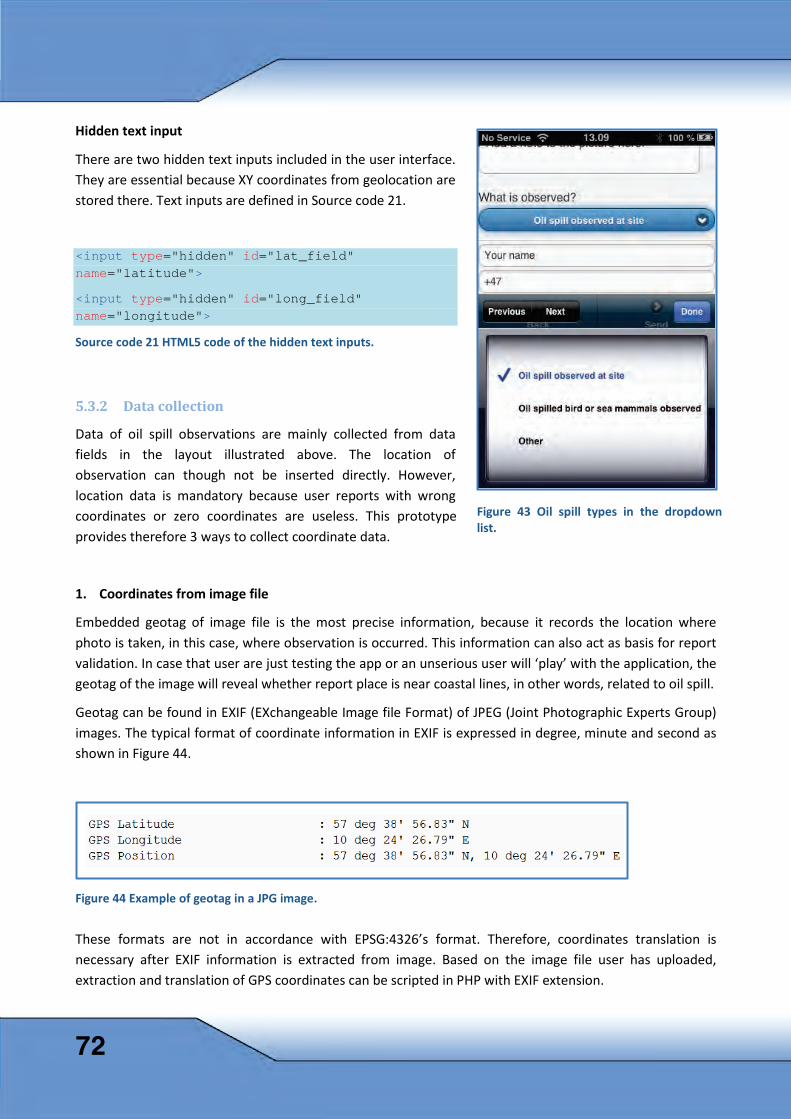
Hidden text input
There are two hidden text inputs included in the user interface. They are essential because XY coordinates from geolocation are stored there. Text inputs are defined in Source code 21.
<input type="hidden" id="lat_field" name="latitude">
<input type="hidden" id="long_field" name="longitude">
Source code 21 HTML5 code of the hidden text inputs.
5.3.2 Data collection
Data of oil spill observations are mainly collected from data fields in the layout illustrated above. The location of observation can though not be inserted directly. However, location data is mandatory because user reports with wrong coordinates or zero coordinates are useless. This prototype provides therefore 3 ways to collect coordinate data.
1. Coordinates from image file
Embedded geotag of image file is the most precise information, because it records the location where photo is taken, in this case, where observation is occurred. This information can also act as basis for report validation. In case that user are just testing the app or an unserious user will ‘play’ with the application, the geotag of the image will reveal whether report place is near coastal lines, in other words, related to oil spill.
Geotag can be found in EXIF (EXchangeable Image file Format) of JPEG (Joint Photographic Experts Group) images. The typical format of coordinate information in EXIF is expressed in degree, minute and second as shown in Figure 44.
Figure 44 Example of geotag in a JPG image.
These formats are not in accordance with EPSG:4326’s format. Therefore, coordinates translation is necessary after EXIF information is extracted from image. Based on the image file user has uploaded, extraction and translation of GPS coordinates can be scripted in PHP with EXIF extension.
Figure 43 Oil spill types in the dropdown list.
72
EXIF info is first extracted from image file by PHP’s exif_read_data function (Source code 22).
$exif=exif_read_data($image_full_name, 0, true); Source code 22: PHP script to extract Exif info from an image file.
The GPS coordinates is then retrieved in 4 parts (Source code 23).
$lat_ref = $exif['GPS']['GPSLatitudeRef']; //South (S) or North(N)
$lat = $exif['GPS']['GPSLatitude']; //GPS coordinates in degree, minute and second
$lon_ref = $exif['GPS']['GPSLongitudeRef']; //East (E) or West (W)
$lon = $exif['GPS']['GPSLongitude']; //GPS coordinates in degree, minute and second
Source code 23 PHP script to retrieve GPS coordinates.
The Source code 24 demonstrates how GPS latitude is translated in decimal degrees. The same translation is done on longitude. After the translation, the coordinates are sent further to data transfer process (see Chapter 5.3.4).
$lat_int = ($lat_s + $lat_m / 60.0 + $lat_v / 3600.0);
// check orientation of latitude and prefix with (-) if latitude ref. is S
$lat_int = ($lat_ref == "S") ? '-' . $lat_int : $lat_int; Source code 24: PHP script to translate GPS coordinates to decimal degrees.
2. Coordinates from geolocation
Geolocation refers to a user’s position where the app is used, in this case, where reporting takes place. The GPS in the smartphone is used to identify coordinates, but information is retrieved from the smartphones browser via the HTML5 geolocation function. Geolocation is a new feature of HTML5. According to caniuse (2013) iOS Safari 3.2+, Android 2.1+, Internet Explorer Mobile 10+, Firefox 25+, Chrome 31+ and Opera 17+ support geolocation.
In order to get the coordinates from smartphone browser, following JavaScript is used to retrieve the latitude and longitude from smartphones’ GPS. The results are coordinates in decimal degrees. The values are then stored in the two hidden text inputs in the layout (see Chapter 5.3.1).
73
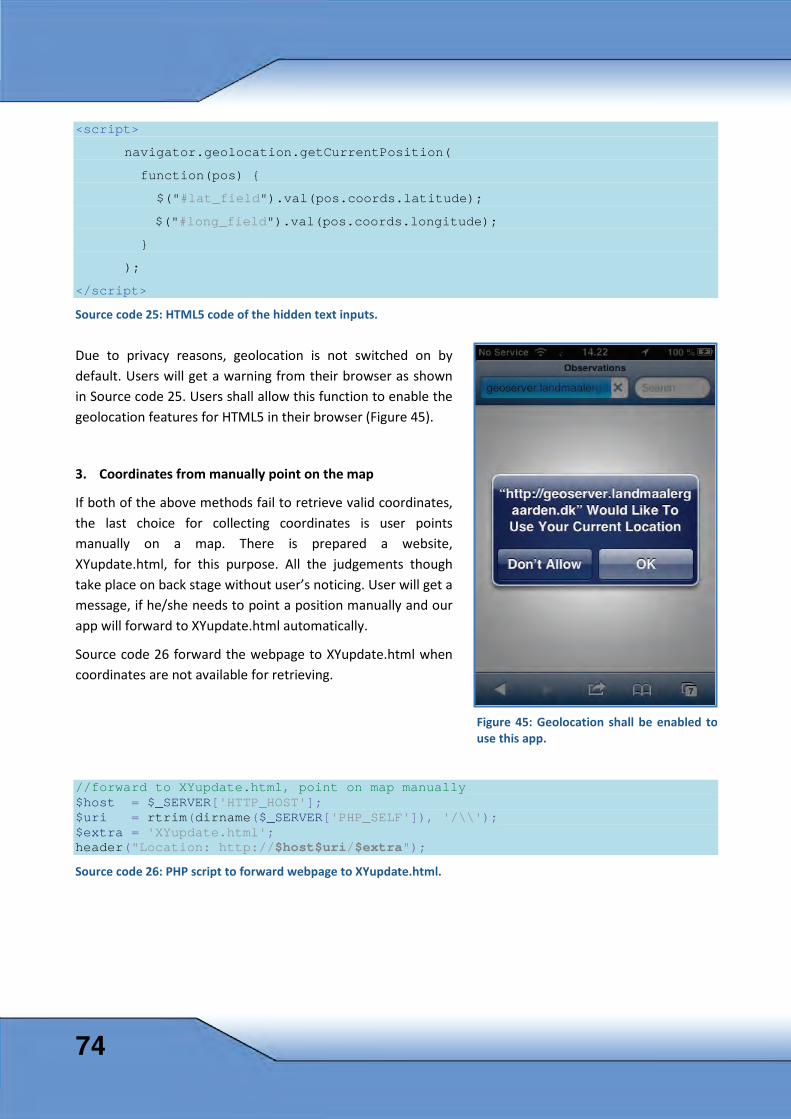
<script>
navigator.geolocation.getCurrentPosition(
function(pos) {
$("#lat_field").val(pos.coords.latitude);
$("#long_field").val(pos.coords.longitude);
}
);
</script>
Source code 25: HTML5 code of the hidden text inputs.
Due to privacy reasons, geolocation is not switched on by default. Users will get a warning from their browser as shown in Source code 25. Users shall allow this function to enable the geolocation features for HTML5 in their browser (Figure 45).
3. Coordinates from manually point on the map
If both of the above methods fail to retrieve valid coordinates, the last choice for collecting coordinates is user points manually on a map. There is prepared a website, XYupdate.html, for this purpose. All the judgements though take place on back stage without user’s noticing. User will get a message, if he/she needs to point a position manually and our app will forward to XYupdate.html automatically.
Source code 26 forward the webpage to XYupdate.html when coordinates are not available for retrieving.
//forward to XYupdate.html, point on map manually $host = $_SERVER['HTTP_HOST']; $uri = rtrim(dirname($_SERVER['PHP_SELF']), '/\\'); $extra = 'XYupdate.html'; header("Location: http://$host$uri/$extra");
Source code 26: PHP script to forward webpage to XYupdate.html.
Figure 45: Geolocation shall be enabled to use this app.
74
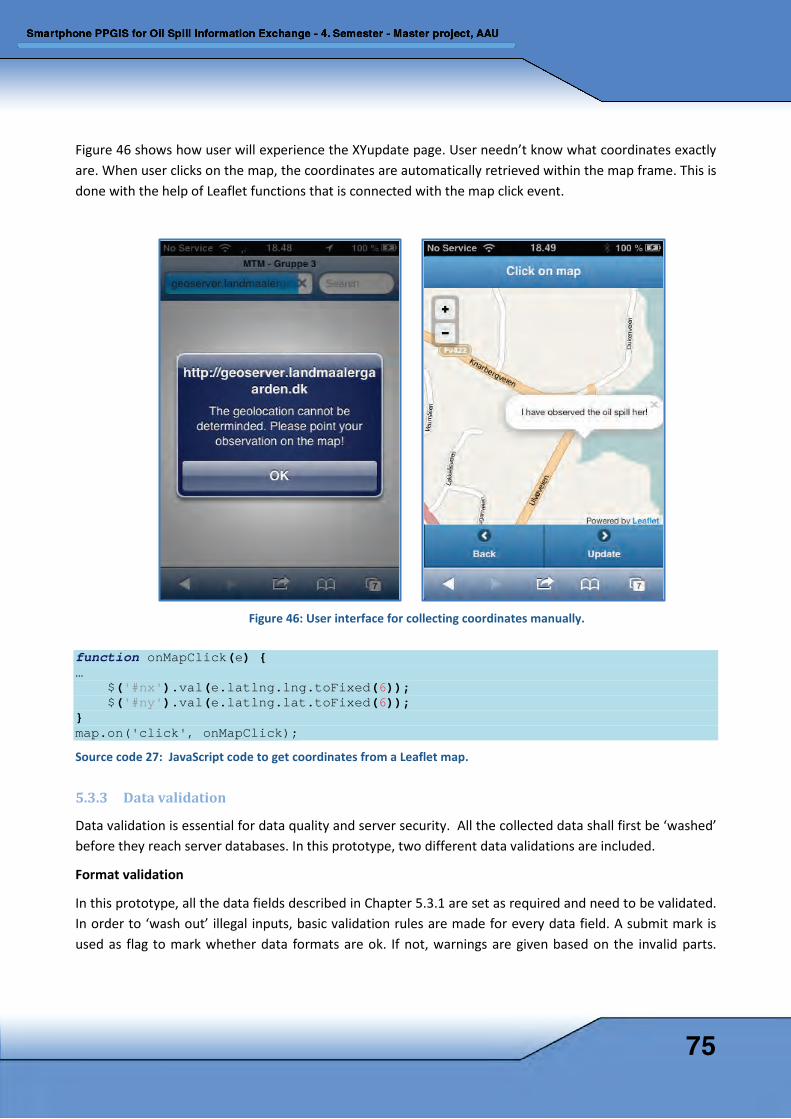
Figure 46 shows how user will experience the XYupdate page. User needn’t know what coordinates exactly are. When user clicks on the map, the coordinates are automatically retrieved within the map frame. This is done with the help of Leaflet functions that is connected with the map click event.
Figure 46: User interface for collecting coordinates manually.
function onMapClick(e) { …
$('#nx').val(e.latlng.lng.toFixed(6)); $('#ny').val(e.latlng.lat.toFixed(6));
} map.on('click', onMapClick);
Source code 27: JavaScript code to get coordinates from a Leaflet map.
5.3.3 Data validation
Data validation is essential for data quality and server security. All the collected data shall first be ‘washed’ before they reach server databases. In this prototype, two different data validations are included.
Format validation
In this prototype, all the data fields described in Chapter 5.3.1 are set as required and need to be validated. In order to ‘wash out’ illegal inputs, basic validation rules are made for every data field. A submit mark is used as flag to mark whether data formats are ok. If not, warnings are given based on the invalid parts.
75
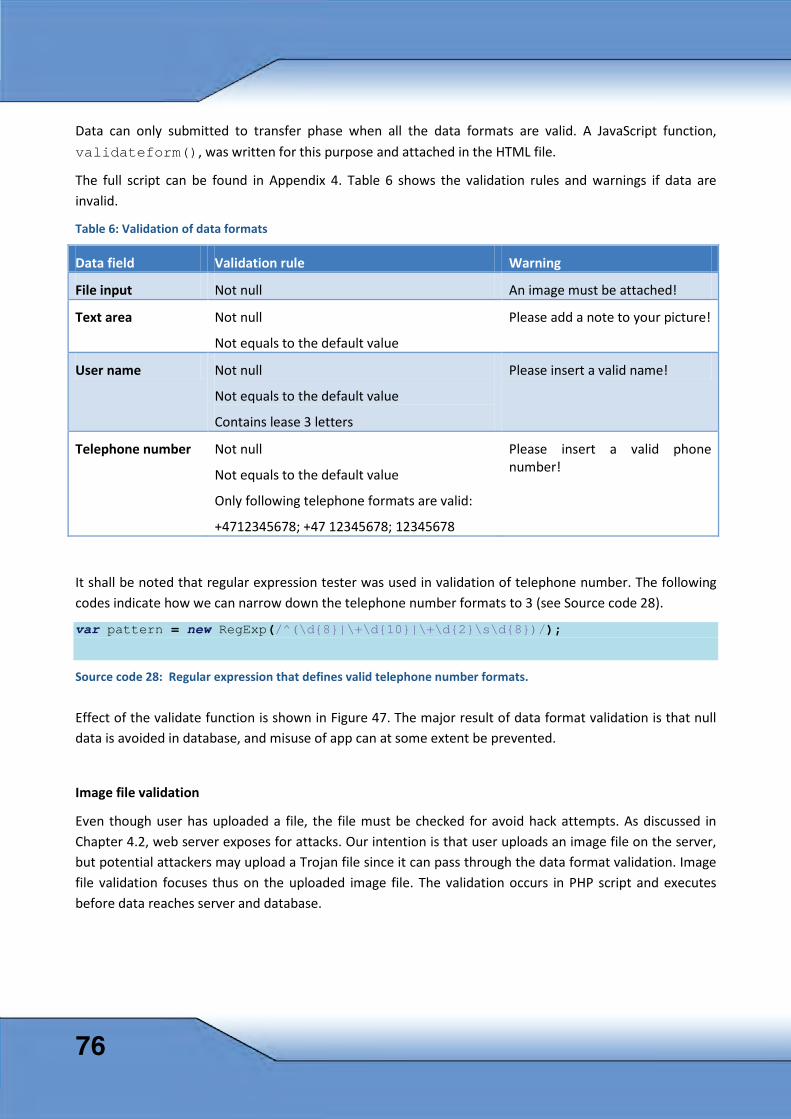
Data can only submitted to transfer phase when all the data formats are valid. A JavaScript function, validateform(), was written for this purpose and attached in the HTML file.
The full script can be found in Appendix 4. Table 6 shows the validation rules and warnings if data are invalid.
Table 6: Validation of data formats
Data field Validation rule Warning
File input Not null An image must be attached!
Text area Not null
Not equals to the default value
Please add a note to your picture!
User name Not null
Not equals to the default value
Contains lease 3 letters
Please insert a valid name!
Telephone number Not null
Not equals to the default value
Only following telephone formats are valid:
+4712345678; +47 12345678; 12345678
Please insert a valid phone number!
It shall be noted that regular expression tester was used in validation of telephone number. The following codes indicate how we can narrow down the telephone number formats to 3 (see Source code 28).
var pattern = new RegExp(/^(\d{8}|\+\d{10}|\+\d{2}\s\d{8})/);
Source code 28: Regular expression that defines valid telephone number formats.
Effect of the validate function is shown in Figure 47. The major result of data format validation is that null data is avoided in database, and misuse of app can at some extent be prevented.
Image file validation
Even though user has uploaded a file, the file must be checked for avoid hack attempts. As discussed in Chapter 4.2, web server exposes for attacks. Our intention is that user uploads an image file on the server, but potential attackers may upload a Trojan file since it can pass through the data format validation. Image file validation focuses thus on the uploaded image file. The validation occurs in PHP script and executes before data reaches server and database.
76
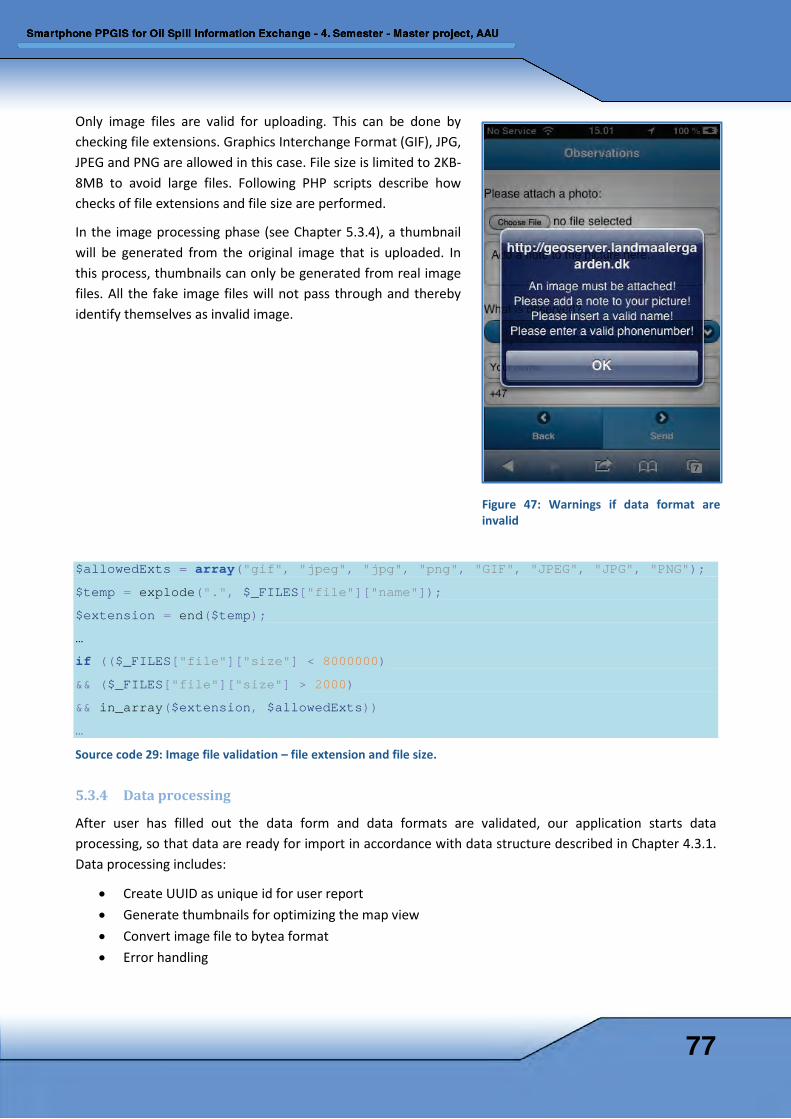
Only image files are valid for uploading. This can be done by checking file extensions. Graphics Interchange Format (GIF), JPG, JPEG and PNG are allowed in this case. File size is limited to 2KB-8MB to avoid large files. Following PHP scripts describe how checks of file extensions and file size are performed.
In the image processing phase (see Chapter 5.3.4), a thumbnail will be generated from the original image that is uploaded. In this process, thumbnails can only be generated from real image files. All the fake image files will not pass through and thereby identify themselves as invalid image.
$allowedExts = array("gif", "jpeg", "jpg", "png", "GIF", "JPEG", "JPG", "PNG");
$temp = explode(".", $_FILES["file"]["name"]);
$extension = end($temp);
…
if (($_FILES["file"]["size"] < 8000000)
&& ($_FILES["file"]["size"] > 2000)
&& in_array($extension, $allowedExts))
… Source code 29: Image file validation – file extension and file size.
5.3.4 Data processing
After user has filled out the data form and data formats are validated, our application starts data processing, so that data are ready for import in accordance with data structure described in Chapter 4.3.1. Data processing includes:
• Create UUID as unique id for user report • Generate thumbnails for optimizing the map view • Convert image file to bytea format • Error handling
Figure 47: Warnings if data format are invalid
77
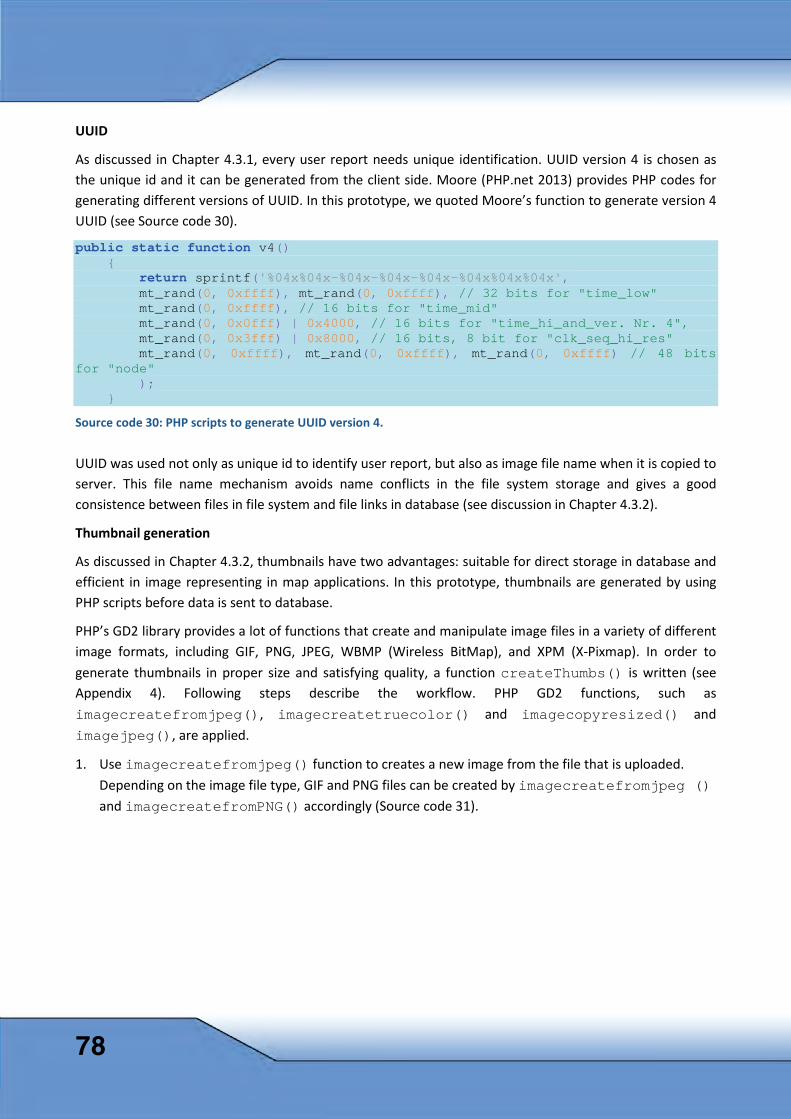
UUID
As discussed in Chapter 4.3.1, every user report needs unique identification. UUID version 4 is chosen as the unique id and it can be generated from the client side. Moore (PHP.net 2013) provides PHP codes for generating different versions of UUID. In this prototype, we quoted Moore’s function to generate version 4 UUID (see Source code 30).
public static function v4() { return sprintf('%04x%04x-%04x-%04x-%04x-%04x%04x%04x', mt_rand(0, 0xffff), mt_rand(0, 0xffff), // 32 bits for "time_low" mt_rand(0, 0xffff), // 16 bits for "time_mid" mt_rand(0, 0x0fff) | 0x4000, // 16 bits for "time_hi_and_ver. Nr. 4", mt_rand(0, 0x3fff) | 0x8000, // 16 bits, 8 bit for "clk_seq_hi_res" mt_rand(0, 0xffff), mt_rand(0, 0xffff), mt_rand(0, 0xffff) // 48 bits for "node" ); } Source code 30: PHP scripts to generate UUID version 4.
UUID was used not only as unique id to identify user report, but also as image file name when it is copied to server. This file name mechanism avoids name conflicts in the file system storage and gives a good consistence between files in file system and file links in database (see discussion in Chapter 4.3.2).
Thumbnail generation
As discussed in Chapter 4.3.2, thumbnails have two advantages: suitable for direct storage in database and efficient in image representing in map applications. In this prototype, thumbnails are generated by using PHP scripts before data is sent to database.
PHP’s GD2 library provides a lot of functions that create and manipulate image files in a variety of different image formats, including GIF, PNG, JPEG, WBMP (Wireless BitMap), and XPM (X-Pixmap). In order to generate thumbnails in proper size and satisfying quality, a function createThumbs() is written (see Appendix 4). Following steps describe the workflow. PHP GD2 functions, such as imagecreatefromjpeg(), imagecreatetruecolor() and imagecopyresized() and imagejpeg(), are applied.
1. Use imagecreatefromjpeg() function to creates a new image from the file that is uploaded. Depending on the image file type, GIF and PNG files can be created by imagecreatefromjpeg () and imagecreatefromPNG() accordingly (Source code 31).
78
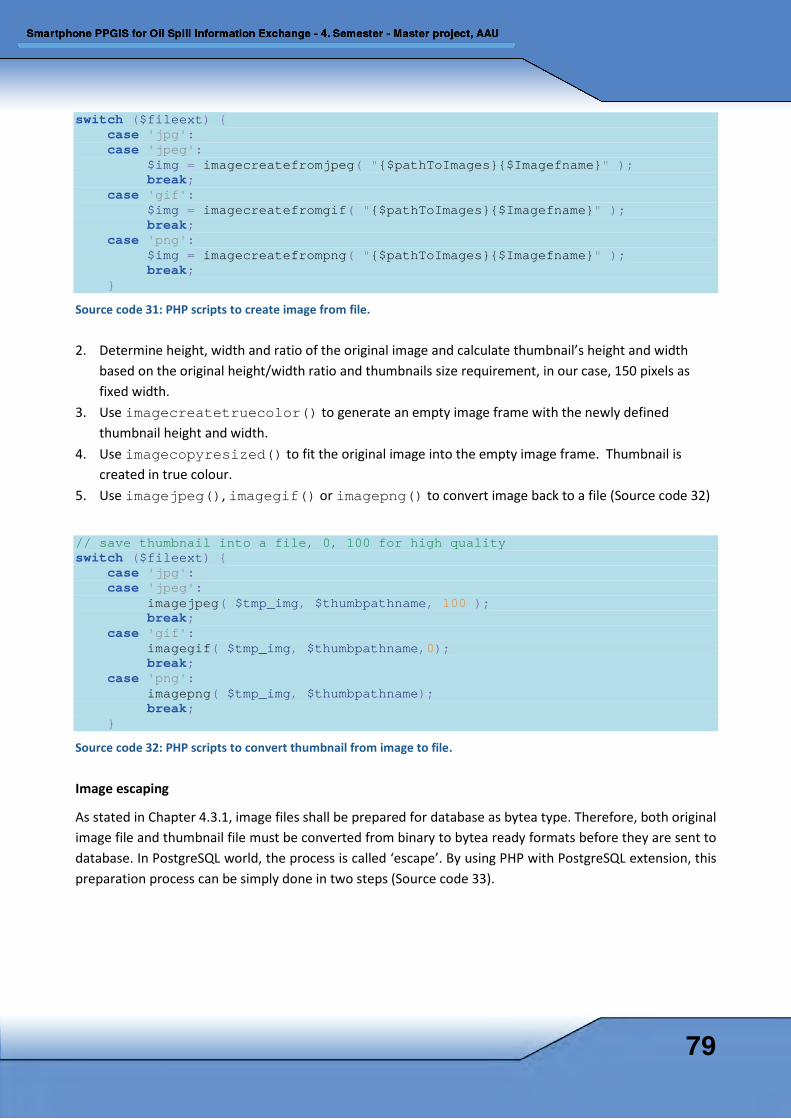
switch ($fileext) { case 'jpg': case 'jpeg': $img = imagecreatefromjpeg( "{$pathToImages}{$Imagefname}" ); break; case 'gif': $img = imagecreatefromgif( "{$pathToImages}{$Imagefname}" ); break; case 'png': $img = imagecreatefrompng( "{$pathToImages}{$Imagefname}" ); break; }
Source code 31: PHP scripts to create image from file.
2. Determine height, width and ratio of the original image and calculate thumbnail’s height and width based on the original height/width ratio and thumbnails size requirement, in our case, 150 pixels as fixed width.
3. Use imagecreatetruecolor() to generate an empty image frame with the newly defined thumbnail height and width.
4. Use imagecopyresized() to fit the original image into the empty image frame. Thumbnail is created in true colour.
5. Use imagejpeg(), imagegif() or imagepng() to convert image back to a file (Source code 32)
// save thumbnail into a file, 0, 100 for high quality switch ($fileext) { case 'jpg': case 'jpeg': imagejpeg( $tmp_img, $thumbpathname, 100 ); break; case 'gif': imagegif( $tmp_img, $thumbpathname,0); break; case 'png': imagepng( $tmp_img, $thumbpathname); break; } Source code 32: PHP scripts to convert thumbnail from image to file.
Image escaping
As stated in Chapter 4.3.1, image files shall be prepared for database as bytea type. Therefore, both original image file and thumbnail file must be converted from binary to bytea ready formats before they are sent to database. In PostgreSQL world, the process is called ‘escape’. By using PHP with PostgreSQL extension, this preparation process can be simply done in two steps (Source code 33).
79
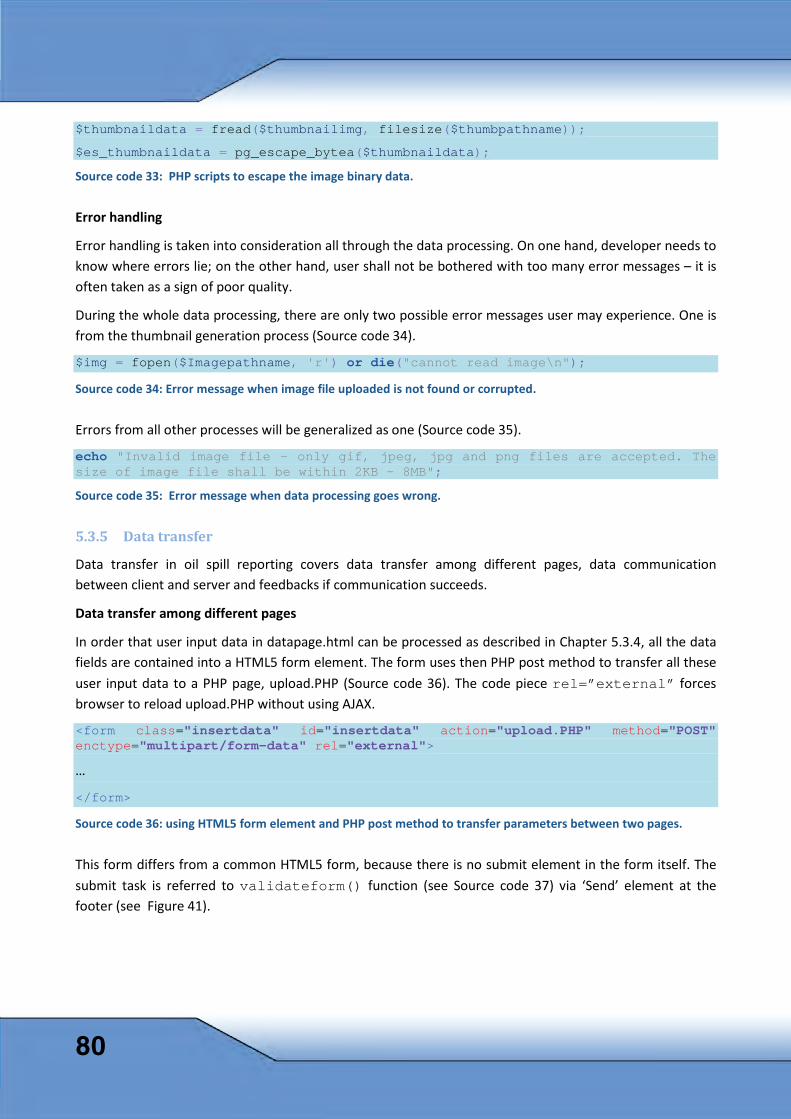
$thumbnaildata = fread($thumbnailimg, filesize($thumbpathname));
$es_thumbnaildata = pg_escape_bytea($thumbnaildata); Source code 33: PHP scripts to escape the image binary data.
Error handling
Error handling is taken into consideration all through the data processing. On one hand, developer needs to know where errors lie; on the other hand, user shall not be bothered with too many error messages – it is often taken as a sign of poor quality.
During the whole data processing, there are only two possible error messages user may experience. One is from the thumbnail generation process (Source code 34).
$img = fopen($Imagepathname, 'r') or die("cannot read image\n");
Source code 34: Error message when image file uploaded is not found or corrupted.
Errors from all other processes will be generalized as one (Source code 35).
echo "Invalid image file - only gif, jpeg, jpg and png files are accepted. The size of image file shall be within 2KB - 8MB"; Source code 35: Error message when data processing goes wrong.
5.3.5 Data transfer
Data transfer in oil spill reporting covers data transfer among different pages, data communication between client and server and feedbacks if communication succeeds.
Data transfer among different pages
In order that user input data in datapage.html can be processed as described in Chapter 5.3.4, all the data fields are contained into a HTML5 form element. The form uses then PHP post method to transfer all these user input data to a PHP page, upload.PHP (Source code 36). The code piece rel=”external” forces browser to reload upload.PHP without using AJAX.
<form class="insertdata" id="insertdata" action="upload.PHP" method="POST" enctype="multipart/form-data" rel="external"> …
</form>
Source code 36: using HTML5 form element and PHP post method to transfer parameters between two pages.
This form differs from a common HTML5 form, because there is no submit element in the form itself. The submit task is referred to validateform() function (see Source code 37) via ‘Send’ element at the footer (see Figure 41).
80
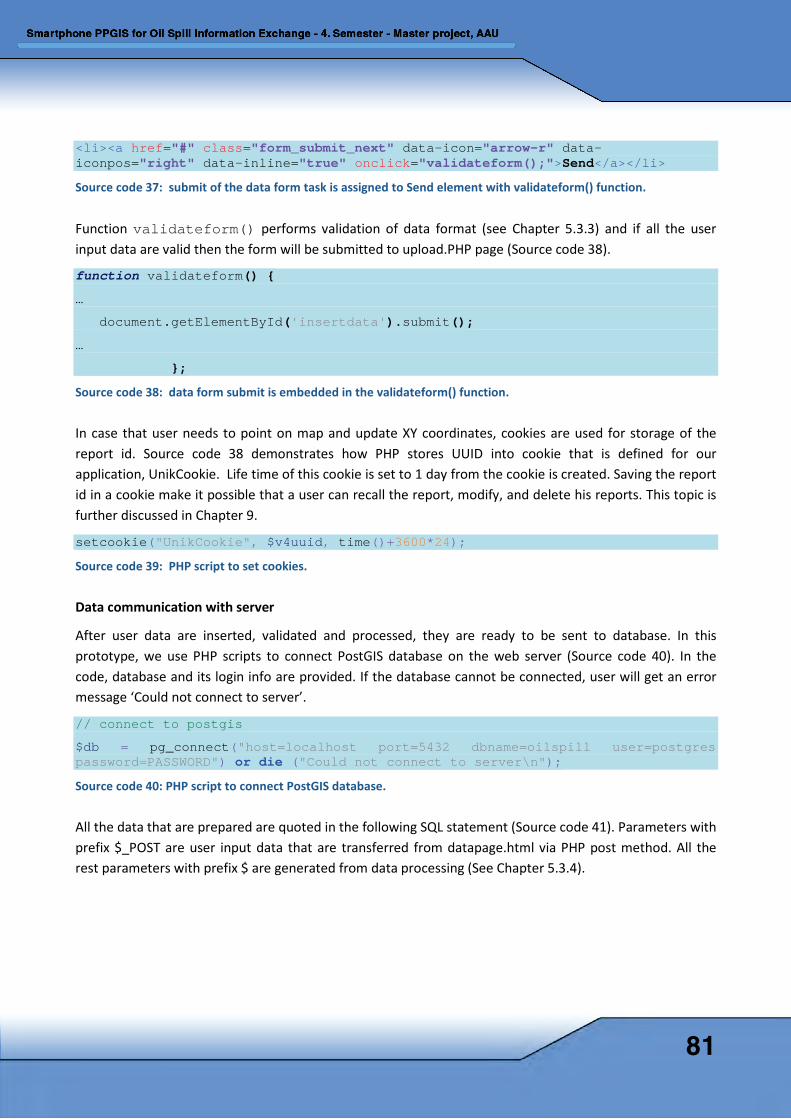
<li><a href="#" class="form_submit_next" data-icon="arrow-r" data-iconpos="right" data-inline="true" onclick="validateform();">Send</a></li> Source code 37: submit of the data form task is assigned to Send element with validateform() function.
Function validateform() performs validation of data format (see Chapter 5.3.3) and if all the user input data are valid then the form will be submitted to upload.PHP page (Source code 38).
function validateform() {
…
document.getElementById('insertdata').submit();
…
}; Source code 38: data form submit is embedded in the validateform() function.
In case that user needs to point on map and update XY coordinates, cookies are used for storage of the report id. Source code 38 demonstrates how PHP stores UUID into cookie that is defined for our application, UnikCookie. Life time of this cookie is set to 1 day from the cookie is created. Saving the report id in a cookie make it possible that a user can recall the report, modify, and delete his reports. This topic is further discussed in Chapter 9.
setcookie("UnikCookie", $v4uuid, time()+3600*24); Source code 39: PHP script to set cookies.
Data communication with server
After user data are inserted, validated and processed, they are ready to be sent to database. In this prototype, we use PHP scripts to connect PostGIS database on the web server (Source code 40). In the code, database and its login info are provided. If the database cannot be connected, user will get an error message ‘Could not connect to server’.
// connect to postgis
$db = pg_connect("host=localhost port=5432 dbname=oilspill user=postgres password=PASSWORD") or die ("Could not connect to server\n"); Source code 40: PHP script to connect PostGIS database.
All the data that are prepared are quoted in the following SQL statement (Source code 41). Parameters with prefix $_POST are user input data that are transferred from datapage.html via PHP post method. All the rest parameters with prefix $ are generated from data processing (See Chapter 5.3.4).
81
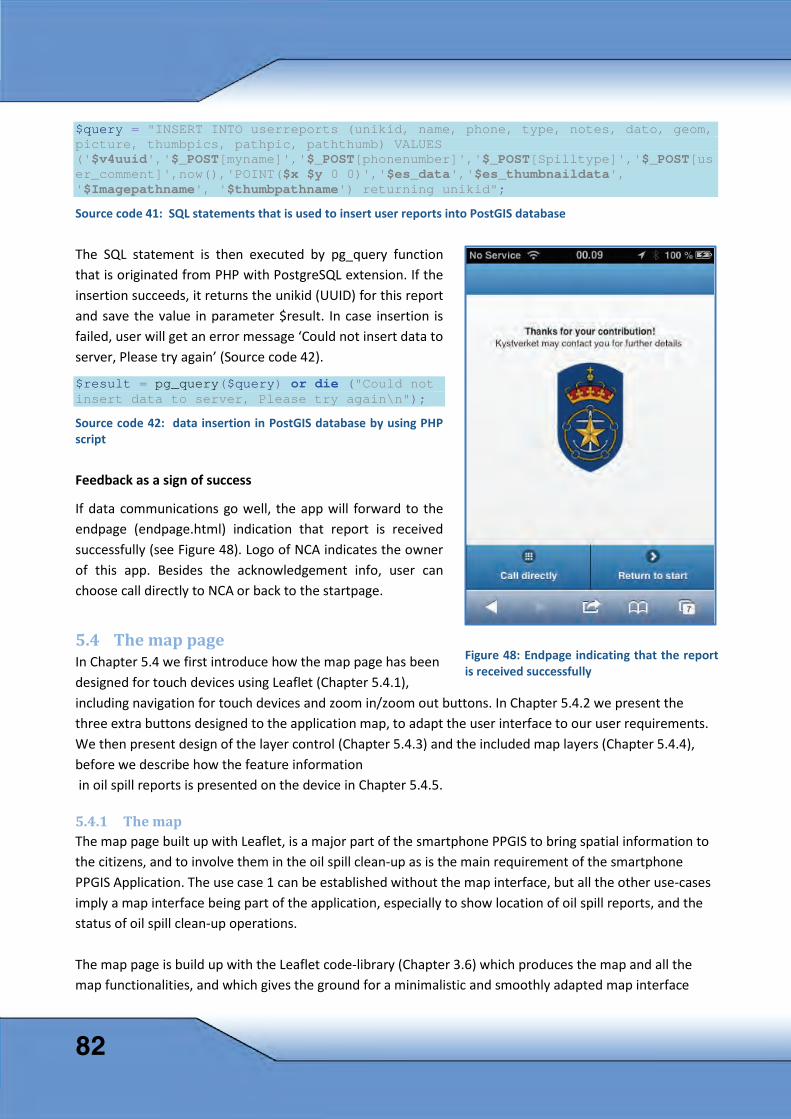
$query = "INSERT INTO userreports (unikid, name, phone, type, notes, dato, geom, picture, thumbpics, pathpic, paththumb) VALUES ('$v4uuid','$_POST[myname]','$_POST[phonenumber]','$_POST[Spilltype]','$_POST[user_comment]',now(),'POINT($x $y 0 0)','$es_data','$es_thumbnaildata', '$Imagepathname', '$thumbpathname') returning unikid";
Source code 41: SQL statements that is used to insert user reports into PostGIS database
The SQL statement is then executed by pg_query function that is originated from PHP with PostgreSQL extension. If the insertion succeeds, it returns the unikid (UUID) for this report and save the value in parameter $result. In case insertion is failed, user will get an error message ‘Could not insert data to server, Please try again’ (Source code 42).
$result = pg_query($query) or die ("Could not insert data to server, Please try again\n"); Source code 42: data insertion in PostGIS database by using PHP script
Feedback as a sign of success
If data communications go well, the app will forward to the endpage (endpage.html) indication that report is received successfully (see Figure 48). Logo of NCA indicates the owner of this app. Besides the acknowledgement info, user can choose call directly to NCA or back to the startpage.
5.4 The map page In Chapter 5.4 we first introduce how the map page has been designed for touch devices using Leaflet (Chapter 5.4.1), including navigation for touch devices and zoom in/zoom out buttons. In Chapter 5.4.2 we present the three extra buttons designed to the application map, to adapt the user interface to our user requirements. We then present design of the layer control (Chapter 5.4.3) and the included map layers (Chapter 5.4.4), before we describe how the feature information in oil spill reports is presented on the device in Chapter 5.4.5.
5.4.1 The map The map page built up with Leaflet, is a major part of the smartphone PPGIS to bring spatial information to the citizens, and to involve them in the oil spill clean-up as is the main requirement of the smartphone PPGIS Application. The use case 1 can be established without the map interface, but all the other use-cases imply a map interface being part of the application, especially to show location of oil spill reports, and the status of oil spill clean-up operations. The map page is build up with the Leaflet code-library (Chapter 3.6) which produces the map and all the map functionalities, and which gives the ground for a minimalistic and smoothly adapted map interface
Figure 48: Endpage indicating that the report is received successfully
82
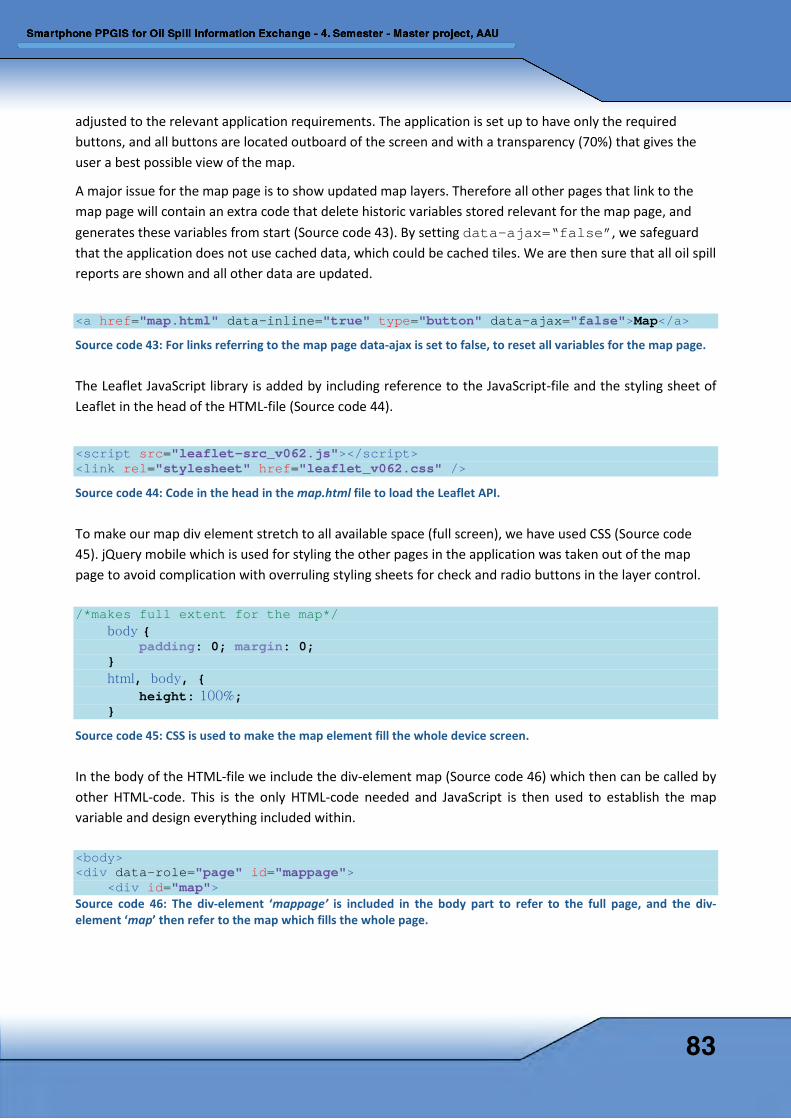
adjusted to the relevant application requirements. The application is set up to have only the required buttons, and all buttons are located outboard of the screen and with a transparency (70%) that gives the user a best possible view of the map.
A major issue for the map page is to show updated map layers. Therefore all other pages that link to the map page will contain an extra code that delete historic variables stored relevant for the map page, and generates these variables from start (Source code 43). By setting data-ajax=“false”, we safeguard that the application does not use cached data, which could be cached tiles. We are then sure that all oil spill reports are shown and all other data are updated.
<a href="map.html" data-inline="true" type="button" data-ajax="false">Map</a>
Source code 43: For links referring to the map page data-ajax is set to false, to reset all variables for the map page.
The Leaflet JavaScript library is added by including reference to the JavaScript-file and the styling sheet of Leaflet in the head of the HTML-file (Source code 44).
<script src="leaflet-src_v062.js"></script> <link rel="stylesheet" href="leaflet_v062.css" /> Source code 44: Code in the head in the map.html file to load the Leaflet API.
To make our map div element stretch to all available space (full screen), we have used CSS (Source code 45). jQuery mobile which is used for styling the other pages in the application was taken out of the map page to avoid complication with overruling styling sheets for check and radio buttons in the layer control. /*makes full extent for the map*/ body { padding: 0; margin: 0; } html, body, { height: 100%; } Source code 45: CSS is used to make the map element fill the whole device screen.
In the body of the HTML-file we include the div-element map (Source code 46) which then can be called by other HTML-code. This is the only HTML-code needed and JavaScript is then used to establish the map variable and design everything included within.
<body> <div data-role="page" id="mappage"> <div id="map"> Source code 46: The div-element ‘mappage’ is included in the body part to refer to the full page, and the div-element ‘map’ then refer to the map which fills the whole page.
83
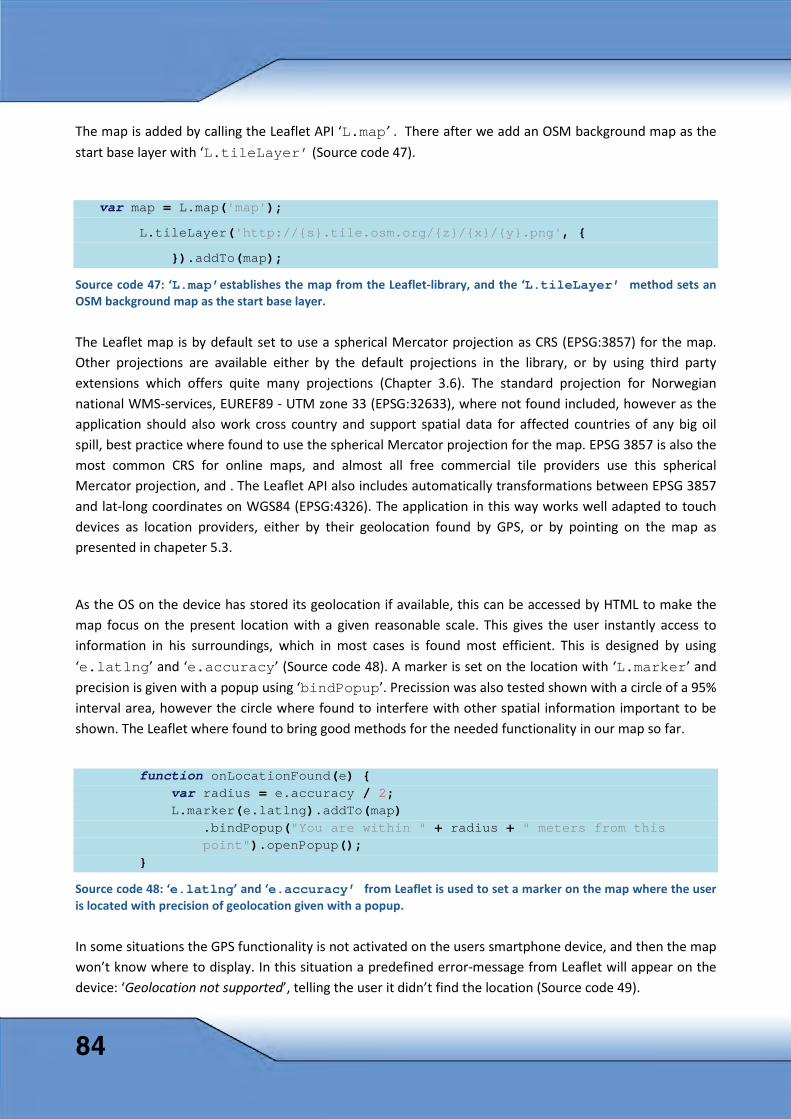
The map is added by calling the Leaflet API ‘L.map’ . There after we add an OSM background map as the start base layer with ‘L.tileLayer’ (Source code 47).
var map = L.map('map');
L.tileLayer('http://{s}.tile.osm.org/{z}/{x}/{y}.png', {
}).addTo(map);
Source code 47: ‘L.map’establishes the map from the Leaflet-library, and the ‘L.tileLayer’ method sets an OSM background map as the start base layer.
The Leaflet map is by default set to use a spherical Mercator projection as CRS (EPSG:3857) for the map. Other projections are available either by the default projections in the library, or by using third party extensions which offers quite many projections (Chapter 3.6). The standard projection for Norwegian national WMS-services, EUREF89 - UTM zone 33 (EPSG:32633), where not found included, however as the application should also work cross country and support spatial data for affected countries of any big oil spill, best practice where found to use the spherical Mercator projection for the map. EPSG 3857 is also the most common CRS for online maps, and almost all free commercial tile providers use this spherical Mercator projection, and . The Leaflet API also includes automatically transformations between EPSG 3857 and lat-long coordinates on WGS84 (EPSG:4326). The application in this way works well adapted to touch devices as location providers, either by their geolocation found by GPS, or by pointing on the map as presented in chapeter 5.3.
As the OS on the device has stored its geolocation if available, this can be accessed by HTML to make the map focus on the present location with a given reasonable scale. This gives the user instantly access to information in his surroundings, which in most cases is found most efficient. This is designed by using ‘e.latlng’ and ‘e.accuracy’ (Source code 48). A marker is set on the location with ‘L.marker’ and precision is given with a popup using ‘bindPopup’. Precission was also tested shown with a circle of a 95% interval area, however the circle where found to interfere with other spatial information important to be shown. The Leaflet where found to bring good methods for the needed functionality in our map so far.
function onLocationFound(e) { var radius = e.accuracy / 2; L.marker(e.latlng).addTo(map) .bindPopup("You are within " + radius + " meters from this point").openPopup(); }
Source code 48: ‘e.latlng’ and ‘e.accuracy’ from Leaflet is used to set a marker on the map where the user is located with precision of geolocation given with a popup.
In some situations the GPS functionality is not activated on the users smartphone device, and then the map won’t know where to display. In this situation a predefined error-message from Leaflet will appear on the device: ‘Geolocation not supported’, telling the user it didn’t find the location (Source code 49).
84
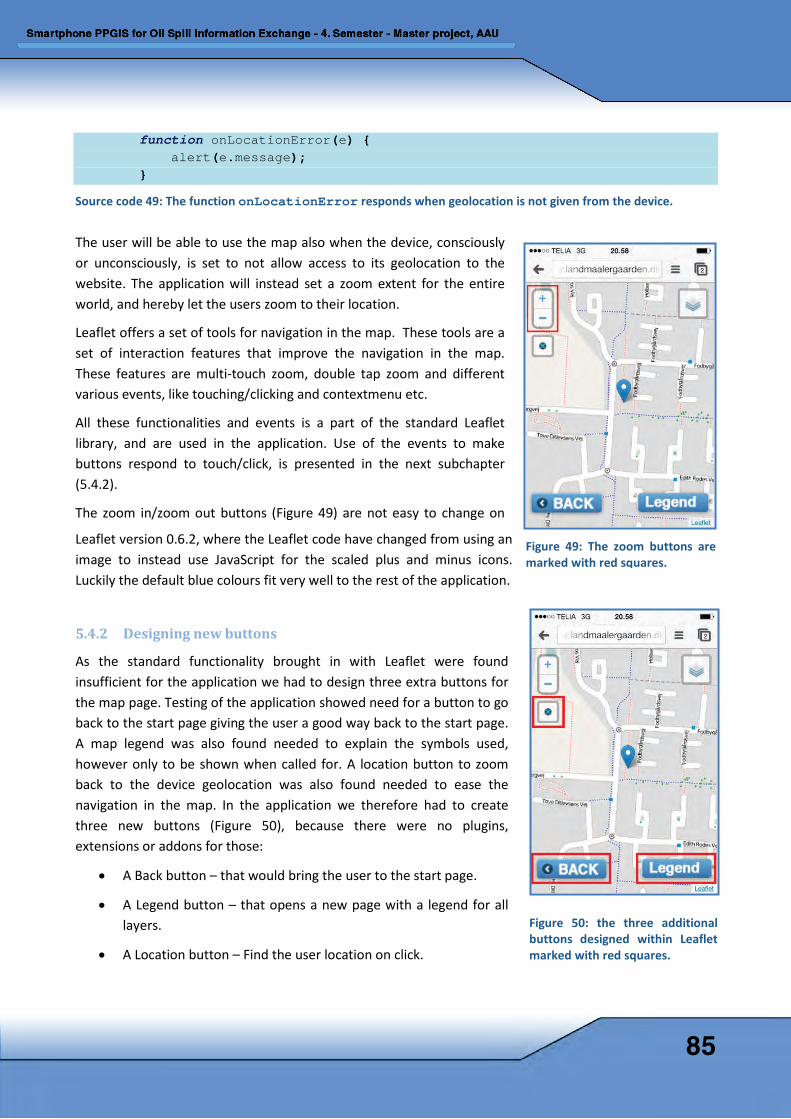
function onLocationError(e) { alert(e.message); }
Source code 49: The function onLocationError responds when geolocation is not given from the device.
The user will be able to use the map also when the device, consciously or unconsciously, is set to not allow access to its geolocation to the website. The application will instead set a zoom extent for the entire world, and hereby let the users zoom to their location.
Leaflet offers a set of tools for navigation in the map. These tools are a set of interaction features that improve the navigation in the map. These features are multi-touch zoom, double tap zoom and different various events, like touching/clicking and contextmenu etc.
All these functionalities and events is a part of the standard Leaflet library, and are used in the application. Use of the events to make buttons respond to touch/click, is presented in the next subchapter (5.4.2).
The zoom in/zoom out buttons (Figure 49) are not easy to change on
Leaflet version 0.6.2, where the Leaflet code have changed from using an image to instead use JavaScript for the scaled plus and minus icons. Luckily the default blue colours fit very well to the rest of the application.
5.4.2 Designing new buttons
As the standard functionality brought in with Leaflet were found insufficient for the application we had to design three extra buttons for the map page. Testing of the application showed need for a button to go back to the start page giving the user a good way back to the start page. A map legend was also found needed to explain the symbols used, however only to be shown when called for. A location button to zoom back to the device geolocation was also found needed to ease the navigation in the map. In the application we therefore had to create three new buttons (Figure 50), because there were no plugins, extensions or addons for those:
• A Back button – that would bring the user to the start page.
• A Legend button – that opens a new page with a legend for all layers.
• A Location button – Find the user location on click.
Figure 49: The zoom buttons are marked with red squares.
Figure 50: the three additional buttons designed within Leaflet marked with red squares.
85
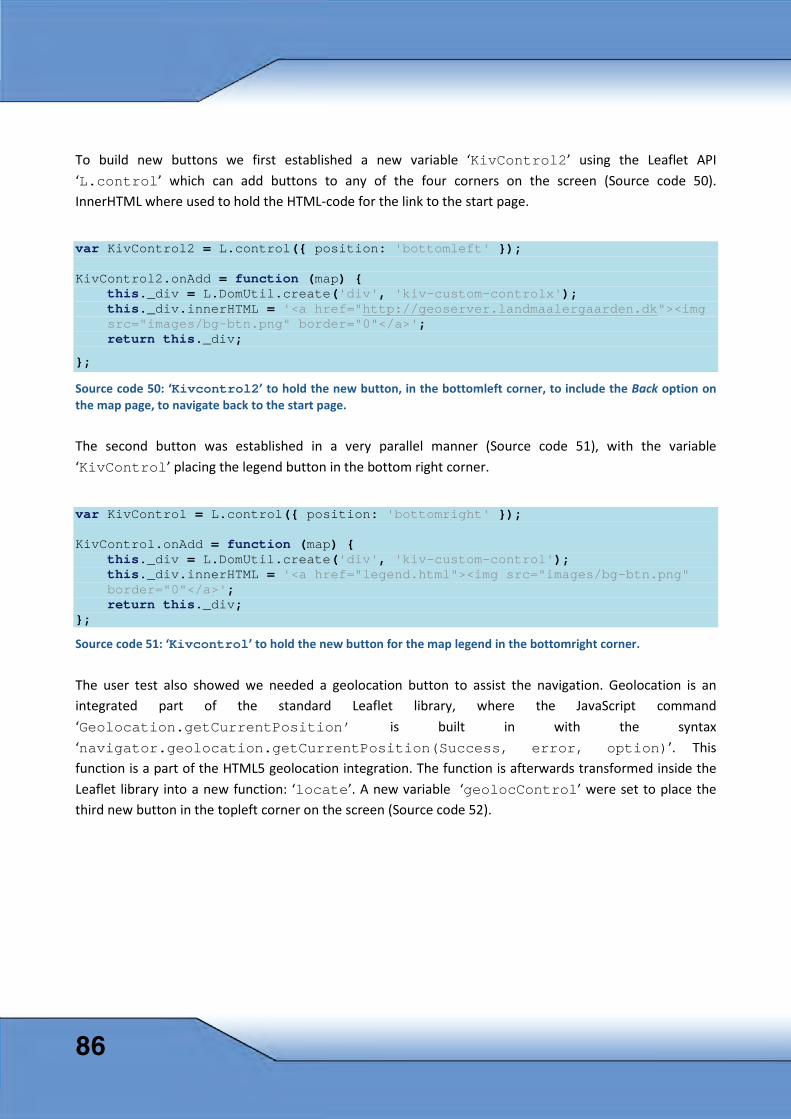
To build new buttons we first established a new variable ‘KivControl2’ using the Leaflet API ‘L.control’ which can add buttons to any of the four corners on the screen (Source code 50). InnerHTML where used to hold the HTML-code for the link to the start page.
var KivControl2 = L.control({ position: 'bottomleft' }); KivControl2.onAdd = function (map) { this._div = L.DomUtil.create('div', 'kiv-custom-controlx'); this._div.innerHTML = '<a href="http://geoserver.landmaalergaarden.dk"><img src="images/bg-btn.png" border="0"</a>'; return this._div;
};
Source code 50: ‘Kivcontrol2’ to hold the new button, in the bottomleft corner, to include the Back option on the map page, to navigate back to the start page.
The second button was established in a very parallel manner (Source code 51), with the variable ‘KivControl’ placing the legend button in the bottom right corner.
var KivControl = L.control({ position: 'bottomright' }); KivControl.onAdd = function (map) { this._div = L.DomUtil.create('div', 'kiv-custom-control'); this._div.innerHTML = '<a href="legend.html"><img src="images/bg-btn.png" border="0"</a>'; return this._div; };
Source code 51: ‘Kivcontrol’ to hold the new button for the map legend in the bottomright corner.
The user test also showed we needed a geolocation button to assist the navigation. Geolocation is an integrated part of the standard Leaflet library, where the JavaScript command ‘Geolocation.getCurrentPosition’ is built in with the syntax ‘navigator.geolocation.getCurrentPosition(Success, error, option)’. This function is a part of the HTML5 geolocation integration. The function is afterwards transformed inside the Leaflet library into a new function: ‘locate’. A new variable ‘geolocControl’ were set to place the third new button in the topleft corner on the screen (Source code 52).
86
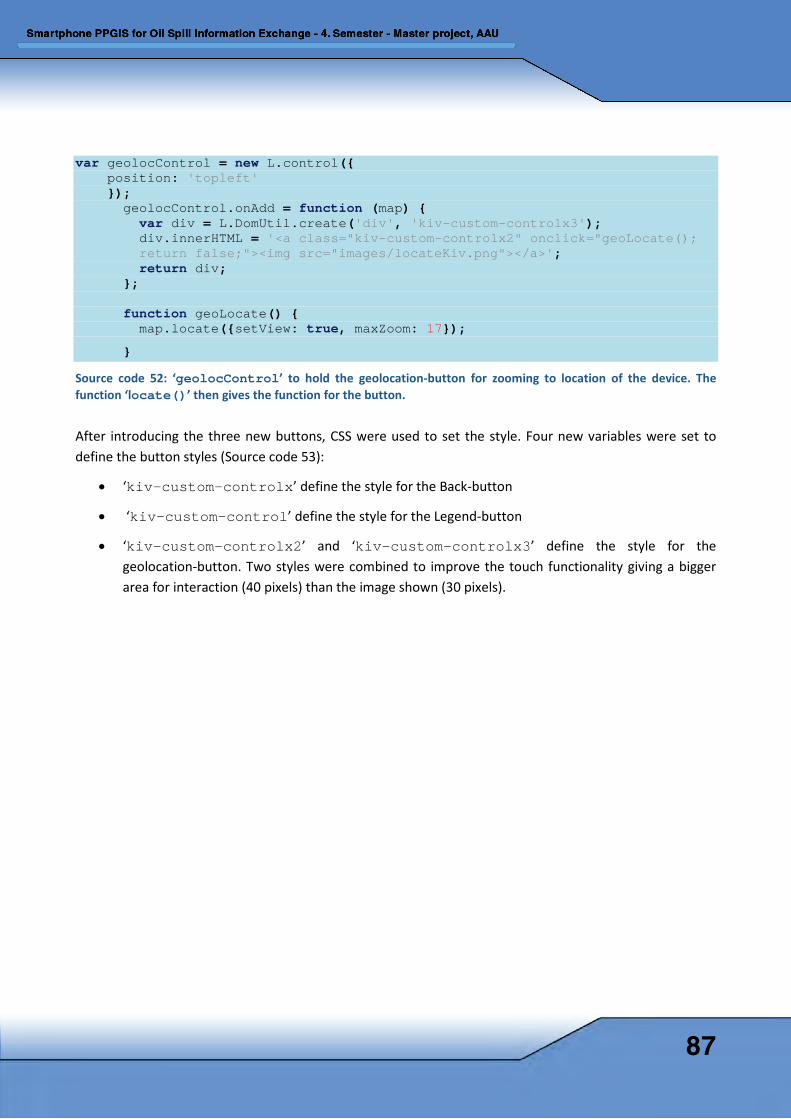
var geolocControl = new L.control({ position: 'topleft' }); geolocControl.onAdd = function (map) { var div = L.DomUtil.create('div', 'kiv-custom-controlx3'); div.innerHTML = '<a class="kiv-custom-controlx2" onclick="geoLocate(); return false;"><img src="images/locateKiv.png"></a>'; return div; }; function geoLocate() { map.locate({setView: true, maxZoom: 17});
}
Source code 52: ‘geolocControl’ to hold the geolocation-button for zooming to location of the device. The function ‘locate()’ then gives the function for the button.
After introducing the three new buttons, CSS were used to set the style. Four new variables were set to define the button styles (Source code 53):
• ‘kiv-custom-controlx’ define the style for the Back-button
• ‘kiv-custom-control’ define the style for the Legend-button
• ‘kiv-custom-controlx2’ and ‘kiv-custom-controlx3’ define the style for the geolocation-button. Two styles were combined to improve the touch functionality giving a bigger area for interaction (40 pixels) than the image shown (30 pixels).
87
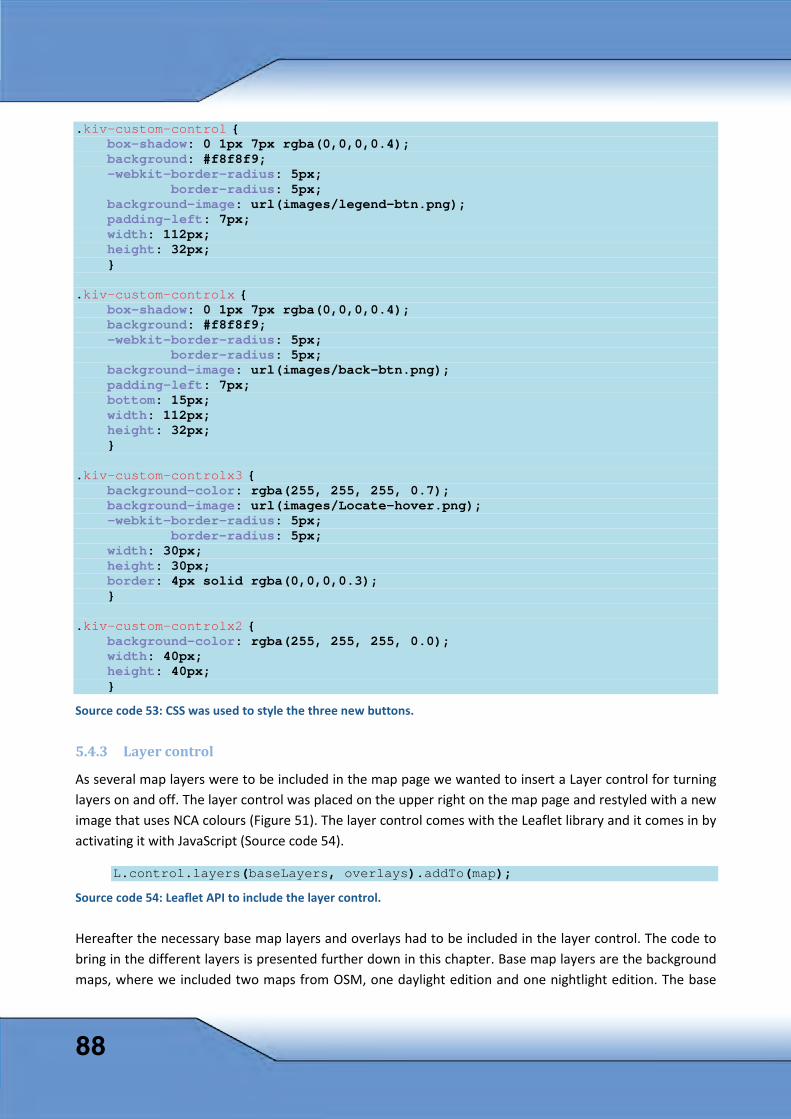
.kiv-custom-control { box-shadow: 0 1px 7px rgba(0,0,0,0.4); background: #f8f8f9; -webkit-border-radius: 5px; border-radius: 5px; background-image: url(images/legend-btn.png); padding-left: 7px; width: 112px; height: 32px; } .kiv-custom-controlx { box-shadow: 0 1px 7px rgba(0,0,0,0.4); background: #f8f8f9; -webkit-border-radius: 5px; border-radius: 5px; background-image: url(images/back-btn.png); padding-left: 7px; bottom: 15px; width: 112px; height: 32px; } .kiv-custom-controlx3 { background-color: rgba(255, 255, 255, 0.7); background-image: url(images/Locate-hover.png); -webkit-border-radius: 5px; border-radius: 5px; width: 30px; height: 30px; border: 4px solid rgba(0,0,0,0.3); } .kiv-custom-controlx2 { background-color: rgba(255, 255, 255, 0.0); width: 40px; height: 40px; } Source code 53: CSS was used to style the three new buttons.
5.4.3 Layer control
As several map layers were to be included in the map page we wanted to insert a Layer control for turning layers on and off. The layer control was placed on the upper right on the map page and restyled with a new image that uses NCA colours (Figure 51). The layer control comes with the Leaflet library and it comes in by activating it with JavaScript (Source code 54).
L.control.layers(baseLayers, overlays).addTo(map); Source code 54: Leaflet API to include the layer control.
Hereafter the necessary base map layers and overlays had to be included in the layer control. The code to bring in the different layers is presented further down in this chapter. Base map layers are the background maps, where we included two maps from OSM, one daylight edition and one nightlight edition. The base
88
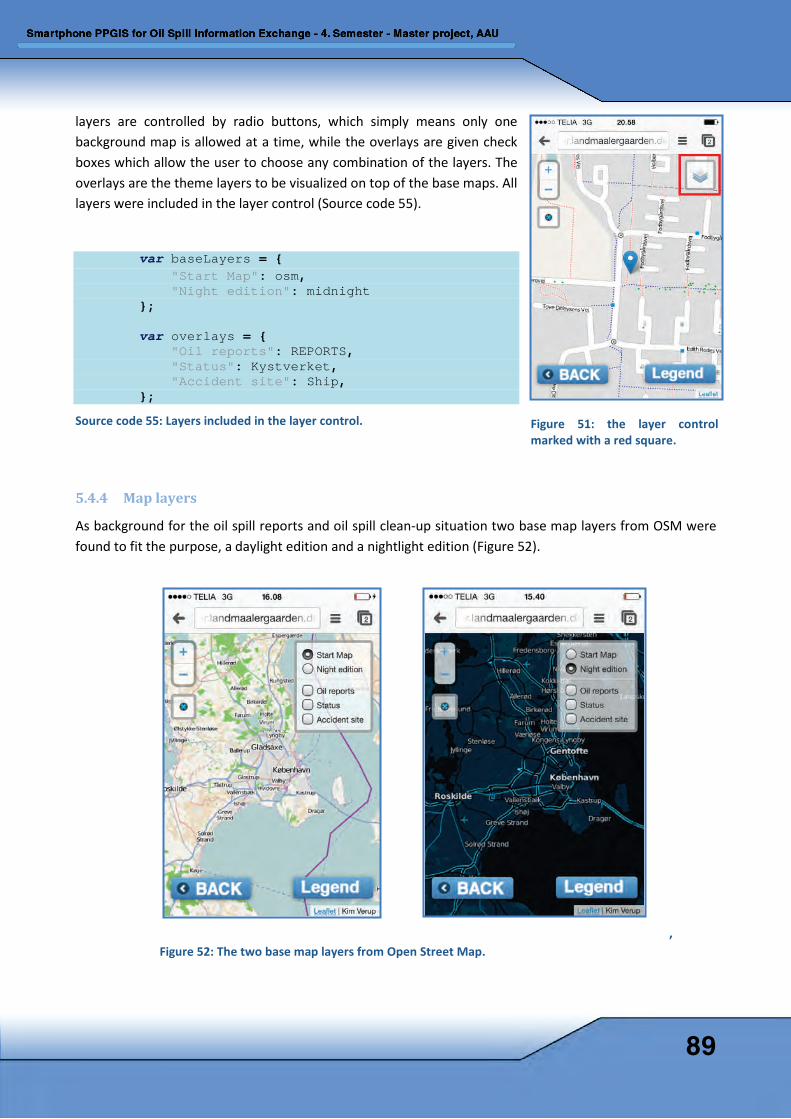
layers are controlled by radio buttons, which simply means only one background map is allowed at a time, while the overlays are given check boxes which allow the user to choose any combination of the layers. The overlays are the theme layers to be visualized on top of the base maps. All layers were included in the layer control (Source code 55).
var baseLayers = { "Start Map": osm, "Night edition": midnight }; var overlays = { "Oil reports": REPORTS, "Status": Kystverket, "Accident site": Ship, }; Source code 55: Layers included in the layer control.
5.4.4 Map layers
As background for the oil spill reports and oil spill clean-up situation two base map layers from OSM were found to fit the purpose, a daylight edition and a nightlight edition (Figure 52).
,
Figure 51: the layer control marked with a red square.
Figure 52: The two base map layers from Open Street Map.
89
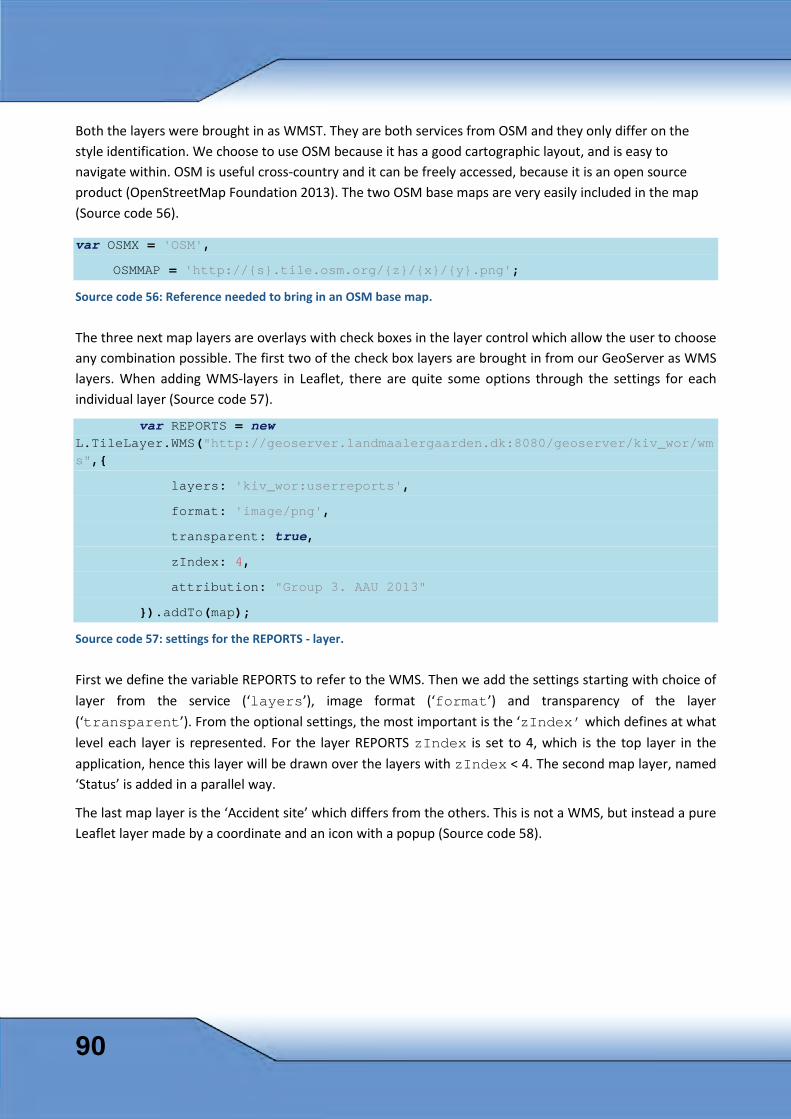
Both the layers were brought in as WMST. They are both services from OSM and they only differ on the style identification. We choose to use OSM because it has a good cartographic layout, and is easy to navigate within. OSM is useful cross-country and it can be freely accessed, because it is an open source product (OpenStreetMap Foundation 2013). The two OSM base maps are very easily included in the map (Source code 56).
var OSMX = 'OSM',
OSMMAP = 'http://{s}.tile.osm.org/{z}/{x}/{y}.png';
Source code 56: Reference needed to bring in an OSM base map.
The three next map layers are overlays with check boxes in the layer control which allow the user to choose any combination possible. The first two of the check box layers are brought in from our GeoServer as WMS layers. When adding WMS-layers in Leaflet, there are quite some options through the settings for each individual layer (Source code 57).
var REPORTS = new L.TileLayer.WMS("http://geoserver.landmaalergaarden.dk:8080/geoserver/kiv_wor/wms",{
layers: 'kiv_wor:userreports',
format: 'image/png',
transparent: true,
zIndex: 4,
attribution: "Group 3. AAU 2013"
}).addTo(map);
Source code 57: settings for the REPORTS - layer.
First we define the variable REPORTS to refer to the WMS. Then we add the settings starting with choice of layer from the service (‘layers’), image format (‘format’) and transparency of the layer (‘transparent’). From the optional settings, the most important is the ‘zIndex’ which defines at what level each layer is represented. For the layer REPORTS zIndex is set to 4, which is the top layer in the application, hence this layer will be drawn over the layers with zIndex < 4. The second map layer, named ‘Status’ is added in a parallel way.
The last map layer is the ‘Accident site’ which differs from the others. This is not a WMS, but instead a pure Leaflet layer made by a coordinate and an icon with a popup (Source code 58).
90
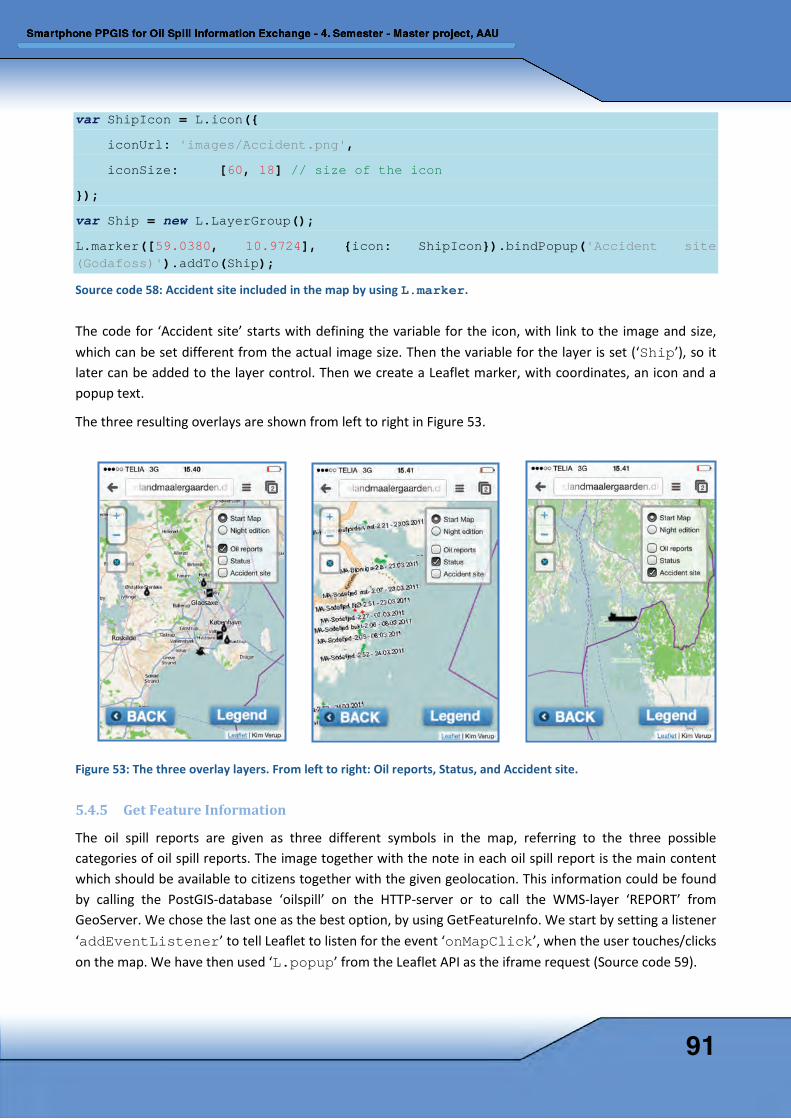
var ShipIcon = L.icon({
iconUrl: 'images/Accident.png',
iconSize: [60, 18] // size of the icon
});
var Ship = new L.LayerGroup();
L.marker([59.0380, 10.9724], {icon: ShipIcon}).bindPopup('Accident site (Godafoss)').addTo(Ship);
Source code 58: Accident site included in the map by using L.marker.
The code for ‘Accident site’ starts with defining the variable for the icon, with link to the image and size, which can be set different from the actual image size. Then the variable for the layer is set (‘Ship’), so it later can be added to the layer control. Then we create a Leaflet marker, with coordinates, an icon and a popup text.
The three resulting overlays are shown from left to right in Figure 53.
Figure 53: The three overlay layers. From left to right: Oil reports, Status, and Accident site.
5.4.5 Get Feature Information
The oil spill reports are given as three different symbols in the map, referring to the three possible categories of oil spill reports. The image together with the note in each oil spill report is the main content which should be available to citizens together with the given geolocation. This information could be found by calling the PostGIS-database ‘oilspill’ on the HTTP-server or to call the WMS-layer ‘REPORT’ from GeoServer. We chose the last one as the best option, by using GetFeatureInfo. We start by setting a listener ‘addEventListener’ to tell Leaflet to listen for the event ‘onMapClick’, when the user touches/clicks on the map. We have then used ‘L.popup’ from the Leaflet API as the iframe request (Source code 59).
91
map.addEventListener('click', onMapClick); //Leaflet click activation.
popup = new L.Popup({maxWidth: 400}); // defining the popup element, with a max width value.
Source code 59: Leaflet API used to establish the touch/click response needed for getting information from the reports of oil spill through GeoServer.
The function ‘onMapClick’ which is called by ‘addEventListener’ is then used to build up the input to the popup window (Source code 60).
The GetFeatureInfo request basically calls GeoServer for all available attributes in the layer. GeoServer responds by delivering all attributes limited by the template description for the layer (see Chapter 4.5.2). The selection is afterwards styled inside the iframe by the template.
As we are aware touch icons on touch displays should have a minimum size of 9 x 9 mm previously discussed in Chapter 3.2.2, the symbols used for the oil spill report were not ideal. To bring the touch interface more near this ideal size without making big symbols to take too much place on the screen, we chose to increase the response area around each symbol. In Chapter 4.5.2 we have described how the extra transparent pixels were added to increase the responsive area for touches/click.
92
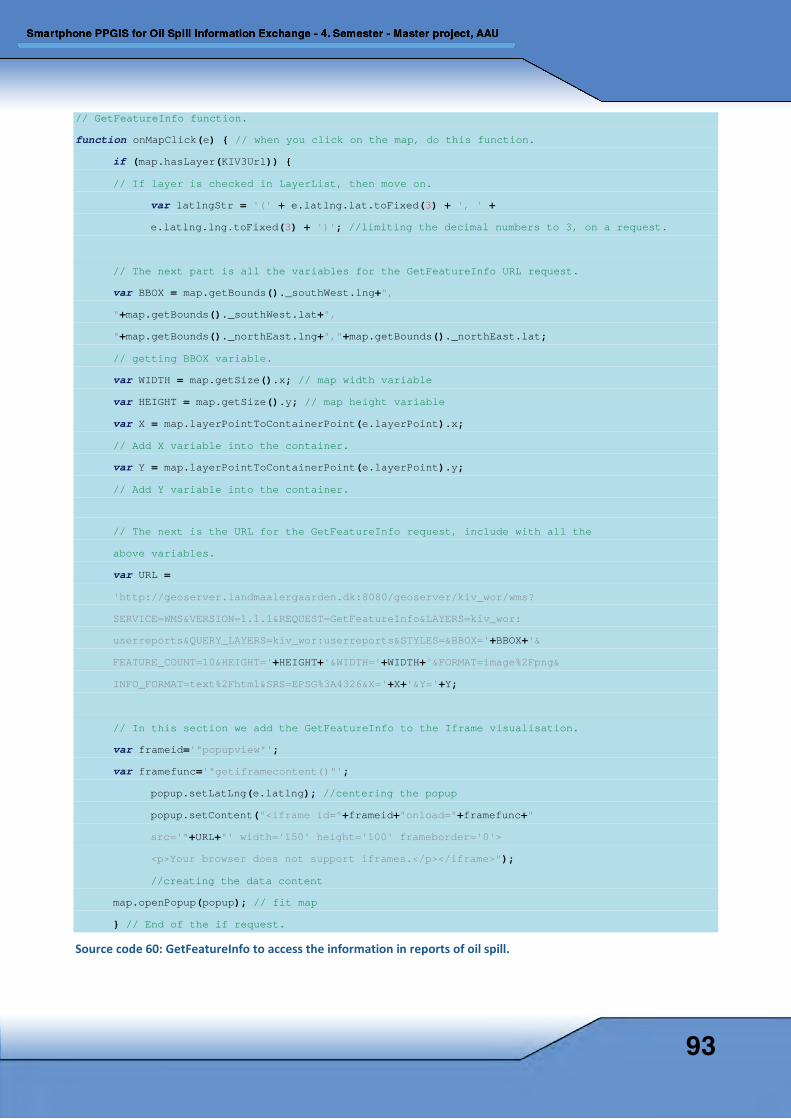
// GetFeatureInfo function.
function onMapClick(e) { // when you click on the map, do this function.
if (map.hasLayer(KIV3Url)) {
// If layer is checked in LayerList, then move on.
var latlngStr = '(' + e.latlng.lat.toFixed(3) + ', ' +
e.latlng.lng.toFixed(3) + ')'; //limiting the decimal numbers to 3, on a request.
// The next part is all the variables for the GetFeatureInfo URL request.
var BBOX = map.getBounds()._southWest.lng+",
"+map.getBounds()._southWest.lat+",
"+map.getBounds()._northEast.lng+","+map.getBounds()._northEast.lat;
// getting BBOX variable.
var WIDTH = map.getSize().x; // map width variable
var HEIGHT = map.getSize().y; // map height variable
var X = map.layerPointToContainerPoint(e.layerPoint).x;
// Add X variable into the container.
var Y = map.layerPointToContainerPoint(e.layerPoint).y;
// Add Y variable into the container.
// The next is the URL for the GetFeatureInfo request, include with all the
above variables.
var URL =
'http://geoserver.landmaalergaarden.dk:8080/geoserver/kiv_wor/wms?
SERVICE=WMS&VERSION=1.1.1&REQUEST=GetFeatureInfo&LAYERS=kiv_wor:
userreports&QUERY_LAYERS=kiv_wor:userreports&STYLES=&BBOX='+BBOX+'&
FEATURE_COUNT=10&HEIGHT='+HEIGHT+'&WIDTH='+WIDTH+'&FORMAT=image%2Fpng&
INFO_FORMAT=text%2Fhtml&SRS=EPSG%3A4326&X='+X+'&Y='+Y;
// In this section we add the GetFeatureInfo to the Iframe visualisation.
var frameid='"popupview"';
var framefunc='"getiframecontent()"';
popup.setLatLng(e.latlng); //centering the popup
popup.setContent("<iframe id="+frameid+"onload="+framefunc+"
src='"+URL+"' width='150' height='100' frameborder='0'>
<p>Your browser does not support iframes.</p></iframe>");
//creating the data content
map.openPopup(popup); // fit map
} // End of the if request.
Source code 60: GetFeatureInfo to access the information in reports of oil spill.
93
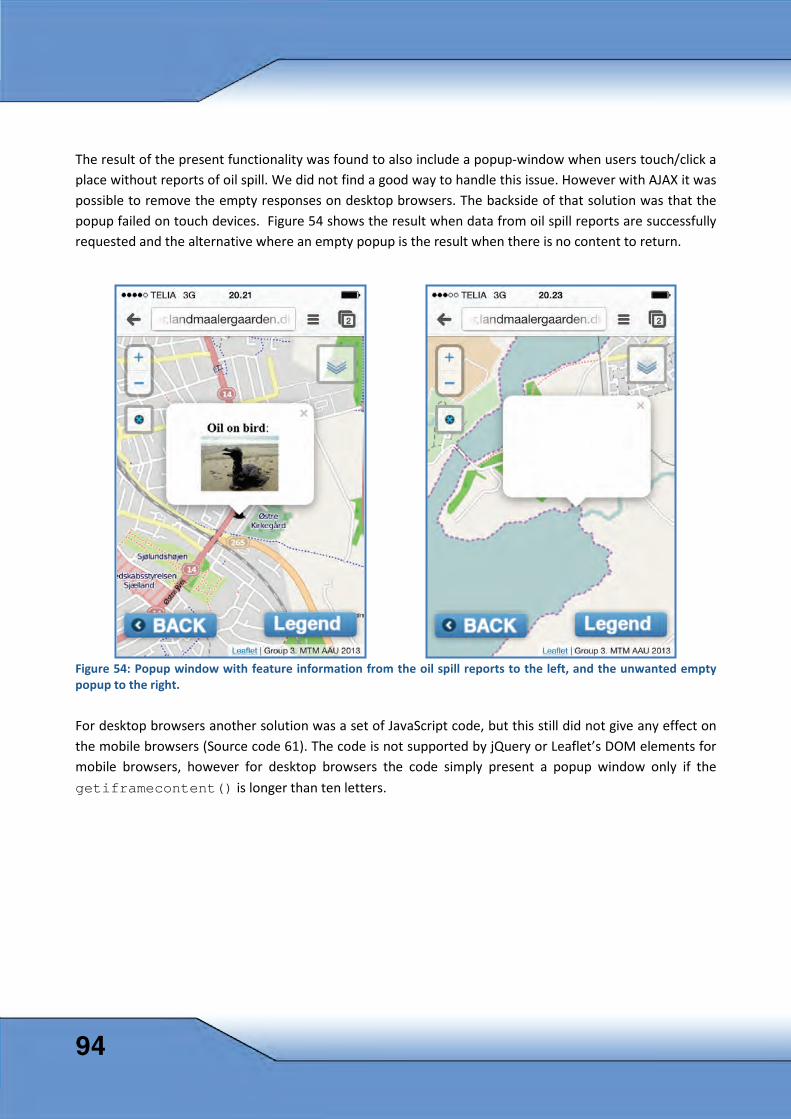
The result of the present functionality was found to also include a popup-window when users touch/click a place without reports of oil spill. We did not find a good way to handle this issue. However with AJAX it was possible to remove the empty responses on desktop browsers. The backside of that solution was that the popup failed on touch devices. Figure 54 shows the result when data from oil spill reports are successfully requested and the alternative where an empty popup is the result when there is no content to return.
Figure 54: Popup window with feature information from the oil spill reports to the left, and the unwanted empty popup to the right.
For desktop browsers another solution was a set of JavaScript code, but this still did not give any effect on the mobile browsers (Source code 61). The code is not supported by jQuery or Leaflet’s DOM elements for mobile browsers, however for desktop browsers the code simply present a popup window only if the getiframecontent() is longer than ten letters.
94
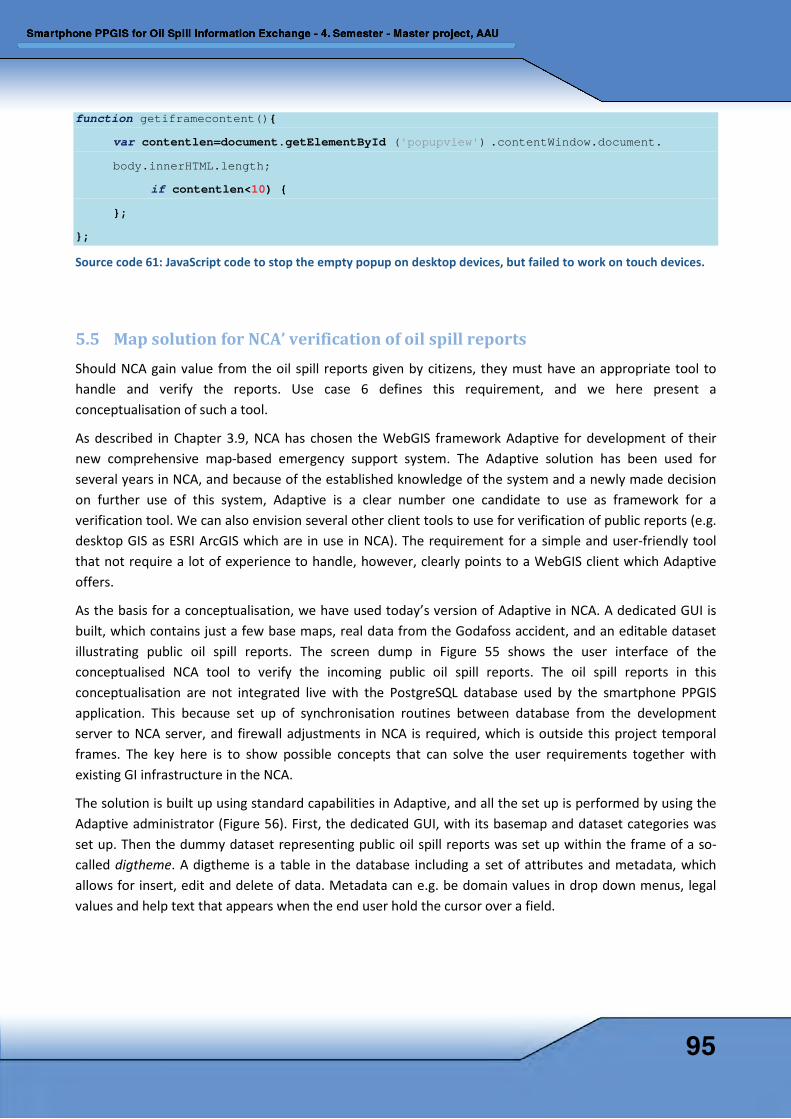
function getiframecontent(){
var contentlen=document.getElementById ('popupview') .contentWindow.document. body.innerHTML.length;
if contentlen<10) { };
};
Source code 61: JavaScript code to stop the empty popup on desktop devices, but failed to work on touch devices.
5.5 Map solution for NCA’ verification of oil spill reports Should NCA gain value from the oil spill reports given by citizens, they must have an appropriate tool to handle and verify the reports. Use case 6 defines this requirement, and we here present a conceptualisation of such a tool.
As described in Chapter 3.9, NCA has chosen the WebGIS framework Adaptive for development of their new comprehensive map-based emergency support system. The Adaptive solution has been used for several years in NCA, and because of the established knowledge of the system and a newly made decision on further use of this system, Adaptive is a clear number one candidate to use as framework for a verification tool. We can also envision several other client tools to use for verification of public reports (e.g. desktop GIS as ESRI ArcGIS which are in use in NCA). The requirement for a simple and user-friendly tool that not require a lot of experience to handle, however, clearly points to a WebGIS client which Adaptive offers.
As the basis for a conceptualisation, we have used today’s version of Adaptive in NCA. A dedicated GUI is built, which contains just a few base maps, real data from the Godafoss accident, and an editable dataset illustrating public oil spill reports. The screen dump in Figure 55 shows the user interface of the conceptualised NCA tool to verify the incoming public oil spill reports. The oil spill reports in this conceptualisation are not integrated live with the PostgreSQL database used by the smartphone PPGIS application. This because set up of synchronisation routines between database from the development server to NCA server, and firewall adjustments in NCA is required, which is outside this project temporal frames. The key here is to show possible concepts that can solve the user requirements together with existing GI infrastructure in the NCA.
The solution is built up using standard capabilities in Adaptive, and all the set up is performed by using the Adaptive administrator (Figure 56). First, the dedicated GUI, with its basemap and dataset categories was set up. Then the dummy dataset representing public oil spill reports was set up within the frame of a so-called digtheme. A digtheme is a table in the database including a set of attributes and metadata, which allows for insert, edit and delete of data. Metadata can e.g. be domain values in drop down menus, legal values and help text that appears when the end user hold the cursor over a field.
95
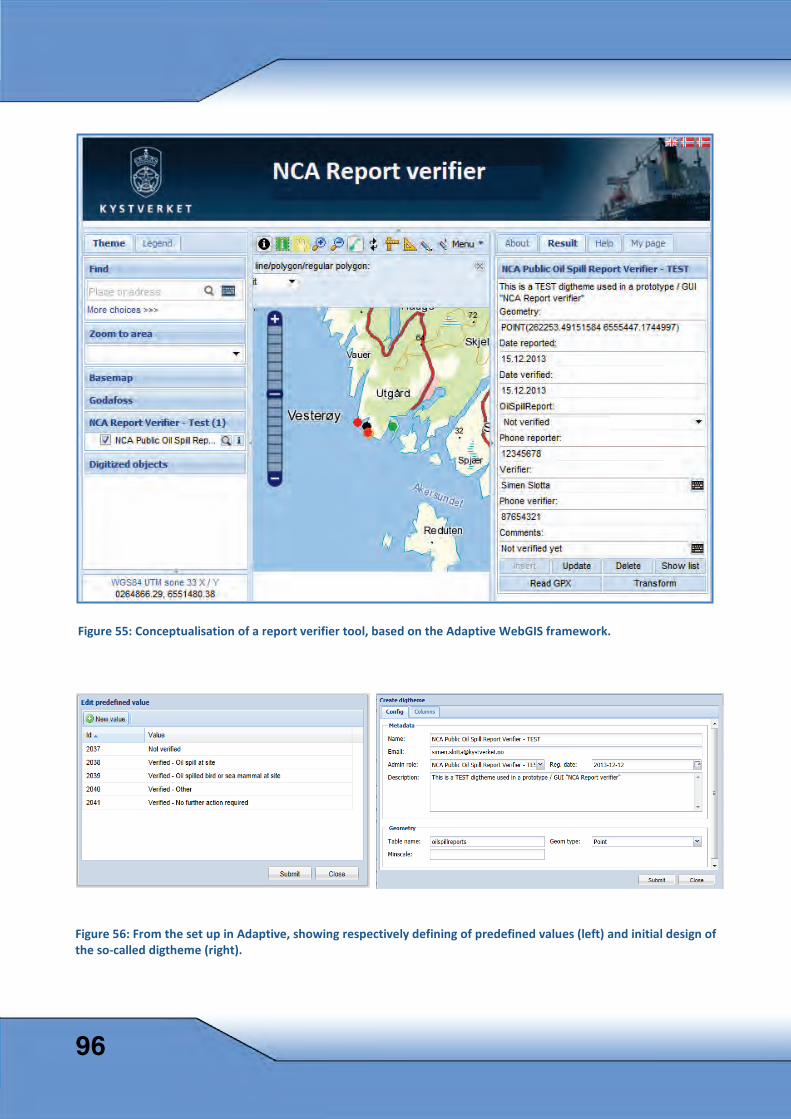
Figure 56: From the set up in Adaptive, showing respectively defining of predefined values (left) and initial design of the so-called digtheme (right).
Figure 55: Conceptualisation of a report verifier tool, based on the Adaptive WebGIS framework.
96
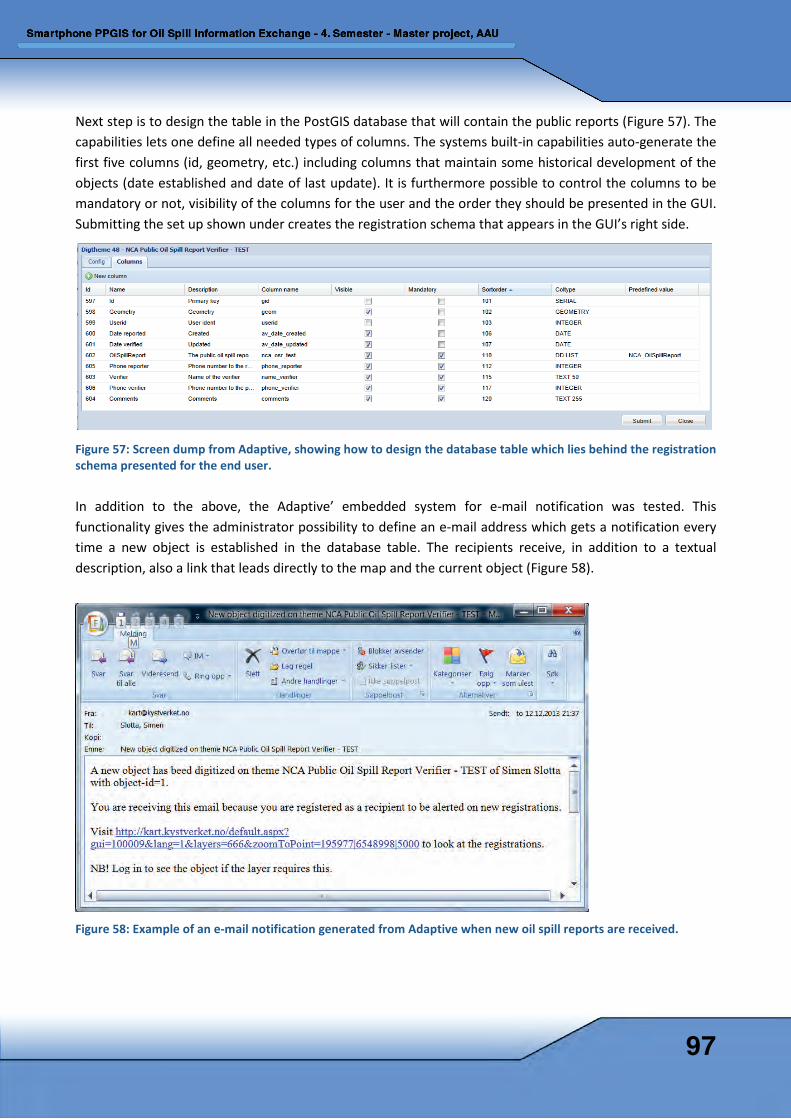
Next step is to design the table in the PostGIS database that will contain the public reports (Figure 57). The capabilities lets one define all needed types of columns. The systems built-in capabilities auto-generate the first five columns (id, geometry, etc.) including columns that maintain some historical development of the objects (date established and date of last update). It is furthermore possible to control the columns to be mandatory or not, visibility of the columns for the user and the order they should be presented in the GUI. Submitting the set up shown under creates the registration schema that appears in the GUI’s right side.
Figure 57: Screen dump from Adaptive, showing how to design the database table which lies behind the registration schema presented for the end user.
In addition to the above, the Adaptive’ embedded system for e-mail notification was tested. This functionality gives the administrator possibility to define an e-mail address which gets a notification every time a new object is established in the database table. The recipients receive, in addition to a textual description, also a link that leads directly to the map and the current object (Figure 58).
Figure 58: Example of an e-mail notification generated from Adaptive when new oil spill reports are received.
97
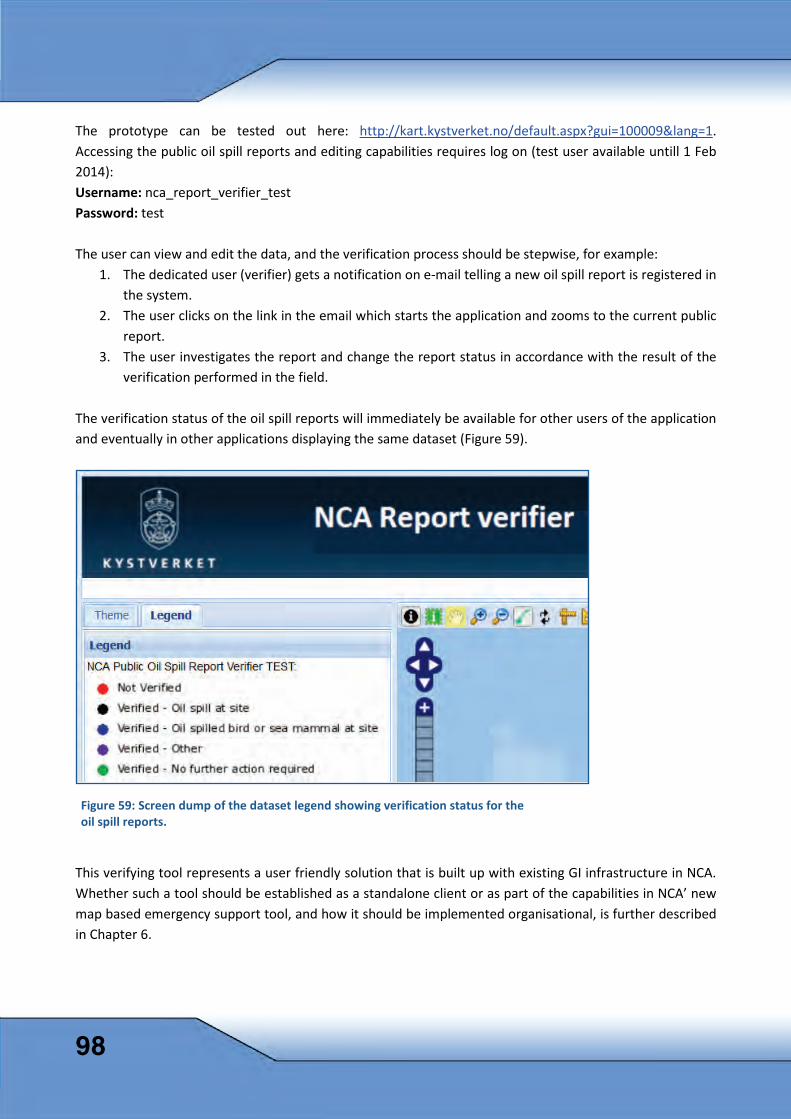
The prototype can be tested out here: http://kart.kystverket.no/default.aspx?gui=100009&lang=1. Accessing the public oil spill reports and editing capabilities requires log on (test user available untill 1 Feb 2014): Username: nca_report_verifier_test Password: test The user can view and edit the data, and the verification process should be stepwise, for example:
1. The dedicated user (verifier) gets a notification on e-mail telling a new oil spill report is registered in the system.
2. The user clicks on the link in the email which starts the application and zooms to the current public report.
3. The user investigates the report and change the report status in accordance with the result of the verification performed in the field.
The verification status of the oil spill reports will immediately be available for other users of the application and eventually in other applications displaying the same dataset (Figure 59).
This verifying tool represents a user friendly solution that is built up with existing GI infrastructure in NCA. Whether such a tool should be established as a standalone client or as part of the capabilities in NCA’ new map based emergency support tool, and how it should be implemented organisational, is further described in Chapter 6.
Figure 59: Screen dump of the dataset legend showing verification status for the oil spill reports.
98
6 Organisational implementation and distribution requirements The description of the prototype in Chapter 4 and 5 demonstrates a good solution of the requirements for information exchange between the government and affected citizens, even though not all the required functionality is present in the prototype.
A possible implementation will require some further development, and practical testing, e.g. in an exercise on oil spill clean-up operations. These are required steps before a final evaluation of the smartphone PPGIS as an operational information exchange tools. We will here in Chapter 6 present the main organisational changes needed for an implementation, and how the application could become part of the overall information system used in emergency operations. We also look into how the application eventually can be distributed to the public, as this is a major step to succeed and get the possible benefits. Finally we present a SWOT-analysis and a business model canvas which shows major cost and benefits of the application.
6.1 Organisational implementation To implement the prototype as a part of NCA’s emergency response on large acute oil spills it must find its place within the existing organisation and procedures. We have studied the existing organisation in our previous report (Verup et al. 2013b) and discussed the organisational challenges. NCA’s organisation for governmental response on big acute pollutions has a highly operational culture. This is based on well established procedures under continuous development (Appendix 5). Included in the function descriptions are also procedures for logging all activity and decisions. We here present a possible organisational implementation for NCA. This presentation should also give a good idea on what is needed for other authorities with the same responsibilities.
Product owner
Firstly, there must be a part of the organisation which has the responsibility and ownership of the application. From the NCA’s organisation chart (Figure 60) and procedures we find the ‘Operation unit’ as the most suitable owner of the product, as they have high focus on establishing good clean-up operations after oil spills, including gathering information on oil-spill status. The information staff in NCA has a much broader focus since it also is responsible for many other information issues in NCA’s organisation. However the information staff will have a main role when using the PPGIS application and should see how the application works best as part of the overall information work.
As product owner the operation unit must, before bringing the prototype into oil spill clean-up exercises, set up a sketch of main goals, main use, and responsible and affected units within the emergency organisation. What should the tool be used for and what should it not be used for. The message about a new “App” can give many different associations and confusion and new difficulties on information exchange during emergency response is not giving a better oil spill response. The information exchange in emergency operations must be solid and well defined.
99
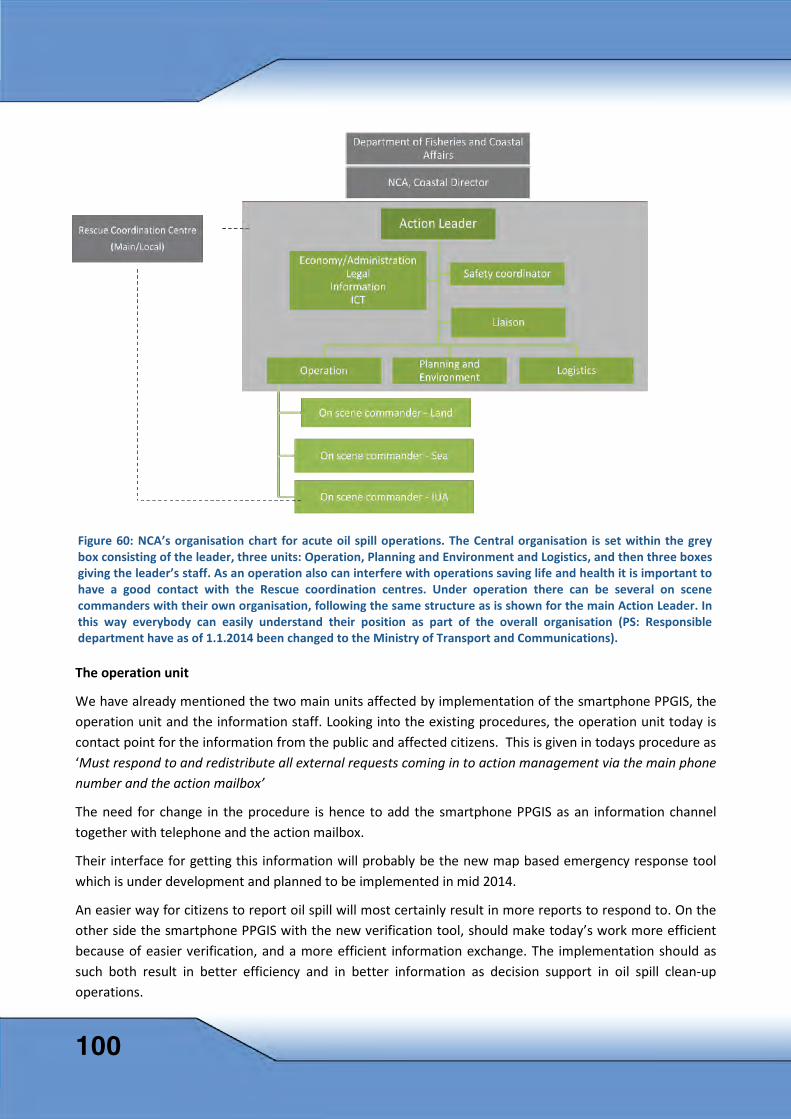
The operation unit
We have already mentioned the two main units affected by implementation of the smartphone PPGIS, the operation unit and the information staff. Looking into the existing procedures, the operation unit today is contact point for the information from the public and affected citizens. This is given in todays procedure as ‘Must respond to and redistribute all external requests coming in to action management via the main phone number and the action mailbox’
The need for change in the procedure is hence to add the smartphone PPGIS as an information channel together with telephone and the action mailbox.
Their interface for getting this information will probably be the new map based emergency response tool which is under development and planned to be implemented in mid 2014.
An easier way for citizens to report oil spill will most certainly result in more reports to respond to. On the other side the smartphone PPGIS with the new verification tool, should make today’s work more efficient because of easier verification, and a more efficient information exchange. The implementation should as such both result in better efficiency and in better information as decision support in oil spill clean-up operations.
Figure 60: NCA’s organisation chart for acute oil spill operations. The Central organisation is set within the grey box consisting of the leader, three units: Operation, Planning and Environment and Logistics, and then three boxes giving the leader’s staff. As an operation also can interfere with operations saving life and health it is important to have a good contact with the Rescue coordination centres. Under operation there can be several on scene commanders with their own organisation, following the same structure as is shown for the main Action Leader. In this way everybody can easily understand their position as part of the overall organisation (PS: Responsible department have as of 1.1.2014 been changed to the Ministry of Transport and Communications).
100
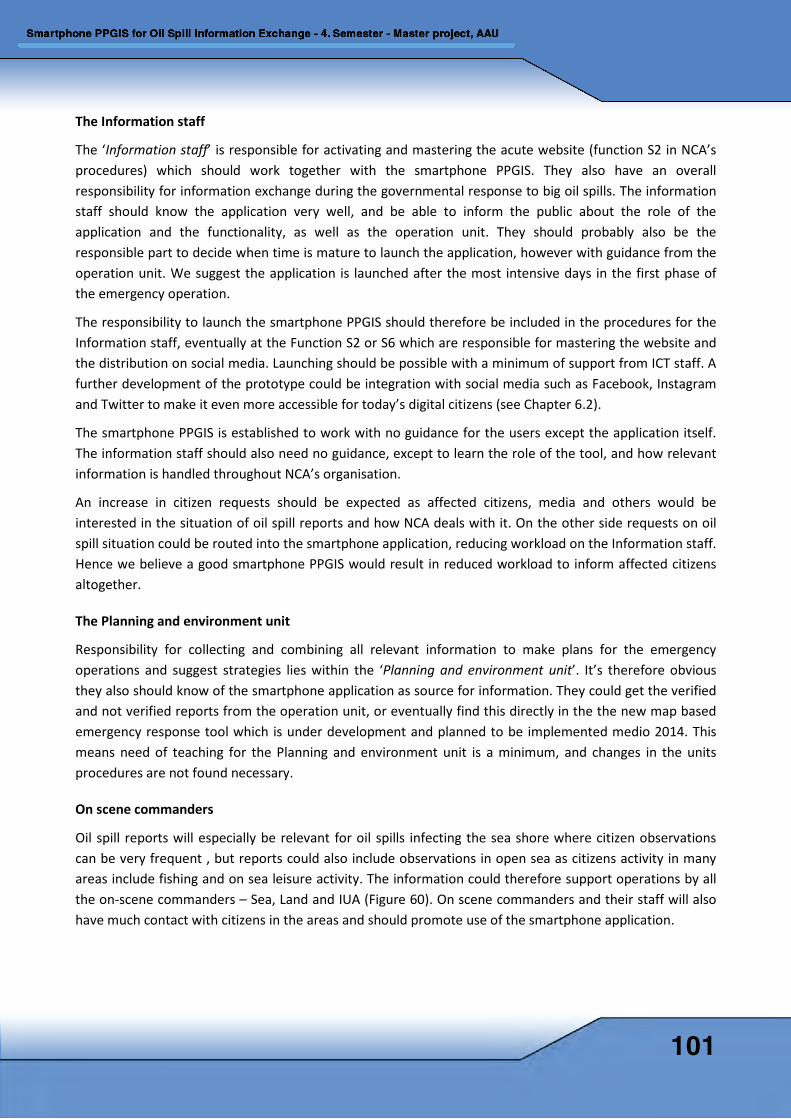
The Information staff
The ‘Information staff’ is responsible for activating and mastering the acute website (function S2 in NCA’s procedures) which should work together with the smartphone PPGIS. They also have an overall responsibility for information exchange during the governmental response to big oil spills. The information staff should know the application very well, and be able to inform the public about the role of the application and the functionality, as well as the operation unit. They should probably also be the responsible part to decide when time is mature to launch the application, however with guidance from the operation unit. We suggest the application is launched after the most intensive days in the first phase of the emergency operation.
The responsibility to launch the smartphone PPGIS should therefore be included in the procedures for the Information staff, eventually at the Function S2 or S6 which are responsible for mastering the website and the distribution on social media. Launching should be possible with a minimum of support from ICT staff. A further development of the prototype could be integration with social media such as Facebook, Instagram and Twitter to make it even more accessible for today’s digital citizens (see Chapter 6.2).
The smartphone PPGIS is established to work with no guidance for the users except the application itself. The information staff should also need no guidance, except to learn the role of the tool, and how relevant information is handled throughout NCA’s organisation.
An increase in citizen requests should be expected as affected citizens, media and others would be interested in the situation of oil spill reports and how NCA deals with it. On the other side requests on oil spill situation could be routed into the smartphone application, reducing workload on the Information staff. Hence we believe a good smartphone PPGIS would result in reduced workload to inform affected citizens altogether.
The Planning and environment unit
Responsibility for collecting and combining all relevant information to make plans for the emergency operations and suggest strategies lies within the ‘Planning and environment unit’. It’s therefore obvious they also should know of the smartphone application as source for information. They could get the verified and not verified reports from the operation unit, or eventually find this directly in the the new map based emergency response tool which is under development and planned to be implemented medio 2014. This means need of teaching for the Planning and environment unit is a minimum, and changes in the units procedures are not found necessary.
On scene commanders
Oil spill reports will especially be relevant for oil spills infecting the sea shore where citizen observations can be very frequent , but reports could also include observations in open sea as citizens activity in many areas include fishing and on sea leisure activity. The information could therefore support operations by all the on-scene commanders – Sea, Land and IUA (Figure 60). On scene commanders and their staff will also have much contact with citizens in the areas and should promote use of the smartphone application.
101

On scene commanders and their staff should therefore be given information about the application and its role in supporting information exchange, and its contribution as decision support. On scene commanders includes the 32 IUA’s which are responsible for shore-based clean-up operations within their areas also after big oil spills.
The ICT-staff
The ICT staff shall set up necessary ICT-equipment for the emergency response organisation, and give general ICT user support. The ICT staff must be made aware of the smartphone PPGIS as part of the communication with citizens, and its role to collect information for decision support. .
The ICT-staff shall assist the Information staff on launching the smartphone PPGIS if this becomes troublesome, and shall assist on any technical issues during operation. A good technical documentation of the system is needed to make sure all participants in the ICT-staff can support when faults occur in the system. However the support should not include development of the tool, only launching and error solving.
We cannot se need for changes in the procedures for the ICT staff.
Other personnel
All personnel involved in the different roles of the emergency operations should at an early stage get knowledge about the smartphone PPGIS if this is to be utilized. Getting everybody to look one minute into the application should give them the needed information, and refer to the operation unit or Information staff for further questions. No organisational changes are needed.
The application can easily also be demonstrated on a desktop, laptop or a tablet.
6.2 Integration with existing information systems NCA today has an established information system used for logging activity and for information exchange during emergency operations after big oil spills. The operation and decision support system KystCIM (Kystverket Crises Information Management) (Figure 61) stores all messages and decisions, and information on resources and the emergency situation. KystCIM is an internal system to support the internal information flow. The Smartphone PPGIS is obviously separated from this as it should support an information flow between the NCA organisation and affected citizens. However the information on both places needs to be synchronised. When and how should the oil spill reports come into KystCIM, and when and how should information from KystCIM be brought into the smartphone PPGIS? As there already exist an acute web site, and a Web-GIS (Chapter 3.9) operational in today exercises and real acute oil spill operations, the new application should merge with the solutions already set up.
102
Figure 61: The Logg-page in KystCIM which is used to log messages and decisions, and all relevant information for management of Emergency operations dealing with acute oil spills and other acute pollution.
Major changes especially relevant for kystCIM, is a new map based emergency support tool which is under development and planned to be implemented in the mid of 2014. In the new system the administration of clean-up operations, will get connected to the initial reason in kystCIM, for example a major ship accident, and information on the initial handling of the accident and the more lasting clean-up operations will be better integrated.
Today there is no oil spill report database as parallel to the one built up for the smartphone PPGIS. Other spatial data like status of contaminated areas and some information on resources available for the clean-up operation are presented through the Adaptive WebGIS, stored in a spatial database in-house (PostGIS). Data are distributed as WMS-services with national spatial reference (EPSG:25833), available for external systems. Eleven datasets have been defined for the new map based emergency support tool, and the smartphone PPGIS oil spill reports should easily be added here as dataset number twelve.
Oil spill reports from the smartphone PPGIS should be brought in as one extra set of information together with the existing ones, however verification and filtering of the reports is needed before they should be brought in together with the rest of information to be used for decision support.
Verification and evaluation of oil spill reports
Automatic functionalities in verification and evaluation of oil spill reports are of high importance if we expect a high number of oil spill reports from citizens. If this process require time consuming manual work, this will kill the value of new information. We here see three main options:
- Let the crowd itself increase value of crowd sourced information. The application could be further developed to include further status of oil spill situation in oil spill reports, and eventually let people
103

add information to each other’s oil spill reports. There is a trend in crisis management to utilize crowd sourcing, however the level of public interest will together with the applications user friendliness decide the possible support from crowd sourcing. (National Geographic 2012, Aljazeera 2013 and Wire 2013).
- Develop automatic verification and handling of reports, e.g. accept of reports within the expected area only, or image recognition to filter reports with pictures obviously not holding relevant information.
- Further development of the verification and evaluation interface as we have presented in Chapter 5.5 as part of the new map based emergency support tool to be implemented in the mid of 2014.
For an introduction of the smartphone PPGIS we suggest high user friendliness as main focus to set grounds for crowd sourcing. An eventually further development of verification and evaluation should be done based on experience or good knowledge of possible risk of such situation. Further development could also be an issue when a situation comes up, with involving technological resources early in an emergency response.
Non-verified contra verified oil spill reports
We have suggested a solution where NCA have the possibility to verify and add data to the oil spill reports. This result is an updated version of the oil spill reports and oil spill information produced from this base. We suggest this to be two separate databases, first the unverified oil spill reports and secondly the verified and further improved database of oil spill reports where NCA have full control. A routine must be established for how to bring new unverified reports into the database with verified reports. A sketch of such a routine has been suggested in Figure 62. The technical options to generate this functionality have been presented in Chapter 5.5.
104
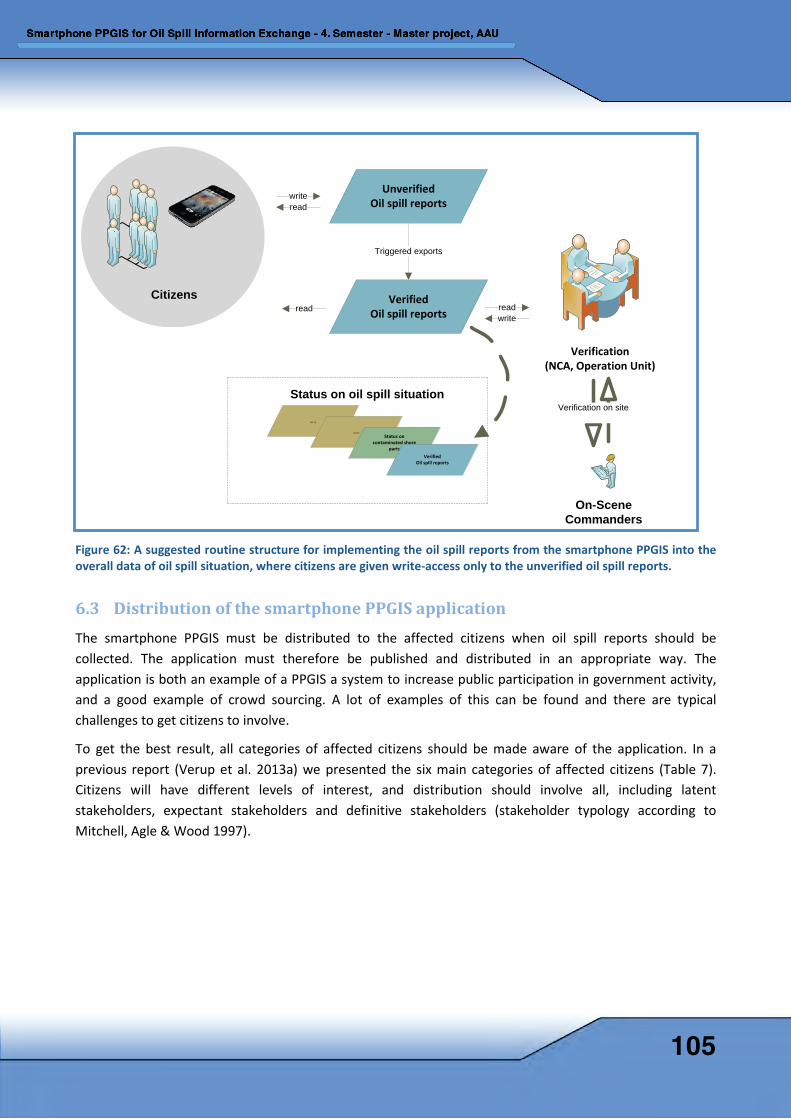
Figure 62: A suggested routine structure for implementing the oil spill reports from the smartphone PPGIS into the overall data of oil spill situation, where citizens are given write-access only to the unverified oil spill reports.
6.3 Distribution of the smartphone PPGIS application The smartphone PPGIS must be distributed to the affected citizens when oil spill reports should be collected. The application must therefore be published and distributed in an appropriate way. The application is both an example of a PPGIS a system to increase public participation in government activity, and a good example of crowd sourcing. A lot of examples of this can be found and there are typical challenges to get citizens to involve.
To get the best result, all categories of affected citizens should be made aware of the application. In a previous report (Verup et al. 2013a) we presented the six main categories of affected citizens (Table 7). Citizens will have different levels of interest, and distribution should involve all, including latent stakeholders, expectant stakeholders and definitive stakeholders (stakeholder typology according to Mitchell, Agle & Wood 1997).
UnverifiedOil spill reports
On-Scene Commanders
write
Verification(NCA, Operation Unit)
Citizens VerifiedOil spill reports
read
Triggered exports
readwrite
…..
Verification on site
…..Status on
contaminated shore parts
VerifiedOil spill reports
Status on oil spill situation
read
105
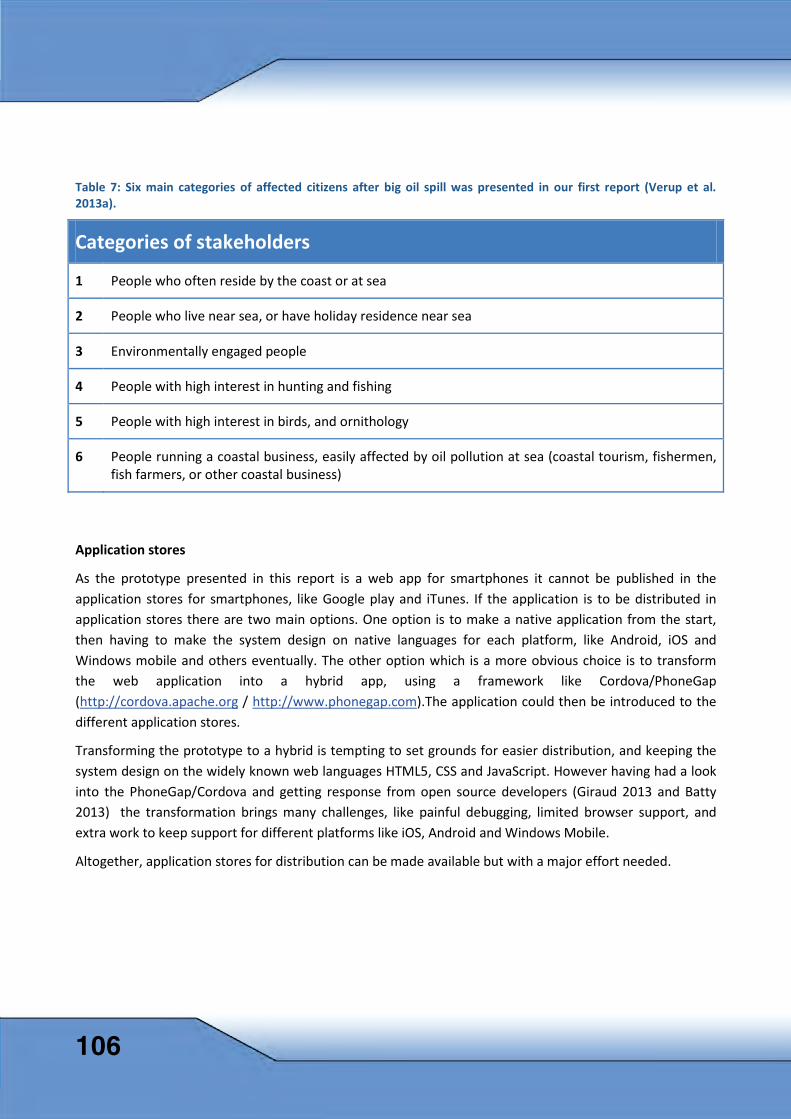
Table 7: Six main categories of affected citizens after big oil spill was presented in our first report (Verup et al. 2013a).
Categories of stakeholders
1 People who often reside by the coast or at sea
2 People who live near sea, or have holiday residence near sea
3 Environmentally engaged people
4 People with high interest in hunting and fishing
5 People with high interest in birds, and ornithology
6 People running a coastal business, easily affected by oil pollution at sea (coastal tourism, fishermen, fish farmers, or other coastal business)
Application stores
As the prototype presented in this report is a web app for smartphones it cannot be published in the application stores for smartphones, like Google play and iTunes. If the application is to be distributed in application stores there are two main options. One option is to make a native application from the start, then having to make the system design on native languages for each platform, like Android, iOS and Windows mobile and others eventually. The other option which is a more obvious choice is to transform the web application into a hybrid app, using a framework like Cordova/PhoneGap (http://cordova.apache.org / http://www.phonegap.com).The application could then be introduced to the different application stores.
Transforming the prototype to a hybrid is tempting to set grounds for easier distribution, and keeping the system design on the widely known web languages HTML5, CSS and JavaScript. However having had a look into the PhoneGap/Cordova and getting response from open source developers (Giraud 2013 and Batty 2013) the transformation brings many challenges, like painful debugging, limited browser support, and extra work to keep support for different platforms like iOS, Android and Windows Mobile.
Altogether, application stores for distribution can be made available but with a major effort needed.
106
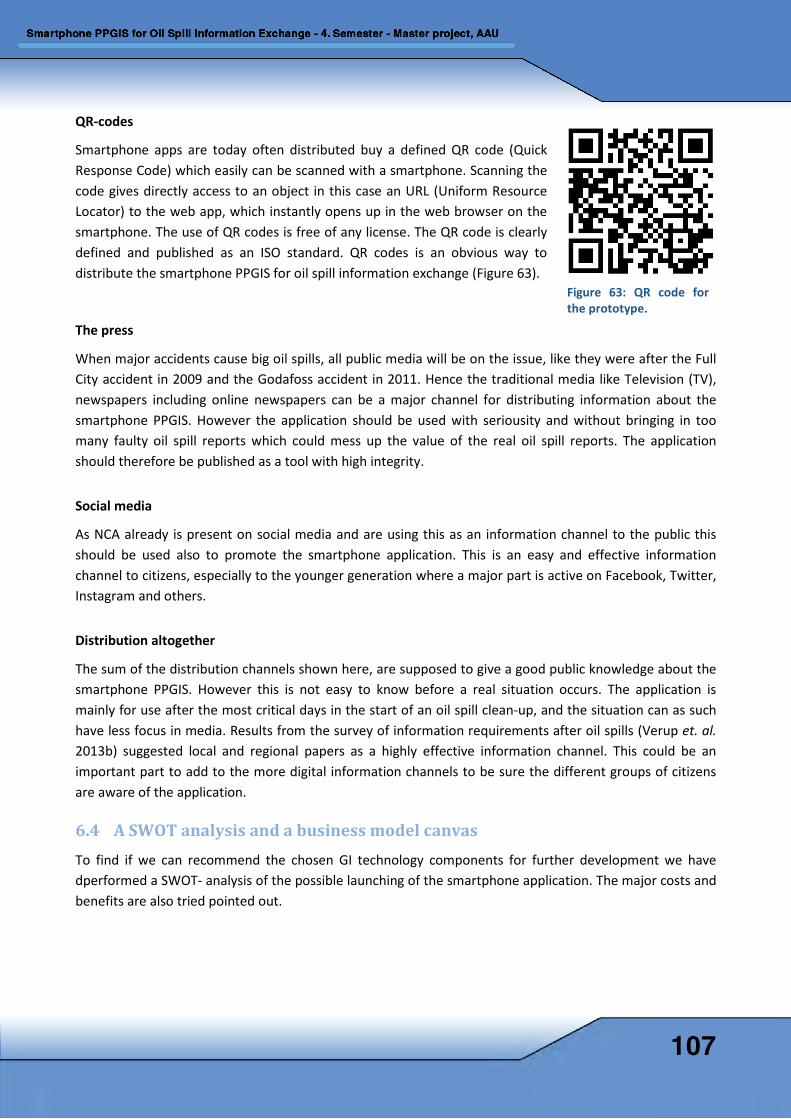
QR-codes
Smartphone apps are today often distributed buy a defined QR code (Quick Response Code) which easily can be scanned with a smartphone. Scanning the code gives directly access to an object in this case an URL (Uniform Resource Locator) to the web app, which instantly opens up in the web browser on the smartphone. The use of QR codes is free of any license. The QR code is clearly defined and published as an ISO standard. QR codes is an obvious way to distribute the smartphone PPGIS for oil spill information exchange (Figure 63).
The press
When major accidents cause big oil spills, all public media will be on the issue, like they were after the Full City accident in 2009 and the Godafoss accident in 2011. Hence the traditional media like Television (TV), newspapers including online newspapers can be a major channel for distributing information about the smartphone PPGIS. However the application should be used with seriousity and without bringing in too many faulty oil spill reports which could mess up the value of the real oil spill reports. The application should therefore be published as a tool with high integrity.
Social media
As NCA already is present on social media and are using this as an information channel to the public this should be used also to promote the smartphone application. This is an easy and effective information channel to citizens, especially to the younger generation where a major part is active on Facebook, Twitter, Instagram and others.
Distribution altogether
The sum of the distribution channels shown here, are supposed to give a good public knowledge about the smartphone PPGIS. However this is not easy to know before a real situation occurs. The application is mainly for use after the most critical days in the start of an oil spill clean-up, and the situation can as such have less focus in media. Results from the survey of information requirements after oil spills (Verup et. al. 2013b) suggested local and regional papers as a highly effective information channel. This could be an important part to add to the more digital information channels to be sure the different groups of citizens are aware of the application.
6.4 A SWOT analysis and a business model canvas To find if we can recommend the chosen GI technology components for further development we have dperformed a SWOT- analysis of the possible launching of the smartphone application. The major costs and benefits are also tried pointed out.
Figure 63: QR code for the prototype.
107
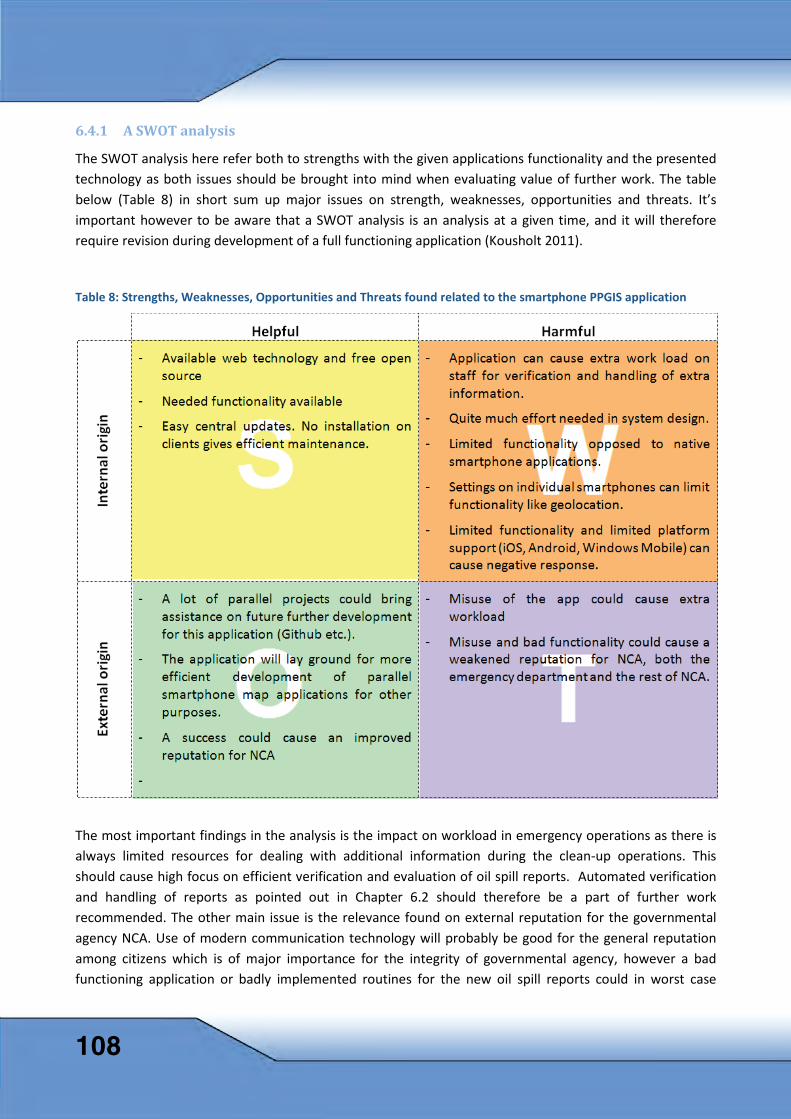
6.4.1 A SWOT analysis
The SWOT analysis here refer both to strengths with the given applications functionality and the presented technology as both issues should be brought into mind when evaluating value of further work. The table below (Table 8) in short sum up major issues on strength, weaknesses, opportunities and threats. It’s important however to be aware that a SWOT analysis is an analysis at a given time, and it will therefore require revision during development of a full functioning application (Kousholt 2011).
Table 8: Strengths, Weaknesses, Opportunities and Threats found related to the smartphone PPGIS application
The most important findings in the analysis is the impact on workload in emergency operations as there is always limited resources for dealing with additional information during the clean-up operations. This should cause high focus on efficient verification and evaluation of oil spill reports. Automated verification and handling of reports as pointed out in Chapter 6.2 should therefore be a part of further work recommended. The other main issue is the relevance found on external reputation for the governmental agency NCA. Use of modern communication technology will probably be good for the general reputation among citizens which is of major importance for the integrity of governmental agency, however a bad functioning application or badly implemented routines for the new oil spill reports could in worst case
108
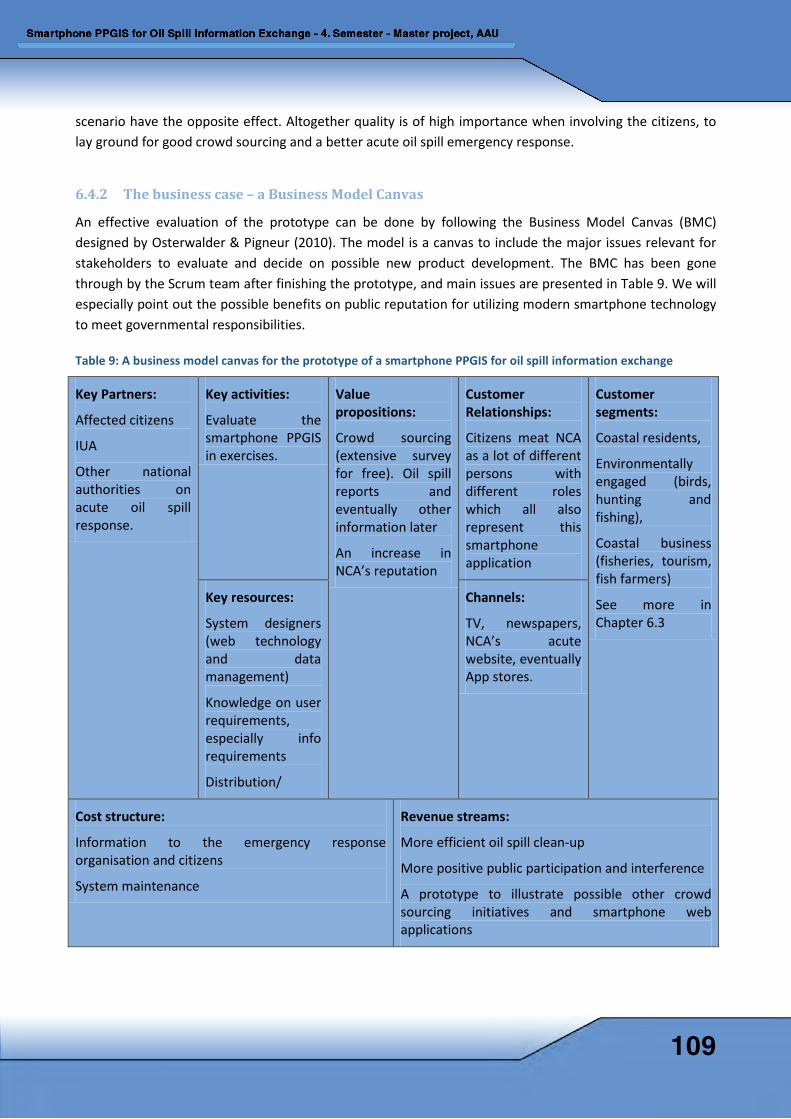
scenario have the opposite effect. Altogether quality is of high importance when involving the citizens, to lay ground for good crowd sourcing and a better acute oil spill emergency response.
6.4.2 The business case – a Business Model Canvas
An effective evaluation of the prototype can be done by following the Business Model Canvas (BMC) designed by Osterwalder & Pigneur (2010). The model is a canvas to include the major issues relevant for stakeholders to evaluate and decide on possible new product development. The BMC has been gone through by the Scrum team after finishing the prototype, and main issues are presented in Table 9. We will especially point out the possible benefits on public reputation for utilizing modern smartphone technology to meet governmental responsibilities.
Table 9: A business model canvas for the prototype of a smartphone PPGIS for oil spill information exchange
Key Partners:
Affected citizens
IUA
Other national authorities on acute oil spill response.
Key activities:
Evaluate the smartphone PPGIS in exercises.
Value propositions:
Crowd sourcing (extensive survey for free). Oil spill reports and eventually other information later
An increase in NCA’s reputation
Customer Relationships:
Citizens meat NCA as a lot of different persons with different roles which all also represent this smartphone application
Customer segments:
Coastal residents,
Environmentally engaged (birds, hunting and fishing),
Coastal business (fisheries, tourism, fish farmers)
See more in Chapter 6.3
Key resources:
System designers (web technology and data management)
Knowledge on user requirements, especially info requirements
Distribution/
Channels:
TV, newspapers, NCA’s acute website, eventually App stores.
Cost structure:
Information to the emergency response organisation and citizens
System maintenance
Revenue streams:
More efficient oil spill clean-up
More positive public participation and interference
A prototype to illustrate possible other crowd sourcing initiatives and smartphone web applications
109
The application will not contribute to a reduced probability of incidents with oil spill, but is a part of the emergency response to limit the consequences when oil spills occur, and in this case big oil spills.
A main goal for the prototype is is to contribute to a better oil spill response with the resources available, and to involve affected citizens in a good way. The result should be better decisions in oil spill recovery, and hence a better effect of the resources included. Additionally, to get the citizens more involved could also contribute to more people volunteering if that could be needed..
An increase in reputation is of course a good benfit for the NCA. Respect and a good reputation is basis for good working conditions and working environment for the emergency organisation. After major oil spills the high media focus will always be interested in finding critical issues, and a functional smartphone PPGIS can, together with a good emergency operation, set grounds for a positive feedback from affected citizens and media.
110
7 Discussion In this chapter we discuss the key findings related to our four major questions presented in the problem statement (Chapter 1.3). We start with how critical functionality regarding client-server communication and camera and GPS access has been solved within the chosen technical framework (Chapter 7.1). Then, in Chapter 7.2, we discuss the development of the user interface using Leaflet and jQuery, including the map view. In Chapter 7.3, we put the whole together and discuss issues regarding recommendations for further system development within the chosen technical framework and possible technology choices and then the organisational implementation in the NCA. Finally, in Chapter 7.4, we present an evaluation of our adapted Scrum methodology which has been used during the system development in the project.
7.1 Critical functionality Based on the user requirements that are detailed in the use cases, the smartphone PPGIS application have to deal with some basic functionality which can be said to be of high criticality, namely server-client communication, image storage on server, smartphone cameras, and geolocation and cross-platform OS compatibilities. All these recur as core functionality to support the user requirements. How this is handled within the chosen technical framework for the prototype is discussed in this subchapter.
Client-server communication The basic infrastructure for the prototype development is the server infrastructure. We have during this project borrowed a dedicated server, installed and hosted by the ICT-firm that are hosting the ICT-infrastructure for the company Landmålergården, of which one of the authors of this report is employee. We missed hereby some experiences of setting up basic IT infrastructure and configuring the firewall. But it is considered as acceptable loss because such infrastructure in most cases will already be available or be facilitated by an organisation's ICT department. From this project, we have accumulated considerable experiences on configurations of web server software, web map server and databases on the server side. To fulfil the establishment of a client-server environment for the smartphone PPGIS in the project, the major elements used was PostGIS (database), GeoServer (map server) with GeoWebCache and the client application building blocks; the JavaScript libraries Leaflet and jQuery Mobile.
The Apache HTTP server was chosen as the software fundament for our web server. Apache and Internet Information Server (IIS) were the main alternatives, however since the other components chosen was open source and IIS is a part of the Microsoft application family, we envisioned several potential challenges on integration between the open source components and IIS. E.g. IIS don’t handle the communication with PHP very well, and instead heavily rely on .NET programming for smooth server-client interaction. During the prototype development and test periods, we have experienced following conveniences and challenges on Apache web server.
• Apache was quite easy to be installed. Web service was online right after the installation. Its cooperation with PHP is seamless in our opinion.
111
• Apache has provided a safe and stable web server environment for our development. We did not experience a single down hour because of Apache software.
• The power of Apache lies in its scalabilities and flexibilities. More than a hundred of modules and extensions are available for Apache. Functions are fully documented from its official website, http://httpd.apache.org/. These can be very good features for advanced applications, but as for small application like ours, it is troublesome.
• Apache does not provide graphic interfaces for server configuration. The modules and extensions can only be switched on and off from a configuration file. In order to configure basic security settings and switch off unnecessary modules, many literatures and documents were read.
• Apache is originally designed in Linux operating system. Apache can first run in windows after a compilation, which means all the external modules and extensions for Linux system cannot be used directly. Instructions for installation and configuration are also different in two different operating systems. It was quite confusing and time consuming for beginners.
Security was major concern in our server site setup. We did several adjustments following the Apache documentation. E.g. only installing the modules that we needed, minimize exposure to potentially attackers by setting the ‘ServerSignature’ directive to ‘off’, disabled directory browsing and prevented upload of executable files and general expose minimum information by disabling relevant settings, like broadcasting of software version info and disabling remote configuration. Apaches’ security capabilities appear to be very good and configurable, and there are a lot of tips and tricks and ‘security tutorials’ available on the internet which undoubtedly have created visibility and safety for our implementation of Apache in this project.
PHP was the core part of our prototype as it helps to establish data communication between server and client side. PHP was chosen because this server side scripting language is fast, flexible and pragmatic. It has been used in numerous web applications and the most important is that PHP is well documented. All the information about features and functionalities can be found on its official site www.php.net. Furthermore an extensive number of samples are available for use on internet communities like www.github.com. In our development, we have integrated some sample codes with adjustments, such as UUID creation and EXIF extraction. Besides, we have also created our own functions that suits to our specific needs.
PHP acted in the prototype as bridge between client and server. Though the prototype does not offer editing capabilities as use case 4 requires. This is because report editing needs two things: local cache of unique report ID’s and spatial data is editable in map. Local caching of unique report ID’s was integrated in the prototype by use of cookie. Online editing of spatial data requires directly access to the data set, and the most popular ways to handle the request are WFS-T and GeoJSON. Data passed between a WFS and a client is encoded with GML, an XML dialect which can be used to model geographic features. WFS-T is official and standardized, but has been used relatively limited until now. The rise of the INSPIRE directive and its implementation in the European countries, however boosts the use of WFS and GML. A good example of this is the ongoing Norwegian project ‘Geosynkronisering’, which is based on WFS and GML. In this project, a dedicated standard is developed. This standard is again based on the WFS 2.0 standard, which in turn proves to be challenging since many of the systems that shall implement the standard does not support WFS 2.0 yet (Gyland, F 2013, pers. comm., 22 Nov). Regarding WFS-T support in Leaflet, there is no broad code library for reuse available, only what might be called alpha releases, e.g. the Leaflet plug-in
112
for WFS-T support, available at GitHub (2013). Realizing editing capabilities in a Leaflet based application GeoJSON will probably represent the smoothest way, and there is much more code examples available and Leaflet itself offers tutorials using GeoJSON (Leaflet 2013b).
Image storage on server As described in Chapter 4.3.2, there are two options to store images on server: save original image file in server’s file system or convert image to large object type (e.g. bytea) and save it directly into database. Even a thorough searching in literatures gives no clear answer to the question. Conservative developers prefer file system methods, while the innovative developers like database a bit more. As both methods have their advantages and disadvantages (see Table 5), the final choice is very much depending on the system scale. According to the innovative developers, disadvantages of image storage in database will disappear with the development of database technologies. Therefore, we have chosen to leave possibilities for both methods in the prototype. Only the future scale tests will indicate which one (or maybe combination) is better to our application.
Geolocation and camera access For our application, geolocation of image reported is an important issue. We have imagined different scenarios for user to geolocate the reported picture, e.g. report at the observation place, take a picture and send report from office or home. There were designed three methods to assign XY coordinates to user reported pictures. The first and most correct way to get XY coordinates is from pictures embedded geotag. Almost all the smartphones have enabled geotags options on their cameras, which means every picture smartphone camera takes has embedded coordinates of the place where the picture is taken. This geolocation information is examined first in our prototype. If it can be found, then the image is assigned with this coordinate. If not, the system goes further with method two, finding geolocation from the browser where users report their observations. The JavaScript code getCurrentPosition() is supported by HTML5 in all major browsers (IE 9.0+, FireFox 3.5+, Opera 10.6+, Chrome 5+, Safari 5+, Iphone 3.0+, Android 2.0+) (Pilgrim 2010), and tested to work finding the position from the smartphone unit. The current location is brought in by GPS-unit or by triangulation of signals from mobile antennas and WiFi-antennas. The precision of position is also in many situations of good use to know within how big area the point of interest could be lying within. Accuracy of geolocation in HTML5 shall be specified in meters, and should correspond to a 95 % confidence interval (W3C 2013b). However, due to privacy reasons, the geolocation feature is not switched on as default. Users shall allow browser to use this function. If this geolocation is disabled and there is no geotag embedded in the picture, we provided users a third possibility, to choose position by pointing on a map manually. This can also be the case, when there is very poor GPS signal coverage. This method shall be taken as the last option.
We have experienced two problems with geolocation functions in testing the prototypes.
1. If users take a picture without geotag and return home or office for reporting the observation in a geolocation-enabled browser. The non-geotaged picture will get current position, say home address, instead of that of the actual observation site.
2. Using HTML5 to call iPhone camera taking photos, the picture will not be saved into iPhone’s gallery. Neither a geotag is embedded. In this case, our prototype tries to find the current location
113
via browser’s geolocation function. If it is disabled, users shall choose a position manually by pointing on the map. We guess this phenomenon due to pictures taken by iPhone get first geotags after they are saved into the gallery. HTML5 calls the camera to take a photo, but has no access to save the picture, thereby adding geotags to the picture.
In scenario 1, wrong coordinates may be assigned to the picture. A simple solution can be adding a judgement whether geolocation shall be used if geotag information cannot be extracted. But this whether or not choice can be annoying if users stand on the observation site and want to use geolocation automatically. Scenario 2 is just a disadvantage of web app, as it does not have access to mobile devices’ file system. Users will get confused if they thought geotags are automatically on in every picture taken by iPhone. Precision of the coordinates will fully depend on the manual pointing on the map.
Point data collected from users are saved in the database with WGS84 (EPSG:4326) as the coordinate system, which is in latitude and longitude. We choose EPSG:4326 as the spatial reference for data storage, mainly because the spatial reference from user reporting images are originated from GPS and in WGS84 latitude longitude formats. Keeping consistence of spatial reference can also avoid transform in spatial reference to minimize performance limiting factors and risks of error in data representation.
One of the important advantages of web apps is cross-platform capabilities. Most features of our prototype runs smoothly on all tested platforms. We have though experienced one major issue that are related to compatibilities between OS and browser types and versions of them using HTML5 to call smartphones camera. Take a photo function works only on new browser and operating systems. According to Bidelman (2013), the HTML5’ multimedia features requirements for iPhone/iPad is minimum iOS6 Safari and iOS6 Chrome, something that is consistent with our own testing. Testing the application on iOS6+ gave access, but testing on an iPhone with an old iOS version (4.3) gave no access to the functionality. For Android OS, the Android 3+ and Chrome 0.16+ is required.
This blocks a lot of non-high-end smartphones which only has lower version of mobile operating systems. Not all users are also probably so careful to have the latest OS versions installed at any time, even if they have a quite new smartphone. Without take a photo function means users have to switch from our app to open camera, take a photo, switch back to our app and then choose a photo from the gallery. This unnecessary workaround gives poor user experiences, and will not work for everyone. iOS version 4.3 did not give access to the ‘Choose existing’ which leads to the gallery, something which also exclude user of such old OS from at all be able to submit a photo. This critical functionality, which is crucial for the user experience, is a HTML5 support issue that seems difficult to be solved by programming from our side.
7.2 Leaflet and jQuery as major parts of the system Development for smartphone devices is first and foremost about communication (Castledine, Eftos & Wheeler 2011). The smartphone application must be well suited for getting information and sending information, which is the main mission. The prototype is however being a light weight application with a limited number of pages and should be easily established without any large effort put into architecture, like the common MVC architecture. By using the MVC we are able to decoupling the modules, which help us to reduce the complexity in architectural design and to increase flexibility and reuse of code in the different programming parts (Supaartagorn 2011).
114
Which context the application is used within must also be taken into account. Usability and user-friendliness is therefore of high importance, especially where the user should be self-taught through use of the application, and even more as the users of the application should include ‘all citizens’.
Design principles from Benyon (2010) Design principles for human centred interactive system design and Cesani & Dranka’s (2013) Ten principles especially relevant for system design on mobile devices is used as guidelines for our system design, where the JavaScript libraries Leaflet and jQuery are used as the major technical framework for realising the design of the prototype.
Leaflet is used for the map page, where it gives the full framework interface of the map. Leaflet is also used for the UpdateXY.html, for users with no geolocation. jQuery is used as basis for development of the user interface of the prototype. Beside basic jQuery, the jQuery mobile framework is used. During the prototype development and test periods, we have experienced following conveniences and challenges on using Leaflet and jQuery:
• The jQuery mobile framework’ ThemeRoller system, was found suitable to create the application framework’ three parts; header, content and footer and gave also good capabilities to fulfil a user interface that support visibility for the user and harmony against the NCA’s design profile.
• jQuery mobile buttons fully support realisations of a our start page design, which contain four buttons, where we want the user first push the red-texted ‘Caution!’ button, then the others respectively regarding their repetitive use of the application. Feedback from the final personas-testing supports this.
• jQuery and Leaflet is capable to combine with necessary technologies to establish advance functionality combined with a well functioning system interface design that works on most OS and different browsers. The report oil spill page is a good example of this, and was developed in a combination with HTML5 and PHP.
• Leaflet gives opportunity to catch coordinates from the map, even if there is no GPS access or geotag available. Our development of the third possible way for user to catch and report a coordinate by pointing in the map manually is a good example of this.
• Leaflet provides a well suitable framework for building a minimalistic and smoothly adapted interface adjusted to the relevant application requirements. Our experience is that this is easy to set up from a well documented API.
• Open Street Map (WMTS) EPSG:3857, which also is Leaflet’s default projection was easily included in the map content, and a lot of other projections supported if third party extension is used. A huge amount of WMS and WMTS can therefore be used within the Leaflet framework.
• Broad browser support is of major importance to offer high degree of usability, and both jQuery and Leaflet offer good support as shown in table 4 (Chapter 3.7). However, use of e.g. HTML5 features for getting access to the devices features like camera, address issues that reduce user experience, although browser support for the basic components Leaflet and jQuery is good.
An issue we experienced challenging was developing a user friendly GetfeatureInfo response presenting in the map from GeoServer’ WMS of the oil spill reports. The GetFeatureInfo request basically calls GeoServer for all available attributes in the layer. GeoServer responds by delivering all attributes limited by the template description for the layer (see Chapter 4.5.2). To improve usability, we made a modification of this
115
template showing only the picture and notes from the reports. This new selection is then presented for the user including using the ‘L.popup’ from the Leaflet API. Due to that touch icons on touch displays should have a minimum size of 9 x 9 mm, the symbol used for the oil spill report were not ideal. To bring the touch interface more near this ideal size without making big symbols to take too much place on the screen, we chose to increase the response area around each symbol by adding extra transparent pixels (see Chapter 4.5.2 for details). This worked well and gave a better user experience in relation to hit the symbols. However, the result of this developed functionality also includes a popup-window when users touch/click a place without report of oil spill.
After intensive literature searches and studies, several AJAX solutions, as e.g. the code in Source code 62 was written to judge the length of HTML file in the popup – a short file refers to an empty file. This function is tested successfully on Internet Explorer where the popups for the empty responses was removed. The backside of that solution was that the popup failed on touch devices. According to tutorialspoint.com (2014), all main stream browser supports AJAX. In our concrete example, it was obviously not working well. Even with jQuery, which we tested a lot against, we did not get the AJAX code to react. According to jQuerymobile (2013), AJAX would be the obvious choice for solving such issue, but we did however thus not to.
$.ajax({ url: URL, dataType: "html", type: "GET", //async: false, success: function(data) { var body = data.replace(/^[\S\s]*<body[^>]*?>/i, "") .replace(/<\/body[\S\s]*$/i, ""); var leng= body.length; if (leng >10) { popup.setContent(data); popup.setLatLng(e.latlng); map.openPopup(popup); } } });
Source code 62: AJAX solution to blank popup problems in the map page
Besides AJAX, we can also find options using HTML5’s getElementbyID functions. It worked also on IE only. Options may be available using HTML5 and AJAX elements, but the time we had available for prototype development was insufficient for further investigation of this.
Leaflet and jQuery undoubtedly offer a good framework for building a user friendly web application where map and map layers is of major importance. Regarding Benyon’s design principles (Benyon 2010, p. 89-94) we believe essentially that the prototype overall have fulfilled the four main principles, using Leaflet and jQuery with the other components server side:
Learnability by ensuring the visibility of functions and their affordance for the user; buttons are made as few and big as possible in relation to an ordinary smartphone’ screen size, with names that gives the user clear guidance of what they perform, and by using concise descriptive text that leaves no doubt about what
116
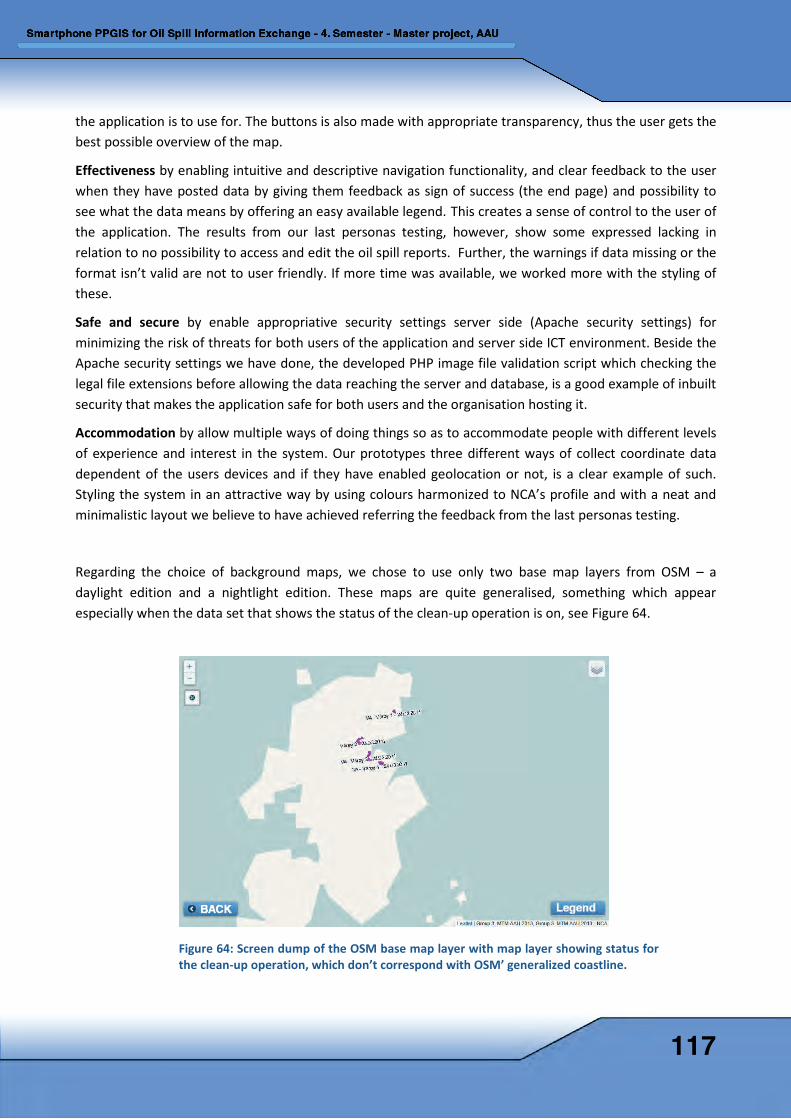
the application is to use for. The buttons is also made with appropriate transparency, thus the user gets the best possible overview of the map.
Effectiveness by enabling intuitive and descriptive navigation functionality, and clear feedback to the user when they have posted data by giving them feedback as sign of success (the end page) and possibility to see what the data means by offering an easy available legend. This creates a sense of control to the user of the application. The results from our last personas testing, however, show some expressed lacking in relation to no possibility to access and edit the oil spill reports. Further, the warnings if data missing or the format isn’t valid are not to user friendly. If more time was available, we worked more with the styling of these.
Safe and secure by enable appropriative security settings server side (Apache security settings) for minimizing the risk of threats for both users of the application and server side ICT environment. Beside the Apache security settings we have done, the developed PHP image file validation script which checking the legal file extensions before allowing the data reaching the server and database, is a good example of inbuilt security that makes the application safe for both users and the organisation hosting it.
Accommodation by allow multiple ways of doing things so as to accommodate people with different levels of experience and interest in the system. Our prototypes three different ways of collect coordinate data dependent of the users devices and if they have enabled geolocation or not, is a clear example of such. Styling the system in an attractive way by using colours harmonized to NCA’s profile and with a neat and minimalistic layout we believe to have achieved referring the feedback from the last personas testing.
Regarding the choice of background maps, we chose to use only two base map layers from OSM – a daylight edition and a nightlight edition. These maps are quite generalised, something which appear especially when the data set that shows the status of the clean-up operation is on, see Figure 64.
Figure 64: Screen dump of the OSM base map layer with map layer showing status for the clean-up operation, which don’t correspond with OSM’ generalized coastline.
117
The appearance of the overlay data showing status for the clean-up operation is not corresponding to OSM’s generalized coastline. Using a national base layer in addition to the OSM, e.g. an orthophoto WMTS layer will improve this, and should be considered used by NCA if this PPGIS concept is implemented in their organisation.
Leaflet and jQuery undoubtedly offers the possibilities to make a successful project for a web based smartphone application. Leaflet does have a force in the adaption to touch devices, compared to other libraries, and Leaflet version 0.7, which was released November 2013, underpins this frameworks focus on touch devices. Support for IE11 touch devices, dropped need for IE conditional comment (moved to the main leaflet.css file), fixed some issues regarding iOS7 safari browser support and improvement of the panning performance is some of several improvements in the 0.7 version (Leaflet 2013c). Use of the libraries Leaflet and jQuery, if the development of a web app is the aim, is therefore considered to be a forward-looking and safe choice, both in terms of technical and design wise capabilities.
jQuery is thus found as a great lightweight framework for building relatively simple applications, as the prototype in this project. This is supported by Ghatol & Patel (2012) and their experiences with jQuery and Sencha Touch, both JavaScript based UI framework for web based mobile applications. Ghatol and Patel conclude that jQuery is most suitable for simpler applications while Sensa Touch is a better choice when the applications complexity increases, which supports very well the idea of combining Leaflet with jQuery in this project’ prototype development.
The structure of the application was found to fit well the user requirements and to support the given use cases 1-7 except 4 and 5.
The page ‘Report oil spill’ fully support use case 1, reporting without using any map interface. The additional pages XYupdate.html together with PHP-code solve use case 2, giving the geolocation for oil spill reports by pointing in the map. Use case 3, where the citizen will check registered oil spills, is available by opening up the map page directly from the start page, however the symbolisation does not distinguish which reports comes from the different users.
Use case 4 which shall give the user access to update oil spill reports have not been implemented. Use case 5, to report observations of birds not oil-infected, is not implemented but is foreseen to be an adapted version of the ‘Report oil spill’ page. Use case 6 is solved by the Map solution for NCA presented in Chapter 5.5. Use case 7, reporting by NCA’s personnel, is solved by the same route as for use case 1 and 2.
118
7.3 Recommendations for organisational implementations and further development
After finishing the prototype development as far as we managed within the timeframe of this project, what is our recommendation for further development, and do we believe NCA should consider implementing such a concept in their organisation?
The prototype developed in this project demonstrates a good solution of the requirements referred to in the introduction for information exchange between the government and affected citizens, even though not all the required functionality is present in the prototype. However, nearby all of them is implemented in a fully technical solution, ready to be used in further testing. User requirements not resolved through the work of the prototype – primarily editing capabilities for citizens own oil spill reports – are however, thoroughly discussed and possible solutions described. Final personas testing (Appendix 3) clarify that the solution, even if it just is a prototype actually works quite well. Further decision on the fate of this smartphone PPGIS concept will soon be left with NCA, and we give them here some advice on how they could establish a good knowledge basis to make a final decision in relation to an implementation or not.
A possible implementation will first require a broad practical testing, e.g. in an exercise on oil spill clean-up operations, and then a final evaluation of the smartphone PPGIS as an operational information exchange support tool. However, as facilitation for an implementation, and as a good basis for an evaluation, it is important that the prototype is given the necessary anchoring in the NCA. Further development of the business model canvas (table 9) can be a good way to establish and maintain the anchoring of the concept. According to the professional Scrum trainer, Sergey Dmitriev, such simple business model canvas often represent the best way of presenting a concept easily understandable for the stakeholders (Dmitriev, S 2013, pers. comm., 17 Oct).
As pinpointed in Chapter 6, early defining of a system owner of the prototype is of major importance, and the ‘Operation unit’ is clearly the most suitable owner of the system. The system owner must take the responsibility to implement the use of the new application in both existing procedures regarding information handling and by clearly address what the tool be used for and what should it not be used for. This should be done by draft that becomes part of the evaluation, which then can be incorporated into existing procedures. The message about a new ‘App’ can give many different associations and confusing and new difficulties on information exchange during oil spill emergency. The program for the information exchange in such operation must therefore be solid and well defined before the final testing and evaluating is conducted. In this program, the verification solution (use case 6) also must be a part and both the smartphone PPGIS application and the verification concept, must be technical implemented in an appropriate test server environment within NCA.
Since NCA planning to implement a new map based emergency support tool in the mid of 2014, based on the Adaptive WebGIS framework, we recommend that the final testing and evaluating of the smartphone PPGIS tool take place after this new system is implemented. The verification tool concept will much likely be best suited as an extension to this new system. To ensure a holistic approach, which support NCA’ desire for one comprehensive oil spill emergency support tool, will it therefore be important to await the final testing and evaluation to after this.
119
Regarding verification of the public oil spill reports, the conceptualized solution (use case 6) involves that only NCA are doing the verification. This due to NCA’ stated user requirements. Experience from other crowd-sourcing also shows a value in citizens adding information to each other’s reports/pictures (Aljazeera 2013). Verification of oil spill reports may represent a heavy workload to the responsible authority, in this case the NCA. If citizens can increase quality of oil spill reports by confirming each other’s reports this could heavily decline the amount of work needed for verification by responsible authority and also increase the reliability of the public reports. According to use case 3, citizens should be allowed to edit their oil spill report. This is a use case with medium priority, however, an extension of this with possibility to confirm another users oil spill report, should be considered.
In our previous GI technology review (Verup et al. 2013b), we had compared the basic advantages and disadvantages of web app, hybrid app and native app. Mantra ‘code once, deploy anywhere’ attracted us so much as we were going to develop a prototype in a short time with limited resources. The prototype development of this project can be taken as cross-platform development that has experienced a lot of benefits, and great advantages in the field of mobile web application development. Nevertheless it is still not fully matured, as browser compatibility issues popup more than once.
HTML5 offers the real opportunities of cross-platform development. However, as an emerging new language, it is far from a fully developed standard. At this moment, many of the functions, especially multimedia-related ones, are still limitedly implemented. We believe that HTML5 standard becomes more attractive for mobile app development when more functions for access to native features of the phone are incorporated (Amatya and Kurti 2013). This is of course under the condition that hardware vendors, and browser owners supports the HTML5 development. The world of browser market is still fairly fragmented today. HTML5 is the first-class citizen on mobile environment Firefox OS and Chrome OS; however it is never the high priority in iOS and Android. The latter are though dominating the mobile market, which means they could slow down the HTML5 development. However, some also predicts that in the near future it will be developed open source OS directly targeted to run HTML5. FireFox OS (project name 'Boot to Gecko ‘), a linux based OS with open source code is an example mentioned, where the goal is to develop an OS that runs HTML5 applications so developer in the future only have to develop applications for one single OS (Knowitlabs 2013).
We see however that any system development either for web applications, hybrid applications or native applications, all include more or less development for each platform. If knowledge is available on native system design, this therefore seam a tempting alternative to the web application development being difficult to some degree by limited access to the smartphone features, and requiring much effort in system development, especially with the limited experience we hold in our group. The same message was also found given at several presentations at Nottingham FOSS4G (Giraud 2013, Batty 2013). The experience with PhoneGap as the main tool available for building hybrid applications was found to give hard work to conquer the system design, and to go native was suggested as a better option. References we have found (Amataya and Kurti 2013, Infoworld 2013) however also diverge in their recommendations. So the choice of elements is found hard, however Leaflet and jQuery is found as very good alternatives if going the open source way for system design.
We suggest the final testing and evaluating is done within the web app framework and the solution that is developed during this project. The evaluating will then, beyond the recommendation for possible
120

implementation, also be determinative for whether the web app framework or a hybrid or native solution should be used. At this point, based on the experiences and outcomes we have documented in this report, however, indicates that a final realization and implementation of the smartphone PPGIS tool should be done within the framework of a hybrid or native solution, to ensure best possible usability.
The other technical components used in the prototype development – PostGIS and GeoServer are found very suitable as basis for eventually further development. GeoServer comes with a number of extensions (GeoServer 2013c) where we especially find the INSPIRE extension and the export of reports on Microsoft Excel format to be possible elements for the prototype, as well as possible support for creation time series of data in map services which is under development (GeoServer 2013d). The INSPIRE-extension could be found to assist in support of transnational solutions for information exchange, and the excel-format is highly valuable as format to citizens with an interest in looking more into the data available, more than just seeing the reports on the map. Time series could be used to show the change in situation over time to the citizens in a very good way. If NCA determines an implementation of the smartphone PPGIS concept after a final test and evaluation, near all necessary infrastructure (servers, database, map server etc.) will already have been implemented as part of the infrastructure to the new map based emergency support tool currently under development, and due to be implemented in mid 2014. This new system, with its infrastructure, clearly facilitates both technical implementations for test an evaluating and eventually for a permanent implementation.
During the prototype development we have used the agile framework Scrum for project management. As a geographically distributed team we faced several potential bottlenecks in relation to perform the development in an effective and transparent way. Scrum as methodology and appropriate tools for project management and collaboration has proved to be very important for the implementation of this project. We therefore in the next and last subchapter, present an evaluation of how Scrum is used in this project, including project management tools.
7.4 Scrum for the project management Technical development of a web application, especially designed for use on smartphones has been the core of this project. The agile framework Scrum was early pointed out as highly relevant for us to use. Good experience of the agile methodology in general in the preliminary work for this project (Verup et al. 2013b), combined with the fact that Scrum is today by far the most used agile framework for system development, strengthened our interest and conviction to try out Scrum as project method.
The characteristics of Scrum are that the methodology is based on a strongly empirical approach. This means that all the work driven forward by using the well defined set of events and artefacts (sprint planning, daily Scrum, backlog etc.) is constructed in the context of supporting transparency, inspection and customization – all key elements in an empirical work process. Scrum is also based on close contact – daily meetings, preferable at the same geographical site – between the team members during the development. In our case – four master students’ located miles apart and with few opportunities to meet physically, this undoubtedly represented a challenge we discussed carefully in the initial work before development methodology was chosen, including trying identify if Scrum have some pitfalls one should be aware of.
121

In this project, where the team have been geographical distributed, we chose to focus mostly on the Scrum process and less on the Scrum roles. The group as a whole has maintained the product owner role, because we all should have a clear understanding of the vision and objectives of the system development, and that it would be artificial to appoint one of the students to hold this role alone. In an ordinary project – we as the consultant and NCA as the customer – a person within the NCA would have the product owner role. In accordance to Shek and Stark’ findings (2013) regarding the Scrum’ pitfalls, a strong and dedicated product owner will clearly benefit the products quality and value creation.
One of the project members was appointed as scrum master to manage prototype development using Scrum tools and planning meetings within the team. The tool Team Foundation Service (TFS) was chosen and used intensive throughout the system development period, from defining the initial product backlog to sprint planning, documentation and progress measuring.
The Scrum project management tool TFS has undoubtedly been critical for the possibility to cooperate and interact effectively within the group during system development. Without this system, we would make much more effort to establish common understanding, transparency and making inspection possible throughout the system development. TFS’ capabilities regarding measuring of progress and detailed documentation possibilities were found very effective and important for our work, and the use of an appropriate Scrum tool, such as TFS, in combination with other appropriate communication and interaction tools (e.g. respectively Skype and DropBox as used in this project) is probably one success critical factor for geographical distributed Scrum teams. Without such tools, which establish the basis for the critical cooperation between geographically distributed team members, Scrum will probably be a difficult methodology to use.
Collaboration and knowledge sharing between team members during the development period has primarily been carried out through Skype meetings. Even if TFS has facilitated a good interaction platform, the lack of physical meetings clearly led to a less productive development process than if we had the opportunity to meet more frequently. The few physical meetings we had during development period (part of the MTM weekend seminar and some fragmented hours during our participation in an oil spill emergency exercise) reaffirm this. The regular weekly Skype meetings, combined with extensive use of TFS, however, weighed something up for this. We therefore believe Scrum, with roughly similar adaptations as made in this study, combined with the use of appropriate support tools as e.g. TFS, can be recommended as methodological framework in system development projects where team members have little opportunity to implement physical meetings.
During the work with this project, we have gained experience with several disciplines, but system design and –development have had the biggest focus, relatively seen. Clarification of user requirements were mainly carried out in our previous study (Verup et al 2013b), which was also the case in relation to which technologies we should use for the system development. Regarding user requirements we have our personas, use cases’ and user stories, which undoubtedly have been the backbone for the system design and subsequent development of the prototype. Demonstration of the prototype iterative development for the real customer – personnel within the NCA – should, however, probably been focused higher. We have had intense periods with coding, planning and monitoring the work progress – all within the Scrum framework, which we have had a strong focus to follow. Testing the application against the users has, however, only been done against the personas, something that ideally also should included real personnel
122
in the NCA. The projects relatively short time frame, combined with the fact that none of the team members are specialists in system development, has led to that the technical development has been given the highest priority, and subsequent testing was performed in the most efficient way - namely against our personas. Even if the developed prototype probably would not deviate significantly from a prototype that have had been tested against personnel from the NCA, however, it would be better quality assured. Given a better time frame for the project and more experienced developers in the team, it would be natural to invite personnel from the NCA to each sprint demo, and thus involved them throughout the major part of the development process, to ensure the best possible feedback as basis for an iterative development process. Close involvement of the customer is one of the stated focus areas for a successful Scrum implementation, and its importance is often underestimated according to Shek and Stark (2013).
In this chapter, we have discussed the opportunities and challenges of the prototype. As technologies are concerned, pros and cons of a web app were discussed in depth based on our software development experiences. Adapted Scrum has been proved as an effective methodology for software development, even within a geographically distributed environment. Concerning further development and implementation, NCA is likely to integrate and develop further on the prototype. Based on these, we draw the conclusions in the following chapter (Chapter 8).
123
8 Conclusions The goal of this project is to answer:
‘How can we apply a web-app framework to develop a functional prototype demonstrating the potential of a smartphone PPGIS for decision support and information exchange between responsible authorities and citizens during large oil spill clean-up operations, and use this as basis for an implementation recommendation?’
This problem statement has been guidance through the project. To achieve an answer to this we have analysed four supplementary questions:
- How can we handle critical functionality regarding client-server communication and camera and GPS access, within the chosen technical framework?
- How can Leaflet and jQuery be utilized for development of good user interfaces which encourages citizen involvement, including a good map view?
- Can we recommend the chosen GI technology components for further development and organisational implementation for responsible authorities?
- How can we handle the teamwork following Scrum within a geographically distributed environment?
The technical framework used as basis for the prototype; Apache HTTP server, PostgreSQL PostGIS, GeoServer and the client application building blocks; Leaflet and jQuery Mobile, has proven to be a very suitable framework for development of a lightweight map based web application for use on smartphones in the field, and only limited by the internet accessibility. Leaflet and jQuery Mobile is found especially suitable for simpler applications. Experiences from this project and the literature confirm this. These components, in combination with use of HTML5 and PHP, have made it possible to develop a fully functional prototype which supports most of the user requirements. The application built support public reporting of oil spill, including picture taking and geolocation through a smoothly designed GUI.
The prototype supports the given use cases 1-7 except 4 and 5. Use case 1, reporting without using any map interface, is fully supported. Using another map page together with PHP-code solve use case 2, giving the geolocation for oil spill reports by pointing in the map. Use case 3, where the citizen will check registered oil spills, is available by opening up the map page directly from the start page, however the symbolisation does not distinguish which reports coming from the different users. Use case 4 which shall give the user access to update oil spill reports, have not been implemented. Use case 5, to report observations of birds not oil-infected, is not implemented but is foreseen to be an adapted version of the ‘Report oil spill’ page. Use case 6 is solved by the Map solution for NCA presented in Chapter 5.5. Use case 7, reporting by NCA’s personnel, is solved by the same route as for use case 1 and 2.
The main challenges related to this open source based GI technology framework relates to compatibility issues between OS and browser types and versions of them using HTML5 multimedia features to call smartphones camera. Only the newest OS and browser versions support such capabilities. This critical functionality, which is crucial for the user experience, is a HTML5 support issue that seems difficult to be solved by programming.
124

The prototype demonstrates a good solution, although not all the use cases are solved in the prototype. We recommend the NCA to conduct a broad practical testing of the concept, e.g. in an exercise on oil spill clean-up operation and use this as basis for an evaluation before a final decision is made regarding technical and organisational implementation.
Critical for an evaluation and further implementation is that the smartphone PPGIS concept is given the necessary anchoring in the NCA, including defining a system owner within the ‘Operation unit’ which takes responsibility to implement the use of the application in NCA’s organisation. It is important to see the smartphone PPGIS concept in relation to the new map based emergency support tool which is under development and planned to be implemented in the mid of 2014, and the final testing and evaluation should first be performed after this new system is implemented.
We suggest the proposal for the final testing and evaluation is done within the web app framework and the solution that is developed during this project. The evaluation will then, beyond the recommendation for possible implementation, also determine whether the web app framework or a hybrid or native solution should be used. At this point, the experiences and outcomes we have documented in this report, however, indicates that a final realization and implementation of the smartphone PPGIS should be done within the framework of a hybrid or native solution, to ensure best possible usability.
Scrum has been used as project methodology during the development process of the prototype. The framework, with some small adaptations, is found suitable for a geographical distributed team as in this project. Daily Scrum has been changed to a weekly Scrum as development has been in addition to full time work. An appropriate Scrum project management tool, such as TFS, and other communication tools as e.g. Skype and DropBox, has been critical for the teams’ possibility to cooperate and interact effectively during system development. The lack of physical meetings, however, clearly led to a less productive development process than if we had the opportunity to meet more frequently. We believe Scrum, with roughly similar adaptations as made in this study, combined with the use of appropriate tools for management can be recommended as methodological framework in system development projects where team members have little opportunity to implement physical meetings.
125
9 Proposals for further work A functional prototype of Smartphone PPGIS web app is developed in this project. This app provides a tool for citizens to get involved after large oil spill accidents. Full scale tests of the prototype are recommended as the next step. In order to reveal the strength and weakness of the prototype, those test shall covers both technical and organisational aspects. On the technical part, stress tests on both server side and client side are expected. As far as organisation challenges are concerned, full scale test can make NCA taking PPGIS into consideration and learning how to integrate citizens’ input into their rescue work after oil spill accidents. Results from those tests will lead to improvements that bring our prototype to an official release - version 1.0.
A full scale test simulates the interests from citizens after a large oil spill accident. According to our previous studies, the interests can be huge. That means technically a significant load on web traffic and server resources. If we use scripts to trigger a moderate scenario, for example 3,000 user reports and map viewings each in an hour, intensively on a certain costal area, it will be interesting to examine the following technical aspects under the stress condition:
• Web Server Performance – how Apache and web traffic react to this amount of HTTP requests; how much hardware resources are allocated to this service; how long the response time develops during the test period; how quick PHP deals with data handling and data transferring to the database.
• Web Map Server Performance – how GeoServer reacts to the map view requests; are there needs for creating map caches on the objective area.
• Image storage in file system – does file system experience resource problems; is there problems indexing and search files; is there needs for splitting upload directory into several subdirectories
• Image storage in database – how fast does PostGIS database grow; does PostGIS database become slower in responding to use requests; does image storage give problems to database backup; does this web app need image stored in database directly.
During this robot test period, one or two human tester can experience how user will notice a heavy load on server and whether there is a mess on the map viewing due to the big amount of user reports. These results reveal the scalability of our prototype, and they can lead to improvements of the existing prototype.
Personas were involved in testing of our prototype in this project and their opinions were valuable to our development. Another full scale test can thus be performed with focus on user experiences, for example, to select 100 coastal inhabitants testing our prototype under excellent (4G), good (3G) and poor (EDGE - Enhanced Data for GMS Evolution) signal coverage. Again the feedbacks can give clear idea where the existing prototype can be improved.
Based on the robot tests and user tests, a certain amount of data is accumulated. That will make NCA to consider how validation work can be conducted in practice. IT and GIS units from NCA can begin thinking of how the validated user reports can be integrated into the existing SDI (Spatial Data Infrastructure) and at what extent NCA’s Operation and Commando units shall be involved. Hopefully, a series of action plans will be made and relative work routines can be established. This is not for the sake of our prototype, but more of PPGIS integration in NCA organisation.
126
Due to the limitations on time and resources of this project, there are still several functionalities and features in our development plan not yet reached. Personas mentioned save, edit and delete possibilities in the app. This is the typical way of software development. Users have requirements and software owner and developers make priorities. We think the following functions are most important and relevant to be developed. It is very possible that full scale tests discover the same demands for these functions.
• Cell clustering: crowd sourcing from above mentioned robots tests can bring in a large amount of pictures and oil spill reports. There are risks for information overload and clustering of oil spill reports with thousands of points in a limited area can lead to poor user experiences. Showing numbers of reports instead of every single point can make information more pedagogic. Using colours to show which areas that have many oil spill observations can also provide a quick understanding of which locations should be given highest priority in NCA’s clean-up operations.
• Offline cache: we have made some attempts in this prototype on using web cache to store user’s data offline. However it is far from enough. The offline cache function shall be developed in an extent that all data user reported can be saved locally if there is no data connection to server. As soon as the data communication established, all the saved data are synchronised with server without further action from users. We have even thought that offline cache function is extended with downloading relevant background map to the local cache, so that users still can find their locations without network connection.
• Automatic image recognition: Kongsberg Satellite’s Oil-Service is already included in NCA’s web map solution Kystinfo (Leifer et al. 2012). Automated detection of oil spills at sea from satellite or aerial photography and satellite radar are replacing labour-intensive manual reviewing. Integration of automatic image recognition can relieve the manual verification workload in NCA, so that user reports can be identified efficiently and be integrated into NCA’s system quickly.
During the development of this prototype, we have experienced a lot of compatible issues due to difference of mobile device and browser type. The limitation of calling Smartphone’s local functions is another big issue. Those inconveniences make us thinking of the conversion trials from web app to hybrid or native app. Hybrid or native apps have the clear advantages in app distribution, which is also in favour of Smartphone PPGIS. It will be an interesting try using third-party tools like PhoneGAP to do the transformation.
127

10 Abbreviations A-GPS Assisted Global Positioning System
AJAX Asynchronous JAvascript XML
API Application Programming Interface
App Application
ASP Application Service Provider
BBOX Bounding Box
BMC Business Model Canvas
BMP BitMaP image file
CGI Common Gateway Interface
CRS Coordinate Reference System
CSS Cascading Style Sheets
DB DataBase
DBMS DataBase Management System DIV Division DNS Domain Name System
DOM Document Object Model
EDGE Enhanced Data for GMS Evolution
EPSG European Petroleum Survey Group
EUREF89 the European sub-commission of the International Association of Geodesy (IAG)
ER Entity Relationship
ESRI Environmental System Research Institute
ETRS89 European Terrestrial Reference System 1989
EU Europe
EWKB Extended Well-Known Binary
EWKT Extended Well-Known Text
EXIF EXchangeable Image file Format
FLT Freemarker TempLate
FME Feature Manipulation Engine
FOSS4G Free and Open Source Software for Geospatial
GB GigaBytes
GD Graphics Draw
GDAL Geospatial Data Abstraction Library
GeoJSON Geographical JavaScript Object Notation
GI Geographical Information
GIF Graphics Interchange Format GIS Geographical Information System GML Geographic Markup Language
GPL General Public License
GPS Global Positioning System
GUI Global System for Mobile communication
HSEQ Health, Safety, Environment and Quality
HTML Hypertext Markup Language HTTP Hyper Text Transfer Protocol
ICT Information and Communication Technology
ID Identity
IETF Internet Engineering Task Force
IIS Internet Information Server
IMEI International Mobile Equipment Identity
IMG Images
INSPIRE (INfrastructure for SPatial InfoRmation in Europe)
iOS Apples Operating System
IP Internet Protocol ISO International Standards Organization
IT Information Technology
IUA Intermunicipal emergency response units on acute pollution
JPEG Joint Photographic Experts Group JS JavaScript
JSON JavaScript Object Notation
KB KiloByte
KystCIM Kystverket Crises Information Management
LAN Local area Network
MB MegaByte
MIT Massachusetts Institute of Technology
MS Microsoft
MTM Master of Technology Management
MVC Model View Controller
128

NCA Norwegian Coastal Administration
PC Personal Computer
PL/pgSQL Procedural Language/PestgreSQL
PHP Hypertext Preprocessor
PNG Portable Network Graphic
PPGIS Public Participation Geographical Information System
OGC Open Geospatial Consortium
OGR OpenGIS Simple Features Reference Implementation
OSM Open Street Maps
OGP International Association of Oil & Gas Producers
OSGeo Open Source Geospatial foundation OS Operating System
QR Quick Response
RDP Remote Desktop Protocol
RFC Request For Comment
RGB Red, Green and Blue
SAR Search And Rescue
SDI Spatial Data Infrastructure
SE Symbology Encoding
SLD Styled Layer Descriptor
SQL Structured Query Language
SRID Spatial Reference system Identifier
SRS Spatial reference system
SWOT Strengths, Weaknesses Opportunities and Threats
TCP Transmission Control Protocol
TFS Team Foundation Service
TV Television
US United States
UML Unified Modelling Language
UTM Universal Transversal Mercator
URL Uniform Resource Locator
UUID Universally Unique Identifiers
uuid-ossp Universally Unique Identifiers – open source software project
VGI Volunteered Geographic Information
WBMP Wireless BitMap
WCS Web Coverage Service
WFS Web Feature Service
WFS-T Transactional Web Feature Service
WGS84 World Geodetic System 1984
WKB Well-Known Binary
WKT Well-Known Text
WMS Web Map Service
WMTS Web Map Tile Service
WWF World Wide Fund for Nature
WWW World Wide Web
WYSIWYG What You See Is What You Get
W3C World Wide Web Consortium
XML Extensible Markup Language
XPM X-Pixmap
2D 2 Dimensions
3G Third Generation
3D 3 Dimensions
4G Fourth Generation
4D 4 Dimensions
129
11 References
11.1 Literature:
Amatya, S & Kurti, A 2013, Cross-Platform Mobile Development: An Alternative to Native Mobile Development. Degree: Project Department of Computer Science, Linnæus University Sweden.
Benyon, D 2010, Designing Interactive Systems – A comprehensive guide to HCI and interaction design, 2nd ed. Pearson Education Ltd, Edinburgh, England.
Boitsov, S, Klungsøyr, J & Dolva, H 2013, Experiences from oil spills at the Norwegian coast – A summary of environmental effects. IMR Report No. 23-2012.
Derrough, J 2013, Interactive Map designs with Leaflet JavaScript Library How-to: An intuitive guide to creating animated, interactive maps with the Leaflet JavaScript library in a series of straightforward recipes. Packt Pub. Birmingham, UK.
Fowler, M & Highsmith, J 2001, The Agile Manifesto, Written at a summit of seventeen independent-minded practitioners of several programming methodologieson 11. – 13. Feb 2001, at The Lodge at Snowbird ski resort in the Wasatch mountains of Utah. Available from: <http://www.pmp-projects.org/Agile-Manifesto.pdf>. [4 Jan 2014].
Fu, P & Sun, J 2011, Web GIS: Principles and Applications. ESRI Press. CA.
Ghatol, R & Patel, Y 2012, Beginning PhoneGap: Mobile Web Framework for JavaScript and HTML5. Apress, Berkeley, CA.
Hansen, HS & Prosperi, D 2005, Citizen participation and internet GIS – some recent advances. Computers Environment and Urban Systems, Vol. 29, pp. 617-627
Hansen, HS, Schrøder L, Hvingel, L & Christiansen, JS 2011, Towards Spatially Enabled e-Governance – A Case Study on SDI implementation, International Journal of Spatial Data Infrastructures Research, Vol. 6, pp. 73-96.
Holdener III, AT 2011, HTML5 Geolocation. O’Reilly Media Inc. Sebastopol, CA.
Hong Ma 2013, Tech Services on the Web - jQuery Mobile. Technical Services Quarterly, Vol 30:2, pp. 231-232, DOI: 10.1080/07317131.2013.759840.
Hsiao C-Y, Liu, Y-J & Wang, M-JJ 2013, ‘Usability Evaluation of the Touch Screen User Interface Design’ in Proceedings HIMI/HCII 2013 Part I, LNCS 8017, ed. S Yamamoto. Springer-Verlag Berlin Heidelberg, pp. 48-54.
130

IETF 1996, Address Allocation for Private Internets. RFC 1918. The Internet Engineering Task Force (IETF). Available from: < http://tools.ietf.org/pdf/rfc1918.pdf>. [11 Dec 2013].
IETF 2011, HTTP State Management Mechanism, Obsoletes RFC 2965, 2011, The Internet Engineering Task Force (IETF).
ISO/IEC 9834-8, 2008, Information technology -- Open Systems Interconnection -- Procedures for the operation of OSI Registration Authorities: Generation and registration of Universally Unique Identifiers (UUIDs) and their use as ASN.1 Object Identifier components, International Organization for Standardization.
Komine, S & Nakanishi, M 2013, Optimization of GUI on Touchscreen Smartphones Based on Physiological Evaluation – Feasibility of Small Button Size and Spacing for Graphical Objects. Proceedings HIMI/HCII 2013 Part I, LNCS 8017, ed. S Yamamoto. Springer-Verlag Berlin Heidelberg, pp. 80-88.
Kousholt, B 2011, Projæktlederens verktøj. Nyt Teknisk Forlag. København.
Leifer, I 2012, State of the art satellite and airborne marine oil spill remote sensing: Application to the BP Deepwater Horizon oil spill. Remote Sensing of Environment, Vol. 124, pp. 185-209.
Lim, Y-K, Stoltermann, E & Tenenberg, J 2008, The anatomy of prototypes: Prototypes as filters, prototypes as manifestations of design ideas. ACM Transactions on Computer-Human Interaction (TOCHI), Vol. 15 issue 2 Article no. 7.
Loechel, A & Schmid, S 2013, Comparison of Different Caching Techniques for High-Performance Web Map Services. International Journal of Spatial Data Infrastructures Research, Vol 8. pp 43-73.
Mitchell, RK, Agle, BR, Wood, DJ 1997, Toward a theory of stakeholder identification and salience: defining the principle of who and what really counts. The Academy of Management Review. Vol 22. pp. 853-886.
Norwegian Mapping Authority 2013, ‘Kartverkets bruk av WGS84 vs. Euref89 og konsekvenser for data og tjenester i Norge digitalt’ Note from the reference group in Norge digitalt 17. Feb 2013. Available from: <http://159.162.103.4/norgedigitalt.no/Norge_digitalt/Norsk/Teknologi/Koordinatsystemer/Forslag+om+felles+overgang+til+nye+EPSG-koder.d25-SwJzS0x.ips>. [11 Nov 2013].
OGC 2005, Web Feature Service Implementation Specification. Ver. 1.1.0. Ref. no. OGC 04-094
OGC 2006, Open GIS Web Map Server Implementation Specification. Ver. 1.3.0. Ref. no. OGC 06-042
OGC 2010, OpenGIS Web Feature Service 2.0 Interface Standard. Ver. 2.0.0. Ref. no. OGC 09-025r1 and ISO/DIS 19142.
OGC 2011, OpenGIS® Implementation Standard for Geographic information - Simple feature access – Part 1: Common architecture, ver. 1.2.1. Reference no. OGC 06-103r4.
131
Osterwalder, A & Pigneur, Y 2010, Business Model Generation: A Handbook for Visionaries, Game Changers, and Challengers. 3rd ed. John Wiley & Sons. Hoboken, NJ.
Perschke, S 2012, Six free databases for the enterprise, Network World, vol. 29, Issue 21, pp. 28-30.
PricewaterhouseCoopers 2010, Evaluering av den statlige oljevernaksjonen etter grunnstøtingen av MV Full City 31. juli 2009. Report to Kystverket.
Quesenbery, W 2001, What does usability mean: Looking beyond ‘ease of use’. in Proceedings of the 48th Annual Conference, Society for Technical Communication, 2001. Available from: <http://www.wqusability.com/articles/more-than-ease-of-use.html>. [11 Nov 2013].
Ramsey, P 2006, ‘The state of open source GIS’, Refraction Research Inc. Vancouver.
Robinson, AH, Sale, RD, Morrison, JL & Muehrcke, PC 1984, Elements of Cartography. Fifth edition. Wiley. New York, NY.
Rogers, Y, Sharp, H & Preece, J 2011, Interaction Design: Beyond Human - Computer Interaction. John Wiley & Sons.
Schwaber, K & Sutherland, J 2013, The Scrum GuideTM - The Definitive Guide to Scrum: The Rules of the Game, ver. July 2013. Scrum.org. Available from: <https://www.scrum.org/Portals/0/Documents/Scrum%20Guides/2013/Scrum-Guide.pdf>. [05 Jan 2014].
Sears, R. & Van Ingen, C 2007, Fragmentation in Large Object Repositories Experience Paper, Proceeding of Third Biennial Conference on Innovative Data Systems Research (CIDR), pp. 298-305
Sears, R, Van Ingen, C & Gray, J 2007, To BLOB or Not To BLOB: Large Object Storage in a Database or a Filesystem?, Third Biennial Conference on Innovative Data Systems Research.
Shek, S & Stark, F 2013, ‘Hur hanteras problematiken i scrumprojekt – en studie om ramverket scrum”. Kanditatuppsats i Informatik, Høgskolan i Borås.
Shekhar, S & Chawla, S 2003, Spatial Databases – A Tour. Prentice Hall. Upper Saddle River NJ.
Snyder, JP 1989, Album of Map Projections, United States Geological Survey Professional Paper. United States Government Printing Office.
Supaartagorn, C. 2011, PHP Framework for Database Management Based on MVC Pattern. International Journal of Computer Science & Information Technology (IJCSIT), Vol.3(2), pp. 251-258.
Sæther, PO 2009, User stories versus use cases. Article on breathingtech.com dated 22.1.2009. Available from: < http://breathingtech.com/2010/user-stories-versus-use-cases/>. [17 Dec 2013].
Takeuchi, H & Nonaka, I 1986, The New New Product Development Game, Harvard Business Review, January/February 1986, pp. 285-305
132
Verup, K, Klingsheim, JM, Slotta, S & Yang, W 2013a, PPGIS – borgerindragelse ved olieforurening’, 2nd semesters’s project report, Aalborg University.
Verup, K, Klingsheim, JM, Slotta, S & Yang, W 2013b, Smartphone PPGIS for Oil Spill Information Exchange, 3. semester’s project report, Aalborg University.
W3C 2010, Mobile Web Application Best Practices W3C Recommendation 14 Dec 2010. Available from: < http://www.w3.org/TR/2010/REC-mwabp-20101214/>. [9 Nov 2013].
W3C 2013a, W3C DOM4 - W3C First Public Working Draft, dated 07 November 2013. Available from: <http://www.w3.org/TR/dom/>. [9 Nov 2013].
W3C 2013b, W3C Geolocation API Specification - W3C Recommendation, dated 24 Oct 2013. Available from: <http://www.w3.org/TR/geolocation-API/>. [11 Nov 2013].
W3C 2013c, Web Storage - Editor's Draft, dated 23 Oct 2013. Available from: <http://dev.w3.org/html5/webstorage/>. [11 Dec 2013].
11.2 Webpages:
Aljazeera 2013, ‘Interactive: Mapping damage in Philippines - Volunteers have tagged thousands of social media images to online maps and rated typhoon damage to assist aid efforts’. Aljazeera In depth article, last updated 13 Nov 2013. Available from: < http://www.aljazeera.com/indepth/interactive/2013/11/interactive-mapping-damage-philippines-2013111372853666106.html>. [7 Dec 2013].
Apache Lounge 2013, ‘Apache 2.4 VC11 Binaries and Modules Win32 and Win64’. Available from: <http://www.apachelounge.com/download/>. [11 Dec 2013].
Apache Software Foundation 2013, Overview of new features in Apache HTTP Server 2.4. Available from: <http://httpd.apache.org/docs/trunk/new_features_2_4.html>. [11 Dec 2013].
BBC News technology 2011, New net rules set to make cookies crumble. Available from: <http://www.bbc.co.uk/news/technology-12668552>. [11 Dec 2013].
Buckey, David J 1997, ‘The GIS primer – An introduction to Geographic Information System’, http://bgis.sanbi.org/gis-primer/ [11 Dec 2013].
Bidelman, E 2013, Capture audio & video in HTML5. Available from: <http://www.html5rocks.com/en/tutorials/getusermedia/intro/>. [29 Oct 2013].
Caniuse 2013, Compatibility tables for support of HTML5, CSS3, SVG and more in desktop and mobile browsers. Available from: < http://caniuse.com/#cats=HTML5>. [5 Jan 2014].
Capax Global 2013, ‘Mobile consulting’. Available from: <http://www.capaxglobal.com/solutions/mobile-consulting/>. [9 Nov 2013].
133
Castledine, E, Eftos, M & Wheeler, M 2011, Build mobile websites and Apps for smart devices. 1st ed. Available from: Sitepoint Pty Ltd [11 Nov 2013].
Cowart, J 2013, ‘When to Go Native, Mobile Web or Cross-Platform/Hybrid’. Available from: < http://tech.pro/blog/1355/when-to-go-native-mobile-web-or-cross-platformhybrid>. [9 Nov 2013].
Deveria, A 2013, Compatibility tables for support of HTML5, CSS3, SVG and more in desktop and mobile browsers. Available from: <http://caniuse.com/#search=getUserMedia>. [12 Nov 2013].
Domingos, N 2008, Agile criticism 2 – Scrum and the Team. Available from: <http://www.codeinstructions.com/2008/08/agile-criticism-2-scrum-and-team.html>. [7 Dec 2013].
Erhvervsstyrelsen (2013), Cookie-loven. Available from: <http://erhvervsstyrelsen.dk/cookies>. [22 Dec 2013]. In Danish.
Findthebest 2013,‘Compare smartphones. A webbased continuous technology survey. Available from: <http://www.findthebest.com/>. [20. Dec 2013].
GeoJSON 2013, GeoJSON – Full specification. Homepage. Available from: <http://geojson.org/geojson-spec.html>. [11 Dec 2013].
GeoServer 2013a, Geoserver documentation - Services. Available from: <http://docs.geoserver.org/2.3.5/user/services/index.html>. [11. Dec 2013]
GeoServer 2013b, Geoserver documentation - SLD Reference’. Available from:
<http://docs.geoserver.org/2.3.5/user/styling/sld-reference/index.html#sld-reference>. [11. Dec 2013].
GeoServer 2013c, Geoserver documentation - Extensions. Available from:
<http://docs.geoserver.org/2.3.5/user/extensions/index.html>. [11 Dec 2013].
GeoServer, 2013d, Using the Image Mosaic plugin for raster time-series data. Available from: <http://docs.geoserver.org/latest/en/user/tutorials/imagemosaic_timeseries/imagemosaic_timeseries.html>. [11. Dec 2013].
GitHub 2013, Leaflet plug-in for WFS Transactional (WFS-T) support. Available from: <https://github.com/flatrockgeo/leaflet.wfs-t/>. [28 Dec 2013].
Google developers, 2013, Managing application storage, Last updated 12. Aug 2013. Available from: <https://developers.google.com/chrome-developer-tools/docs/resource-panel>. [11 Dec 2013].
Infoworld 2013, Mobile app developers’ interest in HTML5 is slipping. Available from: <http://www.infoworld.com/t/javascript/mobile-app-developers-interest-in-html5-slipping-232971>. [28 Dec 2013].
134
jQuery Foundation 2013a, jQuery –Write less, do more. Available from: <http://www.jquery.com/>. [16 Nov 2013].
jQuery Foundation 2013b, jQuery mobile - Introduction. Available from: <http://demos.jquerymobile.com/1.4.0/intro/>. [23 Dec 2013].
Knowitlabs 2013, Smarttelefoner Q2 2013. Articlee of 31 Mar 2013. Available from: < http://beta.knowitlabs.no/smarttelefoner-q2-2013/>. [1 Jan 2014].
Leaflet 2013a, Leaflet - An Open-Source JavaScript Library for Mobile-Friendly Interactive Maps. Available from: <http://www.leafletjs.com/>. [16 Nov 2013].
Leaflet 2013b, Using GeoJSON with Leaflet. Available from: <http://leafletjs.com/examples/geojson.html/>. [28 Dec 2013].
Leaflet 2013c, Leaflet 0.7 Release, MapBox and Plans for Future. Available from: <http://leafletjs.com/2013/11/18/leaflet-0-7-released-plans-for-future.html>. [1 Jan 2014].
Merriam-Webster n.d., Merriam-Webster Dictionary. Available from: <http://www.merriam-webster.com/dictionary/user-friendly>. [11 Nov 2013].
OpenStreetMap Foundation 2013, OpenStreetMap Foundation - Main page. Available from: <http://wiki.osmfoundation.org/wiki/Main_Page>. [28 Dec 2013].
Pilgrim, M 2010, Dive into HTML5 – No6. You are here. Available from: <http://diveintohtml5.info/geolocation.html>. [12 Nov 2013].
PostGIS Project Steering Committee 2013, PostGIS. Available from <http://postgis.net>. [13 Nov 2013].
Singelton, A 2012, Seven Things I Hate About Agile. Available from: <http://blog.assembla.com/assemblablog/tabid/12618/bid/87899/Seven-Things-I-Hate-About-Agile.aspx>. [7 Dec 2013].
Software Sustainability Institute 2013, Choosing a repository for your software project. Available from: <http://software.ac.uk/resources/guides/choosing-repository-your-software-project>. [4 Jan 2014].
Tang, Guoan, 2013, Courseware - Geographic Information System. Available from: <http://kc.njnu.edu.cn/dlxx/English/English.htm>. [11 Dec 2013].
Taft, DK 2011, ’W3C: HTML5 Spec Due in 2014 - The World Wide Web Consortium has reset its timeline for the delivery of HTML5 to see a final version of the specification in 2014’. Article on eWeek.com posted 16.2.2011. Available from: <http://www.eweek.com/c/a/Application-Development/W3C-HTML5-Spec-Due-in-2014-108529/>. [8 Dec 2013]
Teeky.org, 2010, ‘Model-View-Controller MVC to Javascript’. Article published 26. Oct 2010. Available from: < http://teeky.org/model-view-controller-mvc-to-javascript/>. [17 Nov 2013].
135
Tutorialspoint.com, 2014, AJAX Browser Support. Available from: <http://www.tutorialspoint.com/ajax/ajax_browser_support.htm>. [2 Jan 2014].
Wayner, P2013, Review: Mobile web development frameworks face off. Info World.com, Available from: <http://www.infoworld.com/d/application-development/review-mobile-web-development-frameworks-face-229774>. [23 Dec 2013].
Wire 2013, ‘How AI, Twitter and digital volunteers are transforming humanitarian disaster response’. Article on Wired.co.uk 30 September 2013. Available from: <http://www.wired.co.uk/news/archive/2013-09/30/digital-humanitarianism>. [7 Dec 2013].
W3Techs 2013, Technologies - Usage of JavaScript libraries for websites. Available from: <http://w3techs.com/technologies/overview/javascript_library/all>. [23 Dec 2013].
11.3 Presentations and personal communication
Batty, P 2013, ‘Open Source Web and Mobile Mapping Applications in Utilities and Telcos’. Presentation at FOSS4G Nottingham 2013. Available from: <http://elogeo.nottingham.ac.uk/xmlui/handle/url/215>. [24 Nov 2013].
Berger, S (pers. comm. 12 Nov 2013). From conversations between Simen Slotta and Silje Berger after the choice of developing company of the new system “Map based emergency response solution” has been taken.
Cesani, E & Dranka, L 2013, ‘HCI Principles for Mobile Devices’. Presentation on slideshare.net 16 Mar 2013. Available from: <http://www.slideshare.net/cesani/10-principles-of-hci-for-mobile-devices>. [9 Nov 2013].
Dmitriev, S (pers. comm. 17 Oct 2013). From conversations between Simen Slotta and the certified scrum trainer Sergey Dmitriev during his course “Certified scrum product owner” in Tromsø, Norway, 17 and 18 Oct 2013.
Giraud, P 2013, ‘Mobile development with OpenLayers, Sencha Touch and PhoneGap’. Presentation at FOSS4G Nottingham 2013. Available from: <http://elogeo.nottingham.ac.uk/xmlui/handle/url/172>. [24 Nov 2013].
Gyland, F (pers. comm. 22 Nov 2013). From conversations between Simen Slotta and Lars Fredrik Gyland during steering committee meeting in the Norwegian national GI-Infrastructure project ‘Geosynkronisering’.
National Geographic 2012, Patrick Meier: Chrisis Mapping. Available from: <http://www.youtube.com/watch?v=qRG_Rue1a-s&feature=youtube_gdata>. [7 Dec 2013].
136
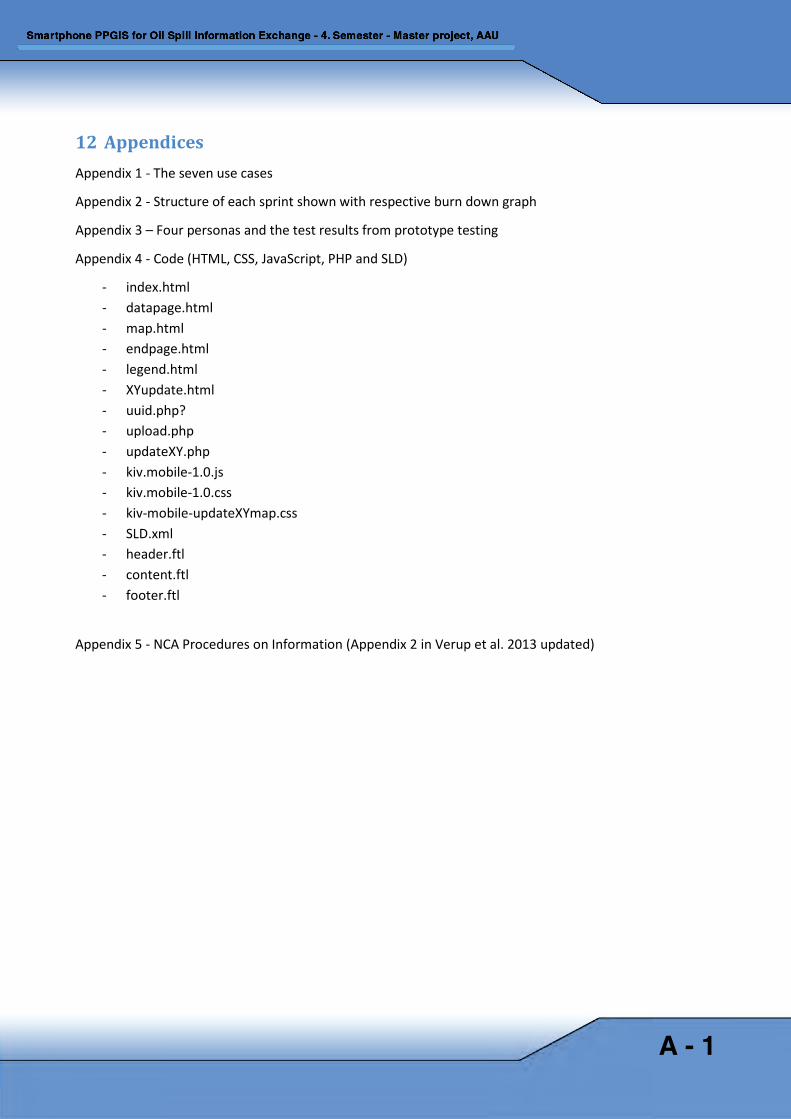
12 Appendices Appendix 1 - The seven use cases
Appendix 2 - Structure of each sprint shown with respective burn down graph
Appendix 3 – Four personas and the test results from prototype testing
Appendix 4 - Code (HTML, CSS, JavaScript, PHP and SLD)
- index.html - datapage.html - map.html - endpage.html - legend.html - XYupdate.html - uuid.php? - upload.php - updateXY.php - kiv.mobile-1.0.js - kiv.mobile-1.0.css - kiv-mobile-updateXYmap.css - SLD.xml - header.ftl - content.ftl - footer.ftl
Appendix 5 - NCA Procedures on Information (Appendix 2 in Verup et al. 2013 updated)
A - 1
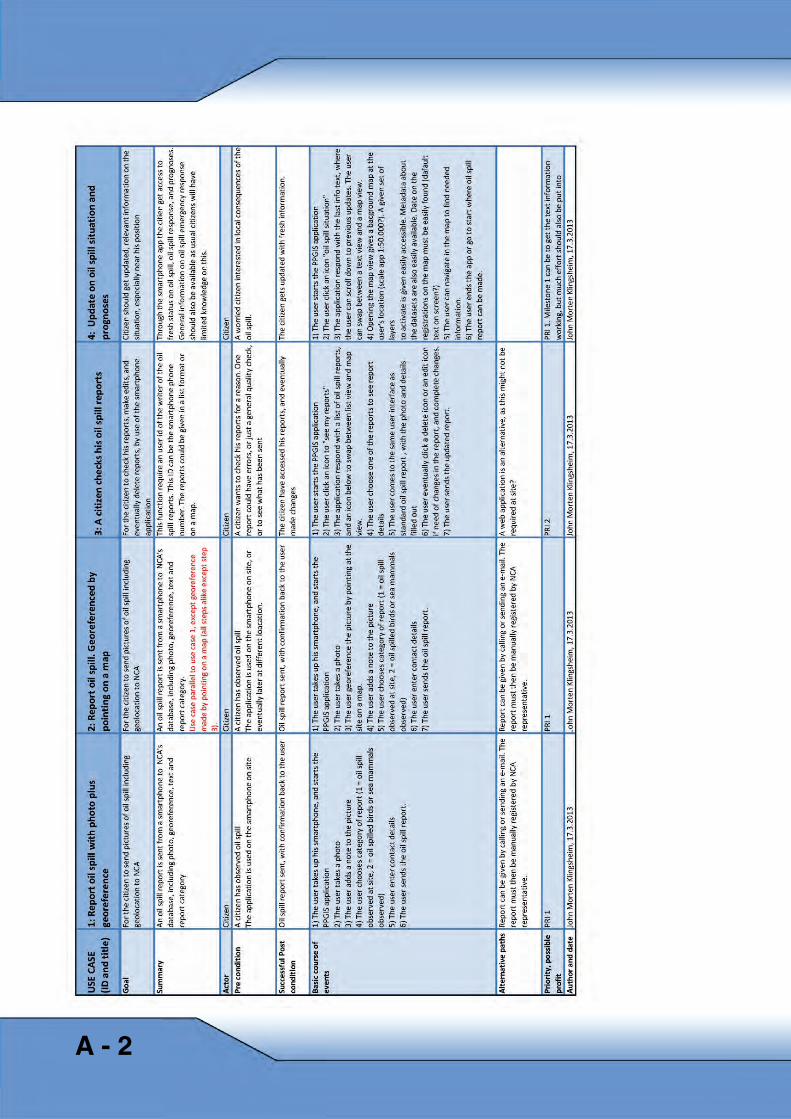
Appendix 1: The seven use cases (1-4)
A - 2
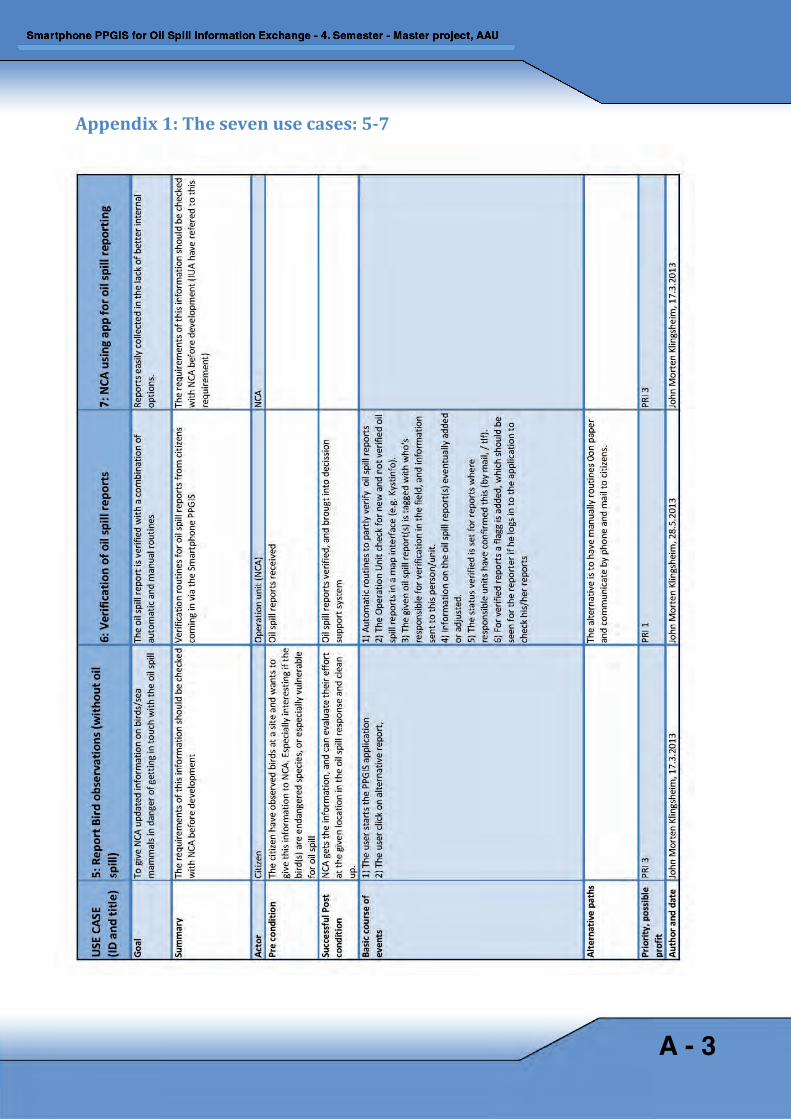
Appendix 1: The seven use cases: 5-7
A - 3
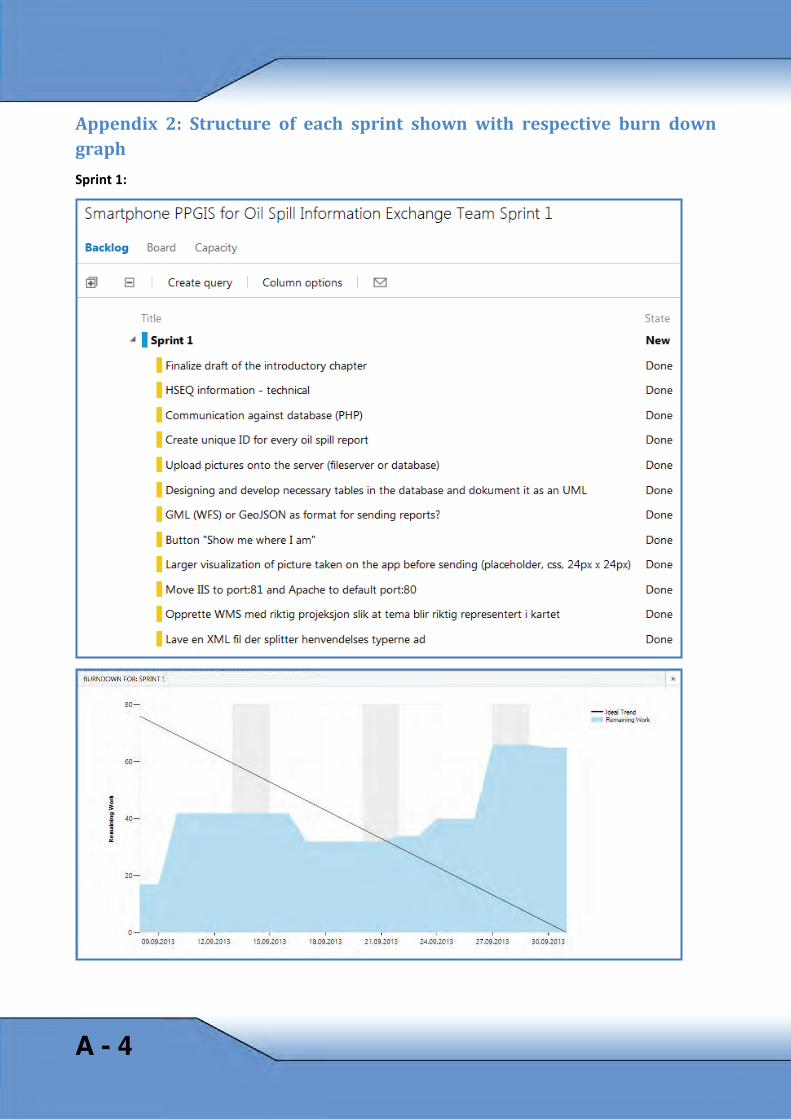
Appendix 2: Structure of each sprint shown with respective burn down graph Sprint 1:
A - 4
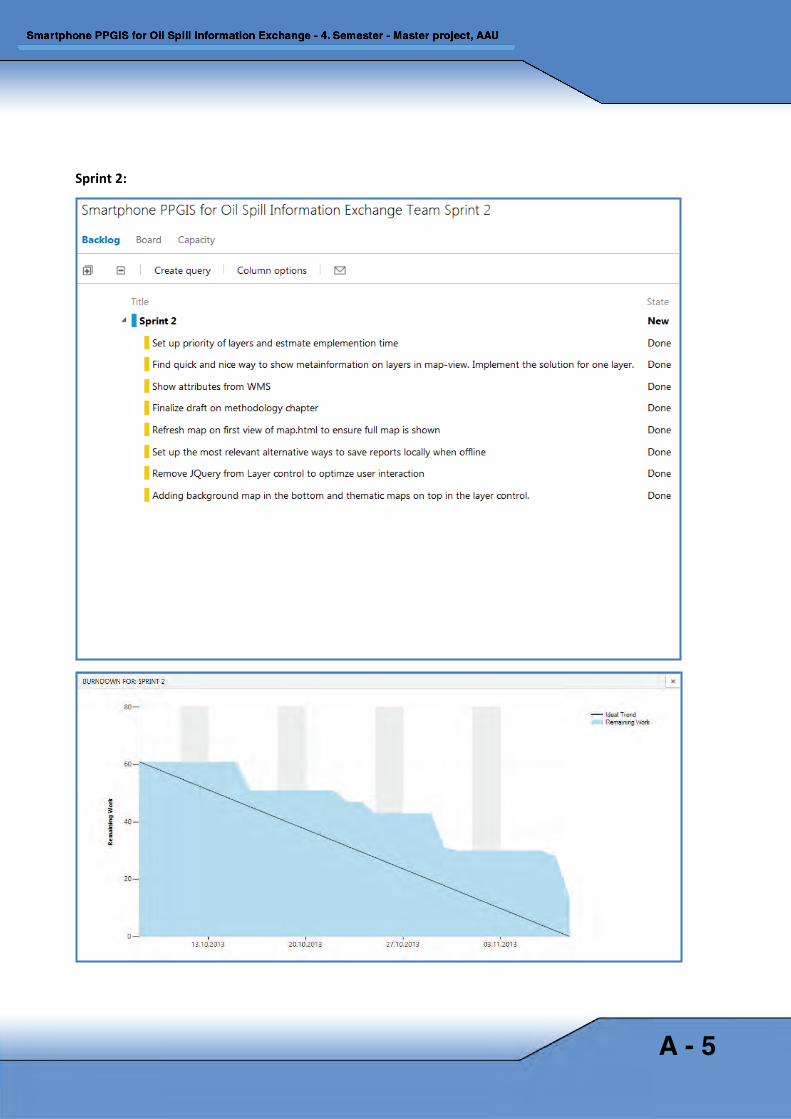
Sprint 2:
A - 5
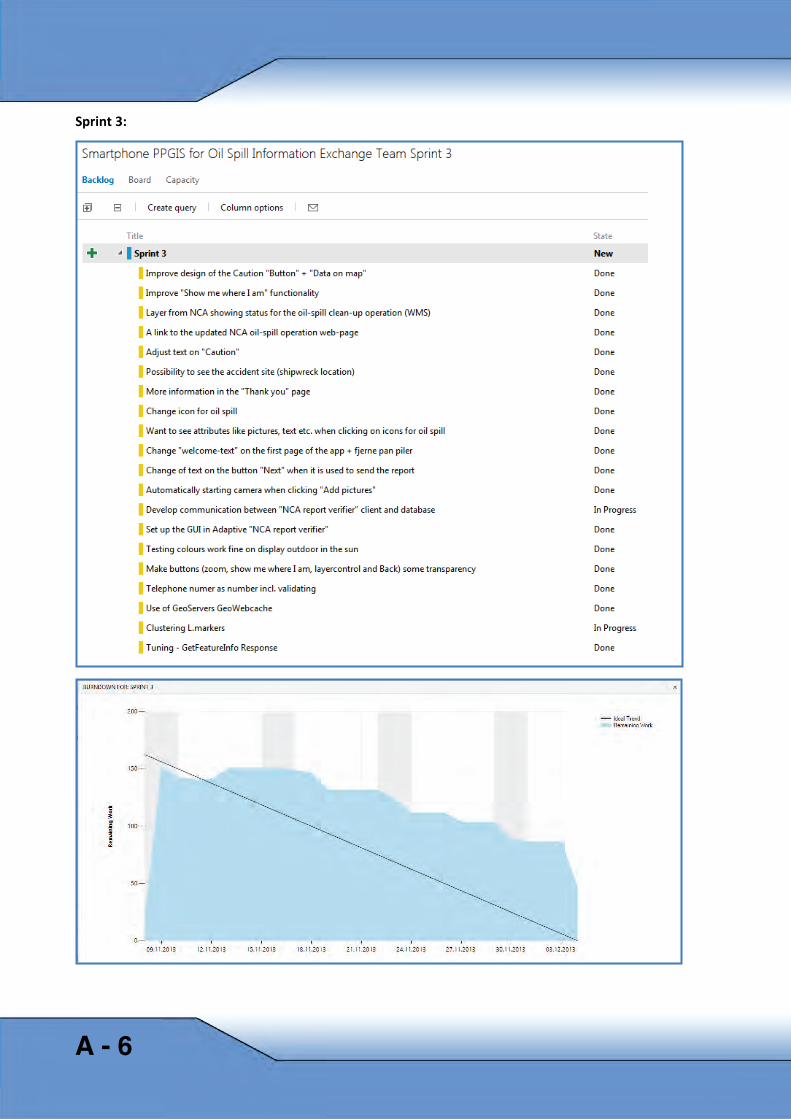
Sprint 3:
A - 6
Appendix 3: Four personas and the test results from prototype testing
- 3.1 Presentation of the four personas used for prototype testing
- 3.2 Background for testing prototypes (Test procedure, information to personas as preparation for test)
- 3.3 Test results after sprint 2 (Espen, Benny, Laila and Kari (NCA))
- 3.4 Test results after sprint 3 (Espen and Laila)
A - 7
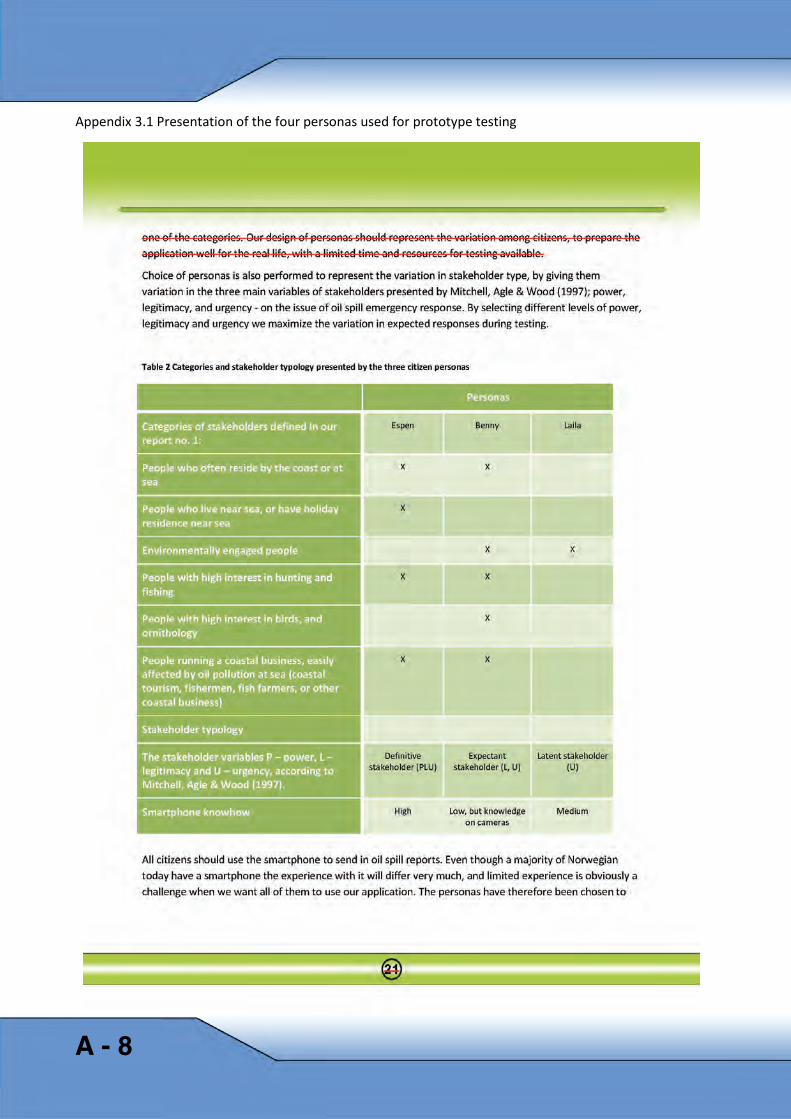
Appendix 3.1 Presentation of the four personas used for prototype testing
A - 8

A - 9
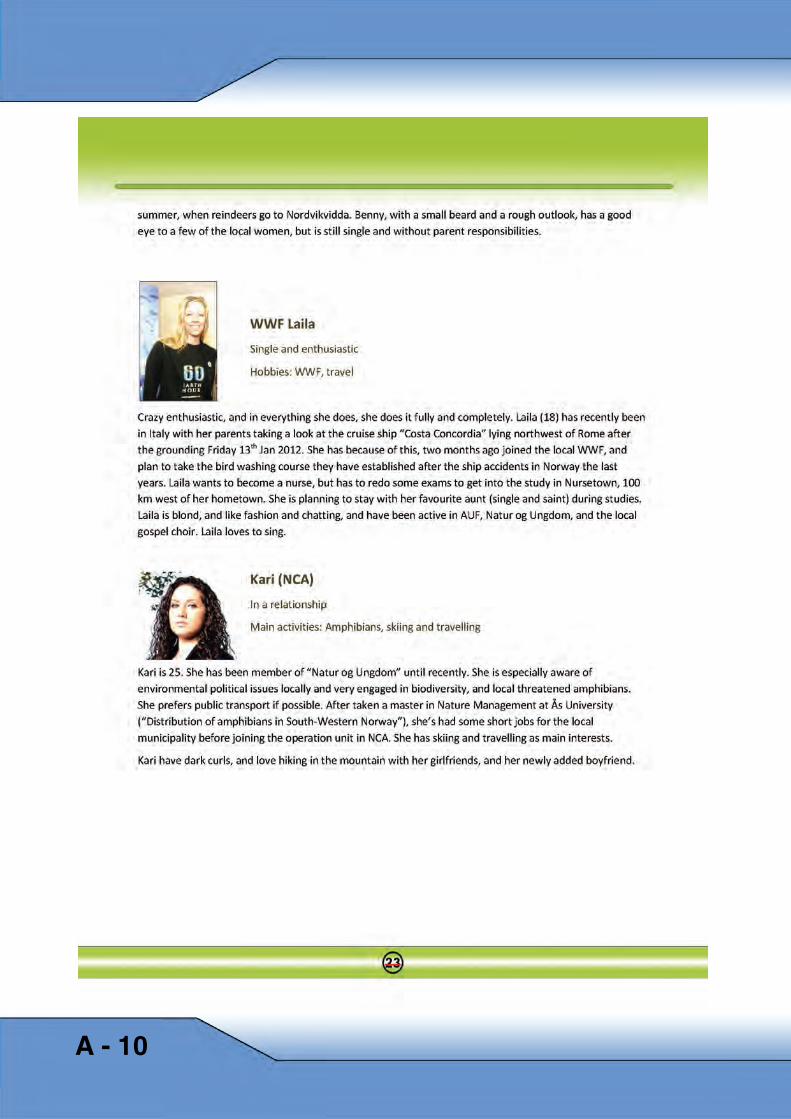
A - 10
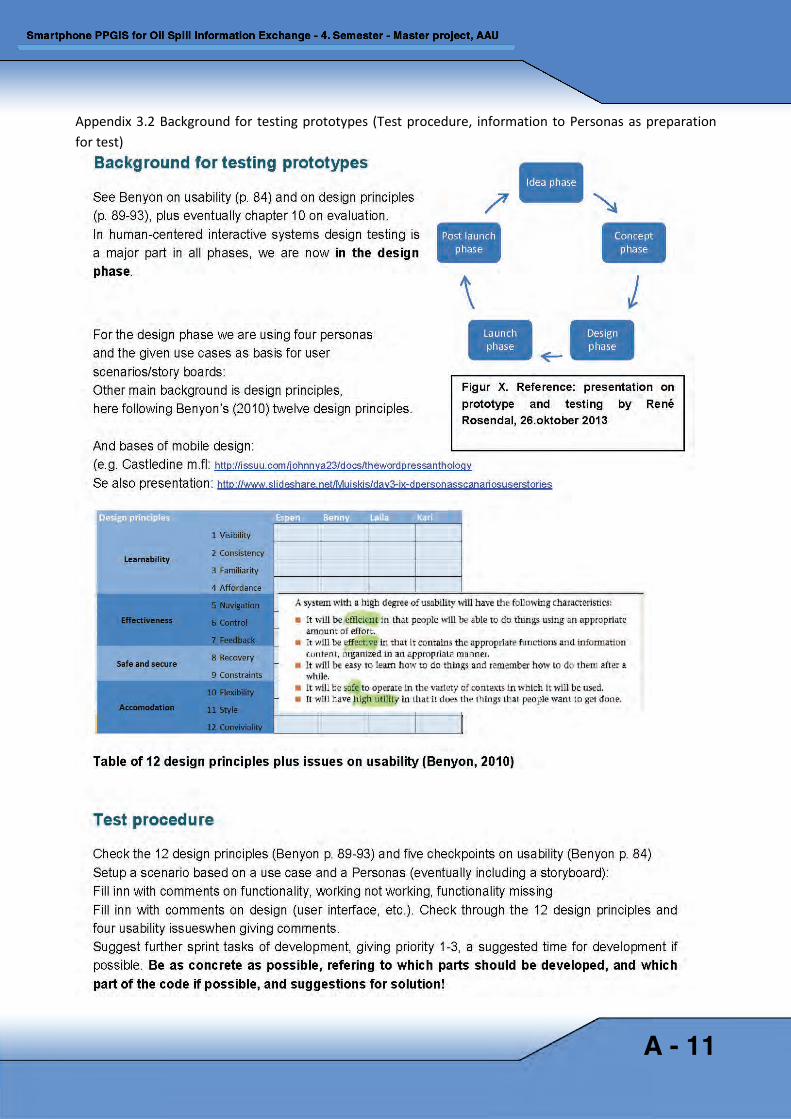
Appendix 3.2 Background for testing prototypes (Test procedure, information to Personas as preparation for test)
A - 11
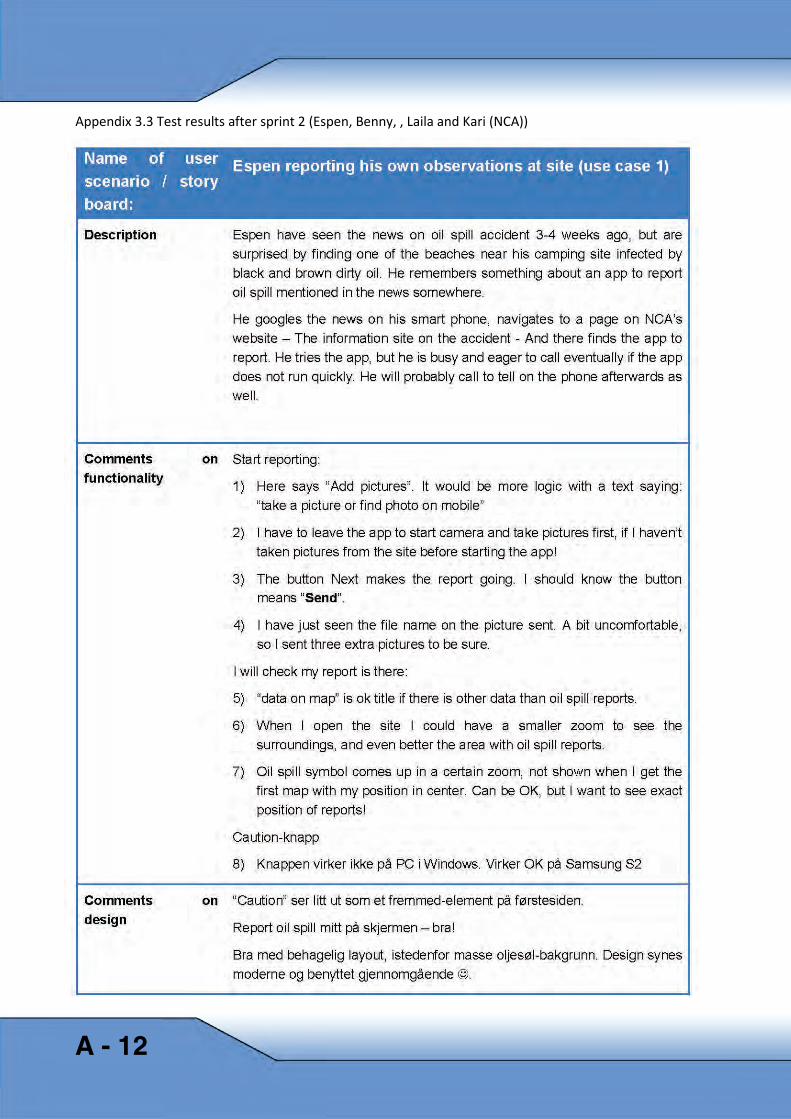
Appendix 3.3 Test results after sprint 2 (Espen, Benny, , Laila and Kari (NCA))
A - 12
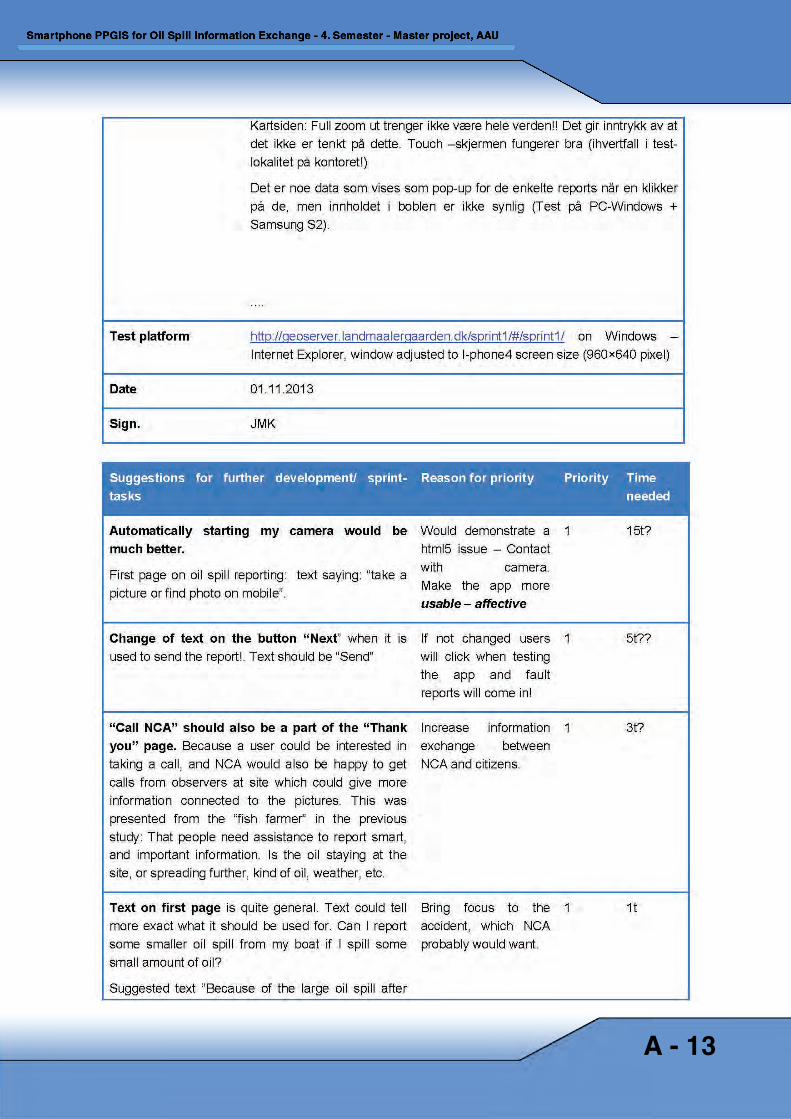
A - 13
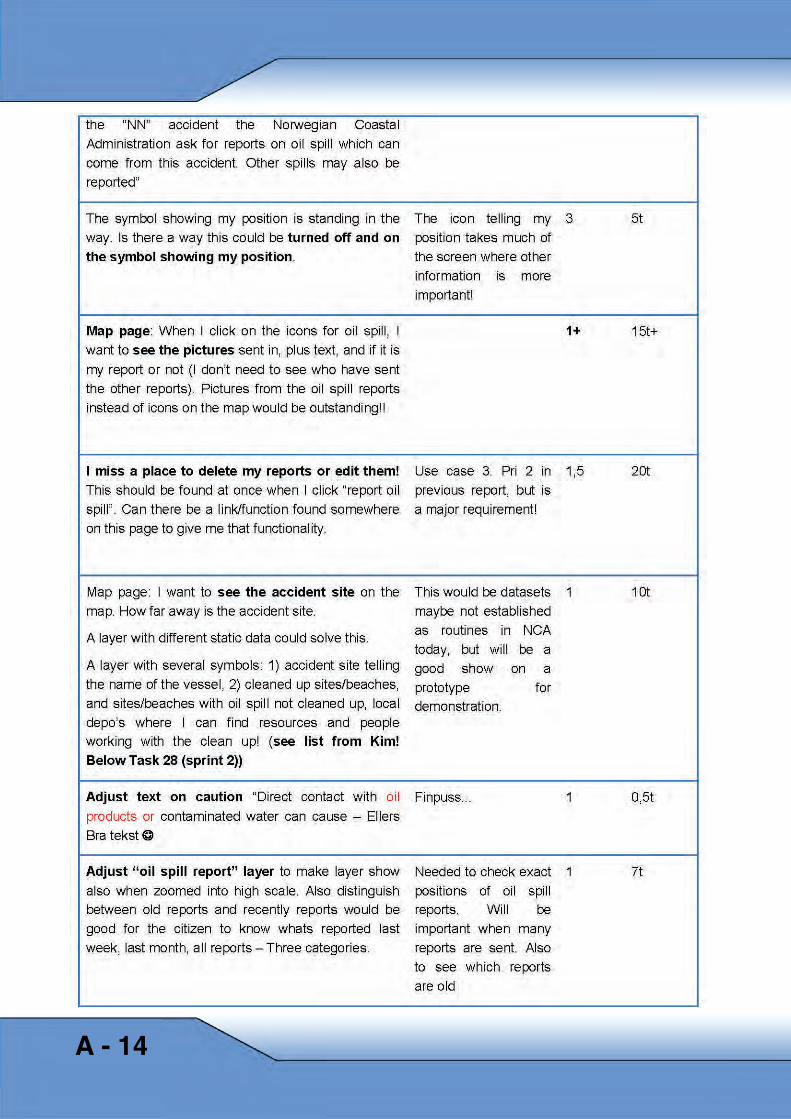
A - 14
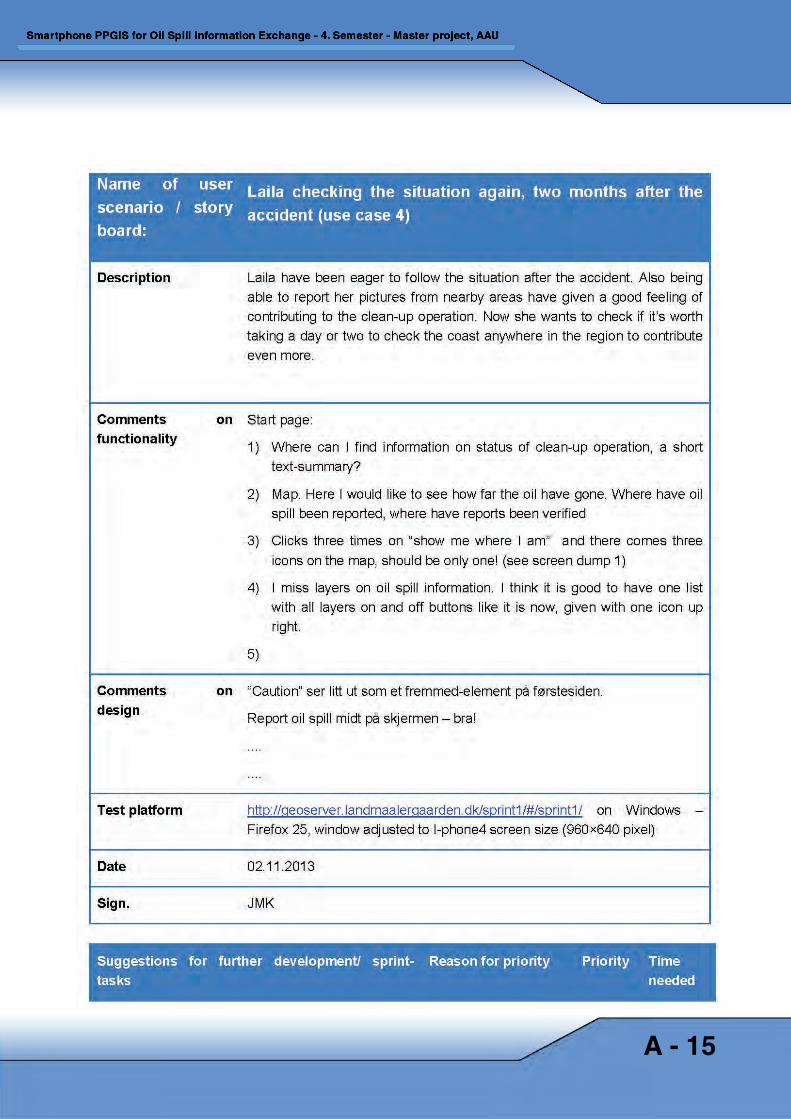
A - 15
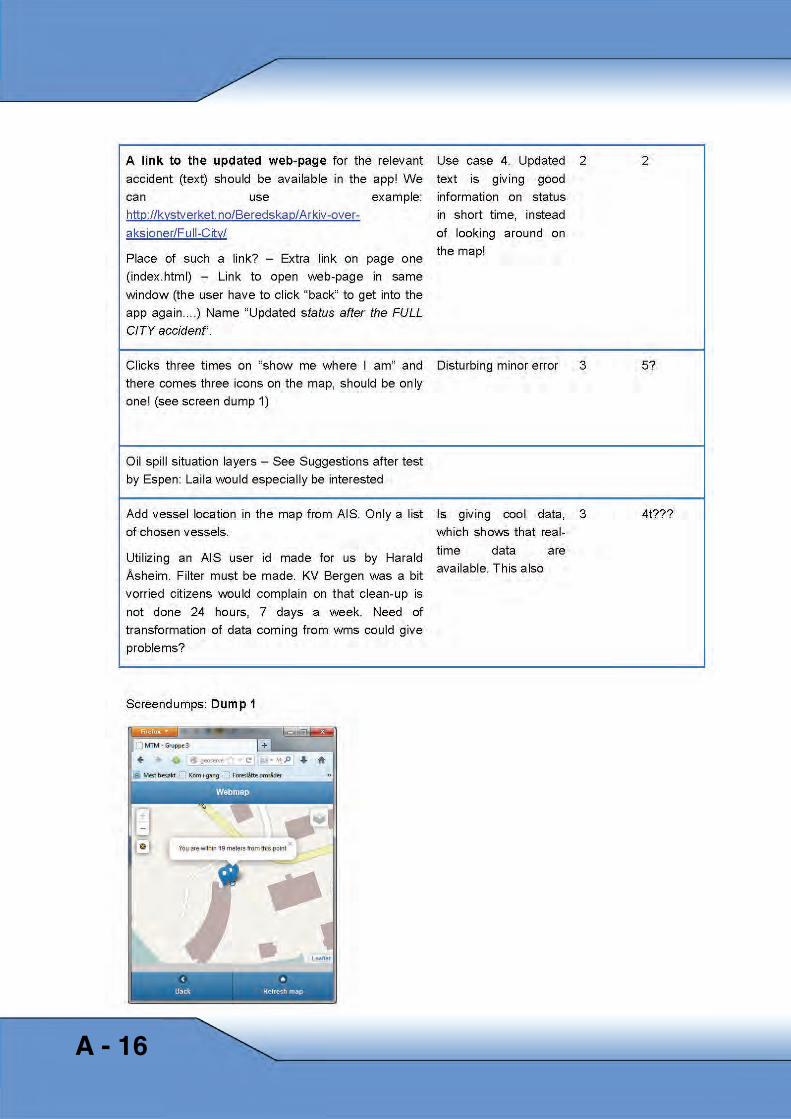
A - 16
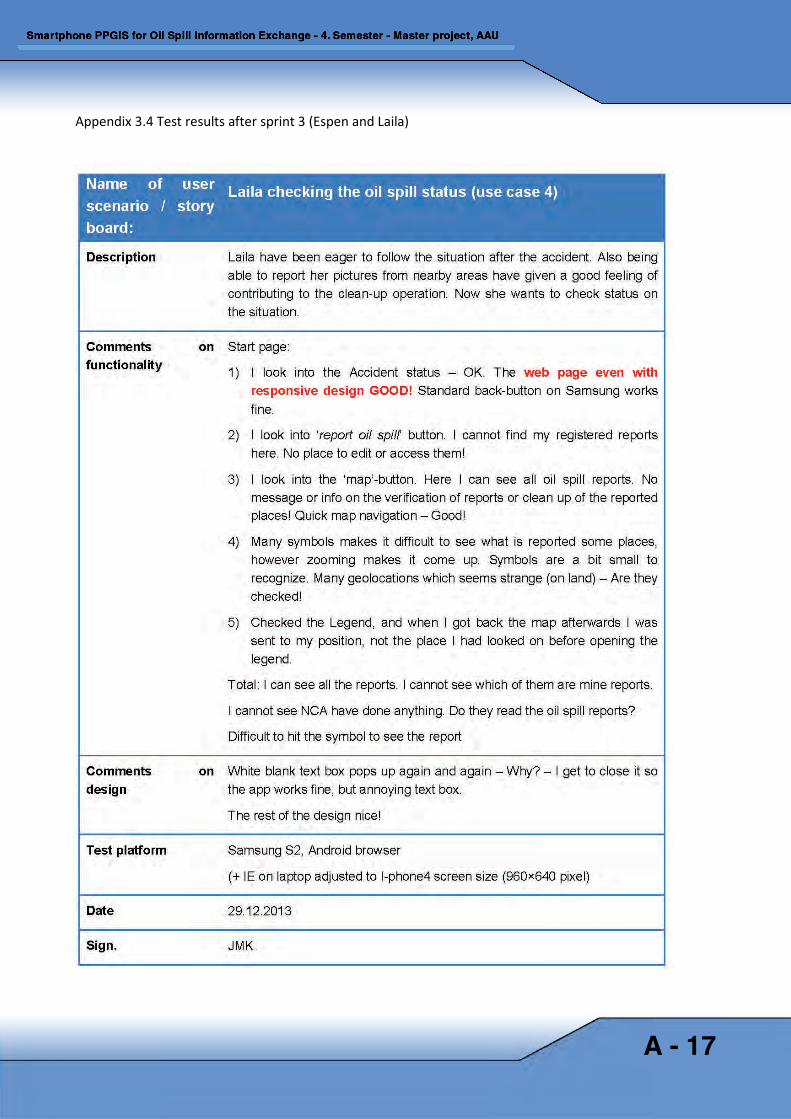
Appendix 3.4 Test results after sprint 3 (Espen and Laila)
A - 17
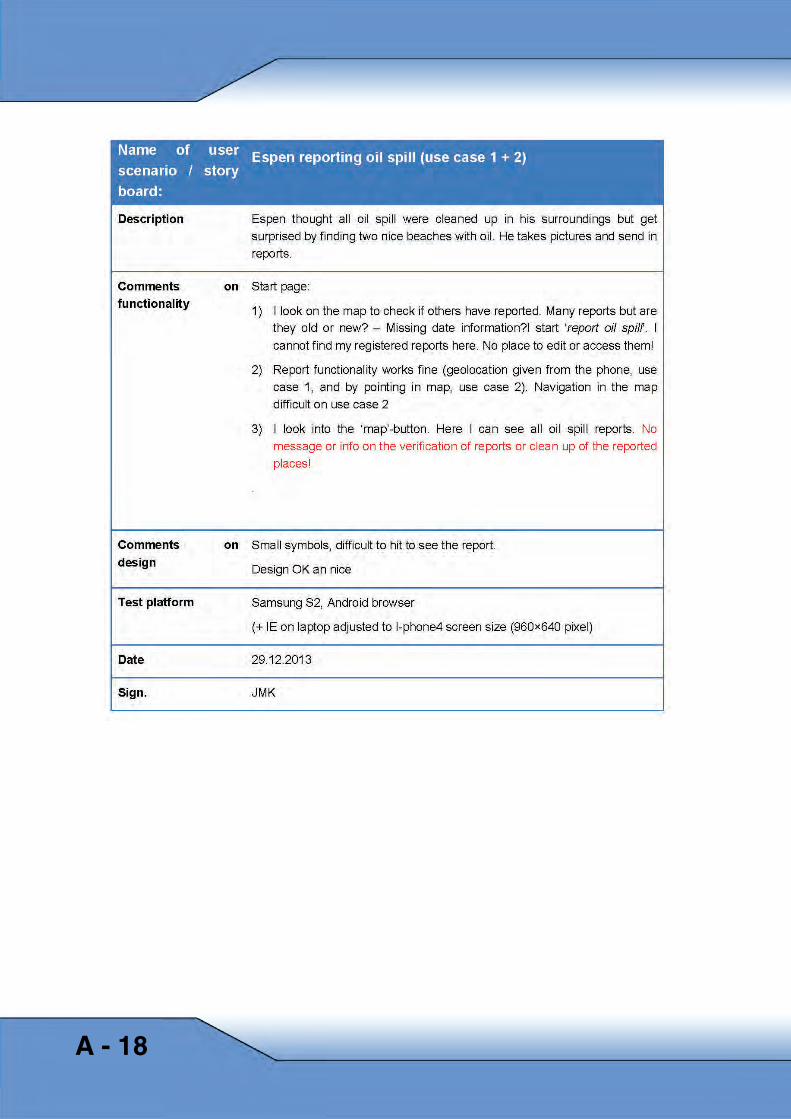
A - 18
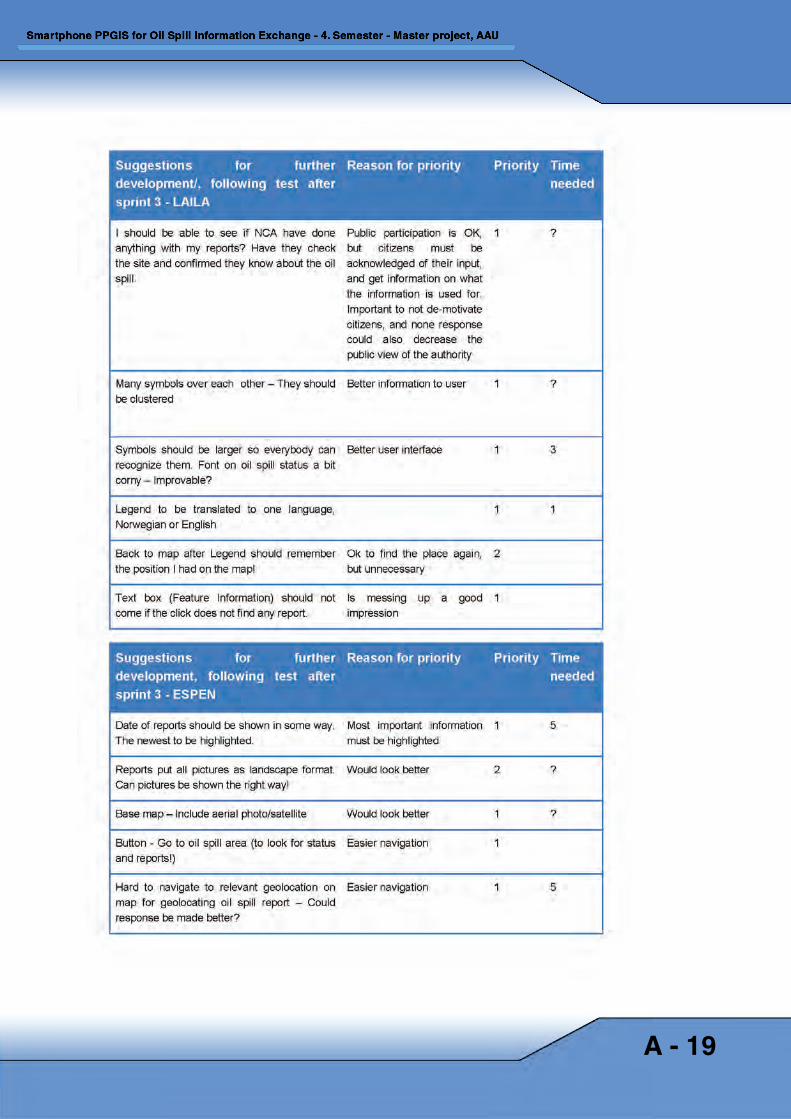
A - 19
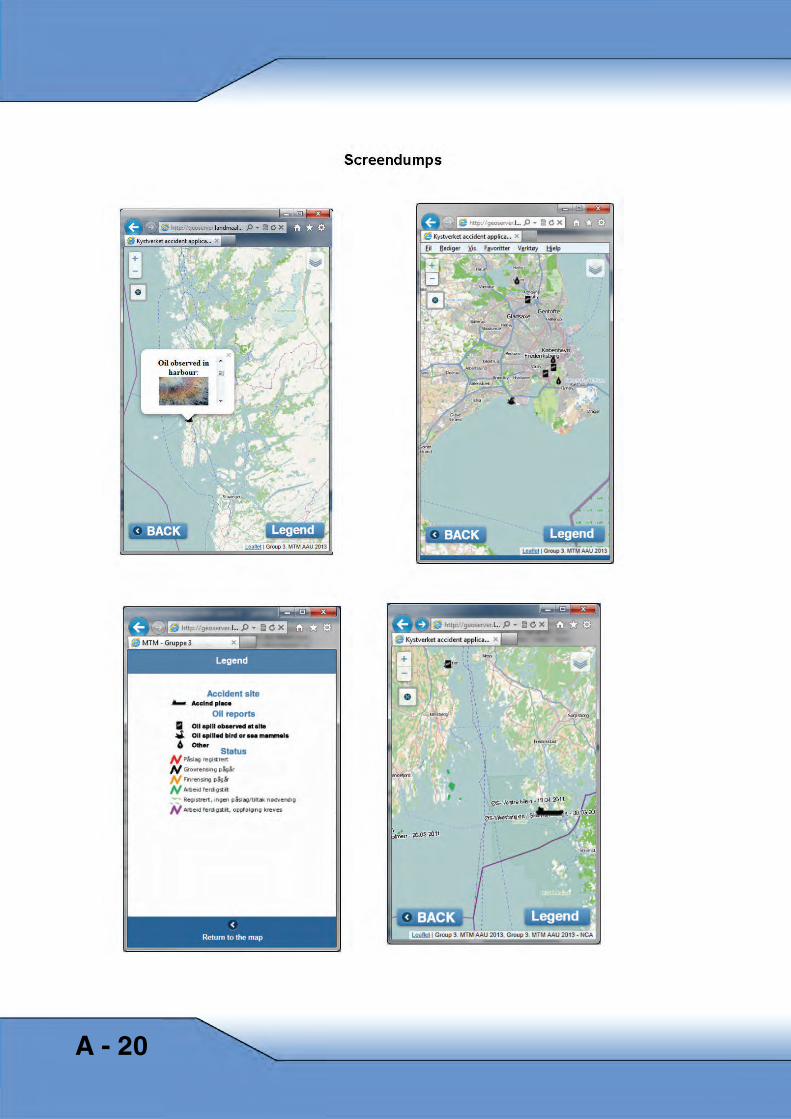
A - 20
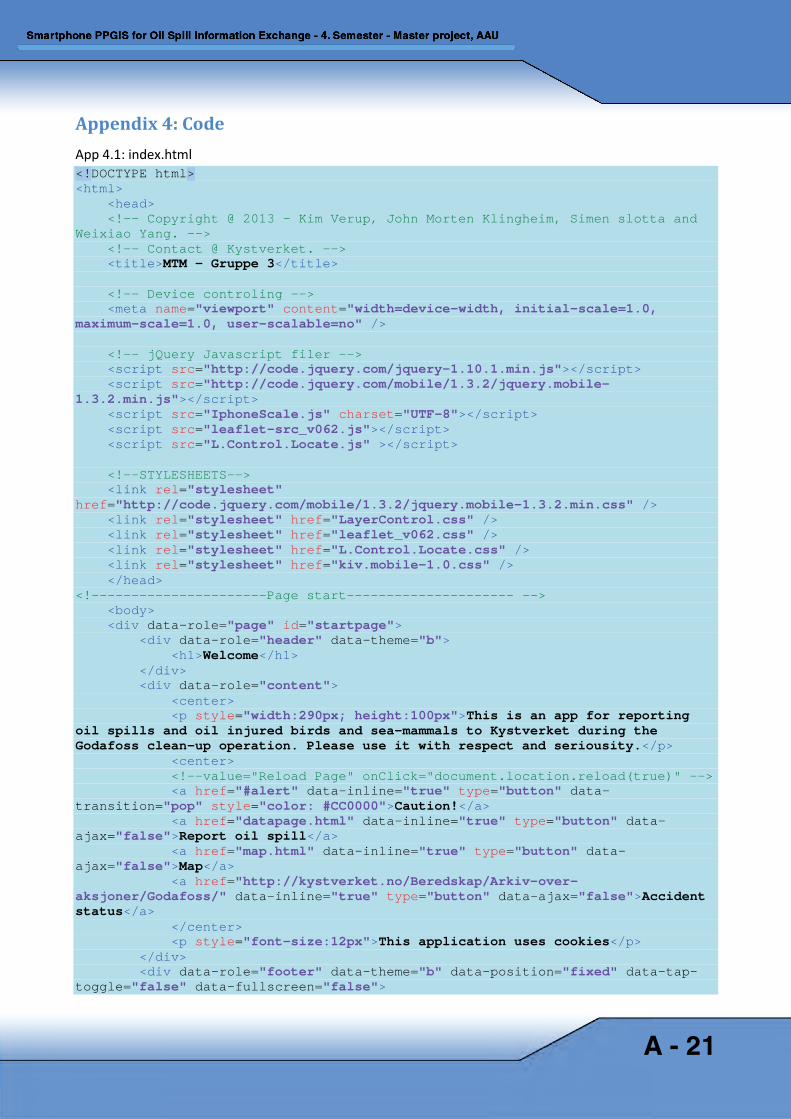
Appendix 4: Code App 4.1: index.html <!DOCTYPE html> <html> <head> <!-- Copyright @ 2013 - Kim Verup, John Morten Klingheim, Simen slotta and Weixiao Yang. --> <!-- Contact @ Kystverket. --> <title>MTM - Gruppe 3</title> <!-- Device controling --> <meta name="viewport" content="width=device-width, initial-scale=1.0, maximum-scale=1.0, user-scalable=no" /> <!-- jQuery Javascript filer --> <script src="http://code.jquery.com/jquery-1.10.1.min.js"></script> <script src="http://code.jquery.com/mobile/1.3.2/jquery.mobile-1.3.2.min.js"></script> <script src="IphoneScale.js" charset="UTF-8"></script> <script src="leaflet-src_v062.js"></script> <script src="L.Control.Locate.js" ></script> <!--STYLESHEETS--> <link rel="stylesheet" href="http://code.jquery.com/mobile/1.3.2/jquery.mobile-1.3.2.min.css" /> <link rel="stylesheet" href="LayerControl.css" /> <link rel="stylesheet" href="leaflet_v062.css" /> <link rel="stylesheet" href="L.Control.Locate.css" /> <link rel="stylesheet" href="kiv.mobile-1.0.css" /> </head> <!----------------------Page start--------------------- --> <body> <div data-role="page" id="startpage"> <div data-role="header" data-theme="b"> <h1>Welcome</h1> </div> <div data-role="content"> <center> <p style="width:290px; height:100px">This is an app for reporting oil spills and oil injured birds and sea-mammals to Kystverket during the Godafoss clean-up operation. Please use it with respect and seriousity.</p> <center> <!--value="Reload Page" onClick="document.location.reload(true)" --> <a href="#alert" data-inline="true" type="button" data-transition="pop" style="color: #CC0000">Caution!</a> <a href="datapage.html" data-inline="true" type="button" data-ajax="false">Report oil spill</a> <a href="map.html" data-inline="true" type="button" data-ajax="false">Map</a> <a href="http://kystverket.no/Beredskap/Arkiv-over-aksjoner/Godafoss/" data-inline="true" type="button" data-ajax="false">Accident status</a> </center> <p style="font-size:12px">This application uses cookies</p> </div> <div data-role="footer" data-theme="b" data-position="fixed" data-tap-toggle="false" data-fullscreen="false">
A - 21
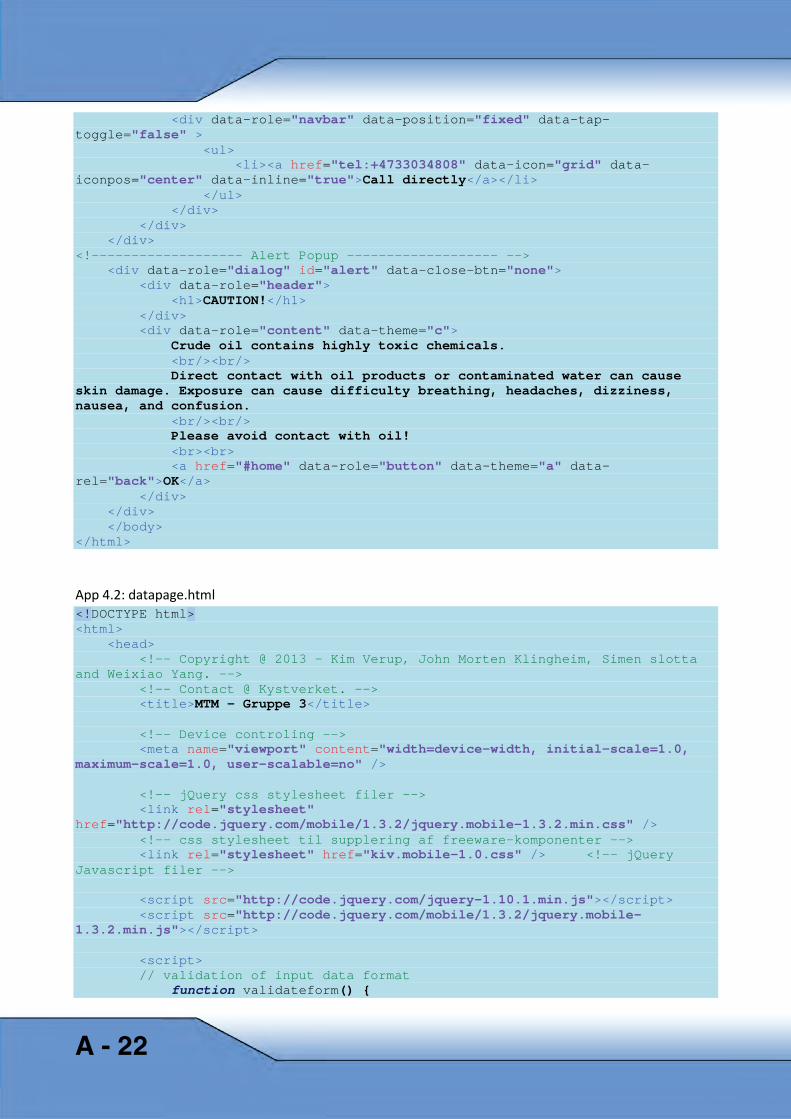
<div data-role="navbar" data-position="fixed" data-tap-toggle="false" > <ul> <li><a href="tel:+4733034808" data-icon="grid" data-iconpos="center" data-inline="true">Call directly</a></li> </ul> </div> </div> </div> <!------------------- Alert Popup ------------------- --> <div data-role="dialog" id="alert" data-close-btn="none"> <div data-role="header"> <h1>CAUTION!</h1> </div> <div data-role="content" data-theme="c"> Crude oil contains highly toxic chemicals. <br/><br/> Direct contact with oil products or contaminated water can cause skin damage. Exposure can cause difficulty breathing, headaches, dizziness, nausea, and confusion. <br/><br/> Please avoid contact with oil! <br><br> <a href="#home" data-role="button" data-theme="a" data-rel="back">OK</a> </div> </div> </body> </html>
App 4.2: datapage.html <!DOCTYPE html> <html> <head> <!-- Copyright @ 2013 - Kim Verup, John Morten Klingheim, Simen slotta and Weixiao Yang. --> <!-- Contact @ Kystverket. --> <title>MTM - Gruppe 3</title> <!-- Device controling --> <meta name="viewport" content="width=device-width, initial-scale=1.0, maximum-scale=1.0, user-scalable=no" /> <!-- jQuery css stylesheet filer --> <link rel="stylesheet" href="http://code.jquery.com/mobile/1.3.2/jquery.mobile-1.3.2.min.css" /> <!-- css stylesheet til supplering af freeware-komponenter --> <link rel="stylesheet" href="kiv.mobile-1.0.css" /> <!-- jQuery Javascript filer --> <script src="http://code.jquery.com/jquery-1.10.1.min.js"></script> <script src="http://code.jquery.com/mobile/1.3.2/jquery.mobile-1.3.2.min.js"></script> <script> // validation of input data format function validateform() {
A - 22
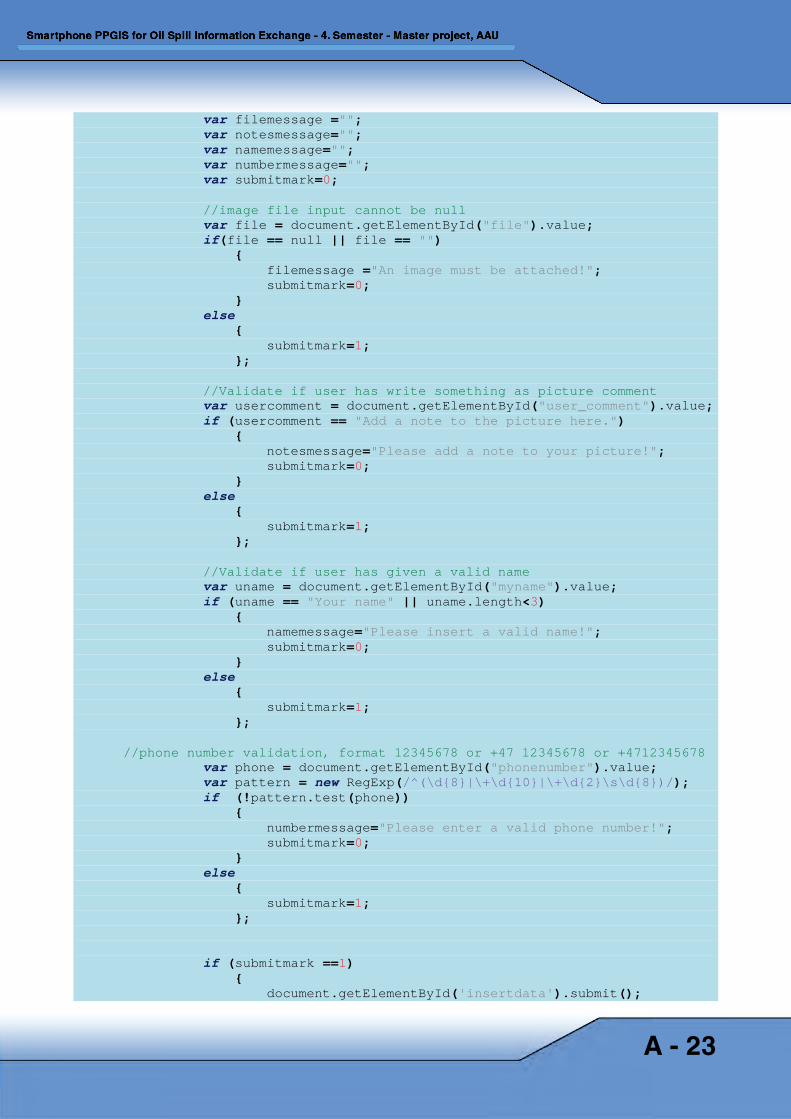
var filemessage =""; var notesmessage=""; var namemessage=""; var numbermessage=""; var submitmark=0; //image file input cannot be null var file = document.getElementById("file").value; if(file == null || file == "") { filemessage ="An image must be attached!"; submitmark=0; } else { submitmark=1; }; //Validate if user has write something as picture comment var usercomment = document.getElementById("user_comment").value; if (usercomment == "Add a note to the picture here.") { notesmessage="Please add a note to your picture!"; submitmark=0; } else { submitmark=1; }; //Validate if user has given a valid name var uname = document.getElementById("myname").value; if (uname == "Your name" || uname.length<3) { namemessage="Please insert a valid name!"; submitmark=0; } else { submitmark=1; }; //phone number validation, format 12345678 or +47 12345678 or +4712345678 var phone = document.getElementById("phonenumber").value; var pattern = new RegExp(/^(\d{8}|\+\d{10}|\+\d{2}\s\d{8})/); if (!pattern.test(phone)) { numbermessage="Please enter a valid phone number!"; submitmark=0; } else { submitmark=1; }; if (submitmark ==1) { document.getElementById('insertdata').submit();
A - 23
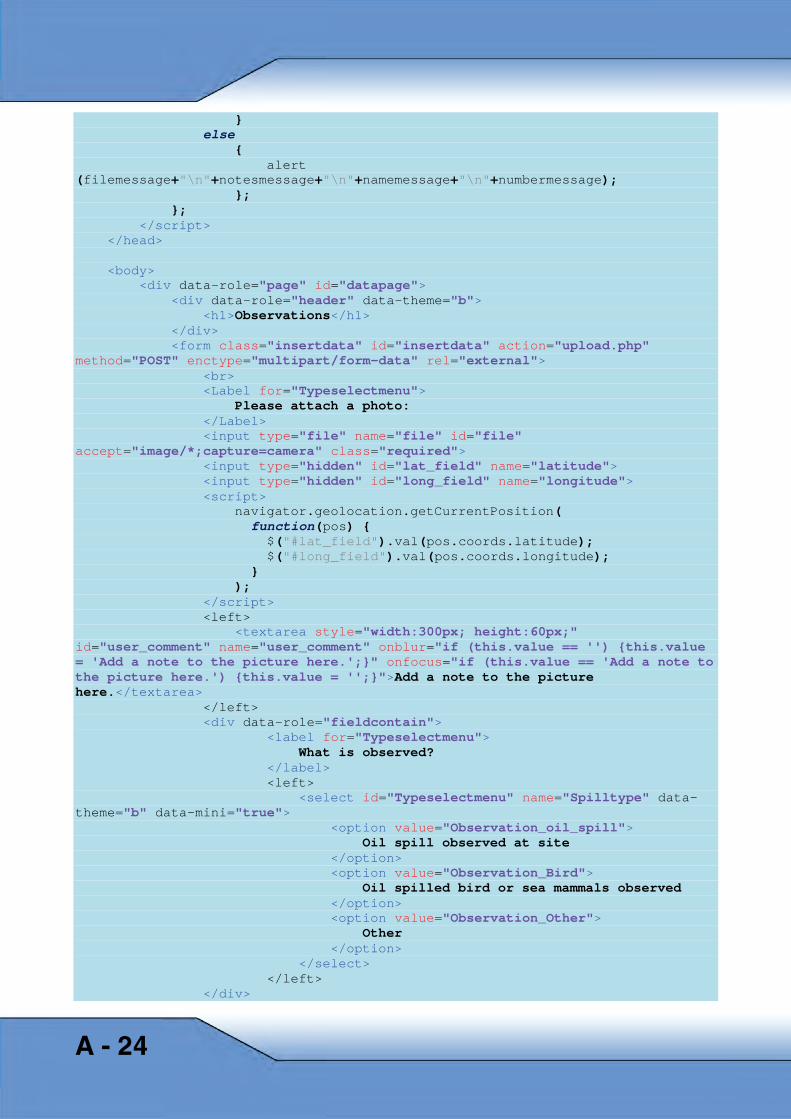
} else { alert (filemessage+"\n"+notesmessage+"\n"+namemessage+"\n"+numbermessage); }; }; </script> </head> <body> <div data-role="page" id="datapage"> <div data-role="header" data-theme="b"> <h1>Observations</h1> </div> <form class="insertdata" id="insertdata" action="upload.php" method="POST" enctype="multipart/form-data" rel="external"> <br> <Label for="Typeselectmenu"> Please attach a photo: </Label> <input type="file" name="file" id="file" accept="image/*;capture=camera" class="required"> <input type="hidden" id="lat_field" name="latitude"> <input type="hidden" id="long_field" name="longitude"> <script> navigator.geolocation.getCurrentPosition( function(pos) { $("#lat_field").val(pos.coords.latitude); $("#long_field").val(pos.coords.longitude); } ); </script> <left> <textarea style="width:300px; height:60px;" id="user_comment" name="user_comment" onblur="if (this.value == '') {this.value = 'Add a note to the picture here.';}" onfocus="if (this.value == 'Add a note to the picture here.') {this.value = '';}">Add a note to the picture here.</textarea> </left> <div data-role="fieldcontain"> <label for="Typeselectmenu"> What is observed? </label> <left> <select id="Typeselectmenu" name="Spilltype" data-theme="b" data-mini="true"> <option value="Observation_oil_spill"> Oil spill observed at site </option> <option value="Observation_Bird"> Oil spilled bird or sea mammals observed </option> <option value="Observation_Other"> Other </option> </select> </left> </div>
A - 24
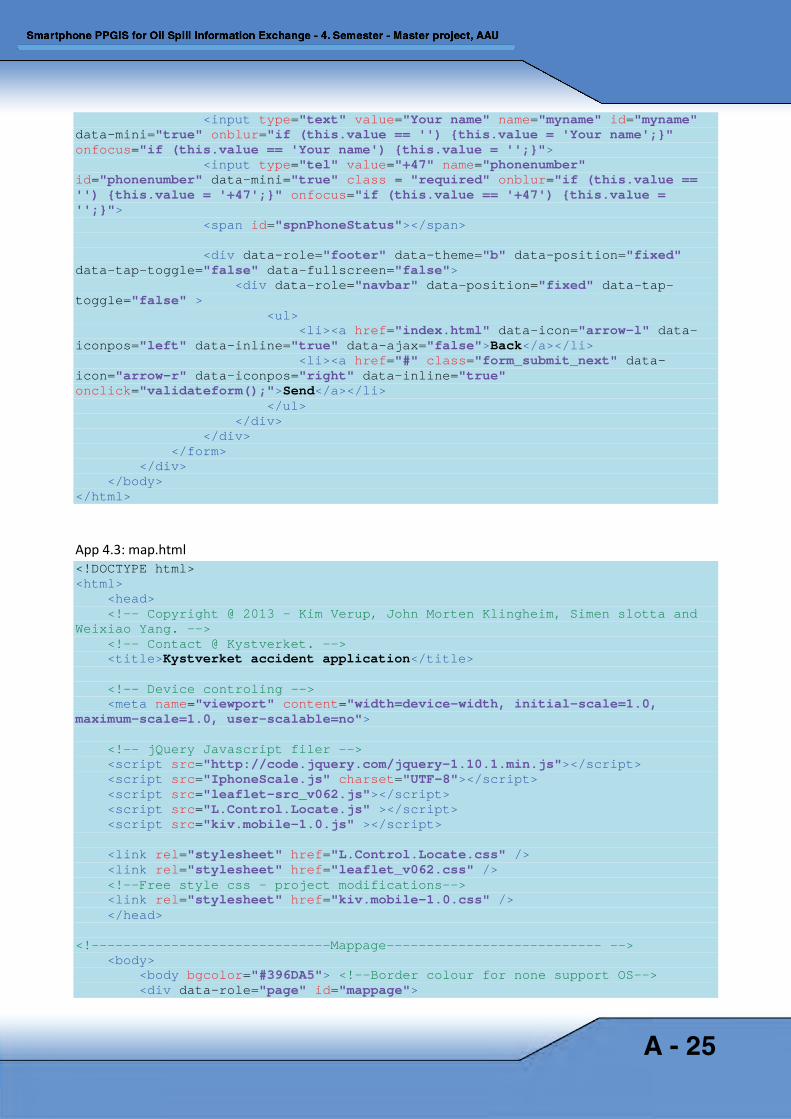
<input type="text" value="Your name" name="myname" id="myname" data-mini="true" onblur="if (this.value == '') {this.value = 'Your name';}" onfocus="if (this.value == 'Your name') {this.value = '';}"> <input type="tel" value="+47" name="phonenumber" id="phonenumber" data-mini="true" class = "required" onblur="if (this.value == '') {this.value = '+47';}" onfocus="if (this.value == '+47') {this.value = '';}"> <span id="spnPhoneStatus"></span> <div data-role="footer" data-theme="b" data-position="fixed" data-tap-toggle="false" data-fullscreen="false"> <div data-role="navbar" data-position="fixed" data-tap-toggle="false" > <ul> <li><a href="index.html" data-icon="arrow-l" data-iconpos="left" data-inline="true" data-ajax="false">Back</a></li> <li><a href="#" class="form_submit_next" data-icon="arrow-r" data-iconpos="right" data-inline="true" onclick="validateform();">Send</a></li> </ul> </div> </div> </form> </div> </body> </html>
App 4.3: map.html <!DOCTYPE html> <html> <head> <!-- Copyright @ 2013 - Kim Verup, John Morten Klingheim, Simen slotta and Weixiao Yang. --> <!-- Contact @ Kystverket. --> <title>Kystverket accident application</title> <!-- Device controling --> <meta name="viewport" content="width=device-width, initial-scale=1.0, maximum-scale=1.0, user-scalable=no"> <!-- jQuery Javascript filer --> <script src="http://code.jquery.com/jquery-1.10.1.min.js"></script> <script src="IphoneScale.js" charset="UTF-8"></script> <script src="leaflet-src_v062.js"></script> <script src="L.Control.Locate.js" ></script> <script src="kiv.mobile-1.0.js" ></script> <link rel="stylesheet" href="L.Control.Locate.css" /> <link rel="stylesheet" href="leaflet_v062.css" /> <!--Free style css - project modifications--> <link rel="stylesheet" href="kiv.mobile-1.0.css" /> </head> <!------------------------------Mappage--------------------------- --> <body> <body bgcolor="#396DA5"> <!--Border colour for none support OS--> <div data-role="page" id="mappage">
A - 25
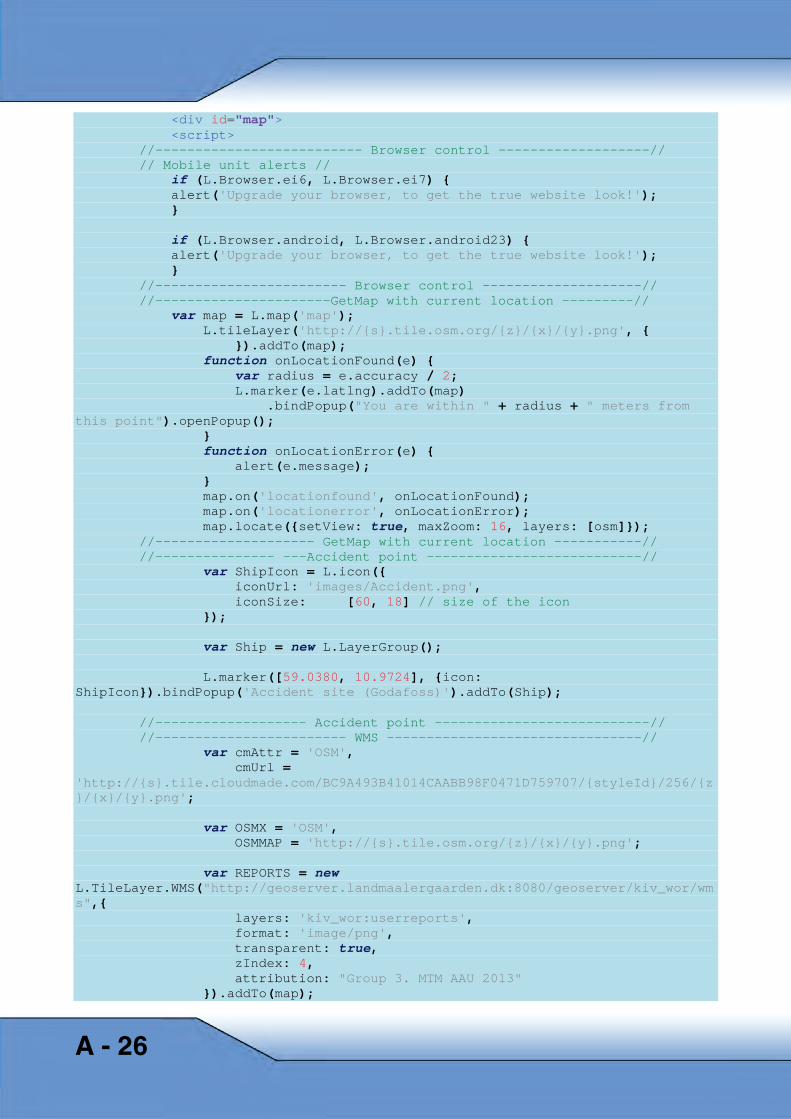
<div id="map"> <script> //-------------------------- Browser control -------------------// // Mobile unit alerts // if (L.Browser.ei6, L.Browser.ei7) { alert('Upgrade your browser, to get the true website look!'); } if (L.Browser.android, L.Browser.android23) { alert('Upgrade your browser, to get the true website look!'); } //------------------------ Browser control --------------------// //----------------------GetMap with current location ---------// var map = L.map('map'); L.tileLayer('http://{s}.tile.osm.org/{z}/{x}/{y}.png', { }).addTo(map); function onLocationFound(e) { var radius = e.accuracy / 2; L.marker(e.latlng).addTo(map) .bindPopup("You are within " + radius + " meters from this point").openPopup(); } function onLocationError(e) { alert(e.message); } map.on('locationfound', onLocationFound); map.on('locationerror', onLocationError); map.locate({setView: true, maxZoom: 16, layers: [osm]}); //-------------------- GetMap with current location -----------// //--------------- ---Accident point ---------------------------// var ShipIcon = L.icon({ iconUrl: 'images/Accident.png', iconSize: [60, 18] // size of the icon }); var Ship = new L.LayerGroup(); L.marker([59.0380, 10.9724], {icon: ShipIcon}).bindPopup('Accident site (Godafoss)').addTo(Ship); //------------------- Accident point ---------------------------// //------------------------ WMS --------------------------------// var cmAttr = 'OSM', cmUrl = 'http://{s}.tile.cloudmade.com/BC9A493B41014CAABB98F0471D759707/{styleId}/256/{z}/{x}/{y}.png'; var OSMX = 'OSM', OSMMAP = 'http://{s}.tile.osm.org/{z}/{x}/{y}.png'; var REPORTS = new L.TileLayer.WMS("http://geoserver.landmaalergaarden.dk:8080/geoserver/kiv_wor/wms",{ layers: 'kiv_wor:userreports', format: 'image/png', transparent: true, zIndex: 4, attribution: "Group 3. MTM AAU 2013" }).addTo(map);
A - 26
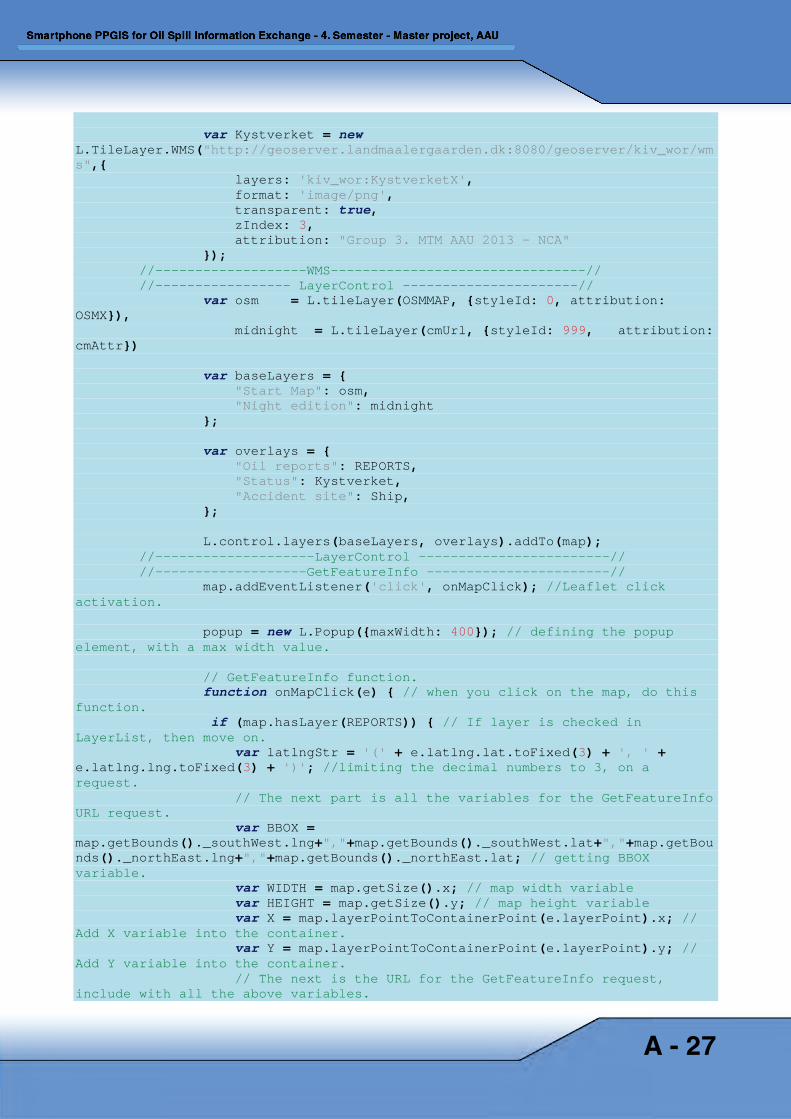
var Kystverket = new L.TileLayer.WMS("http://geoserver.landmaalergaarden.dk:8080/geoserver/kiv_wor/wms",{ layers: 'kiv_wor:KystverketX', format: 'image/png', transparent: true, zIndex: 3, attribution: "Group 3. MTM AAU 2013 - NCA" }); //-------------------WMS--------------------------------// //----------------- LayerControl ----------------------// var osm = L.tileLayer(OSMMAP, {styleId: 0, attribution: OSMX}), midnight = L.tileLayer(cmUrl, {styleId: 999, attribution: cmAttr}) var baseLayers = { "Start Map": osm, "Night edition": midnight }; var overlays = { "Oil reports": REPORTS, "Status": Kystverket, "Accident site": Ship, }; L.control.layers(baseLayers, overlays).addTo(map); //--------------------LayerControl ------------------------// //-------------------GetFeatureInfo -----------------------// map.addEventListener('click', onMapClick); //Leaflet click activation. popup = new L.Popup({maxWidth: 400}); // defining the popup element, with a max width value. // GetFeatureInfo function. function onMapClick(e) { // when you click on the map, do this function. if (map.hasLayer(REPORTS)) { // If layer is checked in LayerList, then move on. var latlngStr = '(' + e.latlng.lat.toFixed(3) + ', ' + e.latlng.lng.toFixed(3) + ')'; //limiting the decimal numbers to 3, on a request. // The next part is all the variables for the GetFeatureInfo URL request. var BBOX = map.getBounds()._southWest.lng+","+map.getBounds()._southWest.lat+","+map.getBounds()._northEast.lng+","+map.getBounds()._northEast.lat; // getting BBOX variable. var WIDTH = map.getSize().x; // map width variable var HEIGHT = map.getSize().y; // map height variable var X = map.layerPointToContainerPoint(e.layerPoint).x; // Add X variable into the container. var Y = map.layerPointToContainerPoint(e.layerPoint).y; // Add Y variable into the container. // The next is the URL for the GetFeatureInfo request, include with all the above variables.
A - 27
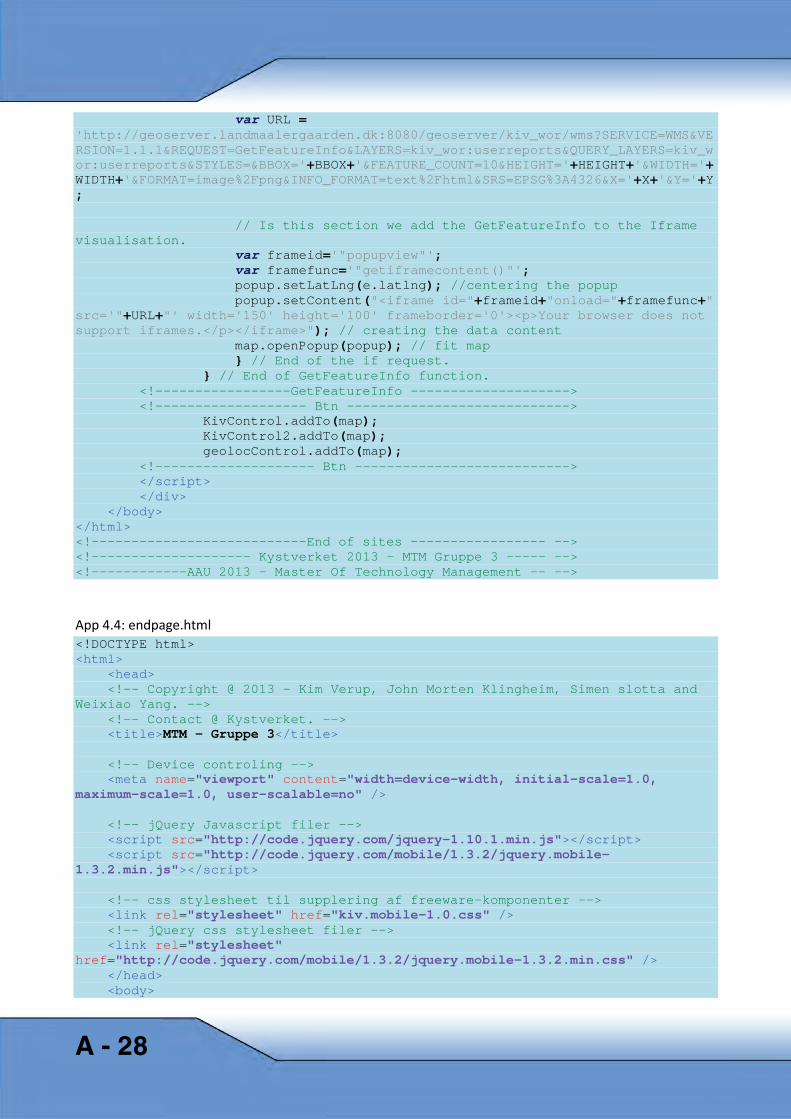
var URL = 'http://geoserver.landmaalergaarden.dk:8080/geoserver/kiv_wor/wms?SERVICE=WMS&VERSION=1.1.1&REQUEST=GetFeatureInfo&LAYERS=kiv_wor:userreports&QUERY_LAYERS=kiv_wor:userreports&STYLES=&BBOX='+BBOX+'&FEATURE_COUNT=10&HEIGHT='+HEIGHT+'&WIDTH='+WIDTH+'&FORMAT=image%2Fpng&INFO_FORMAT=text%2Fhtml&SRS=EPSG%3A4326&X='+X+'&Y='+Y; // Is this section we add the GetFeatureInfo to the Iframe visualisation. var frameid='"popupview"'; var framefunc='"getiframecontent()"'; popup.setLatLng(e.latlng); //centering the popup popup.setContent("<iframe id="+frameid+"onload="+framefunc+" src='"+URL+"' width='150' height='100' frameborder='0'><p>Your browser does not support iframes.</p></iframe>"); // creating the data content map.openPopup(popup); // fit map } // End of the if request. } // End of GetFeatureInfo function. <!-----------------GetFeatureInfo --------------------> <!------------------- Btn ----------------------------> KivControl.addTo(map); KivControl2.addTo(map); geolocControl.addTo(map); <!-------------------- Btn ---------------------------> </script> </div> </body> </html> <!---------------------------End of sites ----------------- --> <!-------------------- Kystverket 2013 - MTM Gruppe 3 ----- --> <!------------AAU 2013 - Master Of Technology Management -- -->
App 4.4: endpage.html <!DOCTYPE html> <html> <head> <!-- Copyright @ 2013 - Kim Verup, John Morten Klingheim, Simen slotta and Weixiao Yang. --> <!-- Contact @ Kystverket. --> <title>MTM - Gruppe 3</title> <!-- Device controling --> <meta name="viewport" content="width=device-width, initial-scale=1.0, maximum-scale=1.0, user-scalable=no" /> <!-- jQuery Javascript filer --> <script src="http://code.jquery.com/jquery-1.10.1.min.js"></script> <script src="http://code.jquery.com/mobile/1.3.2/jquery.mobile-1.3.2.min.js"></script> <!-- css stylesheet til supplering af freeware-komponenter --> <link rel="stylesheet" href="kiv.mobile-1.0.css" /> <!-- jQuery css stylesheet filer --> <link rel="stylesheet" href="http://code.jquery.com/mobile/1.3.2/jquery.mobile-1.3.2.min.css" /> </head> <body>
A - 28
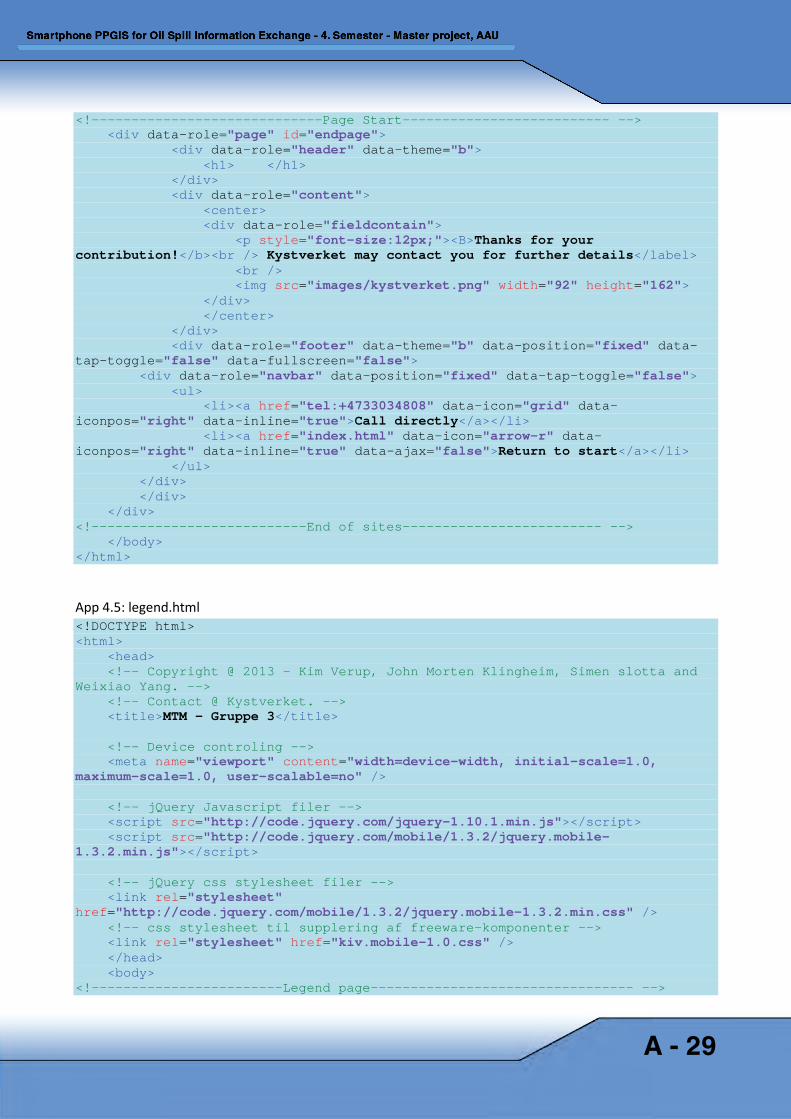
<!-----------------------------Page Start-------------------------- --> <div data-role="page" id="endpage"> <div data-role="header" data-theme="b"> <h1> </h1> </div> <div data-role="content"> <center> <div data-role="fieldcontain"> <p style="font-size:12px;"><B>Thanks for your contribution!</b><br /> Kystverket may contact you for further details</label> <br /> <img src="images/kystverket.png" width="92" height="162"> </div> </center> </div> <div data-role="footer" data-theme="b" data-position="fixed" data-tap-toggle="false" data-fullscreen="false"> <div data-role="navbar" data-position="fixed" data-tap-toggle="false"> <ul> <li><a href="tel:+4733034808" data-icon="grid" data-iconpos="right" data-inline="true">Call directly</a></li> <li><a href="index.html" data-icon="arrow-r" data-iconpos="right" data-inline="true" data-ajax="false">Return to start</a></li> </ul> </div> </div> </div> <!---------------------------End of sites------------------------- --> </body> </html>
App 4.5: legend.html <!DOCTYPE html> <html> <head> <!-- Copyright @ 2013 - Kim Verup, John Morten Klingheim, Simen slotta and Weixiao Yang. --> <!-- Contact @ Kystverket. --> <title>MTM - Gruppe 3</title> <!-- Device controling --> <meta name="viewport" content="width=device-width, initial-scale=1.0, maximum-scale=1.0, user-scalable=no" /> <!-- jQuery Javascript filer --> <script src="http://code.jquery.com/jquery-1.10.1.min.js"></script> <script src="http://code.jquery.com/mobile/1.3.2/jquery.mobile-1.3.2.min.js"></script> <!-- jQuery css stylesheet filer --> <link rel="stylesheet" href="http://code.jquery.com/mobile/1.3.2/jquery.mobile-1.3.2.min.css" /> <!-- css stylesheet til supplering af freeware-komponenter --> <link rel="stylesheet" href="kiv.mobile-1.0.css" /> </head> <body> <!------------------------Legend page--------------------------------- -->
A - 29
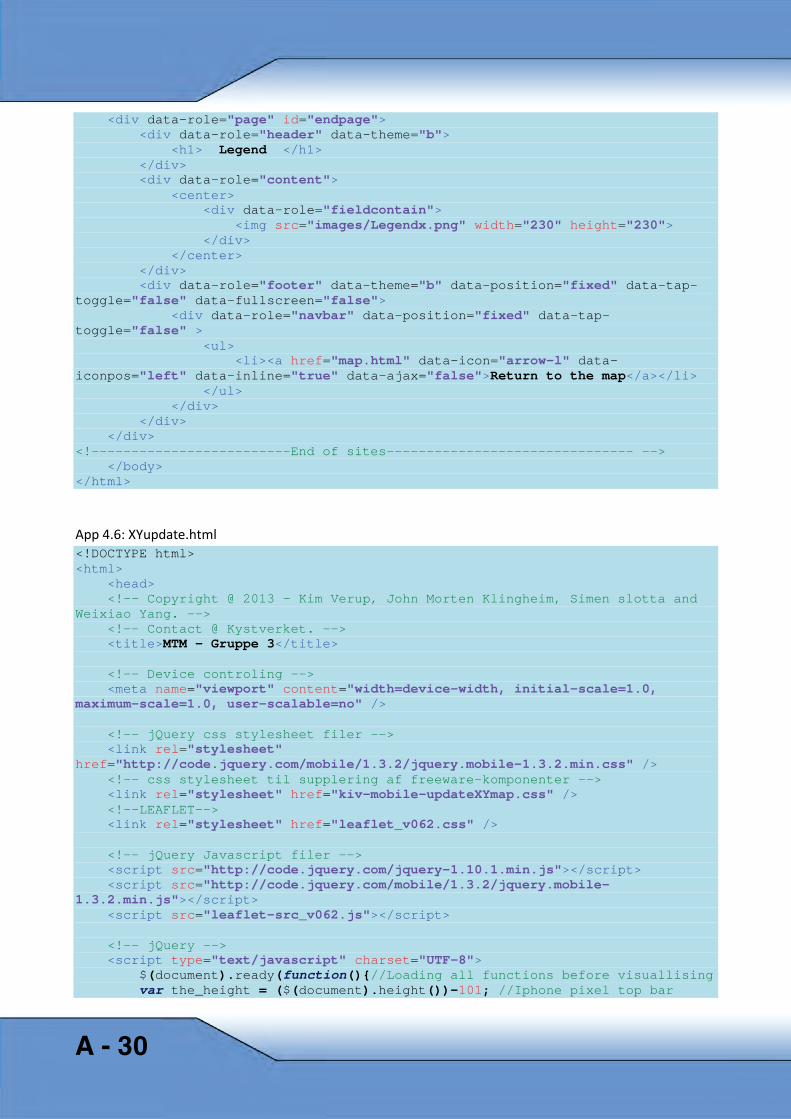
<div data-role="page" id="endpage"> <div data-role="header" data-theme="b"> <h1> Legend </h1> </div> <div data-role="content"> <center> <div data-role="fieldcontain"> <img src="images/Legendx.png" width="230" height="230"> </div> </center> </div> <div data-role="footer" data-theme="b" data-position="fixed" data-tap-toggle="false" data-fullscreen="false"> <div data-role="navbar" data-position="fixed" data-tap-toggle="false" > <ul> <li><a href="map.html" data-icon="arrow-l" data-iconpos="left" data-inline="true" data-ajax="false">Return to the map</a></li> </ul> </div> </div> </div> <!-------------------------End of sites------------------------------- --> </body> </html>
App 4.6: XYupdate.html <!DOCTYPE html> <html> <head> <!-- Copyright @ 2013 - Kim Verup, John Morten Klingheim, Simen slotta and Weixiao Yang. --> <!-- Contact @ Kystverket. --> <title>MTM - Gruppe 3</title> <!-- Device controling --> <meta name="viewport" content="width=device-width, initial-scale=1.0, maximum-scale=1.0, user-scalable=no" /> <!-- jQuery css stylesheet filer --> <link rel="stylesheet" href="http://code.jquery.com/mobile/1.3.2/jquery.mobile-1.3.2.min.css" /> <!-- css stylesheet til supplering af freeware-komponenter --> <link rel="stylesheet" href="kiv-mobile-updateXYmap.css" /> <!--LEAFLET--> <link rel="stylesheet" href="leaflet_v062.css" /> <!-- jQuery Javascript filer --> <script src="http://code.jquery.com/jquery-1.10.1.min.js"></script> <script src="http://code.jquery.com/mobile/1.3.2/jquery.mobile-1.3.2.min.js"></script> <script src="leaflet-src_v062.js"></script> <!-- jQuery --> <script type="text/javascript" charset="UTF-8"> $(document).ready(function(){//Loading all functions before visuallising var the_height = ($(document).height())-101; //Iphone pixel top bar
A - 30
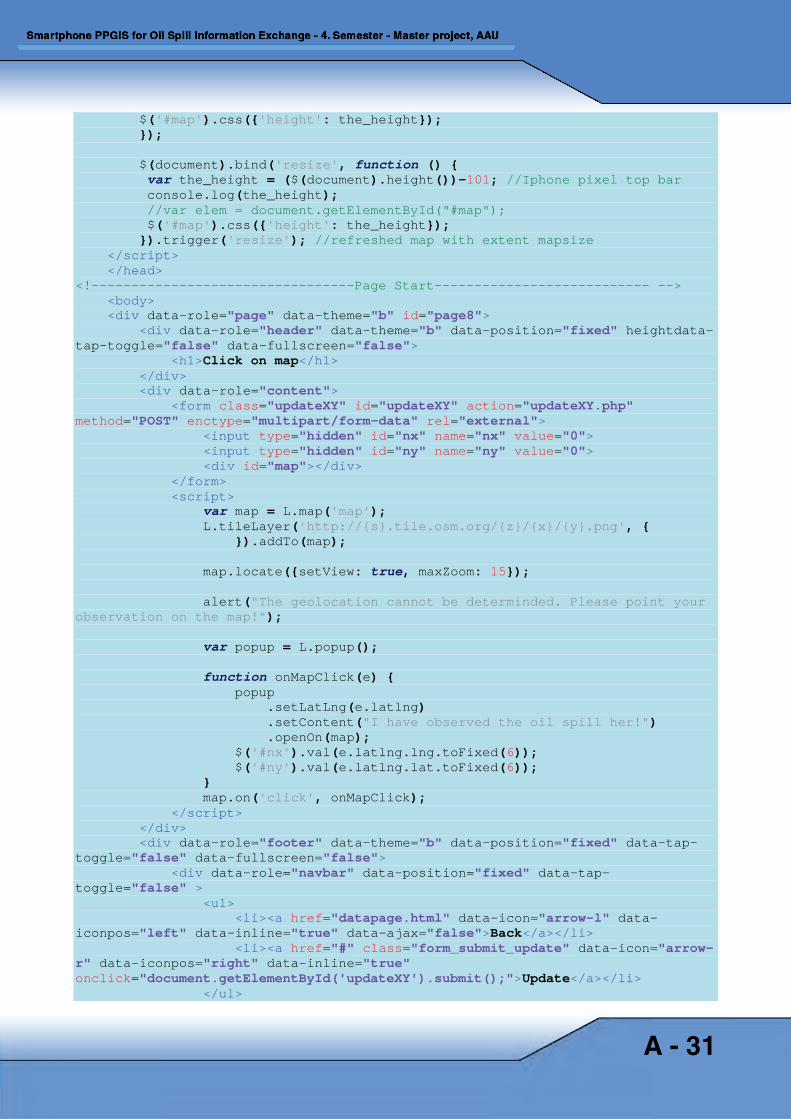
$('#map').css({'height': the_height}); }); $(document).bind('resize', function () { var the_height = ($(document).height())-101; //Iphone pixel top bar console.log(the_height); //var elem = document.getElementById("#map"); $('#map').css({'height': the_height}); }).trigger('resize'); //refreshed map with extent mapsize </script> </head> <!---------------------------------Page Start--------------------------- --> <body> <div data-role="page" data-theme="b" id="page8"> <div data-role="header" data-theme="b" data-position="fixed" heightdata-tap-toggle="false" data-fullscreen="false"> <h1>Click on map</h1> </div> <div data-role="content"> <form class="updateXY" id="updateXY" action="updateXY.php" method="POST" enctype="multipart/form-data" rel="external"> <input type="hidden" id="nx" name="nx" value="0"> <input type="hidden" id="ny" name="ny" value="0"> <div id="map"></div> </form> <script> var map = L.map('map'); L.tileLayer('http://{s}.tile.osm.org/{z}/{x}/{y}.png', { }).addTo(map); map.locate({setView: true, maxZoom: 15}); alert("The geolocation cannot be determinded. Please point your observation on the map!"); var popup = L.popup(); function onMapClick(e) { popup .setLatLng(e.latlng) .setContent("I have observed the oil spill her!") .openOn(map); $('#nx').val(e.latlng.lng.toFixed(6)); $('#ny').val(e.latlng.lat.toFixed(6)); } map.on('click', onMapClick); </script> </div> <div data-role="footer" data-theme="b" data-position="fixed" data-tap-toggle="false" data-fullscreen="false"> <div data-role="navbar" data-position="fixed" data-tap-toggle="false" > <ul> <li><a href="datapage.html" data-icon="arrow-l" data-iconpos="left" data-inline="true" data-ajax="false">Back</a></li> <li><a href="#" class="form_submit_update" data-icon="arrow-r" data-iconpos="right" data-inline="true" onclick="document.getElementById('updateXY').submit();">Update</a></li> </ul>
A - 31
</div> </div> </div> </body> <<!-------------------------------End of sites--------------------------- --> </html>
App 4.7: uuid.php <?php /** * UUID class * * The following class generates VALID RFC 4122 COMPLIANT * Universally Unique IDentifiers (UUID) version 3, 4 and 5. * * UUIDs generated validates using OSSP UUID Tool, and output * for named-based UUIDs are exactly the same. This is a pure * PHP implementation. * * @author Andrew Moore * @link http://www.php.net/manual/en/function.uniqid.php#94959 */ class UUID { /** * Generate v3 UUID * * Version 3 UUIDs are named based. They require a namespace (another * valid UUID) and a value (the name). Given the same namespace and * name, the output is always the same. * * @param uuid $namespace * @param string $name */ public static function v3($namespace, $name) { if(!self::is_valid($namespace)) return false; // Get hexadecimal components of namespace $nhex = str_replace(array('-','{','}'), '', $namespace); // Binary Value $nstr = ''; // Convert Namespace UUID to bits for($i = 0; $i < strlen($nhex); $i+=2) { $nstr .= chr(hexdec($nhex[$i].$nhex[$i+1])); } // Calculate hash value $hash = md5($nstr . $name); return sprintf('%08s-%04s-%04x-%04x-%12s', // 32 bits for "time_low" substr($hash, 0, 8),
A - 32
// 16 bits for "time_mid" substr($hash, 8, 4), // 16 bits for "time_hi_and_version", // four most significant bits holds version number 3 (hexdec(substr($hash, 12, 4)) & 0x0fff) | 0x3000, // 16 bits, 8 bits for "clk_seq_hi_res", // 8 bits for "clk_seq_low", // two most significant bits holds zero and one for variant DCE1.1 (hexdec(substr($hash, 16, 4)) & 0x3fff) | 0x8000, // 48 bits for "node" substr($hash, 20, 12) ); } /** * * Generate v4 UUID * * Version 4 UUIDs are pseudo-random. */ public static function v4() { return sprintf('%04x%04x-%04x-%04x-%04x-%04x%04x%04x', // 32 bits for "time_low" mt_rand(0, 0xffff), mt_rand(0, 0xffff), // 16 bits for "time_mid" mt_rand(0, 0xffff), // 16 bits for "time_hi_and_version", // four most significant bits holds version number 4 mt_rand(0, 0x0fff) | 0x4000, // 16 bits, 8 bits for "clk_seq_hi_res", // 8 bits for "clk_seq_low", // two most significant bits holds zero and one for variant DCE1.1 mt_rand(0, 0x3fff) | 0x8000, // 48 bits for "node" mt_rand(0, 0xffff), mt_rand(0, 0xffff), mt_rand(0, 0xffff) ); } /** * Generate v5 UUID * * Version 5 UUIDs are named based. They require a namespace (another * valid UUID) and a value (the name). Given the same namespace and * name, the output is always the same. * * @param uuid $namespace * @param string $name */ public static function v5($namespace, $name)
A - 33
{ if(!self::is_valid($namespace)) return false; // Get hexadecimal components of namespace $nhex = str_replace(array('-','{','}'), '', $namespace); // Binary Value $nstr = ''; // Convert Namespace UUID to bits for($i = 0; $i < strlen($nhex); $i+=2) { $nstr .= chr(hexdec($nhex[$i].$nhex[$i+1])); } // Calculate hash value $hash = sha1($nstr . $name); return sprintf('%08s-%04s-%04x-%04x-%12s', // 32 bits for "time_low" substr($hash, 0, 8), // 16 bits for "time_mid" substr($hash, 8, 4), // 16 bits for "time_hi_and_version", // four most significant bits holds version number 5 (hexdec(substr($hash, 12, 4)) & 0x0fff) | 0x5000, // 16 bits, 8 bits for "clk_seq_hi_res", // 8 bits for "clk_seq_low", // two most significant bits holds zero and one for variant DCE1.1 (hexdec(substr($hash, 16, 4)) & 0x3fff) | 0x8000, // 48 bits for "node" substr($hash, 20, 12) ); } public static function is_valid($uuid) { return preg_match('/^\{?[0-9a-f]{8}\-?[0-9a-f]{4}\-?[0-9a-f]{4}\-?'. '[0-9a-f]{4}\-?[0-9a-f]{12}\}?$/i', $uuid) === 1; } } ?>
App 4.8: Upload.php <?php include 'uuid.php'; //create a Pseudo-random UUID $v4uuid = UUID::v4(); // Function to create Thumbnails, GD2 extension is required in PHP function createThumbs( $pathToImages, $Imagefname, $pathToThumbs, $thumbWidth ) { $tmp=explode(".", $Imagefname);
A - 34
$fileext = strtolower(end($tmp)); // determine the image type switch ($fileext) { case 'jpg': case 'jpeg': $img = imagecreatefromjpeg( "{$pathToImages}{$Imagefname}" ); break; case 'gif': $img = imagecreatefromgif( "{$pathToImages}{$Imagefname}" ); break; case 'png': $img = imagecreatefrompng( "{$pathToImages}{$Imagefname}" ); break; } //echo "<br /> Creating thumbnail for {$Imagefname} <br />"; // load image and get image size $width = imagesx( $img ); $height = imagesy( $img ); // calculate thumbnail size $new_width = $thumbWidth; $new_height = floor( $height * ( $thumbWidth / $width ) ); // create a new temporary image $tmp_img = imagecreatetruecolor( $new_width, $new_height ); // copy and resize old image into new image imagecopyresized( $tmp_img, $img, 0, 0, 0, 0, $new_width, $new_height, $width, $height ); // Rename Thumbfile's name $thumbpathname = $pathToThumbs . "Thumb_" . $Imagefname; // save thumbnail into a file, 0, 100 for high quality switch ($fileext) { case 'jpg': case 'jpeg': imagejpeg( $tmp_img, $thumbpathname, 100 ); break; case 'gif': imagegif( $tmp_img, $thumbpathname,0); break; case 'png': imagepng( $tmp_img, $thumbpathname); break; } }; //function to retrieve XY from EXIF function readGPSinfoEXIF($image_full_name) { $exif=exif_read_data($image_full_name, 0, true); if(!$exif || $exif['GPS']['GPSLatitude'] == '') { return false; } else
A - 35
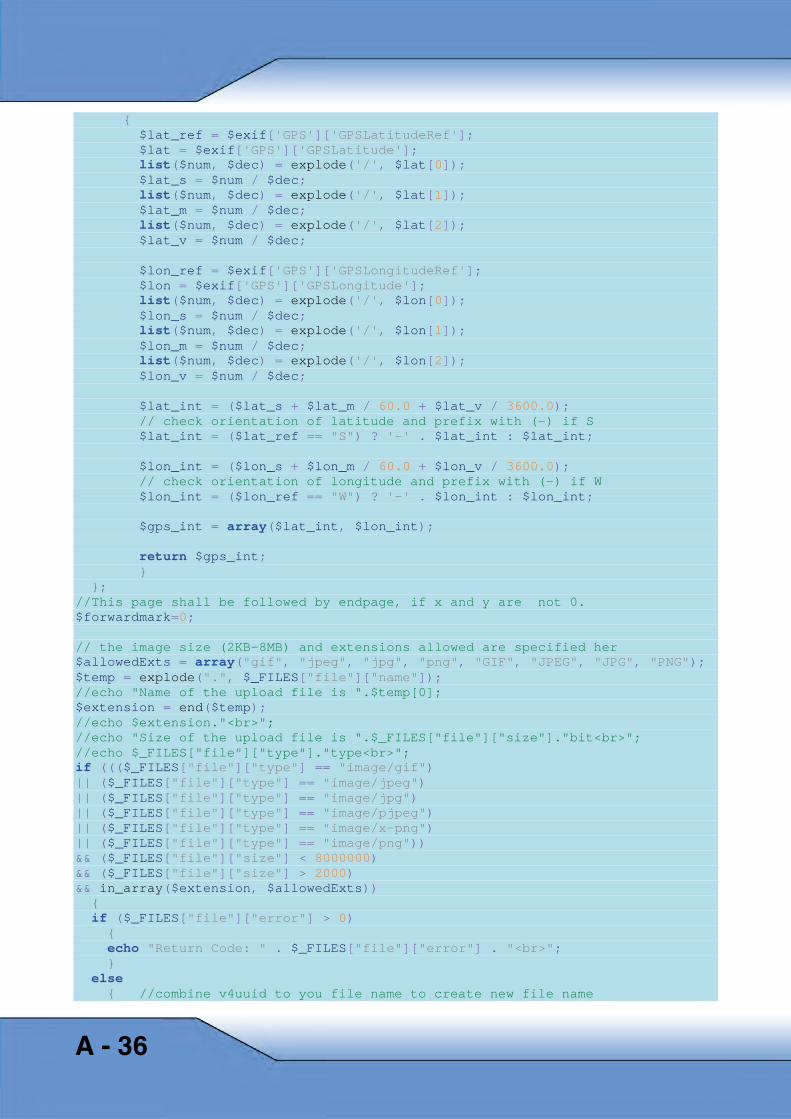
{ $lat_ref = $exif['GPS']['GPSLatitudeRef']; $lat = $exif['GPS']['GPSLatitude']; list($num, $dec) = explode('/', $lat[0]); $lat_s = $num / $dec; list($num, $dec) = explode('/', $lat[1]); $lat_m = $num / $dec; list($num, $dec) = explode('/', $lat[2]); $lat_v = $num / $dec; $lon_ref = $exif['GPS']['GPSLongitudeRef']; $lon = $exif['GPS']['GPSLongitude']; list($num, $dec) = explode('/', $lon[0]); $lon_s = $num / $dec; list($num, $dec) = explode('/', $lon[1]); $lon_m = $num / $dec; list($num, $dec) = explode('/', $lon[2]); $lon_v = $num / $dec; $lat_int = ($lat_s + $lat_m / 60.0 + $lat_v / 3600.0); // check orientation of latitude and prefix with (-) if S $lat_int = ($lat_ref == "S") ? '-' . $lat_int : $lat_int; $lon_int = ($lon_s + $lon_m / 60.0 + $lon_v / 3600.0); // check orientation of longitude and prefix with (-) if W $lon_int = ($lon_ref == "W") ? '-' . $lon_int : $lon_int; $gps_int = array($lat_int, $lon_int); return $gps_int; } }; //This page shall be followed by endpage, if x and y are not 0. $forwardmark=0; // the image size (2KB-8MB) and extensions allowed are specified her $allowedExts = array("gif", "jpeg", "jpg", "png", "GIF", "JPEG", "JPG", "PNG"); $temp = explode(".", $_FILES["file"]["name"]); //echo "Name of the upload file is ".$temp[0]; $extension = end($temp); //echo $extension."<br>"; //echo "Size of the upload file is ".$_FILES["file"]["size"]."bit<br>"; //echo $_FILES["file"]["type"]."type<br>"; if ((($_FILES["file"]["type"] == "image/gif") || ($_FILES["file"]["type"] == "image/jpeg") || ($_FILES["file"]["type"] == "image/jpg") || ($_FILES["file"]["type"] == "image/pjpeg") || ($_FILES["file"]["type"] == "image/x-png") || ($_FILES["file"]["type"] == "image/png")) && ($_FILES["file"]["size"] < 8000000) && ($_FILES["file"]["size"] > 2000) && in_array($extension, $allowedExts)) { if ($_FILES["file"]["error"] > 0) { echo "Return Code: " . $_FILES["file"]["error"] . "<br>"; } else { //combine v4uuid to you file name to create new file name
A - 36
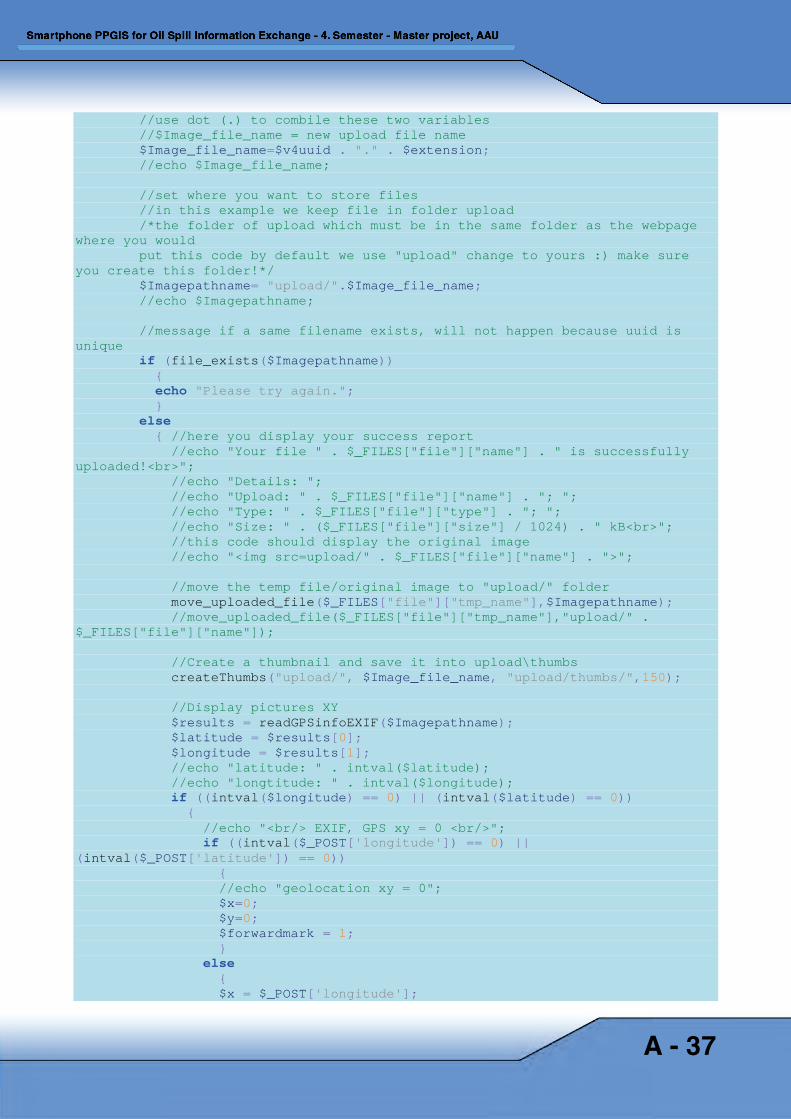
//use dot (.) to combile these two variables //$Image_file_name = new upload file name $Image_file_name=$v4uuid . "." . $extension; //echo $Image_file_name; //set where you want to store files //in this example we keep file in folder upload /*the folder of upload which must be in the same folder as the webpage where you would put this code by default we use "upload" change to yours :) make sure you create this folder!*/ $Imagepathname= "upload/".$Image_file_name; //echo $Imagepathname; //message if a same filename exists, will not happen because uuid is unique if (file_exists($Imagepathname)) { echo "Please try again."; } else { //here you display your success report //echo "Your file " . $_FILES["file"]["name"] . " is successfully uploaded!<br>"; //echo "Details: "; //echo "Upload: " . $_FILES["file"]["name"] . "; "; //echo "Type: " . $_FILES["file"]["type"] . "; "; //echo "Size: " . ($_FILES["file"]["size"] / 1024) . " kB<br>"; //this code should display the original image //echo "<img src=upload/" . $_FILES["file"]["name"] . ">"; //move the temp file/original image to "upload/" folder move_uploaded_file($_FILES["file"]["tmp_name"],$Imagepathname); //move_uploaded_file($_FILES["file"]["tmp_name"],"upload/" . $_FILES["file"]["name"]); //Create a thumbnail and save it into upload\thumbs createThumbs("upload/", $Image_file_name, "upload/thumbs/",150); //Display pictures XY $results = readGPSinfoEXIF($Imagepathname); $latitude = $results[0]; $longitude = $results[1]; //echo "latitude: " . intval($latitude); //echo "longtitude: " . intval($longitude); if ((intval($longitude) == 0) || (intval($latitude) == 0)) { //echo "<br/> EXIF, GPS xy = 0 <br/>"; if ((intval($_POST['longitude']) == 0) || (intval($_POST['latitude']) == 0)) { //echo "geolocation xy = 0"; $x=0; $y=0; $forwardmark = 1; } else { $x = $_POST['longitude'];
A - 37
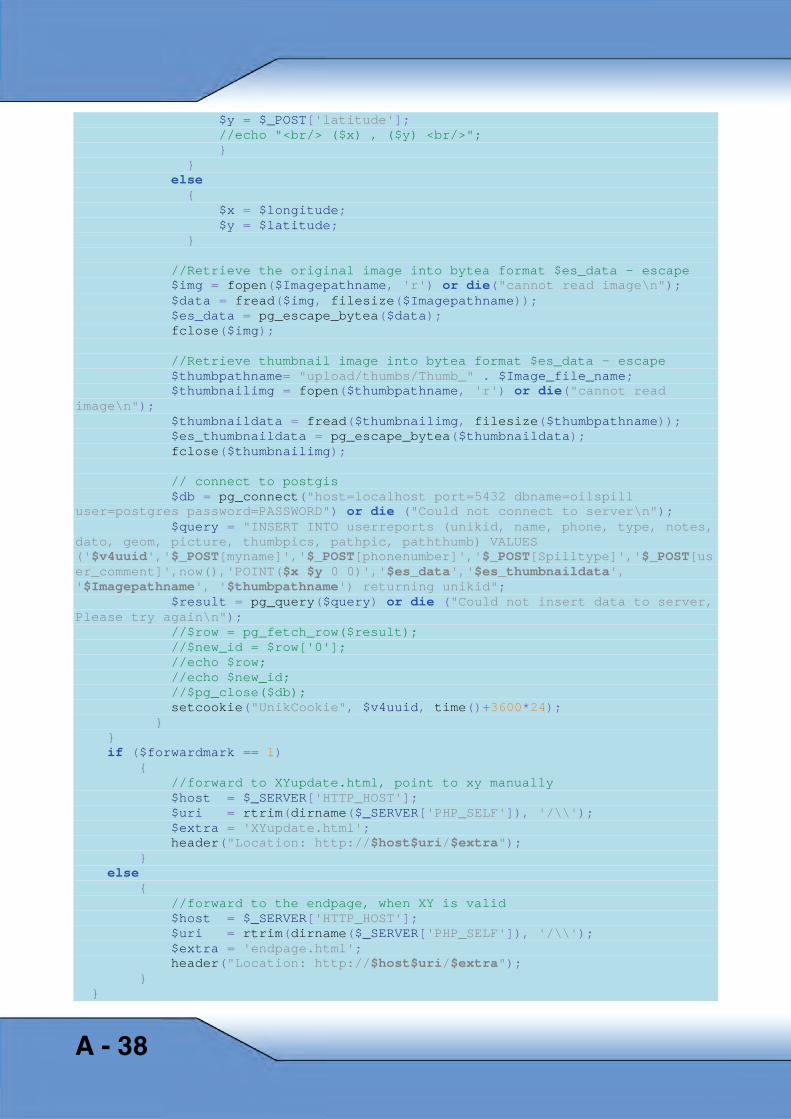
$y = $_POST['latitude']; //echo "<br/> ($x) , ($y) <br/>"; } } else { $x = $longitude; $y = $latitude; } //Retrieve the original image into bytea format $es_data - escape $img = fopen($Imagepathname, 'r') or die("cannot read image\n"); $data = fread($img, filesize($Imagepathname)); $es_data = pg_escape_bytea($data); fclose($img); //Retrieve thumbnail image into bytea format $es_data - escape $thumbpathname= "upload/thumbs/Thumb_" . $Image_file_name; $thumbnailimg = fopen($thumbpathname, 'r') or die("cannot read image\n"); $thumbnaildata = fread($thumbnailimg, filesize($thumbpathname)); $es_thumbnaildata = pg_escape_bytea($thumbnaildata); fclose($thumbnailimg); // connect to postgis $db = pg_connect("host=localhost port=5432 dbname=oilspill user=postgres password=PASSWORD") or die ("Could not connect to server\n"); $query = "INSERT INTO userreports (unikid, name, phone, type, notes, dato, geom, picture, thumbpics, pathpic, paththumb) VALUES ('$v4uuid','$_POST[myname]','$_POST[phonenumber]','$_POST[Spilltype]','$_POST[user_comment]',now(),'POINT($x $y 0 0)','$es_data','$es_thumbnaildata', '$Imagepathname', '$thumbpathname') returning unikid"; $result = pg_query($query) or die ("Could not insert data to server, Please try again\n"); //$row = pg_fetch_row($result); //$new_id = $row['0']; //echo $row; //echo $new_id; //$pg_close($db); setcookie("UnikCookie", $v4uuid, time()+3600*24); } } if ($forwardmark == 1) { //forward to XYupdate.html, point to xy manually $host = $_SERVER['HTTP_HOST']; $uri = rtrim(dirname($_SERVER['PHP_SELF']), '/\\'); $extra = 'XYupdate.html'; header("Location: http://$host$uri/$extra"); } else { //forward to the endpage, when XY is valid $host = $_SERVER['HTTP_HOST']; $uri = rtrim(dirname($_SERVER['PHP_SELF']), '/\\'); $extra = 'endpage.html'; header("Location: http://$host$uri/$extra"); } }
A - 38
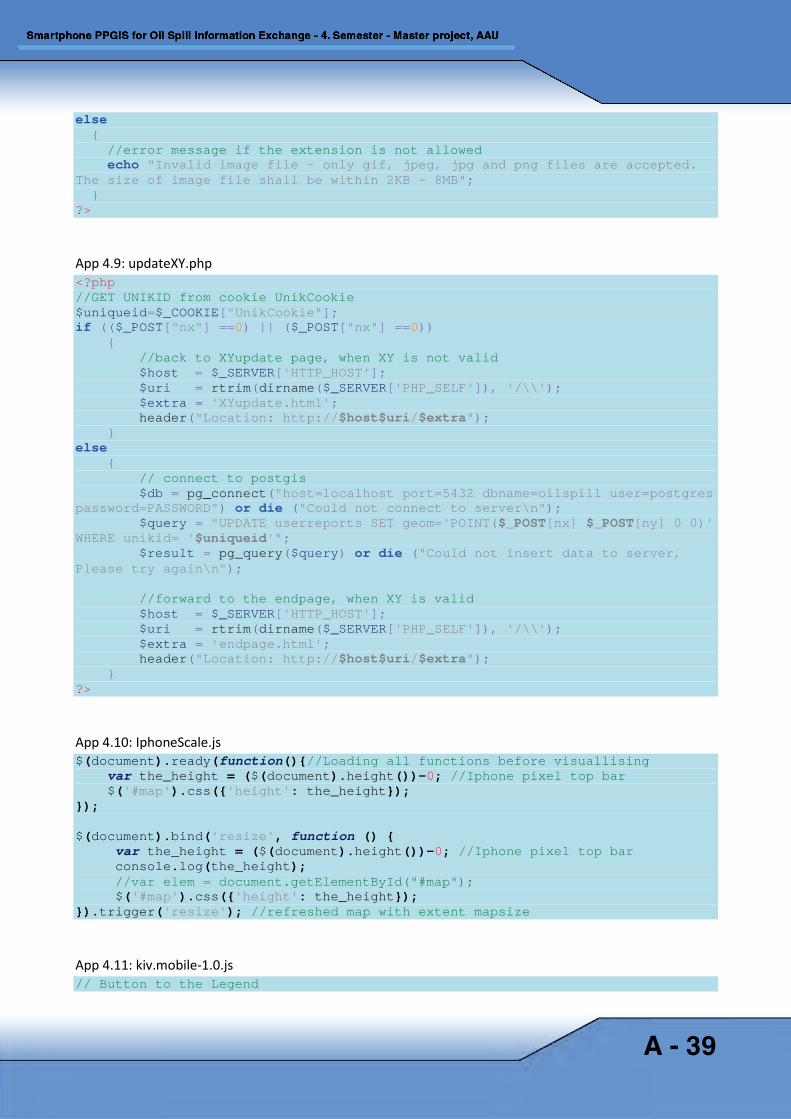
else { //error message if the extension is not allowed echo "Invalid image file - only gif, jpeg, jpg and png files are accepted. The size of image file shall be within 2KB - 8MB"; } ?>
App 4.9: updateXY.php <?php //GET UNIKID from cookie UnikCookie $uniqueid=$_COOKIE["UnikCookie"]; if (($_POST["nx"] ==0) || ($_POST["nx"] ==0)) { //back to XYupdate page, when XY is not valid $host = $_SERVER['HTTP_HOST']; $uri = rtrim(dirname($_SERVER['PHP_SELF']), '/\\'); $extra = 'XYupdate.html'; header("Location: http://$host$uri/$extra"); } else { // connect to postgis $db = pg_connect("host=localhost port=5432 dbname=oilspill user=postgres password=PASSWORD") or die ("Could not connect to server\n"); $query = "UPDATE userreports SET geom='POINT($_POST[nx] $_POST[ny] 0 0)' WHERE unikid= '$uniqueid'"; $result = pg_query($query) or die ("Could not insert data to server, Please try again\n"); //forward to the endpage, when XY is valid $host = $_SERVER['HTTP_HOST']; $uri = rtrim(dirname($_SERVER['PHP_SELF']), '/\\'); $extra = 'endpage.html'; header("Location: http://$host$uri/$extra"); } ?>
App 4.10: IphoneScale.js $(document).ready(function(){//Loading all functions before visuallising var the_height = ($(document).height())-0; //Iphone pixel top bar $('#map').css({'height': the_height}); }); $(document).bind('resize', function () { var the_height = ($(document).height())-0; //Iphone pixel top bar console.log(the_height); //var elem = document.getElementById("#map"); $('#map').css({'height': the_height}); }).trigger('resize'); //refreshed map with extent mapsize
App 4.11: kiv.mobile-1.0.js // Button to the Legend
A - 39
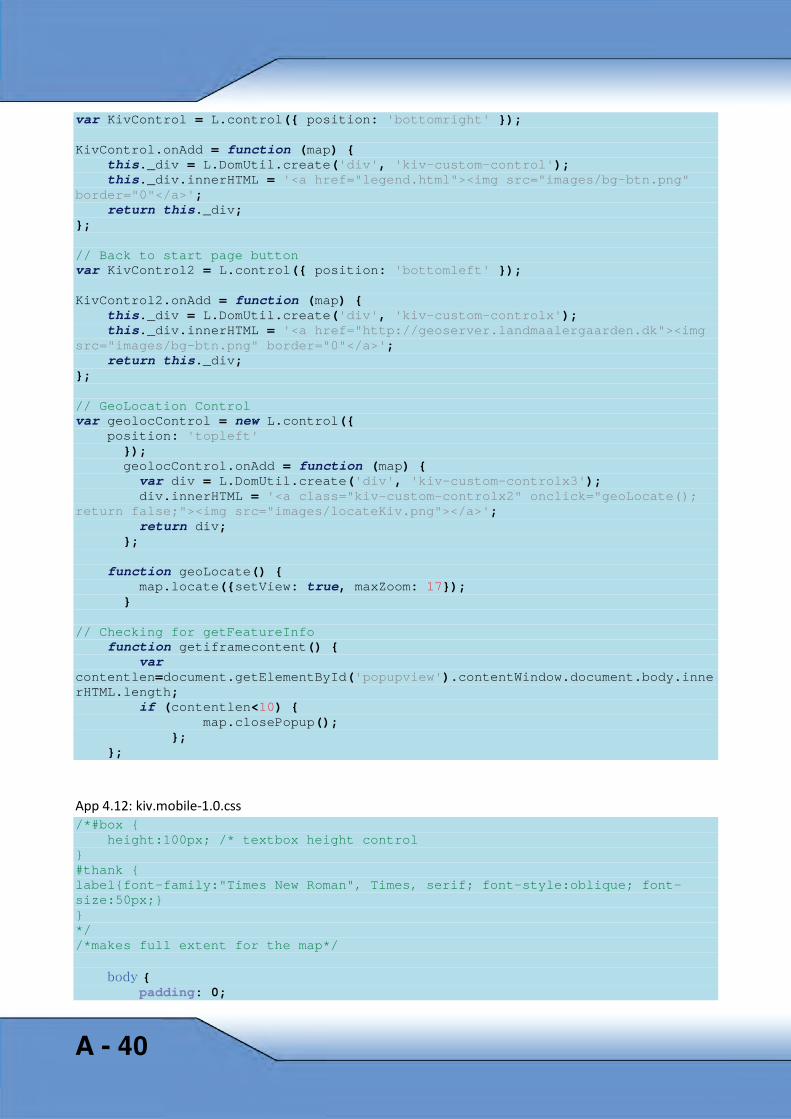
var KivControl = L.control({ position: 'bottomright' }); KivControl.onAdd = function (map) { this._div = L.DomUtil.create('div', 'kiv-custom-control'); this._div.innerHTML = '<a href="legend.html"><img src="images/bg-btn.png" border="0"</a>'; return this._div; }; // Back to start page button var KivControl2 = L.control({ position: 'bottomleft' }); KivControl2.onAdd = function (map) { this._div = L.DomUtil.create('div', 'kiv-custom-controlx'); this._div.innerHTML = '<a href="http://geoserver.landmaalergaarden.dk"><img src="images/bg-btn.png" border="0"</a>'; return this._div; }; // GeoLocation Control var geolocControl = new L.control({ position: 'topleft' }); geolocControl.onAdd = function (map) { var div = L.DomUtil.create('div', 'kiv-custom-controlx3'); div.innerHTML = '<a class="kiv-custom-controlx2" onclick="geoLocate(); return false;"><img src="images/locateKiv.png"></a>'; return div; }; function geoLocate() { map.locate({setView: true, maxZoom: 17}); } // Checking for getFeatureInfo function getiframecontent() { var contentlen=document.getElementById('popupview').contentWindow.document.body.innerHTML.length; if (contentlen<10) { map.closePopup(); }; };
App 4.12: kiv.mobile-1.0.css /*#box { height:100px; /* textbox height control } #thank { label{font-family:"Times New Roman", Times, serif; font-style:oblique; font-size:50px;} } */ /*makes full extent for the map*/ body { padding: 0;
A - 40
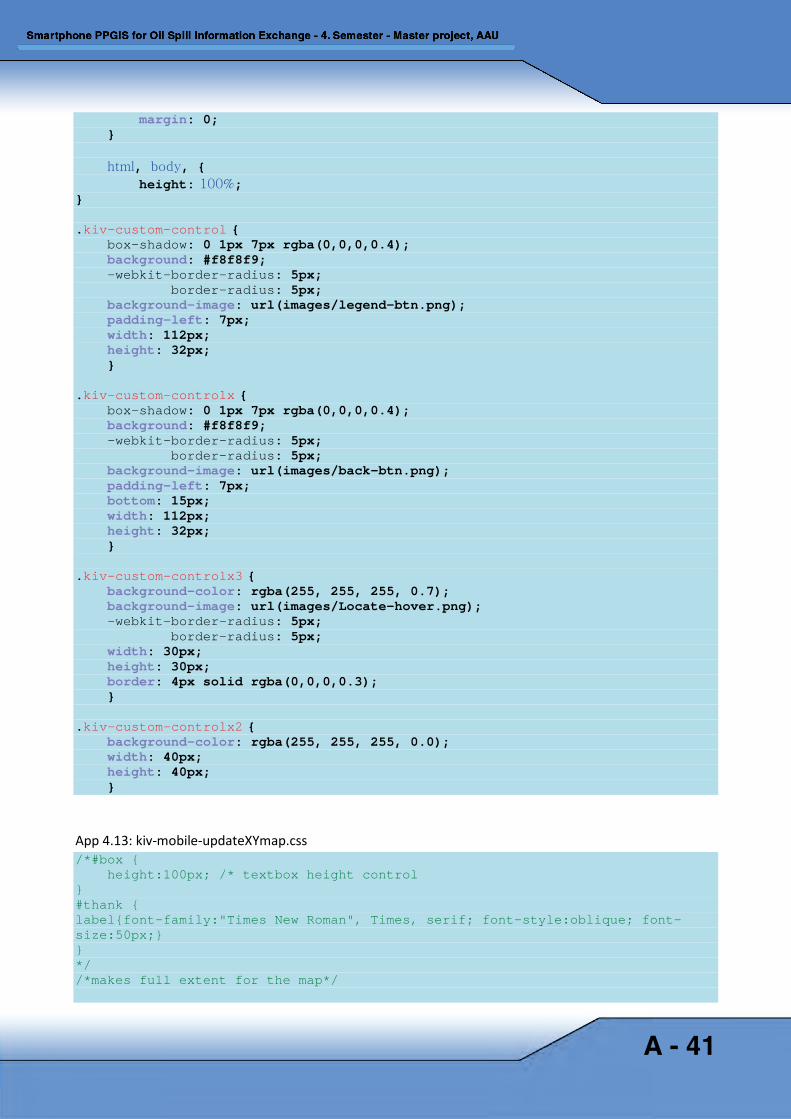
margin: 0; } html, body, { height: 100%; } .kiv-custom-control { box-shadow: 0 1px 7px rgba(0,0,0,0.4); background: #f8f8f9; -webkit-border-radius: 5px; border-radius: 5px; background-image: url(images/legend-btn.png); padding-left: 7px; width: 112px; height: 32px; } .kiv-custom-controlx { box-shadow: 0 1px 7px rgba(0,0,0,0.4); background: #f8f8f9; -webkit-border-radius: 5px; border-radius: 5px; background-image: url(images/back-btn.png); padding-left: 7px; bottom: 15px; width: 112px; height: 32px; } .kiv-custom-controlx3 { background-color: rgba(255, 255, 255, 0.7); background-image: url(images/Locate-hover.png); -webkit-border-radius: 5px; border-radius: 5px; width: 30px; height: 30px; border: 4px solid rgba(0,0,0,0.3); } .kiv-custom-controlx2 { background-color: rgba(255, 255, 255, 0.0); width: 40px; height: 40px; }
App 4.13: kiv-mobile-updateXYmap.css /*#box { height:100px; /* textbox height control } #thank { label{font-family:"Times New Roman", Times, serif; font-style:oblique; font-size:50px;} } */ /*makes full extent for the map*/
A - 41
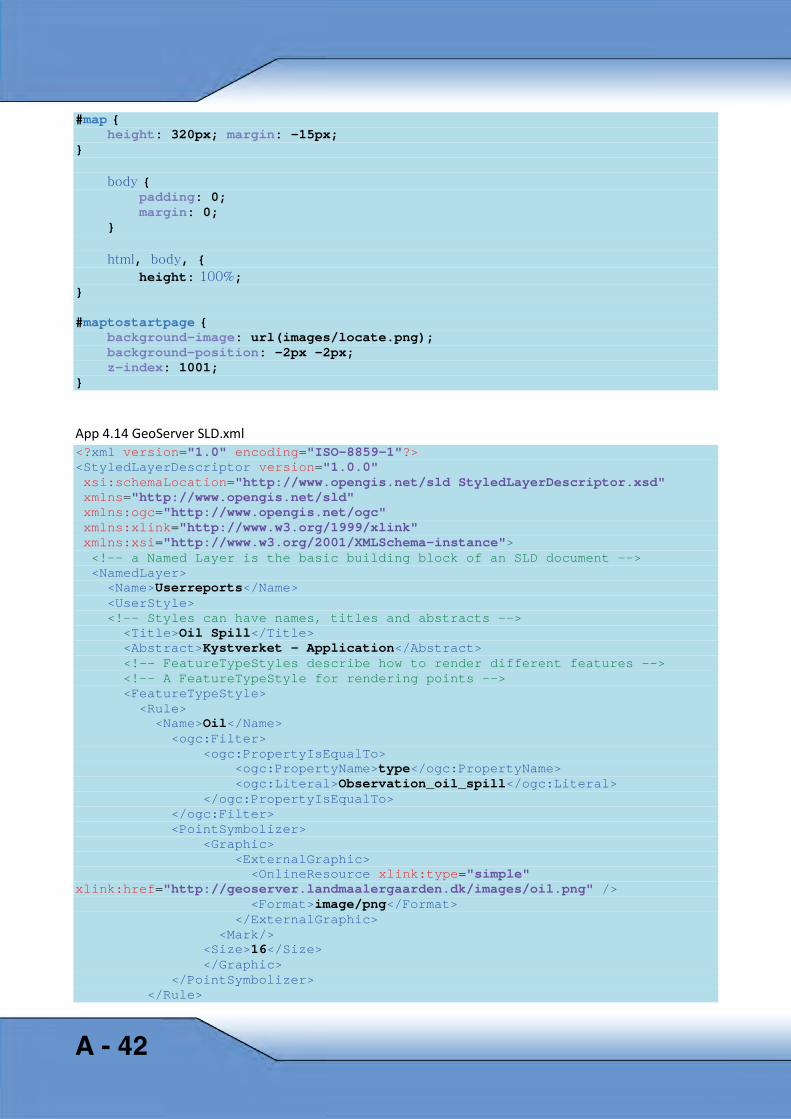
#map { height: 320px; margin: -15px; } body { padding: 0; margin: 0; } html, body, { height: 100%; } #maptostartpage { background-image: url(images/locate.png); background-position: -2px -2px; z-index: 1001; }
App 4.14 GeoServer SLD.xml <?xml version="1.0" encoding="ISO-8859-1"?> <StyledLayerDescriptor version="1.0.0" xsi:schemaLocation="http://www.opengis.net/sld StyledLayerDescriptor.xsd" xmlns="http://www.opengis.net/sld" xmlns:ogc="http://www.opengis.net/ogc" xmlns:xlink="http://www.w3.org/1999/xlink" xmlns:xsi="http://www.w3.org/2001/XMLSchema-instance"> <!-- a Named Layer is the basic building block of an SLD document --> <NamedLayer> <Name>Userreports</Name> <UserStyle> <!-- Styles can have names, titles and abstracts --> <Title>Oil Spill</Title> <Abstract>Kystverket - Application</Abstract> <!-- FeatureTypeStyles describe how to render different features --> <!-- A FeatureTypeStyle for rendering points --> <FeatureTypeStyle> <Rule> <Name>Oil</Name> <ogc:Filter> <ogc:PropertyIsEqualTo> <ogc:PropertyName>type</ogc:PropertyName> <ogc:Literal>Observation_oil_spill</ogc:Literal> </ogc:PropertyIsEqualTo> </ogc:Filter> <PointSymbolizer> <Graphic> <ExternalGraphic> <OnlineResource xlink:type="simple" xlink:href="http://geoserver.landmaalergaarden.dk/images/oil.png" /> <Format>image/png</Format> </ExternalGraphic> <Mark/> <Size>16</Size> </Graphic> </PointSymbolizer> </Rule>
A - 42
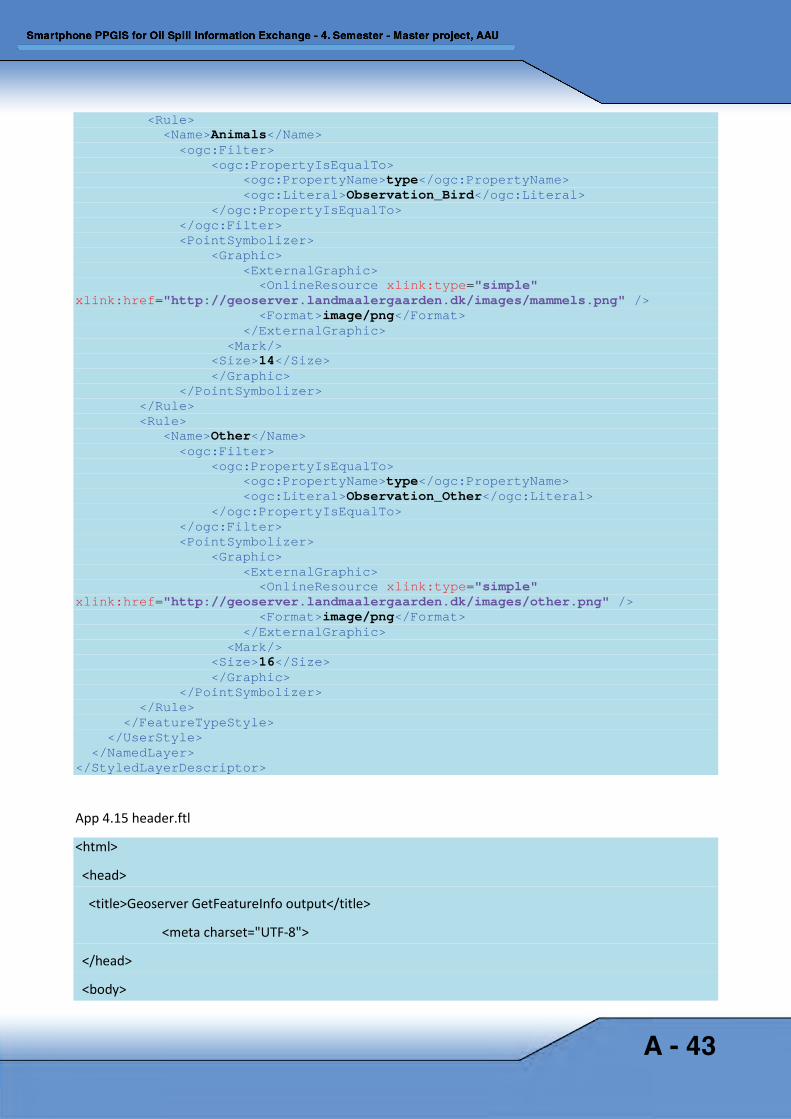
<Rule> <Name>Animals</Name> <ogc:Filter> <ogc:PropertyIsEqualTo> <ogc:PropertyName>type</ogc:PropertyName> <ogc:Literal>Observation_Bird</ogc:Literal> </ogc:PropertyIsEqualTo> </ogc:Filter> <PointSymbolizer> <Graphic> <ExternalGraphic> <OnlineResource xlink:type="simple" xlink:href="http://geoserver.landmaalergaarden.dk/images/mammels.png" /> <Format>image/png</Format> </ExternalGraphic> <Mark/> <Size>14</Size> </Graphic> </PointSymbolizer> </Rule> <Rule> <Name>Other</Name> <ogc:Filter> <ogc:PropertyIsEqualTo> <ogc:PropertyName>type</ogc:PropertyName> <ogc:Literal>Observation_Other</ogc:Literal> </ogc:PropertyIsEqualTo> </ogc:Filter> <PointSymbolizer> <Graphic> <ExternalGraphic> <OnlineResource xlink:type="simple" xlink:href="http://geoserver.landmaalergaarden.dk/images/other.png" /> <Format>image/png</Format> </ExternalGraphic> <Mark/> <Size>16</Size> </Graphic> </PointSymbolizer> </Rule> </FeatureTypeStyle> </UserStyle> </NamedLayer> </StyledLayerDescriptor>
App 4.15 header.ftl
<html>
<head>
<title>Geoserver GetFeatureInfo output</title>
<meta charset="UTF-8">
</head>
<body>
A - 43
App 4.16 content.ftl
<center>
<#list features as feature>
<b>${feature.notes.value}</b>: <br/>
<img src="http://geoserver.landmaalergaarden.dk/${feature.paththumb.value}"/ height="75" width="100"><br/>
</#list>
</center>
App 4.17 footer.ftl </body>
</html>
A - 44
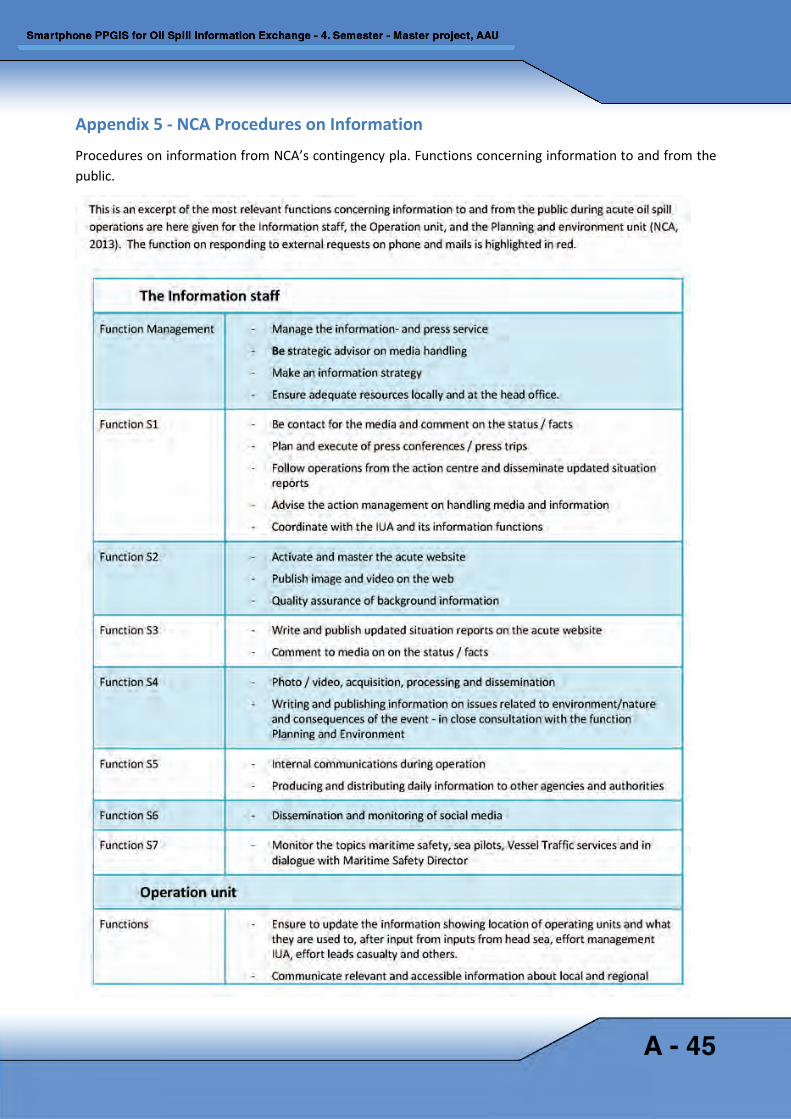
Appendix 5 - NCA Procedures on Information
Procedures on information from NCA’s contingency pla. Functions concerning information to and from the public.
A - 45
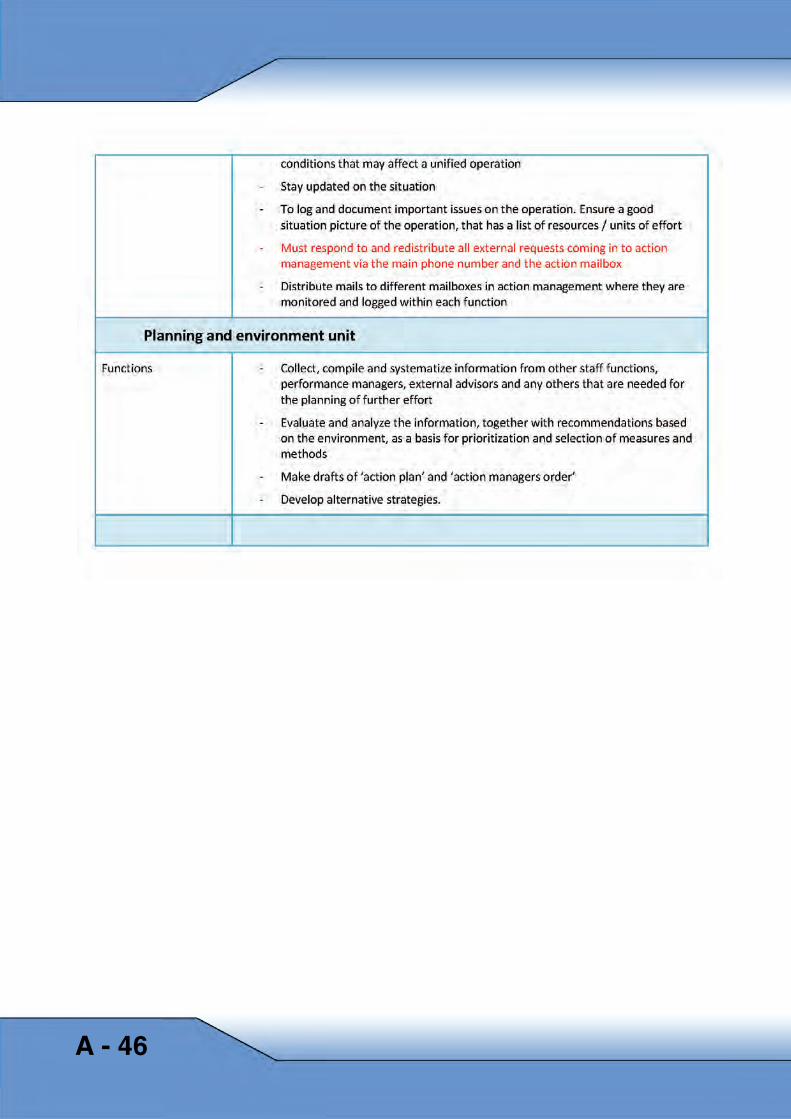
A - 46


Kim Verup, John Morten Klingsheim, Simen Slotta, Weixiao Yang
MTM – Master of Technology Management with specialization in Geoinformatics and Geoinformation management
4. semester, 2013
Aalborg University