Embed Size (px)
DESCRIPTION
Smarter Analytics: Making Better Decisions Faster with IBM BusinessAnalytics and Optimization SolutionsI don't own this material
Citation preview
Front cover
Smarter Analytics: Making Better Decisions Faster with IBM Business Analytics and Optimization Solutions
Dr. Jeremy BloomMurthy RallapalliBarry RosenDr. Hans Schlenker
Learn how analytics can make your company more efficient and effective
Use analytics to assimilate, digest, and act on information
Gain insight into making smarter, faster decisions with analytics
Redguidesfor Business Leaders

Executive overview
Businesses are constantly looking for ways to improve their efficiency and to cut costs. However, situations arise that disrupt the best laid plans. For example, after a major storm on the east coast of the United States disrupts travel, an airline uses a sophisticated scheduling solution to reposition its crews so that the airline can recover and start flying more quickly than its competitors. A power company uses an advanced solution for dispatching power plants to generate electricity, achieving a return on investment in less than 10 days. A financial institution uses an ingenious way to match buy-and-sell orders, reducing clearing time from one day to under two minutes. Think about what similar efficiency improvements can mean for your business.
These striking examples have one thing in common. All these companies built their decision-support solutions by using advanced analytics technology. These days, analytics has a lot of buzz, but for most business executives, the realm of analytics remains mysterious, with promises that seem almost too good to be true.
Many companies are applying Business Analytics and Optimization (BAO) solutions to better understand customers, drive real-time decisions, foster fact-based decision-making, and increase organizational collaboration and productivity. By using BAO, businesses can identify and follow the best course of action, based on facts and objective evaluation of alternatives. For example, an IBM® semiconductor fabrication facility uses BAO to reschedule the production of complex microelectronics every five minutes. With BAO, the plant can effectively coordinate the multiple, intricate production processes and maintain high utilization of capital-intensive equipment.
By implementing BAO solutions, you can make more confident choices, and anticipate and mold business results in rapidly changing environments. What could your business achieve if your organization had the answers it needs when needed? What if you could take action because you understood precisely the consequences of alternative choices? What if you could determine the best choices at any given time?
This IBM Redguide™ publication provides an overview of IBM Smarter Analytics. It highlights various analytic technologies and how they apply to business environments. This paper describes a high-level reference architecture with key components. It also examines possible entry points for many industries that are interested in using BAO. In addition, this paper profiles IBM case studies of various companies that integrated BAO solutions.
© Copyright IBM Corp. 2012. All rights reserved. 1
Introduction to Business Analytics and Optimization
Smarter Analytics (commonly referred to as Business Analytics and Optimization in industry) deals with data for iterative exploration and investigation. Businesses today deal with lots of information. Because the ability to collect data has increased exponentially in the last few decades, business leaders are increasingly focused on finding ways to use this data. By applying analytics, businesses can assimilate, digest, and act on data and information. Analytics reveals hidden patterns in the data, answering previously unidentified questions.
Optimization further extends the power of analytics by helping decision makers handle the difficult trade-offs that arise when limited resources force choices among alternative options. Optimization provides better decision-making when there is an overwhelming number of factors to consider with complex inter-relationships among them. Frequently optimization provides the highest value in situations where the complexity is overwhelming to the human experts.
Analytic technologies fall into the following categories:
� Descriptive analytics provides information about the past state or performance of a business and its environment. It needs data that is already stored (for example, in database). Therefore, by definition, it is a view of the past, even if the past happened just a second ago.
Descriptive analytics provides regular reports for events that already happened and ad hoc reports to help examine facts about what happened, where, how often, and with how many. It includes the capability to perform individual queries so that someone can investigate the exact problem.
� Predictive analytics helps predict (based on data and statistical techniques) with confidence what will happen next so that you can make well-informed decisions and improve business outcomes.
Predictive analytics relies on real-time events and alerts to suggest actions. It uses simulation models to suggest what could happen. For example, with this data, you can apply predictive analytics so that you can perform the following tasks:
– Forecasting, which is a process of making statements about events whose outcomes have not yet been observed
– Predictive modeling for what-if situations or scenarios
� Prescriptive analytics recommends high-value alternative actions or decisions given a complex set of targets, limits, and choices. Optimization is used to examine how you can achieve the best outcome for a particular situation. It shines when there is no practical way to show the breadth of information or its complexity to human experts in a way that they can make decisions. Stochastic optimization recommends how you can mitigate or even avoid uncertain risks. Therefore, prescriptive analytics predicts future outcomes and suggests courses of actions to take so that you can benefit from those predictions.
The value of Business Analytics and Optimization to your organization
Analytics, which are based on mathematical principles, started as simple descriptive statistics. Descriptive analytics identify, classify, and count past events. With this information, you can react and change course when appropriate. Currently, analytics have expanded so that you can anticipate possible future outcomes and take appropriate actions for the current situation or for the future.
2 Smarter Analytics: Making Better Decisions Faster with IBM Business Analytics and Optimization Solutions
By using analytics, your organization can quickly and confidently make better business decisions about what specific actions or strategies to implement. These techniques tap into your data, information, and knowledge base to predict future events and to assess potential courses of action. Analytics provides the following abilities:
� Identify and analyze meaningful patterns and correlations in complex, structured, or unstructured data, which is often too complex for humans to conceptualize.
� Use relationships that link decisions and potential outcomes to each other, determining the best set of interrelated decisions, giving you more options and helping you to identify the most viable action to take.
� Conduct business simulations by modifying input parameters in what-if mode. With this capability, you can explore various alternatives to test alternative choices without affecting the day-to-day operations of your business or organization.
� Examine and choose from numerous options to select the best choices that also satisfy constraints due to resource limits, business policies, and government regulations.
What can analytics mean to your business? By using analytics, you can achieve the following objectives:
� Predict competitors’ responses with accuracy.
� Identify latent market demand to develop products to meet it.
� Determine the likelihood that a specific event will happen, so that you can take action accordingly.
� Plan or schedule activities that meet your customers’ needs, minimize your costs, and use your resources effectively.
As one of the most sophisticated analytics technologies, optimization delivers great business value. It helps decision makers with the tough trade-offs that arise when only limited resources are available. Resources can be such items as capital, workers, capacity, raw materials, and time.
Optimization is about making decisions. It works best when there are thousands of choices to make and resource limits force the decision maker to make trade-offs among them. For example, a manufacturer produces 10,000 products in 20 plants worldwide. The sales forecast for the next year requires making over one million distinct items. The company’s planners must decide where each item will be produced, taking account of local labor costs, shipping costs, raw materials availability, work center capacity in each plant, and many other factors.
In such situations, optimization offers the following advantages:
� Discover previously unknown options or approaches.
Optimization can examine millions of choices to find the best ones within the specified resource limits. It can look at many more options than any human decision maker. In such situations, humans usually rely on intuition and experience, using familiar patterns. But in rapidly changing business environments, experience-based patterns frequently lose relevance. Optimization can break out of the familiar to find novel, substantially better choices, enabling fact-based decisions.
For example, over the past 20 years, the electric power industry worldwide has been restructuring, transitioning daily operations from central command-and-control to market-based bidding. As a result, power system operators found that their traditional dispatch procedures could not adapt to the new market structures. Many implemented new dispatching procedures based on optimization. These new procedures have resulted in billions of dollars in annual cost savings.
3
� Automate and streamline decisions.
Optimization automatically and rapidly examines the millions of choices that are available to decision makers and ensures compliance with complex policies and regulations. It can free up decision makers to focus on the critical challenges of their business rather than on routine tasks, increasing their value and enhancing their satisfaction.
For example, day-to-day personnel scheduling often consumes a large part of the week for many hospital nurse managers. Because the patient census varies and nurses need time off, dynamic reassignments occur often. Rather than sitting in an office pouring over a scheduling spreadsheet, these highly skilled nurse managers create more value out on the floor, overseeing patient care, and mentoring junior nurses. Automating the schedule frees the nurse manager for higher value activities and creates more flexibility for the nurses, increasing job satisfaction. This flexibility is critical to nurse retention in many hospitals today.
� Enable decision makers to explore more scenarios and alternatives.
Most decision makers will not accept an automated solution as is. They must validate it to gain confidence that it works properly and provides its claimed value. Conditions can change rapidly, and decision makers want assurances that their choices perform well. Optimization can enable them to test their decisions under various contingencies. It provides deeper insights into the trade-offs that are required to obtain the greatest value within the limited resources available. The insights extend further. Optimization provides new ways to view and understand both the information that drives the decisions and the outcomes that result from them.
For example, a consumer products company wanted to restructure its distribution network to reduce delivery costs. An optimization solution suggested that reducing the number of regional warehouses might enable savings. This solution might consolidate shipments to take advantage of lower freight rates on full truckloads. However, deeper analysis showed that, in many cases, shipments might be delivered a day later, reducing product availability and customer satisfaction. Ultimately, the company decided to absorb additional delivery costs to improve the rate of next-day deliveries. And the company could quantify this trade-off exactly to determine how much value it should assign to next-day delivery.
The impact of Business Analytics and Optimization on diverse industries
By supporting decision makers as they determine what analytics can mean to their business, business analytics software and solutions enable organizations to perform various new and important capabilities:
� Visualize, spot and analyze trends and anomalies.� Assemble and interact with relevant information.� Compare “what-if” scenarios.� Measure and monitor business performance.� Predict potential threats and opportunities.� Plan, budget, and forecast resources.� Assess and manage risk.� Automate decisions where appropriate.� Align strategic and operational decisions.� Engage in social conversations with customers.
Business analytics in any industry addresses two key questions:
� How are we doing? � What should we be doing to do better?
4 Smarter Analytics: Making Better Decisions Faster with IBM Business Analytics and Optimization Solutions
The first question is really about business as usual. The second question addresses the gap of analytics-based solutions at an industry solution level. Business analytics affects several industries, which have some of the following entry points:
� Banking entry points:
– Multichannel selling and improving cross-selling and customer service to drive higher revenue
– Risk and regulatory compliance for better business results
– Introducing analytics solutions at an operational level to reduce the cost of operations
– An analytics dashboard to help create a single view of your information
– Analytics to help reduce costs by finding and disposing of duplicate content
– Predictive analytics to manage data growth across the organization
– Cash management to minimize carrying costs and ensure availability of funds
– Portfolio rebalancing to maximize returns with acceptable risk tolerance
� Communications entry points:
– Analytics in customer service to identify frequent choke points
– Customer behavioral analysis to improve marketing campaign efficiency
– Analytics solutions in SAP data management, which has proven to reduce costs
– Design networks that minimize capital expenditures and ensure sufficient capacity
� Energy and utilities entry points:
– Analytics solutions that optimize asset operations and help to reduce costs
– Analytics tools to address regulatory compliance and minimize costs, fines, and penalties
– Executive decision support capabilities that are improved by using analytical solutions
– Energy and utilities that come under purview of Department of Homeland Security compliance requirements (Analytics can help with unique compliance needs.)
– Deployment of smart grid components to meet reliability targets and to minimize capital outlays
– Selection of energy supply bids to meet user demand in day-ahead and real-time markets at a minimum cost
� Government entry points:
– Predictive analytics and data mining to improve traffic solutions
– Data mining solutions to help improve public safety
– Increase in revenue collections and improvement of taxpayer services
– Analytics and data mining from other city governments to help with newly incorporated cities and metropolitan areas
– Cost reduction of delivering public safety services and meeting crime prevention and response time targets
� Healthcare provider entry points:
– Analytics solutions in large healthcare facilities to help improve patient safety
– Analytics dashboard by patient and provider identifiers
– Improved data accuracy in patient diagnosis and records
– Scheduling personnel flexibly to meet patient care standards and improve the work-life quality for staff members
5
� Insurance entry points:
– Customer behavior analysis to reduce attrition and improve marketing campaign efficiency
– Improved claims administration efficiency and multichannel distribution by applying predictive analytics
– Allocation of financial capital to ensure compliance to Solvency II requirements, based on analysis of data over a period of time
– Fraud management by identifying the outliers and using embedded analytics
– Assignment of claims investigators to cases to reduce travel costs and improve resolution time
� Retail entry points:
– With analytics, significant optimization of supply chains and improved time to market by effectively managing product and vendor information
– Delivery of a consistent customer experience by capturing and analyzing customer behavior over a period of time
– Streamlining of business processes by analyzing every aspect of the business operations
– Extensive usage of analytics to showcase products prominently by their seasonal significance (for example, recommending moving umbrellas to the front of the store when rain is expected during certain times of the year)
– Matching promotional campaigns with target customer segments to maximize response rates
Several off-the-shelf products support many of these entry-point solutions. With proper analysis of the business (functional and nonfunctional) requirements, appropriate analytics solutions can be easily deployed for optimum benefit in an industry.
Optimization applications differ according to the time frame and frequency of the decisions that you need to make. Consider the following examples:
� Operational decisions, such as the following examples, typically have a short-term focus (such as weekly, daily, or hourly) depending on the cycle time of the business:
– Scheduling production orders on individual work centers– Dispatching and routing deliveries– Assigning workers to shifts– Committing power generators– Settling securities trades
Business operations can involve tens of thousands of individual choices that must be decided in a tight time frame. In the absence of an optimization-based solution, operations managers often resort to using familiar patterns and rules of thumb that might prove unreliable or unnecessarily costly in a fast-moving business environment.
� Tactical planning decisions, such as the following examples, typically have a medium-term focus and are made monthly, quarterly, or annually depending on the business context:
– Production planning, such as when, where, and how much of a product to make– Marketing campaign planning, including when and what media to use– Airplane and flight crew assignment– Inventory stocking– Materials procurement– Staffing– Water management such as in a river system
6 Smarter Analytics: Making Better Decisions Faster with IBM Business Analytics and Optimization Solutions
Although the number of individual decisions is usually smaller than in operations and the time frame is not as urgent, each decision often has a higher impact on key performance indicators such as cost or customer satisfaction. Therefore, an optimization solution can often generate greater benefit over the alternative methods such as rules of thumb.
� Strategic decisions, such as the following examples, typically have a long-term focus and are made with annual or longer frequency or made occasionally on an as-needed basis:
– Capital investments in new equipment or expanded production facilities– Distribution center location– Fleet sizing– Transportation time tabling – Timber harvesting– Mine planning (order of mining ore deposits)
Strategic decisions typically are few, and the evaluation can take months. They are often irreversible and, therefore, entail significant costs and risks. Because such decisions often involve high-level corporate policy questions, optimization constitutes only one of the analytics that is applied. It can put them on a solid factual basis and provide key insights because of the complex interactions among the choices.
Advantages to implementing Smarter Analytics solutions
Organizations that are just beginning to develop analytical decision support often start with ad hoc tools, such as spreadsheets and SQL. These tools have the advantages of simplicity, low cost, and flexibility, and therefore, encourage experimentation. Successful implementation provides a confidence in the organization to pursue analytical approaches with more vigor. However, such tools often prove difficult to maintain, and they do not scale well. As an organization’s appetite for analytics increases, it has several options to consider:
� Buy a prepackaged application for a specific purpose.
These kinds of applications often embody industry-specific knowledge and best practices. When they are applicable to an organization’s business, they can be fast and economical to implement. However, they might not match the organization’s business model or processes. Therefore, adopting one of them might require compromises.
� Build a custom application from components that are knit together with hand-coded software.
These types of applications can mirror the organization’s business model or processes, but they can be costly, time-consuming, and risky to develop.
� Build a custom application that is based on a platform with standardized components.
This approach allows for customization but reduces the cost, time, and risk of development by reusing standard components and minimizing the amount of custom software engineering that is required. Although the platform is standard, any type of custom application has some up-front costs associated with it.
7
Key Business Analytics and Optimization concepts
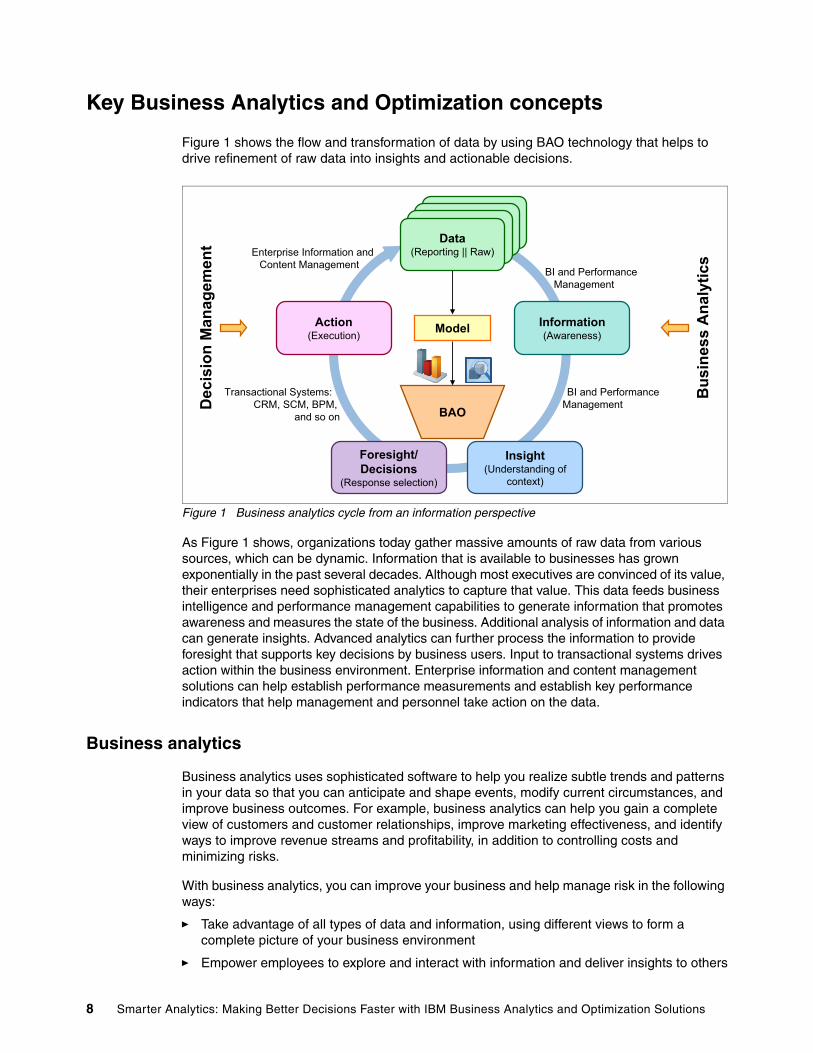
Figure 1 shows the flow and transformation of data by using BAO technology that helps to drive refinement of raw data into insights and actionable decisions.
Figure 1 Business analytics cycle from an information perspective
As Figure 1 shows, organizations today gather massive amounts of raw data from various sources, which can be dynamic. Information that is available to businesses has grown exponentially in the past several decades. Although most executives are convinced of its value, their enterprises need sophisticated analytics to capture that value. This data feeds business intelligence and performance management capabilities to generate information that promotes awareness and measures the state of the business. Additional analysis of information and data can generate insights. Advanced analytics can further process the information to provide foresight that supports key decisions by business users. Input to transactional systems drives action within the business environment. Enterprise information and content management solutions can help establish performance measurements and establish key performance indicators that help management and personnel take action on the data.
Business analytics
Business analytics uses sophisticated software to help you realize subtle trends and patterns in your data so that you can anticipate and shape events, modify current circumstances, and improve business outcomes. For example, business analytics can help you gain a complete view of customers and customer relationships, improve marketing effectiveness, and identify ways to improve revenue streams and profitability, in addition to controlling costs and minimizing risks.
With business analytics, you can improve your business and help manage risk in the following ways:
� Take advantage of all types of data and information, using different views to form a complete picture of your business environment
� Empower employees to explore and interact with information and deliver insights to others
Data(Reporting || Raw)Data
(Reporting || Raw)Data(Reporting || Raw)
Action(Execution)
Information(Awareness)
BAO
Foresight/Decisions
(Response selection)
Insight(Understanding of
context)
Model
Enterprise Information andContent Management
BI and PerformanceManagement
BI and PerformanceManagement
Transactional Systems: CRM, SCM, BPM,
and so on
Dec
isio
n M
anag
emen
t
Bus
ines
s A
naly
tics
8 Smarter Analytics: Making Better Decisions Faster with IBM Business Analytics and Optimization Solutions
� Streamline decisions by individuals or automated systems based on analytics results
� Provide insights from various perspectives and time horizons whether based on historic reporting, real-time analysis, or predictive modeling
Business analytics provides several capabilities:
� Business intelligence gives business users the abilities to view, assemble, and personalize information easily so that they can generate a previously undiscovered perspective. By using business intelligence, business users can consume fact-based statistical evidence to support key decisions. Business intelligence helps users to explore all types of information from all angles and to assess the current business situation to gain a deeper understanding of the patterns that exist in the data. With business intelligence, business users can deliver reports that include statistical insight and validation. They can also distribute these reports to the larger business community.
� Performance management provides various services, such as the following examples, that you can use to evaluate business performance:
– Planning, analysis, and forecasting to automate budgeting and to perform driver-based forecasting, “what-if” scenario modeling, and multidimensional profitability analysis
– Profitability modeling and optimization to accelerate profitability analysis with an organization-wide approach that joins financial, operational, and strategic planning
– Performance reporting and scoring that helps you align strategy with execution, communicate goals, and monitoring of your performance against targets
� Predictive analytics helps you to uncover unexpected patterns and associations from all data within your organization and to develop predictive models to guide interactions. The process of applying a predictive model to a set of data is referred to as scoring the data. Predictive analytics consists of building predictive models, such as linear regression, k-means clustering, decision tree, and artificial neural network models.
� Analytical decision management focuses on the development and deployment of decision services, bringing intelligence, predictive insight, and optimization into repeatable decisions. It empowers workers and systems to gain the most from every transaction and to improve outcomes by using the following tools:
– Combined and integrated predictive models, rules, and decision logic to deliver recommended actions and extended predictive analytics
– What-if simulations to accommodate changing conditions based on incoming data
– A user interface that supports intuitive development, optimization, and implementation of targeted configurations, decisions, and content
� Risk management makes risk-aware decisions and meets regulatory requirements with improved risk management programs and methods. Risk management capabilities support the following areas:
– Actuarial modeling– Capital management– Collateral management– Credit risk– Governance, risk, and compliance– IT governance– Liquidity risk– Market risk– Operational risk– Policy and compliance management– Portfolio optimization
9
� Operational analytics provides line-of-business managers with actionable insights and recommendations through packaged analysis and reporting solutions, such as supply chain optimization. These solutions provide actionable, cross-functional insight that is drawn from information that is locked in enterprise resource planning (ERP) and other data sources.
This powerful business analysis software offers organizations an integrated view of performance across business functions and departments. It provides dashboards and interactive reporting so that business users at all levels can quickly get the insight they require, driving smarter decisions and outcomes that are better aligned with business strategy.
Optimization
Optimization means finding the best solution to a precisely defined situation. In particular, optimization requires measuring value and making specific decisions that maximize that value. An optimization solution is based on the following concepts:
� Targets
All decisions are not equal. By using measurable targets, or goals, you can rank alternative decisions. Targets are often defined as key performance indicators (KPIs), such as minimizing cost, maximizing revenue, maximizing margin, and minimizing delay. An optimization problem can have multiple targets that can conflict with each other, requiring trade-offs.
� Limits
Not all decisions are acceptable. Limits are on resources that distinguish acceptable from unacceptable combinations of decisions. Limits (or requirements) can arise from many circumstances:
– Physical laws, such as in-flow equals out-flow at a pumping station– Capacity, such as shelf space in a warehouse– Inputs, such as the amount of raw material that is available– Regulations, such as a maximum eight-hour, straight-time workday for workers– Policies, such as 99 percent of shipments must arrive on time
An optimization problem usually has multiple limits that can conflict with each other, requiring trade-offs. Limits must also be measured quantitatively.
� Choices
Decisions must be made, and there are many ways to make them. Alternatives increase the trade-offs that are needed to satisfy the limits and to achieve the best value of the targets. Decisions must be precisely specified, such as to determine how much of a particular product to produce on any day at a plant. Decisions must also be measurable.
Optimization problems can have two types of decisions:
– Continuous decisions represent quantities, such as the amount to produce. For example, a car manufacturer must decide whether to increase the number of cars to be produced at a particular plant.
– Discrete decisions represent choices, such as whether to open a warehouse at a specific location.
This distinction has enormous practical implications for solving optimization problems. Problems with only continuous decisions usually require much less computational effort than problems that have discrete decisions. However, the ability to represent discrete decisions gives optimization much of its business value.
10 Smarter Analytics: Making Better Decisions Faster with IBM Business Analytics and Optimization Solutions
� Data
Optimization deals with situations in which targets, limits, and choices are measurable. Therefore, optimization requires data. In fact, optimization extracts enormous value from data, and in some cases, justifies the effort to collect that data. For example, a package delivery company originally justified equipping its trucks with GPS to enable real-time route optimization.
Smarter Analytics support for decision-making
Many executives view BAO as highly technical and are reluctant to embrace solutions that they do not fully understand. However, you do not need a detailed understanding of the technology to use Smarter Analytics effectively. Rather, successful use of analytics to support decision-making depends on several other capabilities:
� Decision makers need decision support.
A decision maker wants tools that they can trust. Trust arises from understanding the recommendations that the tool makes and the reasons behind them. Trust is important when the recommendations depart from familiar patterns, which can happen when the business enters uncharted waters.
A decision maker frequently wants to test alternatives to the recommendation and to understand the trade-offs that are involved in the best use of limited resources. Conflicts often arise among the various targets and limits that can result in a failure to find a solution that satisfies all the criteria. In these situations, the decision maker usually relaxes some of the criteria in a controlled way until an acceptable solution is found. In a dynamic business environment, the decision makers have to revisit and revise plans as conditions change.
Finally, a decision maker must understand the analytical insights that are being provided. Decision makers are experts in their industry or line of business, but they are typically not statisticians, mathematicians, programmers, or data scientists. As a result, Smarter Analytics decision support tools must provide analytics that are consumable by and comprehensible to the decision maker. This requirement is accomplished by using visualizations that can highlight the signal within the data and then present the results in meaningful ways:
– Using business- or industry-appropriate terminology– Generating natural language descriptions instead of mathematical output– Intelligently determining metadata connections on behalf of the user– Enabling visually lead exploration and interactive discovery processes– Providing intuitive user experiences
� Decision makers need good decisions.
It might seem paradoxical to imply that optimal decisions might not be good decisions. However, remember that optimality is measured about a specific model (targets, limits, and choices), and any model represents only an approximation to the real world. Optimization experts strive to make models as accurate as possible, but the limits of the modeling process lead to mismatches, rendering the recommended decisions unimplementable. A good decision-support tool provides capabilities to ensure that optimal decisions are also good decisions.
Often, an optimization model represents objective criteria, such as physical laws or government regulations that must be enforced, and subjective criteria, such as customer service targets. If the optimization model proves to have no solution, the decision maker might need to relax some of the subjective criteria, perhaps at a cost, to attain feasibility.
Again, recalling that optimality is measured about a specific model, that model itself might become inaccurate because of uncertainties that govern the evolution of the business. In
11
that case, the optimal solution based on a nominal forecast might perform poorly under off-nominal conditions, which is a situation that is characterized as a fragile solution. In the face of such uncertainties, decision makers usually prefer a robust solution that performs well under various future conditions. They might willingly give up some of the potential value in the nominal solution to gain better performance under uncertain conditions.
� Decision makers need organizational decision processes.
In most organizations, multiple individuals with distinct roles participate in decision-making processes. A decision support tool must recognize these roles and provide capabilities that support the organization’s decision processes. As an organization grows, the amount of data and the number of people that support decision-making also grow, and the decision support tool must scale comfortably to accommodate that growth. Decision support applications that use corporate information technology must conform to the organization’s IT governance. Decision support applications for collaborative decision-making processes must enable multiple users to interact with it and with each other, sharing information and results.
� Decision makers need to respect the people and processes of the organization.
Adopting a decision-support application changes how an organization works. People need to learn to work in new ways, and they need to trust the new application. In addition to software engineering tasks, organizational tasks must also be accomplished when developing and deploying the new application. Ultimately, success or failure often depends on the usability and user acceptance of the new tool.
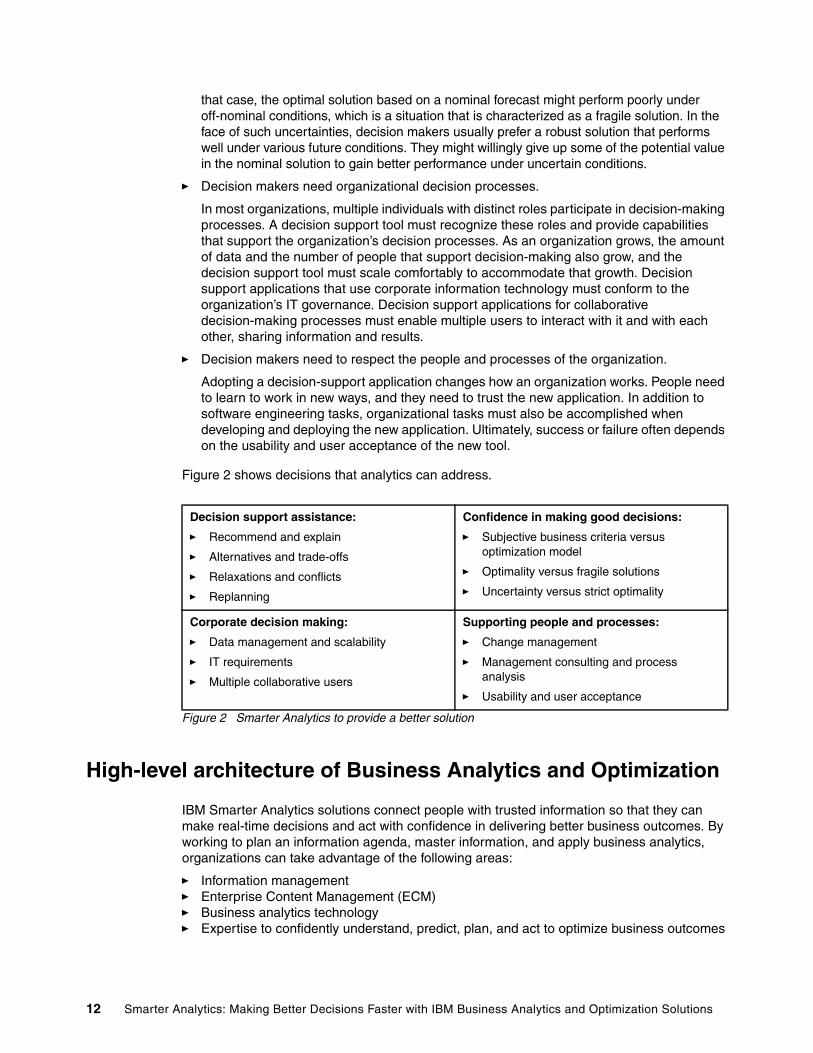
Figure 2 shows decisions that analytics can address.
Figure 2 Smarter Analytics to provide a better solution
High-level architecture of Business Analytics and Optimization
IBM Smarter Analytics solutions connect people with trusted information so that they can make real-time decisions and act with confidence in delivering better business outcomes. By working to plan an information agenda, master information, and apply business analytics, organizations can take advantage of the following areas:
� Information management� Enterprise Content Management (ECM)� Business analytics technology� Expertise to confidently understand, predict, plan, and act to optimize business outcomes
Decision support assistance:
� Recommend and explain
� Alternatives and trade-offs
� Relaxations and conflicts
� Replanning
Confidence in making good decisions:
� Subjective business criteria versus optimization model
� Optimality versus fragile solutions
� Uncertainty versus strict optimality
Corporate decision making:
� Data management and scalability
� IT requirements
� Multiple collaborative users
Supporting people and processes:
� Change management
� Management consulting and process analysis
� Usability and user acceptance
12 Smarter Analytics: Making Better Decisions Faster with IBM Business Analytics and Optimization Solutions
BAO uses information to enable enterprise transformation and creates sustainable differentiation by using the following tools:
� Advanced information management and analytical services� Deep industry and domain expertise� World-class solutions required to address complex business � Societal opportunities across an entity’s entire value chain
BAO empowers decision-making, action, and delivers a new intelligence through a combination of predictive insight, the power of smarter technology, and industry frameworks and accelerators to optimize decisions and improve performance. It provides a solid information and analytics foundation. It also goes beyond traditional capabilities with applied research and emerging technologies that address the needs of a more instrumented, interconnected, and intelligent world.
The need for Business Analytics and Optimization now
To compete in a world that is operating in fundamentally different ways, client organizations will shift to become far more fact-based enterprises. This shift away from decisions based on experience and instinct requires a deep analytic capability that is applied to this historic explosion of information. This ability to speed business decisions, understand their consequences, and predict outcomes with more certainty has never been more important than it is now and will become foundational in the future.
The application of business analytics is opening up important new possibilities for clients and promises to transform the way consulting is practiced. Smarter Analytics brings together sophisticated analytics from IBM Research with market-leading software platforms, deep industry insight, and business consulting expertise.
BAO has defined the following competency areas that bring together critical skills that are necessary to define and drive IBM leadership in the growing analytics market. Through these competencies, our clients can operate at a new level of intelligence and achieve “breakaway” levels.
� By using the IBM Smarter Analytics Strategy, clients can achieve business objectives faster, with less risk, and at a lower cost by defining and helping to implement improvements in how information is identified and acted upon. Applied enterprise-wide and deep within a business function, this strategy addresses both what to do and how to do it with actions that span policy, analytics, business process, organization, applications, and data.
� Business Intelligence and Performance Management empowers decision making and improved business performance through timely access, analysis, and reporting of actionable, accurate, and personalized information. This way, organizations can translate strategies into actionable forecasts or plans, monitor key financial and operational metrics, and improve insight, corresponding actions, and ultimately performance across the enterprise.
� Advanced Analytics and Optimization enhances organizational performance by applying advanced mathematical modeling, deep computing, simulation, data analytics, and optimization techniques to improve operational efficiency. Operational efficiency is accomplished by using analytical engines, data mining, and statistical models that address specific business-process areas.
13
� Enterprise Information Management applies methods, techniques, and technologies that address data architecture, extraction, transformation, movement, storage, integration, and governance of enterprise information and master data.
� Enterprise Content Management includes services, technologies and processes that are used to improve the capture, management, storage, access, preservation and electronic discovery of unstructured content. It focuses on management of unstructured content and on drawing value from content through improved information management, business processes, and advanced analytics. These capabilities help clients improve the performance of their businesses by reducing costs and driving efficiencies.
The importance of a reference architectureA reference architecture defines the checklist of components that typically make up a BAO solution. It provides a common solution framework for BAO across all sectors, industries, and solutions areas. With multiple reference architectures, it is critical to develop a common language and method as a way to collect thought leadership and assets over time. A reference architecture, which acts as a blue print, demonstrates what is in scope for a release, how capabilities will be delivered over time, and what capabilities exist versus which ones need to be developed. Reference architectures are evolutionary in nature.
A reference architecture is important because it describes the major foundational components or candidate building blocks of an end-to-end architecture target solution. It has the following characteristics:
� Spans all industries and all solution areas
� Provides a common language for describing architectural components
� Provides a framework for scope identification, roadmap definition, risk assessment, and gap assessment
� Provides a common framework for conceptualizing the problem space
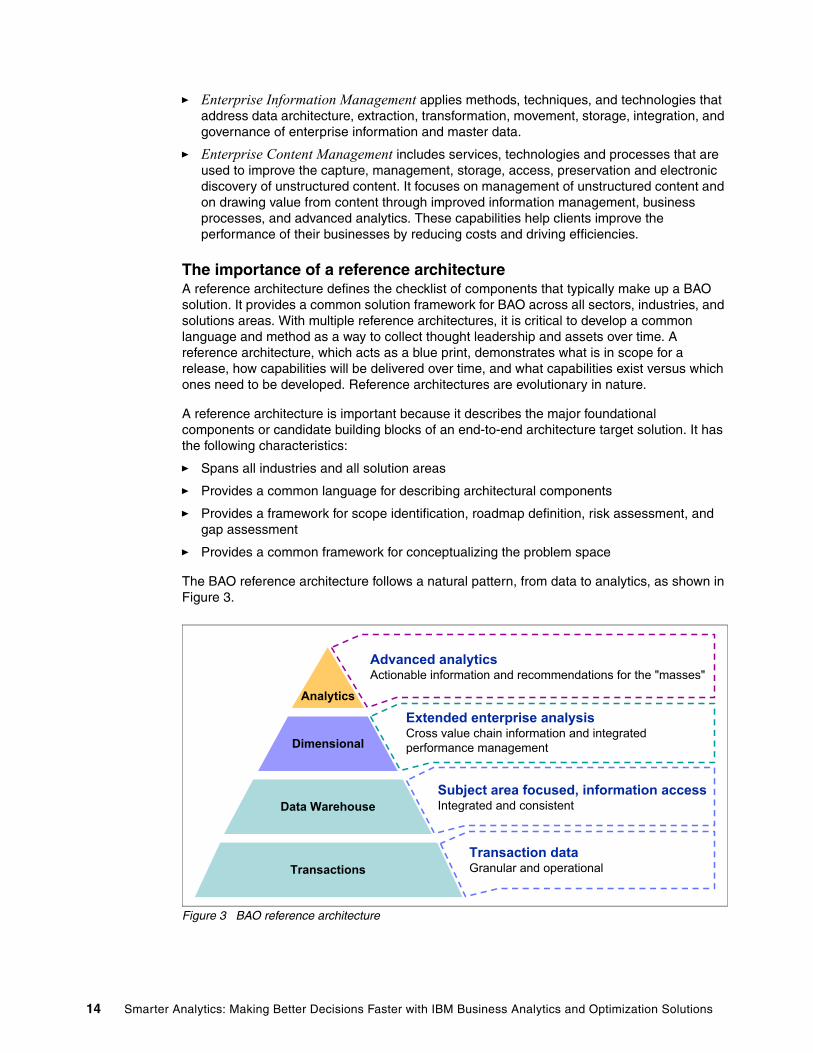
The BAO reference architecture follows a natural pattern, from data to analytics, as shown in Figure 3.
Figure 3 BAO reference architecture
Extended enterprise analysisCross value chain information and integrated performance management
Transaction dataGranular and operational
Dimensional
Transactions
Data Warehouse
Advanced analyticsActionable information and recommendations for the "masses"
Subject area focused, information accessIntegrated and consistent
Analytics
14 Smarter Analytics: Making Better Decisions Faster with IBM Business Analytics and Optimization Solutions
As an organization moves up the value chain of the business intelligence solution, it moves from collecting and reporting data to integration, to analytics, and finally to actionable embedded analytics.
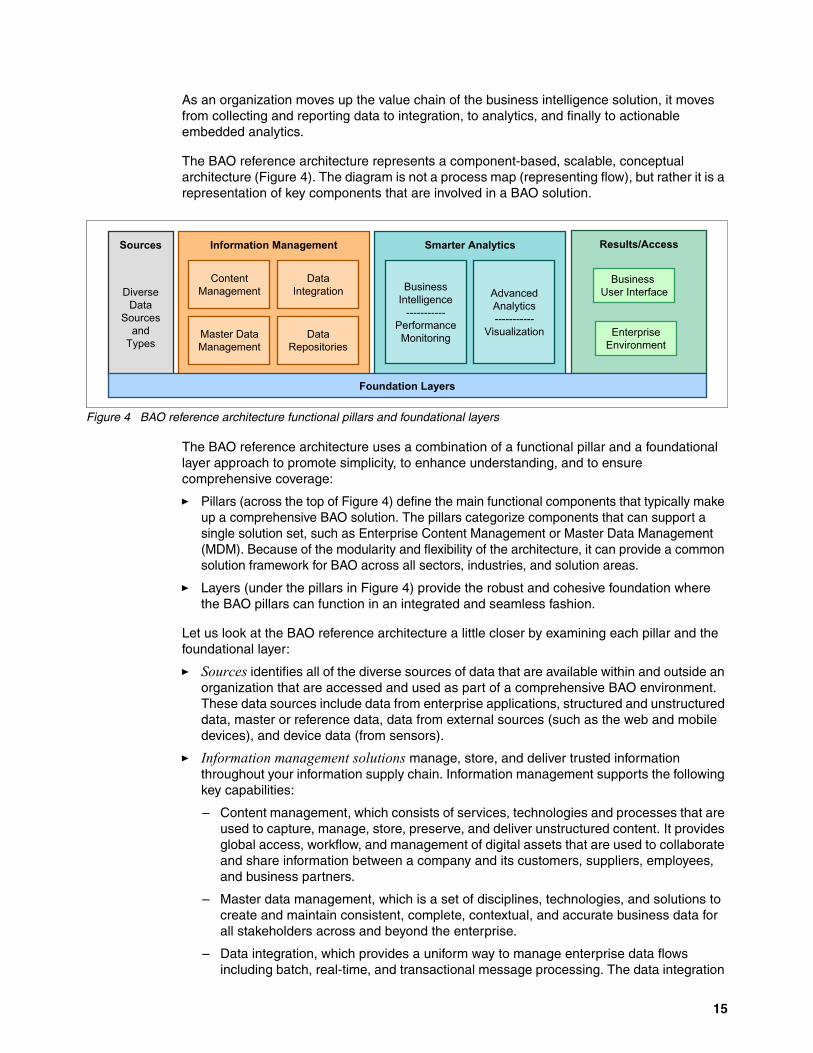
The BAO reference architecture represents a component-based, scalable, conceptual architecture (Figure 4). The diagram is not a process map (representing flow), but rather it is a representation of key components that are involved in a BAO solution.
Figure 4 BAO reference architecture functional pillars and foundational layers
The BAO reference architecture uses a combination of a functional pillar and a foundational layer approach to promote simplicity, to enhance understanding, and to ensure comprehensive coverage:
� Pillars (across the top of Figure 4) define the main functional components that typically make up a comprehensive BAO solution. The pillars categorize components that can support a single solution set, such as Enterprise Content Management or Master Data Management (MDM). Because of the modularity and flexibility of the architecture, it can provide a common solution framework for BAO across all sectors, industries, and solution areas.
� Layers (under the pillars in Figure 4) provide the robust and cohesive foundation where the BAO pillars can function in an integrated and seamless fashion.
Let us look at the BAO reference architecture a little closer by examining each pillar and the foundational layer:
� Sources identifies all of the diverse sources of data that are available within and outside an organization that are accessed and used as part of a comprehensive BAO environment. These data sources include data from enterprise applications, structured and unstructured data, master or reference data, data from external sources (such as the web and mobile devices), and device data (from sensors).
� Information management solutions manage, store, and deliver trusted information throughout your information supply chain. Information management supports the following key capabilities:
– Content management, which consists of services, technologies and processes that are used to capture, manage, store, preserve, and deliver unstructured content. It provides global access, workflow, and management of digital assets that are used to collaborate and share information between a company and its customers, suppliers, employees, and business partners.
– Master data management, which is a set of disciplines, technologies, and solutions to create and maintain consistent, complete, contextual, and accurate business data for all stakeholders across and beyond the enterprise.
– Data integration, which provides a uniform way to manage enterprise data flows including batch, real-time, and transactional message processing. The data integration
Sources
DiverseData
Sourcesand
Types
Smarter AnalyticsInformation Management
BusinessIntelligence
-----------PerformanceMonitoring
AdvancedAnalytics-----------
Visualization
DataIntegration
DataRepositories
ContentManagement
Master DataManagement
Results/Access
Foundation Layers
Business User Interface
EnterpriseEnvironment
15
components focus on the processes and environments that deal with the capture, qualification, processing, and movement of data. Data can flow directly to the consuming systems, or it can be prepared for storage in a data repository. The data integration components can process data in scheduled batch intervals or in real-time (streaming), near real-time, or just-in-time intervals. Data integration also supports distributed transaction staging, depending on the nature of the data and the business purpose for its use.
– Data repositories, which provide the essential foundation for the storage of operational and reshaped information that adds business value. The data repositories are not a replacement or replica of operational databases. Rather they are a complementary set of heterogeneous data repositories that reshape data into formats that are necessary for making decisions and managing a business. Not included in this group is software that has its own repositories that exclude users from direct access to them.
� Smarter Analytics helps organizations make better decisions by gleaning new insights from the massive amounts and diversity of data that are available to the enterprise. Smarter Analytics provides broad analytics capabilities that consist of the following software:
– Business intelligence and performance monitoring
These components empower decision-making and improve business performance. These results are provided through the timely access, analysis, and reporting of actionable, accurate, and personalized information.
Various applications can be supported, such as the following examples:
• Reporting• Balanced scorecards• Monitoring tools embedded in an operational process
The services support the entry points of reporting, visualization, planning, aligned strategic metrics, role-based visibility, search-based access, and alert or detect in-time actions.
Business intelligence and performance monitoring components typically consist of various technological components that are destined to meet specific needs. They are usually built from “best-of-breed” software and tools, such as data access models, query tools, and reporting tools for online analytical processing (OLAP).
– Advanced analytics
These components use data and models to provide better decision-making through data mining, modeling, scoring, and other methods. They empower you and your team to make more effective decisions and to build productive systems. These decisions and systems are based on having access to complete data, provide the ability to consider all available options, and apply predictions of outcomes and estimates of risk.
Advanced analytics typically consists of various technological components that are destined to meet specific needs:
• Predictive analytics analyzes patterns that are found in historical and current transaction data and attitudinal survey data to predict potential future outcomes. The core of predictive analytics relies on capturing relationships between explanatory variables and developing models to predict future outcomes.
• Prescriptive analytics helps decide the best course of action to take given your objectives, requirements, and constraints. It seeks to find the optimal solution given various choices, alternatives, and influences that might affect the outcome. An even more advanced area of prescriptive analytics uses stochastic optimization to also consider the uncertainty that might exist in the data that is used in the analysis.
16 Smarter Analytics: Making Better Decisions Faster with IBM Business Analytics and Optimization Solutions
• Descriptive analytics, also referred to as business intelligence, provides a clear understanding of what happened in the past. It uses visualization of key performance metrics or other data in a report or dashboard, with detailed view capabilities.
• Data mining is focused on extracting patterns and previous unknown facts from large volumes of data. It helps businesses uncover key insights, patterns, and trends in data. Then, it uses this insight to optimize business decisions. Data mining techniques can be divided into major categories. These categories include classification (arranging data into predefined groups), clustering (similar to classification but groups are not predefined), and regression (statistical analysis between a dependent variable and one or more independent variables).
• Simulation replicates a system, process, behavior, or business problem by using advanced analytical techniques. It is used to perform what-if analysis based on a set of parameters and input variables. Simulation models a business process to estimate the impact of management decisions or changes. By using simulation, companies can reproduce the dynamic behavior of a business process to analyze workloads and potential bottlenecks. Simulations are an example of how technology can aid smarter decision-making. It can predict, for example, what will happen to an area if a new major facility is built and lead to improved planning of roads and public transportation. By providing insight into the impact of decisions and design alternatives, simulation can help companies determine the optimal path forward.
• Text analytics provides analysis of textual patterns to provide business insight. This capability infers meaning from unstructured data.
• Optimization helps companies improve operational efficiency and provides centralized business rules in robust repositories that can be used across applications. Business optimization uses advanced mathematical techniques to find the best solution to a complex problem with many decision options and constraints. It is a powerful analytical tool for calculating the best possible utilization of resources to help achieve a desired business result, such as reducing cost or processing time, or increasing profit, serviceability, and throughput.
– Visualization
Visualization software helps clients to gain insight through diagrams, maps, schedules, charts, and images. Visualization techniques manipulate, transform, and render data based on points, lines, areas, volumes, images, or geometric primitives in any combination. Visualization is a powerful tool for understanding the behavior of complex systems. By building graphical displays, users can easily understand and interpret large volumes of data. Visualization applies to a range of business problems, which include financial trend analysis, monitoring of traffic and communication systems, analysis of social networks, and arrangement of large-scale text and image data.
� The Results/Access pillar provides the mechanisms for the user and the enterprise environment to take advantage of the results of the analysis.
– The user has access to the results that are presented by using business user interfaces that are supported by a range of technologies. These technologies include web services or applications, mashups, dashboards, portals, rich clients, and mobile devices. For example, results can be accessed by using a dashboard that supports business process management, call-center applications, or various e-commerce solutions.
– The enterprise environment consists of various system or application interactions with the analytical, informational, and reporting applications. Business applications and business processes can directly take advantage of the results. For example, materials requirements planning (MRP) can use results of analytics to adjust orders to suppliers,
17
ensuring that the right quantities are ordered because of changes to the overall business environment.
The foundational layer is a composite of various layers that provides key services and technologies to the overall solution:
� Business process management (BPM) helps organizations optimize business performance by aligning the organization with the needs of the client. It also helps businesses by discovering, documenting, automating, and continuously improving business processes to increase efficiency and reduce costs. In addition, BPM enables the incorporation of innovation, flexibility, and technology.
� Services management is a broad set of disciplines that better aligns the technology investments with the business objectives. The goal is to continually enhance and optimize the IT infrastructure, applications, policies, and procedures.
� Information governance is a cross-functional discipline that provides the context for organizations to be more comprehensive, consistent, and coherent in the way that they define, discuss, analyze, and use their data as information. It is the orchestration of people, process, and technology that enables an organization to use data as an enterprise asset.
� Collaboration enables people to find the right people or information when they need it. Effective collaboration helps people work smarter and drive business benefits by deepening valuable relationships, making better decisions faster, spurring innovation, and reducing costs.
� Security, privacy, and compliance provides the policies, practices, and controls that are used by an organization to mitigate risk and protect data assets. It also includes the method by which risks are identified, qualified, quantified, avoided, accepted, and mitigated. Compliance management helps reduce costs and overall risks that are associated with legal and regulatory edicts. Compliance management enables quicker and complete responses to legal and government inquiries, helping to improve overall compliance capabilities and ensuring maximum transparency.
� Transport and delivery enables information sharing, authoring, and analytics in a collaborative and timely manner. It is based on the concept of managing a data flow through a massively parallel processing (MPP) data integration framework, data flow messaging, and distributed transaction staging.
� Infrastructure is the physical hardware and foundational software, such as operating systems, security protocols, data storage, and network connectivity. The infrastructure is needed to build the support that allows the suite of applications to interact with the user community.
Meaning of the Business Analytics and Optimization reference architecture to BAO architectsThe BAO reference architecture generates a clear, consistent description of the architectural components that are needed to leverage data effectively in information solutions. A reference architecture in the field of enterprise architecture provides a blueprint solution architecture for a particular domain or industry. It also provides a consistent vocabulary to discuss implementations, often with the aim to stress consistency and commonality.
A BAO architect uses a reference architecture to arrive at a possible architectural solution, similar to the way that ships use their navigational system to charter through unknown areas to reach their destination. This usage, over a period, creates several reusable assets in various industries that provide consistency across all architectural solutions. The reference architecture is maintained to keep up with the changing product set, the functional pillars, and the foundational layers. Enterprises must use a well-defined reference architecture as a basis for designing all their analytics architectural solutions.
18 Smarter Analytics: Making Better Decisions Faster with IBM Business Analytics and Optimization Solutions
IBM customer case studies
IBM has provided BAO solutions to clients in various industries. For example, IBM created the The Smarter Supply Chain of the Future: Global Chief Supply Chain Officer Study, which identifies how technology, including BAO, plays an important role in streamlining the supply chain. You can find this paper at the following website:
http://www.ibm.com/de/processindustry/pdfs/cscostudy-metal-en.pdf
This section provides a sampling of some of the solutions that IBM has helped customers to create.
Business analytics solutions
This section highlights solutions that use IBM business analytics products.
Visa, Inc.Visa, Inc. saw an opportunity when their merchant customers wanted to deliver smart and more targeted offers. The solution uses a real-time analytics engine to provide more personalized offers instantly after a card swipe. With customer permission, Visa combines purchasing behavior with real-time location information to generate more targeted offers. Visa drives greater loyalty and engagement with enrolled customers by delivering relevant offers through mobile devices.
For more information about this case study, see “Visa: Smart offers help merchants achieve breakthrough marketing effectiveness” at:
http://www.ibm.com/software/success/cssdb.nsf/CS/SSAO-8X5KKD?OpenDocument&Site=corp&cty=en_us
Elie TahariElie Tahari has become a prominent global fashion brand. The company needed faster and more actionable information to speed decision-making and keep its processes in sync with the fast changing market. Elie Tahari used IBM Cognos® Business Intelligence to create a seamless reporting framework that provides granular, real-time information from the sales floor to its suppliers’ inventory and production schedules.
For more information about this case study, see “Elie Tahari combines fashion savvy with powerful analytics” at:
http://www.ibm.com/software/success/cssdb.nsf/CS/JSTS-82HSCN?OpenDocument&Site=corp&cty=en_us
Seton Healthcare FamilySeton Healthcare Family is a not-for-profit organization and is the leading provider of healthcare services in Central Texas. The organization needed to significantly reduce the occurrence of high-cost congestive heart failure (CHF) re-admissions. Seton Healthcare used IBM content and predictive analytics to improve care and lower CHF re-admissions. Seton Healthcare can now identify trends and patterns in patient care and outcomes, uncovering sometimes obscure correlations or disparities that are buried in years of medical records. With the ability to identify trends and patterns, the organization can dramatically improve diagnosis and treatment.
19
For more information about this case study, see “Seton Healthcare uses IBM Content and Predictive Analytics to improve care and lower Congestive Heart Failure (CHF) readmissions” at:
http://www.ibm.com/software/success/cssdb.nsf/CS/DJOY-8SCQMX?OpenDocument&Site=corp&cty=en_us
Optimization solutions
This section highlights solutions that use IBM optimization products.
INDEVALINDEVAL, Mexico’s central securities depository, was operating with 9 - 14 different settlement systems, complicating settlement of transaction and limiting liquidity. Financial institutions were forced to reserve substantial financial resources to settle securities transactions, raising costs for smaller players and making it difficult for them to participate.
INDEVAL devised a new securities settlement system to maximize the value of settled trades that come from myriads of securities transactions in near real time. IBM ILOG® CPLEX® Optimization Studio was used develop optimization models.
For more information about this case study, see “INDEVAL saves Mexican banks 240 million USD in 18 months” at:
http://www.ibm.com/software/success/cssdb.nsf/CS/CPOR-8C8MGZ?OpenDocument&Site=optimization&cty=en_us
XM Compañía de Expertos en Mercados S.A. E.S.PXM Compañía de Expertos en Mercados S.A. E.S.P. (XM) operates the Colombian National Interconnected System and administers the Wholesale Energy Market. XM coordinates, supervises, and controls the power system to ensure safe, reliable, and economic operation. The Colombian electricity sector needed to match the supply to the demands of the distribution companies for the following day. The primary objective was to minimize the total cost of generation. XM uses IBM ILOG optimization software to determine the most efficient, low-cost, and reliable operation of the Colombian power system.
For more information about this case study, see “XM keeps the power on with IBM ILOG optimization software” at:
http://www.ibm.com/software/success/cssdb.nsf/CS/CPOR-8EEUV4?OpenDocument&Site=optimization&cty=en_us
Odyssey Logistics & Technology CorporationHeadquartered in Danbury, Connecticut, Odyssey Logistics & Technology Corporation (OL&T) is a leading global logistics service provider. The company serves customers in North America, Europe, and Asia. OL&T wanted a next-generation supply chain management platform to help provide end-to-end transportation solutions and reduce costs for customers. OL&T created the platform by using IBM BPM, IBM WebSphere® ILOG JRules, IBM WebSphere Partner Gateway, and IBM ILOG CPLEX Optimization Studio software.
For more information about this case study, “Odyssey Logistics & Technology Corporation increases agility: Global company uses IBM WebSphere software to optimize processes and meet customer needs” at:
http://www.ibm.com/software/success/cssdb.nsf/CS/RNAE-8SVEWY?OpenDocument&Site=optimization&cty=en_us
20 Smarter Analytics: Making Better Decisions Faster with IBM Business Analytics and Optimization Solutions
To view a video about this client’s solution, see “Odyssey Transportation & Logistics Corporation client reference” at:
http://www.ibm.com/software/success/cssdb.nsf/CS/CPAR-8TWR3S?OpenDocument&Site=optimization&cty=en_us
Summary
Smarter Analytics (also known referred to as Business Analytics and Optimization) has been extended from science and engineering domains into the world of business. These technologies are being fueled by the ever-increasing availability of data, computational power, and the need by businesses to make better decisions based on more appropriate choices.
By using business analytics, organizations can quickly and confidently make better business decisions about the specific actions or strategies to implement next. Organizations make this activity possible by tapping into their information and institutional knowledge to predict future events and to assess all potential courses of action. Optimization helps businesses create the best possible plans, explore alternatives, understand trade-off, and respond to changes in business operations.
IBM can help you to realize your strategies through information management, advanced analytics, and process management and to take advantage of the power of smarter technology. IBM provides leadership in the new era of fact-driven business management, and its advanced analytics and optimization capabilities are a marketplace differentiator. In collaboration with clients, IBM continues to discover new areas where these technologies can be applied. IBM has the resources to advance these technologies within their various research facilities and labs to provide additional capabilities and services.
Start exploring the potential of these technologies for your business. Information is more critical to the success of your business, and BAO solutions from IBM can help you make better decisions faster and enable you to surpass your competition.
Other resources for more information
This section lists websites with additional information about Smarter Analytics and BAO.
� IBM Smarter Analytics
http://www.ibm.com/analytics/us/en
� What is big data?
http://www.ibm.com/software/data/bigdata
� The IT infrastructure that enables an IBM Smarter Planet®
http://www.ibm.com/smarter-computing/us/en/analytics-infrastructure
� IBM ILOG Optimization and Analytical Decision Support Solutions
http://www.ibm.com/software/websphere/products/optimization
21
The team who wrote this guide
This guide was produced by a team of specialists from around the world working with the International Technical Support Organization (ITSO).
Dr. Jeremy Bloom is the IBM Product Line Manager for IBM ILOG ODM Enterprise. He has more than 25 years of business experience in applying operations research and optimization. He is responsible for developing and executing the product strategy for implementing enterprise decision support solutions by using optimization and advanced analytics. He previously was responsible for product marketing for optimization and serves as a subject matter expert for Energy and Utilities and for Banking and Financial Services. His experience also includes research and development for the energy power industry in integrated resource planning, retail market tools, distributed resources, and asset management. Earlier in his career, he taught operations research at Cornell University. Jeremy received his undergraduate education in electrical engineering from Carnegie-Mellon University and his graduate degrees in operations research from the Massachusetts Institute of Technology.
Murthy Rallapalli is an Executive Architect in the areas of cloud security, business analytics architectures, and cloud enablement based in Atlanta, Georgia. He has over 20 years of experience in the IT field. His areas of expertise include web architectures, business analytics, security, and privacy. He authored three IBM Redbooks® publications on web architectures, security, and privacy and published extensively in various peer review journals. Murthy holds a Master of Information Systems degree from Regis University and is pursuing a PhD (doctorate degree) in the area of web privacy from Stevens Institute of Technology, New Jersey.
Barry Rosen is an IBM senior certified, Global Executive Architect of Information Management Architecture for IBM Software Group. He has over 25 years of experience in banking, financial services, and financial markets. He has in-depth expertise in the advancement of industry-leading architectures in information and data management and various aspects of data handling, processing, and analysis. He has co-written and contributed to numerous Redbooks publications and white papers. Barry holds a Master of Engineering Management and Computer Information Systems degree from Northeastern University. He also holds a Chemical Engineering degree from Worcester Polytechnic Institute.
Dr. Hans Schlenker is an IBM Technical Sales Specialist for IBM ILOG Optimization products and solutions. He has delivered projects and solutions for many companies in various industries including automotive, industrial production, logistics, banking, insurance, and energy. Hans has more than 15 years experience in algorithm development, IT architectures, optimization modeling, and solution design. He currently is on an IBM research assignment at the Karlsruhe Institute of Technology, where he researches real-world optimization projects. Hans holds a Master in Computer Science degree from Ludwig Maximilians Universität, Munich, and a PhD in industrial engineering and computer science from Technische Universität, Berlin.
Thanks to the following people for their contributions to this project:
Janine BrowderIBM US, Software Group, Program Director
Aimee Emery-OrtizIBM US, Software Group, Project Manager
Daniel (Dan) SutherlandIBM US, Global Business Services®, Distinguished Engineer
Karolina MarzantowiczIBM Poland, Executive Architect
22 Smarter Analytics: Making Better Decisions Faster with IBM Business Analytics and Optimization Solutions
Aleksander OleszkiewiczIBM Poland, Channel Technical Manager
Grega KespretIBM Slovenia, IT Specialist
LindaMay PattersonIBM ITSO, Rochester, MN
Now you can become a published author, too!
Here’s an opportunity to spotlight your skills, grow your career, and become a published author—all at the same time! Join an ITSO residency project and help write a book in your area of expertise, while honing your experience using leading-edge technologies. Your efforts will help to increase product acceptance and customer satisfaction, as you expand your network of technical contacts and relationships. Residencies run from two to six weeks in length, and you can participate either in person or as a remote resident working from your home base.
Find out more about the residency program, browse the residency index, and apply online at:
ibm.com/redbooks/residencies.html
Stay connected to IBM Redbooks
� Find us on Facebook:
http://www.facebook.com/IBMRedbooks
� Follow us on Twitter:
http://twitter.com/ibmredbooks
� Look for us on LinkedIn:
http://www.linkedin.com/groups?home=&gid=2130806
� Explore new Redbooks publications, residencies, and workshops with the IBM Redbooks weekly newsletter:
https://www.redbooks.ibm.com/Redbooks.nsf/subscribe?OpenForm
� Stay current on recent Redbooks publications with RSS Feeds:
http://www.redbooks.ibm.com/rss.html
23

24 Smarter Analytics: Making Better Decisions Faster with IBM Business Analytics and Optimization Solutions

Notices
This information was developed for products and services offered in the U.S.A.
IBM may not offer the products, services, or features discussed in this document in other countries. Consult your local IBM representative for information on the products and services currently available in your area. Any reference to an IBM product, program, or service is not intended to state or imply that only that IBM product, program, or service may be used. Any functionally equivalent product, program, or service that does not infringe any IBM intellectual property right may be used instead. However, it is the user's responsibility to evaluate and verify the operation of any non-IBM product, program, or service.
IBM may have patents or pending patent applications covering subject matter described in this document. The furnishing of this document does not grant you any license to these patents. You can send license inquiries, in writing, to: IBM Director of Licensing, IBM Corporation, North Castle Drive, Armonk, NY 10504-1785 U.S.A.
The following paragraph does not apply to the United Kingdom or any other country where such provisions are inconsistent with local law: INTERNATIONAL BUSINESS MACHINES CORPORATION PROVIDES THIS PUBLICATION "AS IS" WITHOUT WARRANTY OF ANY KIND, EITHER EXPRESS OR IMPLIED, INCLUDING, BUT NOT LIMITED TO, THE IMPLIED WARRANTIES OF NON-INFRINGEMENT, MERCHANTABILITY OR FITNESS FOR A PARTICULAR PURPOSE. Some states do not allow disclaimer of express or implied warranties in certain transactions, therefore, this statement may not apply to you.
This information could include technical inaccuracies or typographical errors. Changes are periodically made to the information herein; these changes will be incorporated in new editions of the publication. IBM may make improvements and/or changes in the product(s) and/or the program(s) described in this publication at any time without notice.
Any references in this information to non-IBM Web sites are provided for convenience only and do not in any manner serve as an endorsement of those Web sites. The materials at those Web sites are not part of the materials for this IBM product and use of those Web sites is at your own risk.
IBM may use or distribute any of the information you supply in any way it believes appropriate without incurring any obligation to you.
Any performance data contained herein was determined in a controlled environment. Therefore, the results obtained in other operating environments may vary significantly. Some measurements may have been made on development-level systems and there is no guarantee that these measurements will be the same on generally available systems. Furthermore, some measurements may have been estimated through extrapolation. Actual results may vary. Users of this document should verify the applicable data for their specific environment.
Information concerning non-IBM products was obtained from the suppliers of those products, their published announcements or other publicly available sources. IBM has not tested those products and cannot confirm the accuracy of performance, compatibility or any other claims related to non-IBM products. Questions on the capabilities of non-IBM products should be addressed to the suppliers of those products.
This information contains examples of data and reports used in daily business operations. To illustrate them as completely as possible, the examples include the names of individuals, companies, brands, and products. All of these names are fictitious and any similarity to the names and addresses used by an actual business enterprise is entirely coincidental.
COPYRIGHT LICENSE:
This information contains sample application programs in source language, which illustrate programming techniques on various operating platforms. You may copy, modify, and distribute these sample programs in any form without payment to IBM, for the purposes of developing, using, marketing or distributing application programs conforming to the application programming interface for the operating platform for which the sample programs are written. These examples have not been thoroughly tested under all conditions. IBM, therefore, cannot guarantee or imply reliability, serviceability, or function of these programs.
© Copyright IBM Corp. 2012. All rights reserved. 25
This document, REDP-4886-00, was created or updated on October 1, 2012.
Trademarks
IBM, the IBM logo, and ibm.com are trademarks or registered trademarks of International Business Machines Corporation in the United States, other countries, or both. These and other IBM trademarked terms are marked on their first occurrence in this information with the appropriate symbol (® or ™), indicating US registered or common law trademarks owned by IBM at the time this information was published. Such trademarks may also be registered or common law trademarks in other countries. A current list of IBM trademarks is available on the Web at http://www.ibm.com/legal/copytrade.shtml
The following terms are trademarks of the International Business Machines Corporation in the United States, other countries, or both:
Cognos®CPLEX®Global Business Services®IBM®
ILOG®Redbooks®Redguide™Redbooks (logo) ®
Smarter Planet®WebSphere®
The following terms are trademarks of other companies:
Other company, product, or service names may be trademarks or service marks of others.
®
Redbooks®
26 Smarter Analytics: Making Better Decisions Faster with IBM Business Analytics and Optimization Solutions
![Faster, Smarter Intelligence Improves Service Operations. and Analytics[1].pdf · Faster, Smarter Intelligence Improves . Service Operations. From forecasting and predictive modeling](https://img.pdfslide.us/doc/110x75/60065bedcc1ffb7bdf2fc04d/faster-smarter-intelligence-improves-service-and-analytics1pdf-faster-smarter.jpg)