Embed Size (px)
Citation preview

Smart Walker Design
Final Report
ECE 480
Team Four
Trevor Dirheimer
Jeffrey Hancock
Dominic Hill
Yakov Kochubievsky
Sean Moore
Facilitator:
Dr. Virginia Ayres
April 29th, 2015

1
Executive Summary
David is a bright, successful Michigan State University undergraduate student who is visually
and motorically challenged. He uses a walker for assistance while traveling through campus. He
recently fell down an unfamiliar flight of stairs on campus because he was not able to see the
drop-off as he approached. He then used this experience as inspiration for the ECE 480 Team
Four Smart Walker Design Project in an attempt to find a solution. ECE 480 Team Four
designed and built an intelligent sensor and feedback device to attach to David’s walker. This
device will alert David, allowing him to stop from pushing the walker forward into dangerous
drop-offs. The Smart Walker device consists of two sensors with microcontroller integration and
a rechargeable power supply. Experiments were designed, with David’s active participation, to
determine the amount of time and distance needed to stop safely. Team Four also worked with
David to test and implement the form of feedback he prefers for being warned of oncoming drop-
offs. David and others with mobility and/or visual disabilities will benefit from the Smart Walker
device through increased confidence, safety, and independence.
2
Acknowledgements
The members of ECE 480 Design Team Four would like to acknowledge the MSU Resource
Center for Persons with Disabilities (RCPD), which was made possible through generous
contributions from Marathon Petroleum, for presenting us with a chance to improve the life of a
fellow Spartan and truly demonstrate the RCPD’s mission of maximizing ability and
opportunity. Team Four would also like to extend gratitude to Stephen Blosser for his numerous
contributions throughout the project. His skill and years of experience were crucial in
overcoming several engineering challenges that were encountered in the design process. Team
Four would like to thank our facilitator, Dr. Virginia Ayres, for her guidance in completing this
project and for her assistance and encouragement in submitting our design to the National
Institute of Biomedical Imaging and Bioengineering’s Design by Biomedical Undergraduate
Teams (DEBUT) competition. Team Four would also like to thank David Schacher-Hill and
Susan Langendonk for being the inspiration behind the project’s creation. Team Four would
finally like to thank Dennis Corey, from Pulsed Light 3D, who supplied Team Four with the
LiDAR sensors that were used in the final design at a discounted rate.

3
Table of Contents
Chapter 1: Introduction and Background: .............................................................................. 5
Chapter 2: Solution Space and Approach................................................................................ 6
Chapter 2.1: FAST Diagram .............................................................................................................6
Chapter 2.2: Design for Six Sigma (DFSS) Process .............................................................................7
Chapter 2.3: Feasibility Matrix for Solution .....................................................................................9
Chapter 2.4: Budget and Expenses ................................................................................................ 11
Chapter 2.4.1: Research and Development Expenses ........................................................................ 11
Chapter 2.4.2: Prototype Expenses ..................................................................................................... 13
Chapter 2.4.3: Expenses of Components at Production Level (Estimate) .......................................... 13
Chapter 2.5: Development Timeline .............................................................................................. 14
Chapter 3: Technical Description of Smart Walker Device ..................................................... 16
Chapter 3.1: Prototype #1: TI MSP430G2253 Microcontroller & HCSR04 Ultrasonic Sensors ........... 16
Chapter 3.1.1: Prototype #1: Hardware Design and Implementation ................................................ 17
Chapter 3.1.2: Software Design and Implementation ........................................................................ 18
Chapter 3.2: Prototype #2: Parallax Propeller Activity Board Microcontroller and PING))) Ultrasonic
Distance Sensors .......................................................................................................................... 19
Chapter 3.2.1: Hardware Design and Implementation ....................................................................... 21
Chapter 3.2.2: Software Design and Implementation ........................................................................ 23
Chapter 3.2.3: Mounting and Fixture.................................................................................................. 24
Chapter 3.3: Exploring Infrared Sensors with Stephen Blosser’s SCATIR Device .............................. 28
Chapter 3.4: Final Prototype: Arduino Nano Microcontroller and LiDAR Lite Laser Sensors ............. 28
Chapter 3.4.1: Hardware Design and Implementation ....................................................................... 31
Chapter 3.4.2: Software Design and Implementation ........................................................................ 35
Chapter 3.4.3: Mounting and Fixture.................................................................................................. 37
Chapter 4: Proof of Functional Smart Walker Device Design ................................................. 41
Chapter 4.1: Testing Prototype #1: TI MSP430G2253 Microcontroller and HCSR04 Ultrasonic Sensors
.................................................................................................................................................... 42
Chapter 4.2: Testing Prototype #2: Parallax Propeller Activity Board Microcontroller and PING)))
Ultrasonic Distance Sensors .......................................................................................................... 43
Chapter 4.3: Testing Final Prototype: Arduino Nano Microcontroller and LiDAR Lite Laser Sensors . 44
Chapter 4.3.1: Arduino Nano MIcrocontroller and LiDAR Laser Lite Sensors ..................................... 45
Chapter 4.3.2: Threshold Testing ........................................................................................................ 45
Chapter 4.3.3: Feedback system ......................................................................................................... 49
Chapter 4.3.4: Anker Power Supply ............................................................................................... 49
Chapter 5 – Smart Walker Device: Final Design .................................................................... 50
Chapter 5.1 - Summary ................................................................................................................. 50
Chapter 5.2 - Lessons Learned ....................................................................................................... 50
Chapter 5.3 - Improvements to Consider ....................................................................................... 51

4
Appendix 1:Individual Roles and Responsibilities ................................................................. 52
Chapter 6.1: Trevor Dirheimer ...................................................................................................... 52
Chapter 6.2: Jeffrey Hancock ........................................................................................................ 53
Chapter 6.3: Dominic Hill .............................................................................................................. 53
Chapter 6.4: Yakov Kochubievsky.................................................................................................. 53
Chapter 6.5: Sean Moore .............................................................................................................. 54
Appendix 2: References and Data Sheets ............................................................................. 55
Website References...................................................................................................................... 55
Data Sheets .................................................................................................................................. 55
Appendix 3 – Schematics, Programming Code, and Other Essential Figures .......................... 56

5
Chapter 1: Introduction and Background
Team Four’s objective was to design a device which would be attached to a typical walker used
by David and other individuals with varying levels of disabilities. This device would serve as an
audible warning system for a user with vision loss when approaching a sudden change in
elevation, stairs, or other drop-offs. The operating principle of the Smart Walker device is that
sudden changes of elevation can be detected from a distance sensor mounted on the top bar of a
rollator style walker (Figure 1.0.1).
Figure 1.1: Merits 463 Walker
While in operation the sensor would sample constantly the distance to the floor 4’0” to 5’0”
ahead of the walker. If the sensors sample a sudden increase in the distance to the floor ahead, an
audible alarm would sound indicating the hazard of falling. The inspiration for this project came
in as a request from a gentleman named David Schaar-Hill. David is a fellow Spartan student
majoring in Interdisciplinary Social Science who suffers from vision loss and uses a walker as a
mobility aid. Below is David’s account of an accident he experienced that inspired the idea of the
Smart Walker.
“I am a MSU student associated with the RCPD. I have significant visual and mobility
disabilities, plus a moderate hearing loss in the high frequencies. I use a walker on campus,
primarily for safety. Last year, I was walking in Brody Hall in a part of the building that I was
unfamiliar with. As I was walking forward with my walker, I didn't see a flight of four stairs in
front of me. As I approached the first stair, the wheels of my walker lurched forward, pulling me
down the stairs with it. I was glad this wasn't a full set of stairs, but it was in fact quite a warning
sign. Unexpected drop-offs and/or changes in the terrain pose the biggest hindrance to my
independence and accessibility throughout campus and the community. My rehab doctor

6
wondered if a simple "Roomba" knows not to go over an edge, why can't my walker? If there was
a device that I could attach to my walker to warn me of changes in the terrain, I would have
avoided the previously described accident. Anyone with mobility and/or visual disabilities could
benefit from such an innovation tremendously, increasing confidence, safety and independence.”
-David
There is not a device on the walker market that can detect changes in elevation from a safe
distance. The design and methods used to create The Smart Walker device will be a
breakthrough for the medical device industry, as well as any user with disabilities of this nature.
The success of this design will prove to be versatile as it could also be used by users with visual
and motoric disabilities across multiple demographics including senior citizens, stroke patients
with vision loss and/or balance impairment and veterans also with vision loss and/or balance
impairment due to traumatic brain injuries. Quality of life for all users will improve by offering
them a device that will ensure their safety, as well as offering them further confidence and
personal independence.
Chapter 2: Solution Space and Approach
Chapter 2.1: FAST Diagram
In order to begin the development of the Smart Walker, the problem statement and end goals of
the project were closely examined. A FAST diagram (FIGURE X) was created to decompose the
problem into subsystems that the Smart Walker design would need to incorporate, as the first
step to determine what performance and integration issues would need to be resolved:
Figure 2.1.1: FAST Diagram

7
This diagram provided Team Four with a high level view of the overall functionality and purpose
of the Smart Walker device. Subcategories of functions were created and organized in such a
manner that asking “How?” or “Why?” in each direction, showed the complete path needed for
progression through all significant aspects of development. Analyzing each successive
subsystem of operation in both the how and why direction, provided clarity of design
requirements and enabled concise formulation of development plans.
Chapter 2.2: Design for Six Sigma (DFSS) Process
The customer’s viewpoint had to be fully understood in order for development of the Smart
Walker device to be fully optimized,. Utilization of the DFSS (FIGURE X) gave Team Four a
plan for design according to the critical customer requirements as presented by David.
Figure 2.2.1: Voice of Customer Chart
The Smart Walker concept had already been clearly defined by David. However the more
specific voice of customer had to be identified, including critical customer requirements, to
enable creation of the actual device. The highest priority customer requirement was to issue a
8
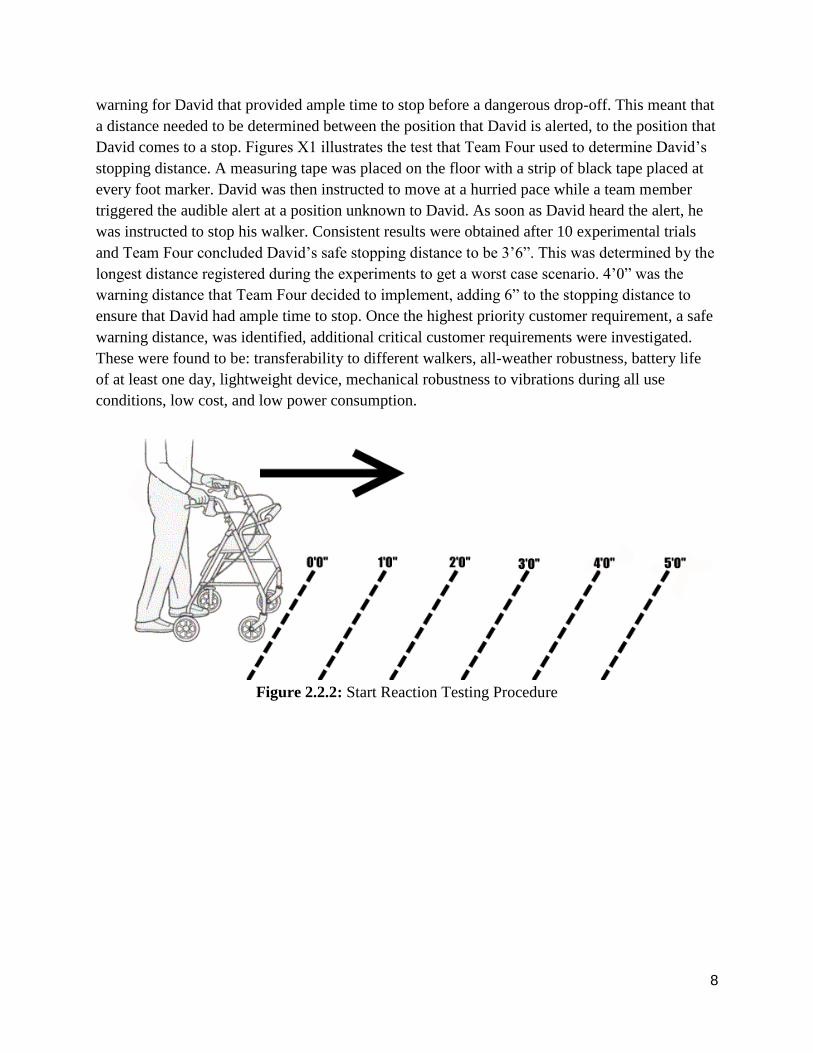
warning for David that provided ample time to stop before a dangerous drop-off. This meant that
a distance needed to be determined between the position that David is alerted, to the position that
David comes to a stop. Figures X1 illustrates the test that Team Four used to determine David’s
stopping distance. A measuring tape was placed on the floor with a strip of black tape placed at
every foot marker. David was then instructed to move at a hurried pace while a team member
triggered the audible alert at a position unknown to David. As soon as David heard the alert, he
was instructed to stop his walker. Consistent results were obtained after 10 experimental trials
and Team Four concluded David’s safe stopping distance to be 3’6”. This was determined by the
longest distance registered during the experiments to get a worst case scenario. 4’0” was the
warning distance that Team Four decided to implement, adding 6” to the stopping distance to
ensure that David had ample time to stop. Once the highest priority customer requirement, a safe
warning distance, was identified, additional critical customer requirements were investigated.
These were found to be: transferability to different walkers, all-weather robustness, battery life
of at least one day, lightweight device, mechanical robustness to vibrations during all use
conditions, low cost, and low power consumption.
Figure 2.2.2: Start Reaction Testing Procedure
9
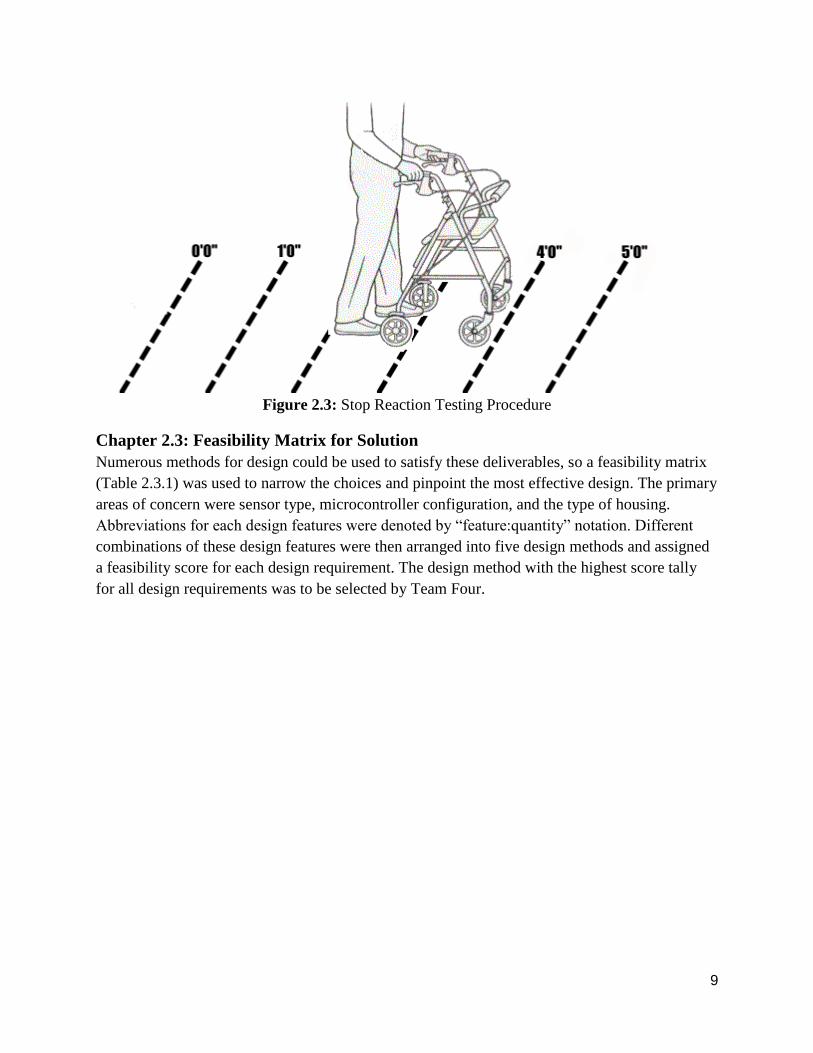
Figure 2.3: Stop Reaction Testing Procedure
Chapter 2.3: Feasibility Matrix for Solution
Numerous methods for design could be used to satisfy these deliverables, so a feasibility matrix
(Table 2.3.1) was used to narrow the choices and pinpoint the most effective design. The primary
areas of concern were sensor type, microcontroller configuration, and the type of housing.
Abbreviations for each design features were denoted by “feature:quantity” notation. Different
combinations of these design features were then arranged into five design methods and assigned
a feasibility score for each design requirement. The design method with the highest score tally
for all design requirements was to be selected by Team Four.

10
Table 2.3.1: Feasibility Matrix

11
Table 2.3.2: Feasibility Matrix Legend
Using this matrix, Team Four came to a conclusion as to what the most effective design would
be. The Smart Walker device design would utilize two LiDAR sensors along with an Arduino 32
kB microcontroller to trigger an audible alarm, which would be powered by 13000 mAh power
supply, all of which would be housed in a shop manufactured lightweight yet sturdy aluminum
harness.
Team Four market investigations led to the conclusion that there is no comparable device
currently on the market. Therefore introduction of The Smart Walker device as a product into the
marketplace would fill an important gap with little to no competition. The versatility of this
product will also benefit multiple types of users, over multiple user demographics.
Chapter 2.4: Budget and Expenses
Michigan State University and The College of Engineering allocated $500 in budget money for
each team to use for product development. During the course of development, additional budget
money was needed, so the budget for Team Four was increased to $660. Team Four chose to
utilize as much of this budget as possible in order to explore all design options. The vast majority
of these expenses were allocated to research and development, with the intent of reusing the parts
utilized in this portion of the design process for the final prototype build.
Chapter 2.4.1: Research and Development Expenses
Table 2.4.1.1 presents the research and development cost breakdown over the entire product
development timeframe. It is noted that these expenses are the costs associated with Michigan
State University facilitating the purchase of such components.
US Ultrasonic Sensor
LD LiDAR Sensor
32kB TI Microcontroller
3D 3D Printed Case
AL Aluminum Harness
9VB 9V Battery

12
Component Qty. Cost ($)
PING))) Ultrasonic Distance Sensor 5 124.95
HC-SR04 Ultrasonic Sensor 5 14.95
Merits 463 Walker 1 140.00
Propeller Activity Board 1 49.99
Anker 15000mAh Power Supply 1 62.99
Optek Laser Diode 1 12.69
Ada Fruit SOIC to DIP Adapter 3 4.50
Arduino Nano Microprocessor 1 28.66
LiDAR Lite Laser Sensor 2 110.00
Anker (5V @ 3A) 13000mAh Supply 1 31.99
NXP Semiconductors Transistor 2 2.01
Piezo Speaker* 2 0.00
Housing/Harness* 1 0.00
TOTAL N/A 582.73
*Piezo speaker and housing provided by Stephen Blosser
Table 2.4.1.1: Research and Development Expenses
13
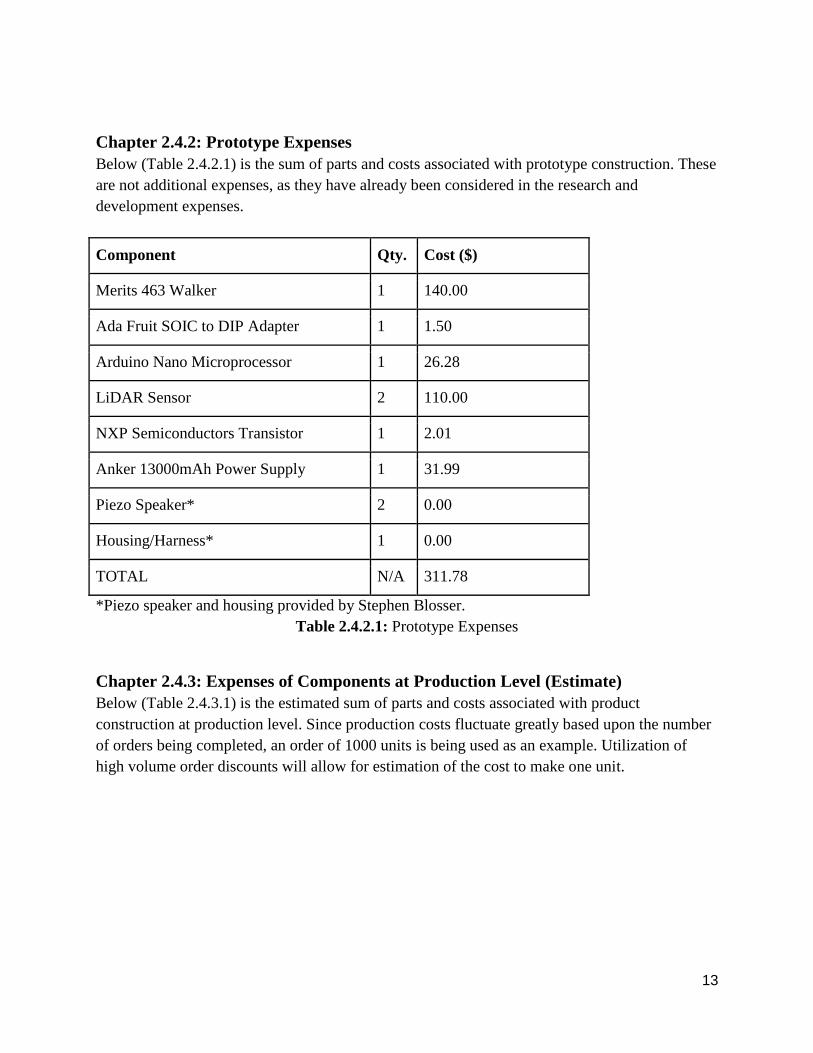
Chapter 2.4.2: Prototype Expenses
Below (Table 2.4.2.1) is the sum of parts and costs associated with prototype construction. These
are not additional expenses, as they have already been considered in the research and
development expenses.
Component Qty. Cost ($)
Merits 463 Walker 1 140.00
Ada Fruit SOIC to DIP Adapter 1 1.50
Arduino Nano Microprocessor 1 26.28
LiDAR Sensor 2 110.00
NXP Semiconductors Transistor 1 2.01
Anker 13000mAh Power Supply 1 31.99
Piezo Speaker* 2 0.00
Housing/Harness* 1 0.00
TOTAL N/A 311.78
*Piezo speaker and housing provided by Stephen Blosser.
Table 2.4.2.1: Prototype Expenses
Chapter 2.4.3: Expenses of Components at Production Level (Estimate)
Below (Table 2.4.3.1) is the estimated sum of parts and costs associated with product
construction at production level. Since production costs fluctuate greatly based upon the number
of orders being completed, an order of 1000 units is being used as an example. Utilization of
high volume order discounts will allow for estimation of the cost to make one unit.

14
Component Qty. Cost ($)
Ada Fruit SOIC to DIP Adapter 1 1.50
Arduino Nano Microprocessor 1 28.86
LiDAR Sensor 2 110.00
NXP Semiconductors Transistor 1 1.43
Anker 13000mAh Power Supply 1 31.99
Piezo Speaker 2 .99
Housing/Harness (Plastic Injection) 1 6.00
TOTAL N/A 314.36
*Mass order discounts not available to public for Arduino Nano Microprocessor, Pulsed Light 3D LiDAR Sensor, or Anker
13000mAh Power Supply.
Table 2.4.3.1: Estimated Expenses of Components at Production Level
In order to make mass production of this product more cost effective, seeking of contracts with
suppliers for discount rates will be possible. Additionally, plastic injection molding would be a
far more effective route for production.
Chapter 2.5: Development Timeline
The timetable Team Four used for product development is given in Figure 2.5.1 below. The
timetable was subsequently used to form a Gantt Chart which is attached in the appendix.

15
Figure 2.5.1: Team Four’s Timetable from Gantt Chart
16
Chapter 3: Technical Description of Smart Walker Device
Throughout the semester, Team Four encountered many technical issues when designing the
Smart Walker device. The most persistent of which was accurate distance detection with a
shallow angle of depression. This was the most critical problem of our design because the power
supply, microcontroller, and housing had to be implemented for the selected sensor. Therefore,
Team Four decided to select a sensor that met the design parameters before implementing the
rest of the design.
The prototypes discussed in this chapter are simply distance sensing devices that were tested to
detect changes of elevation 4’ away with the sensor placed 3’0” above ground. The only
prototype that included the power supply and feedback was the final working prototype. This
particular issue consumed a great amount of Team Four’s time. From prototyping designs, the
team made several iterative prototypes with various sensors and microcontrollers, two of which
failed the design goals and ultimately one that succeeded.
Chapter 3 details the various components used during prototyping, which eventually led to a
successful Smart Walker device. It was crucial that the device would not hinder David’s mobility
with excess weight and provide accurate distance measurements under any weather conditions. It
was also deemed important that the device be affordable and able to withstand vibrations and
minor impacts that would be associated with general day to day use. Criteria for hardware design
such as weight, robustness, cost, and power consumption were considered in all prototyping
iterations implemented by Team Four.
Chapter 3.1: Prototype #1: TI MSP430G2253 Microcontroller & HCSR04
Ultrasonic Sensors
The first design implementation of the Smart Walker device used the Texas Instruments
MSP430G2253 microcontroller (Figure 3.1.1) because the team had immediate access to
MSP430G2253 boards. In addition to this, Team Four had prior experience with programming
the MSP430 from designing and building a color organ during the lab portion of the course. The
first method for measuring distance was selected to be ultrasonic detection. This was chosen due
to its low cost, accurate distance measurement, and low power consumption. The first prototype
used one HCSR04 ultrasonic sensor (Figure 3.1.2).
Team Four’s first prototype failed to meet the project’s needs. The HCSR04 ultrasonic sensor
did not have the capability of detecting the range of distance that was needed for analyzing drop-
offs within 4’0”. This was due to the limitation of the sensor’s angle of depression, which will
be explain in greater detail in Chapter 4. Another downside to Team Four’s first prototype was
that there were no software libraries or documentation available for integrating the HCSR04

17
sensor with the TI microcontroller. Developing a serial communication program for the
components would have taken up a significant amount of Team Four’s allocated design time.
Figure 3.1.1: TI MSP430 Microcontroller Figure 3.1.2: HCSR04 Sensor
Chapter 3.1.1: Prototype #1: Hardware Design and Implementation
The operating principle of the ultrasonic sensors relies on transmitting a 40 kHz pulse and setting
the trigger pin high until the receiver picks up the reflection of the initial transmitted signal. The
microcontroller calculates the distance by multiplying the time it takes the signal to return by the
speed of the transmitted sound. To test this principle the HCSR04 sensors were mounted to a
table using a Helping Hand clamp tool so that various angles of depression could be tested. This
was done because during this phase of the design, Team Four had not completed the housing that
would attach to the mid-bar of the walker. This meant that sensors could be kept in a stable
position, while also being able to pivot with respect to the bar, such that different angles of
depression could be tested. Once the housing was implemented, all of the distance and elevation
tests were performed with the sensors placed inside the housing, which was placed on the top
most bar of the walker. Through testing of this initial prototype, Team Four encountered several
issues that prevented the HCSR04 sensors from detecting elevation change at distances greater
than 1’0” from the target. Figure 3.1.1.1 shows that the TI MSP430 is connected to a desktop
containing code composer while the trigger pin of the HCSR04 is connected to PIN 1.1 of the
MSP430 and the echo pin of the HCSR04 is connected to PIN 1.2 of the MSP430. The VCC and
GND pins on the HCSR04 are connected to the MSP430’s VCC and GND pins respectively.

18
Figure 3.1.1.1: Team Four’s 1st Prototype
Chapter 3.1.2: Software Design and Implementation
The software design and implementation was completed using TI’s code composer studio 5.4.0
IDE available on the computers in room 2221 of MSU’s engineering building. The MSP430 uses
C coding language to perform its programmed functions, making it ideal for all group members
to be able to operate and develop the HCSR04 sensors with the MSP430 microcontroller.
Example code to read distance using the HCSR04 sensors with the msp430 microcontroller was
obtained on instructables.com, which was submitted by user KristjanB.
Program Code 1 in Appendix 3shows the code used to read distance from the HCSR04 sensor
using the TI MSP430 microcontroller. Line 8 of the code includes the msp430g2553.h library,
which enables function specific to this microcontroller to be recognized while the program is
running on the microcontroller. Lines 10-12 declare the distance, milliseconds, and sensor
variables. “distance” is a type “int” variable, which displays the distance reading from the
sensor, “milliseconds” is a time variable, while “sensor” is the variable that will output the
total time when the trigger pin of the microcontroller was set to high. Lines 16 and 17 configure
the two clocks of the msp430 to operate at 1 MHz for ease of calculation. Line 20 enables the
CCR0 interrupt, while Line 21 sets the CCR0 to 1000, which will result in a millisecond count
clock when the msp430’s clock is set to 1 MHz. Line 21 sets the mode of the SMCLK to
“upmode”. Lines 25 and 26 turn the LED off and on. The while loop on line 30 is responsible for
the continuous reading of distance from the sensor. In the while loop, Pin 1.1 is set to send
pulses to the trigger pin of the HC-SR04 sensor, while Pin 1.2 is set to receive information from

19
the echo pin of the sensor. Line 33 triggers Pin 1.1 to send a pulse, while line 43 sets the length
of the pulse to be 10 microseconds. Once 10 microseconds have elapsed the controller executes
line 35 to stop the pulse. Lines 36-39 configure the echo pin in the while loop. Line 40 sets a
delay of 30ms that would set the distance to 204 inches if the signal hasn’t returned in time. A
function of “type vector”, declared in line 53, calculates the echo length on line 66, storing the
length of time in variable sensor. Line 41 converts the time stored in variable sensor to a distance
in centimeters, while lines 42 and 43 convert the distances to inches and feet. Lines 44 and 45
turn on a red LED if the sensor reads a distance greater than 60cm.
This code doesn’t contain an elevation detection algorithm because the sensor failed to read
distances greater than 1’0” away. This setup was discarded and the next prototype to be tested
was to implement the more expensive PING))) Ultrasonic Distance Sensors.
Chapter 3.2: Prototype #2: Parallax Propeller Activity Board Microcontroller and
PING))) Ultrasonic Distance Sensors
The second prototype implementation for the Smart Walker design used both the Parallax
Propeller Activity Board Microcontroller (Figure 3.2.1) and the PING))) Ultrasonic Distance
Sensor (Figure 3.2.2). The implementation of this design is similar to Team Four’s previous
design. Team Four choose to use the PING))) sensor for second prototype design, as the quality
and accuracy was greater than the HCSR04 ultrasonic sensor. Team Four chose to use the
Propeller microcontroller since Parallax provided libraries and documentation regarding
integration of PING))) sensors with a microcontroller.
Just like Team Four’s first prototype design, the second design failed due to the PING))) sensor’s
limitations of detecting distances within the project’s desired range. The PING))) sensor was
significantly more accurate than the HCSR04 ultrasonic sensor, but also had limitations when
detecting distance due to the sensor’s angle of depression. After two failed prototypes, Team
Four concluded that the Smart Walker device could not use ultrasonic sensors in the
implementation of its design.

20
Figure 3.2.1: Propeller Microcontroller Figure 3.2.2: PING))) Ultrasonic Sensor
Figure 3.1.3: Team Four’s 2nd Prototype

21
Chapter 3.2.1: Hardware Design and Implementation
The hardware implementation for Team Four’s second prototype is very simple. The only
hardware components for the prototype are a Parallax Propeller microcontroller and two Parallax
PING))) sensors. Team Four implemented a feedback circuit that was intended to be in the
second prototype’s design, but never made it to the implementation as Team Four found that the
prototype would not meets their needs.
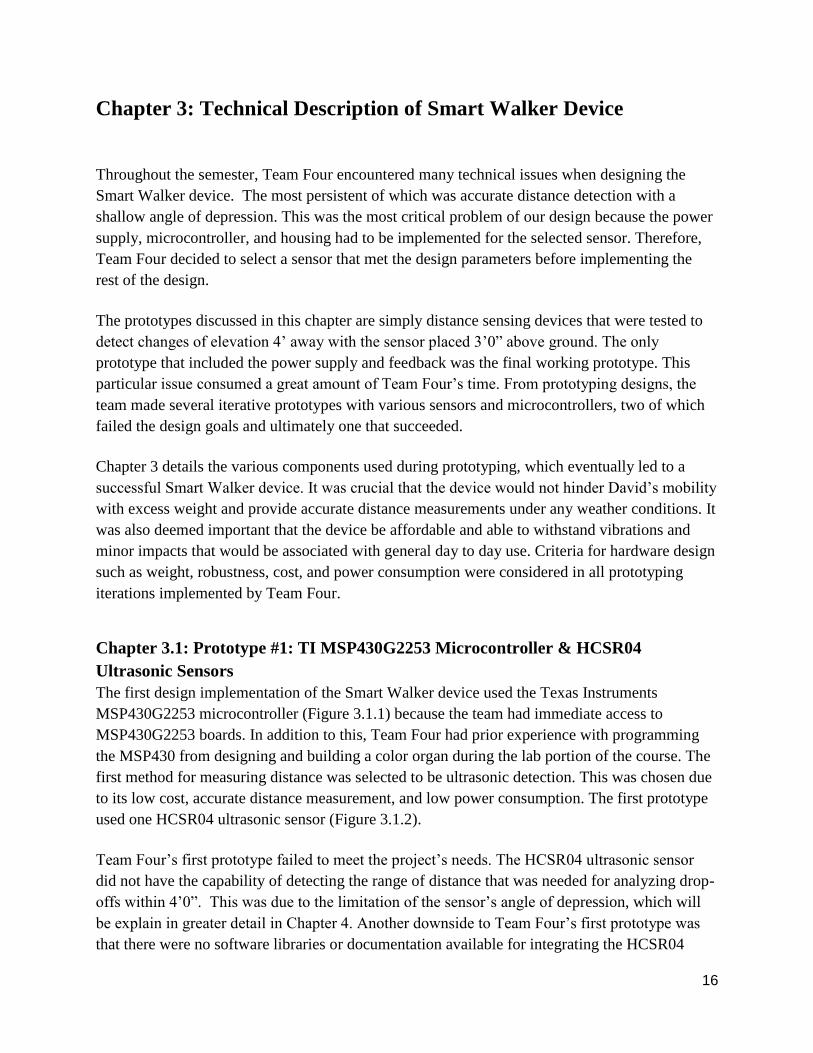
Figure 3.2.1.1 shows the concept for assembly of the Ping))) sensors and the Propeller
microcontroller that Team Four used for the second prototype design. Each ping sensor has 3
pins: ground, 5V power supply, and I/O signal. As seen in Figure 3.2.1.1, the left pin is used for
grounding and the middle pin is used for an input of 5V for powering the sensor. The right pin
acts as an input and output, as it’s used to trigger the sensor to active and let the transmitter send
out a pulse. Once the receiver on the sensor receives feedback, it outputs a distance digitally. If
the receiver on the sensor doesn’t receive any feedback, the sensor then outputs the max distance
it can read, which is 10 meters.
As seen on the top of Figure 3.2.1.1, the Propeller microcontroller has two power rails of 3.3V
and 5V. The PING))) sensors need 5V to be powered on, therefore each middle pin on the
sensors were connected to the 5V power rail. As seen in the bottom left on Figure 3.2.1.1, there
is a ground rail. Each left pin on the PING))) sensors were connected to the ground rail on the
microcontroller. For the I/O signal pins for each sensor, there was a 2 kilo-ohm resistor between
the pin and the ports that connected to the left of the microcontroller. Team Four’s first sensor
was connected to pin 15 as shown in Figure 3.2.1.1 and the second sensor was connected to pin
14.
The last part of the hardware implementation for Team Four’s prototype was connecting the
computer to the microcontroller for testing and distance readings. The Propeller microcontroller
is powered by a 5V USB connection and the connection was achieved through a USB-to-USB-
mini cable. As shown in Figure 3.2.1.2, Team Four plugged the USB end of the cable into the
computer’s USB communication port and the USB-mini end of the cable in the Propeller’s
communication port. This connection established communication between the microcontroller
and Parallax’s IDE software.
22
Figure 3.2.1.1: PING))) and Propeller Design Layout
Figure 3.2.1.2: Propeller and Computer Connection via USB

23
Chapter 3.2.2: Software Design and Implementation
The software implementation for the Propeller microcontroller is very similar to the TI
MSP430G2253 microcontroller, as seen on Program Code 2 in Appendix 3. This software
implementation differed from the previous implementation due to the microcontroller reading
from two sensors rather than one. The software that was needed to program the Propeller
microcontroller was Parallax's GCC Simple IDE, which Team Four obtained from Parallax's
website. Since the PING))) sensors are a product of Parallax as well, Parallax offers its
customers libraries and documentation on how to use these sensors with their microcontrollers.
Team Four obtained the PING))) library from Parallax’s website and included the header file
“ping.h” in their source code, as seen on the top of Program Code 2 in Appendix 3. This library
was beneficial to Team Four, as it allowed for more efficient implementation of the I2C
communication protocols.
In the beginning of the main( ) function, the variables data and number_readings were
established. The variable data was the size of how many readings to be stored in the array
dis_mem[ ]. Team Four chose data to be an integer of 50, as that was the desired number of
readings to be analyzed. The variable num_readings was set to zero, as it was to be used as an
indication in the the algorithm for the while loop. The variable drop_off_trig was set to zero.
Utilization of the while loop allowed for the sensors to be activated and have distance readings
are analyzed. As seen in Program Code 2, in Appendix 3, one sensor was connected to pin 15 on
the microcontroller, as the other is connected to pin 14. In the while loop, variables sensor_1 and
sensor_2 received distance values, in feet, from the sensors from the function ping_ft( ). The
function ping_ft( ) is a function that come from the PING))) library as previously discussed.
Once each variable received a distance value, sensor_1 and sensor_2 are then averaged and set to
the variable avg_dis and the variable num_reading increments.
The next part of the algorithm is the if and else statements. This part of the code is responsible
for arranging the memory in the array. If the number of readings is less than or equal to the size
of the array, 50, the dis_mem’s elements, 0-49 of the array, are equal to the average distance read
at that time. This is found in the first if-statement of the code, in Program Code 2 of Appendix 3.
To ensure all the elements of the array are stored correctly, each average distance needed to be
stored in the element that is equal to one number less than the number of readings. Team Four
did this to account for the first element in the array, which is stored at dis_mem[0].
If the code ignores the if-statement, all the elements in the array obtain a value. The code then
executes the else-statement where it uses a for loop update the memory. The for-loop is
responsible for discarding the last element in the array, dis_mem[50], and illiterates through the
rest of the memory, setting all elements equal to the previous distance value. This process allows
all the recent values to still be stored and analyzed as the older values become irrelevant for

24
analyzing. Once this process is done, the first element of the array is set to the new average
distance value.
The remaining part of the code is responsible for determining when a drop-off is present. As
discussed earlier, the PING))) sensors output the highest distance value it can read when it
cannot detect the distance, which in this case is 10.3 feet. When a drop-off occurs, the sensors
will not receive a signal since the angle of depression is greater with respect to the top edge of
the step extending to the edge of the next step. This is where the variable drop_off_trig is used.
This variable is set to take the sum of the last five average distance values. This is done by a for
loop as seen in Program Code 2 of Appendix 3. The last if statement is used to trigger the alarm.
There is no code is this section for triggering the alarm as, Team Four came to a conclusion that
this prototype wouldn't work before the implementation of triggering this alarm. The if-
statement checks to see if the variable drop_off_trig is equal to 51.5, which clarifies that the
sensors did not receive any signals back from the last 5 readings. Team Four agreed that if a
sensor didn't get a reading within 5 samples, a drop-off was present. The reason Team Four
didn't trigger the alarm after one reading was to ensure the alarm wasn't trigger due to a false
reading. Once the program passed the if-statement, the variable drop_off_trig is set back to zero
so it can be reused for the next iteration.
Chapter 3.2.3: Mounting and Fixture
When Team Four first tested the second prototype, a false conclusion of full operation was
concluded. With that being said, Team Four reached out to sponsor, Stephen Blosser, for the
mounting and fixture for the design. Team Four scheduled a meeting with Stephen to discuss
how the housing should be structured for the Smart Walker device. A week after the meeting,
Stephen finished the design as the final housing for the second prototype design as seen in Figure
3.2.3.1.
25
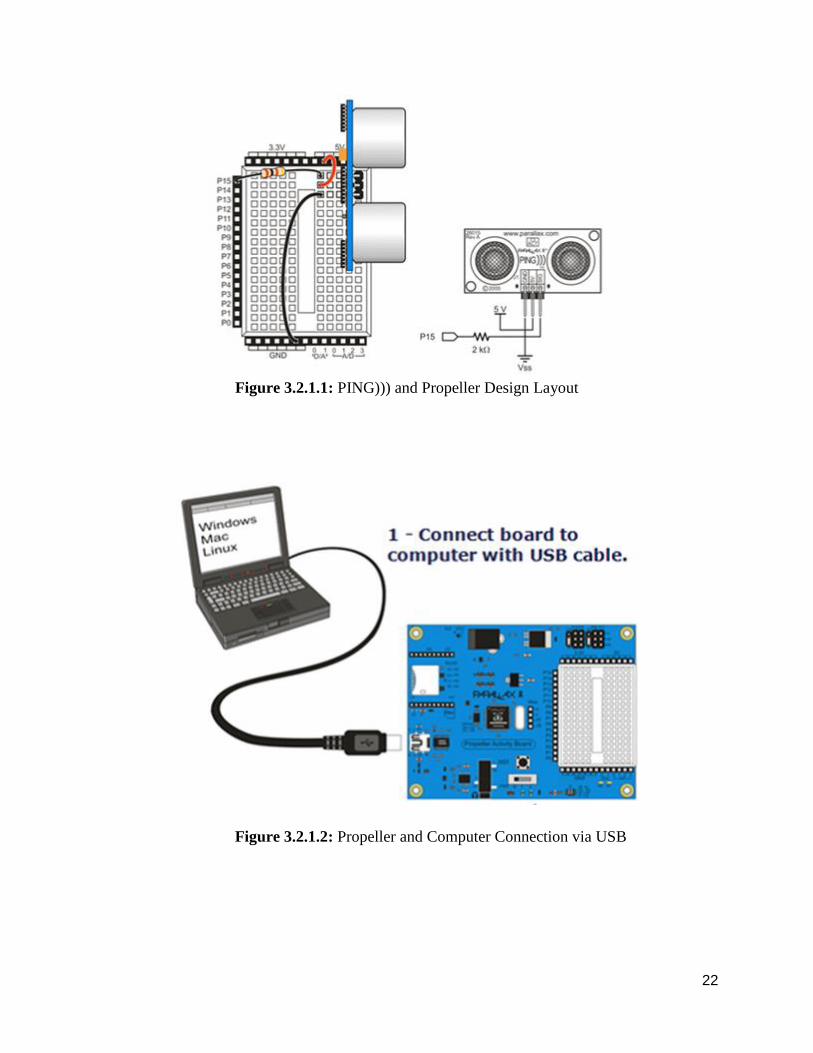
Figure 3.2.3.1: Fabricated Housing on Walker
The fixture for the second prototype consisted of two parts: the mounting and the housing for the
device. Team Four requested to have Stephen create and assemble a crossbar that has greater
height from the ground than the original bar that came on the walker. Team Four chose to have a
higher crossbar so that the device could be mounted higher. Team Four found mounting the
device higher would be an advantage as it allowed the sensors to have a shallower angle of
depression, which led to greater distance readings. The new mounted bar was 6” higher than the
original bar, which allowed the housing of the prototype to be mounted 3’0” above the ground.
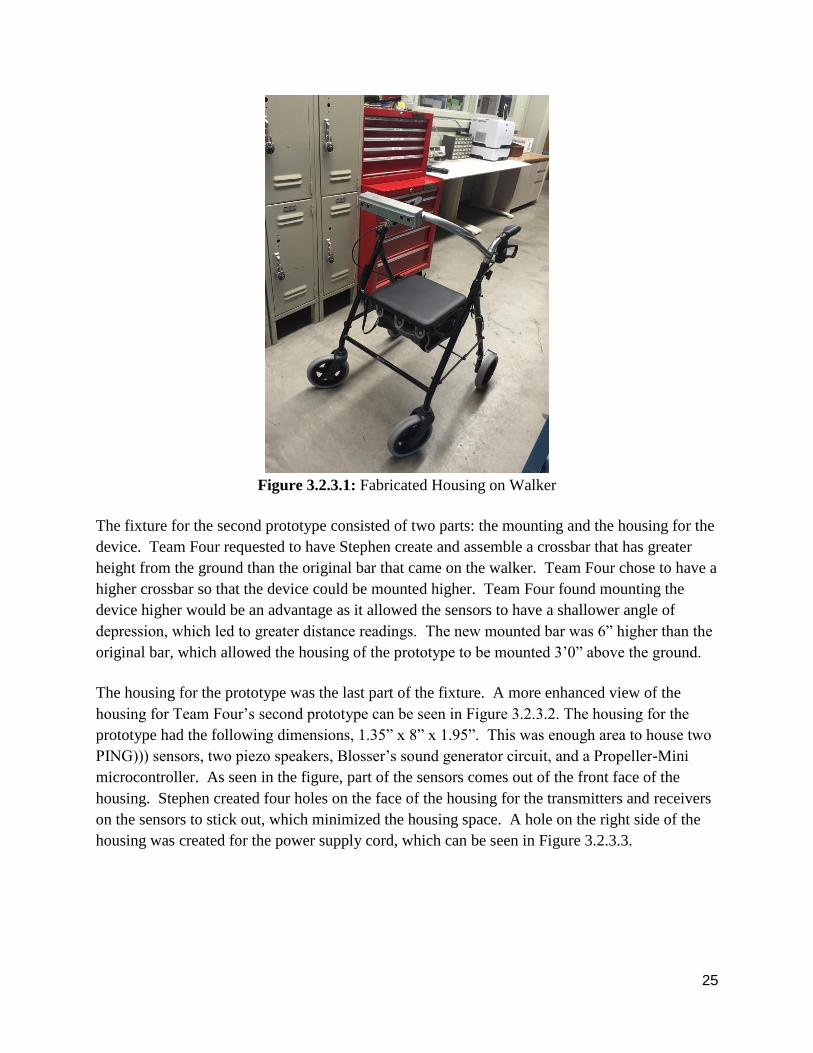
The housing for the prototype was the last part of the fixture. A more enhanced view of the
housing for Team Four’s second prototype can be seen in Figure 3.2.3.2. The housing for the
prototype had the following dimensions, 1.35” x 8” x 1.95”. This was enough area to house two
PING))) sensors, two piezo speakers, Blosser’s sound generator circuit, and a Propeller-Mini
microcontroller. As seen in the figure, part of the sensors comes out of the front face of the
housing. Stephen created four holes on the face of the housing for the transmitters and receivers
on the sensors to stick out, which minimized the housing space. A hole on the right side of the
housing was created for the power supply cord, which can be seen in Figure 3.2.3.3.
26
Figure 3.2.3.2: Front View of Housing with Sensors
Stephen created a top plate on the housing for the prototype that extended out from the face a
little bit so that the sensors’ transmitters and receivers were protected from rain. The top plate
also acted as the locking mechanism for the housing as well. As seen in Figure 3.2.3.3, the
housing opens from the bottom of its structure with hinges. When the top plate is assembled on
the top of the housing, it locks the front and back sides together, not allowing the sides to move.
There is a screw on the surface of the top plate which allows the top plate to stay on tight and not
expose any components inside the housing when bumped or tampered with.
27
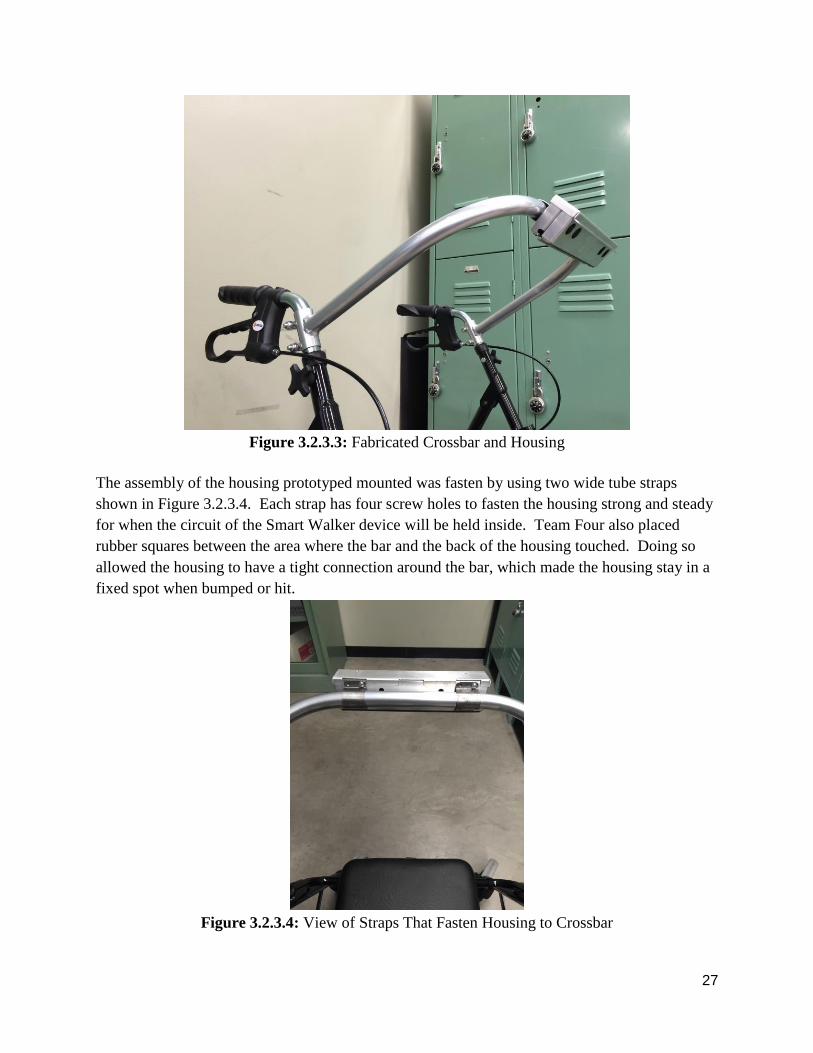
Figure 3.2.3.3: Fabricated Crossbar and Housing
The assembly of the housing prototyped mounted was fasten by using two wide tube straps
shown in Figure 3.2.3.4. Each strap has four screw holes to fasten the housing strong and steady
for when the circuit of the Smart Walker device will be held inside. Team Four also placed
rubber squares between the area where the bar and the back of the housing touched. Doing so
allowed the housing to have a tight connection around the bar, which made the housing stay in a
fixed spot when bumped or hit.
Figure 3.2.3.4: View of Straps That Fasten Housing to Crossbar

28
Chapter 3.3: Exploring Infrared Sensors with Stephen Blosser’s SCATIR Device
After two failed prototypes that involved ultrasonic sensing, Team Four concluded that a
different approach for detecting distance was required. Team Four met with Stephen Blosser to
discuss solutions that would create a working prototype to meet the Smart Walker’s customer
deliverables. During this meeting, Mr. Blosser brought one of his patented SCATIR devices. Mr.
Blosser’s SCATIR device has the same purpose as the Smart Walker design, as it detects
distance using an IR sensor. Having access to this device allowed Team Four to investigate
detecting distance with IR sensing in a short and non-costly manner.
When experimenting with distance detection with the IR sensor in the SCATIR device, Team
Four discovered that color absorption became a huge factor for detection. Team Four observed
that the IR light was absorbed more by darker colored surfaces than it was on lighter colored
surfaces as shown in Figure 3.3.1. Due to the inconsistency of color absorption, the sensors were
able to detect lighter objects at farther distance than it did for darker objects. After further
experimentation with the IR sensing SCATIR device, Team Four concluded that IR sensors
could not be used in the Smart Walker design as color absorption had a huge effect when
detecting distance. This led Team Four to investigate further more in using laser sensors for
their next prototype.
Figure 3.3.1: Color Absorption for Light and Dark Surfaces
Chapter 3.4: Final Prototype: Arduino Nano Microcontroller and LiDAR Lite
Laser Sensors
The sensors selected for the final prototype are the LiDAR Lite Laser sensors provided by Pulsed
Light 3D. These sensors were selected because of their accuracy and success at detecting
elevation change a sufficient distance away from the walker which they were mounted on. The
design features two LiDAR sensors (Figure 3.3.3) mounted on the fabricated crossbar on the
walker aimed at the floor 4’0” away from the walker. Each reading made by the sensor would be
stored into memory and compared against the previous reading, an increase of over 6” would
trigger the piezo speakers to sound an alarm lasting about one second. The microcontroller
29
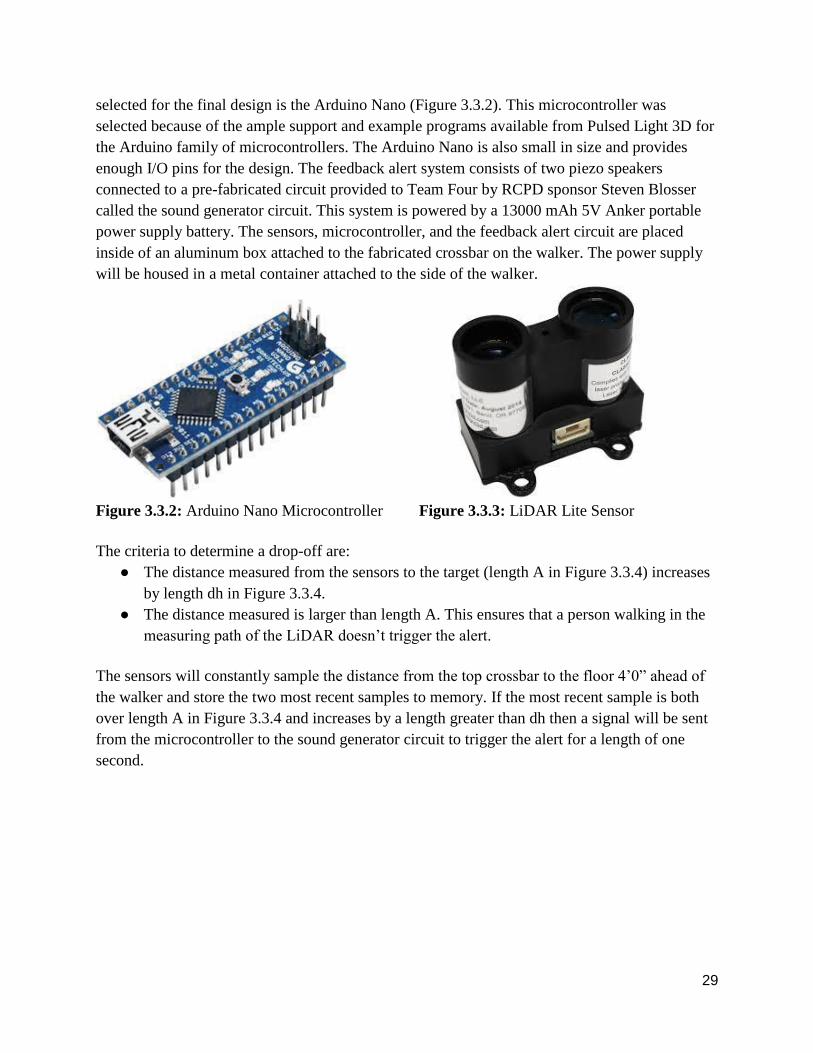
selected for the final design is the Arduino Nano (Figure 3.3.2). This microcontroller was
selected because of the ample support and example programs available from Pulsed Light 3D for
the Arduino family of microcontrollers. The Arduino Nano is also small in size and provides
enough I/O pins for the design. The feedback alert system consists of two piezo speakers
connected to a pre-fabricated circuit provided to Team Four by RCPD sponsor Steven Blosser
called the sound generator circuit. This system is powered by a 13000 mAh 5V Anker portable
power supply battery. The sensors, microcontroller, and the feedback alert circuit are placed
inside of an aluminum box attached to the fabricated crossbar on the walker. The power supply
will be housed in a metal container attached to the side of the walker.
Figure 3.3.2: Arduino Nano Microcontroller Figure 3.3.3: LiDAR Lite Sensor
The criteria to determine a drop-off are:
● The distance measured from the sensors to the target (length A in Figure 3.3.4) increases
by length dh in Figure 3.3.4.
● The distance measured is larger than length A. This ensures that a person walking in the
measuring path of the LiDAR doesn’t trigger the alert.
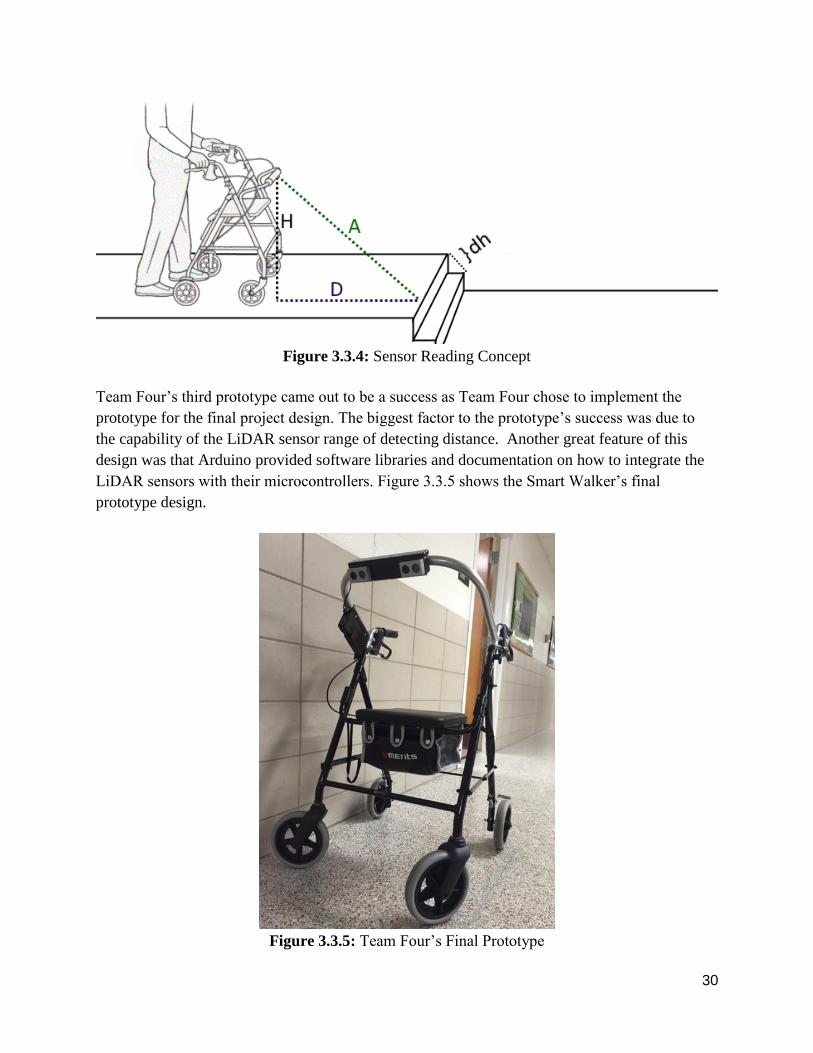
The sensors will constantly sample the distance from the top crossbar to the floor 4’0” ahead of
the walker and store the two most recent samples to memory. If the most recent sample is both
over length A in Figure 3.3.4 and increases by a length greater than dh then a signal will be sent
from the microcontroller to the sound generator circuit to trigger the alert for a length of one
second.
30
Figure 3.3.4: Sensor Reading Concept
Team Four’s third prototype came out to be a success as Team Four chose to implement the
prototype for the final project design. The biggest factor to the prototype’s success was due to
the capability of the LiDAR sensor range of detecting distance. Another great feature of this
design was that Arduino provided software libraries and documentation on how to integrate the
LiDAR sensors with their microcontrollers. Figure 3.3.5 shows the Smart Walker’s final
prototype design.
Figure 3.3.5: Team Four’s Final Prototype

31
Chapter 3.4.1: Hardware Design and Implementation
Materials:
● 1 Arduino Nano Microcontroller
● 2 LiDAR Lite Laser sensors by Pulsed Light 3D
● 2 Piezo Speakers
● 1 Sound Generator PCB (provided by Stephen Blosser)
● 1 General Purpose PCB
● 1 220KΩ resistor
● 1 270 Ω resistor
● 1 IRF530N N-Channel MOSFET
● 1 1N5819 Diode
● 1 13000 mAh 5V power supply by Anker
● 1 Toggle switch
● 1 5mm green LED
● 1 Fabricated housing box.
● 1 PCA9544A 4-channel I2C-bus multiplexer
● 1 SparkFun SOIC to DIP Adapter - 20-Pin
The LiDAR Lite Laser sensor’s key components are: a transmitting laser, a receiving PIN diode,
two lenses, and a microcontroller. The transmitting laser sends a pulse of concentrated light to a
target while the receiver reads the transmitted signal. The LiDAR sensor uses a process called
“signature correlation” to determine the distance to a target.
The desired characteristics for a distance sensor for the purposes of designing a
Smart Walker device are: portability, long range, high accuracy, and low power consumption.
Some of the features that make the LiDAR sensor a good option for the Smart Walker
design:
● Dimensions: 21 X 48.3 X 35.5 mm
● Performance: 0-40m Laser Emitter
● Accuracy: +/- 0.025 m
● Power: 5vdc, <100ma
● Rep Rate: 1 - 100 Hz rep rate
● 0.5 degree beam width
Beam width is a critical concept in distance sensing. Beam width is determined by the angle of
beam divergence from the source and the distance to the object being measured. A very broad
beam width results in undesired objects being detected by the sensor while a very narrow beam
width might not detect a drop-off if a walker isn’t aimed directly at the stairs. A solution to this

32
problem is to use two LiDAR sensors placed on opposite sides of the walker so that the walker
can accurately detect drop-offs when approaching hazards at an angle.
The LiDAR sensors have six output pins, GND (ground), SDA (serial data line), SCL (serial
clock line), mode, power enable, and 5V. See Figure 3.4.1.1 for a display of the pins on the
sensors.
Figure 3.4.1.1: LiDAR Sensor Pinout
The GND, SDA, SCL, and 5V pins were used to implement the communication between the
LiDAR sensors and the Arduino Nano microcontroller while the other two were unused. The
SDA and SCL pins allow for the I2C (Inter-Integrated Circuit) bus communication to be utilized
which will be discussed further in software design and implementation. A PCA9544AD
multiplexer chip was used in order to obtain readings from both LIDAR sensors.
The wiring from the LiDAR sensors to the Arduino Nano worked by using pins A4 and A5 that
supported the I2C bus communication. These are the only two pins that allow for this protocol so
in order for both sensors to connect to the I2C bus communication a PCA9544AD multiplexer
chip is used. The chip is a bidirectional translating multiplexer that is controlled by the I2C bus
communication. Through the programmable registers one sensor can be chosen at a time to
obtain a distance detection and then switch immediately to the second one. This process would
repeat continuously. To wire the two sensors and microcontroller to it, two of the four channels
on the multiplexer chip were utilized. Pin 5 connected SDA and pin 6 connected SCL of one
sensor to the first channel. Pin 8 connected SDA and pin 9 connected SCL of the second sensor
to the second channel. Pin 19 connected to A4 (SDA) of the microcontroller and pin 18

33
connected to A5 (SCL) of the microcontroller to send the sensors information to the
microcontroller for analyzing. The wiring discussed can be seen in Figure 3.4.1.2 and came from
Pulsed Light 3D’s open source which was developed by user austinmeyers.
Figure 3.4.1.2: Wiring Diagram for Multiple Sensors
To implement the feedback system which consist of the sound generator circuit Stephen Blosser
made, the power to it has to be controlled because once it is powered the speakers would trigger
continuously. A power switch was used to control power to the circuit. An IRF530N nMOS
transistor was used to create the power switch. The schematic for the circuit can be seen in
Schematic 1 in Appendix 3 of the entire device circuit. The gate voltage of the transistor would
be provided when a pin on the microcontroller is written high in order to complete the circuit.
This would allow for the power supply to drive the piezo circuit and trigger the speakers. Once
the same pin was written low the gate voltage in the transistor would not be met and would
create an open circuit disconnecting the power supply from the sound generator circuit stopping
the speakers from being triggered. A diode was used in parallel with the sound generator circuit
connected to the drain to protect against current flowing into the transistor and compromising it.
It was discovered that the sound generator circuit acted as an inductive load that caused the gate
to stay high and continue to trigger the speakers so a pulldown resistor was also connected from
the gate to ground. A 220 kilo-ohm resistor was the best choice so the gate threshold would still
be meant and power would still be drawn away from the gate opening the circuit again.

34
An LED and switch are incorporated into the backside of the housing. This can be seen in
Schematic 1 in Appendix 3. This was added to provide a user friendly way of simply turning on
and off the device. The switch controls when the circuit is completed from the power supply to
the 5V pin on the microcontroller, the sound generator circuit, the two LiDAR sensors, and the
PCA9544AD chip. When the switch is on, the circuit is complete and provides power to the bus
line that provides the power to the device. A green LED was used to allow for an easy solution to
determine if the Smart Walker device is on. The green LED is connected to a pin on the
microcontroller. When the switch turns the microcontroller on, the pin is written high
immediately and lights the LED until it is turned off. A 270 ohm resistor is used to safely power
the LED by dropping the current within 20 - 30 mA.
It is of the utmost importance that the system developed by Team Four can operate for the
entirety of David’s most demanding days. Ideally the device can operate for at least twelve hours
however all power calculations were down using 16 hours of continuous operation, this provided
Team Four with a 25% safety overhead. The continuous current draw of the primary components
of the circuit, taken directly from components datasheets and the calculated expected draw
accounting for hours of operation are shown in the table below. All calculations assumed 16
hours except for the piezo speakers, which were calculated for one hour of operation over a
given day to account for worst case scenario.
Component Continuous Current Draw Calculated Expected Draw
Arduino Nano MCU 20 mA 320 mAh
LiDAR Lite Sensor (x2) 100 mA per sensor 3200 mAh
Microchip PIC10F206T 70 µA 1.12 mAh
Piezo Audio Transducer (x2) 11 mA per speaker 22 mAh
Table 3.4.1.3: Current Draw of Components
From Table 3.4.1.3 above we should expect approximately 3543.12 mAhr draw at 5 V which
gives 17715.6 mWh of power in a given day. Team Four is using a Lithium ion battery to power
the circuit so battery efficiency needs to be accounted for as well. The actual power draw can be
found using the equation Wactual = Wcalculated/efficiencybattery. The efficiency of a Lithium ion
battery is approximately 80%, this leads to Wactual = 22144.5 mWhr or 22.15 Wh. After
evaluating several power supply options Team Four decided that the Anker 2nd Gen Astro E4
35
13000mAh which has a 48.1 Wh capacity. This option far exceeds Team Four’s performance
expectations and presented a cost effective solution.
Chapter 3.4.2: Software Design and Implementation
For the final prototype, Team Four used the Arduino Nano microcontroller. The IDE Team Four
used to program the Arduino Nano is called Arduino 1.6.2, as it was available for Team Four to
download on Arduino’s website. Team Four’s software design for their final prototype has the
same conceptual implementation as their previous prototypes, which can be seen on Program
Code 2 in Appendix 3. The only big difference for the final prototype implementation is the
algorithmic process in which the program determines when a drop-off occurs. In the previous
Parallax prototype, the software implementation predicted a drop-off when five consecutive
distance readings did not receive any feedback. Since the LiDAR Lite sensors are capable of
detecting distances of the approaching downward stairs, the drop-off algorithm uses height
thresholds to determine when a drop-off is present. This algorithmic process will be discussed in
more detail later as the chapter goes on.
The implementation of the code first starts with including the I2C library and defining important
I2C variables. The I2C library was created by Arduino as one can download the library from
Arduino’s website. The definition of the LIDARLite_ADDRESS variable defines the default I2C
address of the LiDAR sensor. The definitions RegisterMeasure and MeasureValue variables
define the initiating range and the value of the initiating range for the LiDAR sensor. The last
definition variable, I2CMultiplexer, defines the I2C address of the PCA544A multiplexer.
Following the I2C library and definitions of the implementation, a global integer and array are
established. The global inter num_readings is used as a counter and the array dis_mem[ ] is used
to store two distance readings for the upcoming implementation. The global variables
DO_threshold and min_height_threshold are assigned values of .5 and 7. These values are the
drop-off and minimum height thresholds that the distance readings have to reach to indicate
when a drop-off is present. These thresholds were obtained by test procedures that Team Four
conducted, which will be discussed in Chapter 4.
The next part of the code calls the setup( ) function. The purpose of this function is to set up the
I2C communication before any data is analyzed and computed. In the beginning of the function,
the I2c.begin( ) function from Arduino’s library is called following a 100 ms delay. This
process opens and joins the I2C bus and waits to make sure every component is powered on
before sending or receiving data. Next, the I2c.timeOut( ) function from the I2C library is called,
with a 50 ms delay, to ensure that the program doesn't lock up if the I2C communication fails.
The function pinMode( ) is called twiced to make pins D6 and D3 digital outputs. Lastly, the
function digitalWrite( ) is called to make pin D3 go high. Pin D3 is used to turn on the LED
light on the hardware design, which indicates the user of device that sensors are enabled and
sensing.

36
The next part of the software implementation is the loop( ) function. In the beginning of this
function, the function selectMultiplexierChannel( ) is called followed by initiation of the variable
D1 equal to the readDistance ( ) function. Before the explanation of the loop( ) function can be
understood, these two functions must be explained first. The selectMultiplexierChannel( )
function is called with a parameter of byte channel variable. Since the PCA544A multiplexer
has only 4 channels for I2C communication, the variable channel can only be an integer of zero
through three. A byte variable controlRegister is set to a hexadecimal value of 0x04, which is
the address of the control register in the PCA544A multiplexer. The control register’s variable is
then bitwise OR’ed with the parameter channel. A while-loop is then establish to keep the
Arduino Nano sending NACK’s (no acknowledgment) to the LiDAR Lite sensor at that channel
until the sensor sends an ACK (acknowledgment) back to the Arduino Nano indicating that the
sensor is powered on and ready for communication.
After the selectMultiplexierChannel( ) function returns back to the loop( ) function, the distance
from sensor one, variable D1, is established by calling the readDistance ( ) function. The
beginning of the readDistance ( ) function acts the same as the selectMultiplexierChannel( )
function. It uses a while-loop to establish communication between the microcontroller and the
range register in the LiDAR sensor by using NACK’s and ACK’s. After this process a byte-
array, distanceArray, is established to hold bytes in its array. Another while-loop is then
executed to read two bytes from the LiDAR’s I2C address by using the I2c.read( ) function from
the I2C library. After the two bytes are read, the code then breaks out of the while-loop. The
doubled variable distance is set to the sum of the first element, which is shifted eights bits to the
left, and the low byte of the 2nd element in the distance array. Shifting the 8 bits to the left of
the first element and adding the low byte of the second element creates 16 bit integer. The
variable distance is then divided by 30.48 to convert the distance reading from centimeters to
feet and then returned back to the variable D1 in the loop( ) function.
Now that the selectMultiplexierChannel( ) and readDistance ( ) functions have been explained,
the explanation of the loop( ) function can proceed. The next action in this function is obtaining
the distance value from the second LiDAR sensor and assigning that distance value to the
variable D2. This procedure is done the same way as obtaining the value for variable D1, as the
only difference is calling the selectMultiplexierChannel( ) function with the channel parameter
of ‘1’ to communicate with the second channel on the PCA544A multiplexer. Once both
distance variables are received, the program then averages the readings and stores the average
value to the variable avg_dis.
After averaging the distances from both sensors, the code then enters an if-statement to allocate
the memory properly. If the variable num_readings is greater than zero, then there is a minimum
of one element in the distance memory array. The program takes the old average distance
reading that is in the front of the array and stores it in the back of the array. Once this is done,
37
the new average distance value that was just computed is stored in front of the array. This
procedure allows the new average distance to be compared to the old average distance for the
next part of the code. If the program passes the if-statement it then enters the else-statement.
This only happens once, as it sets the first element in the array to the average distance for the
first iteration of the loop( ) function.
Preceding the if-and-else statements, the program encounters another if-statement. The purpose
of this if-statement is to determine if a drop-off is present in front of the walker. In order to
indicate that a drop-off is present, two instances must happen. The new average distance reading
must be greater than the minimum height threshold of 6.8’ and must be greater than the sum of
the drop-off threshold of 6” and the previous average distance reading. Once these the two
distance readings have met the drop-off criteria, the program executes through the if-statement
triggering the feedback system. The feedback system is triggered by using the digitalWrite( )
function to set pin D6 high. The program then delays for one second and then disables the
feedback system by setting pin D6 to low. If there is no drop-off present, the program then
jumps back up to the top of loop( ) function and continues executing. The program will keep
iterating until the power is removed from the Smart Walker device.
Chapter 3.4.3: Mounting and Fixture
Team Four’s final prototype fixture is the same fixture used in the previous prototype with a few
modifications. Team Four and Mr. Blosser were pleased that the previous fixture would be able
to house the new prototypes design without having to completely design a new fixture. The
mount on the previous prototype was able to be used without any modifications as the previous
housing was the only fixture that needed to be modified for the final project design.
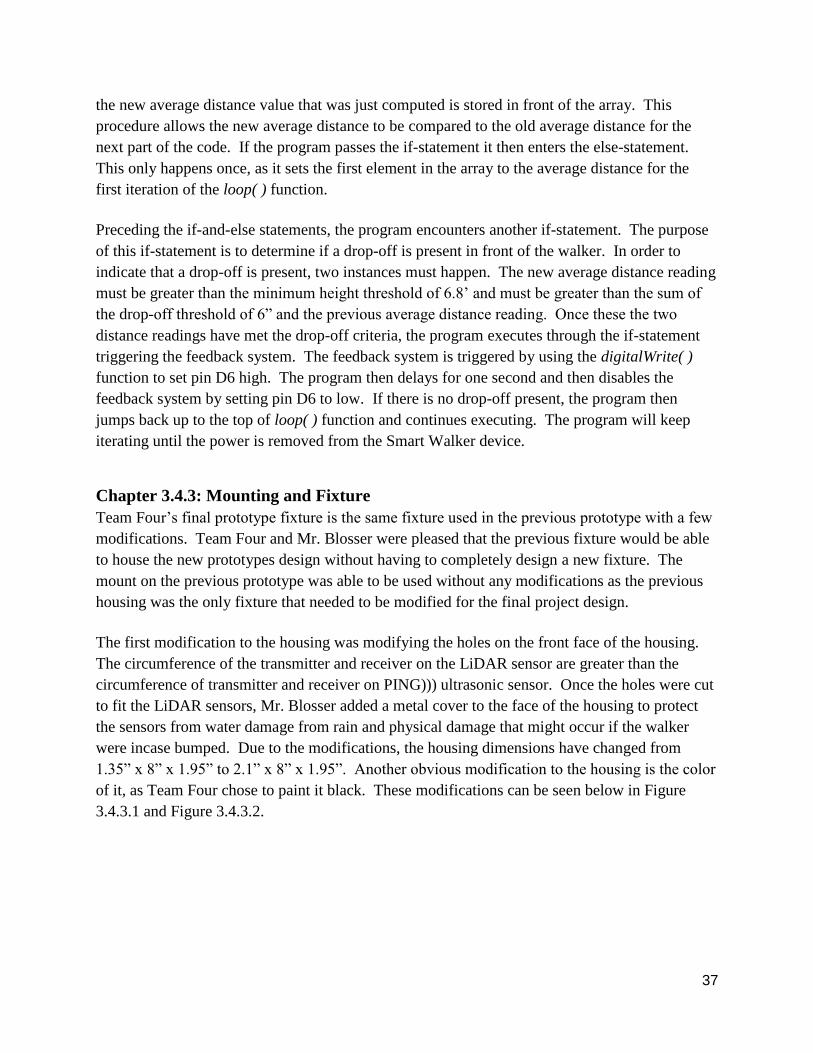
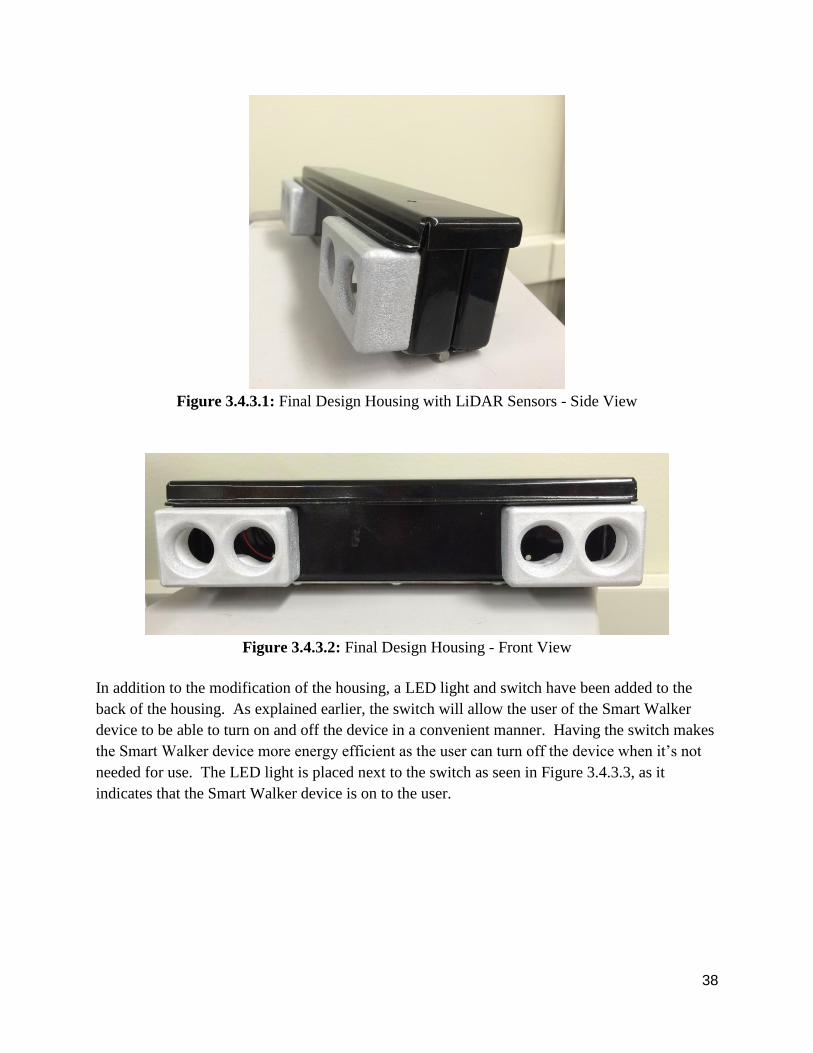
The first modification to the housing was modifying the holes on the front face of the housing.
The circumference of the transmitter and receiver on the LiDAR sensor are greater than the
circumference of transmitter and receiver on PING))) ultrasonic sensor. Once the holes were cut
to fit the LiDAR sensors, Mr. Blosser added a metal cover to the face of the housing to protect
the sensors from water damage from rain and physical damage that might occur if the walker
were incase bumped. Due to the modifications, the housing dimensions have changed from
1.35” x 8” x 1.95” to 2.1” x 8” x 1.95”. Another obvious modification to the housing is the color
of it, as Team Four chose to paint it black. These modifications can be seen below in Figure
3.4.3.1 and Figure 3.4.3.2.
38
Figure 3.4.3.1: Final Design Housing with LiDAR Sensors - Side View
Figure 3.4.3.2: Final Design Housing - Front View
In addition to the modification of the housing, a LED light and switch have been added to the
back of the housing. As explained earlier, the switch will allow the user of the Smart Walker
device to be able to turn on and off the device in a convenient manner. Having the switch makes
the Smart Walker device more energy efficient as the user can turn off the device when it’s not
needed for use. The LED light is placed next to the switch as seen in Figure 3.4.3.3, as it
indicates that the Smart Walker device is on to the user.

39
Figure 3.4.3.3: Switch and Green LED on Backside of Housing
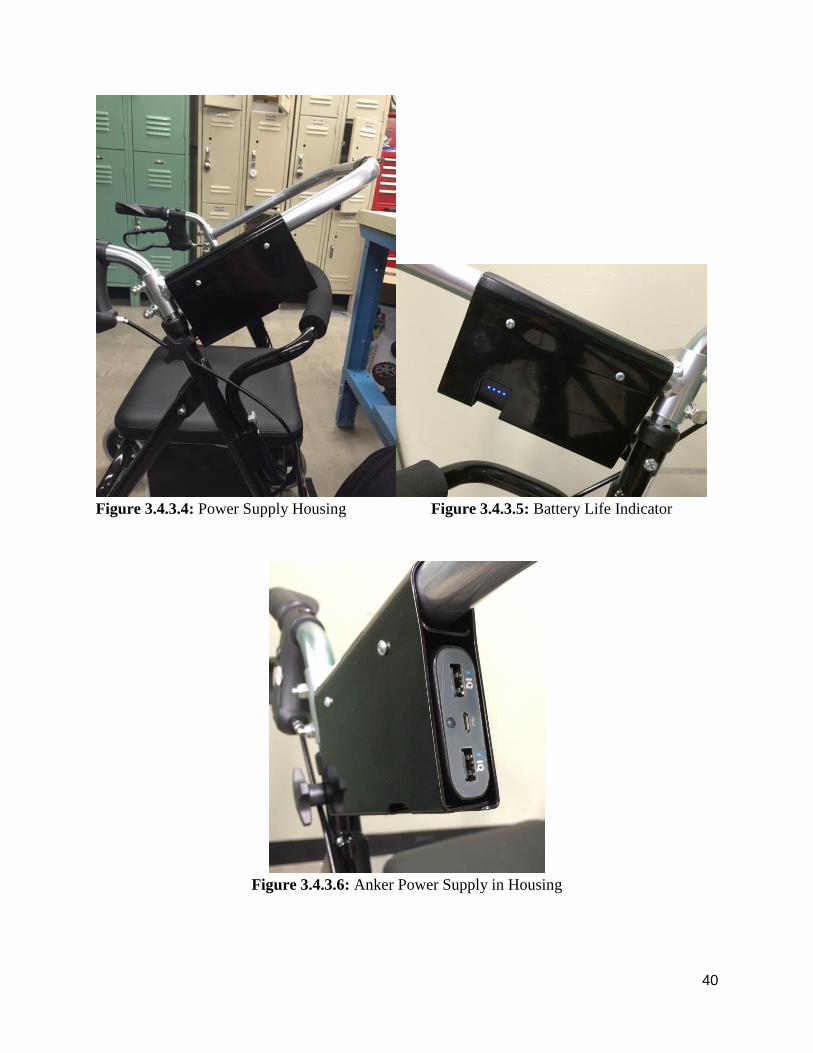
For the final Smart Walker design, Team Four has added more to the overall fixture design. As
seen in Figure 3.4.3.4, housing has been added onto the side of the walker to hold the power
supply. Mr. Blosser made the housing out of metal to protect the power supply from damage and
has been painted black like the housing for the Smart Walker device. A great feature that Mr.
Blosser made on the housing for the power supply is a cutout area on the housing that shows the
user how much power is left in the battery. The battery displays four blue LED lights when the
battery is fully charged as seen on Figure 3.4.3.5. Each LED light turns off at a certain time as
the battery starts to gradually lose power. There is an opening for a USB cable to plug into the
power supply and provide power to the circuit (Figure 3.4.3.6).
40
Figure 3.4.3.4: Power Supply Housing Figure 3.4.3.5: Battery Life Indicator
Figure 3.4.3.6: Anker Power Supply in Housing
41
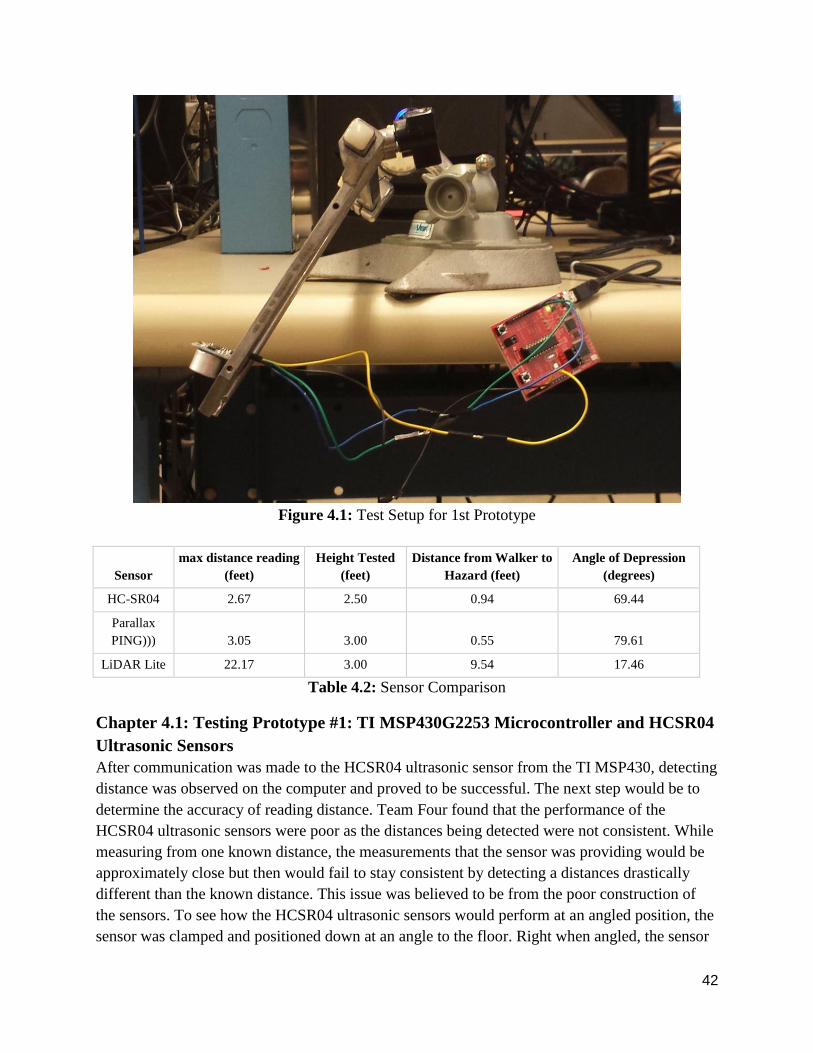
Chapter 4: Proof of Functional Smart Walker Device Design
The testing procedure that Team Four used to test the Smart Walker prototypes created
throughout the semester consisted of several steps. The first of which was to make ensure the
sensors were operating properly and accurately detecting distance. This was done by viewing the
serial monitor of the distance on the computer, while connected to the microcontroller. To
confirm that the sensors were reading the correct distance, the team set up the sensors at a known
distance to the ground and compared it to the distances being displayed in the monitor. If the
distance being read by the sensors approximately matched the known distance, the next step was
to confirm the angle of depression at which the sensors could accurately read distance. Two
methods were used to test the sensors at an angle. Figure 4.1 shows the first testing method,
Team Four placed the sensor on soldering clamps called “helping hands” which had the
advantages of keeping the sensor steady, while also offering three degrees of freedom, including
the ability to change the angle of the sensor with respect to the ground. With the helping hands
placed on a desk, the distance readings were observed through a serial monitor on a computer
connected to the microcontroller and sensor. The readings were then confirmed by use of a
measuring tape. The angle of depression was gradually decreased by pivoting the helping hands
upward. The maximum distance reading was determined to be the last consistent reading before
a “no signal” reading was observed. A “no signal” reading was an inaccurate maximum possible
distance that gets displayed when the sensor can no longer detect an object. The second testing
method was used once the first housing fixture was fabricated. This method was utilized to test
the sensor’s performance for angles of depression. The height position tested was the height of
the fabricated crossbar at 3’0” on the walker. This height and the distance being detected by the
sensors could then determine how far in front of the walker the sensor was able to detect, as well
as the angle of depression. These would be the values that determine if the sensor would perform
as expected for the Smart Walker design. Measurements would be taken once a consistent
reading was observed on the serial monitor to make sure the sensor would be accurate. Once an
angle was determined that allowed for accurate distance reading, the final step was to test it on a
flight of stairs and see when the sensors at the angle determined earlier could detect the drop-off.
From this testing, the angle of the sensor would determine how much distance David would have
in front of the walker before the flight of stairs, since the height would remain consistent. The
ideal distance was determined to be 4’0” for David with the minimum possibility of 3’6”. This
constraint was the primary issue Team Four experienced during testing until the final prototype
was put under testing trials.
The following will detail the testing and results of each of the prototypes Team Four assembled.
Table 4.2 shows the final distance sensor testing results. After the right sensor was determined
through testing, Team Four moved on to incorporate and test the feedback system and power
supply on the final prototype.
42
Figure 4.1: Test Setup for 1st Prototype
Sensor
max distance reading
(feet)
Height Tested
(feet)
Distance from Walker to
Hazard (feet)
Angle of Depression
(degrees)
HC-SR04 2.67 2.50 0.94 69.44
Parallax
PING))) 3.05 3.00 0.55 79.61
LiDAR Lite 22.17 3.00 9.54 17.46
Table 4.2: Sensor Comparison
Chapter 4.1: Testing Prototype #1: TI MSP430G2253 Microcontroller and HCSR04
Ultrasonic Sensors
After communication was made to the HCSR04 ultrasonic sensor from the TI MSP430, detecting
distance was observed on the computer and proved to be successful. The next step would be to
determine the accuracy of reading distance. Team Four found that the performance of the
HCSR04 ultrasonic sensors were poor as the distances being detected were not consistent. While
measuring from one known distance, the measurements that the sensor was providing would be
approximately close but then would fail to stay consistent by detecting a distances drastically
different than the known distance. This issue was believed to be from the poor construction of
the sensors. To see how the HCSR04 ultrasonic sensors would perform at an angled position, the
sensor was clamped and positioned down at an angle to the floor. Right when angled, the sensor

43
would behave erratically and not give consistent distance measurements, unless positioned in a
specific angle range which can be seen in Figure 4.1.1.
Figure 4.1.1: Angle of Depression Test for HCSR04 Ultrasonic Sensor
At this position, the sensor can only detect accurately out to approximately one foot when 30
inches high. These specific ultrasonic sensors had difficulty receiving the signal pulse when
angled any further because the majority of the pulse would reflect away from the sensor and not
reach the receiver. It was determined that the HCSR04 ultrasonic sensors would be insufficient
in providing robust and accurate distance detection that would provide the safety expected to aid
David.
Chapter 4.2: Testing Prototype #2: Parallax Propeller Activity Board
Microcontroller and PING))) Ultrasonic Distance Sensors
The PING))) Ultrasonic Distance Sensors, compared to the HCSR04 Ultrasonic Sensors, proved
to be more reliable from testing. The PING))) sensors were able to detect distance. When testing
the accuracy of the sensors at no angle of depression, the PING))) sensors were stable and
accurate in detecting the correct distance. They proved to be consistent in operation and in

44
detecting the distance correctly continuously. The monitor data can be seen in Figure 4.2.1
measuring consistently at 3.05 feet.
Figure 4.2.1: Distance Reading for 2nd Prototype
When the testing the sensor’s accuracy while angled, success was shown in being accurate and it
was applied to the walker housing. The sensors were then tested at a flight of stairs that
concluded that the angle of depression would be too shallow for the sensors to work correctly in
detecting distance at the current designated height on the walker. When the sensors were tested
on the flight of stairs, the only consistent readings the sensors would detect was when they were
positioned at 45 degrees or greater. Even at 45 degrees the sensors would not operate efficiently.
However, even at 45 degrees the PING))) sensors would only detect 3’0” in front of the walker
due to the height only being at 3’0” as well. The ultrasonic sensors have a very narrow operating
range when it comes to the angle they would function at, which misled the team before the
sensors were tested at the stairs.
Chapter 4.3: Testing Final Prototype: Arduino Nano Microcontroller and LiDAR
Lite Laser Sensors
The performance of the LiDAR Lite Laser Sensors was consistent and accurate in distance
detection. The sensor passed the test consistently which allowed Team Four to move to
incorporating the feedback system and power supply into this final design. The following

45
sections will describe the test results of each of these components as they were added to the final
design.
Chapter 4.3.1: Arduino Nano Microcontroller and LiDAR Laser Lite Sensors
The LiDAR sensors with the Arduino Nano microcontroller when implemented performed better
than expected. The LiDAR sensors consistently detected distances at angled positions that the
previous sensors could not. At the height of the fabricated crossbar on the walker, the sensors
were able to operate at smaller angles of depression which allowed, at the height of 3’0”, the
sensors to still detect distance 4’0” in front of the walker. The previous sensors were not able to
perform like the LiDAR sensors were capable of at shallower angles of depression. The sensors
have the ability to sense up to 60 meters, which meant that even when stairs were detected the
sensors provided feedback. This showed that in order to counter this, thresholds had to be
programmed into the Arduino in order to trigger the feedback system. The thresholds that Team
Four observed came from thorough testing that will be explained next.
Chapter 4.3.2: Threshold Testing
For the software implementation for Team Four’s final design, two thresholds needed to be
determined when indicating the user of a drop-off. The first threshold was the drop-off
threshold. The drop-off threshold is the distance value that the new and old distance values can
vary by. This is important as new distance values can be a few hundredths of a foot off from the
old distance values when detecting a distance in the same spot. The second threshold that Team
Four needed to determine was the minimum height threshold. The minimum height threshold is
important for the design implementation, as it does not allow the Smart Walker device to falsely
trigger when a rapid change in short distance readings change. A great example of this is the
scenario when someone would walk past the LiDAR Lite sensors.
Team Four determined the drop-off threshold by conducting multiple tests. Team Four first
tested the change in distance by observing the change in a universal stairway. At the top of the
stairway, Team Four observed the changes in distance as the walker approached the drop-off.
Before the Smart Walker device detected the distance, it had a distance reading of 6.20’. When
the device detected the drop-off in the stairway, the distance reading increased to 12.57’. This
test indicated that the sensors were able to detect the distance of the bottom of the stairwell as
Team Four concluded that the change of distance read from the Smart Walker device would vary
for each stairwell due to its size. Team Four then took into consideration the device approaching
a scenario of a one-step drop-off.
Team Four then conducted several one-step drop-off tests of different types of step scenarios.
Team Four conducted the one-step test outside the engineering building. The 8” drop of one step
had a change of distance of about 1’ for the Smart Walker distance readings when a drop-off
occurred. After the first one-step test, Team Four took the Smart Walker device to the
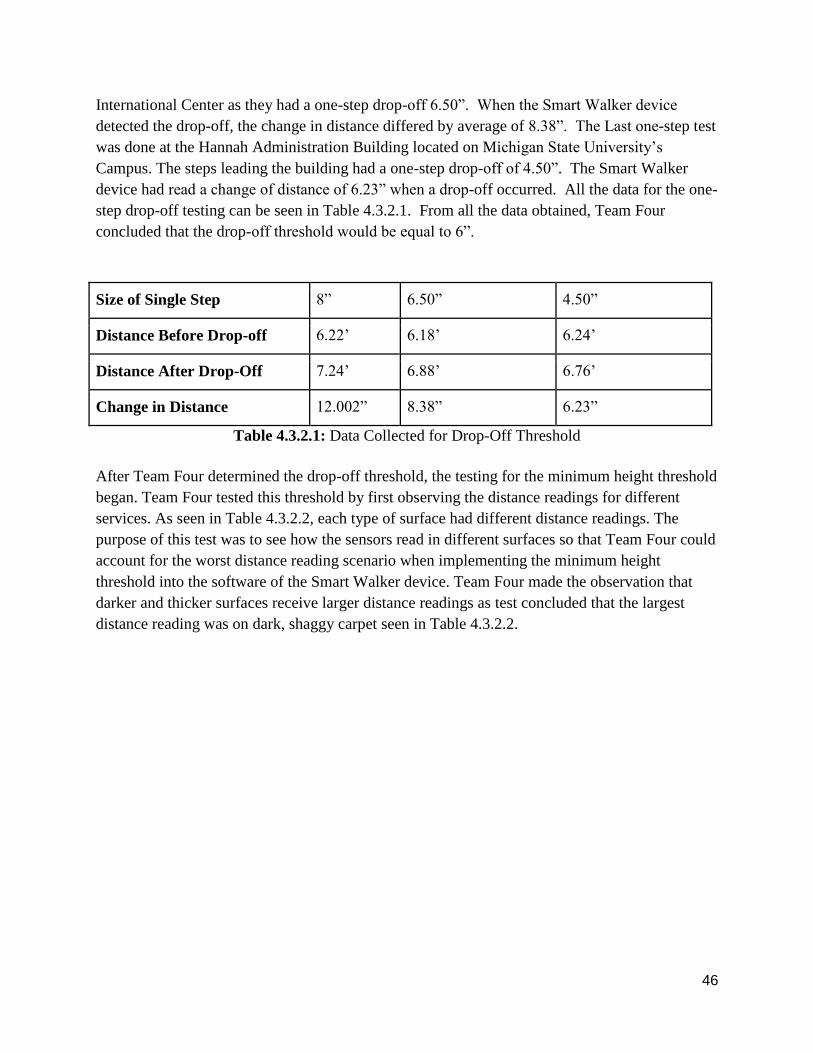
46
International Center as they had a one-step drop-off 6.50”. When the Smart Walker device
detected the drop-off, the change in distance differed by average of 8.38”. The Last one-step test
was done at the Hannah Administration Building located on Michigan State University’s
Campus. The steps leading the building had a one-step drop-off of 4.50”. The Smart Walker
device had read a change of distance of 6.23” when a drop-off occurred. All the data for the one-
step drop-off testing can be seen in Table 4.3.2.1. From all the data obtained, Team Four
concluded that the drop-off threshold would be equal to 6”.
Size of Single Step 8” 6.50” 4.50”
Distance Before Drop-off 6.22’ 6.18’ 6.24’
Distance After Drop-Off 7.24’ 6.88’ 6.76’
Change in Distance 12.002” 8.38” 6.23”
Table 4.3.2.1: Data Collected for Drop-Off Threshold
After Team Four determined the drop-off threshold, the testing for the minimum height threshold
began. Team Four tested this threshold by first observing the distance readings for different
services. As seen in Table 4.3.2.2, each type of surface had different distance readings. The
purpose of this test was to see how the sensors read in different surfaces so that Team Four could
account for the worst distance reading scenario when implementing the minimum height
threshold into the software of the Smart Walker device. Team Four made the observation that
darker and thicker surfaces receive larger distance readings as test concluded that the largest
distance reading was on dark, shaggy carpet seen in Table 4.3.2.2.

47
Surface Type Surface color Average Distance Reading
Hard, Glossy Light Colored 6.18’
Hard, Glossy Dark Colored 6.21’
Thin Carpet Light Colored 6.23’
Thin Carpet Dark Colored 6.25’
Thick Carpet Light Colored 6.27’
Thick Carpet Dark Colored 6.32’
Shaggy Carpet Light Colored 6.38’
Shaggy Carpet Dark Colored 6.49’
Wood Floor Light Colored 6.18’
Wood Floor Dark Colored 6.22’
Black Top (outside) Black 6.26’
Concrete Grey 6.21’
Grass Green 6.27’
Dirt Trail Brown 6.31’
Table 4.3.2.2: Data Collected for Minimum Height Threshold
The last test Team Four conducted before determining the minimum height threshold was testing
the Smart Walker device on a declination. Team Four chose to test the scenario on the second
floor of the Engineering Building right in front of Professor Udpa’s Office. Team Four chose this
area for testing as it had a larger decline than normal public decline surface areas. This allowed
Team Four to test the Smart Walker device in a worst case scenario for declined surfaces. When
the Smart Walker device for this experiment was sensing leveled ground, the distance reading
came to 6.24’. Then when the walker was placed at the top of the decline surface area while still
being leveled to normal ground as shown in Figures 4.3.2.1 and 4.3.2.2, the Smart Walker device
was reading a distance of 6.71’. As the walker then rolled down the declination plane, it read the
distance of 6.22’ feet again as the Smart Walker device was leveled with the decline. After
conducting this test, Team Four concluded that the minimum height threshold would be equal to
6.8’. Team Four chose this value since it withstood in the range of the 6.24’ plus the drop-off
threshold (6.84’).
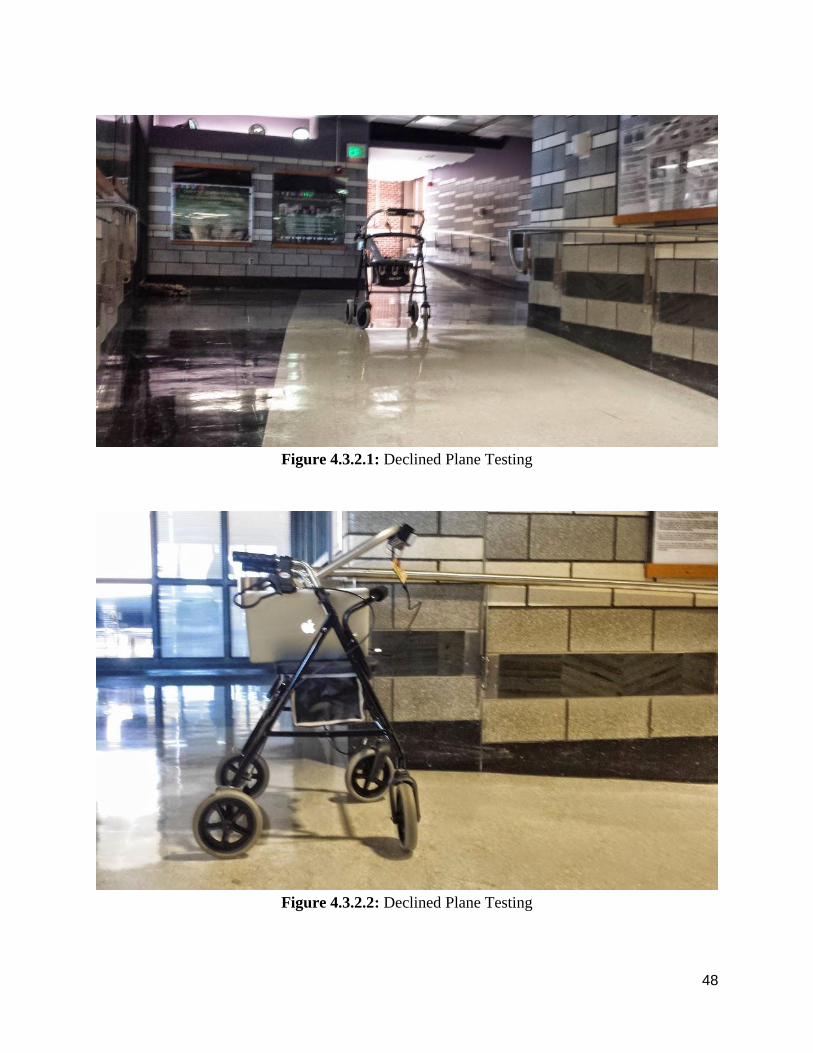
48
Figure 4.3.2.1: Declined Plane Testing
Figure 4.3.2.2: Declined Plane Testing

49
Chapter 4.3.3: Feedback system
With the LiDAR sensors chosen, the next step was to test triggering the feedback system from
the Arduino Nano microcontroller. The test would provide information regarding if the software
implemented would trigger the feedback system, if the feedback system is loud enough, and if
the feedback system could be powered by the microcontroller. Two options for the feedback
system were tested. The first consisted of using the capabilities of the Arduino Nano. Arduino
has a Tone library that allows to send frequencies to a pin. This was tested and succeeded in
being triggered when a drop-off was detected however, the output of the tone was only 2.5 V and
would be hard to hear in public areas such as near streets or other loud areas. It was concluded to
be too quiet even though it was the simplest implementation. The next step was to test Stephen
Blosser’s piezo speaker circuit, which the implementation took longer to determine as discussed
in Chapter 3. Once the simple power switch was created with a nMOS transistor, the circuit was
tested to see if triggering a pin to write high on the microcontroller would supply the correct gate
voltage to allow the nine volt battery to complete its circuit and trigger the piezo speaker circuit
to turn on. Once that was confirmed, it was tested on a flight of stairs to see if the pin would
trigger high to turn the speakers on when the drop-off was detected and then turn off once the pin
was written low. The thresholds discussed earlier limit when the feedback system runs to only
when the distance change is greater than half a foot of the last distance detected. Also in order
for the feedback system to not go off when people walked in front of the walker or the sensors
detected a wall, the Arduino Nano was programmed where the distance change had to be at least
a half a foot and the distance had to be greater than 6’0”
Chapter 4.3.4: Anker Power Supply
After the sensors and feedback system were incorporated, Team Four needed to confirm that the
Anker power supply would be able to satisfy the power demand of the Smart Walker device for
an entire day. For this test, the team set the device to run for a 16 hour day. The walker was set
up in the lab at 8:00 AM with a fully charged power supply and ran continuously until 12:00
AM. The microcontroller was reprogrammed to trigger the piezo speakers anytime the distance
being detected changed. This was done in order to keep the Smart Walker in one location while
testing the battery life so a drop-off was not needed. Members of the team would come in
through the day to trigger the alarm. At the end, the alarm was triggered 50 times and the Anker
power supply was sufficient in powering the device for a 16 hour day. It was expected that the
power supply would last through a full day of usage, since it operates at 13000 mAh. These
assumptions were confirmed through calculations done in Chapter 3. The current draw from the
two sensors, the feedback system with two piezo speakers, the microcontroller, and I2C
multiplexer chip can be supplied by the Anker power supply for up to two days.
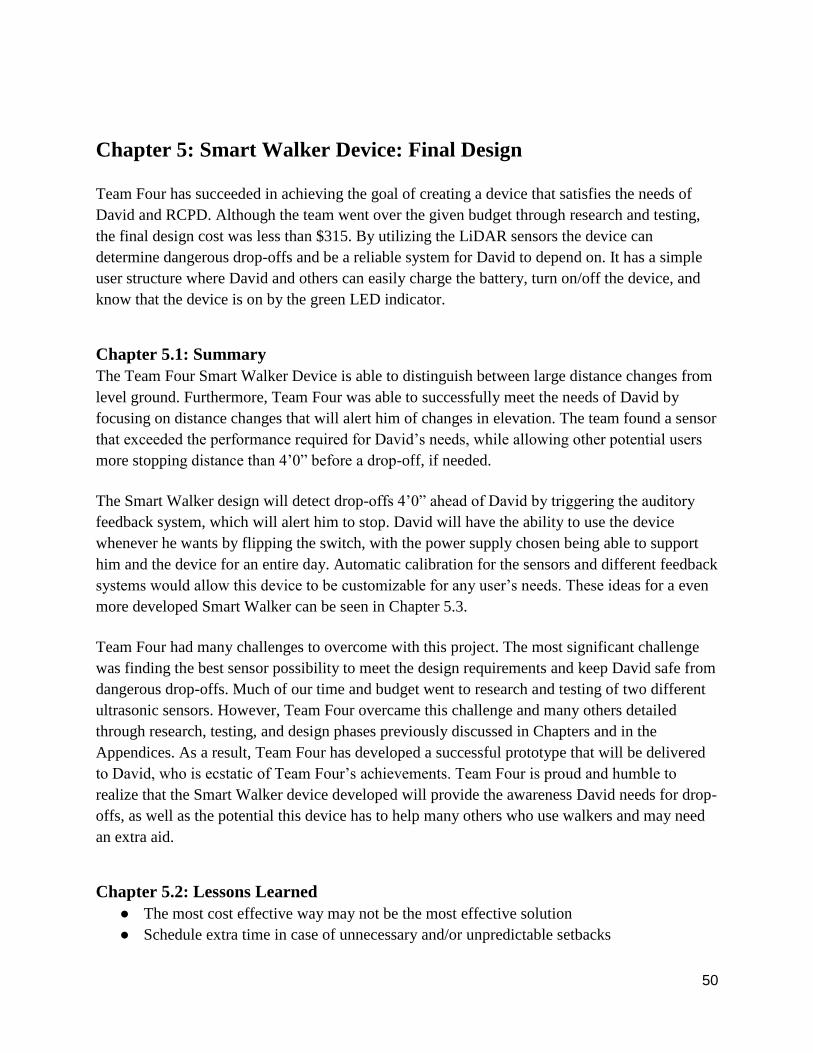
50
Chapter 5: Smart Walker Device: Final Design
Team Four has succeeded in achieving the goal of creating a device that satisfies the needs of
David and RCPD. Although the team went over the given budget through research and testing,
the final design cost was less than $315. By utilizing the LiDAR sensors the device can
determine dangerous drop-offs and be a reliable system for David to depend on. It has a simple
user structure where David and others can easily charge the battery, turn on/off the device, and
know that the device is on by the green LED indicator.
Chapter 5.1: Summary
The Team Four Smart Walker Device is able to distinguish between large distance changes from
level ground. Furthermore, Team Four was able to successfully meet the needs of David by
focusing on distance changes that will alert him of changes in elevation. The team found a sensor
that exceeded the performance required for David’s needs, while allowing other potential users
more stopping distance than 4’0” before a drop-off, if needed.
The Smart Walker design will detect drop-offs 4’0” ahead of David by triggering the auditory
feedback system, which will alert him to stop. David will have the ability to use the device
whenever he wants by flipping the switch, with the power supply chosen being able to support
him and the device for an entire day. Automatic calibration for the sensors and different feedback
systems would allow this device to be customizable for any user’s needs. These ideas for a even
more developed Smart Walker can be seen in Chapter 5.3.
Team Four had many challenges to overcome with this project. The most significant challenge
was finding the best sensor possibility to meet the design requirements and keep David safe from
dangerous drop-offs. Much of our time and budget went to research and testing of two different
ultrasonic sensors. However, Team Four overcame this challenge and many others detailed
through research, testing, and design phases previously discussed in Chapters and in the
Appendices. As a result, Team Four has developed a successful prototype that will be delivered
to David, who is ecstatic of Team Four’s achievements. Team Four is proud and humble to
realize that the Smart Walker device developed will provide the awareness David needs for drop-
offs, as well as the potential this device has to help many others who use walkers and may need
an extra aid.
Chapter 5.2: Lessons Learned
● The most cost effective way may not be the most effective solution
● Schedule extra time in case of unnecessary and/or unpredictable setbacks

51
● Test one sensor to confirm operation and performance before buying bulk
Chapter 5.3: Improvements to Consider
● Auto-Calibration of Sensors to Designated Alert Distance Before Drop-Off
The ability to allow the sensors to auto-calibrate would allow the Smart Walker device to be sold
to users without having to calibrate the sensors to a certain angle of detection by hand. This
would eliminate human error encountered if the sensor’s position was compromised as the auto-
calibration would realign them. For user convenience three (or more) distance detection
selections of drop-offs could be offered. A simple instruction booklet or DVD could illustrate
how to choose the distance a user needs in front of their walker when a drop-off is detected. This
can be done through determining response time and seeking advice from the user’s physician. An
idea to create the auto-calibration would be to use servo or stepper motors that would rotate the
housing until the sensors read the distance that would calculate the desired distance being
detected.
● Implement Any Desired Feedback Alert System
Other forms of feedback, other than auditory may and will be desired if the Smart Walker device
is in production. These could include haptic and visual feedback systems to alert the user with the
following disabilities and limitations:
Deaf or Hearing Impaired User: For a user with hearing impairment(s), a visual warning
would be the best way to gain the attention of the user. Various cues could be chosen, but
an LED warning light would be the simplest solution due to its ease of integration and
low cost.
Deaf or Hearing Impaired & Blind or Visually Impaired User: For a user with both
hearing and visual impairment(s), a haptic form of feedback would be the best means of
warning. Since the user is in constant contact with the handles of the walker, feedback
routed through this area would be the best solution. A small piezoelectric motor could be
utilized to send vibrations throughout the handles of the walker to warn the user.

52
Appendix 1: Individual Roles and Responsibilities
Pictured from left to right: Dominic Hill, Jeff Hancock, Sean Moore, Trevor Dirheimer, Yakov Kochubievsky
Chapter 6.1: Trevor Dirheimer
Mr. Dirheimer’s non-technical role is Presentation Preparation. Mr. Dirheimer managed the
presentation slides and set the basic presentation layout.
Mr. Dirheimer first technical role was hardware design. Mr. Dirheimer has contributed to
designing the circuitry that interfaces the sound generator circuit with the microcontroller
through the transistor power switch circuit. In collaboration with Mr. Kochubievsky, the idea to
use a nMOS transistor for the power switch was researched. Mr. Dirheimer determined how
IRF530N transistor would operate in the power switch. By creating this circuit, Mr. Dirheimer
succeeded in implementing the desired feedback system into the Smart Walker design.
Mr. Dirheimer’s second technical role is microcontroller programmer/software tester. In
collaboration with Mr. Moore, Mr. Dirheimer determined the correct pinout for the Arduino
Nano that would interface with the LiDAR sensors by using the I2C bus communication. Mr.
Dirheimer and Mr. Moore determined when the Smart Walker device would alert the user when

53
a drop-off is ahead by developing an algorithmic program that implemented the distance
thresholds found from sensor testing.
Chapter 6.2: Jeffrey Hancock
Mr. Hancock’s non-technical role is Manager. Mr. Hancock managed the team by facilitating
meeting times and keeping Team Four organized.
Mr. Hancock’s first technical role was prototype planning. Along with other team members, he
explored the feasibility and implementation of various prototype designs. Construction and
testing of prototypes was also completed by Mr. Hancock as well as other team members.
Decisions based upon such feasibility were made by all team members with equal input.
Mr. Hancock’s second technical role was collaborating on hardware component selection and
implementation of a power supply with Mr. Hill and Mr. Kochubievsky. In addition to this,
support was provided by Mr. Hancock for testing of other functionality issues.
Chapter 6.3: Dominic Hill
Mr. Hill’s non-technical role is Documentation Preparation. Mr. managed the technical
documentation referenced throughout the design process as well as formatting any technical
documentation written by the team to support the design.
Mr. Hill’s first technical role was power consideration. Throughout the prototyping process Mr.
Hill performed power consumption calculations to ensure the supply would be suitable to handle
the demands of the systems that were under investigation. Mr. Hill ensured that all components
could be sufficiently powered via a single source, including implementing dc to dc converters to
facilitate components whose operation required a higher or lower potential than what the supply
produced.
Mr. Hill’s second technical role was to provide general circuit support with Mr. Hancock and
Mr. Kochubievsky. This included interfacing circuit subsystems, soldering connections, and
circuit troubleshooting.
Chapter 6.4: Yakov Kochubievsky
Mr. Kochubievsky’s non-technical role is Web Designer. Mr. Kochubievsky created and
maintained Team Four’s website.
Mr. Kochubievsky’s first technical role was sensor research, implementation, and testing. Mr.
Kochubievsky reached out to various sensor manufacturers to get specifications and pricing
information on all sensors tested. Mr. Kochubievsky along with Mr. Moore, and Mr. Dirheimer
determined the initial setup to operate and test the distance sensors. Mr. Kochubievsky
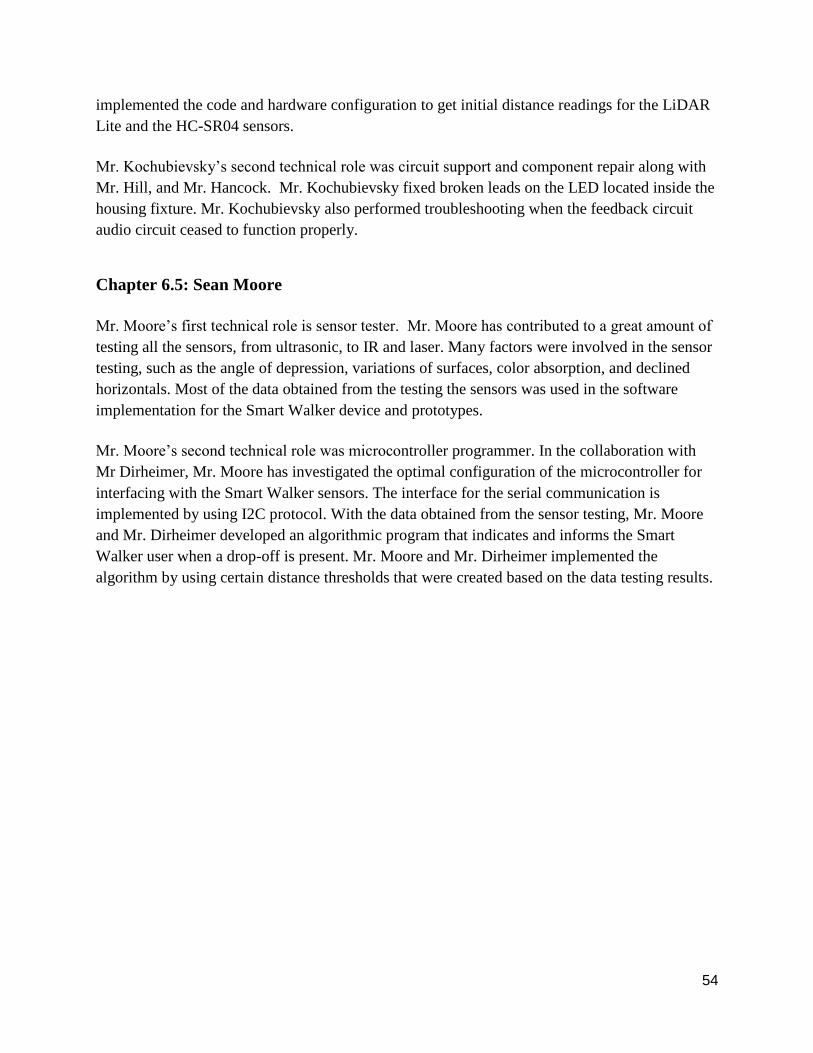
54
implemented the code and hardware configuration to get initial distance readings for the LiDAR
Lite and the HC-SR04 sensors.
Mr. Kochubievsky’s second technical role was circuit support and component repair along with
Mr. Hill, and Mr. Hancock. Mr. Kochubievsky fixed broken leads on the LED located inside the
housing fixture. Mr. Kochubievsky also performed troubleshooting when the feedback circuit
audio circuit ceased to function properly.
Chapter 6.5: Sean Moore
Mr. Moore’s first technical role is sensor tester. Mr. Moore has contributed to a great amount of
testing all the sensors, from ultrasonic, to IR and laser. Many factors were involved in the sensor
testing, such as the angle of depression, variations of surfaces, color absorption, and declined
horizontals. Most of the data obtained from the testing the sensors was used in the software
implementation for the Smart Walker device and prototypes.
Mr. Moore’s second technical role was microcontroller programmer. In the collaboration with
Mr Dirheimer, Mr. Moore has investigated the optimal configuration of the microcontroller for
interfacing with the Smart Walker sensors. The interface for the serial communication is
implemented by using I2C protocol. With the data obtained from the sensor testing, Mr. Moore
and Mr. Dirheimer developed an algorithmic program that indicates and informs the Smart
Walker user when a drop-off is present. Mr. Moore and Mr. Dirheimer implemented the
algorithm by using certain distance thresholds that were created based on the data testing results.

55
Appendix 2 - References and Data Sheets
Website References
Arduino Nano Microcontroller
<http://www.arduino.cc/en/Main/arduinoBoardNano>
Arduino Board Pinouts
<https://bigdanzblog.wordpress.com/2015/01/30/cant-get-i2c-to-work-on-an-arduino-
nano-pinout-diagrams/>
I2C Communication
<https://learn.sparkfun.com/tutorials/i2c>
<http://www.totalphase.com/support/articles/200349156-I2C-Background>
NXP PCA9544A Information
<http://www.nxp.com/products/interface_and_connectivity/i2c/i2c_multiplexers_switche
s/series/PCA9544A.html>
Start Up Guides with Arduino and LiDAR sensors
<https://github.com/PulsedLight3D/LIDARLite_Basics>
<https://github.com/PulsedLight3D/LIDARLite_MultiSensor_w_PCA9544A_Multiplexe
r>
Data Sheets
HCSR04 Ultrasonic Sensor
<http://www.micropik.com/PDF/HCSR04.pdf>
IRF530N Transistor
<http://pdf.datasheetcatalog.com/datasheet/fairchild/IRF530N.pdf>
LiDAR Lite Laser Module Sensor
<https://s3.amazonaws.com/cdn.freshdesk.com/data/helpdesk/attachments/production/50
07466446/original/LIDAR-Lite-Laser-
Datasheet.pdf?AWSAccessKeyId=AKIAJ2JSYZ7O3I4JO6DA&Expires=1430279192&
Signature=qB3n4UA%2FfSEf7qXz8%2FOuSRkUqhU%3D&response-content-
type=application%2Fpdf>
NXP PCA9555A Multiplexer Chip
<http://www.nxp.com/products/interface_and_connectivity/i2c/i2c_multiplexers_switche
s/series/PCA9544A.html>
Parallax Propeller Activity Board Microcontroller
<https://www.parallax.com/sites/default/files/downloads/P8X32A-Propeller-Datasheet-
v1.4.0_0.pdf>
<http://www.adafruit.com/datasheets/32910-Propeller-Activity-Board-Guide-v1.0.pdf>
PING))) Ultrasonic Distance Sensor
<http://www.cypress.com/?docID=43639>
TI MSP430 Microcontroller
<http://www.ti.com/lit/ds/symlink/msp430g2213.pdf>
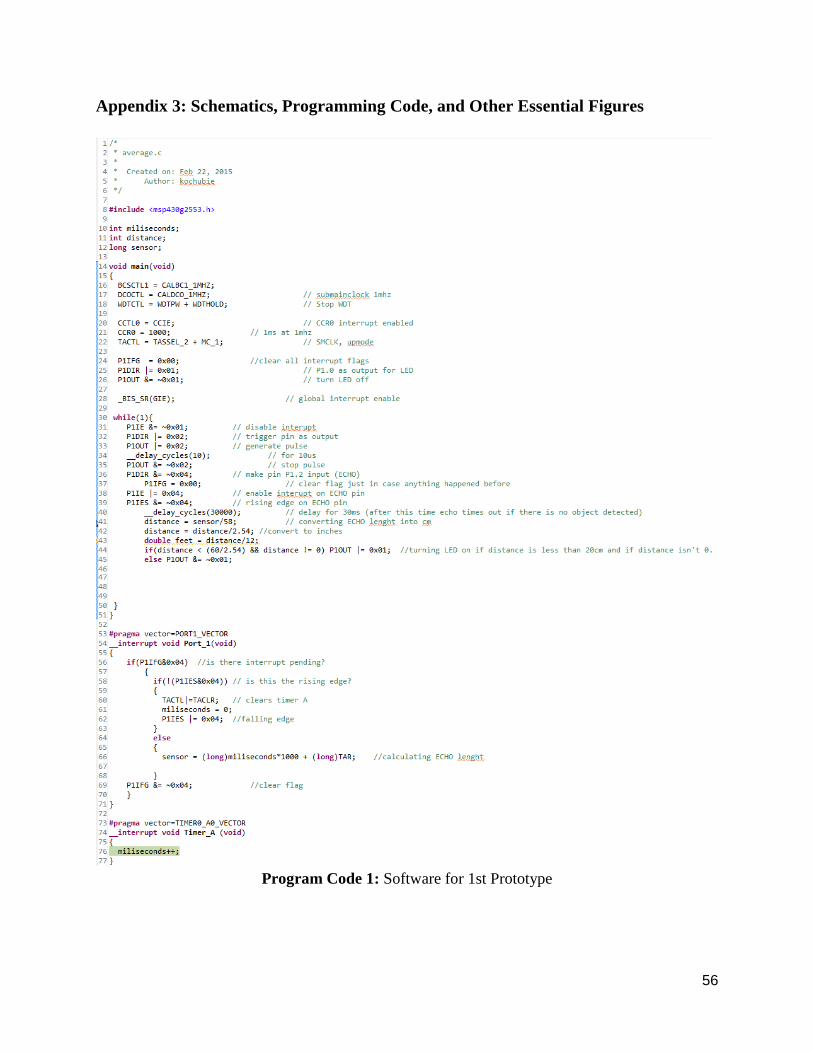
56
Appendix 3: Schematics, Programming Code, and Other Essential Figures
Program Code 1: Software for 1st Prototype
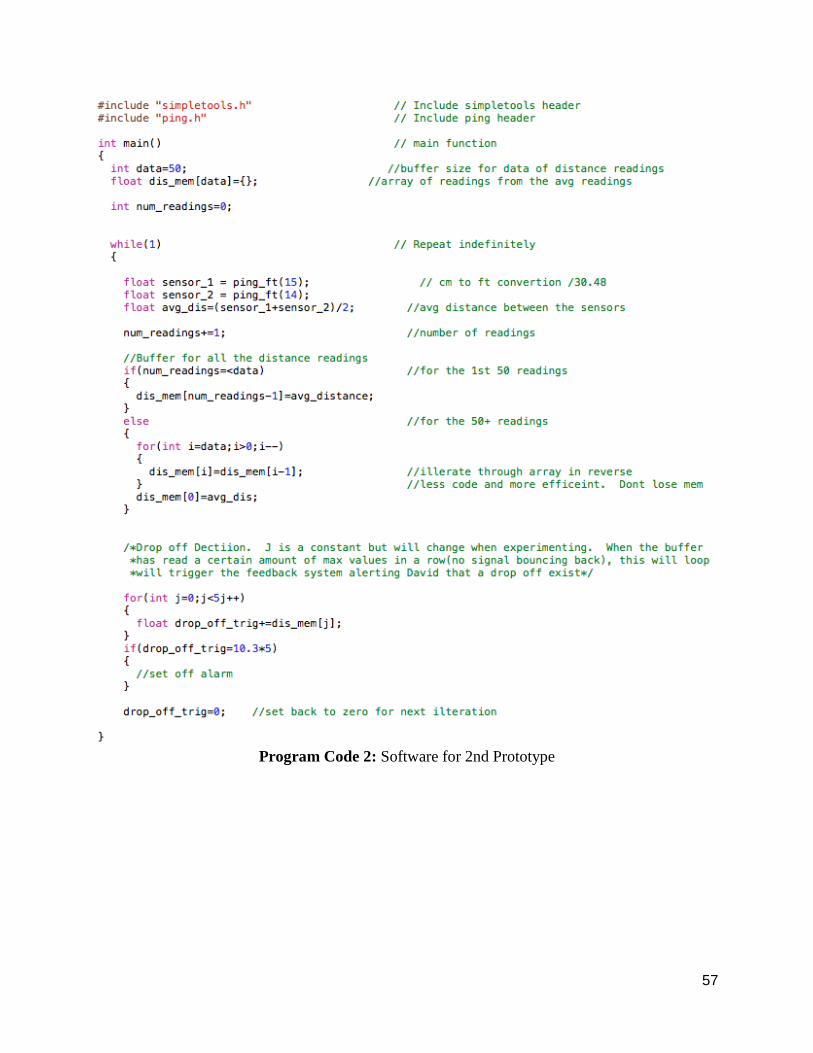
57
Program Code 2: Software for 2nd Prototype

58

59
Program Code 3: Software for Final Prototype
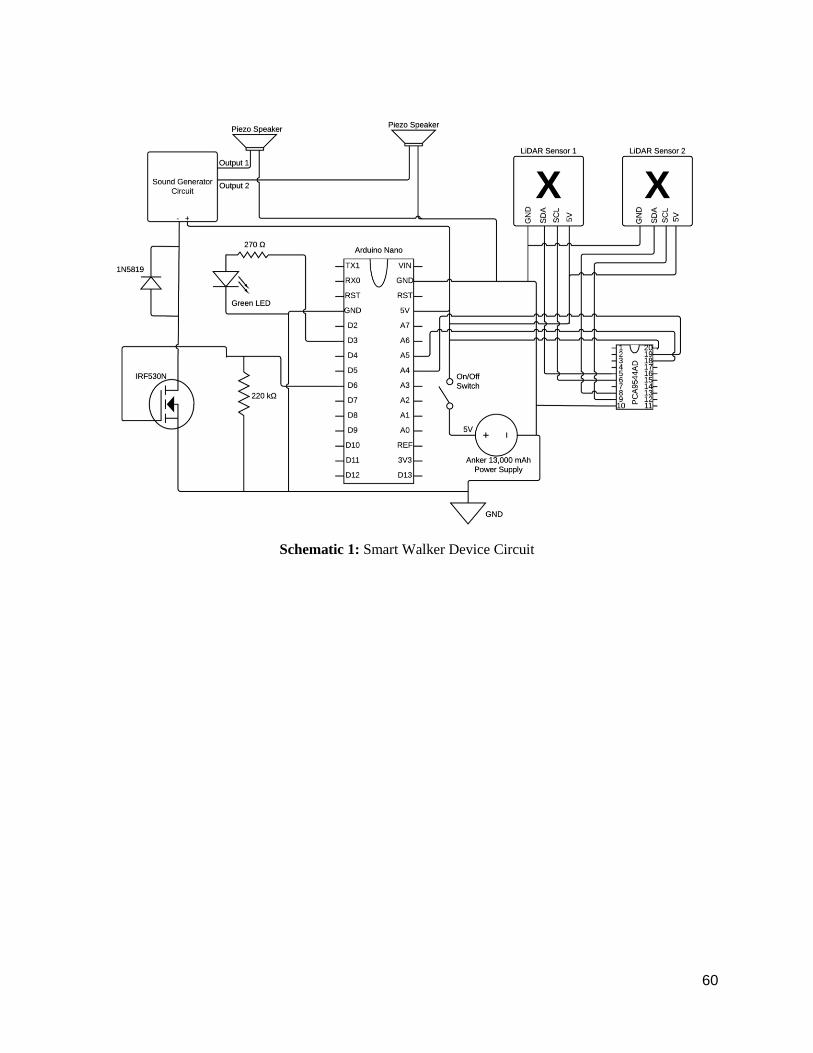
60
Schematic 1: Smart Walker Device Circuit

61
Schematic 2: Wire Layout for Sound Generator Circuit
62
PCB Layout: PCB Design of Sound Generator