Embed Size (px)
Citation preview
Smart Playbook
Dealmaker Smart Playbook puts you in control of the buying process, increases sales velocity throughthe sales cycle and delivers objective and accurate sales forecasts. It connects the dots betweencustomer activity and deal progress. Using Quicklinks, you link the right sales tools to each stage of thedeal. Your sales forecast is based on the same objective criteria for each sales person and is based onfact, not opinion. The playbook is tailored for your business with the step-by-step approach needed toclose the deal, and the intelligent forecasting engine predicts accurate close dates and closureprobabilities to save you from wasting time building and updating sales forecasts.
Smart Playbook is a combination of sales process(es) and the associated content items that are attachedusing the Quicklinks capability in Dealmaker.
Your forecasting ability is enhanced through the Team Views tab that provides insight into salesopportunities that Dealmaker identifies as being available to close within a date range that you select,for one or many sales processes, and for an individual or team in the reporting hierarchy.
2
Smart PlaybookSmart Playbook in Dealmaker is a combination of sales process(es) and the associated content itemsthat are attached using the Quicklinks capability in Dealmaker. Your sales processes will be configuredwhen Dealmaker is deployed and may be modified subsequently by your Dealmaker administrator. Youmay have one or multiple sales processes, depending on the complexity of your business.
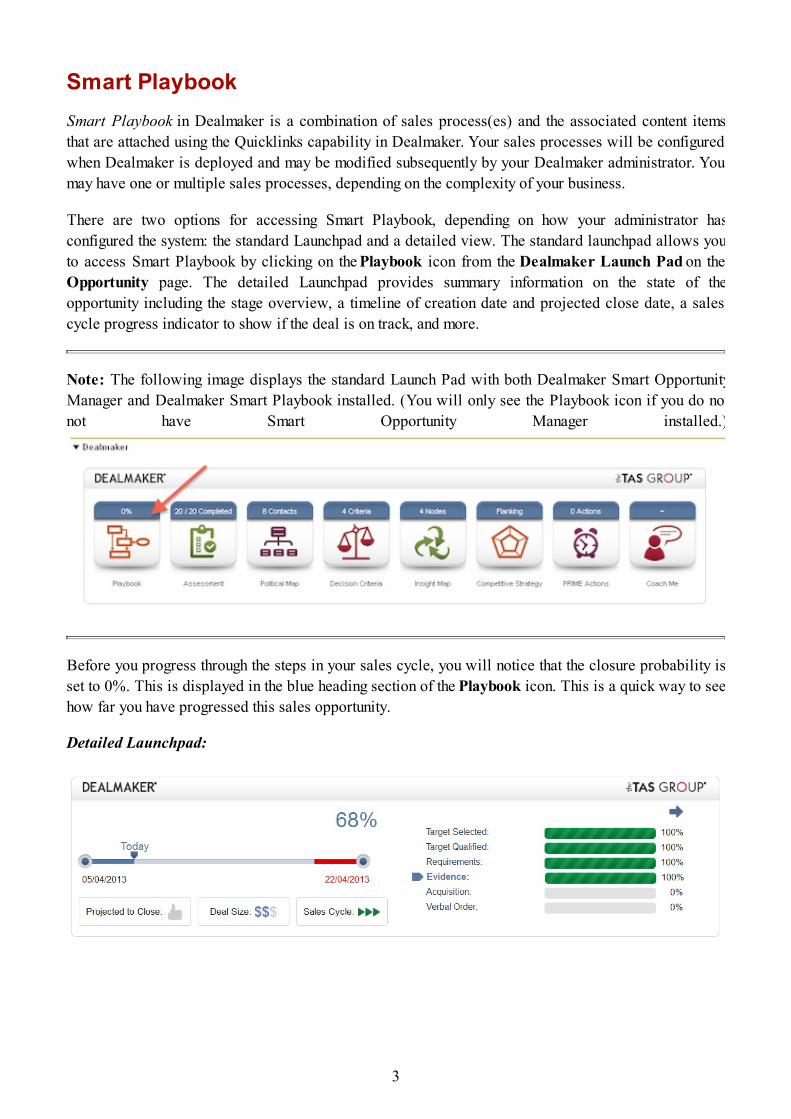
There are two options for accessing Smart Playbook, depending on how your administrator hasconfigured the system: the standard Launchpad and a detailed view. The standard launchpad allows youto access Smart Playbook by clicking on the Playbook icon from the Dealmaker Launch Pad on theOpportunity page. The detailed Launchpad provides summary information on the state of theopportunity including the stage overview, a timeline of creation date and projected close date, a salescycle progress indicator to show if the deal is on track, and more.
Note: The following image displays the standard Launch Pad with both Dealmaker Smart OpportunityManager and Dealmaker Smart Playbook installed. (You will only see the Playbook icon if you do notnot have Smart Opportunity Manager installed.)
Before you progress through the steps in your sales cycle, you will notice that the closure probability isset to 0%. This is displayed in the blue heading section of the Playbook icon. This is a quick way to seehow far you have progressed this sales opportunity.
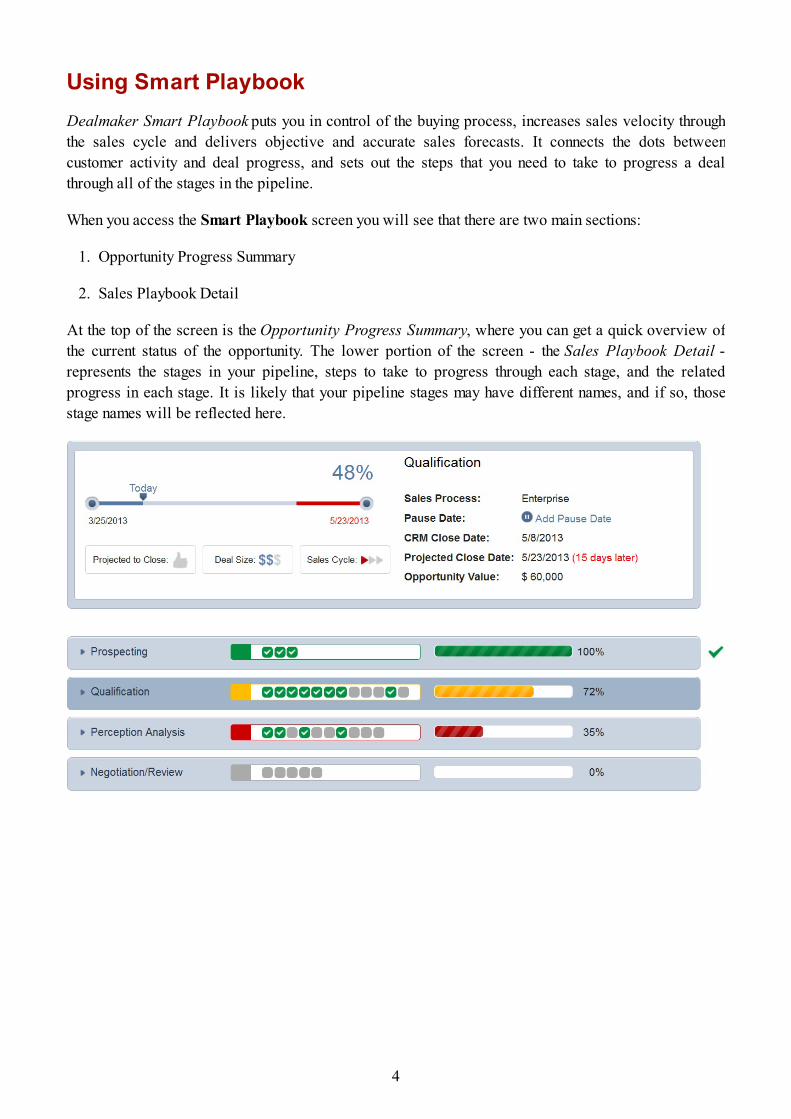
Detailed Launchpad:
3
Using Smart PlaybookDealmaker Smart Playbook puts you in control of the buying process, increases sales velocity throughthe sales cycle and delivers objective and accurate sales forecasts. It connects the dots betweencustomer activity and deal progress, and sets out the steps that you need to take to progress a dealthrough all of the stages in the pipeline.
When you access the Smart Playbook screen you will see that there are two main sections:
1. Opportunity Progress Summary
2. Sales Playbook Detail
At the top of the screen is the Opportunity Progress Summary, where you can get a quick overview ofthe current status of the opportunity. The lower portion of the screen - the Sales Playbook Detail -represents the stages in your pipeline, steps to take to progress through each stage, and the relatedprogress in each stage. It is likely that your pipeline stages may have different names, and if so, thosestage names will be reflected here.
4
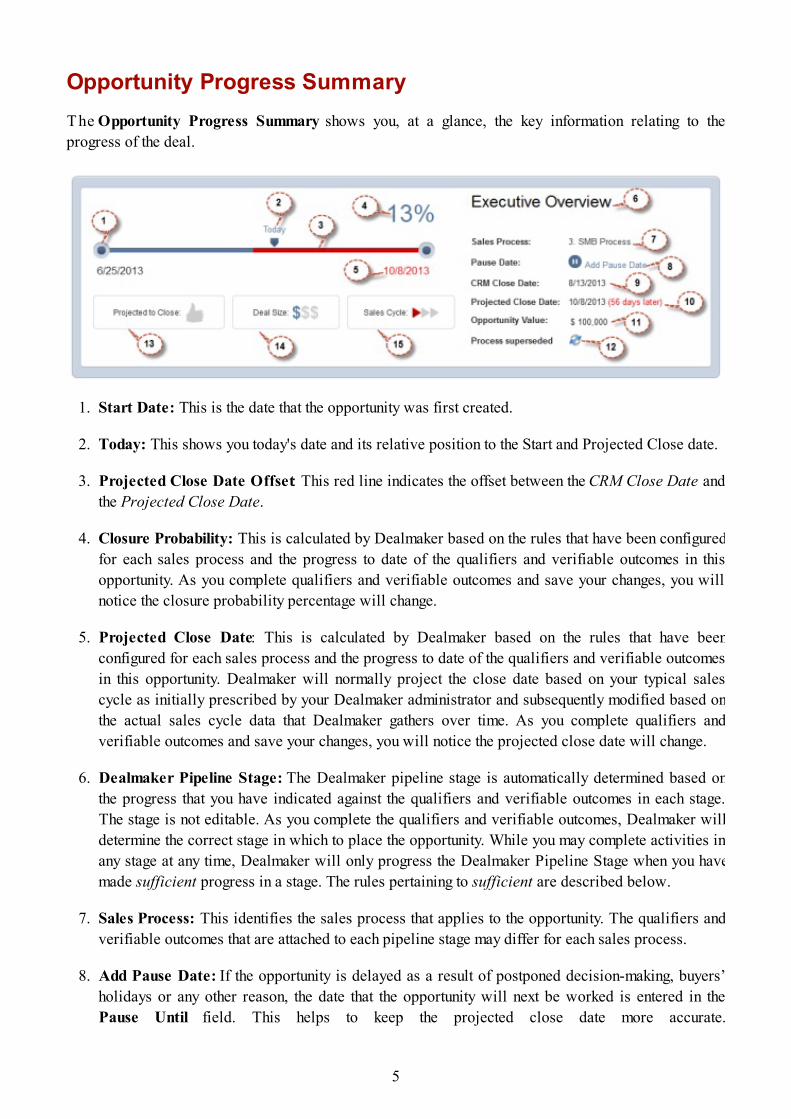
Opportunity Progress SummaryThe Opportunity Progress Summary shows you, at a glance, the key information relating to theprogress of the deal.
1. Start Date: This is the date that the opportunity was first created.
2. Today: This shows you today's date and its relative position to the Start and Projected Close date.
3. Projected Close Date Offset: This red line indicates the offset between the CRM Close Date andthe Projected Close Date.
4. Closure Probability: This is calculated by Dealmaker based on the rules that have been configuredfor each sales process and the progress to date of the qualifiers and verifiable outcomes in thisopportunity. As you complete qualifiers and verifiable outcomes and save your changes, you willnotice the closure probability percentage will change.
5. Projected Close Date: This is calculated by Dealmaker based on the rules that have beenconfigured for each sales process and the progress to date of the qualifiers and verifiable outcomesin this opportunity. Dealmaker will normally project the close date based on your typical salescycle as initially prescribed by your Dealmaker administrator and subsequently modified based onthe actual sales cycle data that Dealmaker gathers over time. As you complete qualifiers andverifiable outcomes and save your changes, you will notice the projected close date will change.
6. Dealmaker Pipeline Stage: The Dealmaker pipeline stage is automatically determined based onthe progress that you have indicated against the qualifiers and verifiable outcomes in each stage.The stage is not editable. As you complete the qualifiers and verifiable outcomes, Dealmaker willdetermine the correct stage in which to place the opportunity. While you may complete activities inany stage at any time, Dealmaker will only progress the Dealmaker Pipeline Stage when you havemade sufficient progress in a stage. The rules pertaining to sufficient are described below.
7. Sales Process: This identifies the sales process that applies to the opportunity. The qualifiers andverifiable outcomes that are attached to each pipeline stage may differ for each sales process.
8. Add Pause Date: If the opportunity is delayed as a result of postponed decision-making, buyers’holidays or any other reason, the date that the opportunity will next be worked is entered in thePause Until field. This helps to keep the projected close date more accurate.
5
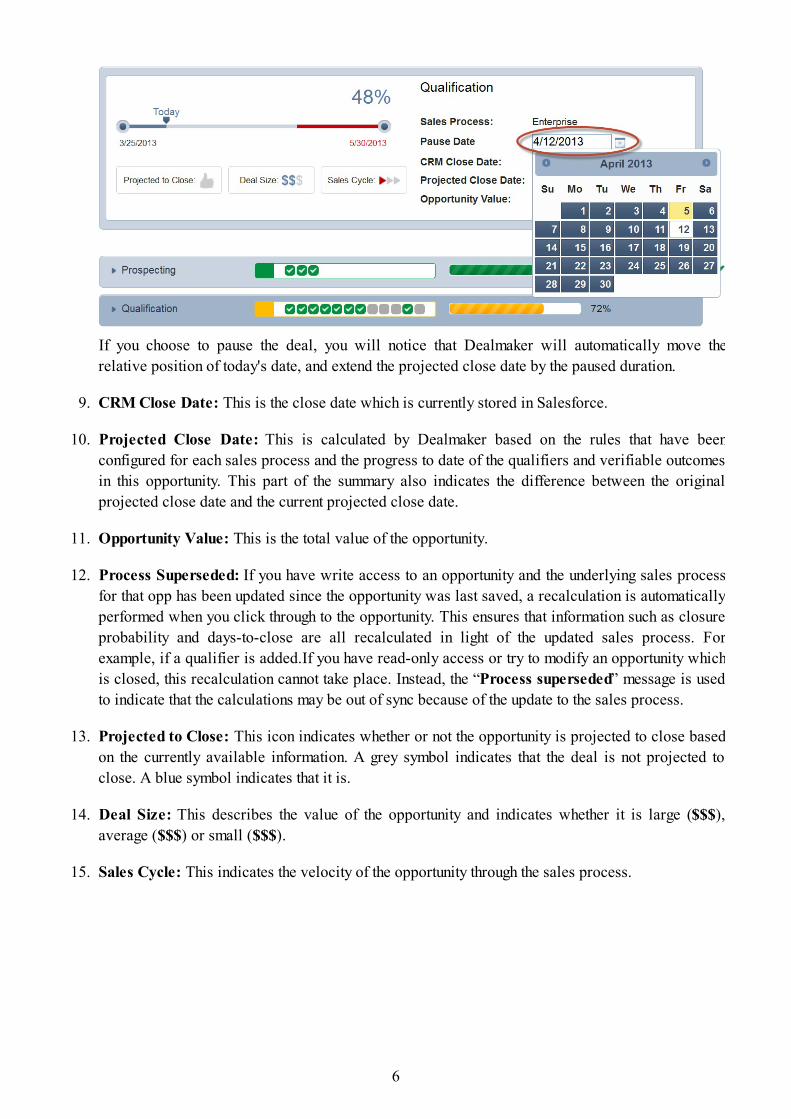
If you choose to pause the deal, you will notice that Dealmaker will automatically move therelative position of today's date, and extend the projected close date by the paused duration.
9. CRM Close Date: This is the close date which is currently stored in Salesforce.
10. Projected Close Date: This is calculated by Dealmaker based on the rules that have beenconfigured for each sales process and the progress to date of the qualifiers and verifiable outcomesin this opportunity. This part of the summary also indicates the difference between the originalprojected close date and the current projected close date.
11. Opportunity Value: This is the total value of the opportunity.
12. Process Superseded: If you have write access to an opportunity and the underlying sales processfor that opp has been updated since the opportunity was last saved, a recalculation is automaticallyperformed when you click through to the opportunity. This ensures that information such as closureprobability and days-to-close are all recalculated in light of the updated sales process. Forexample, if a qualifier is added.If you have read-only access or try to modify an opportunity whichis closed, this recalculation cannot take place. Instead, the “Process superseded” message is usedto indicate that the calculations may be out of sync because of the update to the sales process.
13. Projected to Close: This icon indicates whether or not the opportunity is projected to close basedon the currently available information. A grey symbol indicates that the deal is not projected toclose. A blue symbol indicates that it is.
14. Deal Size: This describes the value of the opportunity and indicates whether it is large ($$$),average ($$$) or small ($$$).
15. Sales Cycle: This indicates the velocity of the opportunity through the sales process.
6
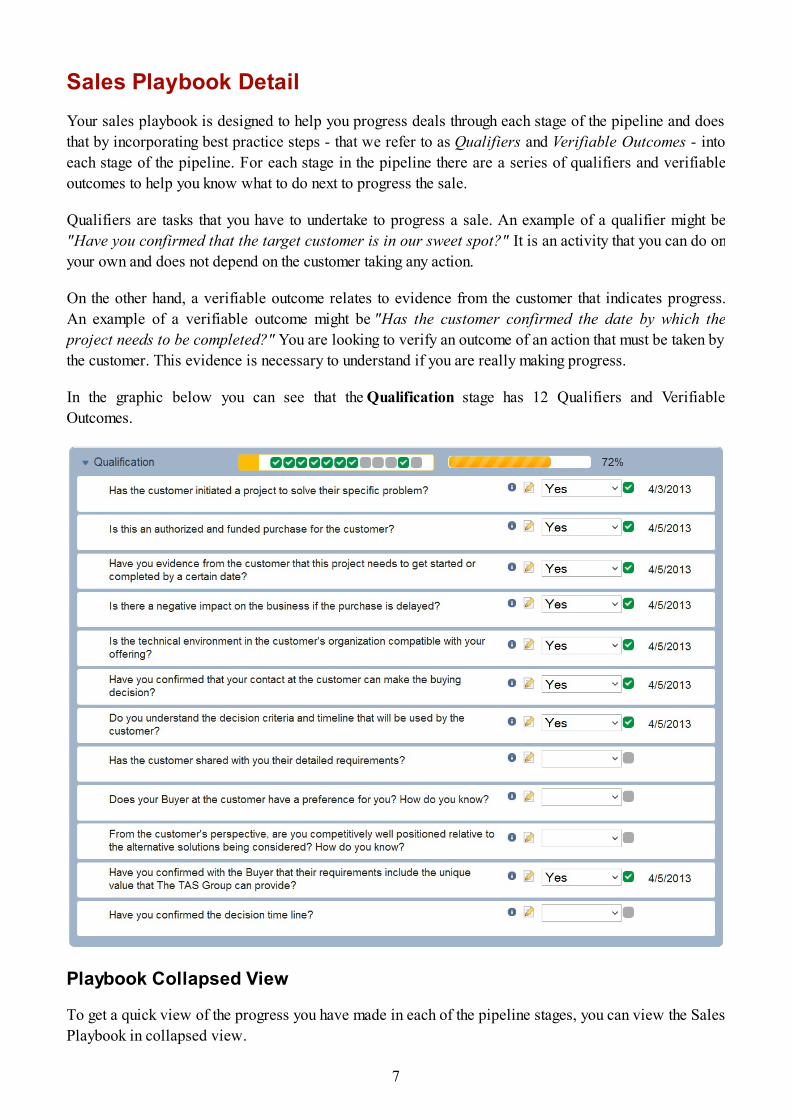
Sales Playbook DetailYour sales playbook is designed to help you progress deals through each stage of the pipeline and doesthat by incorporating best practice steps - that we refer to as Qualifiers and Verifiable Outcomes - intoeach stage of the pipeline. For each stage in the pipeline there are a series of qualifiers and verifiableoutcomes to help you know what to do next to progress the sale.
Qualifiers are tasks that you have to undertake to progress a sale. An example of a qualifier might be"Have you confirmed that the target customer is in our sweet spot?" It is an activity that you can do onyour own and does not depend on the customer taking any action.
On the other hand, a verifiable outcome relates to evidence from the customer that indicates progress.An example of a verifiable outcome might be "Has the customer confirmed the date by which theproject needs to be completed?" You are looking to verify an outcome of an action that must be taken bythe customer. This evidence is necessary to understand if you are really making progress.
In the graphic below you can see that the Qualification stage has 12 Qualifiers and VerifiableOutcomes.
Playbook Collapsed View
To get a quick view of the progress you have made in each of the pipeline stages, you can view the SalesPlaybook in collapsed view.
7
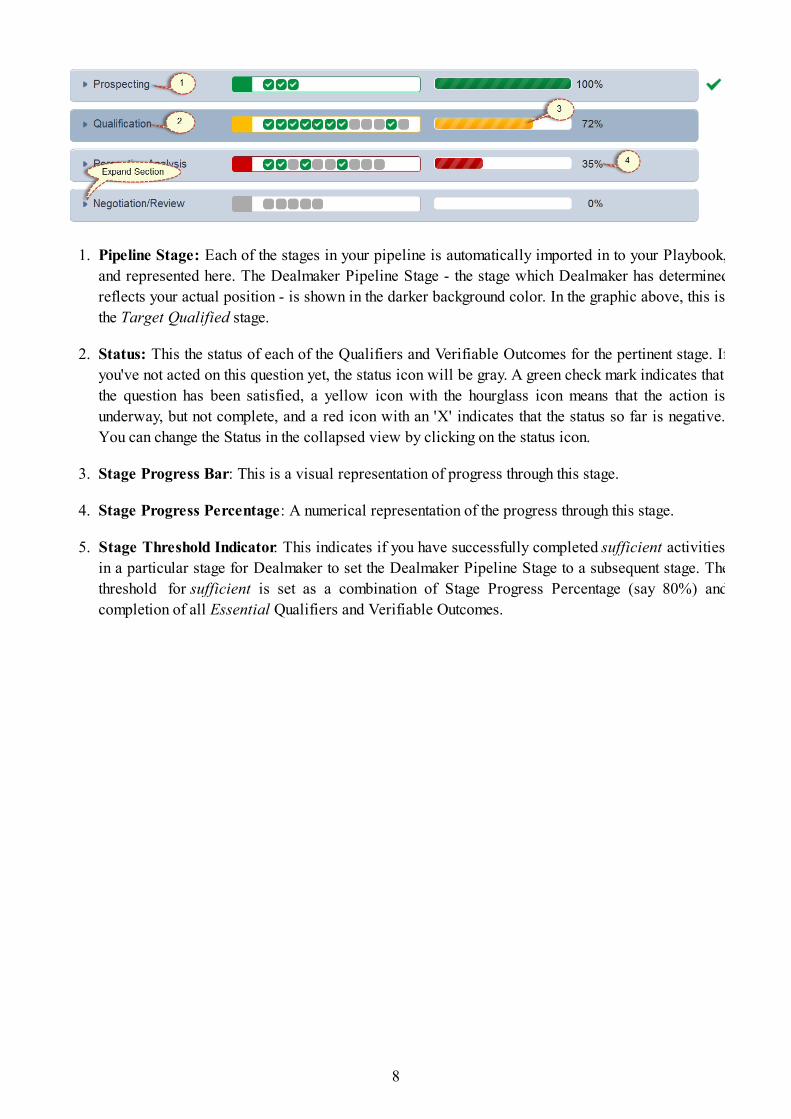
1. Pipeline Stage: Each of the stages in your pipeline is automatically imported in to your Playbook,and represented here. The Dealmaker Pipeline Stage - the stage which Dealmaker has determinedreflects your actual position - is shown in the darker background color. In the graphic above, this isthe Target Qualified stage.
2. Status: This the status of each of the Qualifiers and Verifiable Outcomes for the pertinent stage. Ifyou've not acted on this question yet, the status icon will be gray. A green check mark indicates thatthe question has been satisfied, a yellow icon with the hourglass icon means that the action isunderway, but not complete, and a red icon with an 'X' indicates that the status so far is negative.You can change the Status in the collapsed view by clicking on the status icon.
3. Stage Progress Bar: This is a visual representation of progress through this stage.
4. Stage Progress Percentage: A numerical representation of the progress through this stage.
5. Stage Threshold Indicator: This indicates if you have successfully completed sufficient activitiesin a particular stage for Dealmaker to set the Dealmaker Pipeline Stage to a subsequent stage. Thethreshold for sufficient is set as a combination of Stage Progress Percentage (say 80%) andcompletion of all Essential Qualifiers and Verifiable Outcomes.
8
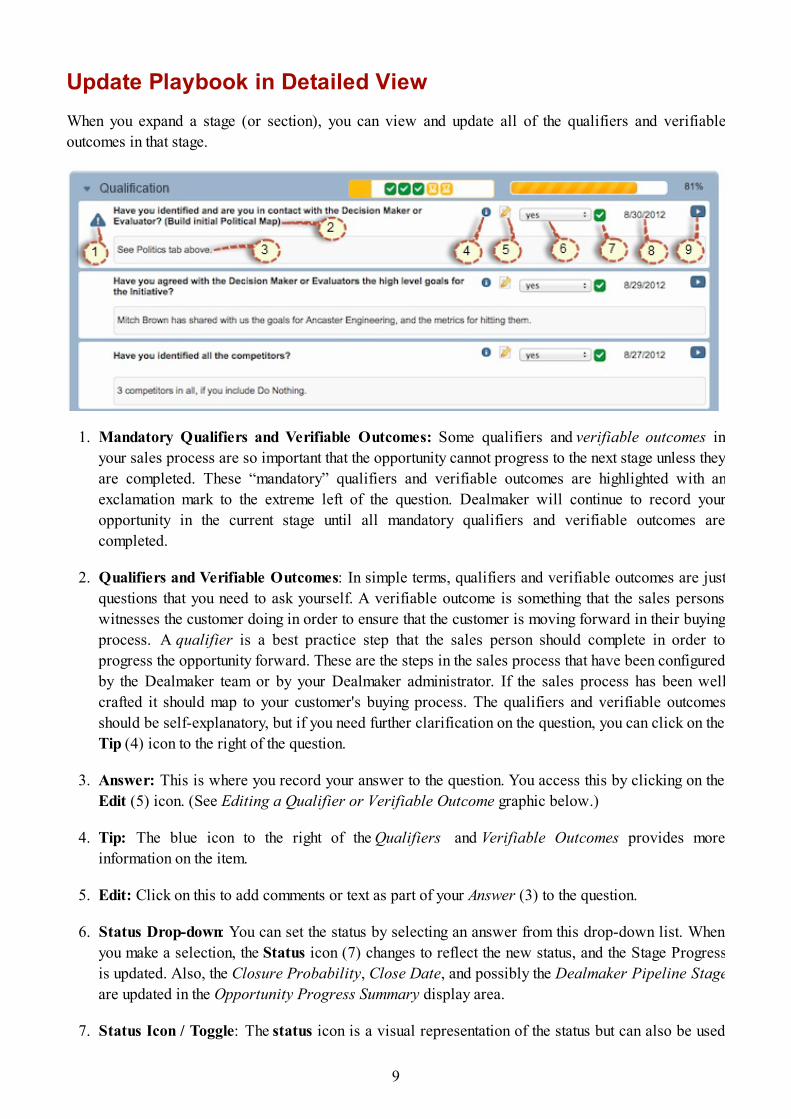
Update Playbook in Detailed ViewWhen you expand a stage (or section), you can view and update all of the qualifiers and verifiableoutcomes in that stage.
1. Mandatory Qualifiers and Verifiable Outcomes: Some qualifiers and verifiable outcomes inyour sales process are so important that the opportunity cannot progress to the next stage unless theyare completed. These “mandatory” qualifiers and verifiable outcomes are highlighted with anexclamation mark to the extreme left of the question. Dealmaker will continue to record youropportunity in the current stage until all mandatory qualifiers and verifiable outcomes arecompleted.
2. Qualifiers and Verifiable Outcomes: In simple terms, qualifiers and verifiable outcomes are justquestions that you need to ask yourself. A verifiable outcome is something that the sales personswitnesses the customer doing in order to ensure that the customer is moving forward in their buyingprocess. A qualifier is a best practice step that the sales person should complete in order toprogress the opportunity forward. These are the steps in the sales process that have been configuredby the Dealmaker team or by your Dealmaker administrator. If the sales process has been wellcrafted it should map to your customer's buying process. The qualifiers and verifiable outcomesshould be self-explanatory, but if you need further clarification on the question, you can click on theTip (4) icon to the right of the question.
3. Answer: This is where you record your answer to the question. You access this by clicking on theEdit (5) icon. (See Editing a Qualifier or Verifiable Outcome graphic below.)
4. Tip: The blue icon to the right of the Qualifiers and Verifiable Outcomes provides moreinformation on the item.
5. Edit: Click on this to add comments or text as part of your Answer (3) to the question.
6. Status Drop-down: You can set the status by selecting an answer from this drop-down list. Whenyou make a selection, the Status icon (7) changes to reflect the new status, and the Stage Progressis updated. Also, the Closure Probability, Close Date, and possibly the Dealmaker Pipeline Stageare updated in the Opportunity Progress Summary display area.
7. Status Icon / Toggle: The status icon is a visual representation of the status but can also be used
9
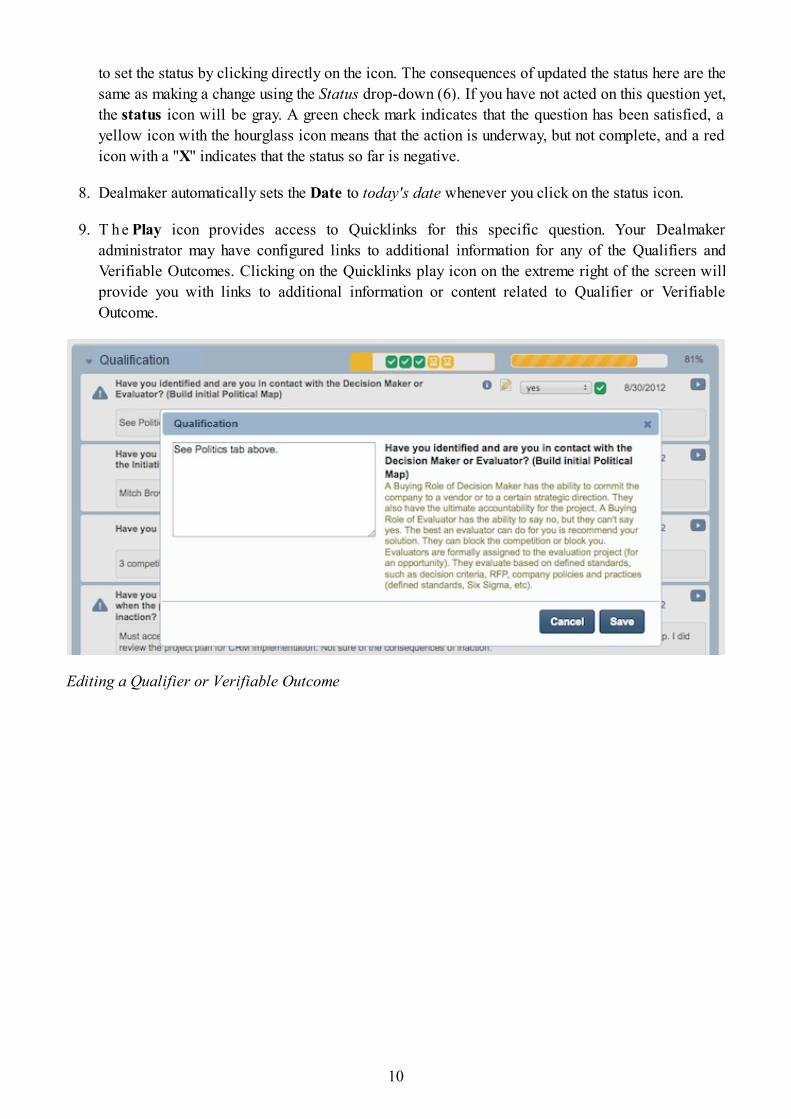
to set the status by clicking directly on the icon. The consequences of updated the status here are thesame as making a change using the Status drop-down (6). If you have not acted on this question yet,the status icon will be gray. A green check mark indicates that the question has been satisfied, ayellow icon with the hourglass icon means that the action is underway, but not complete, and a redicon with a "X" indicates that the status so far is negative.
8. Dealmaker automatically sets the Date to today's date whenever you click on the status icon.
9. T he Play icon provides access to Quicklinks for this specific question. Your Dealmakeradministrator may have configured links to additional information for any of the Qualifiers andVerifiable Outcomes. Clicking on the Quicklinks play icon on the extreme right of the screen willprovide you with links to additional information or content related to Qualifier or VerifiableOutcome.
Editing a Qualifier or Verifiable Outcome
10
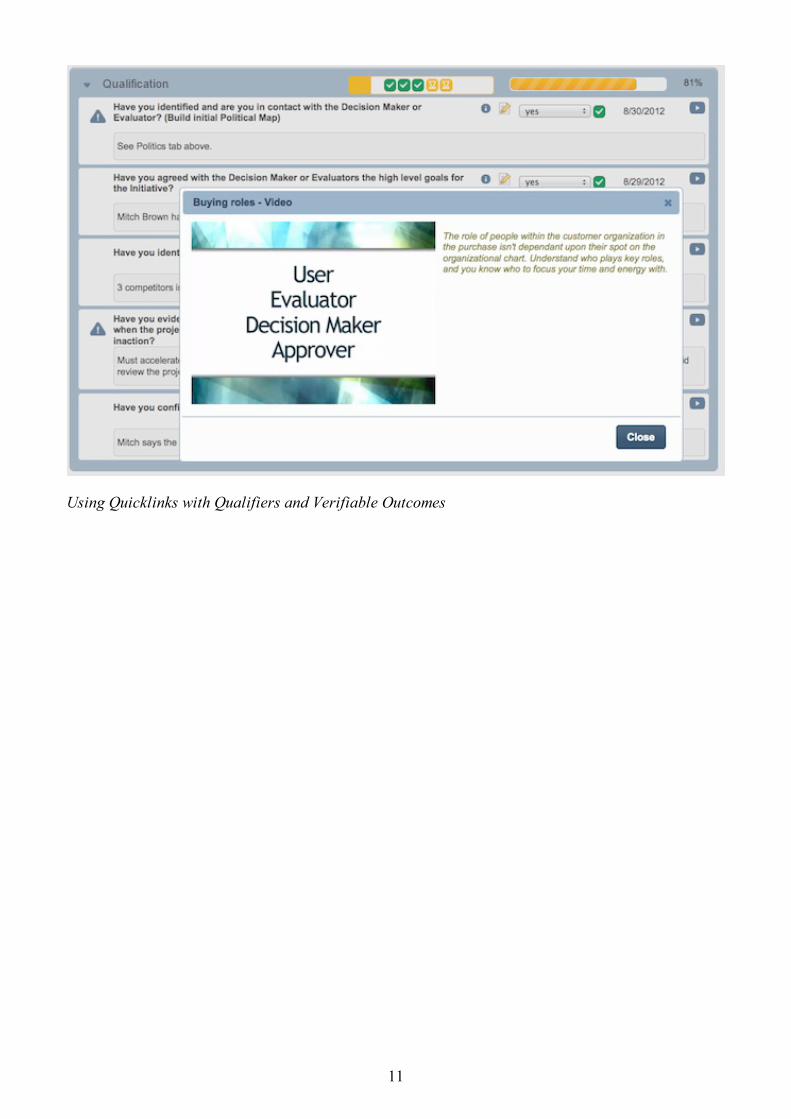
Using Quicklinks with Qualifiers and Verifiable Outcomes
11
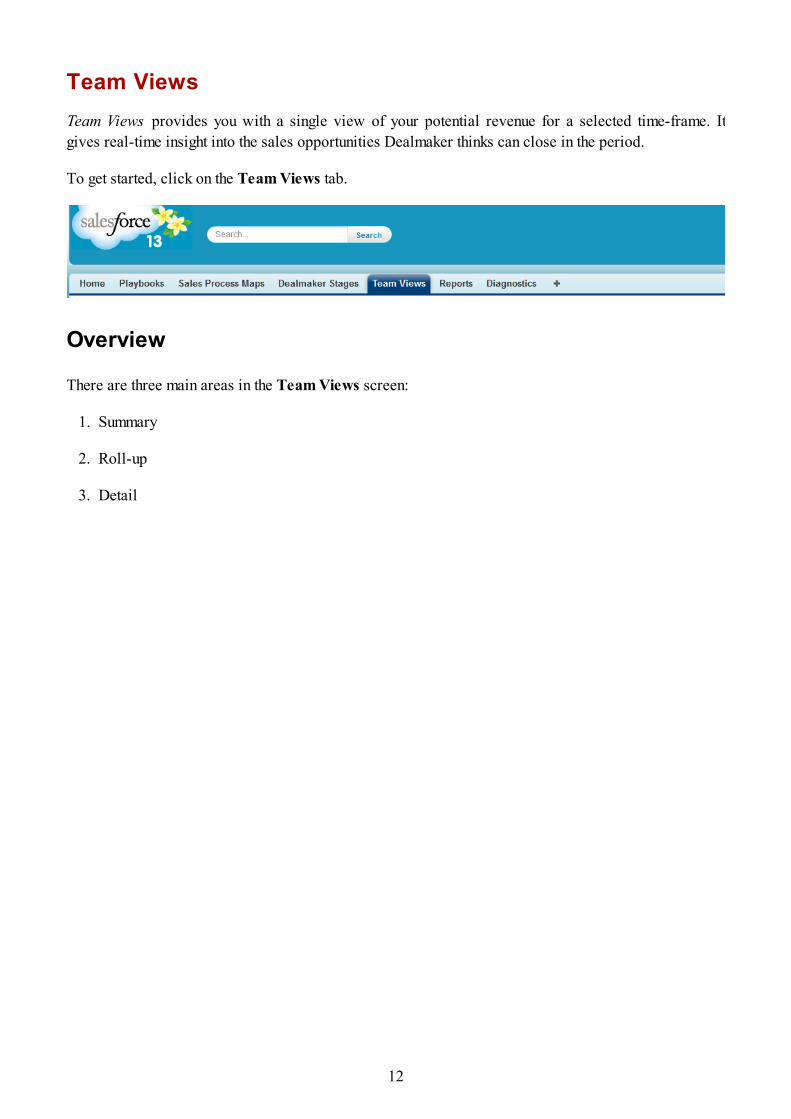
Team ViewsTeam Views provides you with a single view of your potential revenue for a selected time-frame. Itgives real-time insight into the sales opportunities Dealmaker thinks can close in the period.
To get started, click on the Team Views tab.
Overview
There are three main areas in the Team Views screen:
1. Summary
2. Roll-up
3. Detail
12
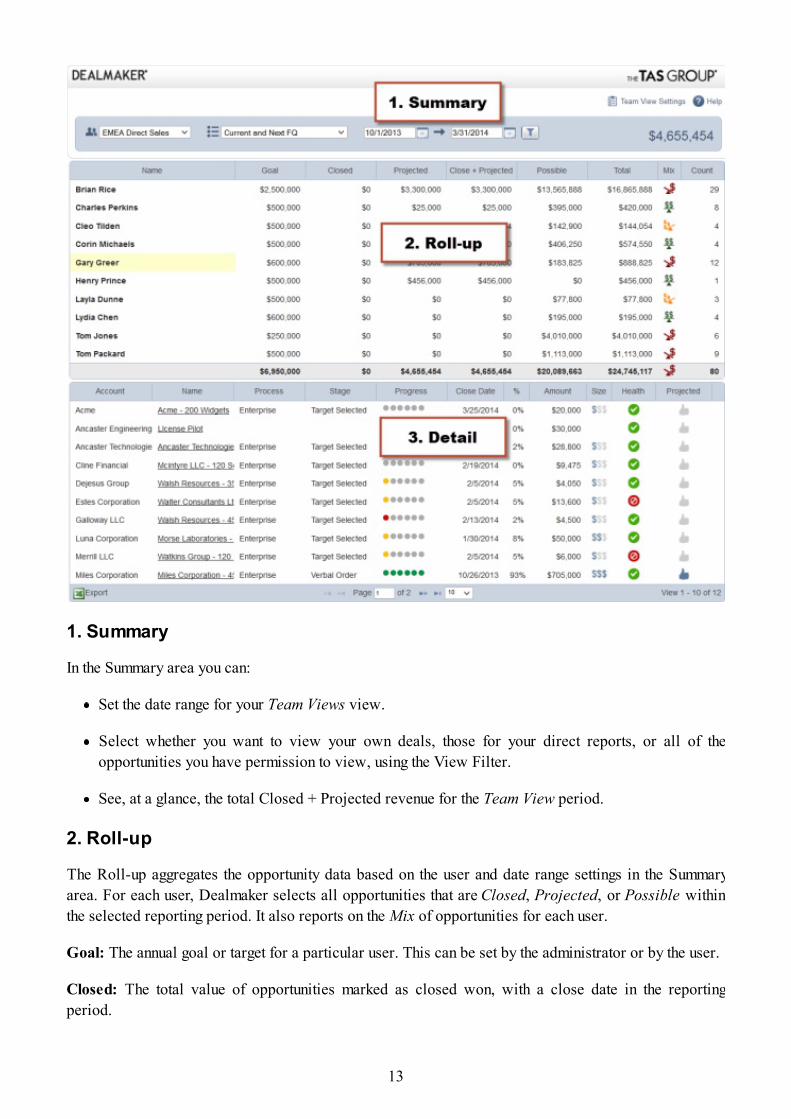
1. Summary
In the Summary area you can:
Set the date range for your Team Views view.
Select whether you want to view your own deals, those for your direct reports, or all of theopportunities you have permission to view, using the View Filter.
See, at a glance, the total Closed + Projected revenue for the Team View period.
2. Roll-up
The Roll-up aggregates the opportunity data based on the user and date range settings in the Summaryarea. For each user, Dealmaker selects all opportunities that are Closed, Projected, or Possible withinthe selected reporting period. It also reports on the Mix of opportunities for each user.
Goal: The annual goal or target for a particular user. This can be set by the administrator or by the user.
Closed: The total value of opportunities marked as closed won, with a close date in the reportingperiod.
13
Projected: The total value of open opportunities with a Dealmaker calculated close date in thereporting period, and a Dealmaker closure probability exceeding the projected threshold. The projectedthreshold is a Dealmaker administration setting defined by the salesforce administrator (typically set to70%).
Dealmaker does not use weighted or percentages when determining the value of your sales forecast.Rather, based on the business rules in your Dealmaker deployment configuration, it chooses those dealsit thinks are likely to close based on progress through the sales cycle and the time remaining in thereporting period, based on historical data. The Projected Opportunities column shows the total valueof open opportunities with a Dealmaker calculated close date in the reporting period, and a Dealmakerclosure probability exceeding the projected threshold. The projected threshold is a Dealmakeradministration setting defined by the salesforce administrator (typically set to 70%).
Close + Projected: The total value of the Closed and Projected opportunities (columns 1 and 2).
Possible: The total value of open opportunities with a Dealmaker calculated close date in the reportingperiod, and a Dealmaker closure probability below the projected threshold. The projected threshold is aDealmaker administration setting defined by the salesforce administrator (typically set to 70%).
Mix: In your Dealmaker configuration, opportunities are categorized as Rocks, Stones or Pebbles.Stones are opportunities of an amount that is similar to your average deal value as determined by yourDealmaker administrator. Rocks are very large deals, and Pebbles are very small deals. Rocks, Stonesand Pebbles can be configured differently for each sales process that you use, and can be used to identifya risk to your results either due to over-dependence on a small number of unusually large deals, or dueto the inefficiencies or resource concerns of pursuing too many unusually small deals. For moreinformation on how the mix is calculated, click here.
Total: The total value of all closed and open opportunities with a Dealmaker calculated close date inthe current reporting period.
3. Detail
When you click on any cell in Roll-up, you can see the detail information behind any of the items that areaggregated for that cell. Information displayed here is:
Account: The name of the account.
Name: The name of the opportunity. Click on the name link to open the opportunity in a new window.
Amount: The amount of the opportunity.
Process: The sales process being used for this opportunity.
Stage: The pipeline stage of the opportunity, as determined by Dealmaker.
Progress: A graphical indication of the status of the opportunity.
Close Date: The Dealmaker Projected close date.
14
%: The closure probability of the opportunity, as determined by Dealmaker.
Size: An indicator of whether the opportunity is categorized as a Rock, Stone or Pebble as describedabove.
Health: Dealmaker classifies an opportunity as Active, Stalled or Inactive based on when it was lastupdated. Stalled opportunities have not been updated in the last 30 days. Inactive opportunities have notbeen updated in the last 60 days.
Projected: A graphical indicator of whether the opportunity is projected or not, or if it is closed won.An opportunity is projected if its probability of closing is above the configured threshold for the salesprocess.
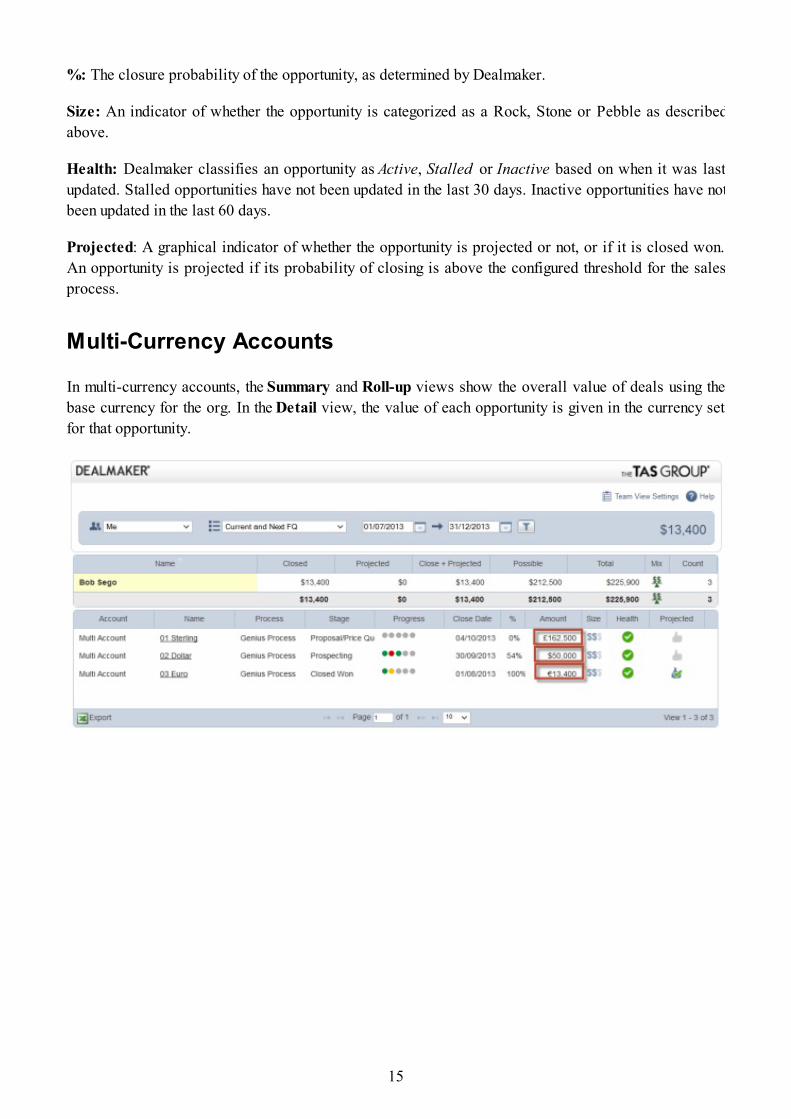
Multi-Currency Accounts
In multi-currency accounts, the Summary and Roll-up views show the overall value of deals using thebase currency for the org. In the Detail view, the value of each opportunity is given in the currency setfor that opportunity.
15
Using Team Views
Team Views Summary
The Summary section is at the top of the Team Views screen and lets you set the parameters for yourTeam Views report.
You can report on any opportunities to which you have read or read/write access. The available datavaries depending on your Salesforce sharing model, but you can almost always report on data owned byor shared with users below you in the role hierarchy, regardless of your sharing model. However,certain sharing models do not allow this.
Set the date range
It is important to always remember that Team View only reports on opportunities that Dealmaker thinksare 'in play' for the reporting period. You can set the date range for the reporting period in two ways.
Pick a Financial Period from the Financial Periods drop-down to list to select a date rangecorresponding to the Fiscal Year settings in Salesforce.
If you are looking for a very specific date range, you can use the Custom Date Range fields topick dates from the calendar pop-up, or just manually enter dates in the date fields.
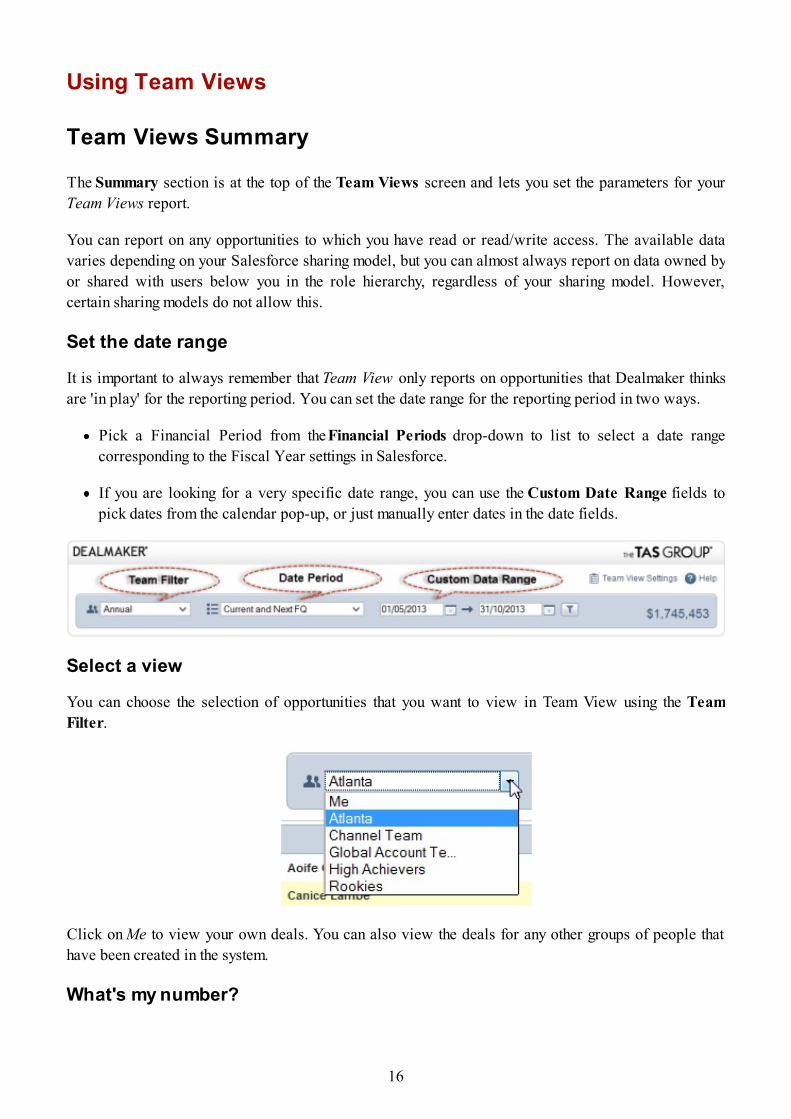
Select a view
You can choose the selection of opportunities that you want to view in Team View using the TeamFilter.
Click on Me to view your own deals. You can also view the deals for any other groups of people thathave been created in the system.
What's my number?
16
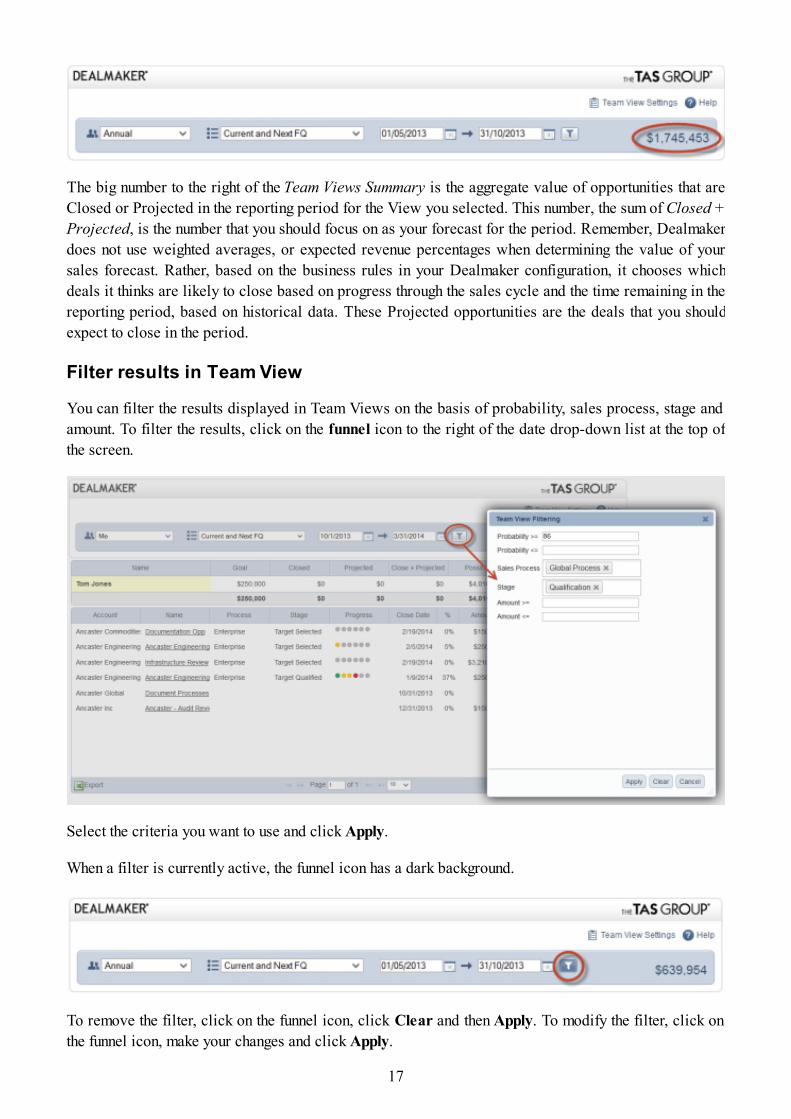
The big number to the right of the Team Views Summary is the aggregate value of opportunities that areClosed or Projected in the reporting period for the View you selected. This number, the sum of Closed +Projected, is the number that you should focus on as your forecast for the period. Remember, Dealmakerdoes not use weighted averages, or expected revenue percentages when determining the value of yoursales forecast. Rather, based on the business rules in your Dealmaker configuration, it chooses whichdeals it thinks are likely to close based on progress through the sales cycle and the time remaining in thereporting period, based on historical data. These Projected opportunities are the deals that you shouldexpect to close in the period.
Filter results in Team View
You can filter the results displayed in Team Views on the basis of probability, sales process, stage andamount. To filter the results, click on the funnel icon to the right of the date drop-down list at the top ofthe screen.
Select the criteria you want to use and click Apply.
When a filter is currently active, the funnel icon has a dark background.
To remove the filter, click on the funnel icon, click Clear and then Apply. To modify the filter, click onthe funnel icon, make your changes and click Apply.
17
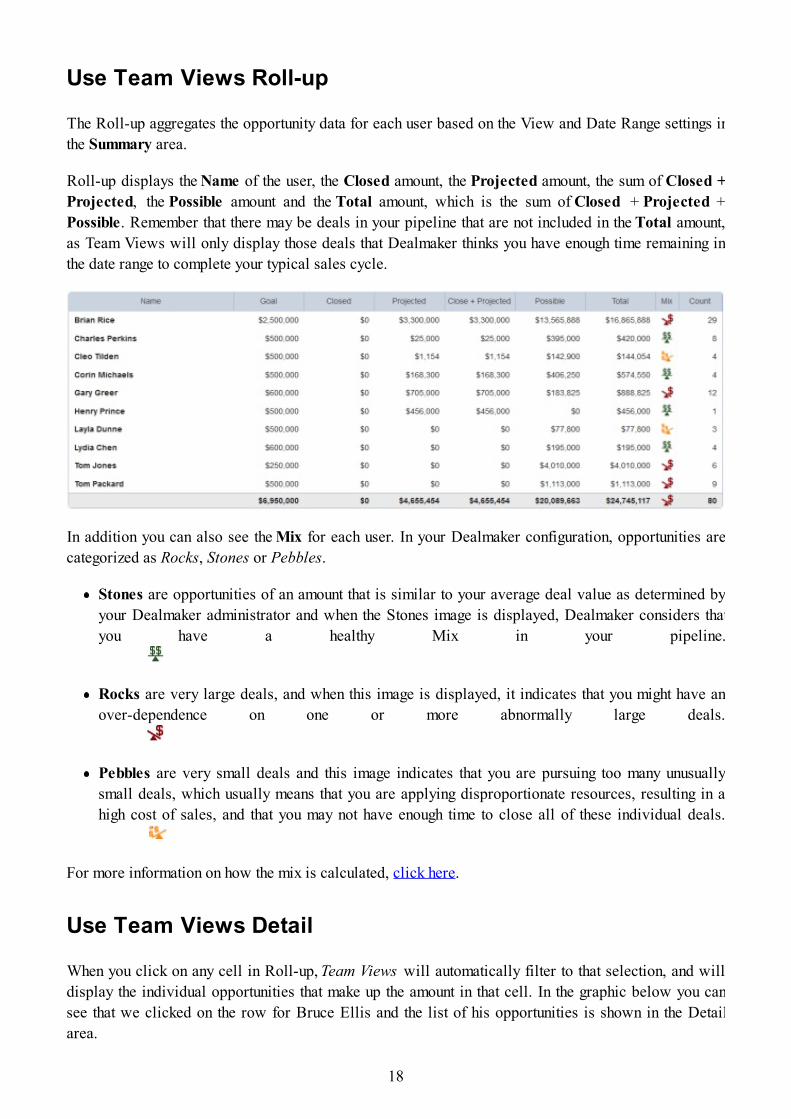
Use Team Views Roll-up
The Roll-up aggregates the opportunity data for each user based on the View and Date Range settings inthe Summary area.
Roll-up displays the Name of the user, the Closed amount, the Projected amount, the sum of Closed +Projected, the Possible amount and the Total amount, which is the sum of Closed + Projected +Possible. Remember that there may be deals in your pipeline that are not included in the Total amount,as Team Views will only display those deals that Dealmaker thinks you have enough time remaining inthe date range to complete your typical sales cycle.
In addition you can also see the Mix for each user. In your Dealmaker configuration, opportunities arecategorized as Rocks, Stones or Pebbles.
Stones are opportunities of an amount that is similar to your average deal value as determined byyour Dealmaker administrator and when the Stones image is displayed, Dealmaker considers thatyou have a healthy Mix in your pipeline.
Rocks are very large deals, and when this image is displayed, it indicates that you might have anover-dependence on one or more abnormally large deals.
Pebbles are very small deals and this image indicates that you are pursuing too many unusuallysmall deals, which usually means that you are applying disproportionate resources, resulting in ahigh cost of sales, and that you may not have enough time to close all of these individual deals.
For more information on how the mix is calculated, click here.
Use Team Views Detail
When you click on any cell in Roll-up, Team Views will automatically filter to that selection, and willdisplay the individual opportunities that make up the amount in that cell. In the graphic below you cansee that we clicked on the row for Bruce Ellis and the list of his opportunities is shown in the Detailarea.
18
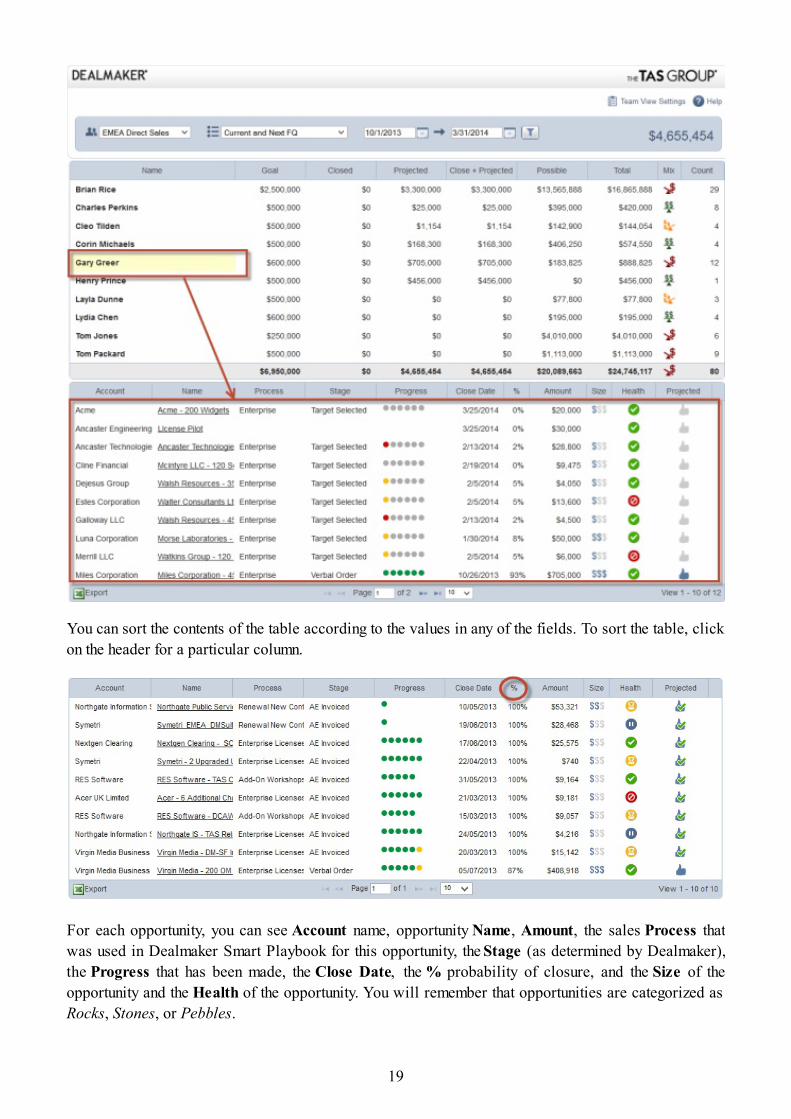
You can sort the contents of the table according to the values in any of the fields. To sort the table, clickon the header for a particular column.
For each opportunity, you can see Account name, opportunity Name, Amount, the sales Process thatwas used in Dealmaker Smart Playbook for this opportunity, the Stage (as determined by Dealmaker),the Progress that has been made, the Close Date, the % probability of closure, and the Size of theopportunity and the Health of the opportunity. You will remember that opportunities are categorized asRocks, Stones, or Pebbles.
19
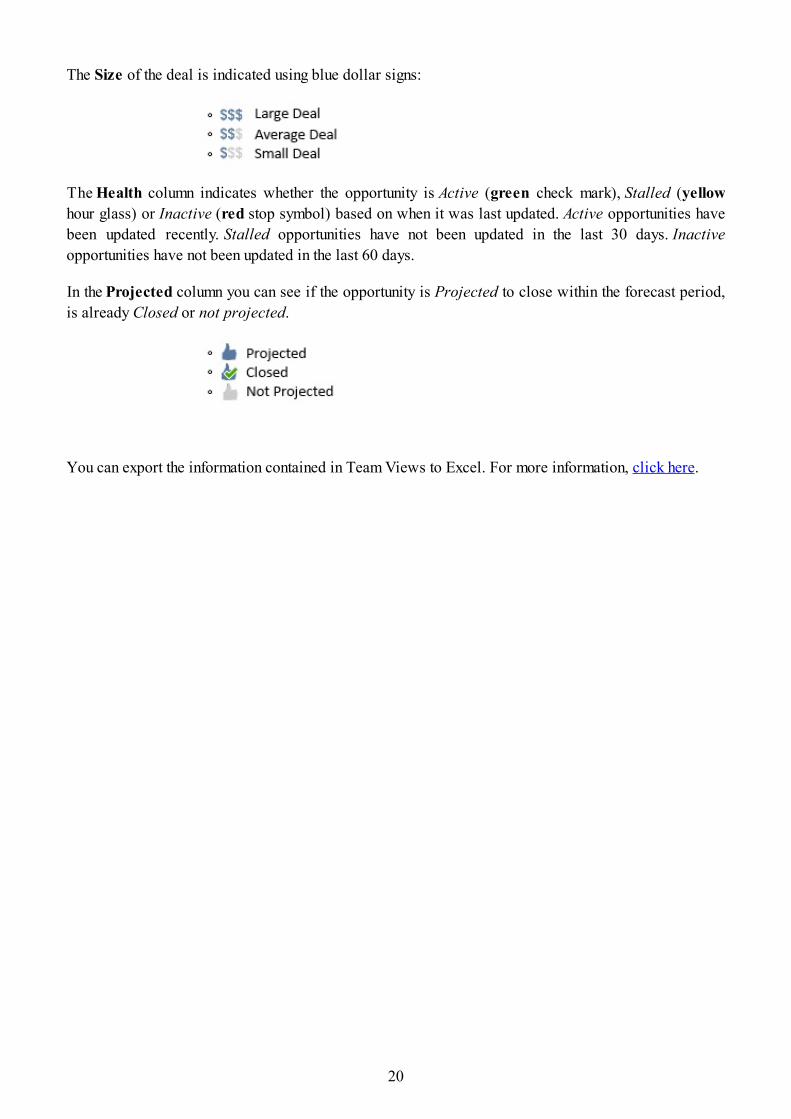
The Size of the deal is indicated using blue dollar signs:
The Health column indicates whether the opportunity is Active (green check mark), Stalled (yellowhour glass) or Inactive (red stop symbol) based on when it was last updated. Active opportunities havebeen updated recently. Stalled opportunities have not been updated in the last 30 days. Inactiveopportunities have not been updated in the last 60 days.
In the Projected column you can see if the opportunity is Projected to close within the forecast period,is already Closed or not projected.
You can export the information contained in Team Views to Excel. For more information, click here.
20
Create, modify and delete groupsUsing the Team View Settings icon you can create, modify and delete teams. In Team View Settingsyou can see the teams which you own as well as any public teams which you have access to. Publicteams are identified by means of an icon in the Public column.
Create a team
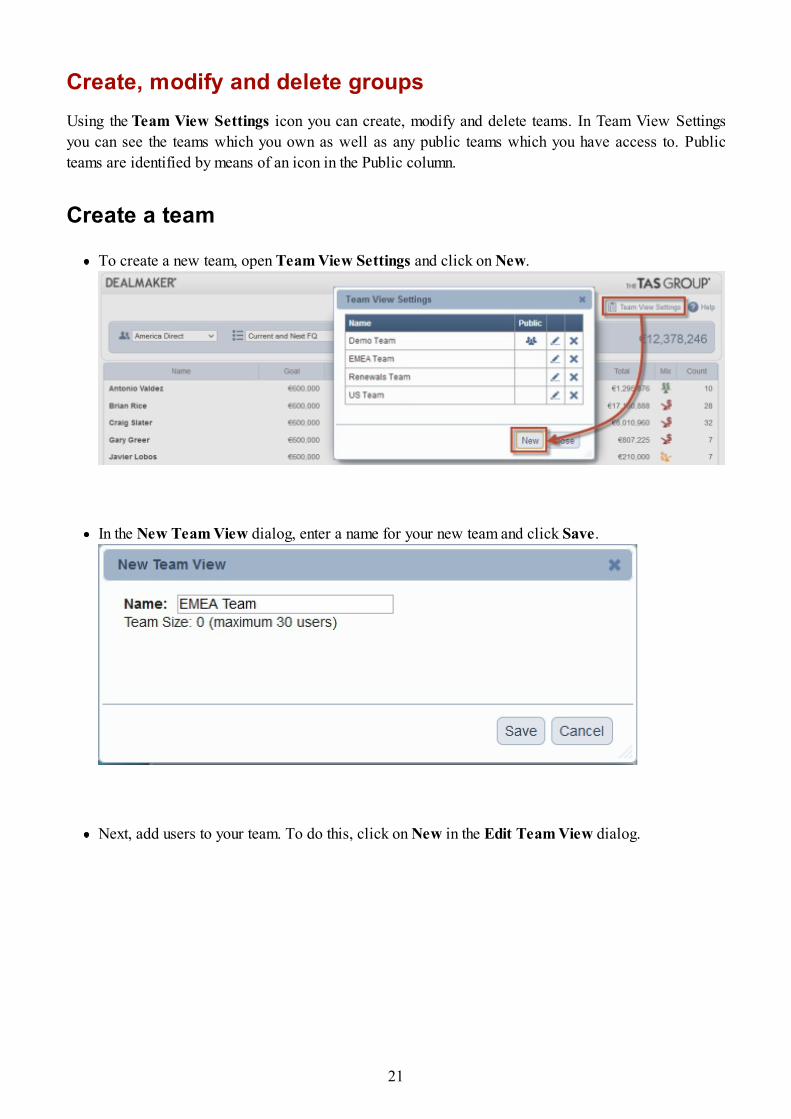
To create a new team, open Team View Settings and click on New.
In the New Team View dialog, enter a name for your new team and click Save.
Next, add users to your team. To do this, click on New in the Edit Team View dialog.
21
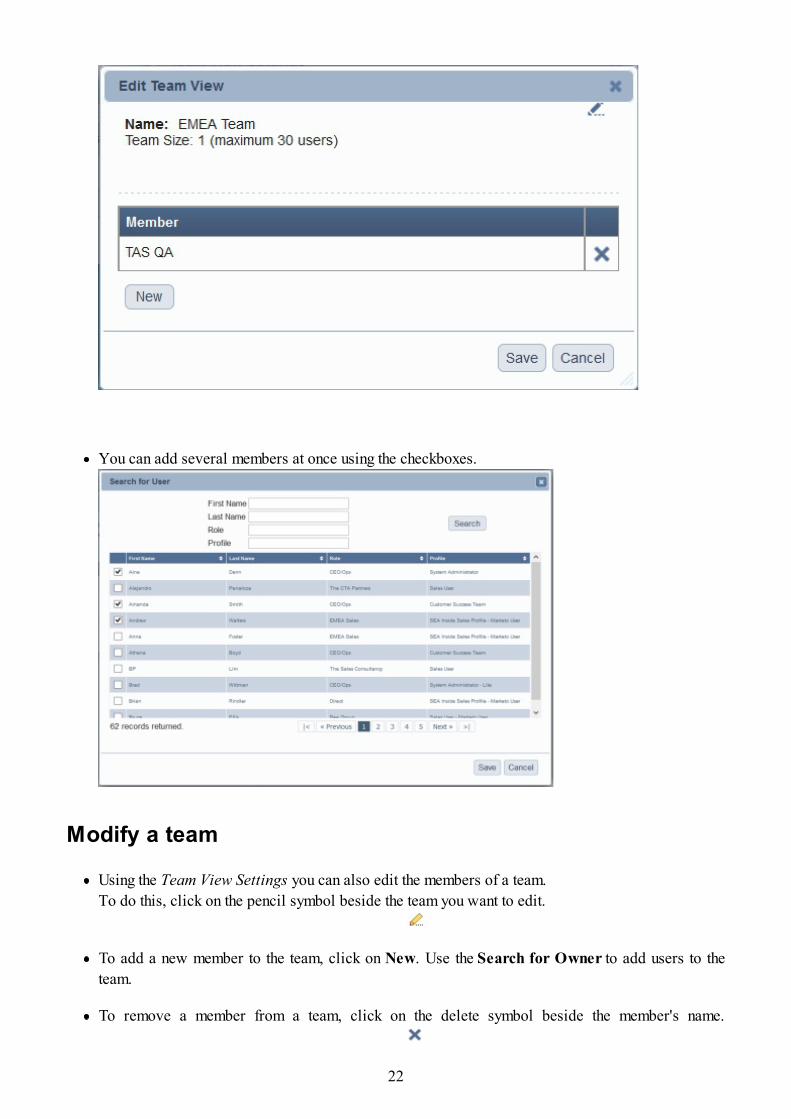
You can add several members at once using the checkboxes.
Modify a team
Using the Team View Settings you can also edit the members of a team.To do this, click on the pencil symbol beside the team you want to edit.
To add a new member to the team, click on New. Use the Search for Owner to add users to theteam.
To remove a member from a team, click on the delete symbol beside the member's name.
22
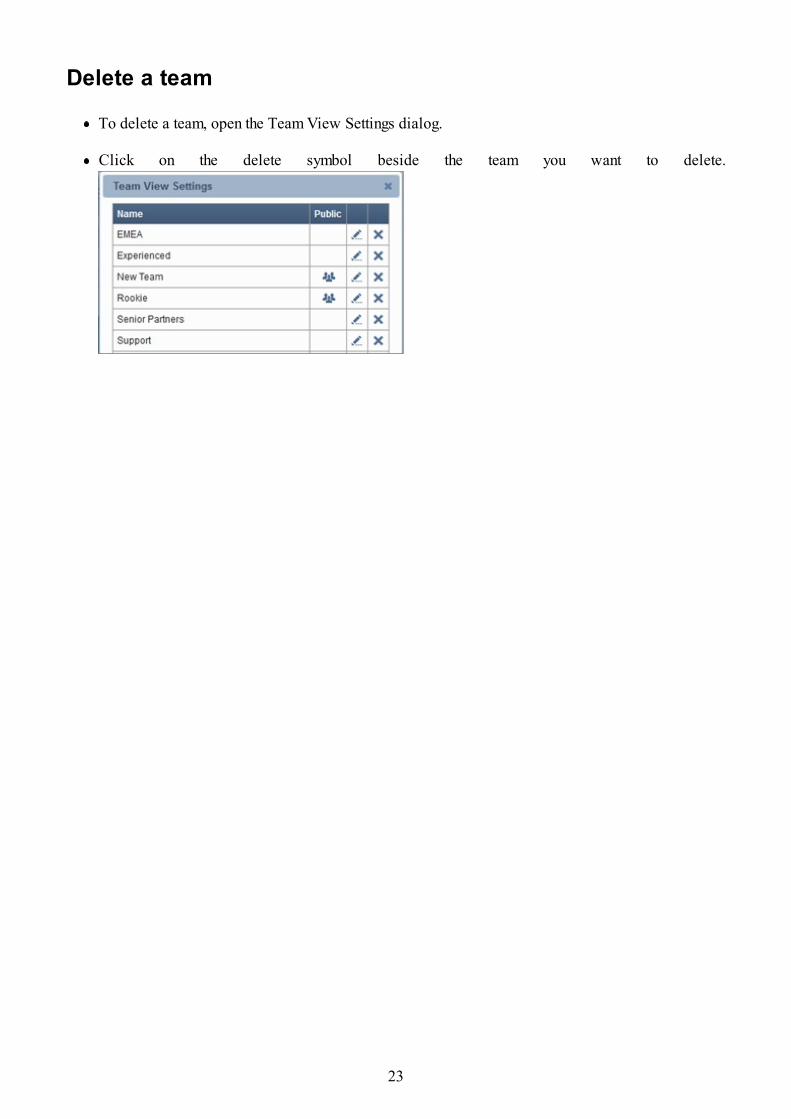
Delete a team
To delete a team, open the Team View Settings dialog.
Click on the delete symbol beside the team you want to delete.
23
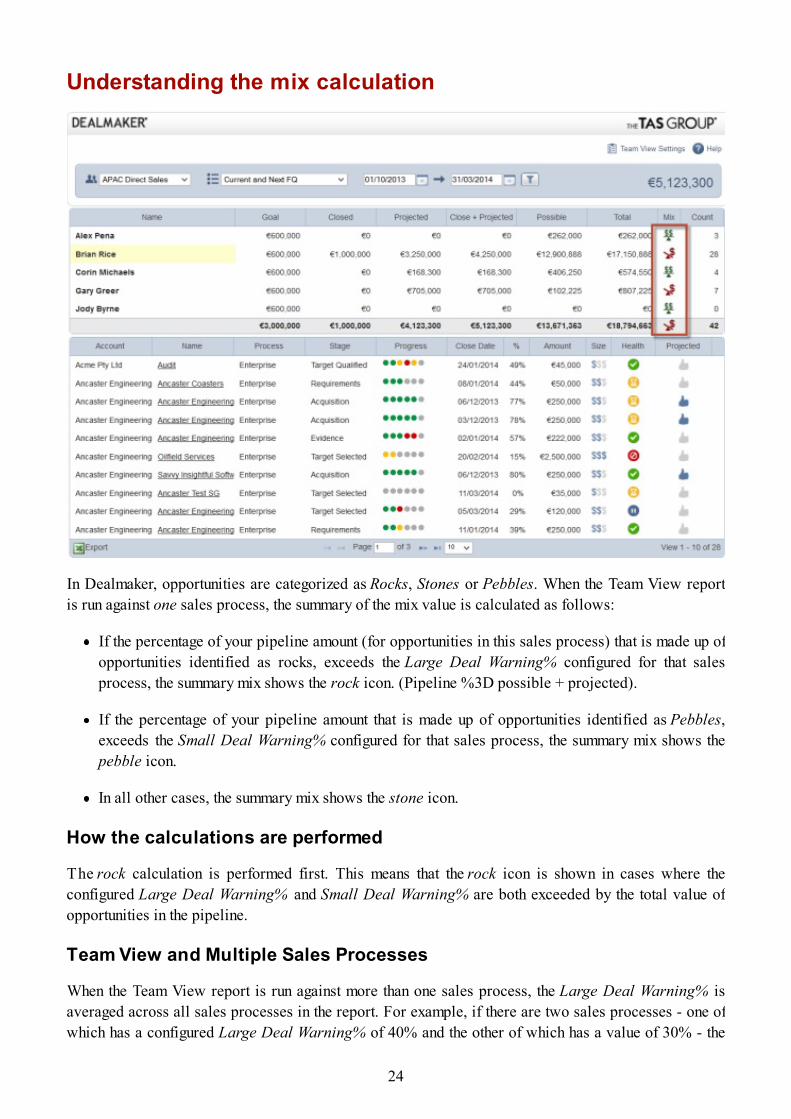
Understanding the mix calculation
In Dealmaker, opportunities are categorized as Rocks, Stones or Pebbles. When the Team View reportis run against one sales process, the summary of the mix value is calculated as follows:
If the percentage of your pipeline amount (for opportunities in this sales process) that is made up ofopportunities identified as rocks, exceeds the Large Deal Warning% configured for that salesprocess, the summary mix shows the rock icon. (Pipeline %3D possible + projected).
If the percentage of your pipeline amount that is made up of opportunities identified as Pebbles,exceeds the Small Deal Warning% configured for that sales process, the summary mix shows thepebble icon.
In all other cases, the summary mix shows the stone icon.
How the calculations are performed
The rock calculation is performed first. This means that the rock icon is shown in cases where theconfigured Large Deal Warning% and Small Deal Warning% are both exceeded by the total value ofopportunities in the pipeline.
Team View and Multiple Sales Processes
When the Team View report is run against more than one sales process, the Large Deal Warning% isaveraged across all sales processes in the report. For example, if there are two sales processes - one ofwhich has a configured Large Deal Warning% of 40% and the other of which has a value of 30% - the
24
summary mix will be calculated against the average of the two (35%).
In practice, this means that if the percentage of your pipeline amount which consists of rocks exceeds theaverage Large Deal Warning% configured for the sales processes (in this case 35%), the summary mixshows the rock icon.
Similarly the Small Deal Warning% is averaged to determine if the Pebble icon should be shown.
Opportunities with no assigned sales process
In certain circumstances, the Team View report may contain opportunities which do not have anidentified sales process. This can happen, for example, if you are configured to use the sales processpopup and have not yet clicked through to Playbook for the opportunity to set its sales process. In suchcases, these opportunities cannot be identified as either rocks or pebbles because the Large Deal Sizeand Small Deal Size are dependent on the sales process. For this reason, they are regarded as stoneswhen calculating the summary mix value.
25
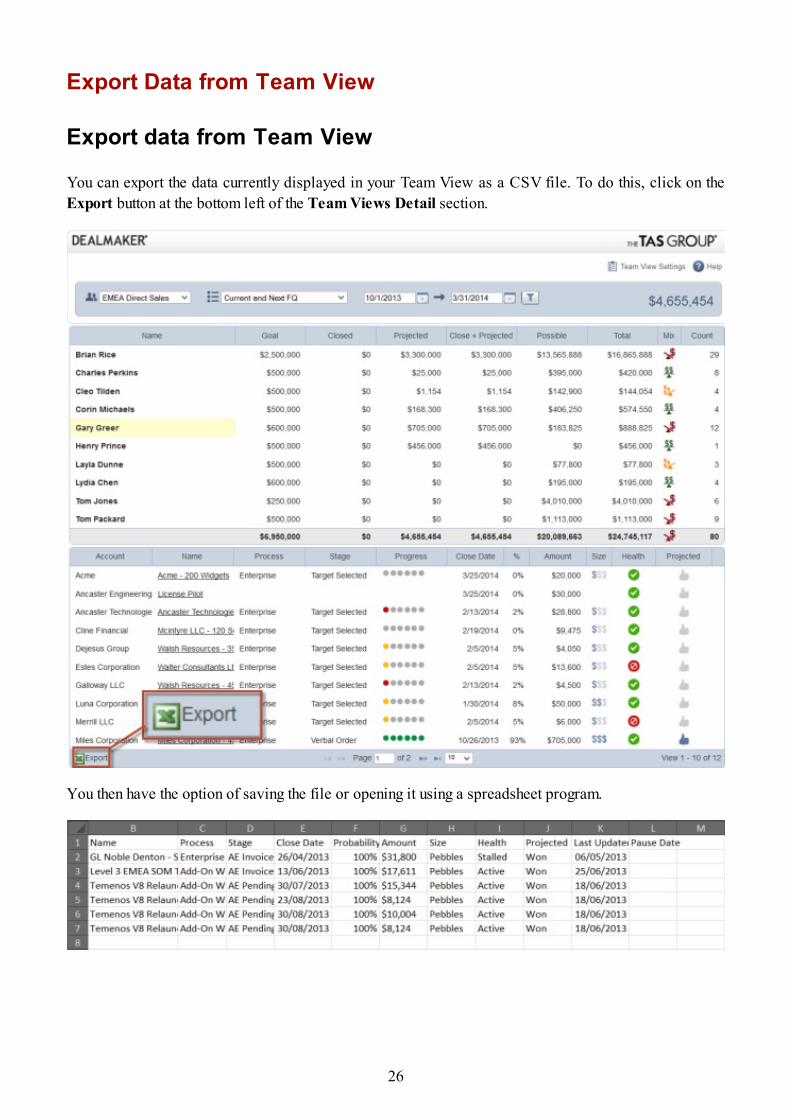
Export Data from Team View
Export data from Team View
You can export the data currently displayed in your Team View as a CSV file. To do this, click on theExport button at the bottom left of the Team Views Detail section.
You then have the option of saving the file or opening it using a spreadsheet program.
26