Embed Size (px)
Citation preview
Smart Pharma Consulting
1, rue Houdart de Lamotte – 75015 Paris – FranceTel.: +33 6 11 96 33 78 – Fax: +33 1 45 57 46 59
E-mail: [email protected] – Website: www.smart-pharma.com
From Drug Cost to Payer Valuation
- How to get the best value? -
Report: R&D Excerpts
June 2016
Drug Value &
Market Access
Optimization
Smart Pharma Consulting
“Finding New & Better
Avenues”
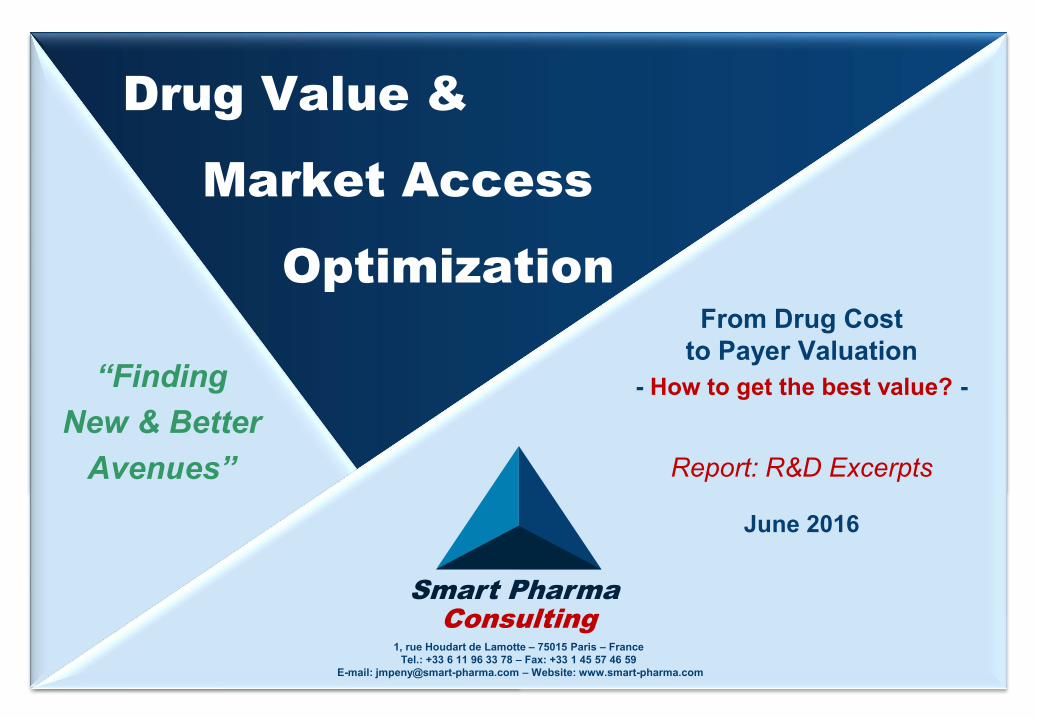
Smart Pharma ConsultingTable of contents
June 2016 2Drug Value & Market Access Optimization
1. Introduction p. 31.1. Foreword p. 31.2. International healthcare expenditure p. 41.3. Global Pharma market p. 81.4. Global Pharma R&D p. 241.5. Global Pharma profitability p. 301.6. Global Pharma reputation p. 321.7. Conclusion p. 33
2. R&D cost of drugs p. 342.1. Introduction p. 342.2. R&D process p. 352.3. R&D cost estimates p. 362.4. Focus on biosimilars p. 512.5. Focus on vaccines p. 542.6. Conclusion p. 61
3. Drug pricing approaches p. 623.1. Introduction p. 623.2. Free pricing p. 643.3. Cost-based pricing p. 663.4. Value-based pricing p. 703.5. Internal price referencing p. 783.6. International price referencing p. 793.7. Managed entry agreements p. 823.8. Price cuts p. 1083.9. Paybacks p. 1093.10. Tenders p. 112
3.11. Compulsory licensing p. 1133.12. Voluntary licensing p. 1143.13. Tiered pricing p. 1163.14. Influence of patients advocacy groups p. 1193.15. Conclusion p. 120
4. Health economic evaluations p. 1214.1. Introduction p. 1214.2. Generalities p. 1224.3. Methods of health economic evaluation p. 1264.4 Collaboration for HTA in Europe p. 1324.5. Conclusion p. 133
5. Market access processes p. 1355.1. Introduction p. 1355.2. Price and market access comparisons p. 1365.3. France p. 1445.4. Germany p. 1495.5. Italy p. 1535.6. Spain p. 1575.7. UK p. 1625.7. USA p. 1675.8. Conclusion p. 169
6. Market access best practices p. 170
7. Corporate reputation leverage p. 185
8. Key learnings & Recommendations p. 201
Smart Pharma Consulting
Source: Smart Pharma Consulting analyses
June 2016 3Drug Value & Market Access Optimization
Context & Objective
The purpose of this report is to provide key information and robust analyses to better optimize drug valuation, from the pharmaceutical companies perspective
To slowdown the increase of healthcare expenditure, governments and public or private payers implement a large array of cost-containment mechanisms
Drugs are particularly affected by these measures, which include:− Drug prices control and regulations to favor the prescription
of cheaper products like generics and biosimilars− Capping of the prescribed volumes− Selective reimbursement of drugs (e.g. limitation to a
subset of patients or to the most severe cases)
However, the way these measures are applied does not allow governments and payers to guarantee access to innovation to the largest number of patients
Thus, governments and payers have no choice but to increase their pressure on drug prices and “force” pharma companies to accept affordable prices
In this context, the following questions must be raised: − What is the value of innovative drugs for the community? − What is a fair price for pharmaceutical companies?
This report reviews:− The economic and healthcare environment− The R&D cost of drugs− The drug pricing strategic approaches of pharma
companies, governments and payers− The health economic evaluation methods− The market access processes in selected countries− The best practices in market access− The ways to leverage the corporate reputation of pharma
companies
Smart Pharma Consulting proposes new thoughts likely to help pharma companies to optimize the valuation of their drugs
1. Introduction1.1. Foreword
Smart Pharma Consulting
Source: Smart Pharma Consulting analyses
2. R&D cost of drugs
June 2016 4Drug Value & Market Access Optimization
1 The cost of the investment in a project which will only generate revenues years later
2.1. Introduction
What is the R&D cost of new drugs?
R&D cost of drugs is subject to severe critics due to the absence of recognized valuation methodologies and the lack of independence of the authors of certain studies
Prior to reviewing the different approaches to value the price of drugs in Western countries, we propose to analyzethe cost associated to the research and development of a new drug
The drug market is often described as "high risk – high reward" due to the important level of development failures and to the time required to bring a new product to the market
Several studies have been carried out to estimate the R&D cost of a new drug, including in addition to the “out-of-pocket” costs actually spent in R&D, multiple factors such as the cost of capital1, the failure rates and the development timelines
All these valuations are strongly criticized due to some methodological problems and the lack of independence of their authors
Irrespective of these loopholes, the cost to bring a new drug to the market reaches several USD billion
Even if they are often perceived as less important, the manufacturing costs also need to be covered by the price granted by authorities
Smart Pharma Consulting
Sources: IBM Consulting 2002 – LEEM – Pharmaprojects, IMS Health – R&D Focus – DiMasi & Al (2014) – Smart Pharma Consulting estimates
2. R&D cost of drugs
June 2016 5Drug Value & Market Access Optimization
¹ Average of estimated studies published with mid-analysis point after 1990
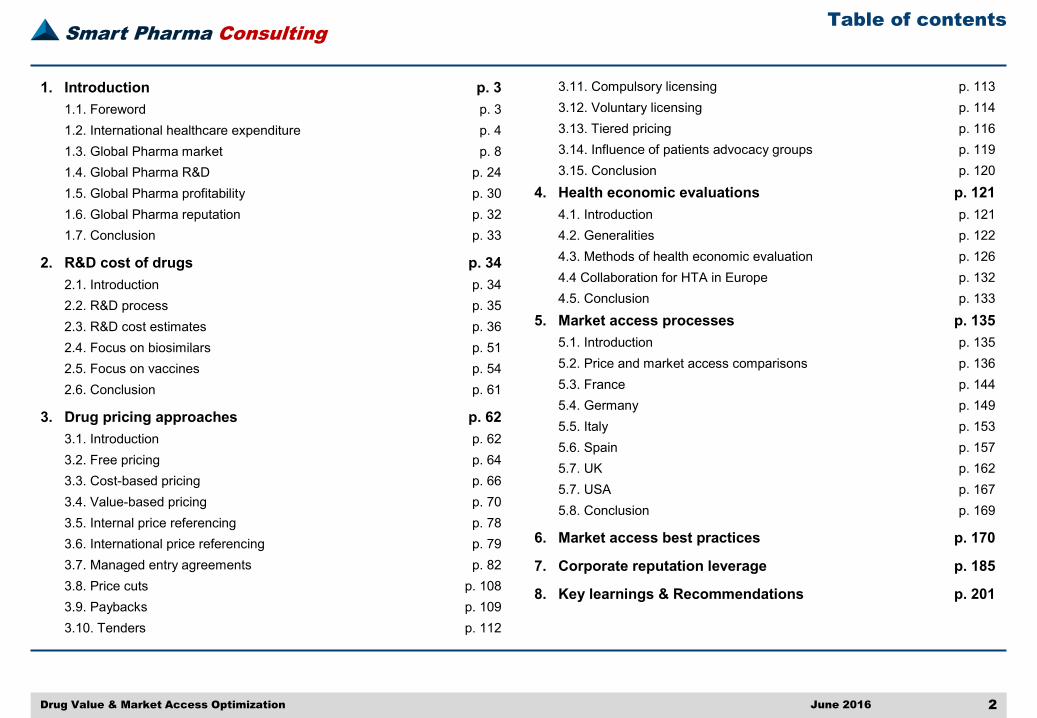
2.2. R&D process
The conventional R&D process
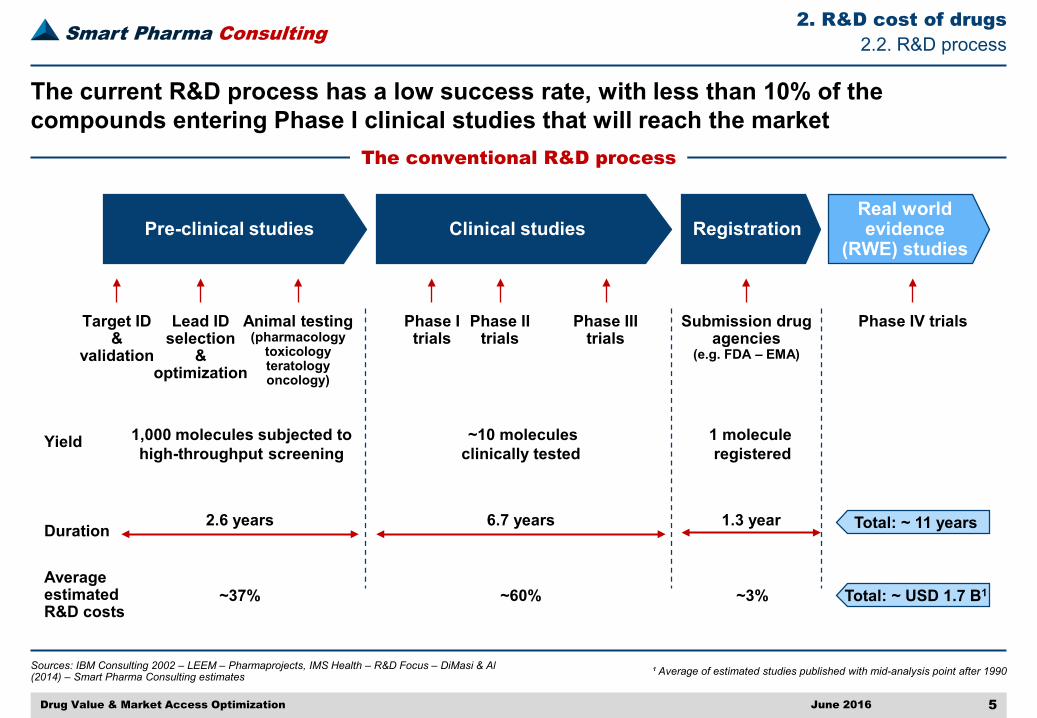
The current R&D process has a low success rate, with less than 10% of the compounds entering Phase I clinical studies that will reach the market
Pre-clinical studies
Duration
Average estimated R&D costs
Clinical studies Registration
Phase Itrials
Real world evidence
(RWE) studies
Phase IItrials
Phase IIItrials
Submission drug agencies
(e.g. FDA – EMA)
Phase IV trialsTarget ID &
validation
Animal testing(pharmacology
toxicologyteratologyoncology)
2.6 years 6.7 years 1.3 year
~37% ~60% Total: ~ USD 1.7 B1
Lead IDselection
&optimization
Yield 1,000 molecules subjected tohigh-throughput screening
~10 moleculesclinically tested
1 molecule registered
Total: ~ 11 years
~3%
Smart Pharma Consulting
Source: DiMasi JA & al, 2003. J. Health Economics
2. R&D cost of drugs
June 2016 6Drug Value & Market Access Optimization
1 Capitalized costs in 2000 dollars – 2 From Tufts Center for the Study of Drug Development (CSDD) proprietary databases – 3 New molecular entity
2.3. R&D cost estimates
R&D costs estimates for drugs (2000) (1/3)
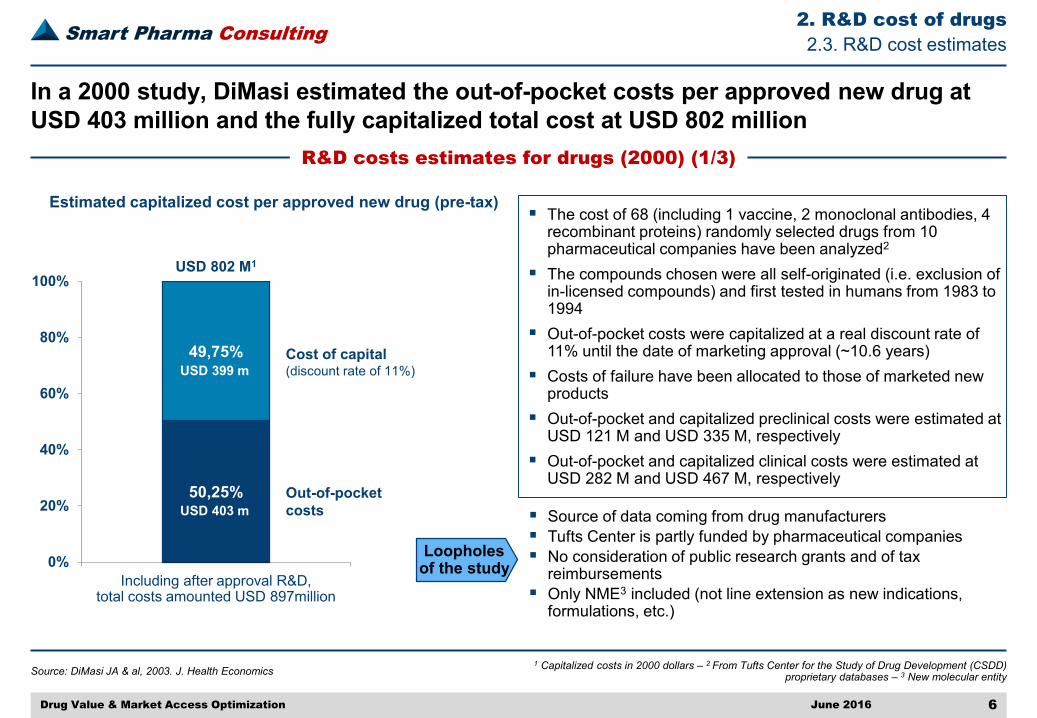
In a 2000 study, DiMasi estimated the out-of-pocket costs per approved new drug at USD 403 million and the fully capitalized total cost at USD 802 million
50,25%
49,75%
0%
20%
40%
60%
80%
100%USD 802 M1
Out-of-pocket costs
Cost of capital (discount rate of 11%)
USD 403 m
USD 399 m
The cost of 68 (including 1 vaccine, 2 monoclonal antibodies, 4 recombinant proteins) randomly selected drugs from 10 pharmaceutical companies have been analyzed2
The compounds chosen were all self-originated (i.e. exclusion of in-licensed compounds) and first tested in humans from 1983 to 1994
Out-of-pocket costs were capitalized at a real discount rate of 11% until the date of marketing approval (~10.6 years)
Costs of failure have been allocated to those of marketed new products
Out-of-pocket and capitalized preclinical costs were estimated at USD 121 M and USD 335 M, respectively
Out-of-pocket and capitalized clinical costs were estimated at USD 282 M and USD 467 M, respectively
Estimated capitalized cost per approved new drug (pre-tax)
Source of data coming from drug manufacturers Tufts Center is partly funded by pharmaceutical companies No consideration of public research grants and of tax
reimbursements Only NME3 included (not line extension as new indications,
formulations, etc.)
Including after approval R&D, total costs amounted USD 897million
Loopholes of the study
Smart Pharma Consulting
Sources: Adams CP & al, 2006. Health Affairs – DiMasi JA et al, 2003. J. Health Economics
2. R&D cost of drugs
June 2016 7Drug Value & Market Access Optimization
1 Capitalized costs in 2000 dollars
2.3. R&D cost estimates
R&D costs estimates for drugs (2000) (2/3)
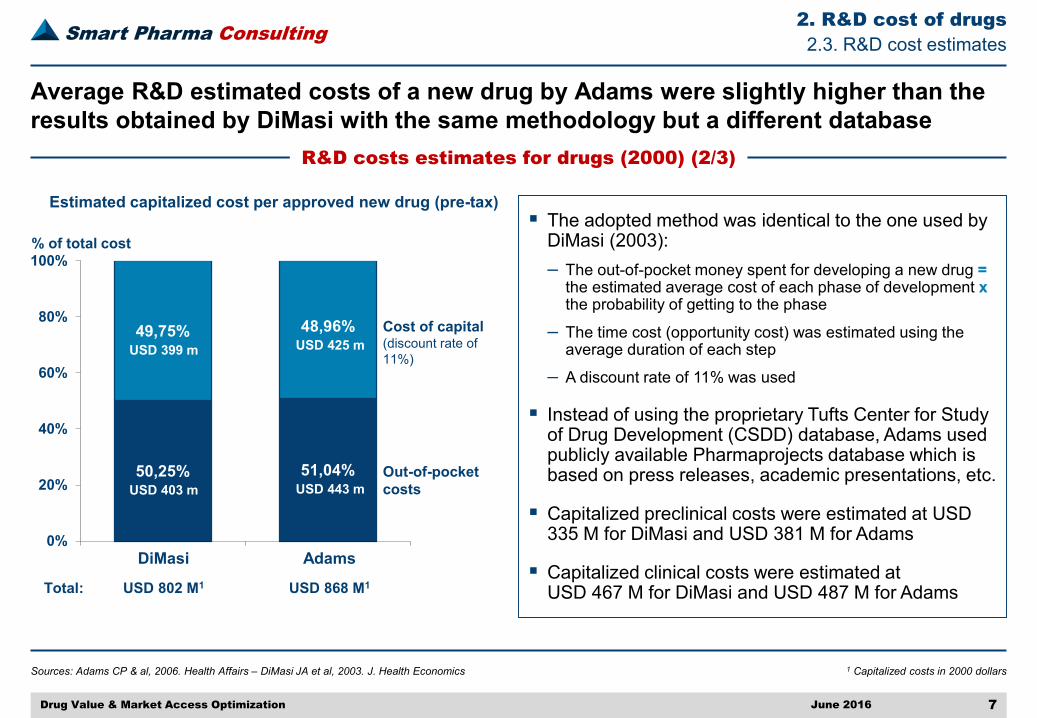
Average R&D estimated costs of a new drug by Adams were slightly higher than the results obtained by DiMasi with the same methodology but a different database
The adopted method was identical to the one used by DiMasi (2003):– The out-of-pocket money spent for developing a new drug =
the estimated average cost of each phase of development xthe probability of getting to the phase
– The time cost (opportunity cost) was estimated using the average duration of each step
– A discount rate of 11% was used
Instead of using the proprietary Tufts Center for Study of Drug Development (CSDD) database, Adams used publicly available Pharmaprojects database which is based on press releases, academic presentations, etc.
Capitalized preclinical costs were estimated at USD 335 M for DiMasi and USD 381 M for Adams
Capitalized clinical costs were estimated at USD 467 M for DiMasi and USD 487 M for Adams
50,25% 51,04%
49,75% 48,96%
0%
20%
40%
60%
80%
100%
Out-of-pocket costs
Cost of capital (discount rate of 11%)
USD 403 m
USD 399 m
Adams
USD 443 m
USD 425 m
DiMasi
Estimated capitalized cost per approved new drug (pre-tax)
USD 802 M1 USD 868 M1Total:
% of total cost
Smart Pharma Consulting
Sources: Vernon J & al, 2009. Health Economics – DiMasi JA & al, 2003. J. Health Economics
2. R&D cost of drugs
June 2016 8Drug Value & Market Access Optimization
1 Capitalized costs in 2000 dollars
2.3. R&D cost estimates
R&D costs estimates for drugs (2000) (3/3)
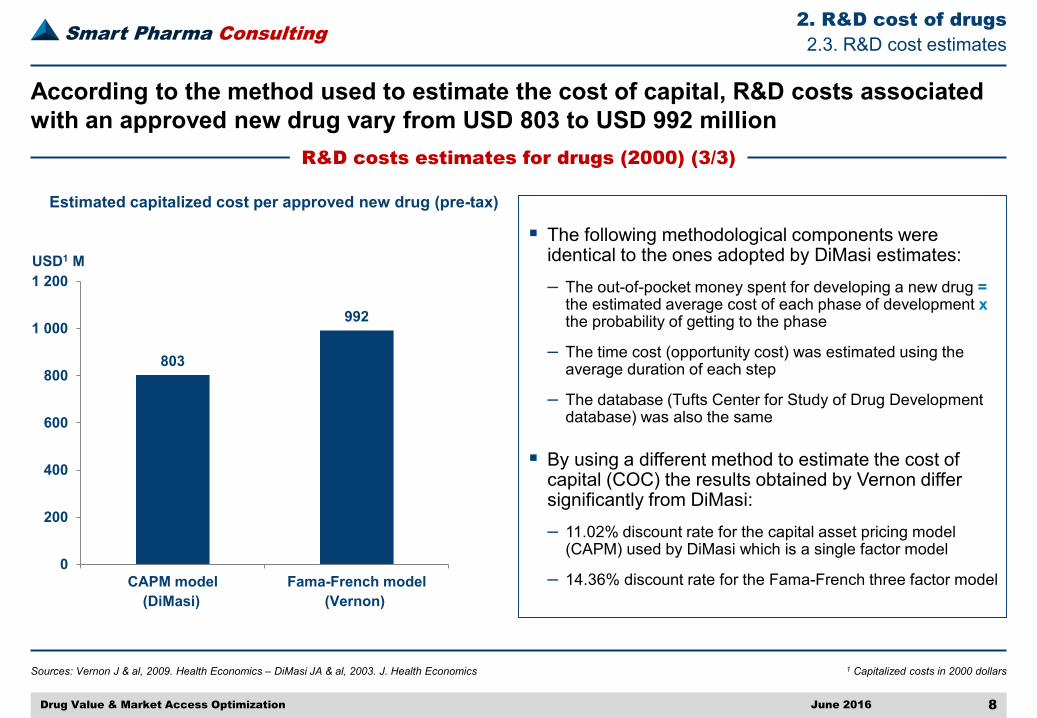
According to the method used to estimate the cost of capital, R&D costs associated with an approved new drug vary from USD 803 to USD 992 million
Estimated capitalized cost per approved new drug (pre-tax)
The following methodological components were identical to the ones adopted by DiMasi estimates:– The out-of-pocket money spent for developing a new drug =
the estimated average cost of each phase of development xthe probability of getting to the phase
– The time cost (opportunity cost) was estimated using the average duration of each step
– The database (Tufts Center for Study of Drug Development database) was also the same
By using a different method to estimate the cost of capital (COC) the results obtained by Vernon differ significantly from DiMasi: – 11.02% discount rate for the capital asset pricing model
(CAPM) used by DiMasi which is a single factor model
– 14.36% discount rate for the Fama-French three factor model
803
992
0
200
400
600
800
1 000
1 200
CAPM model Fama-French model
USD1 M
(DiMasi) (Vernon)
Smart Pharma Consulting
Source: BCG analysis, 2001
2. R&D cost of drugs
June 2016 9Drug Value & Market Access Optimization
2.3. R&D cost estimates
R&D costs estimates for drugs (2001)
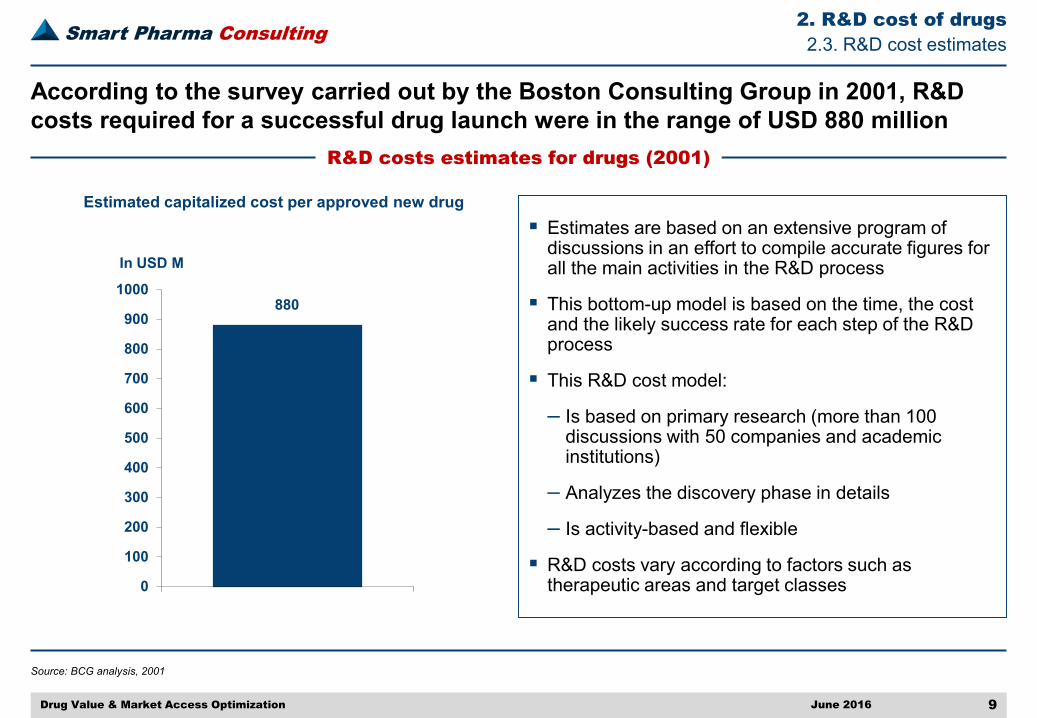
According to the survey carried out by the Boston Consulting Group in 2001, R&D costs required for a successful drug launch were in the range of USD 880 million
Estimated capitalized cost per approved new drug Estimates are based on an extensive program of
discussions in an effort to compile accurate figures for all the main activities in the R&D process
This bottom-up model is based on the time, the cost and the likely success rate for each step of the R&D process
This R&D cost model:
– Is based on primary research (more than 100 discussions with 50 companies and academic institutions)
– Analyzes the discovery phase in details
– Is activity-based and flexible
R&D costs vary according to factors such as therapeutic areas and target classes0
100
200
300
400
500
600
700
800
900
1000880
In USD M
Smart Pharma Consulting
Source: DiMasi JA & al, 2007. Manage. Decis. Econ
2. R&D cost of drugs
June 2016 10Drug Value & Market Access Optimization
1 Capitalized costs in 2005 dollars
2.3. R&D cost estimates
R&D costs for biological & chemical products (2005)
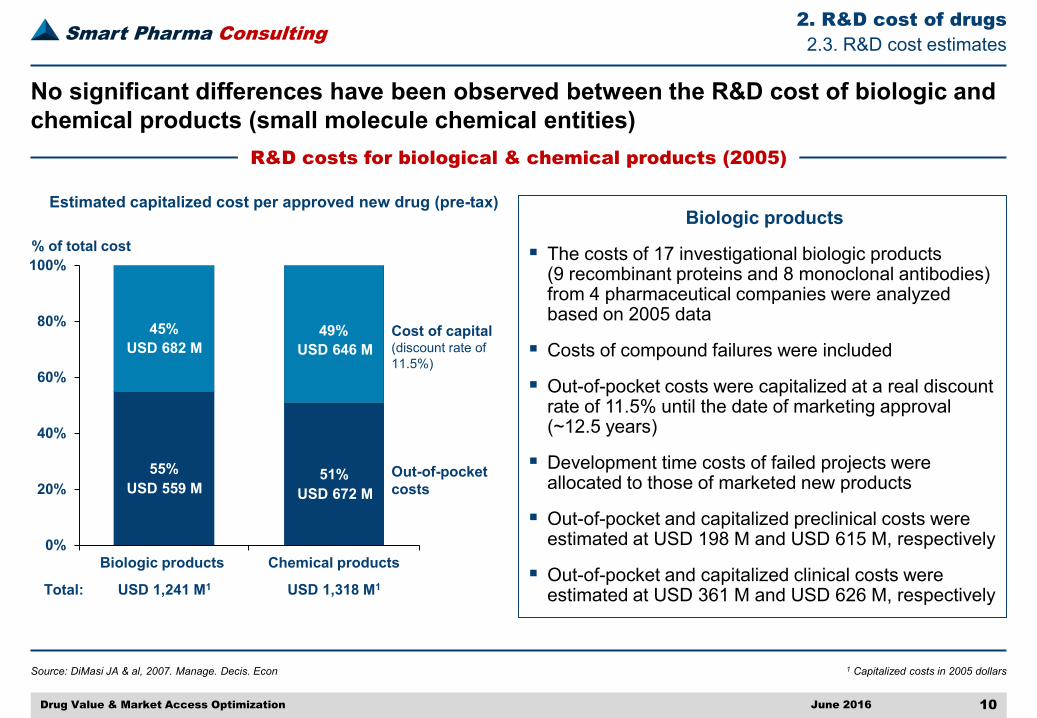
No significant differences have been observed between the R&D cost of biologic and chemical products (small molecule chemical entities)
Estimated capitalized cost per approved new drug (pre-tax)Biologic products
The costs of 17 investigational biologic products (9 recombinant proteins and 8 monoclonal antibodies) from 4 pharmaceutical companies were analyzed based on 2005 data
Costs of compound failures were included
Out-of-pocket costs were capitalized at a real discount rate of 11.5% until the date of marketing approval (~12.5 years)
Development time costs of failed projects were allocated to those of marketed new products
Out-of-pocket and capitalized preclinical costs were estimated at USD 198 M and USD 615 M, respectively
Out-of-pocket and capitalized clinical costs were estimated at USD 361 M and USD 626 M, respectively
55% 51%
45% 49%
0%
20%
40%
60%
80%
100%
USD 1,241 M1
Out-of-pocket costs
Cost of capital (discount rate of 11.5%)
USD 559 M
USD 682 M
Chemical products
USD 672 M
USD 646 M
USD 1,318 M1
Biologic products
% of total cost
Total:
Smart Pharma Consulting
Sources: Gilbert L & al, 2003. In Vivo – O’Hagab P and Farkas C, 2009. Bain & Co
2. R&D cost of drugs
June 2016 11Drug Value & Market Access Optimization
%: Percentage of total costs
2.3. R&D cost estimates
R&D costs estimates for drugs (1995 – 2008)
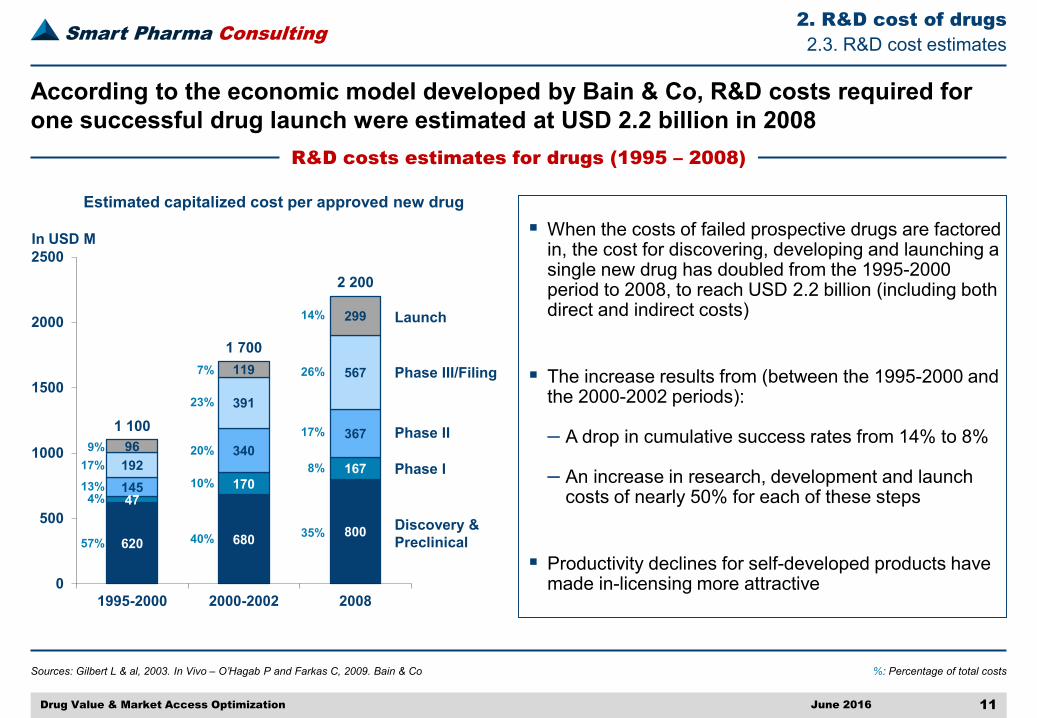
According to the economic model developed by Bain & Co, R&D costs required for one successful drug launch were estimated at USD 2.2 billion in 2008
When the costs of failed prospective drugs are factored in, the cost for discovering, developing and launching a single new drug has doubled from the 1995-2000 period to 2008, to reach USD 2.2 billion (including both direct and indirect costs)
The increase results from (between the 1995-2000 and the 2000-2002 periods):
– A drop in cumulative success rates from 14% to 8%
– An increase in research, development and launch costs of nearly 50% for each of these steps
Productivity declines for self-developed products have made in-licensing more attractive
Estimated capitalized cost per approved new drug
620 680 800
47170
167145
340367
192
391
567
96
119
299
1 100
1 700
2 200
0
500
1000
1500
2000
2500
1995-2000 2000-2002 2008
In USD M
Discovery & Preclinical
Phase I
Phase II
Phase III/Filing
Launch14%
26%
17%
8%
35%
7%
23%
20%
10%
40%57%
4%13%17%
9%
Smart Pharma Consulting
Source: DiMasi & Al., 2014
2. R&D cost of drugs
June 2016 12Drug Value & Market Access Optimization
1 Capitalized costs in 2014 dollars
2.3. R&D cost estimates
R&D costs estimates for drugs (2014)
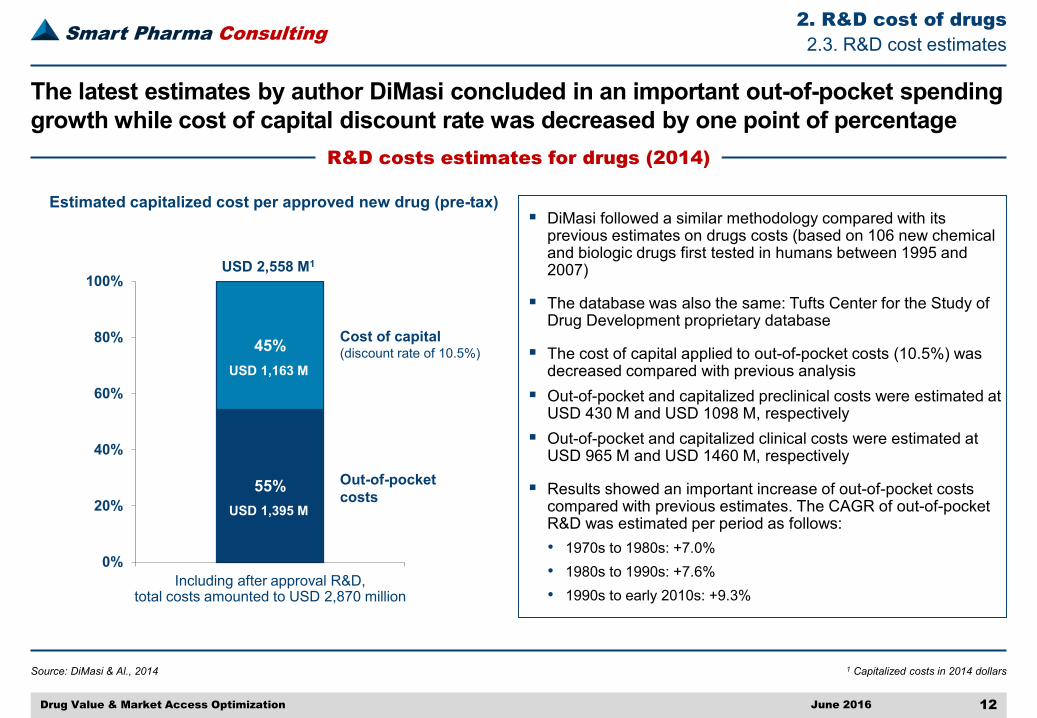
The latest estimates by author DiMasi concluded in an important out-of-pocket spending growth while cost of capital discount rate was decreased by one point of percentage
55%
45%
0%
20%
40%
60%
80%
100%USD 2,558 M1
Out-of-pocket costs
Cost of capital (discount rate of 10.5%)
USD 1,395 M
USD 1,163 M
DiMasi followed a similar methodology compared with its previous estimates on drugs costs (based on 106 new chemical and biologic drugs first tested in humans between 1995 and 2007)
The database was also the same: Tufts Center for the Study of Drug Development proprietary database
The cost of capital applied to out-of-pocket costs (10.5%) was decreased compared with previous analysis
Out-of-pocket and capitalized preclinical costs were estimated at USD 430 M and USD 1098 M, respectively
Out-of-pocket and capitalized clinical costs were estimated at USD 965 M and USD 1460 M, respectively
Results showed an important increase of out-of-pocket costs compared with previous estimates. The CAGR of out-of-pocket R&D was estimated per period as follows:• 1970s to 1980s: +7.0%• 1980s to 1990s: +7.6%• 1990s to early 2010s: +9.3%
Estimated capitalized cost per approved new drug (pre-tax)
Including after approval R&D, total costs amounted to USD 2,870 million
Smart Pharma Consulting
Sources: Authors publications – "The cost of drug development: A systematic review”, Steve Morgan & Al
2. R&D cost of drugs
June 2016 13Drug Value & Market Access Optimization
¹ Average of estimates with mid-analysis point after 1990 –² Products with first testing in humans over the analyzed period
2.3. R&D cost estimates
Evolution of R&D costs (1/2)
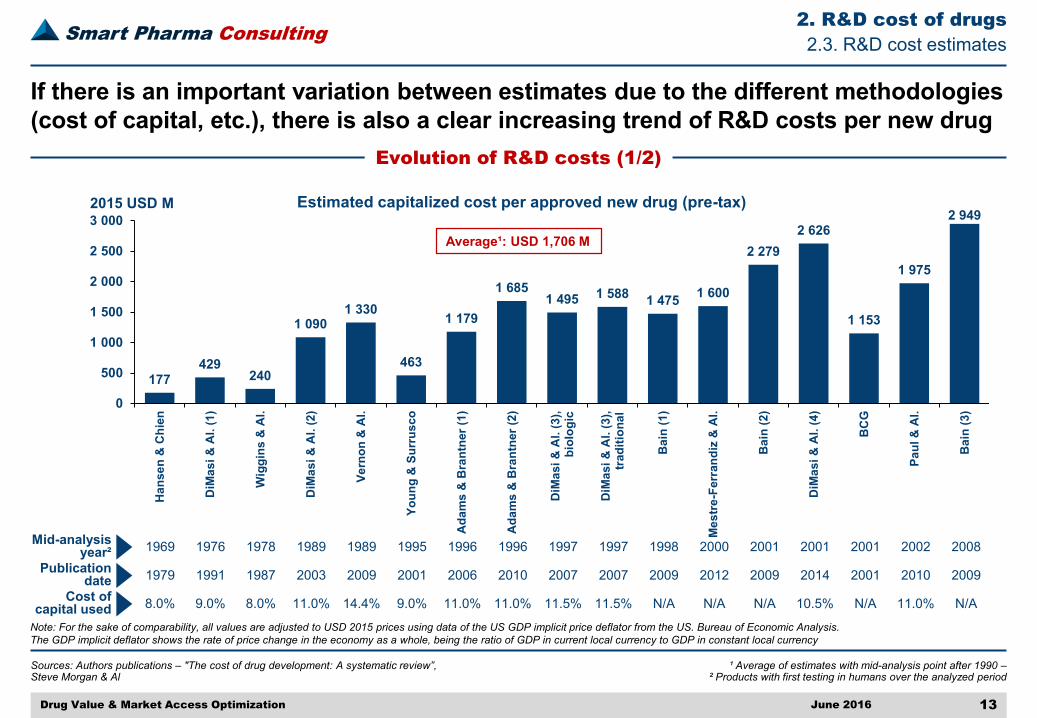
If there is an important variation between estimates due to the different methodologies (cost of capital, etc.), there is also a clear increasing trend of R&D costs per new drug
Estimated capitalized cost per approved new drug (pre-tax)
177429
240
1 0901 330
463
1 179
1 6851 495 1 588 1 475 1 600
2 2792 626
1 153
1 975
2 949
0
500
1 000
1 500
2 000
2 500
3 000
Han
sen
& C
hien
DiM
asi &
Al.
(1)
Wig
gins
& A
l.
DiM
asi &
Al.
(2)
Vern
on &
Al.
Youn
g &
Sur
rusc
o
Ada
ms
& B
rant
ner (
1)
Ada
ms
& B
rant
ner (
2)
DiM
asi &
Al.
(3),
bio
logi
c
DiM
asi &
Al.
(3),
tr
aditi
onal
Bai
n (1
)
Mes
tre-
Ferr
andi
z &
Al.
Bai
n (2
)
DiM
asi &
Al.
(4)
BC
G
Paul
& A
l.
Bai
n (3
)
2015 USD M
Mid-analysisyear²
Average¹: USD 1,706 M
1969 1976 1978 1989 1989 1995 1996 1996 1998 2000 2001 20022001 20011997 1997 2008Publication
date 1979 1991 1987 2003 2009 2001 2006 2010 2009 2012 2001 20102009 20142007 2007 2009
Note: For the sake of comparability, all values are adjusted to USD 2015 prices using data of the US GDP implicit price deflator from the US. Bureau of Economic Analysis. The GDP implicit deflator shows the rate of price change in the economy as a whole, being the ratio of GDP in current local currency to GDP in constant local currency
Cost ofcapital used 8.0% 9.0% 8.0% 11.0% 14.4% 9.0% 11.0% 11.0% N/A N/A N/A 11.0%N/A 10.5%11.5% 11.5% N/A
Smart Pharma Consulting
Sources: DiMasi (1991) – DiMasi et al. (2003) – DiMasi, Grabowski (2007) – DiMasi (2014) – Cost of Capital - NYU Stern School of Business, January 2016
2. R&D cost of drugs
June 2016 14Drug Value & Market Access Optimization
¹ Products with first testing in humans over the analyzed period
2.3. R&D cost estimates
Evolution of R&D costs (2/2)
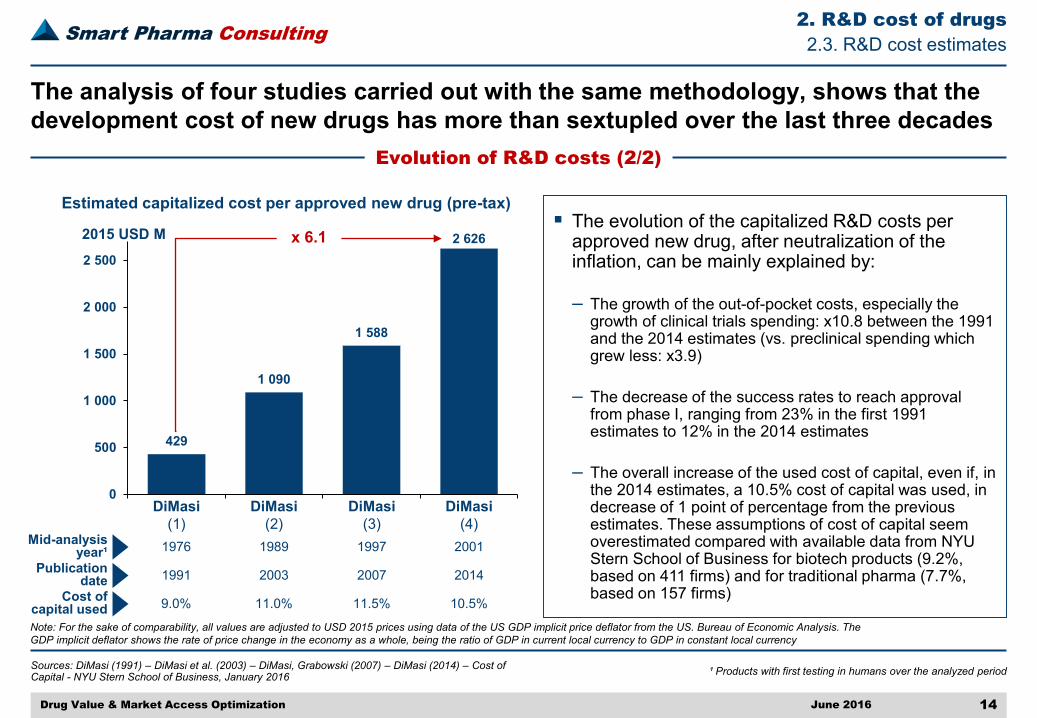
The analysis of four studies carried out with the same methodology, shows that the development cost of new drugs has more than sextupled over the last three decades
Estimated capitalized cost per approved new drug (pre-tax)
429
1 090
1 588
2 626
0
500
1 000
1 500
2 000
2 500
1 2 3 4DiMasi(1)
2015 USD M x 6.1
Mid-analysisyear¹
Publicationdate
Note: For the sake of comparability, all values are adjusted to USD 2015 prices using data of the US GDP implicit price deflator from the US. Bureau of Economic Analysis. The GDP implicit deflator shows the rate of price change in the economy as a whole, being the ratio of GDP in current local currency to GDP in constant local currency
Cost ofcapital used
DiMasi(2)
DiMasi(3)
DiMasi(4)
1976 1989 20011997
1991 2003 20142007
9.0% 11.0% 10.5%11.5%
The evolution of the capitalized R&D costs per approved new drug, after neutralization of the inflation, can be mainly explained by:
‒ The growth of the out-of-pocket costs, especially the growth of clinical trials spending: x10.8 between the 1991 and the 2014 estimates (vs. preclinical spending which grew less: x3.9)
‒ The decrease of the success rates to reach approval from phase I, ranging from 23% in the first 1991 estimates to 12% in the 2014 estimates
‒ The overall increase of the used cost of capital, even if, in the 2014 estimates, a 10.5% cost of capital was used, in decrease of 1 point of percentage from the previous estimates. These assumptions of cost of capital seem overestimated compared with available data from NYU Stern School of Business for biotech products (9.2%, based on 411 firms) and for traditional pharma (7.7%, based on 157 firms)
Smart Pharma Consulting
Source: Adams CP et al, 2006. health Affairs
2. R&D cost of drugs
June 2016 15Drug Value & Market Access Optimization
1 Capitalized costs in 2000 dollars
2.3. R&D cost estimates
Variations in R&D costs estimates according to companies (2000)
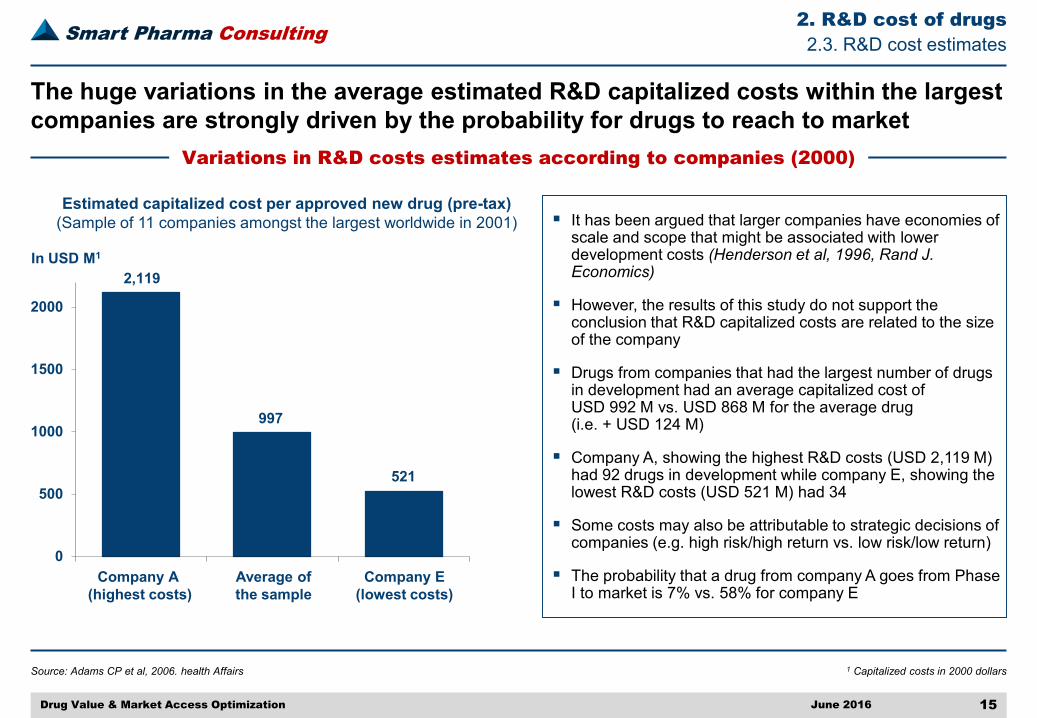
The huge variations in the average estimated R&D capitalized costs within the largest companies are strongly driven by the probability for drugs to reach to market
It has been argued that larger companies have economies of scale and scope that might be associated with lower development costs (Henderson et al, 1996, Rand J. Economics)
However, the results of this study do not support the conclusion that R&D capitalized costs are related to the size of the company
Drugs from companies that had the largest number of drugs in development had an average capitalized cost of USD 992 M vs. USD 868 M for the average drug (i.e. + USD 124 M)
Company A, showing the highest R&D costs (USD 2,119 M) had 92 drugs in development while company E, showing the lowest R&D costs (USD 521 M) had 34
Some costs may also be attributable to strategic decisions of companies (e.g. high risk/high return vs. low risk/low return)
The probability that a drug from company A goes from Phase I to market is 7% vs. 58% for company E
0
500
1000
1500
2000
In USD M1
Average ofthe sample
Company A (highest costs)
Company E (lowest costs)
521
997
2,119
Estimated capitalized cost per approved new drug (pre-tax)(Sample of 11 companies amongst the largest worldwide in 2001)
Smart Pharma Consulting
Source: Forbes August 2013 after Innothink Center for Research in Biomedical Innovation
2. R&D cost of drugs
June 2016 16Drug Value & Market Access Optimization
1 Cumulated over the 2003-2012 period – 2 Period preceding new drugs approval – ³ Companies that have launched 4 products or more over the periodNote: Abbott has been excluded for including medical devices sales. Wyeth and Schering-Plough
have been excluded for being merged with Pfizer and Merck & Co respectively
2.3. R&D cost estimates
Biggest R&D spenders per new drug – Top 10 big pharma companies
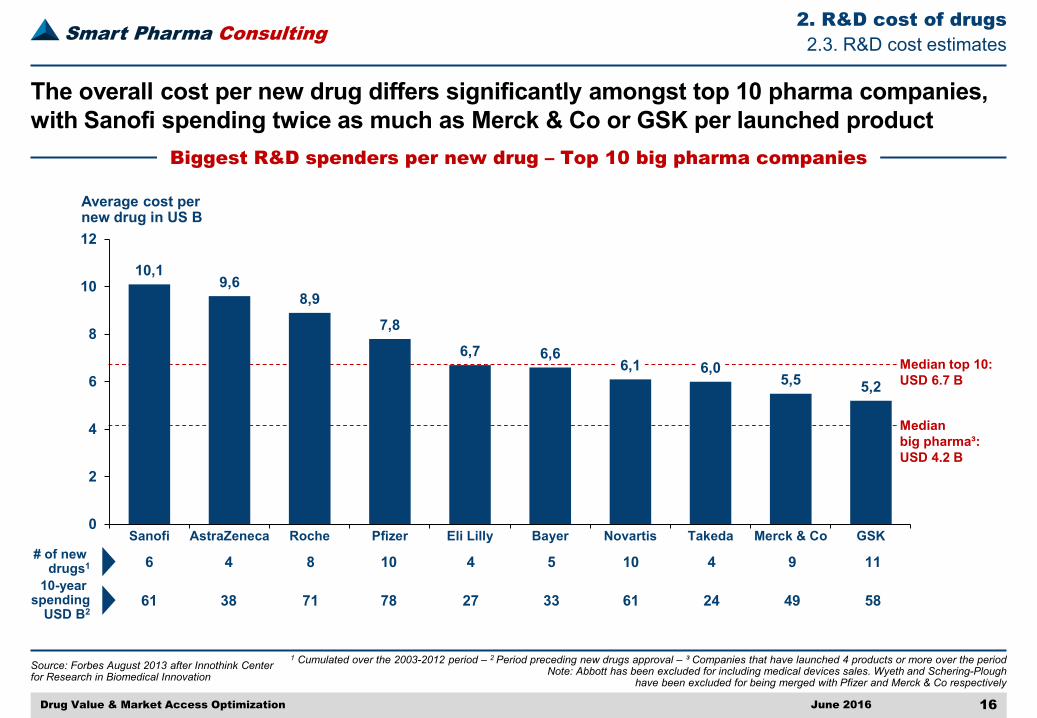
The overall cost per new drug differs significantly amongst top 10 pharma companies, with Sanofi spending twice as much as Merck & Co or GSK per launched product
10,19,6
8,97,8
6,7 6,66,1 6,0
5,5 5,2
0
2
4
6
8
10
12
Sanofi AstraZeneca Roche Pfizer Eli Lilly Bayer Novartis Takeda Merck & Co GSK# of new
drugs1 6 4 58 10 1110 4 4 910-year
spendingUSD B2
61 38 3371 61 5878 27 24 49
Average cost per new drug in US B
Median top 10: USD 6.7 B
Median big pharma³: USD 4.2 B
Smart Pharma Consulting
Source: Forbes August 2013 after Innothink Center for Research in Biomedical Innovation
2. R&D cost of drugs
June 2016 17Drug Value & Market Access Optimization
1 USD 4.2 B, median spending of big pharma companies / USD 0.9 B, median for biotech companies = 4.7 –2 Defined as companies that are mainly focused on biologic products – 3 Cumulated over the 2003-2012 period –
4 Period preceding new drugs approval – 5 Companies that have launched 1 product over the period
2.3. R&D cost estimates
Biggest R&D spenders per new drug – Selection of 10 biotech companies2
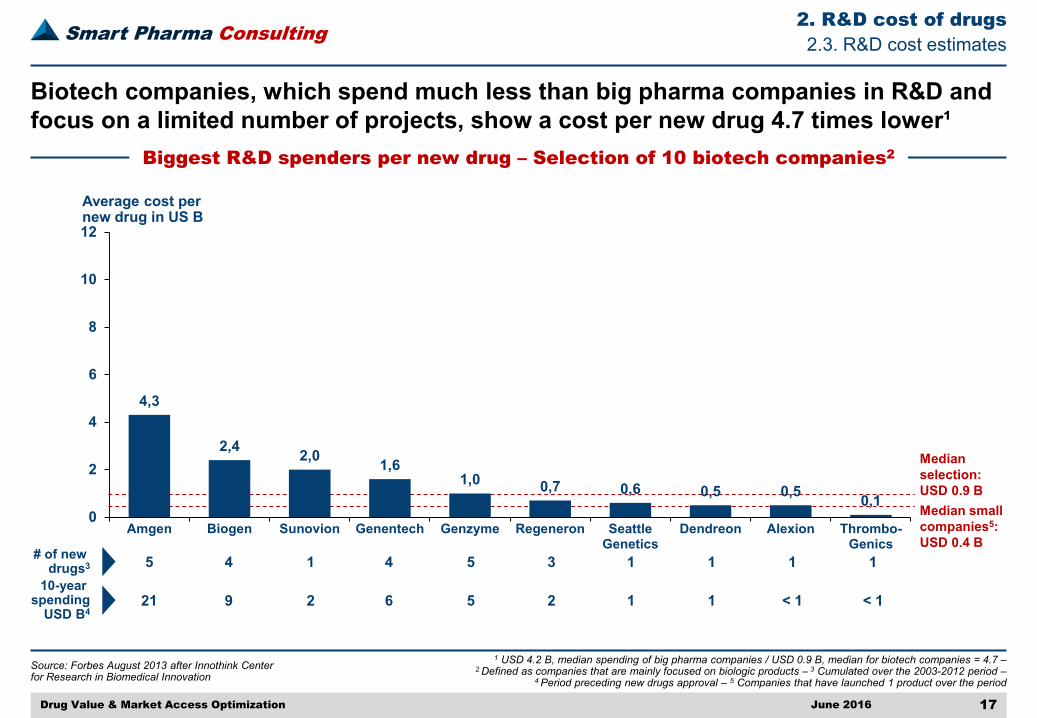
Biotech companies, which spend much less than big pharma companies in R&D and focus on a limited number of projects, show a cost per new drug 4.7 times lower¹
4,3
2,4 2,0 1,61,0 0,7 0,6 0,5 0,5 0,1
0
2
4
6
8
10
12
Amgen Biogen Sunovion Genentech Genzyme Regeneron SeattleGenetics
Dendreon Alexion Thrombo-Genics
# of new drugs3 5 4 31 1 14 5 1 1
10-year spending
USD B421 9 22 1 < 16 5 1 < 1
Average cost per new drug in US B
Median selection: USD 0.9 BMedian small companies5: USD 0.4 B
Smart Pharma Consulting
Source: Forbes August 2013 after Innothink Center for Research in Biomedical Innovation
2. R&D cost of drugs
June 2016 18Drug Value & Market Access Optimization
2.3. R&D cost estimates
Comment on Forbes drugs development cost estimates
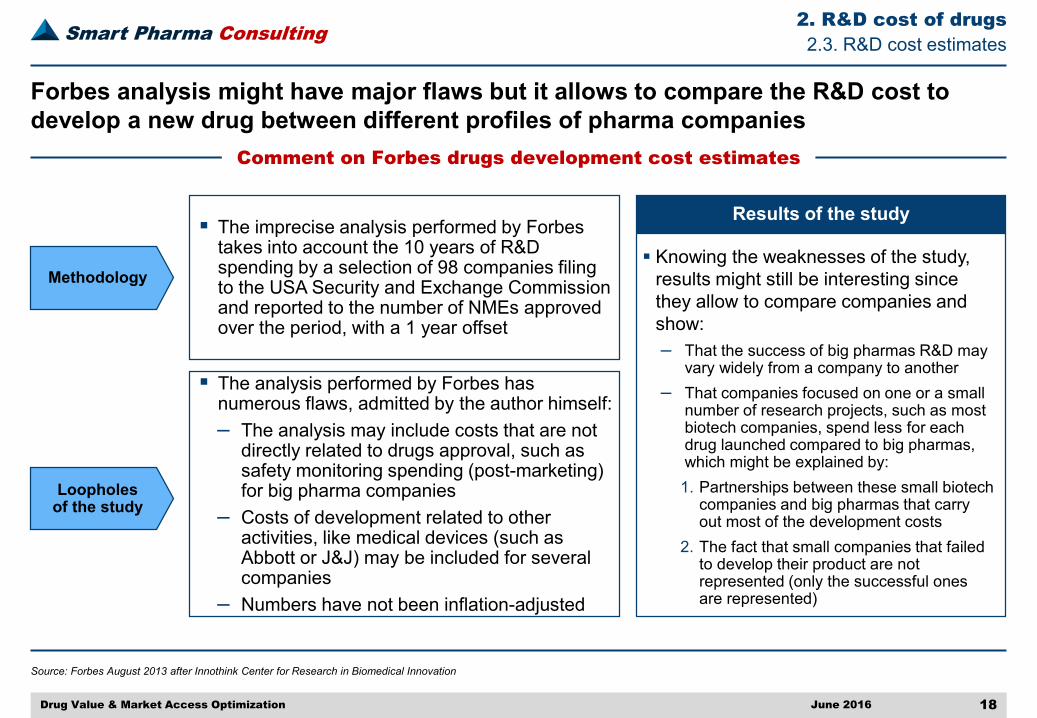
Forbes analysis might have major flaws but it allows to compare the R&D cost to develop a new drug between different profiles of pharma companies
The imprecise analysis performed by Forbes takes into account the 10 years of R&D spending by a selection of 98 companies filing to the USA Security and Exchange Commission and reported to the number of NMEs approved over the period, with a 1 year offset
Loopholes of the study
Methodology
The analysis performed by Forbes has numerous flaws, admitted by the author himself:‒ The analysis may include costs that are not
directly related to drugs approval, such as safety monitoring spending (post-marketing) for big pharma companies
‒ Costs of development related to other activities, like medical devices (such as Abbott or J&J) may be included for several companies
‒ Numbers have not been inflation-adjusted
Knowing the weaknesses of the study, results might still be interesting since they allow to compare companies and show:‒ That the success of big pharmas R&D may
vary widely from a company to another‒ That companies focused on one or a small
number of research projects, such as most biotech companies, spend less for each drug launched compared to big pharmas, which might be explained by: 1. Partnerships between these small biotech
companies and big pharmas that carry out most of the development costs
2. The fact that small companies that failed to develop their product are not represented (only the successful ones are represented)
Results of the study
Smart Pharma Consulting
Source: DiMasi et al, 2004, Drug Information Journal
2. R&D cost of drugs
June 2016 19Drug Value & Market Access Optimization
1 Capitalized costs in 2000 dollars
2.3. R&D cost estimates
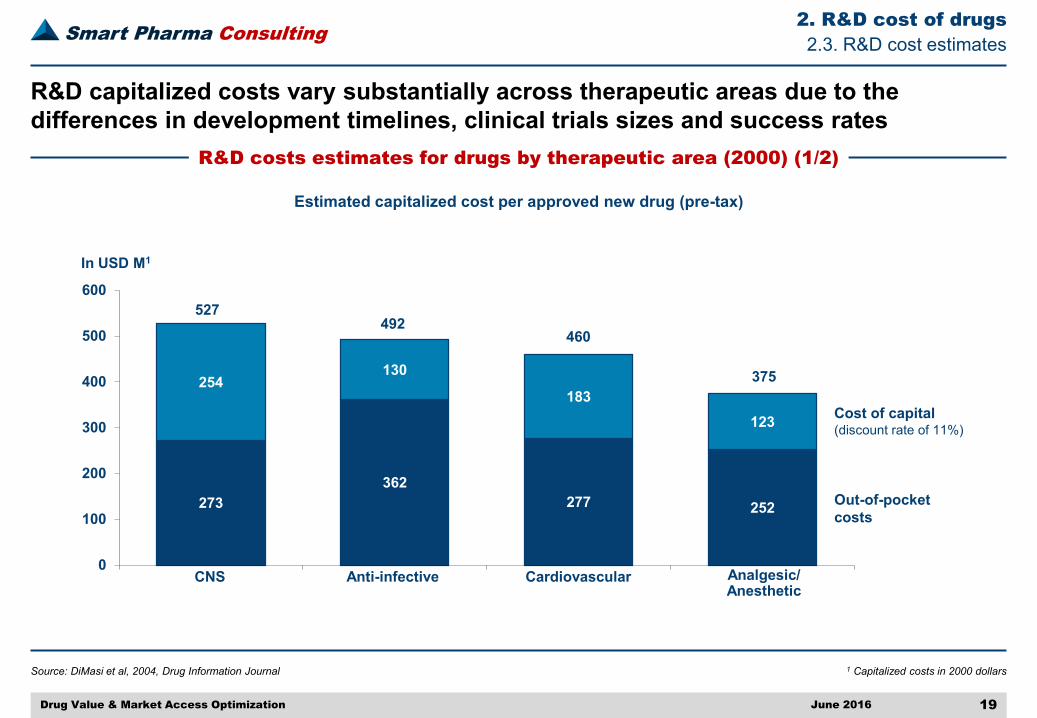
R&D costs estimates for drugs by therapeutic area (2000) (1/2)
R&D capitalized costs vary substantially across therapeutic areas due to the differences in development timelines, clinical trials sizes and success rates
Estimated capitalized cost per approved new drug (pre-tax)
273362
277 252
254130
183123
0
100
200
300
400
500
600
Anti-infectiveCNS Cardiovascular Analgesic/Anesthetic
Out-of-pocket costs
Cost of capital (discount rate of 11%)
In USD M1
527492
460
375

Smart Pharma Consulting
Source: Adams CP et al, 2006. health Affairs
2. R&D cost of drugs
June 2016 20Drug Value & Market Access Optimization
1 Capitalized costs in 2000 dollars – 2 New Drug Applications
2.3. R&D cost estimates
R&D costs estimates for drugs by therapeutic area (2000) (2/2)
R&D capitalized costs can vary depending on the therapeutic area, due to the specific regulatory policies which can have a substantive effect on success rate and duration
Estimated capitalized cost per approved new drug (pre-tax) The difference observed in
development costs between disorders is attributable to the variability in:– Success rates– Durations of each development
step Higher success rates have been
observed for drugs indicated for disorders with higher unmet medical needs (e.g. HIV/AIDS, breast cancer) Phase III durations for HIV/AIDS
drugs are associated with lower capitalized costs because they are in general allowed to file NDAs2
without completing large-scale clinical trials, unlike cardiovasculars
1 1341 042 1 016 946 906 887
677 648 635540
454
0
200
400
600
800
1 000
1 200
Respiratory Cancer Blood Dermatology Genito-urinary AntiparasiticCNS Rheumatology Cardiovascular Sensory HIV/AIDS
In USD M1
Smart Pharma Consulting
Source: Smart Pharma Consulting analyses
2. R&D cost of drugs
June 2016 21Drug Value & Market Access Optimization
1 For an opportunity cost estimated at 11%. The US government guidelines call for using 3%
2.6. Conclusion
Estimated R&D cots of drugs
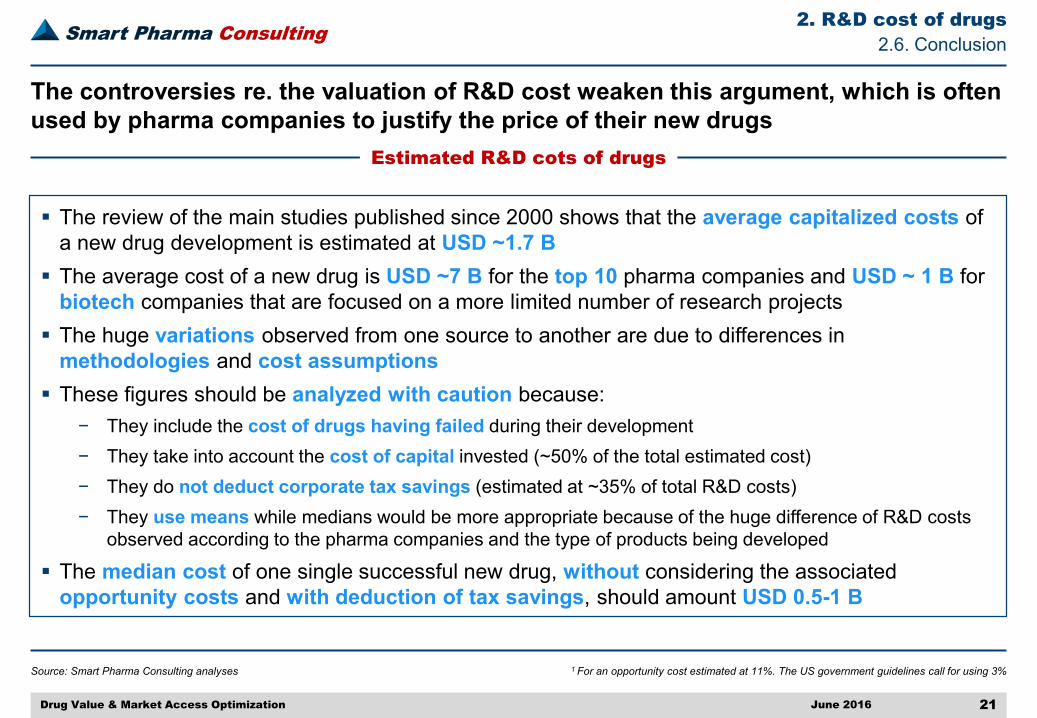
The controversies re. the valuation of R&D cost weaken this argument, which is often used by pharma companies to justify the price of their new drugs
The review of the main studies published since 2000 shows that the average capitalized costs of a new drug development is estimated at USD ~1.7 B The average cost of a new drug is USD ~7 B for the top 10 pharma companies and USD ~ 1 B for
biotech companies that are focused on a more limited number of research projects The huge variations observed from one source to another are due to differences in
methodologies and cost assumptions These figures should be analyzed with caution because:
− They include the cost of drugs having failed during their development− They take into account the cost of capital invested (~50% of the total estimated cost)− They do not deduct corporate tax savings (estimated at ~35% of total R&D costs)− They use means while medians would be more appropriate because of the huge difference of R&D costs
observed according to the pharma companies and the type of products being developed
The median cost of one single successful new drug, without considering the associated opportunity costs and with deduction of tax savings, should amount USD 0.5-1 B
Confidential
Smart Pharma Consulting1, rue Houdart de Lamotte – 75015 Paris – France • Tel.: +33 6 11 96 33 78 • Fax: +33 1 45 57 46 59 • E-mail: [email protected] • Website: www.smart-pharma.com
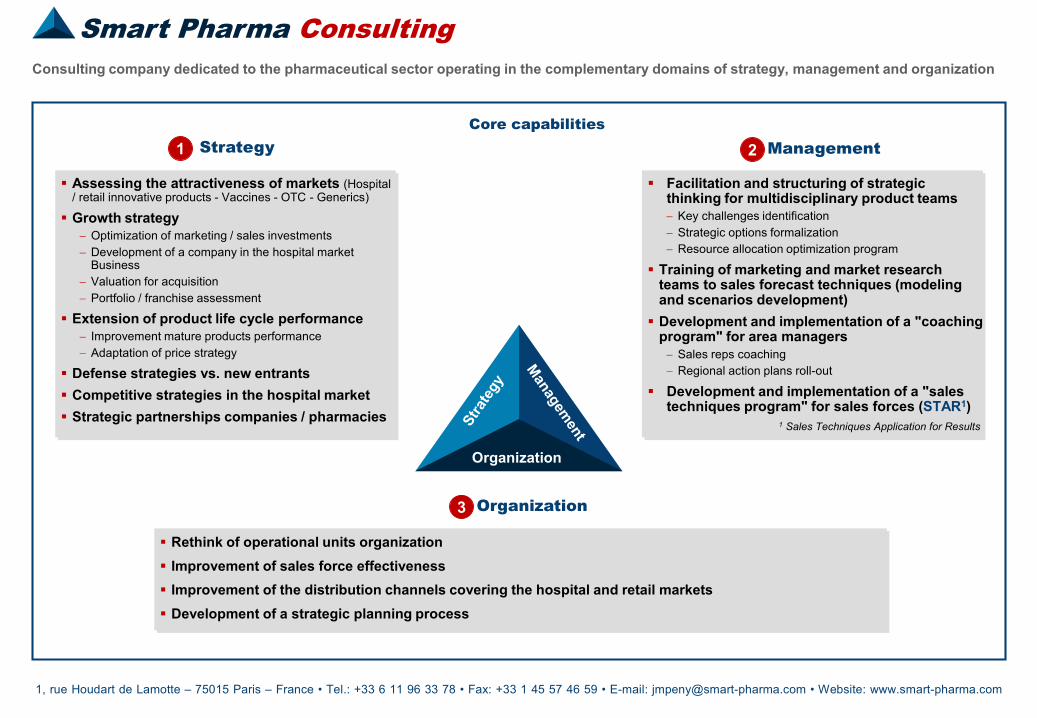
Consulting company dedicated to the pharmaceutical sector operating in the complementary domains of strategy, management and organization
Smart Pharma Consulting
Core capabilitiesStrategy1
Assessing the attractiveness of markets (Hospital / retail innovative products - Vaccines - OTC - Generics)
Growth strategy − Optimization of marketing / sales investments− Development of a company in the hospital market
Business− Valuation for acquisition − Portfolio / franchise assessment
Extension of product life cycle performance− Improvement mature products performance− Adaptation of price strategy
Defense strategies vs. new entrants Competitive strategies in the hospital market Strategic partnerships companies / pharmacies
Rethink of operational units organization Improvement of sales force effectiveness Improvement of the distribution channels covering the hospital and retail markets Development of a strategic planning process
Organization3
Organization
Facilitation and structuring of strategic thinking for multidisciplinary product teams − Key challenges identification − Strategic options formalization− Resource allocation optimization program
Training of marketing and market research teams to sales forecast techniques (modeling and scenarios development) Development and implementation of a "coaching
program" for area managers− Sales reps coaching− Regional action plans roll-out
Development and implementation of a "sales techniques program" for sales forces (STAR1)
Management2
1 Sales Techniques Application for Results