Embed Size (px)
Citation preview
Helping our customers. We’re on it.
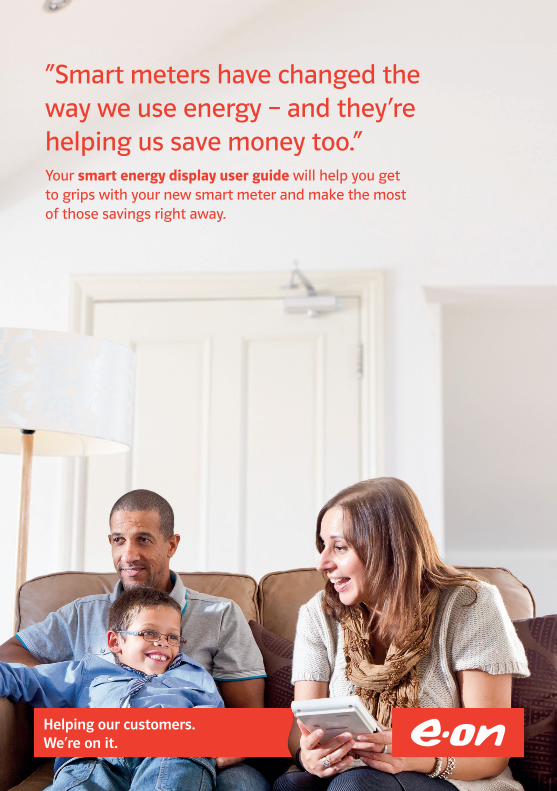
“Smart meters have changed the way we use energy – and they’re helping us save money too.”Your smart energy display user guide will help you get to grips with your new smart meter and make the most of those savings right away.

This handy guide will help you use your smart energy display to keep an eye on how much energy you’re using. Inside, you’ll also find out how your display could help you save energy and money.
3 What does my Smart energy
display do?
4 How do I get up and running?
6 Your quick start guide
8 Using your smart energy display
9 Energy costs
10 Usage
11 CO2 emissions
12 Setting the alarm
13 Setting the key tone and
light options
14 What else do I need to know?
15 What happens next?
Contents
2
This guide is for our customers
who have electricity or gas smart
meters installed or both by E.ON.
How does smart metering work?
Smart meters are intelligent electricity
and gas meters that enable two-way
communications between your home
and us. Your meter will talk to us
remotely, sending us accurate meter
readings and energy usage details. It’ll
also talk to you through your display – a
unit that can sit anywhere in your home.
It communicates remotely with your
smart meters to show you exactly
how much electricity and gas you’re
using. You can look at this information in
real time or by looking back at the last
week, month or year.
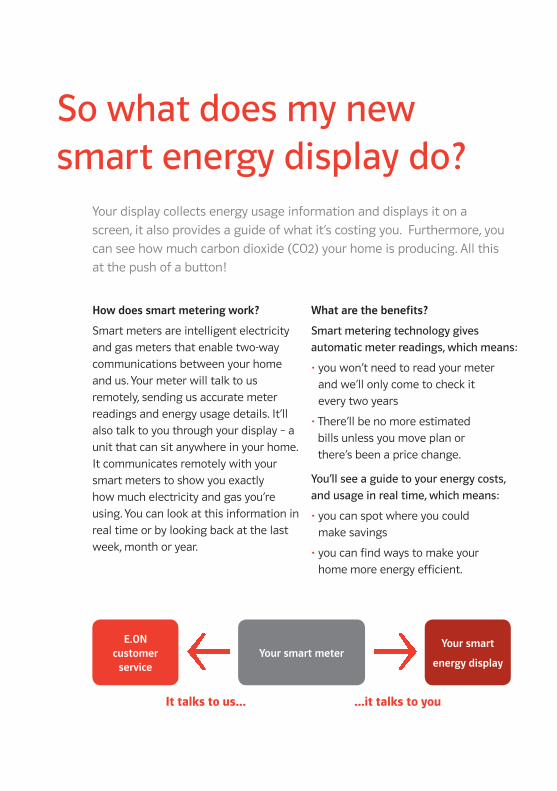
Your display collects energy usage information and displays it on a
screen, it also provides a guide of what it’s costing you. Furthermore, you
can see how much carbon dioxide (CO2) your home is producing. All this
at the push of a button!
So what does my new smart energy display do?
What are the benefits?
Smart metering technology gives
automatic meter readings, which means:
• you won’t need to read your meter
and we’ll only come to check it
every two years
• There’ll be no more estimated
bills unless you move plan or
there’s been a price change.
You’ll see a guide to your energy costs,
and usage in real time, which means:
• you can spot where you could
make savings
• you can find ways to make your
home more energy efficient.
It talks to us... ...it talks to you
Your smart meterE.ON
customer service
Your smart
energy display

How can my display help me save energy and money?
Your display stores a guide to your energy costs and usage
information so you can view it for the last week, month or year, as
well as in real time. By tracking your costs and usage, you’ll build a
picture of when and where you use the most energy in your home.
In time, you’ll be able to see where you could use less energy
and cut your bills.
It’s quick and easy to start using your smart energy display
to monitor your energy costs and usage. Our smart meter
installer will have set up your display and linked it to your
smart meter, so you’re ready to go.
4
How do I get up and running?

Will I see what I’m using at a glance?
Yes, your display has a traffic light system to quickly show you
how much energy you’re using in real time. The coloured lights
beneath the display screen tell you if you’re using a small,
medium or large amount of energy.
5
Green Current energy usage
is less than 150W.
Amber Current energy usage is between
150W and 1,000W (1kW).
Red Current energy usage is more
than 1,000W (1kW).
5

6
Your quick start guide
1
2
3
4
6
5
1. Select Fuel Button This button will let you switch between
fuels if you have E.ON smart meters fitted
for both electricity and gas. You’ll see a
lightbulb for electricity, and a flame for gas.
On CO2 emissions, both fuels can be
shown combined.
2. Reading/Costs display By pressing the readings/costs button you
can view the current active rate and
readings then easily move through the
screens showing a guide to all costs for
Electricity for today, yesterday, last 7
and 28 days.

7
3. Usage Display Press this button to move through
screens showing how much you’re
currently using, and how much you’ve
used in the last 7 days, 28 days and 12
months. You can view information in
numerical and graph format.
4. Emissions Display Press this button to move through
screens showing how much CO2 is being
produced by the energy you’re using. The
information is shown in kg of CO2 split by
selected fuel. You can view totals in real
time and for the last 7 days, 28 days and
12 months.
5. Menu Pressing this button will display the
following menu options:
1. Set-Up Allows you to turn the key
press buzzer on or off.
2. System Info Displays your smart
meters’ serial numbers.
3. Usage Alarm Lets you set an alarm
that tells you when your electricity costs
have gone over a pre-set amount.
You can change this amount at any time,
or turn off the alarm by setting the
amount to zero. If the alarm goes off,
press any button to switch it off.
6. Menu navigation Use the up and down buttons to scroll
through the menu options, and the enter
button to make your selections. You can
go back to the main menu by pressing
the menu button. Pressing this again
takes you out of the menu function and
back to normal operation.
Top tips1. You can use the information shown on
the display to compare your electricity
spend across different periods helping
you budget.
2. If you’ve taken efficiency steps to help
reduce your energy consumption such as
fitting energy saving bulbs, appliances
etc, the usage screens will help you see
how much energy you’re saving.
3. Your display will show you the effects of
making even small changes to your
central heating and hot water
thermostat settings.
4. You can use the CO2 emissions
information gathered on your display to
help you make decisions about how you
could help protect the environment by
using less energy in your home.
5. If your display regularly shows a red
light, take a walk around your home and
see which appliances can be switched
off to save energy.
What are kilowatts (kW) and kilowatt hours (kWh)? The amounts of electricity and gas you
use are shown on your display in kilowatt
hours (kWh). Each kWh is one unit. Your
appliances all use different amounts of
energy. A typical electric kettle is rated
around 2kW, which means that, while in
use, it consumes 2kW of electricity. If the
kettle was used continuously for an hour,
it would use 2 kWh, or 2 units of electricity.
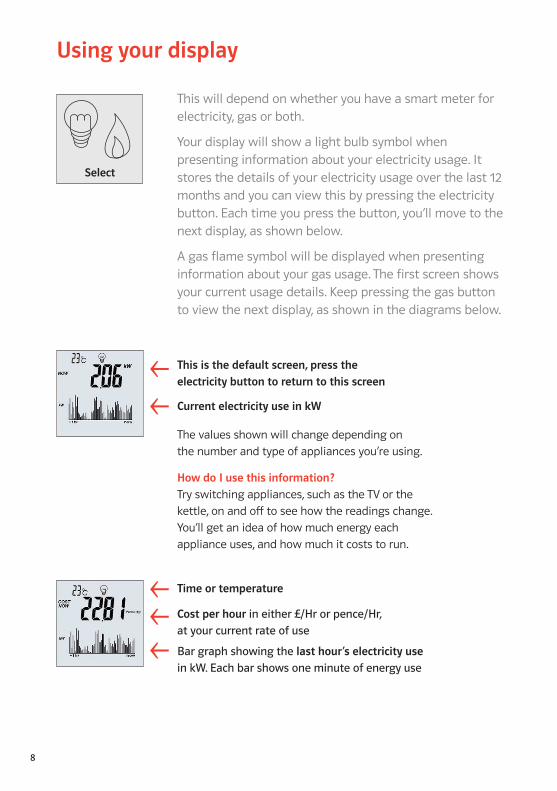
Select
This will depend on whether you have a smart meter for electricity, gas or both.
Your display will show a light bulb symbol when presenting information about your electricity usage. It stores the details of your electricity usage over the last 12 months and you can view this by pressing the electricity button. Each time you press the button, you’ll move to the next display, as shown below.
A gas flame symbol will be displayed when presenting information about your gas usage. The first screen shows your current usage details. Keep pressing the gas button to view the next display, as shown in the diagrams below.
Time or temperature
How do I use this information?Try switching appliances, such as the TV or the
kettle, on and off to see how the readings change.
You’ll get an idea of how much energy each
appliance uses, and how much it costs to run.
Cost per hour in either £/Hr or pence/Hr,
at your current rate of use
Bar graph showing the last hour’s electricity use
in kW. Each bar shows one minute of energy use
This is the default screen, press the electricity button to return to this screen
8
Using your display
Current electricity use in kW
The values shown will change depending on
the number and type of appliances you’re using.

9
The costs on your energy display are a guide and can’t be used to work out your bill because we use averages to work it. Press the readings and costs button to view details of your energy costs over different time periods, along with corresponding meter readings. Each time you press the readings and costs button, you’ll move on to the next display, as shown in the diagrams below.
Readings/Costs
Using your display – energy costs
Electricity costs, rates and actual meter readings 1 x button press
• Cost as pence/kWh
• Time and date
• Actual meter readings in kWh,
exactly as shown on your smart meter
and updated every 30 minutes
View your costs for electricity usage yesterday, the last 7 days and the last 28 days 2 x button presses
Gas costs and actual meter reading 2 x button presses
• Cost as pence/kWh
• Actual meter reading in m3, exactly
as shown on your smart meters and
updated every 30 minutes
View your costs for gas usage yesterday, the last 7 days and the last 28 days 2 x button presses

10
Electricity use 1 x button press = instant cost now and graph of today
(each bar shows 1 hour)
2 x button presses = last 7 days (each bar shows 1 day)
3 x button presses = last 28 days (each bar shows 1 week)
4 x button presses = last 12 months (each bar shows 1 month)
Using your display – usage
Gas use 1 x button press = cumulative cost and graph of today
(each bar shows 1 hour)
2 x button presses = last 7 days (each bar shows 1 day)
3 x button presses = last 28 days (each bar shows 1 week)
4 x button presses = last 12 months (each bar shows 1 month)
How do I use this information?As well as noticing usage patterns, you’ll see how
much energy and money you’re saving if you’ve taken
energy saving steps, such as fitting loft insulation.
How is my display unit cost calculated?Your display uses a unit cost based on averages. The
unit cost is an average of your first and next unit (as
described on your bill), and is based on Ofgems
average annual consumption figures - which are
3,300kWh for standard meters, 5000kWh for Economy
7 meters and 16,500kWh for gas.
Also if you are an Economy 7 customer your display
assumes that you use 55% of units during cheaper
times and 45% at other times. Remember, your
discounts and VAT are not included on your display.

Press the emissions button to view the environmental impact of your home gas and electricity usage. The amount of CO
2 emitted per kWh is a variable figure that
depends on the method used for electricity generation at any given time. The display uses a weighted national average value. Move through the different screens as shown below.
Current CO2 emissions caused by fuel usage 1 x button press
• Emissions per hour in kG of CO2 at your
current rate of energy usage
• Current figure of CO2 per kWh of fuel
• Graph showing CO2 emissions over the
last hour (each bar shows one minute)
Emissions
CO2
Using your display – CO2 emissions
Today’s CO2 emissions caused by usage Electricity = 2 x button presses (top screen) Gas = 3 x button presses (bottom screen)
• CO2 emissions in kG linked to each type of energy
• Current figure of CO2 per kWh of fuel
• Graph showing CO2 emissions today
(each bar shows one hour)
Total CO2 emissions over the last 7 days, 28 days and 12 months 4 x button presses
• These three totals show the CO2 emissions
combined for both fuel types
11

12
Using your display – setting the alarmTo help control your energy spend, you can programme your display to
warn you if you’re spending more on electricity than your chosen amount.
An alarm will alert you when your hourly spend amount is reached.
Press once
Press repeatedly until menu item 3 Usage Alarm is highlighted
Press once to see Set Alarm
Press again to highlight the alarm level ie £0.00/Hour ON.
Use the keys
Followed by to enter your energy cost value
Set Alarm will be displayed followed by your set value
To exit to the main menu press
To resume normal operation press again
You can update your £/Hour amount as often as you like.
enter
enter
enter
menu
menu
menu

Using your display – setting the key toneEach time you press a button, a tone will sound. Use this menu
option to turn the tone on and off, according to your preference.
enter
enter
menu
menu
enter
enter
Press once. 1 Set-Up will be highlighted
Press once. 1 Buzzer Options will be highlighted
Press once. Set Buzzer will be highlighted
Press to highlight ON
Use the keys to toggle ON/OFF
and press again to highlight Set Buzzer O
To return to the main menu press
To resume normal operation press again.
menu
Using your display – light options
13
enter
enter
enter
enter
enter
Press once
Press once. 2 light options will be highlighted
Press once
Use to toggle on or off
Press to confirm
Scroll down highlight Brightness to confirm
to adjust % of brightness to confirm
To resume normal operation, press menu again.
Positioning the smart energy display
Your display can be mounted on the
worktop stand supplied, or fixed to a
wall. Please check the following when
positioning your display:
• It needs to be plugged into an
electrical socket.
• It should be placed somewhere
accessible, so you can read it easily.
• It shouldn’t be installed in a bathroom,
or any other areas with high humidity,
or in direct sunlight.
• If the message ‘Cannot Talk To Meter’
is displayed, move the display closer
to your meter or try it in different areas
of the house, as the signal may be
stronger there.
Important safety information
We want you to use your display safely, so please read these notes:
• Only use the enclosed power adapter.
Always switch off and unplug the
display before attaching or removing
the power cable.
• Never operate the display using a
damaged power adapter, lead or jack. If
you need a replacement power supply,
please call us on 0845 366 5973.
• Don’t immerse the equipment in water
or any other liquids. You can use a soft,
dry cloth to clean the unit.
• Don’t open the display if
the unit develops a fault, please call us
on 0845 366 5973.
• Please ensure children are supervised
when using the smart energy display.
• Operating conditions are 0°C to 40°C.
• Please do not dispose of this product
with your household waste. Take it to
an electrical product recycling centre,
or return it to us for disposal.
14
What else do I need to know?

Now my smart meters are installed, what can I expect when my next bill arrives?Your next bill is likely to include final readings from your old meters and the
automatic readings from your new smart meters. Also, we’ll make sure that all the
old meters we remove are recycled. Now your smart meters are installed, we can
bring your account completely up to date and from now on, unless you change to
a different plan or there’s been a price change, there’ll be no more estimated bills.
Staying with usYou’ll be free to move energy supplier at any time and we’ll do everything we can
to make sure you continue to receive the benefits of smart meters. However,
these may be reduced if the supplier doesn’t support smart meters.
In the future
As smart meter technology advances in the future, we may need to visit you to
exchange your smart meters. This will ensure you benefit from the very latest
smart meters can offer you.
15
What happens next?

D11
55/U
G/0
2/13
E.ON Energy Solutions Limited
Registered Office: Westwood Way Westwood Business Park Coventry CV4 8LG
Registered in England and Wales No. 3407430
eonenergy.com
Final meter reading (electricity)
Final meter reading (gas)
Smart meter serial number (electricity)
Smart meter serial number (gas)
Smart energy display serial number
Date smart meter(s) fitted
Your smart meter(s) certificate of installationYour installer will fill in these boxes once the installation is complete and your
display has been set up and tested. It’s a good idea to hang on to it in case you
need the info at any time - like if you move home.
Your details
Name
Address
Installation details
Name of installer
Date
Signature
#


![They're monkeys They'r - Pearson Argentina · They're [monkeys]. They're [brown]. ... Ask or help the children to cut out the mini flashcards. Say Cut out the cards. Call out colour](https://img.pdfslide.us/doc/110x75/5b4fbce87f8b9a5a6f8d05af/theyre-monkeys-theyr-pearson-theyre-monkeys-theyre-brown-ask.jpg)