Embed Size (px)
Citation preview

SMART GROWTH
FOR CLEAN WATERHelping Communities Addressthe Water Quality Impacts of Sprawl
National Association of Local Government Environmental ProfessionalsTrust for Public LandERG

ABOUT THE NATIONAL ASSOCIATION OF LOCAL GOVERNMENT ENVIRONMENTAL PROFESSIONALS
Founded in 1993 by a group of local offi cials, NALGEP is a nonprofi t national organization representing local government professionals
responsible for environmental compliance and the development and implementation of local environmental policy. NALGEP’s membership includes more than 150 local government entities located throughout America. NALGEP brings together local environmental offi cials to net-work and share information on innovative environmental practices, con-duct environmental policy projects, promote environmental training and education, and communicate the view of local environmental offi cials on national environmental issues.
NALGEP is managed by Spiegel & McDiarmid, a national law and gov-ernment aff airs fi rm based in Washington, D.C. NALGEP’s staff includes Kenneth Brown (Executive Director), Ma� Ward (Environmental A� or-ney), Jessica Cogan (Senior Policy Coordinator), David Dickson (Project Manager), Bridget Thorsen (Project Coordinator), and Jessica Mitchell (Project Assistant).
ABOUT THE TRUST FOR PUBLIC LAND
The Trust for Public Land (TPL) is a national nonprofi t land conserva-tion organization founded to conserve land for public enjoyment. We
connect people to land through parks, recreation areas, working lands, and natural open spaces, ensuring livable communities for generations to come. TPL’s experts in law, fi nance, real estate, fundraising, government, and public relations work nationwide to help citizens and government agencies identify lands they wish to see protected and accomplish their conservation goals. Since its founding in 1972, TPL has helped protect more than 1.6 million acres of land in 45 states. The Trust for Public Land depends on the support and generosity of individuals, foundations, and businesses to achieve our land for people mission. For more information please visit us on the web at www.tpl.org.www.tpl.org.www.tpl.org
ABOUT THE ERG
The ERG is a multidisciplinary consulting fi rm off ering a broad range of professional expertise in the areas of environmental services, com-
munications, information technology, economic research and analysis, energy services, occupational health and safety, and facility planning and engineering. ERG off ers a comprehensive understanding of the envi-ronmental regulations, programs, and issues aff ecting communities. ERG serves a full spectrum of public and private clients, including federal agencies, state governments, corporations, and universities.

SMART GROWTH
FOR CLEAN WATER
Helping Communities Addressthe Water Quality Impacts of Sprawl
National Association of Local Government Environmental ProfessionalsTrust for Public LandERG
2003

This publication was funded in part by the US EPA under grant number CX82865501-1. Points of view expressed in this publication do not necessarily refl ect the views or policies of the US EPA. Mention of trade names and commercial products does not constitute endorsement of their use.
To order copies of these reports, contact NALGEP at (202) 638-6254 or email [email protected] © National Association of Local Government Environmental Professionals NALGEP encourages reproduction of this report if acknowledgement is given to NALGEP.Report text printed on 100 percent processed chlorine-free recycled paper with soy-based inks.
Photo Credits
Some images © 2003 www.clipart.com
Cover — Woman with child © Susan Lapides, courtesy of TPL
Page 11 — © Nevada Wier, courtesy of TPL
Page 17 — © Peter Benen, courtesy of TPL
Page 22 — © Craig Tanner, courtesy of TPL
Page 25 — Community Preservation Initiative, Massachuse� s Executive Offi ce of Environmental Aff airs
Page 28 — © Lin Adler, courtesy of TPL
Page 39 — © Robert Liberty 2003
Page 44 — © Susan Lapides, courtesy of TPL
OTHER NALGEP PUBLICATIONS
Recycling America’s Gas Stations: The Value and Promise of Revitalizing Petroleum Contaminated PropertiesAcross America, local communities are grappling with the challenge of polluted, abandoned gas stations and other petroleum contaminated sites. This report can prime the pump for the redevelopment and reuse of these properties.
Profiles of Local Clean Air Innovation: Empowering Communities to Meet the Air Quality Challenges of the 21st CenturyThis report presents the perspectives of local government offi cials who work every day to combat air pollution and create innovative programs to improve air quality.
Profiles of Business Leadership on Smart Growth: New Partnerships Demonstrate the Economic Benefits of Reducing SprawlThis NALGEP report identifi es the economic impacts of sprawl and highlights strategies businesses are identifying to preserve quality of life, improve access to labor, promote economic development, and protect open space.
Building a Brownfields Partnership from the Ground Up: Local Government Views on the Value and Promise of National Brownfields InitiativesThis report documents the views of local government brownfi elds offi cials on the value of EPA’s brownfi elds policies, and provides proposals for building the next phase of federal brownfi elds programs.

Acknowledgements
NALGEP, Trust for Public Land, and ERG wish to convey our special appreciation to several folks who helped make this “Smart Growth for Clean Water” project and report a success.
We commend and thank the National Advisory Council on Smart Growth for Clean Water and its 34 members for their support throughout the entire project. The Advisory Council represented the best and brightest leaders from across America on land and water protection and the connection and linkage of those two areas. The Advisory Council helped create the Smart Growth for Clean Water project, guided its eff orts by providing valuable information on smart growth and clean water approaches, and assisted in the development of this report.
We likewise off er our appreciation to the leaders and participants in the fi ve National Demonstration Projects for this eff ort, including the State of Colo-rado and the Cherry Creek Stewardship Partners; the State of Iowa and the City of Des Moines; the City of Chicago Department of Environment and the State of Illinois; the Charlo� e-Mecklenburg County Surface Water Improve-ment Program or “SWIM” leaders; and the Commonwealth of Massachuse� s and its partners in the Merrimack River Watershed protection initiative. These fi ve groups were the innovative pioneers that inspired many of the lessons learned in this report.
We are very grateful to the sponsors and federal project offi cers who sup-ported this project and report. Many thanks to the Environmental Protection Agency Offi ce of Water, including Diane Regas, Fred Lindsay, Rebecca Dils, Jamal Kadri, Stephanie Von Feck, Jordan Dorfman, and Holly Stallworth. We also convey our appreciation to the EPA Offi ce of Brownfi elds Cleanup and Redevelopment, including its Director Linda Garczynski, Ben Hamm, and Sven-Erik Kaiser. Thanks to the U.S. Forest Service sponsors of this initia-tive, particularly Susan Mockenhaupt and Philip Rodbell. Thanks also for the great guidance and support from EPA’s Development, Community and Envi-ronment Division, especially Director Geoff Anderson and Lynn Richards.
Special gratitude is due to the NALGEP Board of Directors and Executive Director Ken Brown for their support and guidance in the development of this project. We would also like to thank Bridget Thorsen, David Dickson, and Jessica Mitchell of NALGEP for their eff orts on this project. The Trust for Public Land thanks Caryn Ernst, David Brown, Chris Sla� ery, Nissa Maddox, Doug Robotham, and Craig MacDonnell. ERG conveys its thanks to Ellen Roy Herzfelder, Massachuse� s Secretary for the Executive Offi ce of Environmen-tal Aff airs, and the following ERG staff : Deborah Bartram, who led the Iowa Demonstration Project, Ed Stigall, for his technical expertise and advice, and Rebecca Feldman, who developed the GIS maps for the Massachuse� s Dem-onstration Project.
Finally, thanks to Jessica White of Spiegel & McDiarmid for her excellent design of this report.
Smart Growth for Clean Water – i

STATE GOVERNMENT REPRESENTATIVES
Robert O’Connor, Director of Land and Forest PolicyMassachuse� s Executive Offi ce of Environmental Aff airs
Richard Parachini, Outreach & Assistance Unit ManagerWater Quality Control DivisionColorado Department of Public Health and Environment
Greg Smith, Chief, Division of Environmental & Financial AssistanceOhio Environmental Protection Agency
Michael Tramontina, Executive DirectorIowa Finance Authority
Jeff Vonk, DirectorIowa Department of Natural Resources
Marcia Willhite, Bureau of Water ChiefIllinois Environmental Protection Agency
LOCAL GOVERNMENT REPRESENTATIVES
Larry Coff man, Associate DirectorPrince George’s County, Department of Environmental Resources
John Hills, Director of Water QualityIrvine Ranch Water District
N. Marcia Jimenez, CommissionerChicago Department of Environment
Rusty Rozelle, Water Quality Program ManagerMecklenberg County
Ellen Walkowiak, Economic Development CoordinatorCity of Des Moines
Jim Worley, DirectorCherry Creek Basin Water Quality Authority
NON-PROFIT ORGANIZATIONS
Mark Ackelson, Executive DirectorIowa National Heritage Foundation
Jim Gibbons, Extension Educator Land Use SpecialistUniversity of Connecticut Cooperative Extension
Ed McMahon, Vice PresidentThe Conservation Fund
Gary Moll, Vice President for Urban ForestryAmerican Forests
Chris Rowe, Executive DirectorColorado Watershed Network
Tom Schueler, Executive DirectorTom Schueler, Executive DirectorTom SchuelerCenter for Watershed Protection
Harriet Tregoning, Executive DirectorSmart Growth Leadership Institute
Neil Weinstein, Executive DirectorLow Impact Development Center
Barbara Wells, Senior Policy AnalystNortheast-Midwest Institute
FEDERAL GOVERNMENT MEMBERS
Marc AlstonU.S. EPA Region 8
Geoff Anderson, DirectorU.S. EPA Development, Community, and Environment Division
Rebecca DilsOffi ce of Wetlands, Oceans, and Watersheds
Pixie HamiltonU.S. Geological SurveyWater Resources Division
Ben HammU.S. EPA Offi ce of Brownfi elds Cleanup and Redevelopment
Susan MockenhauptUSDA Forest ServiceUrban & Community Forestry Program
Phillip Rodbell, Program ManagerUrban & Community ForestryU.S. Forest Service
Linda RimerU.S. EPA
Jim Van der KlootUS EPA Region 5
Dov Weitman, ChiefU.S. EPA Nonpoint Source Control Branch
PRIVATE SECTOR REPRESENTATIVES
John De Villars, Executive Vice PresidentBrownfi elds Recovery Corp, Inc.
Carl Guardino, President & CEOSilicon Valley Manufacturing Group
Dr. F. Robert McGregor, PresidentWater and Waste Engineering
Smart Growth for Clean Water Advisory Council
ii – Smart Growth for Clean Water

Smart Growth for Clean Water – iii
Contents
Acknowledgments . . . . . . . . . . . . . . . . . . . . . . . . . . . . . . . . . . . . . . . . i
Smart Growth for Clean Water Advisory Council . . . . . . . . . . . . . . . . . . . ii
Introduction . . . . . . . . . . . . . . . . . . . . . . . . . . . . . . . . . . . . 1
Smart Growth for Clean Water Tools . . . . . . . . . . . . . . . . . . . . 8
Profiles of Smart Growth for Clean Water Innovation . . . . . . . . 12
Barriers and Solutions to Smart Growth for Clean Water. . . . . . 35
Top 10 Actions for Advancing Smart Growth for Clean Water In Your Community . . . . . . . . . 50
Smart Growth for Clean Water Resources . . . . . . . . . . . . . . . . 52
References . . . . . . . . . . . . . . . . . . . . . . . . . . . . . . . . . . . . 56

Connect the Issues of Land and Water
Establish a Greenprint and a Blueprint for Your Community
Think and Act Like a Region
Revitalize Brownfi elds
Expand Urban and Community Forestry
Provide Incentives to Developers
Use GIS Technology
Partner with State Programs
Leverage New Resources
Use Watershed Management Approaches to Protect Land and Water Quality
1
2
Top 10 Actions for Advancing Smart Growth for Clean Water in Your Community
3
4
5
6
7
8
9
10

IntroductionCommunities across America are coping with the results of poorly
planned, sca� ered, high-impact development – or sprawl. When she was Governor of New Jersey, EPA Administrator Christine Todd Whitman put it succinctly: “Suburban sprawl is eating up open space, creating mind-boggling traffi c jams, bestowing on us endless strip malls and housing developments, and consuming an ever-increasing share of our resources.”
Sprawling growth can also cause the degradation of water quality in our rivers, streams, lakes, shores, and groundwater. As stated by Luna Leopold, former Chief Hydrologist for the U.S. Geological Survey, “the health of our waters is the principal measure of how we live on the land.” Despite progress in improving the nation’s waters under the Clean Water Act, nearly 45 percent of water bodies remain polluted, due in large part to “nonpoint source” runoff pollution. Poor land use management is a chief cause of nonpoint pollution.
The need to address urban and suburban runoff has led to new Clean Wa-ter Act requirements for localities, like EPA’s Phase I and Phase II storm-water requirements, and Total Maximum Daily Load (TMDL) restrictions. As a result, communities are struggling to fi nd cost-eff ective solutions to meet the new requirements and local clean water goals. There is clearly a need for new approaches that can help communities address the land-water connection.
Smart growth is emerging as a key strategy for clean water. Across America, examples are emerging where communities are utilizing “smart growth” tools like land conservation, greenway buff ers, the creation of park and recreational areas, natural and constructed wetlands, urban and community forestry, waterfront brownfi elds revitalization, low impact development, watershed-based management, Geographic Information Systems (GIS) mapping, and other tools to reduce nonpoint source pollu-tion, control stormwater, and improve water quality. These smart growth for clean water approaches are o� en more cost-eff ective than traditional structural solutions like building new wastewater plants or stormwater collection facilities. Moreover, these smart growth tools not only enable localities to achieve clean water goals, but they also help a� ain other com-munity objectives such as preservation of open space and parks, cleanup of environmental contamination and community eyesores, creation of sustainable economic development, saving tax dollars through effi cient use of infrastructure, and the improvement of overall quality of life.
Local communities facing sprawling development are turning to smart growth to protect their rivers, lakes, streams, and oceans. For example, the City of Chicago has launched an ambitious project to use brownfi elds cleanup, land conservation, wetlands protection, and urban forestry to
“The health of our waters is the principal measure of how we live on the land.” Luna LeopoldFormer Chief Hydrologist, USGS
Smart Growth for Clean Water – 1

improve water quality and create new jobs and sustainable industry in the Lake Calumet area. A coalition of communities in the Denver metro-politan area is working to establish a continuous natural greenway and innovative green infrastructure enhancements to protect the water qual-ity and the public enjoyment of the Cherry Creek and its tributaries. In North Carolina, the City of Charlo� e and Mecklenburg County are using low impact development and working with the Trust for Public Land to purchase and preserve hundreds of stream-side properties and thousands of acres of waterfront property around Mountain Island Lake, the area’s primary drinking water source. Iowa is one of a handful of states that has authorized its Clean Water State Revolving Fund to provide funding for smart growth tools including waterfront brownfi elds redevelopment, ri-parian land conservation, watershed management, constructed wetlands, and agricultural best management practices. In the fast-growing areas of the Merrimack River watershed, northwest of Boston, four towns are integrating their land use planning with water protection goals through innovative, GIS-based mapping techniques to form a blueprint for smart growth. Faye� eville, Arkansas has determined that, by increasing its tree canopy from 27 percent to 40 percent, this fast-growing city could save up to $135 million on stormwater benefi ts alone (American Forests, 2003).
The connection between land use and water quality has long been recognized by the U.S. Environmental Protection Agency (EPA), and the Agency has recently taken several steps to help localities and states develop and implement new smart growth approaches to protect wa-ter resources. In early 2002, EPA Administrator Whitman announced a new Watershed Initiative that will provide $15 million in Fiscal Year 2003 to help local entities protect and restore their local watersheds. The Watershed Initiative is focused on promoting a more comprehensive ap-proach to protecting water quality – “one that recognizes that the health of aquatic resources is aff ected by what happens on the land that drains into a water body.” On December 3, 2002, the Offi ce of Water renewed its commitment to watershed management. A new Watershed Manage-ment Council will evaluate the potential for further integration of water programs, recommend strategies for funding local watershed initiatives, increase training and technical assistance opportunities, continue to work with states and tribes to build strong watershed programs, and encourage innovation.
The Offi ce of Water has also been collaborating with the EPA Division of Community and Economic Development (DCED) on several smart growth/clean water projects. In addition to working with the Offi ce of Water on how to credit smart growth approaches in TMDL and stormwa-ter plans, DCED is perfecting a modeling tool that will help communities assess the water quality impacts associated with diff erent types of devel-opment pa� erns.
The EPA Brownfi elds Program has provided numerous grants to help communities clean up and revitalize brownfi elds along waterfronts in
2 – Smart Growth for Clean Water

urban areas. From its inception, the EPA Brownfi elds Program has em-bodied a new model of environmental management through its innova-tive partnerships and market-based approach. This was re-emphasized on January 11, 2002 when President Bush signed the Small Business Li-ability Relief and Brownfi elds Revitalization Act. The redevelopment of brownfi elds is a critical smart growth tool that helps to revitalize com-munities and alleviate development pressure on farmland and open space. In addition, the Brownfi elds Program is encouraging brownfi eld developers to use innovative stormwater controls, such as low-impact development techniques, to further protect water quality when they re-vitalize these waterfront properties. The EPA Brownfi elds Program has also partnered with the Offi ce of Wa-ter to promote the use of Clean Water State Revolving Fund resources for the cleanup of waterfront brownfi elds contamination.
The U.S. Forest Service is also work-ing to develop smart growth tools to help communities meet their water quality goals. Specifi cally, the Forest Service has partnered with American Forests to demonstrate how urban forestry (strategic planting of trees) can help protect water quality by preventing stormwater runoff , promoting groundwater recharge, and lessening the impacts of drought. According to American Forests, “trees slow stormwater fl ow, reducing the volume of water in urban areas and decreasing the amount of runoff that containment facilities must store.” Moreover, this forestry strategy can save communities millions of dollars in capital improvement costs.
Sprawl Happens Even with No Population Growth
Between 1970 and 1990, the Cleveland metropolitan area lost 11 percent of its population but consumed more than 33 percent in developed land.(Earth Day Coalition, 2001).
Smart Growth for Clean Water – 3

The Smart Growth for Clean Water Project
This report showcases the results of the Smart Growth for Clean Wa-ter Project, launched in 2000 by the National Association of Local Project, launched in 2000 by the National Association of Local Project
Government Environmental Professionals (NALGEP) in partnership with the Trust for Public Land, U.S. EPA, the U.S. Forest Service, ERG, and fi ve state/local demonstration projects. This Project is designed to help states and localities use smart growth tools as key strategies for achieving clean water goals. Project objectives include:
• Educating local and state elected and appointed offi cialson opportunities to use smart growth tools to improve water quality and meet federal regulatory mandates.
• Fostering interaction among smart growth, brownfi elds, water quality, and urban and community forestry lead-ers.
• Showcasing and assisting specifi c demonstration proj-ects that illustrate how state and local governments can use smart growth tools to improve water quality, control stormwater, meet regulatory mandates, and achieve other community objectives.
• Identifying state and federal policy barriers that are discouraging the use of smart growth tools for clean water and developing solutions to overcome these barriers.
• Disseminating information on available smart growth tools, projects, programs, and resources to help local and state governments achieve their water quality objectives.
This Smart Growth for Clean Water report shares ideas for using smart growth to advance clean water goals based on the experiences of commu-nities across the nation. The report includes background on the impacts of sprawl on water quality; information on the clean water benefi ts of smart growth approaches; identifi cation of smart growth for clean water tools; fi ndings on the barriers to smart growth for clean water and recommend-ed solutions for overcoming these barriers; case study profi les of innova-tive projects and programs across the country; a “Top 10” list of actions that local governments can take to promote smart growth for clean water; and links to further resources and information for communities that seek to put these tools to use.
There is an old Swedish proverb that says “Don’t throw away the old bucket There is an old Swedish proverb that says “Don’t throw away the old bucket There is an old Swedish proverb that says “until you know whether the new one holds water .” Smart growth is emerging until you know whether the new one holds water .” Smart growth is emerging until you know whether the new one holds water .as a new tool for improving our nation’s communities – and this approach clearly holds water. We hope that this report can help localities and their partners fi nd ways to use smart growth to address important develop-ment and water resource issues in their communities.
4 – Smart Growth for Clean Water

Sprawl Threatens Water ResourcesSprawling development pa� erns increase stormwater runoff and non-point source pollution, harm water ecosystems, reduce the recharge of groundwater aquifers, and worsen drought.
Land use aff ects water quality. A major culprit for unhealthy water is the conversion of natural lands to impervious surfaces, such as roads, parking lots, driveways, and roo� ops, and the polluted runoff that results. This runoff can produce discharges to water of oil, salt, sedi-ment, tire particles, and other pollutants. Such pollution is called nonpoint source pollution because it comes from many diff erent locations and types of activities. By increasing run-off volume, altering stream fl ow and the natural hydrology of the land, and signifi cantly reducing groundwater recharge, water resources are degraded (U.S. EPA, 2001(a)).
New construction in previously undeveloped “greenfi eld” ar-eas causes soil disturbance and increased sedimentation and other runoff . Post-construction, the increase in the amount of impervious surface increases the amount of pollutants that enter water bodies. In fact, a one acre parking lot produces almost 16 times the runoff amount of a one acre meadow (U.S. EPA, 2001(a)). The EPA estimates that watersheds beyond 10 percent imperviousness experience stream degradation. Beyond 26 percent imperviousness, streams are seriously de-graded and may never recover to predevelopment conditions (U.S. EPA, 2002(a)). Likewise, runoff pollution can negatively impact the treatment cost and quality of drinking water.
The low density development pa� ern of sprawl is a tremen-dous consumer of land. The American Farmland Trust found that from 1982—1997, U.S. population grew by 17 percent, while urbanized land grew by an alarming 47 percent. The average acreage per person for new housing almost doubled over the past 20 years due to the preponder-ance of low density development. This voracious consumption of land threatens our forests, stream buff ers, vegetative cover, and wetlands, which are all critical natural water quality protectors.
Sprawl adversely impacts drinking water supplies. With high amounts of impervious cover, the natural recharge of groundwater is greatly reduced. Such reduction threatens both the quality and quantity of drinking wa-ter supplies. The reduction of groundwater recharge becomes even more critical as communities struggle to keep the water running during times of drought. American Rivers, the Natural Resources Defense Council, and Smart Growth America estimate that from 1982—1997, the potential amount of water unable to infi ltrate annually was more than 6.2 billion gallons in Dallas to more than 56.9 billion gallons in Atlanta (American Rivers, 2002).
How Impervious Surface In a Watershed Can Affect Water Quality
0-10% Impervious Cover: Sensitive stream which typically has good to excellent water quality
11-25% Impervious Cover: Impacted stream which typically shows clear signs of degradation from watershed urbanization
> 25% Impervious Cover: Non-supporting stream which typically can no longer support a diverse stream community
For more information, visit the Center for Watershed Protection at www.cwp.org.
Smart Growth for Clean Water – 5

Sprawl also increases vehicle miles traveled and associated air pollution, which also impacts water quality. The automobile is o� en the only option for mobility in sprawl development, as destinations are so far from each other that walking from your house to the store is nearly impossible. With more people traveling greater distances to accommodate basic needs, air pollution problems are exacerbated. The link between air quality and water quality is clear. Air pollutants can be deposited on land and water, sometimes at great distances from their original sources, and can be an important contributor to declining water quality. For example, studies show that 21 percent of all nitrogen pollution entering the Chesapeake Bay comes from the air (U.S. EPA, 2000).
Smart Growth Can Help Protect Water Quality
Smart growth provides an alternative to sprawl. Smart growth di-rects development towards existing communities while preserving
open space, farmland, and natural areas that are critical to clean water. Smart growth increases transportation and housing choices and pro-motes the use of existing infrastructure. Smart growth saves money.Smart growth saves money.Smart growth saves moneySmart growth can reduce the costs to taxpayers of new development and foster new investment in communities that have been le� behind. Control-ling water pollution a� er it is generated can be tremendously expensive. Also, the cost of major sewer and water extensions to accommodate new development located far from existing communities can be exorbitant. By using green infrastructure, low impact (and o� en low cost) development techniques, and building closer to existing communities served by water and sewer infrastructure, the high costs of providing gray infrastructure (roads, bridges, etc.) can be avoided. Moreover, smart growth tools, such as land conservation and brownfi elds revitalization, o� en work best when integrated with smart transportation and environmental planning.
Increasingly, local and state governments are exploring the use of inno-vative smart growth approaches that help achieve their water protection goals. Smart growth uses less land than conventional development, o� en reusing brownfi elds or previously developed sites, thus limiting the amount of land converted from farmland, forest, or open space to im-pervious surface. These lands can serve as buff er zones for water bodies, reducing stormwater runoff and fi ltering out pollutants before they reach the water. Smart growth recognizes the importance of targeting protec-tion eff orts and avoiding development on those lands that are critical to our drinking water supply, such as recharge areas. In addition, smart growth reduces vehicle miles traveled (by as much as 15—52 percent) and thus reduces the amount of air pollutants entering water bodies (U.S. EPA, 1999).
6 – Smart Growth for Clean Water
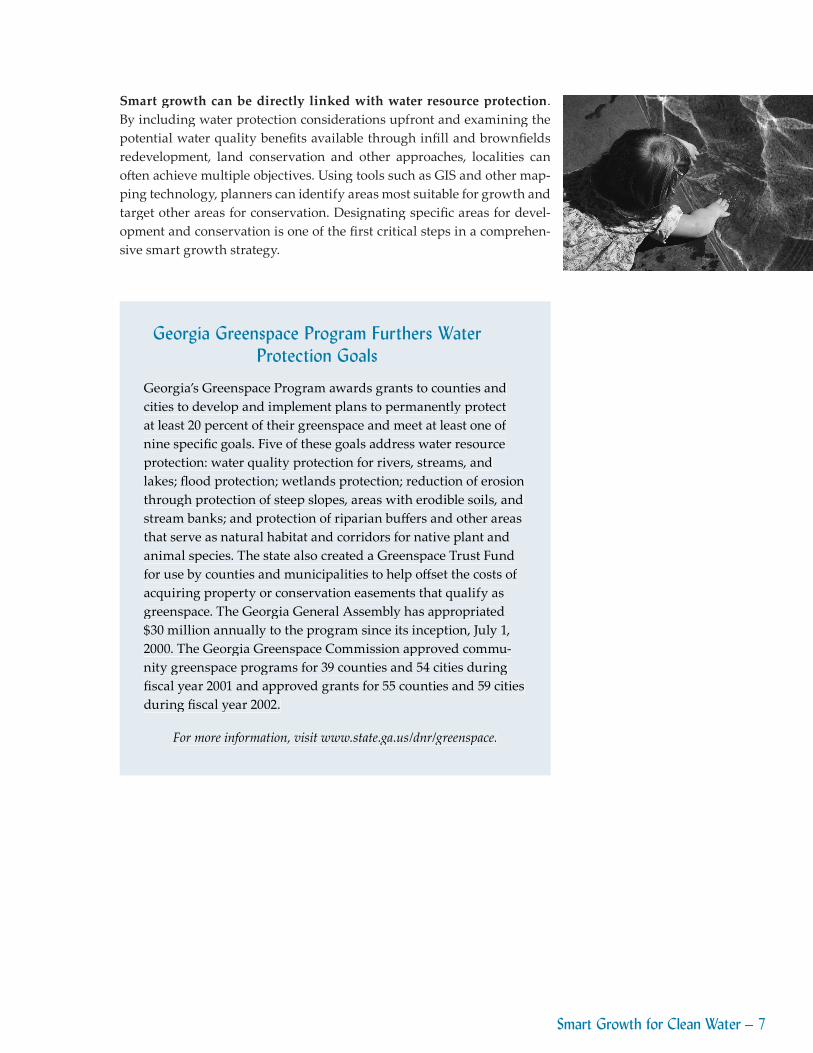
Smart growth can be directly linked with water resource protection. By including water protection considerations upfront and examining the potential water quality benefi ts available through infi ll and brownfi elds redevelopment, land conservation and other approaches, localities can o� en achieve multiple objectives. Using tools such as GIS and other map-ping technology, planners can identify areas most suitable for growth and target other areas for conservation. Designating specifi c areas for devel-opment and conservation is one of the fi rst critical steps in a comprehen-sive smart growth strategy.
Georgia Greenspace Program Furthers Water Protection Goals
Georgia’s Greenspace Program awards grants to counties and cities to develop and implement plans to permanently protect at least 20 percent of their greenspace and meet at least one of nine specifi c goals. Five of these goals address water resource protection: water quality protection for rivers, streams, and lakes; fl ood protection; wetlands protection; reduction of erosion through protection of steep slopes, areas with erodible soils, and stream banks; and protection of riparian buff ers and other areas that serve as natural habitat and corridors for native plant and animal species. The state also created a Greenspace Trust Fund for use by counties and municipalities to help off set the costs of acquiring property or conservation easements that qualify as greenspace. The Georgia General Assembly has appropriated $30 million annually to the program since its inception, July 1, 2000. The Georgia Greenspace Commission approved commu-nity greenspace programs for 39 counties and 54 cities during fi scal year 2001 and approved grants for 55 counties and 59 cities during fi scal year 2002.
For more information, visit www.state.ga.us/dnr/greenspace.
Smart Growth for Clean Water – 7

Smart Growth for Clean Water Tools
This report highlights how fi ve smart growth approaches can improve water quality – land conservation, waterfront brownfi elds revitalization, urban and community forestry, low impact development, and watershed management.
Land ConservationLand use changes aff ect water quality. By preserving land, communities can directly control its use. Acquiring land or conservation easements off ers permanent protection for critical natural resources. The most ef-fective land conservation programs identify critical land resources and preserve those fi rst. In terms of water protection, critical land resources include forested buff ers along water bodies, drinking water recharge zones, and wetlands. Land conservation maintains water quality and can actually improve water quality if critical natural habitat is preserved (such as headwaters, buff ers, and wetlands). Conserving land also pro-vides the additional benefi ts of fl ood control, recreational uses, and the protection of historic and environmental resources. Over the years and across the nation, voters have indicated their willingness to pay for mea-sures to protect land for water quality purposes. In 2002, 75 percent (141 of 189) of parks and open space ballot measures passed in communities across America—up from 70 percent in 2001. The 141 successful measures will generate over $10 billion in 28 states, including an estimated $5.7 bil-lion specifi cally for land acquisition, preservation, and protection (Trust for Public Land and Land Trust Alliance, 2003).
Brownfields RedevelopmentBrownfi elds redevelopment is the conversion of abandoned or underused industrial or commercial properties into clean, actively used areas. This tool recognizes that cleaning up contaminated property located along wa-ter bodies and converting portions of these waterfront brownfi elds into greenways, riverfront parks, or other forms of open space can reduce the fl ow of contaminants into the water. This strategy helps to further protect waterways from the contaminated runoff that fl ows off of urban streets when it rains. Any contamination identifi ed at these sites that is cleaned up prior to redevelopment can reduce or eliminate the potential contami-nation of nearby waters. In addition, brownfi elds revitalization with com-mercial, retail, residential, or industrial uses takes development pressure off undeveloped greenfi eld areas, including sensitive watershed sites, on the fringe of local communities. Typically, this redevelopment takes place on old sites that were already covered with impervious surfaces. More-over, additional stormwater control, best management, and low impact practices can be implemented to minimize water pollution associated with the new development on brownfi eld properties. 8 – Smart Growth for Clean Water

Urban and Community ForestryLike water, trees are an excellent indicator of environmental health. As land is developed, trees are removed to make way for impervious surfaces such as homes and roads. However, trees are a cost eff ective way to reduce stormwater – exactly what is necessary with increased imperviousness. Urban and community forestry manages forests within developed areas for environmental benefi ts. Community forests function as nonstructural stormwater management facilities. In addition to slowing stormwater fl ow, trees increase soil permeability, thus facilitating groundwater re-charge. Reduced stormwater fl ow decreases the amount of pollutants that wash into waterbodies since pollutants can be absorbed naturally into the soil and vegetation. Today, there is a clear understanding of the active role trees play in improving the urban environment. Data documenting the environmental characteristics of trees are now available based on re-search from the United States Department of Agriculture Forest Service (USDA Forest Service, 2000). In addition, an analysis conducted by the organization American Forests found that the existing tree canopy in the Washington, D.C. metropolitan area has reduced the need for additional stormwater retention structures by 949 million cubic feet. Indeed, Wash-ington’s trees have saved the region $4.74 billion in gray infrastructure costs per 30-year construction cycle.
TreePeople
TreePeople in Los Angeles is working in partnership with the Center for Urban Forestry at U.C. Davis, Pacifi c Southwest Re-search Station, USDA Forest Service to study the eff ects of storm-water management at the residential scale. The study includes the use of trees and residential stormwater management tech-niques such as cisterns, retention/detention basins, swales and driveway grates and drywells. Trees work in combination with other stormwater controls to produce comprehensive solutions to rainfall interception, runoff , and landscape water use. The study has found that:
Small storms are responsible for most of the annual pollutant loading of receiving waters, and trees are most eff ective in intercepting “fi rst fl ush” rainfall dur-ing small rain events; and
A typical medium-sized tree can intercept as much as 2,380 gallons of rainfall per year.
For more information, visit www.treepeople.org.
Washington, DC’s trees have saved the region $4.74 billion in gray infrastructure costs.
Smart Growth for Clean Water – 9

Low Impact DevelopmentA relatively new approach to site design strategy, low impact develop-ment a� empts to maintain or replicate the pre-development hydrology of the site (U.S. EPA, 2002(b)). Low impact development (LID) can be accom-plished through the preservation and protection of natural site features such as stream buff ers and wetlands, or through the creation of green infrastructure, such as roo� op gardens, porous pavements, constructed wetlands, or raingarden facilities in parking lot medians. By mimicking the natural hydrology of the land, the problems associated with increased impervious surface are mitigated. By accommodating stormwater runoff on-site, the need for expensive management structures, such as detention ponds and concrete stormwater systems, is greatly reduced. LID is also more cost eff ective and, with its emphasis on natural landscaping tech-niques, can be both very beautiful and an economic premium for devel-opment projects. In addition, by using LID in new development, natural areas can be preserved and more of the site can be le� undisturbed. Low impact development techniques can also be used for infi ll and redevel-opment projects. With the redevelopment or replacement of urban infra-structure (roads, parking lots, roofs, etc.), LID techniques can be used to fi lter, treat, recharge, and reuse rain water, thereby lowering the impact of stormwater on urban waterbodies. LID’s decentralized, micro-scale techniques (rain gardens, planter boxes, etc.) can be easily integrated into redevelopment plans.
Watershed Management If we were to erase the geo-political boundaries of nations, states, coun-ties, and municipalities and instead adopt boundaries based on our physical environment, we would all know which watershed we lived in. A watershed is an area that drains into a body of water, such as a river or lake. Water quality protection and improvement is best accomplished at the watershed level rather than the individual waterbody, zoning parcel, or political boundary. Land conservation, brownfi elds redevelopment, urban and community forestry, and low impact development are tools that are applied in communities–and watersheds–around the country. Watershed management deals with water quality issues comprehensively, relies on creative problem solving and innovative solutions, and encour-ages strong citizen involvement while off ering the most cost-eff ective solutions. The watershed approach provides opportunities for all levels of government to be� er understand the cumulative impacts of human activi-ties and determine the highest priority problems within each watershed. Smart growth is founded on the principles of watershed management because it transcends geo-political boundaries and focuses growth in less sensitive areas.
While there are many other smart growth techniques and practices avail-able to local communities, the fi ve approaches outlined here are proven strategies for protecting public health and the environment, reducing costs, and improving local quality of life.
“Every parcel of land is part of a larger watershed.” First Principle of Stormwater Management, National Association of Homebuilders
10 – Smart Growth for Clean Water

Anacostia Watershed Toxic Alliance
The Anacostia Watershed Toxic Alliance (AWTA) was created to develop and implement a multi-jurisdictional urban retrofi t program to reduce toxics and improve water quality in im-paired sub-watersheds within the Anacostia Watershed using low impact development techniques. The Anacostia Watershed encompasses three governmental jurisdictions: Prince George’s County, Montgomery County, and the District of Columbia, and is governed by a multi-jurisdictional Steering Commi� ee, Tech-nical Advisory Commi� ee, and several project teams. The focus of the program is on the treatment of runoff from the following four land use types: residential, commercial, industrial, and institutional. LID retrofi t techniques apply small-scale source control practices to reduce runoff peak discharge, volume, and frequency and signifi cantly improve the water quality of the re-ceiving streams. LID designs include a wide range of techniques to retain, detain, fi lter, and eliminate pollutants and can easily be integrated into the urban landscape to address critical water-shed issues.
For more information, visit h� p://response.restoration.noaa.gov/cpr/
watershed/anacostia/start.html.
Prince George’s County Innovation
In an a� empt to deal with the challenges of stormwater manage-ment, the Prince George’s County, Maryland, Department of En-vironmental Resources began to develop alternative stormwater management practices in 1990. Their research led to the develop-ment of bioretention or “rain gardens” — the use of green space to manage runoff . This began their intense examination of low impact development. In 1999, Prince George’s County and the EPA published the nation’s fi rst LID manual.
For more information, contact Larry Coff man, Associate Director, Prince George’s County, Department of Environmental Resources,
Phone: (301) 883-5839, or visit www.co.pg.md.us or www.epa.gov/owow/nps/lid/lidnatl.pdf for a copy of the manual.
Smart Growth for Clean Water – 11

Prof
iles Profiles
Profiles of Smart Growth for Clean Water Innovation
Communities across America are demonstrating the value of smart growth for clean water approaches. This section of the report profi les
the innovation of several local partnerships that are pu� ing land conser-vation, brownfi elds revitalization, urban and community forestry, low impact development, and watershed management to use for clean water goals. While these initiatives are diverse, they all share certain key quali-ties: they seek to fulfi ll regulatory requirements and meet community ob-jectives simultaneously; they build on the strength of multi-stakeholder collaboration to reach multi-media environmental goals; they make use of available tools and resources, yet forge ahead with innovative new ap-proaches; and they seek to a� ain long-term solutions with actions that also produce short-term community benefi ts.
INCLUDED ARE THE FOLLOWING CASE STUDIES:
« The Calumet Initiative
« Charlo� e/Mecklenburg Surface Water Improvement and Management Initiative
« Cherry Creek Smart Growth for Clean Water Partnership
Faye� eville Urban and Community Forestry
« State of Iowa Clean Water Revolving Fund
« Merrimack Watershed Open Space and Water Resources Protection
State of Massachuse� s Community Preservation Initiative
New Bedford Waterfront Brownfi elds and Economic Revitalization
San Diego Creek Watershed and Natural Treatment System
Suff olk County Land and Water Resource Protection
United States Army Corps of Engineers Waterfront Preservation and Revitalization
12 – Smart Growth for Clean Water« These fi ve National Demonstration Projects received in-depth technical assistance from NALGEP, TPL, and/or ERG.

Prof
iles Profiles
Forest Service and Cook County Collaboration
Staff from the USDA Forest Service North Central Research Sta-tion have a longstanding partnership with Cook County to help guide and inform management decisions on all Forest Preserves throughout the County. The 68,000 acres of the Forest Preserve District of Cook County (District) tend to be concentrated near water resources. Research has guided the District in estimat-ing public use of its areas; identifying public perceptions of and preferences for forest preserve environments; restoring forest, prairie, and wetland ecosystems; responding to exotic invasive species; and managing areas along the Chicago River and in the Calumet Region. Forest Service researchers continue to work with the District and other partners on the management of important riparian areas in the Chicago Metropolitan Area and beyond.
For more information, contact Lynne Westphal, Research Social Scientist, USDA Forest Service
North Central Research Station at (847) 866-9311x11 or visit www.ncrs.fs.fed.us/contact/profi le/?id=234.
The Calumet InitiativeThe 20-square mile Calumet area on Chicago’s southeast side is the focus of a new initiative centered on rehabilitating both the region’s economy and ecology through innovative, smart growth projects. The Calumet area was once one of the largest wetland complexes in lower North Amer-ica, teeming with native fl ora and fauna. However, due to its strategic geographic location along the Calumet River and adjacent to Lake Michi-gan, the Calumet area a� racted major development and more than 120 years of heavy industrial activity. As a result, Calumet has thousands of acres of contaminated brownfi elds in need of cleanup, interspersed with thousands of acres of open space that provide critical habitat for a range of species, including state-endangered and state-threatened birds.
In 2000, Chicago Mayor Richard Daley and former Governor George H. Ryan announced the “Calumet Initiative” to revitalize the Calumet area both economically and ecologically. A long list of partners, including the Illinois Department of Natural Resources (DNR), the U.S. Forest Service, the U.S. Environmental Protection Agency, the U.S. Fish and Wildlife Ser-vice, the Illinois Environmental Protection Agency, and 15 other govern-ment partners have been working collaboratively with residents and local environmental groups to implement a vision of a revitalized Calumet. The Calumet Initiative will utilize a variety of smart growth approaches through brownfi elds revitalization, wetlands and land preservation,
Smart Growth for Clean Water – 13

Prof
iles Profiles
urban forestry and phytoremediation, renewable energy, and low impact development. Chicago seeks to make Calumet a national model of ecolog-ical innovation. As stated by Mayor Daley, the Calumet project recognizes that “good environmental management is good for business, and good industrial development is good for the environment.”
The initiative targets 3,000 acres for brownfi elds redevelopment with sustainable technologies and industry. This redevelopment will include the construction of a new Ford Motor Company supplier park that will utilize low impact development innovations to improve energy effi ciency and drastically reduce stormwater runoff into adjacent waters like Indian Creek. Chicago has also created the Calumet Tax Increment Financing District to provide incentives for industry to locate in Calumet’s brown-fi elds.
Calumet’s sustainable brownfi elds redevelopment will be linked with natural ecosystem rehabilitation and preservation through the creation of a 4,800 acre Calumet Open Space Reserve. This area of wetlands, creeks, and uplands already plays host to 700 plant species and 200 bird species. The Chicago Department of Environment DNR, Chicago’s Environmental Fund and the U.S. Forest Service have established a “Calumet Area Eco-logical Management Strategy” as the framework and guidance for land managers to rehabilitate their respective parcels within the Open Space Reserve. This strategy is the result of extensive collaboration among a range of government agencies, local museums, residents, and environ-mental groups. The plan calls for looking at the watershed as a whole, with an eye toward preserving critical habitat, improving the ecology, establishing public recreational corridors, and creating new ecosystems appropriate for the area.
Coupled with the ecological management strategy is a land acquisition and preservation strategy for the Calumet Open Space Reserve. Chicago, the DNR, and many other partners have targeted millions of dollars to the permanent preservation of Calumet marshes and waterfront areas, with DNR, the Chicago Park District and the Forest Preserve District of Cook County slated as potential long-term stewards. The U.S. Department of Agriculture Forest Service is building on its long-term involvement in natural resources management in the greater Chicago area, with its work on the Calumet Open Space Reserve. Work at the Calumet site is focused on ecological restoration of the area, including a project to use tree plant-ing and urban forestry to help remediate contaminated soils and water in the Calumet area. The Forest Service is also working with Chicago and area industries to transform the degraded, channelized Indian Creek into a more natural, meandering stream that can support aquatic insects and fi sh.
To help interpret and celebrate the uniquely linked natural and indus-trial history of the Calumet region for visitors, schoolchildren, and other citizens, the Calumet Initiative will build a new Calumet Environmental
14 – Smart Growth for Clean Water

Prof
iles Profiles
Center within the Open Space Reserve. The City of Chicago has already commi� ed $1.5 million toward constructing a state-of-the-art, energy-ef-fi cient facility, and Ford Motor Company has also dedicated $6 million to help build and provide programming. Chicago’s Environmental Fund and the Illinois Institute of Technology are cosponsoring an international architectural design competition to solicit an environmentally friendly building design that will be one of the only buildings in the nation to achieve platinum status under the Leadership in Energy and Environ-mental Design (LEED) criteria established by the Green Building Coun-cil.
The Calumet Initiative seeks to strike a sustainable balance between the Calumet area’s economy and environment – to provide jobs, reinvigorate neighborhoods, and nurture Calumet’s remaining natural areas and wa-ter quality.
For more information, contact N. Marcia Jimenez, Commissioner, Chicago Department of Environment at (312) 774-7609 or visit www.ci.chi.il.us/environment.
Smart Growth for Clean Water – 15
Prof
iles Profiles
Charlotte and Mecklenburg County, North Carolina—SWIM Initiative to Protect Creeks and Mountain Island LakeMecklenburg County and the City of Charlo� e, North Carolina have partnered with other local governments in the region to acquire over 4,400 acres in the Mountain Island Lake watershed, permanently protect-ing 53 percent of Mountain Island Lake’s shoreline and 18 percent of its creekbanks from the impacts of development in one of the fastest growing communities in America. With a goal of ensuring that all Mecklenburg County surface waters are “suitable for prolonged human contact and recreational opportunities and supportive of varied species of aquatic life,” this strategy is based on an innovative “Surface Water Improvement and Management” (SWIM) plan that combines land conservation, tree buff ers, water quality monitoring, GIS mapping, and inter-jurisdictional collaboration.
Under SWIM, the Charlo� e-Mecklenburg Offi ce of Water & Land Resourc-es has established a Creek Coordination Commi� ee with representatives from Charlo� e/Mecklenburg Utilities, Charlo� e/Mecklenburg Parks & Recreation, Charlo� e/Mecklenburg Stormwater Services, the Charlo� e/Mecklenburg Planning Commission, Mecklenburg County Water & Land Resources, and other local, state, and federal stakeholders. This collabora-tive body was instrumental in the adoption of a county-wide stream buf-fer system and the implementation of a number of streamside forestry and ecosystem restoration projects.
The SWIM coalition recently led an eff ort to adopt an innovative water quality protection tool for the Town of Huntersville, north of Charlo� e. Under this new approach, all development projects must use a “Site Eval-uation Tool” (SET) that assesses pre-development and post-development runoff , infi ltration, and pollutant loading rates. Using the SET analysis, development projects must incorporate low impact development and non-structural water protection methods, including land use controls and vegetated buff ers. This new ordinance is expected to modify land devel-opment practices and promote smart growth approaches in Mecklenburg County, including the identifi cation and protection of environmentally sensitive properties; the establishment and expansion of greenway pro-grams; the enhancement of existing riparian buff ers and conservation areas; and the identifi cation of stream reaches in need of retrofi � ing with best management practices, such as constructed wetlands, urban and community forestry, or other low impact development tools. This initia-tive will also incorporate water quality monitoring data into a long-term system for measuring and verifying the actual water quality benefi ts of applied smart growth practices.
Another key component of the SWIM water protection strategy is the tar-geted conservation of streamside and lakeside properties. Mecklenburg
16 – Smart Growth for Clean Water

Prof
iles Profiles
County has partnered with groups like the Trust for Public Land and the Catawba River Conservancy to establish GIS maps that identify stream segments and drinking water resources most in danger of degradation, based on hydrologic data and projected development and impervious surface pa� erns. According to Owen Furuseth, Chair of the Department of Geography and Earth Sciences at the University of North Carolina, Charlo� e and the director of the land/water modeling project, “With this information in hand, local governments can steer development away from areas with the greater water quality risk, and conservation groups can focus on the most environmentally sensitive lands for conservation.”
Using these tools, Mecklenburg County and local municipal governments have been able to permanently preserve thousands of acres of land along Mecklenburg’s creek system, for a total of 2,700 acres in the Mountain Is-land Lake watershed (not including lands conserved in neighboring Lin-coln and Easton Counties, also in the watershed), and put 53 percent of Mountain Island Lake’s shoreline into public control. These smart growth for clean water approaches are becoming more important in the Mecklen-burg County area. In November 2001, Mecklenburg, York, and Lancaster Counties signed a “Memorandum of Understanding” pledging their in-tent to work together to restore the Sugar Creek watershed, a drinking water source for York County, balancing the economic needs of this fast-growing area south of Charlo� e with protection of the local water supply. This collaborative statement details several steps to preserve the quality of local waters, including the development of a 50-year watershed protec-tion strategy; the acquisition and preservation of remaining undeveloped lands within the historic fl oodplain of Sugar Creek and its tributaries; restoration of upstream portions of creeks through the establishment of streamside buff ers; and the development of joint funding, outreach, and regional stewardship programs to connect land use and clean water.
For more information, contact Rusty Rozelle, Mecklenberg County, Department of Environmental Protection at (704) 336-5500 or visit www.co.mecklenburg.nc.us.
“Trees are our signature”
The Charlo� e Metropolitan Area is among the top ten fastest growing metropolitan areas in the coun-try. Mecklenburg County has seen a 72 percent growth in population since 1980 (U.S. Census Bureau). American Forests conducted an analysis of 17 years of changing landcover in Mecklenburg County, North Carolina. With a boom in population, tree cover is threatened. In Charlo� e, the study found that between 1984 and 2001 the county saw a 127 percent increase in impervious surfaces (streets, buildings, parking lots, etc.) and a 22 percent loss of tree cover and open space. The loss of these trees could cost approximately $1.87 billion in additional infrastructure to handle stormwater runoff . “This analysis points out that we need a regional tree canopy policy that deals with sprawl and works across political boundaries,” said Charlo� e Mayor Patrick McCrory on March 19, 2003. “The policy should set specifi c and measurable goals for canopy. Trees are our signature in the Charlo� e region and we should be a role model for the nation.”
For more information, see Urban Ecosystem Analysis Mecklenburg County, North Carolina, March 2003, American Forests at www.americanforests.org/resources/rea.

Prof
iles Profiles
The Cherry Creek Smart Growth for Clean Water Partnership The Cherry Creek has its headwaters 50 miles south of the City and County of Denver in El Paso County, Colorado. The Creek fl ows through four counties, including Douglas County, the fastest growing county in the United States. This watershed includes the Cherry Creek State Park, a highly valued natural and recreational resource mainly due to the pres-ence of the Cherry Creek Reservoir. Because of its proximity to Denver, Cherry Creek State Park is the most heavily visited state park in Colorado. However, the Cherry Creek Reservoir is overloaded with nutrients, in-cluding phosphorus, caused in part by land disturbance and increased runoff from the rapid growth in the southern end of the watershed. In 2001, the State of Colorado enacted a “Cherry Creek Reservoir Control Regulation,” requiring a Total Maximum Annual Load plan to reduce the runoff of phosphorus into the reservoir, thus creating a framework for lo-cal governments and citizens to formally address water quality.
The Cherry Creek Stewardship Partners, a broad coalition of municipal and county governments, developers, environmental and community organizations, and state and federal government offi cials, began in 2001 to cra� a plan to promote smart growth approaches to meeting the phos-phorus and other nutrient challenges in the Cherry Creek watershed. This “Cherry Creek Smart Growth for Clean Water Partnership” is promoting the establishment of a continuous natural greenway and innovative wa-tershed enhancements to protect the water quality and the public enjoy-ment of Cherry Creek and its tributaries.
A key resource for the coalition was the “Cherry Creek Greenprint,” a project led by the Trust for Public Land. The purpose of the Greenprint is to guide the creation of an interconnected open space system aimed at protecting key riparian, upland, and aquatic zones, as well as create a vision for the future of parks and open space in the context of continued growth and development. The Greenprint provides a comprehensive inventory of existing conditions, developed with GIS mapping, includ-ing data on vegetation and riparian areas, water resources, visual and scenic resources, existing, and future land use, and wildlife habitat. The Greenprint also includes an in-depth analysis of water quality, includ-ing historic, existing and future predictions of stormwater runoff and phosphorous conditions based on historic, existing and future land use. By doing so, the Cherry Creek Greenprint helped establish a quantifi able benefi t of land conservation with respect to water quality improvements. Eff orts are now underway to purchase land and conservation easements that serve multiple benefi ts, including parks, open space, habitat protec-tion, and water quality improvements.
Another key element of the Cherry Creek Smart Growth for Clean Water partnership is to promote the use of innovative streamside, watershed,
18 – Smart Growth for Clean Water

Prof
iles Profiles
and development enhancements along the Cherry Creek and its tribu-taries. These include the use of constructed wetlands instead of typical brick and mortar pollution removal facilities, low impact development techniques that exceed current best management practice standards, green infrastructure buff ers, and other practices to mitigate the impacts of development and reduce stormwater runoff and phosphorus pollution. Results from this component of the Cherry Creek initiative include the design and implementation of low impact development projects at several new, mixed-use development projects in the Cherry Creek watershed, and a report identifying the economic and environmental benefi ts achieved at local development projects that utilized green infrastructure approaches. This has led to the funding of a “Cherry Creek Phosphorus Ombuds-man,” which will be a single person or team of local engineers and water quality experts that will both serve as a resource to local developers to help them understand the benefi ts of low impact development prac-tices and as an advocate for the adoption of these practices to local governments and development review agencies.
The Cherry Creek coalition has also developed a comprehensive funding strategy that seeks to utilize a variety of federal, state, local, and nonprofi t resources to fund the land conservation and green infrastructure goals of the initiative. The coalition has creat-ed a funding matrix that assesses and ranks the most promising funding sources based on criteria including the eligible uses of these resources, typical size of funding awards, the likelihood of obtain-ing these funds in the competitive solicitation process, and the level of matching and regulatory requirements tied to these funding sources.
The Cherry Creek strategy calls for the establishment of an intergovern-mental “Cherry Creek Regional Agreement” to legitimize the recommen-dations for innovative enhancements, land preservation, and green infra-structure. Through this agreement, county and municipal governments, regional entities, and state and non-profi t partners will agree on the smart growth concepts for the Cherry Creek watershed and make commitments including: establishing incentives for land conservation and best devel-opment practices; conducting education and outreach campaigns on the water quality benefi ts of smart growth; establishing joint funding strate-gies; enacting agreements on inter-jurisdictional integration of land use and water quality programs; and providing commitments of fi nancial
A Few Key Findings of the Cherry Creek Stewardship Partners
There is a competitive advantage to Smart Growth practices: Smart Growth “pays its way.”
There are environmental benefi ts to utilizing smart growth strategies.
Local and regional land use planning entities will require educational opportunities to feel comfortable applying smart growth practices applicable to the watershed.
There is a need to provide assistance to developers and land use agencies in the watershed.
Citizen participation is a key component in maximizing op-portunities for watershed enhancements.
Smart Growth for Clean Water – 19
Prof
iles Profiles
and staff resources. The Cherry Creek coalition has hired a facilitator to cra� and gain consensus on the intergovernmental agreement, which the coalition expects to adopt in 2003.
The Cherry Creek Smart Growth for Clean Water Partnership has already led to substantial results. In addition to the successes listed above, the foundation has been established for a lasting, cross-jurisdictional part-nership that will integrate land use and water protection strategies and potentially lead to the widespread public acceptance of low impact de-velopment and green infrastructure practices as standard practice in this fast-growing region.
For more information, contact Chris Rowe of the Cherry Creek Stewardship Partners, at (303) 291-7437, or visit www.cherry-creek.org.
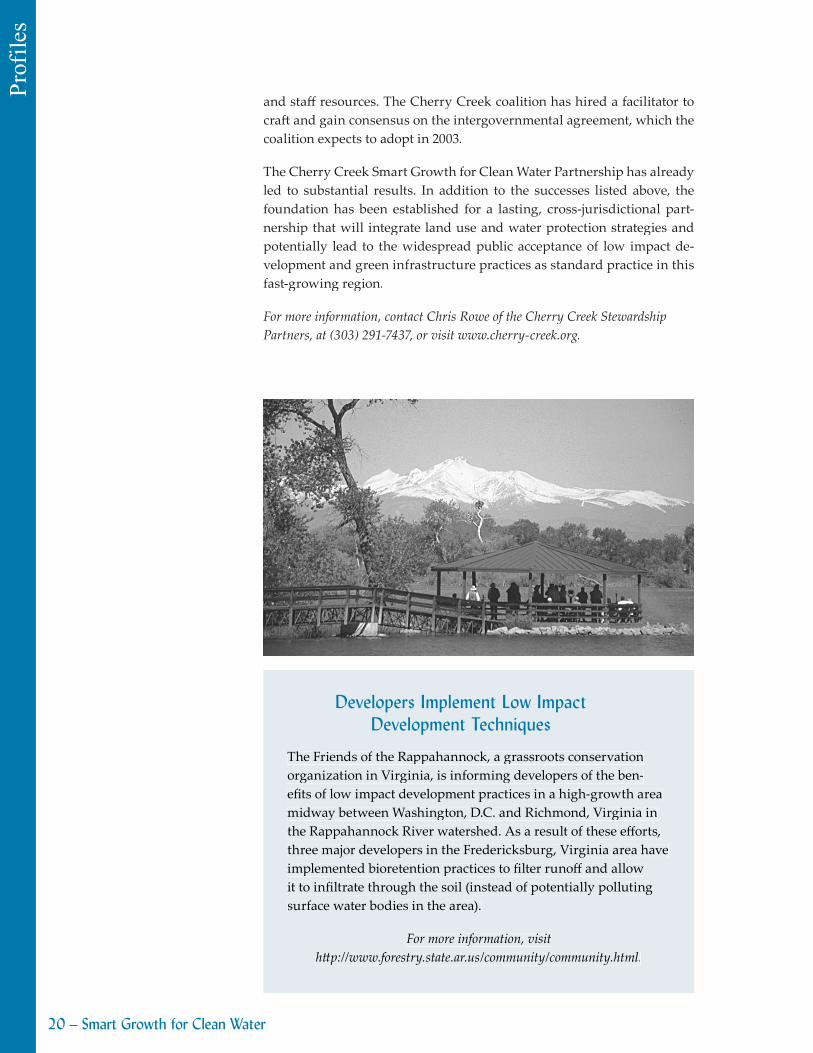
Developers Implement Low Impact Development Techniques
The Friends of the Rappahannock, a grassroots conservation organization in Virginia, is informing developers of the ben-efi ts of low impact development practices in a high-growth area midway between Washington, D.C. and Richmond, Virginia in the Rappahannock River watershed. As a result of these eff orts, three major developers in the Fredericksburg, Virginia area have implemented bioretention practices to fi lter runoff and allow it to infi ltrate through the soil (instead of potentially polluting surface water bodies in the area).
For more information, visit h� p://www.forestry.state.ar.us/community/community.html.
20 – Smart Growth for Clean Water

Prof
iles Profiles
Fayetteville, Arkansas—Urban and Community Forestry Avoids Gray Infrastructure CostsA number of communities across the nation are partnering with groups like American Forests to identify how the “green infrastructure” of trees can help reduce stormwater runoff and nonpoint source pollution, protect the quality of surface and groundwater, save localities millions of dollars in gray infrastructure costs, and meet the regulatory mandates of storm-water and TMDL rules. One such community is the fast-growing City of Faye� eville, Arkansas, where American Forests recently released a study demonstrating the environmental and economic benefi ts of maintaining – and increasing – local tree cover. See www.americanforests.org.See www.americanforests.org.See www.americanforests.org
As explained by American Forests, more trees means less stormwater run-off . Trees slow stormwater fl ow, reducing the volume of water in urban ar-eas and decreasing the amount of runoff that containment facilities must store. Trees intercept rainwater on leaves, branches, and trunks, reducing the volume of runoff and slowing its movement into channelized drain-age areas. Without tree roots, water-saturated ground becomes unstable, causing devastating fl oods and landslides. Even in light rain, trees in-crease soil permeability, enabling rain to be soaked properly into the soil.
In Faye� eville, rapid growth and development has led to an 18 percent de-cline of heavy tree canopy in the last 15 years. American Forests recently conducted an “Urban Ecosystems Analysis” using satellite and aerial imagery, Geographic Information System technology, scientifi c research, and the organization’s CITYgreen® computer so� ware to calculate the benefi ts trees provide to Faye� eville’s urban environment. The fi ndings show that the City of Faye� eville’s existing tree cover currently reduces stormwater runoff by 50 million cubic feet during a storm event. The study also noted that, if the tree canopy in Faye� eville were increased from 27 to 40 percent, the environmental benefi ts would be signifi cant and the cost-saving benefi ts of stormwater reduction alone would be $135 million.
Tree planting is a smart growth strategy that can be undertaken by local communities in nearly every situation, whether it be through the creation of a park or waterfront recreational area or the use of tree cover in de-velopment projects to reduce environmental impact and infrastructure costs. Moreover, tree cover provides other community benefi ts, includ-ing cleaner air, energy savings, and improvements to local quality of life. For the stormwater reduction and water quality benefi ts alone, trees are a smart growth tool worth planting in every locality.
For more information, contact Pa� i Erwin, Arkansas Forestry Commission, Phone: (479) 442-8627, h� p://www.forestry.state.ar.us/community/community.html.
Smart Growth for Clean Water – 21
Prof
iles Profiles
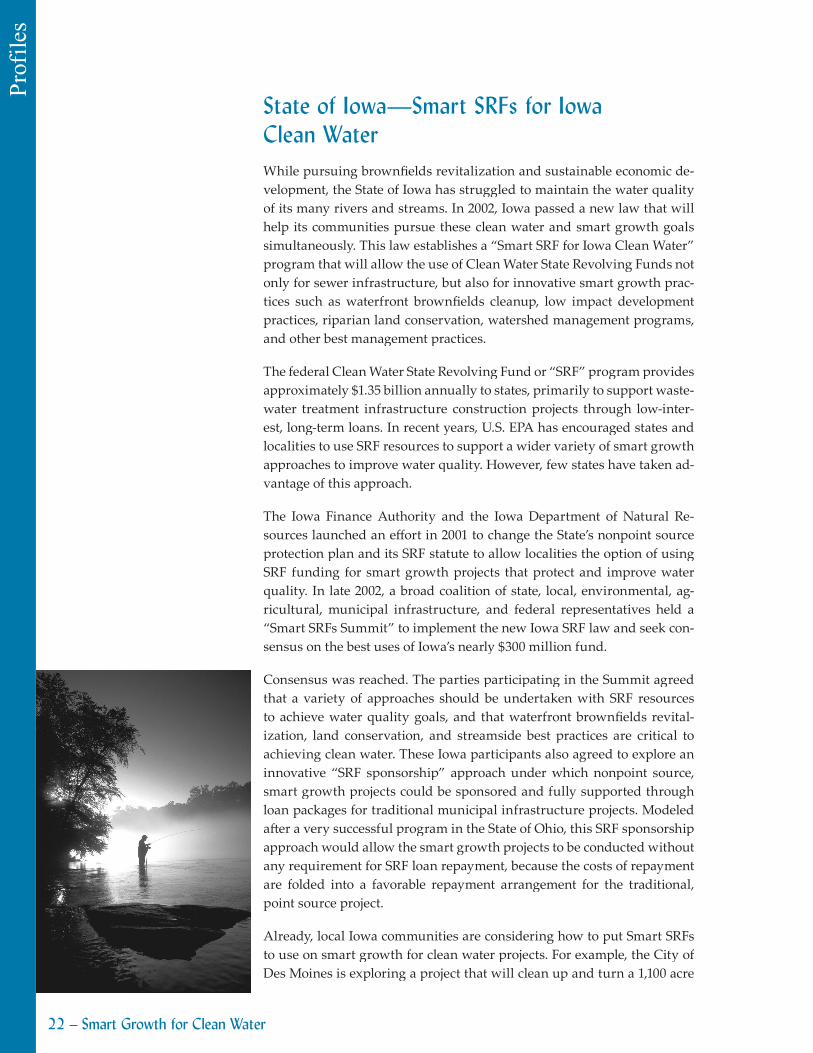
State of Iowa—Smart SRFs for Iowa Clean WaterWhile pursuing brownfi elds revitalization and sustainable economic de-velopment, the State of Iowa has struggled to maintain the water quality of its many rivers and streams. In 2002, Iowa passed a new law that will help its communities pursue these clean water and smart growth goals simultaneously. This law establishes a “Smart SRF for Iowa Clean Water” program that will allow the use of Clean Water State Revolving Funds not only for sewer infrastructure, but also for innovative smart growth prac-tices such as waterfront brownfi elds cleanup, low impact development practices, riparian land conservation, watershed management programs, and other best management practices.
The federal Clean Water State Revolving Fund or “SRF” program provides approximately $1.35 billion annually to states, primarily to support waste-water treatment infrastructure construction projects through low-inter-est, long-term loans. In recent years, U.S. EPA has encouraged states and localities to use SRF resources to support a wider variety of smart growth approaches to improve water quality. However, few states have taken ad-vantage of this approach.
The Iowa Finance Authority and the Iowa Department of Natural Re-sources launched an eff ort in 2001 to change the State’s nonpoint source protection plan and its SRF statute to allow localities the option of using SRF funding for smart growth projects that protect and improve water quality. In late 2002, a broad coalition of state, local, environmental, ag-ricultural, municipal infrastructure, and federal representatives held a “Smart SRFs Summit” to implement the new Iowa SRF law and seek con-sensus on the best uses of Iowa’s nearly $300 million fund.
Consensus was reached. The parties participating in the Summit agreed that a variety of approaches should be undertaken with SRF resources to achieve water quality goals, and that waterfront brownfi elds revital-ization, land conservation, and streamside best practices are critical to achieving clean water. These Iowa participants also agreed to explore an innovative “SRF sponsorship” approach under which nonpoint source, smart growth projects could be sponsored and fully supported through loan packages for traditional municipal infrastructure projects. Modeled a� er a very successful program in the State of Ohio, this SRF sponsorship approach would allow the smart growth projects to be conducted without any requirement for SRF loan repayment, because the costs of repayment are folded into a favorable repayment arrangement for the traditional, point source project.
Already, local Iowa communities are considering how to put Smart SRFs to use on smart growth for clean water projects. For example, the City of Des Moines is exploring a project that will clean up and turn a 1,100 acre
22 – Smart Growth for Clean Water

Prof
iles Profiles
brownfi eld along the Des Moines River into an “Agrimergent Technology Park.” The Agrimergent Technology Park project seeks to include the in-novative use of constructed wetlands and urban forestry for the control of urban runoff and the enhancement of the industrial park’s environmental quality.
For more information, contact Michael Tramontina, Executive Director, Iowa Finance Authority at (800) 432-7230 or visit www.ifahome.com.
Innovative Uses of State Revolving FundsBelow are a few illustrative examples of innovative uses of
Clean Water State Revolving Fund programs:
The New Jersey State Revolving Fund provides low interest loans for land acquisition projects for water quality protection. To qualify, the land parcels must demonstrate water quality benefi ts. One-half of the loan has a 0% interest rate from the New Jersey Department of Environmental Protection (NJDEP), and the other half has a market rate from the New Jersey Infrastructure Trust, resulting in a half market rate Clean Water SRF loan. These Clean Water SRF loans are coordinated with the NJDEP Green Acres Pro-gram, which provides funds to help preserve land and develop parks.
For more information, visit www.njeit.org/index2.html.
The Ohio Environmental Protection Agency funds both point and nonpoint source projects through the Water Resource Restoration Sponsor Program (WRRSP), which is fi nanced through the Water Pollution Control Loan Fund (Ohio’s Clean Water State Revolving Fund program). When a community applies for a Clean Water SRF loan for a point source control project, the community can request assistance for a nonpoint source project through the WRRSP program. The Ohio EPA will reduce the interest rate on the total amount of the loan. For example, under the WRRSP, the City of Massillon, Ohio received a low-interest loan of over $6.7 million, a portion of which is dedicated to water resource restoration projects, including the purchase and preservation of high quality wetland bogs, riparian and forested habitat, restoration of agricultural lands and 30 miles of river, and the development of a free-fl owing stream to bypass a dam to help fulfi ll state Total Maximum Daily Load requirements.
For more information, visit � p://www.epa.state.oh.us/pub/defa/WRRSP_Fact_sheet.pdf.
Funding from California’s Clean Water State Revolving Fund helped the Nature Conservancy of California purchase a 12,362 acre or 19.3 square mile portion of the Howard Ranch in southeast Sacra-mento County, the largest land conservation acquisition in the history of the Sacramento region. The Conservancy’s Howard Ranch land conservation project is the largest land acquisition ever funded in the United States under the federal Clean Water Act’s State Revolving Fund. The California State Water Resources Control Board (SWRCB) and U. S. Environmental Protection Agency collaborated on provid-ing an $8 million low-interest loan to the Conservancy to complete the $13.6 million fundraising target. The signifi cance of this arrangement was highlighted by Walt Pe� it, Executive Director of the SWRCB, “While state revolving funds have been used in the past to acquire property on which to construct stormwater treatment facilities, this is the fi rst time an SRF loan has been issued specifi cally to purchase property in order to preserve wetlands, which include vernal pools, and riparian habitat.”
For more information, visit www.tnccalifornia.org/news/pr_04.asp.
Smart Growth for Clean Water – 23

Prof
iles Profiles
Merrimack River Watershed, Massachusetts—GIS Mapping Links Open Space and Water Resource ProtectionIn the Merrimack River Watershed, a fast-growing area north of Boston, four localities are using Geographic Information System maps to help them identify and preserve open space lands where streams and produc-tive aquifers are threatened by sprawling growth. The towns of Westford, Li� leton, Chelmsford, and Boxborough, which share common aquifers for their drinking water, are working with the Massachuse� s Executive Of-fi ce of Environmental Aff airs, the Trust for Public Land, and ERG to use GIS tools to preserve those lands critical to the future of their precious water resources. This approach promises to shape the direction of growth in order to preserve both drinking water and local quality of life.
These GIS maps will help enhance local resource planning eff orts, includ-ing comprehensive “Community Development Plans.” These plans, part of a Commonwealth-wide eff ort known as the Community Preservation Initiative, help local offi cials balance economic progress with preserving the quality of life in their communities. The plans incorporate environ-mental planning issues, such as habitat and watershed protection, with economic development, housing, and transportation issues as they relate to the challenges of growth management. Massachuse� s is providing $30,000 in services in partnership with local consultants to any interested locality to create Community Development Plan, and is encouraging all 351 municipalities in the Commonwealth to participate. So far, about 250 communities have signed up to prepare plans.
The GIS mapping project focuses on the four municipalities in the 51-square mile Stony Brook subwatershed of the Merrimack River, located along Route 495 about 25 miles northwest of Boston. This is one of the most rapidly growing areas of the Commonwealth. These communi-ties range in size from 8,000 to 33,000 people, and all four share a rural, small-town character that is being threatened by rapid growth along major highway corridors. Top issues of concern for these towns include drinking water quality and quantity, rapid development (residential and commercial), increasing levels of impervious cover, and the protection of remaining open space lands.
ERG and the Massachuse� s Executive Offi ce of Environmental Aff airs developed detailed GIS maps for each of the towns that highlighted un-protected open space lands abu� ing surface waters, and overlayed high- and medium-yield aquifers, which are important current or potential drinking water sources. These GIS maps identify those lands that might best serve as buff er zones to protect water resources. The maps can be integrated with impervious surface and stormwater runoff data in these localities to help determine the ecological carrying capacity of these com-munities and this subwatershed area. This information can be used to
24 – Smart Growth for Clean Water

Prof
iles Profiles
identify the ability of the water resources to support various build-out scenarios, land preservation strategies, allowable land uses and densities, and other important smart growth approaches.
Using these tools, the Trust for Public Land is now helping the municipali-ties identify specifi c properties for conservation and create lasting open space buff er areas adjacent to key water resources. Funding for such land preservation can be pursued through the Massachuse� s Community Preservation Act, which authorizes communities to approve a referen-dum allowing them to levy a community-wide property tax surcharge of up to 3 percent for the purpose of creating a local Community Pres-ervation Fund. Those communities that create a Community Preserva-tion Fund can get those resources matched dollar-for-dollar from the Commonwealth. Funds can be used to acquire and protect open space, preserve historic buildings and landscapes, and create and maintain af-fordable housing.
For more information, contact Robert O’Connor, Massachuse� s Executive Offi ce of Environmental Aff airs, at (617) 626-1170.
Smart Growth for Clean Water – 25

Prof
iles Profiles
The Massachusetts Community Preservation InitiativeMassachuse� s is known around the world for its pedestrian-friendly cities, a� ractive historic downtowns, and quaint New England villages. These vital community centers are characterized by dense se� lement, narrow streets, public parks, and mixed uses that allow citizens to live within easy strolling distance of shops, restaurants, commercial services, and places of work. These communities have typically blended well with a healthy, natural environment and have provided a high quality of life.
However, recent growth trends in Massachuse� s have ignored this vil-lage center concept and spread development diff usely across Massachu-se� s’ landscape. From 1950 to 1990, the Commonwealth’s population grew by 28 percent while the amount of developed land grew by 188 percent. Recognizing the importance of protecting the unique character of Massa-chuse� s as the Commonwealth continues to evolve, the Executive Offi ce of Environmental Aff airs (EOEA) launched the Community Preserva-tion Initiative in January 1999. Community Preservation is dedicated to providing tools and programs to help local leaders and residents make informed decisions about growth and development.
Community Preservation is an organizing principle focused on pre-serving and enhancing the quality of life in Massachuse� s, community by community, watershed by watershed. The Initiative provides tools, technical assistance, and outreach to local decision-makers to help them make informed decisions about future growth. Community Preservation focuses on land and watershed protection, aff ordable housing, historic preservation, economic development, and transportation. Community Preservation seeks to balance these interests while encouraging commu-nities to preserve their unique characteristics and quality of life as they continue to develop.
Community Preservation is also about forming partnerships on the local and state level and involving them in the planning process. Com-prehensive planning involves a variety of issues and a diversity of in-terests and people. At the state level, Environmental Aff airs partnered with the Department of Housing and Community Development, the Department of Economic Development, and the Executive Offi ce of Transportation and Construction to spread the Community Preserva-tion approach. This innovative, interagency partnership is crucial since environmental, housing, transportation, and economic development are inextricably linked, and balanced thinking in local decision-making is essential. Community Preservation promotes bringing individual areas of interest into the same forum for decision-making. A crucial partner-ship has been with the Massachuse� s Watershed Initiative. The active involvement of EOEA’s Watershed Team Leaders was an important part
26 – Smart Growth for Clean Water

Prof
iles Profiles
of buildout project since Team Leaders are invested in the communities within their watershed.
Through the Community Preservation Initiative, the Executive Offi ce of Environmental Aff airs is providing communities with a set of inte-grated tools and programs to help plan for their future: buildout maps and analyses; professional planning assistance through programs such as UrbanRiver Visions and so� ware tools such as the Fiscal Impact Tool and Alternative Futures Tool; planning assistance to complete and imple-ment Community Development Plans; information about the Community Preservation Act; and coursework in planning and growth through the Community Preservation Institute, including its newest program for high school students called Community Preservation: YouthVisions. Informa-tion on all of these programs and tools can be found on the Community Preservation website at h� p://commpres.env.state.ma.us.
On the local level, Community Preservation is about maintaining the quality of life in Massachuse� s’ municipalities by empowering cities and towns to preserve what is important to their individual character. And because no community exists in isolation, the Community Preservation approach encourages cities and towns to look beyond their municipal bor-ders—to an intercommunity level—to plan for growth while preserving a region’s most important assets.
The Community Preservation Initiative works to provide constituents with an understanding of the Community Preservation Act (CPA). The Community Preservation website provides outreach materials and staff is available to make PowerPoint presentation to interested communities to help them be� er understand the mechanics of the Act. The Community Preservation Act is enabling legislation designed to help communities plan ahead for sustainable growth and raise funds to achieve their goals. CPA allows towns and cities to approve a referendum to levy a com-munity-wide property tax surcharge of up to 3 percent for the purpose of creating a local Community Preservation Fund and qualify for state matching funds. (For example, a CPA surcharge of 1 percent on a real property tax bill of $1,000 would be $10, or 1 percent of $1,000, per year. The surcharge can be in any increment up to 3 percent.) The Fund must be used to acquire, create, and preserve open space, acquire and preserve historic resources, create, support, and preserve aff ordable housing, and acquire, create, and preserve land for recreational use. The state will pro-vide matching funds to communities approving a local CPA surcharge.
To date, 59 communities have adopted the Community Preservation Act. In its inaugural year (FY 02), receipts from the local surcharge generated a total of nearly $18 million in local funding for aff ordable housing, open space, and historic preservation initiatives. The state awarded another $18 million in grants to match the funds raised locally. Even though it generally takes close to a year before communities are in a position to appropriate CPA monies (e.g., place the surcharge on the tax bill, collect
Smart Growth for Clean Water – 27

Prof
iles Profiles
revenue, and develop and approve a spending plan), an impressive array of local initiatives has been funded with CPA dollars. Projects underway include nearly 1,000 acres of open space acquisitions, over $4 million for historic preservation projects, and approximately 100 units of new aff ord-able housing, either completed or in the pipeline. The CPA appropriations have been further leveraged with more than $1.2 million in private fund-ing and more than $6 million in other state matching grants.
For more information, visit h� p://commpres.env.state.ma.us/index.asp.
28 – Smart Growth for Clean Water

Prof
iles Profiles
New Bedford, Massachusetts—Waterfront Brownfields and Economic RevitalizationNew Bedford is a coastal port city with a rich history of whaling, fi sh-ing, and manufacturing. To address the major decline in these industries over the past decades and the brownfi elds le� behind, New Bedford is revitalizing its waterfront and port areas into new tourism, recreational, multi-modal transportation, and marine industrial facilities. Moreover, the community is undertaking major ecological restoration projects to address the unfortunate legacy of pollution associated with the City’s 30 brownfi eld sites. As a U.S. EPA Brownfi elds Showcase Community, and a partner with a variety of federal, state, and non-profi t agencies, New Bedford is sailing toward success.
Several projects are underway in New Bedford’s waterfront area to ad-dress past contamination. In November, 2002, U.S. EPA provided New Bedford $6.5 million in Superfund money for the cleanup of a section of New Bedford Harbor. The New Bedford Harbor Trustee Council, charged with conducting eff orts to restore natural resources in the Harbor harmed by PCB contamination, has approved funding for nearly $10 million for 17 water resource restoration projects, including more than $1.75 million in the acquisition and preservation of nearly 275 acres of waterfront proper-ties; the creation and restoration of salt marshes and reefs; and other habi-tat restoration and environmental education projects. A 25 acre intermod-al transportation center, currently in the beginning stages of construction, is an excellent example of the potential such brownfi eld sites present.
Coupled with these waterfront restoration projects are smart growth, sus-tainable development projects. A New Bedford National Historic Whaling Museum has been established in the center of the New Bedford National Historic Park and plans are underway for a world-class New Bedford Oceanarium. The National Oceanographic and Atmospheric Administra-tion (NOAA) has commi� ed $2 million for the revitalization of a brown-fi eld site into a waterfront park and recreational area, and NOAA and U.S. EPA recently signed a Memorandum of Understanding in New Bedford pledging to collaborate on the renewal of blighted coastal brownfi elds in communities like New Bedford throughout the nation. Together, these in-tegrated economic development and shoreline restoration initiatives will create great opportunity for New Bedford for coming generations.
For more information, contact Mike McCormack, Chief of Staff , Mayor Kalisz, New Bedford, (508) 979-1410, [email protected].
Smart Growth for Clean Water – 29

Prof
iles Profiles
San Diego Creek Watershed Natural Treatment SystemThe Irvine Ranch Water District (IRWD) was established in 1961 to provide potable water, sewage collection and treatment, and water reclamation for a 133 square mile area in Orange County, California. The IRWD’s bound-aries coincide with the San Diego Creek Watershed. The San Diego Creek, located in an urbanized watershed and the primary tributary to Newport Bay, is listed as an impaired waterbody due to excess nutrients, sediments, pathogens, and toxics. As a result of this listing, the IRWD made a com-mitment to improve the water quality of the San Diego Creek.
The most signifi cant sources of contaminants in the San Diego Creek are stormwater and urban runoff . In order to deal with these sources, IRWD developed a unique program to reconstruct the San Joaquin Marsh, an historic wetland on IRWD property. Since 1997, the IRWD has success-fully treated San Diego Creek water runoff through a system of ponds. These ponds naturally remove sediment, phosphorus, and nitrates from the water. The stormwater spends seven to ten days moving through the pond system before reentering San Diego Creek and ultimately Newport Bay and the Pacifi c Ocean.
Based on this success, the IRWD plans to implement a project entitled the Natural Treatment System (NTS) within the San Diego Creek Watershed. The NTS is a water quality improvement system that is both cost eff ec-tive and environmentally sound. This system will involve the creation of small, manmade wetlands placed in strategic locations throughout the watershed. Extensive scientifi c review and environmental assess-ment of the watershed will determine the most environmentally suitable locations for these smaller wetlands and the number of sites needed to achieve maximum cleanup potential. Planners initially studied 68 pos-sible locations throughout the San Diego Creek Watershed and have now reduced that list to the 31 best sites in terms of treatment eff ectiveness, availability, cost, and constructability. Many of these sites include public facilities such as county retention basins where water quality wetlands can be constructed without interfering with their primary purpose as fl ood control mechanisms.
Modeling has shown the potential to improve water quality in San Diego Creek and Newport Bay. In fact, the Natural Treatment System is ex-pected to remove 126,000 pounds of nitrogen annually, 21,000 pounds of phosphorus annually, and reduce fecal coliform levels by 26 percent. The NTS also serves multiple functions as a natural resource, riparian habitat, and open space. Moreover, the NTS is expected to cost signifi cantly less than what would otherwise be required to build new or upgrade existing wastewater and stormwater infrastructure systems. Perhaps most impor-tantly, the NTS will provide a regional, watershed-wide approach to solv-ing a water quality problem.
For additional information, contact John Hills, Director of Water Quality, Irvine Ranch Water District at (949)453-5850 or [email protected].

Prof
iles Profiles
Land Protection Criteria Guide Conservation in Suffolk County, New York—Pioneering Programs Help Protect Land and Water ResourcesLocated at the eastern end of Long Island, an area rich in ecological im-portance and scenic beauty, Suff olk County and its towns have pioneered local land conservation eff orts for more than 25 years. During this time, the county has spent roughly $283 million protecting about 24,000 acres of land and has established the nation’s fi rst purchase of development rights program to preserve farmland. Suff olk County voters have also embraced every conservation spending measure placed before them by county and state government, including a $1.9 billion environmental bond act that was rejected statewide in the recession of 1990. Now the county is in the midst of the biggest conservation push in Long Island history: in the past few years, voters have approved millions of dollars for conservation mea-sures and legislative authorizations.
The county has distinct programs to preserve agricultural lands, water-shed lands, open space, and greenways. The system of prioritizing lands depends on the program; some programs have established very specifi c targeted acquisition areas and criteria while others defi ne the parameters more broadly.
In addition to county programs for farmland and open space protection and greenways and recreational lands, concern about the protection of groundwater led to the creation of the Suff olk County Drinking Water Protection Program in the 1980s. Funded with a one-quarter cent of the sales tax, the program acquires watershed lands, primarily in the core area of the Central Pine Barrens as defi ned by the Long Island Pine Bar-rens Protection Act. This Act is a national model for groundwater protec-tion that created a 100,000 acre preserve above the deep aquifer drinking water recharge area, eff ectively eliminating development in the 50,000 acre core area and se� ing aside the other half, the Compatible Growth Area, for limited use. Various land use and zoning tools are used to ac-complish the preservation goals of the Act, including transfer of devel-opment rights, cluster zoning, and conservation easements. In addition, New York’s Clean Water State Revolving Fund has made a loan of $75 mil-lion to Suff olk County to acquire land in priority aquifer recharge areas in the Pine Barrens.
To acquire land under the drinking water protection program, parcels are fi rst recommended by the County Planning Department, the state/local Central Pine Barrens Joint Planning Program, or other county or mu-nicipal stakeholders. These recommendations are then approved by the County Parks Trustees and subsequently authorized for acquisition by the legislature. Any one of the following criteria are used to determine
Smart Growth for Clean Water – 31

Prof
iles Profiles
eligibility: location in deep fl ow recharge areas; proximity to ground water divide; local source supply ground water aquifer; proximity to existing wellsite; or within zone of infl uence of any proposed or existing wellsites.
Excerpt from The Trust for Public Land’s “Local Greenprinting for Growth”Volume IV, 2003. For more information, contact Stephen M. Jones, Chief Execu-tive Offi cer, Suff olk County Water Authority, Phone: (631) 589-5200.
Drinking Water Protection ToolsSome source water protection programs make direct connections among sprawl, smart growth, brownfi elds redevelopment, and watershed management. The following ex-amples describe some of the best practices and lessons learned.
Projects that buff er drinking water sources are one of four priority areas that receive grants under Connecticut’s Open Space and Watershed Land Acquisition Grant Program. Municipalities, nonprofi t land conservation organizations, and water companies can ap-ply for grants that can be used towards the purchase of open space that protects water re-sources. For example, the Town of Westbrook, Connecticut acquired 24 acres as permanent open space because the property was identifi ed as a priority for aquifer protection and for linkage to adjacent town-owned property and a proposed open space network.
For more information, visit h� p://dep.state.ct.us/rec/opensp31.htm.
The Los Angeles Department of Water and Power (LADWP) owns 314,000 acres of land in the Eastern Sierra Watershed in Inyo County, CA, a key source of drinking water for the City of Los Angeles. The LADWP leases a signifi cant portion of these lands to ranch-es and commercial businesses, which must adhere to lease policies, guidelines, and plans that protect the watershed and water quality. LADWP staff conduct routine inspections to ensure that the policies are implemented. For ranches, the guidelines include using ir-rigation practices that minimize runoff , return fl ows, and erosion. Commercial business leases must conform to the Inyo County General Plan, which includes a land use policy to manage ground water basins to ensure water quality and quantity.
For more information, visit www.ladwp.com.
Instead of spending $8 billion on water treatment system improvements and expansions to meet increased demands, New York City’s Department of Environmental Protection (DEP), which is also the city’s water utility, acquired land and conservation easements in upstate watersheds for $1.5 billion to protect the quality of the City’s drinking water supplies. DEP paid fair market value for the land and also pays property taxes. No land is taken by eminent domain, and municipalities can exclude certain parcels from acquisi-tion. DEP consults with communities about lands in which it is interested and provides up to $20,000 to each municipality to support local review processes.
For more information, visit www.nyc.gov/html/dep/html/watersup.html.
32 – Smart Growth for Clean Water

Prof
iles Profiles
United States Army Corps of Engineers Emerges as Community Partner on Waterfront Preservation and RevitalizationThe Army Corps of Engineers (Corps) is a federal agency with a mission to protect and utilize the nation’s water resources for the benefi t of locali-ties, the economy, and the environment. While historically some Corps projects have been criticized as being harmful to the environment, more and more Corps programs and projects are focusing on a mission of en-vironmental stewardship that meets the needs and desires of local com-munities for restoration and preservation of water resources.
For example, in 2002, Corps Commander Robert Flowers issued a set of “Environmental Operating Principles” to guide the eff orts of the Corps to protect and preserve valued environmental resources (see www.hq.usace.army.mil/cepa/envprinciples.htm). Likewise, many Corps’ programs have focused in recent years on projects to restore waterfront ecosystems of rivers, lakes, and coasts while addressing growth and eco-nomic development goals of local communities. Most Corps projects are specifi cally authorized and funded. However, Water Resources Develop-ment Acts have provided programmatic authorities for planning, design, and construction, including: Section 1135, Project Modifi cations for Improvement of the Environment; Section 206, Aquatic Ecosystem Res-toration; Section 204, Benefi cial Use of Dredged Material (for Ecosystem Restoration); and Section 312, Environmental Dredging (contaminated sediments). Additional programmatic authorities empower broad plan-ning assistance, including the Section 729 Watershed and River Basin Assessments program, and the Section 22 Planning Assistance to States program, among others. Many communities support the concept of op-timizing and expanding these limited Corps authorities so that they can be� er meet the urban waterfront and watershed revitalization goals of local governments.
Some promising eff orts are already underway. In Stamford, Connecticut, the community seeks to revitalize the Mill River waterfront in downtown Stamford into a mixed-use development and 26 acre urban park. The proj-ect will involve the establishment of a new urban park, biking and walk-ing trails, open space, and “green infrastructure” along the Mill River, in-cluding constructed wetlands and low impact development practices. The Corps is using its Aquatic Ecosystem Restoration program to study the feasibility of restoring the degraded ecosystem and water quality of the Mill River and to address the problems of urban stormwater runoff and harmful channel modifi cations conducted in the past. The Trust for Public Land is also partnering with Stamford to acquire and preserve open space along the Mill River and the Long Island Sound.
Smart Growth for Clean Water – 33

Prof
iles
The Corps of Engineers has partnered with the City of Des Moines, Iowa to build a new riverwalk, develop constructed wetlands, and ad-dress fl ood control needs along the Des Moines and Raccoon Rivers in downtown Des Moines. This project includes activities on the Riverpoint West and Agrimergent Technology Park areas, where brownfi elds will be converted to mixed-use and eco-industrial development projects on these urban rivers, with designs that incorporate open space, recreational space, and low impact development techniques.
Likewise, the Corps of Engineers has partnered with Indianapolis, Indiana on the “Central Indianapolis Waterfront Project.” The goal of the project was to reverse the environmental and economic decline of the White River and reclaim this valuable asset for the citizens of India-napolis and Indiana. A� er the great fl ood of 1913, levees and fl ood walls were built to protect the city from ravaging fl oods. However, these fl ood control structures became barriers, cu� ing the city off from its river. The new design has created public spaces and continuous walkways along the water’s edge, while providing equal fl ood protection. The project was recently selected for a Chief of Engineers Award of Excellence (see: www.hq.usace.army.mil/cepa/pubs/apr02/story12.htm).
These community-based, well-engineered approaches demonstrate how the Corps of Engineers can help promote smart growth for clean water projects that meet local community needs.
For more information, contact Larry Prather, Chief of Legislative Management Branch, US Army Corps of Engineers, (202) 761-4580, [email protected].
34 – Smart Growth for Clean Water

Barriers &
Solutions
Barriers and Solutions to Smart Growth for Clean Water
As states and communities plan and implement their smart growth for clean water programs, many are fi nding that existing policies, regula-tions, and organizational structures can be impediments to smart growth and water resource protection. Some of the most common barriers to implementing smart growth for clean water programs are discussed below, along with possible solutions. While these solutions are seldom “quick fi xes,” many communities have found that the results are o� en worth the eff ort to protect threatened water resources and community quality of life.
Common challenges include:
Coordination Between Land Use Planning and Water Quality Programs
Integration of Water Quality Goals in Local Zoning Ordinances
Connecting Infrastructure Decisions to Land Use Planning
Measuring the Water Quality Results of Smart Growth Approaches
Providing Adequate Resources to Implement Smart Growth for Clean Water Tools
Developing New Technologies and Innovations
Increasing Public Awareness and Support
Providing Flexible Regulatory Requirements
Smart Growth for Clean Water – 35

Bar
riers
& S
olut
ions
Barriers &
Solutions
Coordination Between Land Use Planning and Water Quality Programs
ü Consolidate state land use and watershed planning, as the Massachuse� s Executive Offi ce of Environmental Aff airs has done. In addition, conduct joint training programs with land management and water quality offi cials.
ü Establish a state smart growth offi ce, such as the Maryland Governor’s Offi ce of Smart Growth (OSG). Established with a mission to implement the state’s comprehensive smart growth program, OSG coordinates state agency activities and ensures consistency among the various smart growth programs.
ü Promote land use approaches in state and local water qual-ity programs. For example, EPA and states should reward local governments that incorporate smart growth in TMDL and stormwater plans with regulatory credit and incentives. In addition, federally approved water quality management plans and programs should more explicitly recognize cur-rent and future sources of pollution resulting from the water quality impacts associated with development.
ü Encourage comprehensive plans on the regional and/or municipal level to integrate water quality, drinking water supply, and watershed concerns with development/land use plans and community economic and quality of life goals.
ü Develop new types of partnerships that link land use plan-ning and water resource protection. Promoting new part-nerships between land and water agencies, land trusts and watershed groups, brownfi elds and economic development organizations, regional planning agencies and park com-missions, and others may help bring about new programs that eff ectively achieve a variety of common goals and ad-dress the land use/water quality connection. Public/private partnerships are important for leveraging additional sources of funding.
BARRIER
At local, state, and federal levels of government, there is a lack of coordination and communication between land use and water quality offi cials and programs.
SOLUTIONS
36 – Smart Growth for Clean Water

Bar
riers
& S
olut
ions
Barriers &
Solutions
Clean Ohio Program
The Clean Ohio Program, based on a constitutional amendment approved by voters, uses half of its $400 million state bond fund for brownfi elds site cleanups and redevelopment and half for open space preservation. This program was the fi rst in the coun-try to link funds for brownfi elds redevelopment and open space preservation.
Contact Wilma Yoder, Clean Ohio Program, (614) 233-4175.
Tree Ordinances
Tree ordinances are one of the more eff ective tools for conserv-ing and improving the urban forest. Tree ordinances range in complexity from simple tree replacement standards to more comprehensive ordinances addressing natural resource issues. It is very important that the tree ordinance meet the needs of the community. One of the best reference materials on writing tree ordinances is the publication “Tree Conservation Ordinances” wri� en by Chris Duerksen and distributed by the American Planning Association.
For more information, visit www.planning.org.
Maryland’s Smart Growth Program
The State of Maryland has taken the lead in establishing and im-plementing a comprehensive smart growth program, which can result in signifi cant water protection benefi ts. Maryland’s Smart Growth initiative, established in 1997, has three simple goals:
1. Supporting and revitalizing existing communities by targeting state resources to those that are already developed.
2. Preserving critical farmland and natural resources.
3. Saving taxpayers millions of dollars in the unneces-sary cost of building the infrastructure required to support sprawl.
For more information, visit www.smartgrowth.state.md.us.
Smart Growth for Clean Water – 37

Bar
riers
& S
olut
ions
Barriers &
Solutions
Integration of Water Quality Goals in Local Zoning Ordinances
ü Revise local ordinances. For example:
o Allow conservation subdivision zoning or cluster develop-ment. Under this approach, a certain percentage of land in a development project remains as open space and natural habitat by clustering development in concentrated areas. Also, consider revised design standards that allow and pro-mote site planning that reduces impervious surface area (for example, narrower streets), stormwater runoff , and pollut-ant loads.
o Encourage compact, infi ll development on brownfi elds and other locations where development has already taken place. This type of development reduces development on pristine greenfi elds. Incorporate water quality evaluations and miti-gation measures as needed in such projects to ensure water resource protection.
o Prohibit leapfrog development that disrupts and fragments habitat. Large tracts of continuous development allow the preservation of more natural habitats (U.S. EPA, 2001 (a)).
o Limit the amount and type of development allowed on prime agricultural land.
o Establish overlay zoning (e.g., aquifer or stream protection districts) to protect specifi c water resources.
o Designate growth areas. For example, restrict certain land uses in areas that could negatively impact water resources, and encourage development in other, less sensitive areas.
ü State/local legislation can be changed to allow more authority and fl exibility in zoning, including incentives for smart growth (e.g., tax reductions for low impact development and other best management practices), and disincentives for sprawling growth (e.g., impact fees for development outside designated growth ar-eas). For example, the Town of Skaneateles, New York revised its
BARRIER
Local zoning codes often do not adequately account for development impacts on water quality, nor provide incentives for (or even allow) low impact development techniques and other smart growth practices.
SOLUTIONS
38 – Smart Growth for Clean Water

Bar
riers
& S
olut
ions
Barriers &
Solutions
zoning laws to incorporate review of building permits, subdivi-sion activities, and other zoning actions by the Syracuse Water Department to help ensure compliance with the Department’s Watershed Rules and Regulations. This action was initiated by town residents concerned with maintaining the high water qual-ity of Skaneateles Lake, which is the primary drinking water supply for municipalities in the Syracuse, NY area. (See New York Lake Watershed District Ordinance, Code of the Town of Skaneateles, Chapter 148, Article V.)
Smart Growth for Clean Water – 39

Bar
riers
& S
olut
ions
Barriers &
Solutions
Connecting Infrastructure Decisions to Land Use Planning
ü Require local comprehensive land use plans that consider the availability of existing and planned infrastructure, as well as the protection of water quality and quantity. Use ad-equate public facility ordinances to require that infrastruc-ture (as well as other public services) be available or planned prior to development. In some communities, urban service boundaries have been established, beyond which new sewer and water infrastructure are not favored or allowed. Once local growth plans are established, tie state infrastructure funding and decisions to designated growth areas and away from designated open space protection areas. This approach was championed by the State of Maryland, where state in-frastructure funding is not available for development that takes place outside of designated growth zones, which are based on locally established development areas and existing infrastructure.
ü Encourage infrastructure funding decisions that are inte-grated with state and local smart growth initiatives, and adopt funding preferences that favor smart growth strate-gies that protect water resources. For example, require con-sideration of the impacts of development as part of state and local environmental and infrastructure review processes; provide “points” for smart growth strategies in deciding which projects to fund; off er fi nancial incentives for projects that address growth impacts; and limit the amount of assis-tance that goes towards new development versus the main-tenance of existing infrastructure. When funding a water collection system project, Massachuse� s has chosen to allow 25 percent of the monies to be used for new development; 75 percent must be used for fl ows that existed as of April 1995.
BARRIER
Infrastructure planning and approvals by state and local officials frequently are not connected with the land use planning process, often putting smart growth plans and infrastructure construction in conflict. In addition, state infrastructure officials are unable to direct decisions in a smart growth fashion if localities have not established clear growth plans and preferences. Moreover, local development plans and decisions often are not based on the avail-ability or adequacy of nearby water and sewer infrastructure.
SOLUTIONS
40 – Smart Growth for Clean Water

Bar
riers
& S
olut
ions
Barriers &
Solutions
ü Localities should have the option to use adequate public fa-cilities ordinances and other tools under state and local law to refuse extensions of sewer and water infrastructure to development that is proposed outside of urban growth and service boundaries.
The Drinking Water State Revolving Fund
The Environmental Protection Agency’s Interim Final Rule on drinking water state revolving funds (40 CFR Parts 9 and 35) states that projects that serve extensive future population growth are ineligible for assistance from the DWSRF Fund. Proj-ects must be sized only to accommodate a reasonable amount of population growth expected to occur over the useful life of the facility (35.3520(e)(5)).
For more information, visit www.epa.gov/safewater/dwsrf/docs/guidetoc.html.
Smart Growth for Clean Water – 41

Bar
riers
& S
olut
ions
Barriers &
Solutions
Measuring the Water Quality Results of Smart Growth Approaches
ü EPA should develop new models, or modify existing models, to estimate the water quality benefi ts of land conservation, brownfi elds cleanup, low impact development, urban and community forestry, and other watershed best management practices. EPA’s Development, Community, and Environ-ment Division is leading the way with the development of a model to measure the water quality impacts associated with diff erent development scenarios.
ü American Forests has developed a new computer so� ware tool, CITYgreen, that measures the eff ect of urban tree cover and impervious surface on stormwater. This tool can help communities meet their stormwater and other water quality goals.
ü Continue the research and development of a GIS based ur-ban forest hydrology model. The model is being developed and fi eld tested by the North Eastern Research Station,
USDA Forest Service in cooperation with the State University of New York Environmental Sciences and Forestry (ESF) program. While most urban hydrology models are oriented towards hardscape and drainage infrastruc-ture, traditional forest hydrology models do not take the built environment into consid-eration. New GIS forestry models will help overcome these challenges.
ü EPA should act as a clearinghouse for information on measuring wa-ter quality benefi ts associated with smart growth practices. A number of local and state governments have measured some benefi ts, but the in-formation is sca� ered and diffi cult to access. The clearinghouse should include information on impervious surface models and methodologies for prioritizing natural areas.
Measuring Benefits
Measuring the benefi ts of smart growth is not easy. It may take years to see the water quality benefi ts of these smart growth tools. During these early years, success may need to be defi ned in terms of better land use. Consider the following alternatives:
ü Measure for water quality changes in the tributaries rather than the main stem of a stream, since tributaries show water quality changes fi rst.
ü Use pollutant ratios rather than concentrations of pollutants.
Environmental models can sometimes be used as partial, less expensive substitutes for water qual-ity monitoring (Stigall, 2002).
BARRIER
It is often difficult to measure the benefits of smart growth prac-tices on water quality, compared to traditional infrastructure and pollution controls.
SOLUTIONS
Bar
riers
& S
olut
ions
Barriers &
Solutions
Providing Adequate Resources to Implement Smart Growth for Clean Water Tools
ü States and localities should conduct cost of service studies and fi scal impact analyses to determine how growth will aff ect the fi scal health and viability of the community. Such studies have consistently shown the economic value of con-servation, brownfi elds revitalization, and smart growth ap-proaches.
ü Where sprawling development projects do not cover the costs and impacts associated with this new growth, locali-ties should consider the use of development impact fees to help ensure that new residential growth is responsible for its share of infrastructure and government services.
ü Localities should pursue local initiatives for protection of land and water resources. While raising local taxes or other local revenues may not be the only or best solution, the fact is that residents are o� en willing to pay for such environmen-tal protection. In 2002, 75 percent (141 of 189) of parks and open space ballot measures passed in communities across America—up from 70 percent in 2001. The 141 successful measures will generate over $10 billion in 28 states, includ-ing an estimated $5.7 billion specifi cally for land acquisi-tion, preservation, and protection (Trust for Public Land and Land Trust Alliance, 2003).
ü Local funds almost always a� ract and leverage state, federal, or private sector funds. Communities should identify and create local programs to leverage available funds/resources
BARRIER
Preserving land, revitalizing brownfields, and pursuing low impact development cost money and often require innovative solutions, but most funding programs and resources are geared toward con-ventional development and infrastructure practices. Smart growth for clean water tools are efficient and cost effective, as these tools often provide multi-purpose objectives (for example, rain gardens control stormwater and may re-introduce natural habitat). More-over, smart growth approaches are often less costly than conven-tional infrastructure and development practices. More resources are needed for these innovative approaches.
SOLUTIONS
Smart Growth for Clean Water – 43
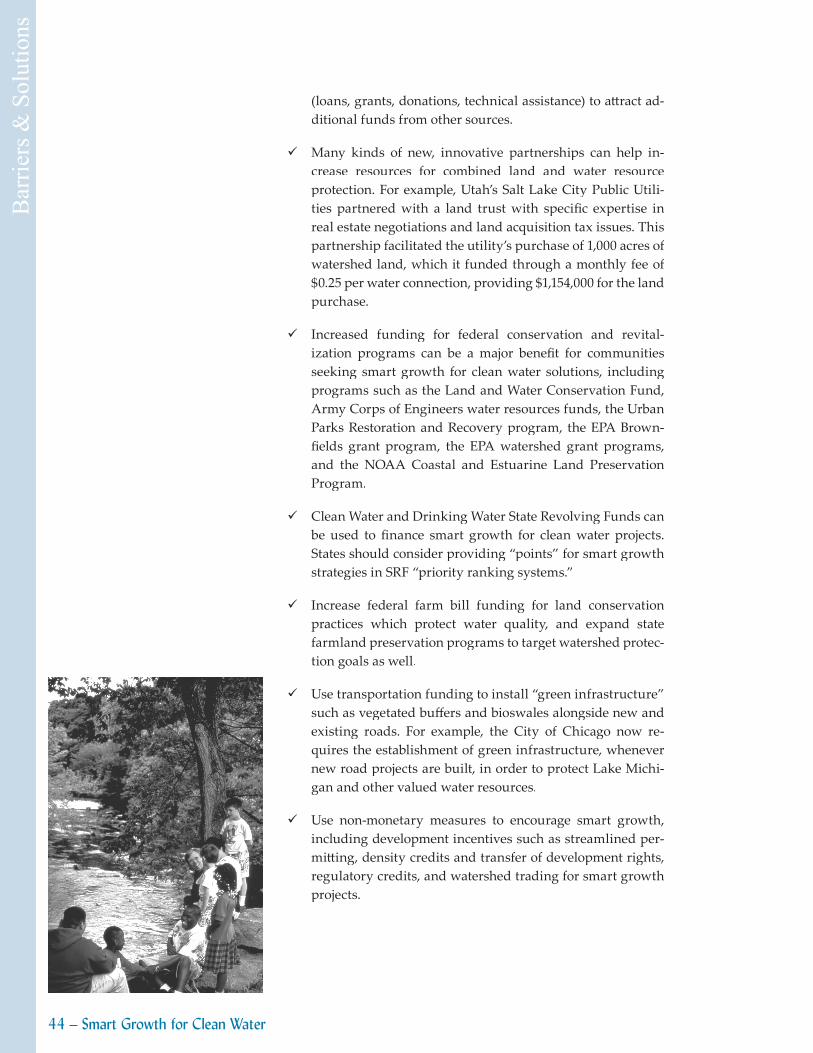
Bar
riers
& S
olut
ions
Barriers &
Solutions
(loans, grants, donations, technical assistance) to a� ract ad-ditional funds from other sources.
ü Many kinds of new, innovative partnerships can help in-crease resources for combined land and water resource protection. For example, Utah’s Salt Lake City Public Utili-ties partnered with a land trust with specifi c expertise in real estate negotiations and land acquisition tax issues. This partnership facilitated the utility’s purchase of 1,000 acres of watershed land, which it funded through a monthly fee of $0.25 per water connection, providing $1,154,000 for the land purchase.
ü Increased funding for federal conservation and revital-ization programs can be a major benefi t for communities seeking smart growth for clean water solutions, including programs such as the Land and Water Conservation Fund, Army Corps of Engineers water resources funds, the Urban Parks Restoration and Recovery program, the EPA Brown-fi elds grant program, the EPA watershed grant programs, and the NOAA Coastal and Estuarine Land Preservation Program.
ü Clean Water and Drinking Water State Revolving Funds can be used to fi nance smart growth for clean water projects. States should consider providing “points” for smart growth strategies in SRF “priority ranking systems.”
ü Increase federal farm bill funding for land conservation practices which protect water quality, and expand state farmland preservation programs to target watershed protec-tion goals as well.
ü Use transportation funding to install “green infrastructure” such as vegetated buff ers and bioswales alongside new and existing roads. For example, the City of Chicago now re-quires the establishment of green infrastructure, whenever new road projects are built, in order to protect Lake Michi-gan and other valued water resources.
ü Use non-monetary measures to encourage smart growth, including development incentives such as streamlined per-mi� ing, density credits and transfer of development rights, regulatory credits, and watershed trading for smart growth projects.
44 – Smart Growth for Clean Water
Bar
riers
& S
olut
ions
Barriers &
Solutions
Developing New Technologies and Innovations
ü Provide education and outreach for local governments and developers on state-of-the-art watershed-based land use planning and water protection techniques from federal and state agencies and knowledgeable private groups. Initiatives by groups like the Center for Watershed Protection and Non-point Education for Municipal Offi cials should be encour-aged and enhanced.
ü Federal and state agencies should provide technical assis-tance on GIS, remote sensing, and other useful planning tools. The federal government should continue to research and develop low impact development technologies and other smart growth tools. For example, on May 1, 2003, U.S. EPA announced the launch of a new “Construction Industry Compliance Assistance Center.” The new web-based CICA-center, found at www.cicacenter.org, was funded by EPA and www.cicacenter.org, was funded by EPA and www.cicacenter.orgdeveloped by the National Center for Manufacturing Scienc-es in partnership with the Associated General Contractors of America, the National Association of Home Builders, the American Road and Transportation Builders Association, and the Golf Course Builders Association of America. With this new compliance tool, users can fi nd plain-language explanations of applicable stormwater and water protection regulations, as well as links to state and local regulatory agencies. EPA should use this and other tools to promote smart growth for clean water and low impact development approaches by the construction industry.
ü Additional training opportunities are needed for developers and local/regional government offi cials on best management practices, low impact development, changes in zoning and building codes, and other smart growth strategies.
ü Promote the use of so� ware available for use on Personal Digital Assistants, such as Palm Pilots, for mobile commu-
BARRIER
Local and state government, as well as the private sector, need better technologies and access to information on existing tech-nologies that can help measure and reduce the negative water quality and quantity impacts of development.
SOLUTIONS
Smart Growth for Clean Water – 45

Bar
riers
& S
olut
ions
Barriers &
Solutions
nity tree inventories. This so� ware can be downloaded from www.umass.edu/urbantree/projects.shtml. This freeware was developed at the Northeastern Center for Urban and Com-munity Forestry, USDA Forest Service.
ü Encourage the continued research into other GIS tools that will help localities proactively use trees to reduce the im-pacts of development and improve water quality.
ü In partnership with U.S. EPA, Region 5 and Purdue Univer-sity, the Local Government Environmental Assistance Net-work (LGEAN) recently launched an online tool to help local government planners measure the water quality impacts of land use changes. Specifi cally, local governments provide information about their location, the proposed land use change, and the area’s soil type. Based on community-spe-cifi c climate data, the Long-Term Hydrologic Impact Assess-ment (L-THIA) model estimates changes in recharge, runoff , and nonpoint source pollution resulting from proposed development. L-THIA is available for free on the LGEAN website, and users only need an Internet browser to use the tool. A downloadable GIS extension is also available for local government offi cials with ArcView so� ware. To use L-THIA, visit LGEAN’s Tools and Resources page at www.lgean.org/html/exchange.cfm and select the “Land Use Impacts on Water Quality Model.”
Geographic Information Systems
Geographic Information Systems technology is an important tool to measure the value of tree cover and model the eff ect of land cover on air quality and stormwater movement. This high-resolution multispectral aerial imagery produces a “green infrastucture” data layer for use in community planning and development.
46 – Smart Growth for Clean Water

Bar
riers
& S
olut
ions
Barriers &
Solutions
Increasing Public Awareness and Support
ü Develop a citizens training program to complement the EPA Development, Community, and Environment Division’s tool to measure the water quality impacts associated with par-ticular development pa� erns. While the tool was developed for the technical planner or water quality specialist, the EPA could develop a simplifi ed version for the public.
ü Develop partnerships among local governments and private/nonprofi t groups to organize smart growth-clean water community awareness events, such as river festivals, stream cleanup days, and tree planting. Make connections and set joint goals between local land trusts and watershed associations.
ü Expand outreach eff orts to the public on the connections between development and water resources and the potential impacts, such as contamination of drinking water supplies and recreational waters. Use local utility bill mailings to remind people where their drinking water comes from and what they can do to protect it.
BARRIER
Residents and community organizations may not understand the threats to water quality and quantity in their community, or the connections between sprawling growth, individual behaviors, and water pollution.
SOLUTIONS
Encouraging Smart Growth
Using smart growth to achieve clean water goals will require local governments to work with the development community. Local governments may consider the following incentives as a way to encourage smart growth in their community:
Provide tax incentives, such as tax reductions, tax credits, or tax deferrals, for land conservation, brownfi elds redevelopment, infi ll development, and low impact development.
Identify designated growth areas and direct funding to those places.
Establish a streamlined permit approval process to developers who locate in des-ignated growth areas and use smart growth for clean water techniques.
Provide density credits and reduced fees or interest rates to developers who reduce the water quality impacts of impervious surface.
Use Clean Water State Revolving Funds to provide loans for land acquisition, purchase or transfer of development rights, and brownfi elds redevelopment.

Bar
riers
& S
olut
ions
Providing Flexible Regulatory Requirements
ü EPA and the states should provide credit or a reduction in regulatory requirements for smart growth approaches that have demonstrated reduced pollutant levels. States and EPA should reward local governments that incorporate smart growth in TMDL and stormwater plans with regulatory credit. EPA is beginning to work in partnership with states and localities to provide clean water credit for smart growth actions. For example, localities can now get credit for smart growth and urban forestry projects in the stormwater man-agement plans required under the Phase II stormwater rule. Likewise, smart growth practices have the potential to fulfi ll pollution reduction requirements at impaired waters where TMDL plans are necessary. The ability for communities to take credit for their smart growth eff orts is truly ground-breaking and the wave of the future.
ü EPA should continue to implement the Water Quality Trad-ing Policy. Water quality trading is a market-based approach to improve and preserve water quality. Trading can pro-vide greater effi ciency in achieving water quality goals in watersheds by allowing one source to meet its regulatory obligations by using pollutant reductions created by another source that has lower pollution control costs. EPA’s policy endorses trading as an economic incentive for voluntary pollutant reductions from point and nonpoint sources of pollution and as a way to achieve ancillary environmental benefi ts, such as creation of habitat.
ü EPA should continue to provide training and assistance to local governments and watershed organizations interested in using smart growth for clean water tools as a way to com-ply with regulatory requirements.
BARRIER
Regulatory requirements favor the building of expensive structural solutions.
SOLUTIONS
48 – Smart Growth for Clean Water

Smart Growth for Clean Water – 49

Top 10 Actions for Advancing Smart Growth for Clean Water In Your Community
What actions can local offi cials take to promote smart growth for clean water in their communities?
1. Connect the Issues of Land and WaterEncourage joint planning, resource allocation, and program imple-mentation of water and wastewater, watershed management, land use planning, and economic development by local government. Es-tablish an inter-offi ce commission to address smart growth for clean water.
2. Establish a Greenprint and a Blueprint for Your CommunityWorking with citizens and community organizations, establish a long-term vision and plan for those lands that should be protected because of their special natural, scenic, agricultural, historic, or cultural value. Connect this “greenprint” to a “blueprint” of rivers, lakes, and other water bodies and use this plan to prioritize land protection.
3. Think and Act Like a RegionSprawling growth and water pollution do not respect local boundar-ies. Solving these problems means that your locality needs to coor-dinate with neighboring communities in the watershed to establish common goals for directing growth pa� erns and protecting the quality of local waters. Places to start include metropolitan councils of government and regional planning or economic development councils.
4. Revitalize Brownfi eldsCleaning up and redeveloping brownfi elds will not only reduce tox-ic runoff from these sites, but also reduce the pressure of sprawling growth on the fringe of your community. Resources are available at the state and federal level to identify, assess, cleanup, and redevelop brownfi elds.
50 – Smart Growth for Clean Water

5. Expand Urban and Community ForestryDevelop local plans for the management of trees in urban areas to maintain a healthy green infrastructure that contributes to storm-water management. Community forest activities, such as engaging residents in tree planting and care, have been proven to reduce water pollution and runoff into rivers, streams, and lakes. Work with your state forester to target forestry resources to waterfront and riverine habitat areas.
6. Provide Incentives to DevelopersLocal zoning, subdivision, and building codes can include incentives to developers who adopt low impact development and other smart growth approaches in residential and commercial development proj-ects. Localities can encourage approaches such as: the dedication of open space to preservation; cluster/conservation zoning or density bonuses; overlay zones to protect water resources; minimum tree planting requirements; and incentives for the use of rain gardens, roo� op gardens, and other stormwater reduction techniques.
7. Use GIS TechnologyGIS mapping off ers some of the best tools for integrating water and land use planning. Communities can use GIS to project community build-out pa� erns and plans, predict the future impacts on water quality from current and proposed growth pa� erns, and identify water resources that need the most protection.
8. Partner with State ProgramsState offi cials can be partners with local boards on the water pollu-tion and sprawl challenges facing specifi c regions and communities. States should be encouraged to direct state resources and programs toward the land-water connection.
9. Leverage New ResourcesBe creative about using new resources to promote smart growth for clean water, such as Clean Water and Drinking Water State Revolv-ing Funds, Transportation Funds, and other non-traditional sources.
10. Use Watershed Management Approaches to Protect Land and Water QualityIn times of tight budgets, it is critical to make the most of what you have. The watershed management approach is highly effi cient since its comprehensive framework allows local governments to simulta-neously improve water quality by managing land use. One key to eff ective watershed management is building strong partnerships with a broad range of people and organizations interested in or re-sponsible for these issues.
Smart Growth for Clean Water – 51

Local GovernmentCity of New BedfordFrederick Kalisz, Jr., MayorMike McCormack, Chief of Staff 133 William StreetNew Bedford, MA 02740Phone: (508) [email protected]
City of Chicago Department of EnvironmentN. Marcia Jimenez, Commissioner30 North LaSalle StreetSuite 250Chicago, IL 60602Phone: (312) [email protected]/environment
City of Des MoinesEllen Walkowiak, Economic Development CoordinatorOffi ce of Economic Development400 East First StreetDes Moines, IA 50309Phone: (515) [email protected]
Irvine Ranch Water DistrictPaul Jones, General ManagerJohn Hills, Director of Water Quality 15600 Sand Canyon Ave.Irvine, CA 92618 Phone: (949) 453-5850 [email protected]
Los Angeles Department of Water and PowerP.O. Box 51111Los Angeles, California 90051-0100Phone (800) 342-5397www.ladwp.com
Mecklenberg County, North CarolinaRusty Rozelle, Water Quality Program ManagerLand Use and Environmental Services Agency700 North Tryon StreetCharlo� e, NCPhone: (704) [email protected]
New York City Department of Environmental ProtectionDepartment of Environmental ProtectionCustomer Service Center59-17 Junction Boulevard, 10th FloorFlushing, NY 11373Phone: (718) 337-4357www.nyc.gov/html/dep/html/watersup.html
Prince George’s County Department of Environmental ResourcesLarry Coff man, Associate DirectorInglewood Center 39400 Peppercorn PlaceLargo, MD 20774Phone: (301) 883-5839lscoff [email protected]
Suff olk County Water AuthorityStephen M. Jones, Chief Executive Offi cer4060 Sunrise HighwayOakdale, New York 11769Phone: (631) 589-5200www.scwa.com
State GovernmentArkansas Forestry CommissionPa� i Erwin2780 North Garland AvenueFaya� eville, Arkansas 72704Phone: (479) 442-8627www.forestry.state.ar.us/asld/htmls/forestry97.html
Connecticut Open Space and Watershed Land Acquisition Grant ProgramDepartment of Environmental Protection 79 Elm Street Hartford, CT 06106-5127Phone (860) 424-3000h� p://dep.state.ct.us/rec/opensp31.htm
Georgia’s Greenspace ProgramGeorgia Department of Natural ResourcesGreenspace Commission2 Martin Luther King, Jr. Dr.Suite 1454Atlanta, GA 30334Phone (404) 656-5165www.state.ga.us/dnr/greenspace
Illinois Environmental Protection AgencyMarcia Willhite, Bureau of Water Chief1021 North Grand Avenue, EastP.O. Box 13276Springfi eld, IL 62794-9276Phone: (217) [email protected]
Iowa Finance AuthorityMichael Tramontina, Executive Director100 East Grand AvenueSuite 250Des Moines, IA 50309Phone: (800) [email protected]
Iowa Department of Natural ResourcesJeff Vonk, SecretaryHenry A. Wallace Building502 East 9th StreetDes Moines, IA 50319Phone: (515) 281-5385www.state.ia.us/government/dnr
Maryland Governor’s Offi ce of Smart Growth16 Francis St, 4th FlAnnapolis, MD 21401Phone (410) 974-2300www.smartgrowth.state.md.us
Smart Growth for Clean Water Resources
52 – Appendix

Massachuse� s Executive Offi ce of Environmental Aff airsRobert O’Connor, Director of Land and Forest Policy251 Causeway Street9th FloorBoston, MA 02114Phone: (617) [email protected]/envir
Mid-Ohio Regional Planning CommissionWilma YoderProgram ManagerClean Ohio Program285 East Main StreetColumbus, OH 43215Phone: (614) [email protected]
Ohio Water Resource Restoration Sponsor ProgramOhio EPAGreg Smith, ChiefDivision of Environmental & Financial AssistanceP.O. Box 1049Columbus, Ohio 43216-1049Phone: (614) 644-3020Fax: (614) [email protected]/pub/defa/WRRSP_Fact_sheet.pdf
Federal GovernmentUS Army Corps of EngineersLarry Prather, Chief, Legislative Management BranchPlanning and Policy Division Directorate of Civil Works441 G Street, NW Washington, DC 20314-1000Phone: (202) 761-4580Fax: (202) [email protected]
U.S. Environmental Protection Agency (EPA)Ariel Rios Building1200 Pennsylvania Avenue, N.W.Mail Code 3213AWashington, DC 20460Phone: (202) 260-2090
Brownfi elds• www.epa.gov/swerosps/bf/index.html
Funding• Catalog of Federal Funding Sources for Watershed Protection: www.epa.gov/owow/watershed/wacademy/fund.html
Potential Roles for Clean Water State Revolving Fund Programs in Smart Growth Initiatives
• www.epa.gov/owm/pdfs/smartgro.pdfLow Impact Development
• www.epa.gov/owow/nps/lid• Model Ordinances to Protect Local Resources: www.epa.gov/owow/nps/ordinance
Smart Growth• www.epa.gov/livability/
Water• Eight tools of Water Protection in Developing Areas: www.epa.gov/owow/watershed/wacademy/acad2000/protection• www.epa.gov/owow/watershed/• www.epa.gov/owow/wetlands
U.S. Department of Agriculture Forest ServiceUrban and Community Forestry1400 Independence Ave., SWWashington DC 20250-1123• Mark Buscaino, Director (202) 205-1054• Jim Geiger, Pacifi c Southwest Region (530) 752-7636• Susan Mockenhaupt (202) 205-1007• Lynne Westphal, North Central Research Station (847) 866-9311x11www.fs.fed.us/spf/coop/ucf_general.htm
Leadership in Energy and Environmental Design (LEED)www.usgbc.org/LEED/LEED_main.asp
Non-Profit OrganizationsAmerican ForestsGary Moll, Vice President for Urban ForestryCheryl Kollin Director for Urban Forestry P.O. Box 2000Washington, DC 20013Phone: (202) 955-4500www.americanforests.org
Center for Watershed Protection (CWP)Tom Schueler, Executive Director8391 Main StreetEllico� City, MD 21043Phone: (410) 461-8323www.cwp.org
Cherry Creek Stewardship PartnersChris Rowe, Executive Director810 A Union StreetGolden, CO 80401Phone: (303) 291-7437www.cherry-creek.org
Chesapeake Bay CommissionAnn Swanson, Executive Director 60 West StreetSuite 200Annapolis, MD 21401 Phone: (410) 263-3420www.chesbay.state.va.us
The Conservation FundEd McMahon, Vice President1800 North Kent StreetSuite 1120Arlington, VA 22209Phone: (703) 525-6300www.conservationfund.org
Council of Infrastructure Financing AuthoritiesRichard Farrell, Executive Director805 15th Street NW Suite 500Washington DC 20005Telephone: (202) 371-9694Fax: (202) 371-6601www.cifanet.org
Friends of the RappahannockP.O. Box 7254 Fredericksburg, Va 22404 Phone (540) 373-3448 Fax (540) 373-8111h� p://for.communitypoint.org
Appendix – 53

Groundwater FoundationP.O. Box 22558Lincoln, NE 68542-2558Phone: (402) 434-2740www.groundwater.org
International City/County Management Association (ICMA)777 North Capitol Street, NESuite 500Washington, DC 20002Phone: (202) 289-4262www.icma.org
Iowa National Heritage FoundationMark Ackelson, Executive Director505 5th AvenueSuite 444Des Moines, IA 50309Phone: (515) 288-1846www.inhf.org/index.html
Know Your WatershedConservation Technology Information Center1220 Po� er Drive Suite 170 West Lafaye� e IN 47906Phone: (765) 494-9555www.ctic.purdue.edu/KYW
Local Government Environmental Assistance NetworkICMA777 North Capitol Street, NESuite 500Washington, DC 20002Phone: (202) 962-3622www.lgean.org
Low Impact Development CenterNeil Weinstein, Director5010 Sunnyside AvenueSuite 200Beltsville, MD 20705Phone: (301) 982-1781www.lowimpactdevelopment.org
National Association of Counties (NACO)440 First Street, NWWashington, DC 20001Phone: (202) 393-6226www.naco.org
National Association of Local Government Environmental Professionals (NALGEP)1333 New Hampshire Avenue, NWWashington, DC 20036Phone: (202) 638-6254www.nalgep.org
Natural Resources Defense CouncilNancy Stoner, Director of Water Programs1200 New York Avenue, NWSuite 400Washington, DC 20005Phone: (202) 289-6868www.nrdc.org
The Nature Conservancy of California201 Mission Street, 4th FloorSan Francisco, CA 94105-1832Phone: (415) 777-0487Fax: (415) 777-0244www.tnccalifornia.org/news/pr_04.asp
New Jersey Environmental Infrastructure Trust3131 Princeton PikeBldg 6, Suite 201Lawrenceville, NJ 08638Phone (609) 219-8600Fax (609) 219-8620www.njeit.org/index2.html
Nonpoint Education for Municipal Offi cials (NEMO)Chester Arnold, DirectorMiddlesex County Extension Center1066 Saybrook RoadP.O. Box 70Haddam, CT 06438Phone: (860) 345-4511www.nemo.uconn.edu
Northeast-Midwest Institute (NEMW)218 D Street, SEWashington, DC 20003Phone: (202) 464-4019www.nemw.orgFinancing Brownfi eld Cleanup and Redevelopment: • www.nemw.org/brownfi n.htmSmart Growth and the Clean Water Act: • www.nemw.org/SGCleanWater.pdf
Smart Growth America1200 18th Street, NWSuite 801Washington, DC 20036Phone: (202) 207-3350 www.smartgrowthamerica.org
Smart Growth Network (SGN)c/o International City/County Management Association 777 North Capitol Street, NE Suite 500 Washington, DC 20002Phone: (202) 962-3623www.smartgrowth.org
TreePeople2601 Mulholland DriveBeverly Hills, CA 90210Phone: (818) 753-4600Fax: (818) 753-4635www.treepeople.org
Trust for Public Land (TPL)Kathy Blaha, Vice President for National Programs660 Pennsylvania Avenue, SESuite 401Washington, DC 20003Phone: (202) 543-7552www.tpl.org
Urban Land Institute (ULI)1025 Thomas Jeff erson Street, NWSuite 500 WestWashington, DC 20007Phone: (202) 624-7000www.uli.org
Water Environment FederationWilliam Bertera, Executive Director601 Wythe StreetAlexandria, VA 22314Phone: (703) [email protected]
54 – Appendix

Private SectorJohn De VillarsExecutive Vice PresidentBrownfi elds Recovery Corp, Inc.137 Newbury Street7th FloorBoston, MA 02116Phone: (617) 267-8585www.brownrecov.com
ERG110 Hartwell Avenue Lexington, MA 02421-3136Phone: (781) 674-7200www.erg.com
Appendix – 55

References
American Forests, Trees Off er Signifi cant Benefi ts as Northwest Arkansas Popu-lation Grows, January 22, 2003lation Grows, January 22, 2003lation Grows
American Rivers, et al., Paving Our Way to Water Shortages: How Sprawl Ag-gravates Drought, American Rivers, the Natural Resources Defense Council, gravates Drought, American Rivers, the Natural Resources Defense Council, gravates Droughtand Smart Growth America, August, 2002
Earth Day Coalition, Urban Sprawl in Northeast Ohio, 2001, Earth Day Co-alition, Cleveland, OH, 2001
Stigall, Ed, Measurement of Phosphorus Water Quality Accomplished Through Smart Growth, ERG, 2002
Trust for Public Land, Local Greenprinting for Growth, Volume IV, 2003
Trust for Public Land and Land Trust Alliance, Land Vote 2002: Americans Invest In Parks and Open Space, Boston, MA, 2003Invest In Parks and Open Space, Boston, MA, 2003Invest In Parks and Open Space
U.S. Department of Agriculture Forest Service, Pacifi c Northwest Research Station, Connecting People with Ecosystems in the 21st Century: An Assessment of Our Nation’s Urban Forests, John F. Dwyer, David J. Nowak, MaryHeather No-Our Nation’s Urban Forests, John F. Dwyer, David J. Nowak, MaryHeather No-Our Nation’s Urban Forestsble and Susan M. Sisinni, General Technical Report PNW-GTR 490, August 2000. www.fs.fed.us/pnw/pubs/gtr490/gtr490.pdf
U.S. EPA, 1999, Transportation and Environmental Analysis of the Atlantic Steel Development Project, United States Environmental Protection Agency, No-Development Project, United States Environmental Protection Agency, No-Development Projectvember 1, 1999, prepared by Hagler Bailly
U.S. EPA, 2000, Deposition of Air Pollutants to the Great Waters: A Third Re-port to Congress, Offi ce of Air Quality and States Planning and Standards, port to Congress, Offi ce of Air Quality and States Planning and Standards, port to CongressUSEPA, Research Triangle Park, NC, June 2000, EPA-453/R-00-005
U.S. EPA, 2001(a), Our Built and Natural Environments: A Technical Review of the Interactions between Land Use, Transportation, and Environmental Quality, the Interactions between Land Use, Transportation, and Environmental Quality, the Interactions between Land Use, Transportation, and Environmental QualityDevelopment, Community, and Environment Division, USEPA, Washing-ton, DC, January 2001, EPA 231-R-01-002
U.S. EPA, 2002(a), National Management Measures to Control Nonpoint Source Pollution from Urban Areas – Dra� , Offi ce of Wetlands, Oceans, and Watersheds, USEPA, Washington, DC, July, 2002, EPA 842-B-02-003
U.S. EPA, 2002(b), Low Impact Development (LID): A Literature Review, Offi ce Low Impact Development (LID): A Literature Review, Offi ce Low Impact Development (LID): A Literature Reviewof Water, USEPA, Washington, DC, October 2000, EPA-841-B-00-005).
56 – Appendix

ABOUT THE AUTHORS
Kathleen A. Blaha, Trust for Public Land, is a Senior Vice President for the Trust for Public Land (TPL), directing programs with TPL’s forty fi eld offi ces that help public agencies use land conservation to manage growth and protect key resources. Before coming to TPL, Ms. Blaha worked as a water resource planner for the regional Council of Governments in Raleigh, North Carolina. Ms. Blaha has a B.A. in Geography from Miami University in Oxford, Ohio and a Master of Regional Planning from the University of North Carolina at Chapel Hill. She currently sits on the Boards of the Severn River Land Trust in Annapolis, Maryland; the Washington Area Bicycling Association; and the Capitol Hill Business Improvement District in Washington, D.C.
Jessica Cogan, NALGEP, is a Senior Governmental Aff airs Specialist with the national law and government aff airs fi rm Spiegel & McDiarmid and a Senior Policy Coordinator for the National Association of Local Government Environmental Professionals. Jessica handles NALGEP’s smart growth projects focusing on water quality issues and business partnerships. Prior to joining NALGEP, Jessica served as the Chief of Staff for the Maryland Governor’s Offi ce of Smart Growth. Previously, Jessica served as the Director of Program and Policy Coordination at the Maryland Department of Planning. Before arriving in Maryland, Jessica was Deputy Director of the Urban and Economic Development Division at the U.S. Environmental Protection Agency. Jessica also worked with the National Estuary Program and other watershed programs in the Offi ce of Wetlands, Oceans, and Watersheds, U.S. EPA. Jessica earned a B.A. in Marine Aff airs from the University of Rhode Island and a Master of Regional Planning from the University of North Carolina at Chapel Hill.
Linda Stein, ERG, is a Senior Project Manager working on numerous projects geared towards local and state offi cials and communities covering a wide range of environmental topics, including risk communication, environmental management, brownfi elds, and watershed protection. Linda has also served as an elected offi cial on a municipal Board of Health and as a volunteer on her local Open Space Commi� ee. She has an M.S. in Environmental Health/Environmental Policy from Tu� s University.
Ma� Ward, NALGEP,Ma� Ward, NALGEP,Ma� Ward, NALGEP is a partner with the national law fi rm Spiegel & McDiarmid, and serves as counsel and project manager for the National Association of Local Government Environmental Professionals. Ma� provides legal and government aff airs services to local governments on ma� ers including brownfi elds, Superfund, growth management, Clean Air Act and Clean Water Act compliance, permi� ing, community development, and congressional appropriations. He is the co-author of Building a Brownfi elds Partnership from the Ground Up, Profi les of Business Leadership on Smart Growth, Profi les of Clean Air Innovation, Recycling America’s Gas Stations, and several articles on environmental protection. Ma� is an elected member of the City Council of Charles Town, West Virginia. He graduated from American University, and the University of Virginia School of Law.

The Trust for Public Land660 Pennsylvania Ave. S.E., Suite 401Washington, D.C. 20003Phone: 202.543.7552Fax: 202.544.4723Web: www.tpl.org
ERG110 Hartwell AvenueLexington, MA 02421
Phone: 781.674.7200 Fax: 781.674.2851
Web: www.erg.com
National Association of Local Government Environmental Professionals1333 New Hampshire Avenue, NW
Washington, DC 20036Phone: 202.638.6254
Fax: 202.393.2866E-mail: [email protected]
Web: www.nalgep.org
I believe water is the biggest environmental challenge we face in the 21st century in terms of both quantity and quality. As we celebrate the 30th anniversary of the Clean Water Act, I commend NALGEP and the Trust for Public Land for showcasing some of the innovative clean water partnerships across America that will help us meet that challenge.
Governor Christine Todd WhitmanAdministrator, Environmental Protection Agency
The land-water connection is the key to health and quality of life in our local communities, and cities like Charlo� e are eager to pursue new approaches to smart growth and clean water together with NALGEP, the Trust for Public Land, and our local, state, and federal partners.
Mayor Patrick McCroryCity of Charlotte, North Carolina
Smart Growth and land conservation tools such as brownfi elds redevelopment, community and urban forestry, low impact development, and watershed management require strong partnerships to be successful. The case studies in this report illustrate the clean water successes a� ained through partnerships of all levels of government, the business community, and the non-profi t sector.
Will RogersPresident, Trust for Public Land
}
}
}
~
~
~