Embed Size (px)
Citation preview
SMART GRID A ROAD TO GREEN AND SMART FUTURE
Submitted to
Power Grid Corporation of India Limited
By PRATEEK DIWAN21st May through 22nd June 2012

AKNOWLEDGEMENT
I am extremely thankful to the management of Power Grid Corporation of India Ltd who provided me an
opportunity to intern with them for a period of four weeks from 21st May through 22nd June 2012. My
appreciations are for Shri. Y.K. Saighal, Executive Director (SEF, CE & IT), Smart Grid, and Mr. Ankit
Rastogi, Officer Special Task Force, Smart Grid, without whom I would not have learnt several
intricacies involved on the project of Smart Grid.
I am also grateful to Shri. SR Sethi, Advisor (Power), University of Petroleum & Energy Studies who
had provided me with many reports, publications and articles on Smart Grids.
This report is submitted to Powergrid as a part of requirement of this internship assignment.
Sincerely,
Prateek DiwanB.Tech (Electrical Engineering)Clemson University, Clemson, USA
2 | Page

CONTENTS
1. CHAPTER 1
1 INTRODUCTION TO COMPANY2 INTRODUCTION–SMART GRID3 BASIS OF SMART GRID4 EMS (ENERGY MANAGEMENT SYSTEM)5 RTU (REMOTE TERMINAL UNIT)
2. CHAPTER 2
1 SMART GRID IN POWER SECTOR2 SMART GRID IMPLEMENTATION SRTATEGY3 STEPS IN EVOLUTION OF SMART GRID4 PILLARS OF SMART GRID5 CUSTOMER RELATIONS MANAGEMENT6 REQUIRED MEASURES3. CHAPTER 3
1 WIDE AREA MANAGEMENT SYSTEMS (WAMS)2 DIFFERENCE BETWEEN WAMS AND EXISTING SYSTEMS3 UTILIZATION OF PMU DATA4 ADVANTAGES OF WAMS
4. CHAPTER 4
1 SECURITY CHALLENGES IN SMART GRID2 INTEGRATION CHALLENGES GIVEN BY MANY EXPERTS3 INITIATIVES FOR SMART GRID4 PILOT PROJECTS IN INDIA5 SMART GRID FOR TRANSMISSION NETWORK6 ON-GOING SMART GRID ACTIVITIES IN INDIA
5. CHAPTER 5
1 CONCLUSIONS2 RECOMMENDATIONS
6. ANNEXES1 BIBLIOGRAPHY
3 | Page
CHAPTER 1> Introduction – Smart Grid> Basis of smart grid
• Communication• Information Technology
> Energy Management System> Remote Terminal Unit
4 | Page
1.1 INTRODUCTION TO COMPANY
SERVICES OFFERED:
• UPSTREAM OIL & GAS E&P• FUEL TRADING & MANAGEMENT• RENEWABLE ENERGY & BIOFUELS• MARKETING & TECHNICAL SUPPORT• PROJECT MANAGEMENT• ENERGY INFRASTRUCTURE• ADVISORY & CONSULTANCY SERVICES• EXECUTIVE PLACEMENT & OUTSOURCING
5 | Page
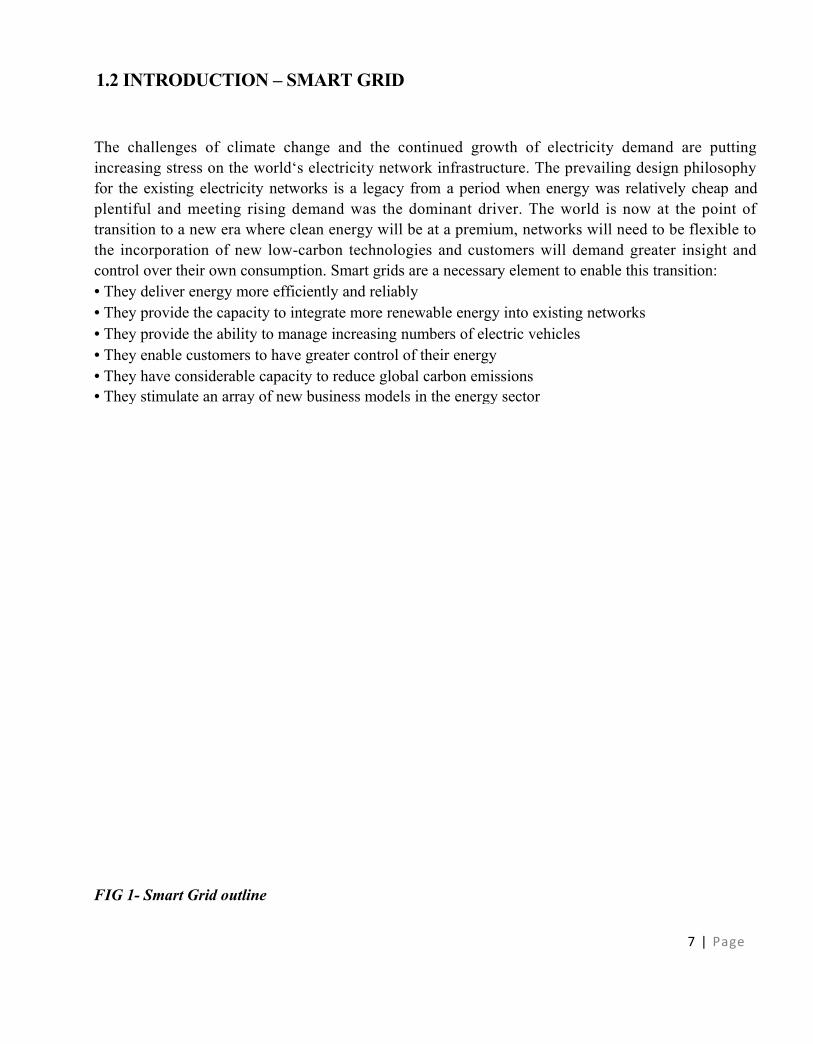
1.2 INTRODUCTION – SMART GRID
The challenges of climate change and the continued growth of electricity demand are putting increasing stress on the world‘s electricity network infrastructure. The prevailing design philosophy for the existing electricity networks is a legacy from a period when energy was relatively cheap and plentiful and meeting rising demand was the dominant driver. The world is now at the point of transition to a new era where clean energy will be at a premium, networks will need to be flexible to the incorporation of new low-carbon technologies and customers will demand greater insight and control over their own consumption. Smart grids are a necessary element to enable this transition:• They deliver energy more efficiently and reliably• They provide the capacity to integrate more renewable energy into existing networks• They provide the ability to manage increasing numbers of electric vehicles• They enable customers to have greater control of their energy• They have considerable capacity to reduce global carbon emissions• They stimulate an array of new business models in the energy sector
FIG 1- Smart Grid outline
7 | Page
In addition to noting the benefits, it is worth recognizing the potential impact of inaction: without smart energy infrastructure, the integration of intermittent renewable energy supply and the charging requirements for electric vehicles have the potential to put the stability of the energy system at risk. Even at relatively low penetration levels, these technologies could cause instability and increased risk of outages. By acting now, decision makers can avoid having the electricity infrastructure become a bottleneck to delivering a lower-carbon future.
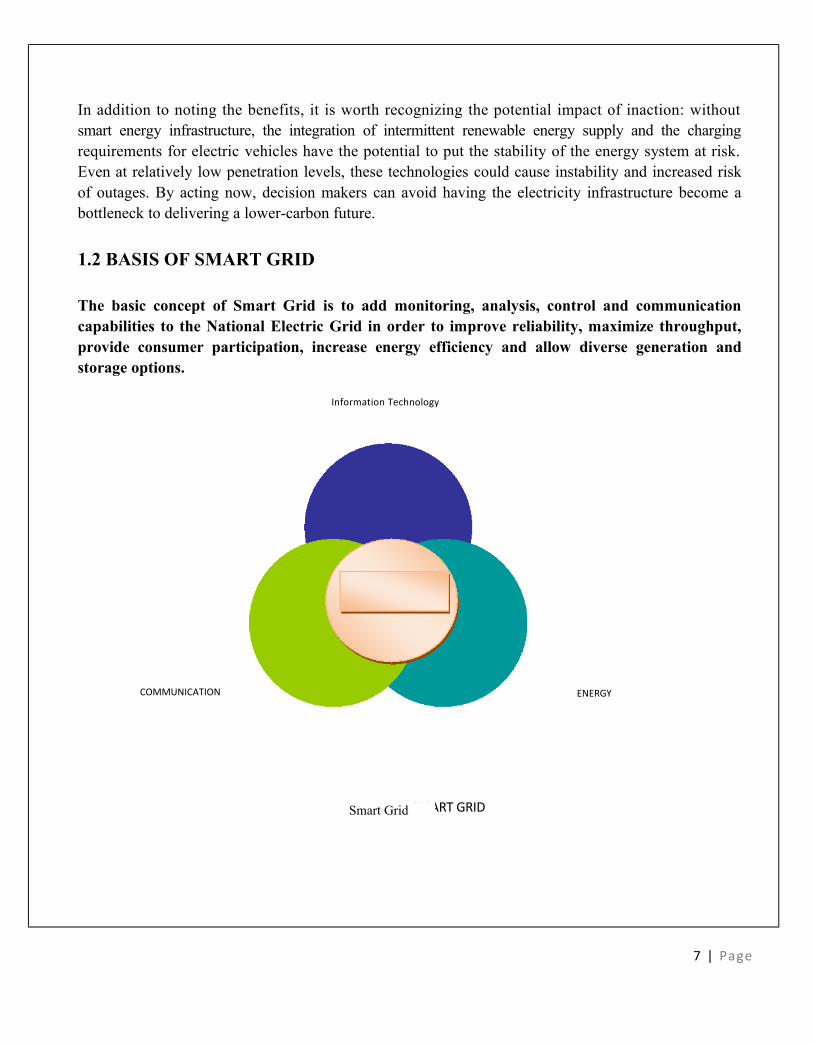
1.2 BASIS OF SMART GRID
The basic concept of Smart Grid is to add monitoring, analysis, control and communication capabilities to the National Electric Grid in order to improve reliability, maximize throughput, provide consumer participation, increase energy efficiency and allow diverse generation and storage options.
Information Technology
COMMUNICATION
7 | Page
ENERGY
SMART GRIDSmart Grid

FIG 2- Basis of Smart GridSmart grid technology will bring together the advancements in the IT and Telecommunications sector – embedded sensing, computing and ubiquitous communications – to deliver a safer, more efficient and more resilient energy system. Not dissimilar to the Internet, this smart grid will act as a backbone infrastructure, enabling a suite of new business models, new energy management services and new energy tariff structures.
The smart grid will enhance the way that utility companies manage assets and offer consumer-relevant products and services, how consumers interact with their energy supply, and how governments respond to the challenge of maintaining security of supply and reducing carbon levels while managing costs of energy delivery. However, a number of factors are holding back this transition and may ultimately act as a limiting factor to the broader drive to reduce greenhouse gas emissions.EU: A Smart Grid is an electricity network that can intelligently integrate the actions of all users connected to it – generators, consumers and those that do both – in order to efficiently deliver sustainable, economic and secure electricity supplies.
US DOE: A grid that is ―Intelligent, Efficient, Accommodating, Motivating, Opportunistic, Quality-
focused, Resilient, Green‖ The earliest use of the adjective ―Smart
‖ was connected with revenue
meters which can communicate in both directions and offer variable rates, control of household appliances, etc.
1.3.1 COMMUNICATION
Communication system has been installed in order to meet the following requirements for power system operation.
1. Speech transmission for power system operation and control and administrative uses.
2. Data Transmission for telemetry, remote control and file transfer ( data transmission from all
major Generating stations and substations are transmitted to Sub LDCs/SLDCs and the RLDC to 8 | Page
provide real time indication of system condition and equipment status for system monitoring and control.
3. Facsimile transmission
1.3.1.1 TYPES OF COMMUNICATION SYSTEMS
Under ULDC project, following types of Communication Systems has been deployed depending upon the requirement:
• RTU to Sub-LDC: Power Line Carrier Communication (PLCC)
• Sub-LDC to SLDC: FO/MW (Wideband communication system)
• SLDC to RLDC: FO/MW (Wideband communication system)
• If RTU is Located at wideb and location FO/MW will be used.
9 | Page
1.3.1.2 COMMUNICATION NETWORK DESIGN CRITERIA
The design requirements of telecommunication systems used by electric utilities differ from those used by public telecommunication network facilities because usage is different. In designing the telecommunication system to support MSETCL requirements, the following criteria have been used:
(a) High Reliability: The system should be engineered to provide high reliability with minimum loss of communication by selecting proven hardware and using proven methods of communication.
(a) High Availability: The system should suffer only minimum degradation in the event of circuits failing due to media shortcomings, and care should be taken to provide alternative route of speech & data wherever it is economically feasible.
(b) Rapid Response: The system should offer quick response to changes in measured values by keeping the update time within specified limits.
(c) Economy: The system should be engineered to provide the required performance in an economical manner.
(d) Flexibility: The communication network should have enough flexibility to changed requirements and future augmentation programs. The network should itself be capable of being easily changed to embrace these new requirements.
(e) Maintainability: The network should use methods which make minimum demands for maintenance. Also, adequate provision of spares should be allowed to ensure quick remedial action of any fault at any station within the network.
1.3.1.3 TYPES OF COMMUNICATION
1.3.1.3.1 Power Line Carrier Communication (PLCC)
This is the conventional system operating between 50 to 500 kHz and is usually implemented with the high voltage transmission lines. The technology is uneconomical and is not suitable for distribution networks. Moreover, PLCC provides very limited bandwidth and is not suitable where the requirement of voice and data channels is large. However, with the advent of Digital PLCC the bandwidth gets improved and can go up to 256 Kbps but there is a requirement of continuous high bandwidth, high SNR and new frequency pairs.
10 I P a g e
11 I P a g e
CKT-IE/W E/WR V
R V
B B
CVT/CC
LM U LM ULM ULM U
BT CD BT CD
P1CC P1CCP1CCP1CC
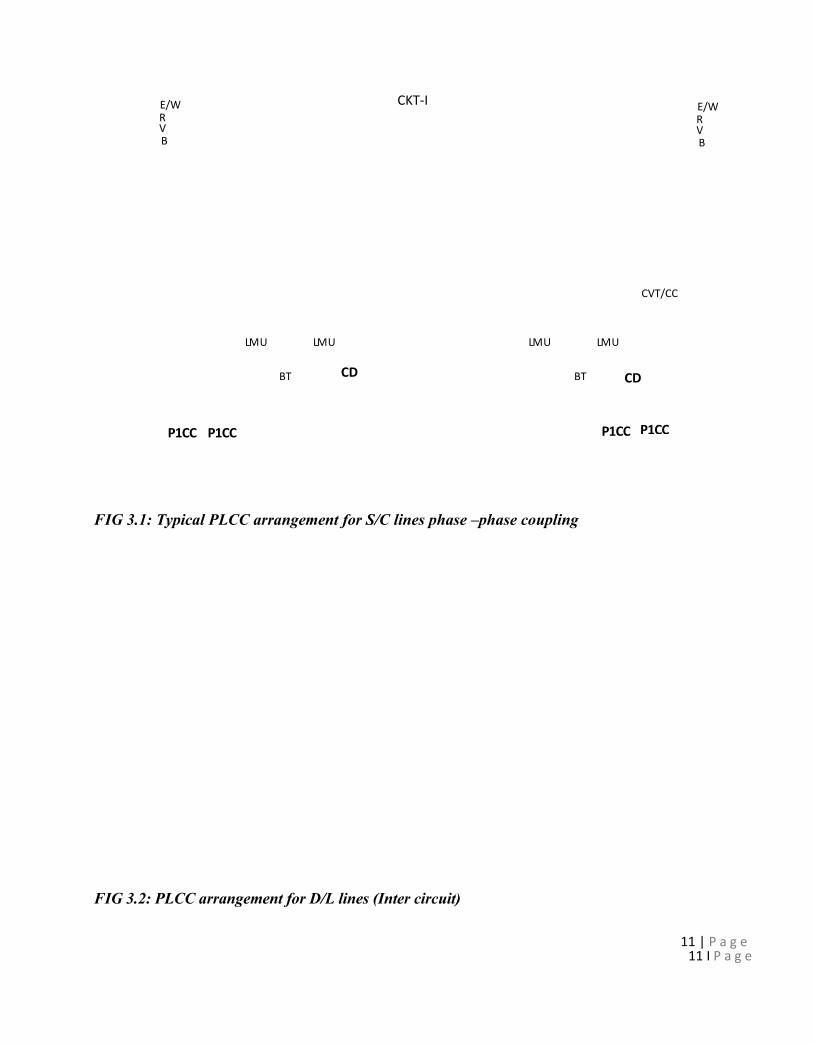
FIG 3.1: Typical PLCC arrangement for S/C lines phase –phase coupling
FIG 3.2: PLCC arrangement for D/L lines (Inter circuit)
11 | P a g e
12 I P a g e
1.3.1.3.2 Digital Microwave
The Microwave system is in use for several years. The systems are available in various frequency bands, typical being 2 GHz./ 7 GHz & 10 GHz. This system works on point- to- point link basis. This system has the advantage that it does not require any right of way and works on the line of sight principle. These systems are more used where no right of way is there or the terrain is difficult and widely spread. However, Microwave communication requires high rise towers for antenna installation. The reliability of the system is also low wherever water bodies and hilly terrain are encountered. The establishment of such network requires clearances from various authorities, SACFA and has high annual recurring expenditure towards license fee & royalty charges.
1.3.1.3.3 Fiber Optics Communication
Power Utilities throughout the world are making increased use of Optical Fibre technology for their telecommunication requirements considering readily available Right of Way. Optical Fibre technology not only provides an efficient telecommunication network to support their own telecommunication needs but also provides scope for external business opportunities. A privately owned optical fibre network may readily become a suitable asset for building a profitable external telecommunication business.
Optical Fiber technology offers certain high performance features and most commonly used communication on backbone network in view of following:
1) High reliability with self-healing capability,
2) free from noise,
3) EMI immune,
4) Very low loss (less than 0.25dB/km),
5) Higher transmission rates/ channel capacity,
6) Better maintainability,
7) Longer repeater-less distances as compared with Microwave technology.A smart grid system could be constructed from just one of these telecommunications technologies, but a utility will often use two or three in order to add more reliability to its service territory coverage. 1.3.2 INFORMATION TECHNOLOGY
The head-end system is the apex node of the network; it consists of the telecommunication system and field devices. The role and function of the head-end system vary depending on the system‘s application (for example, metering for billing, SCADA, automatic generation control with economic
dispatch, metering for load research, demand-side and load management, load shedding, disconnection and reconnection as part of billing, energy accounting, and SAIDI, SAIFI, and CAIDI indices).
The size of the head-end system is usually in proportion to its position within the utility hierarchy, with systems at the apex usually being the largest. System size (number of file servers, amount of storage, etc.) decreases for systems in the second and third tiers of the hierarchy.
This combination of growing technology in distribution management and operations is leading to an emerging need to support the integration of micro grids, open-access, energy systems, and the use of network-controlled devices, and hence, a need for a converged security infrastructure for all. The first priority is securing these assets of electric power delivery systems, from the control center to the substation, to the feeders and even to the customer meters. This will require an end-to-end secure infrastructure that protects the web of communication assets (control center-based SCADA, RTUs, PLCs, power meters, digital relays and bay control) used to operate, monitor and control power flow and measurement
Following functions are generally included in the SCADA software:-1) Data Acquisition2) Data Processing3) Real Time Calculation
4) Time Synchronization5) Sequence of Events Recording (SOE).6) Supervisory Control7) Configuration Management for minimum loss
1.4 EMS (ENERGY MANAGEMENT SYSTEM)
An energy management system (EMS) is a system of computer-aided tools used by operators of electric utility grids to monitor, control, and optimize the performance of the generation and/or transmission system. The monitor and control functions are known as SCADA. The computer technology is also referred to as SCADA/EMS or EMS/SCADA. In these respects, the terminology EMS then excludes the monitoring and control functions, but more specifically refers to the collective suite of power network applications and to the generation control and scheduling applications.
In a slightly different context EMS can also refer to a system in an organization to achieve energy efficiency through well laid out procedures and methods, and to ensure continual improvement, which will spread awareness of energy efficiency throughout an entire organization.
13 I P a g e
1.4.1 EMS FUNCTION:
1. Operating Scheduling Functions
2. Generation Dispatch Functions3. Power System Analysis Function
1.4.2 BENEFITS OF ENERGY MANAGEMENT SYSTEMS
1. Dynamic planning for reliable system operation.
2. Real time evaluation of impact of possible contingencies on the system.3. Preventive action to ensure system stability.4. Quick restoration of Grid in case of Disturbance.5. Operation of System at its full capacity through continuous contingency analysis.6. Real time environment for training dispatches to cope with contingencies.
1.5 RTU (REMOTE TERMINAL UNIT)
An RTU, or Remote Terminal Unit is a microprocessor controlled electronic device which interfaces objects in the physical world to a distributed control system or SCADA system by transmitting telemetry data to the system and/or altering the state of connected objects based on control messages received from the system.
1.5.1 MAIN FUNCTIONS
• Data Collection• Data Processing
• Time stamping
• Supervisory control command
• Disturbance Recording
• Communication with Master Station
• Communication with Peripheral Devices- Local HMI (Human Machine Interface)- Local Printer- V D U
• Communication with IEDs
• Data Concentrator
• Automation Functions for Substation• Communication/ Synchronization with Distributed Rack
14 I P a g e
15 I P a g e
FIG 4 R TU Image (Typical)
1.5.2 SALIENT FEATURES OF RTU• Support for Distribution I/O‘s
• Modular design
• Al Designed to support wide range of Transducer Output (DC Current/Voltages)
• Sequence of Events (SOE)• Multi Port• Multiple Protocols
• High Stability Internal Clock (Accuracy < 3.6ppm)
• Support for Local / Master station time Synchronization
• Self / Remote Diagnostic
• Configuration down loading capability
• Local MMI• Support Programmable Ladder, Latching Logics for closed loop control
• Data Concentrator
• Redundant Configuration
• Disturbance Recorder
15 I P a g e
CHAPTER 2
> Smart Grid in Power Sector> Smart grid implementation strategies
> Steps involved in evolution of smart grid> Pillars of smart grid> Customer relationship management> Other Measures

2.1 SMART GRID IN POWER SECTOR
The transition towards a smart grid can be driven by a number of factors, some or all of which may apply to varying degrees. However, the hierarchy of needs will vary from country to country, region to region and even circuit to circuit, based on the legacy network that exists and the ambitions of local policy-makers. In some cases, reliability may dominate the list of outcomes due to challenges faced by an ageing infrastructure; however, in another area, the drive to incorporate plug-in hybrid electric vehicles and distributed generation and storage may be dominant. In these instances, different physical architectures might evolve that are optimized to the local need. Over time, needs may change and therefore the design philosophy will need to embrace the concepts of flexibility, modularity, scalability and forward compatibility.To highlight the issue of variability in vision and design, a number of smart grid archetypes have been outlined to highlight how changes in the hierarchy of needs may lead to smart grids that are optimized to prioritize certain functionality. These are not intended as a menu of designs, but simply as a demonstration of their potential diversity. In each case, policy-makers and regulators will need to define their hierarchy of needs and then work with the incumbent utility to define the journey that takes them from where they currently are to where they want to be. In each case, the transition will need to be defined to allow a gradual layering of capabilities that will lower the impact on the incumbent utility and deliver the best value for the customer.Smart grid implementation in Transmission, Distribution and System Operation will be marked with different updation and introduction.
17 I P a g e
“Ultimately, smart gridsempower consumers byproviding unprecedented visibility and control over energy usage and will change the way we all think about and buy well as the environment.”

18 I P a g e
2.2 SMART GRID IMPLEMENTATION SRTATEGY
18 I P a g e

2.3 STEPS IN EVOLUTION OF SMART GRID
20 I P a g e
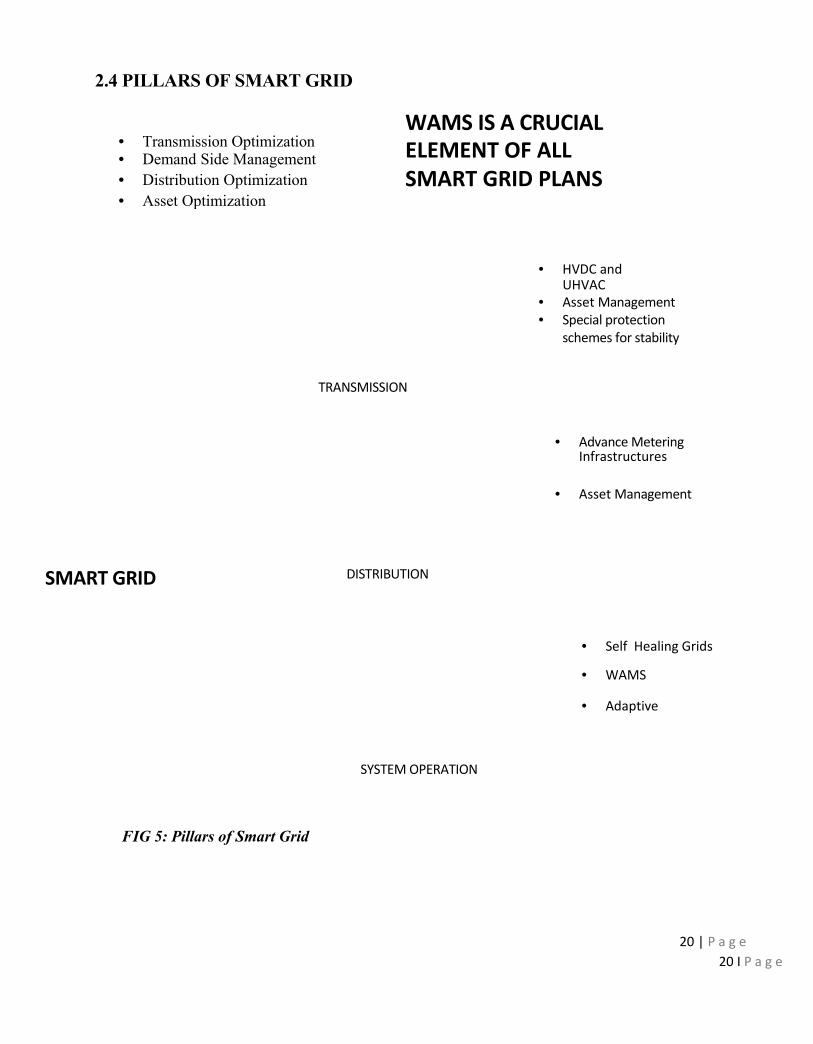
2.4 PILLARS OF SMART GRID
• Transmission Optimization• Demand Side Management• Distribution Optimization• Asset Optimization
WAMS IS A CRUCIALELEMENT OF ALLSMART GRID PLANS
• HVDC andUHVAC
• Asset Management• Special protection
schemes for stability
TRANSMISSION
• Advance MeteringInfrastructures
• Asset Management
DISTRIBUTIONSMART GRID
• Self Healing Grids
• WAMS
• Adaptive
SYSTEM OPERATION
FIG 5: Pillars of Smart Grid
20 | P a g e
2.4.1 TRANSMISSION
• Use of Flexible AC Transmission system like Series Compensation, TCSC, SVC etc. for increase in power transfer capacity & maintaining critical grid parameters
• Wide Area Monitoring (WAMS), PMUs for real time monitoring & visualization.
• Adaptive Islanding, Self-Healing
• HVDC Transmission
• Use of High temperature endurance conductor such as INVAR
• More MW per meter of RoW
• Gas Insulated S/s (GIS) for optimization of S/s space in urban areas
• Substation Automation
FIG 6 : Electrical and Communication Interface
2.4.2 SYSTEM OPERATION
• Fault Current Limiting
• Wide Area Monitoring and Visualization and Control
• Dynamic Capability Rating
• Flow Control
• Adaptive Protection
• Automated Feeder Switching
• Automated Islanding and Reconnection
• Automated Voltage and VAR Control
• Diagnosis and Notification of Equipment Condition
• Enhanced Fault Protection
2.4.3 DISTRIBUTION
• Advanced Metering
o Traditional meter reading
o Usage Profiling
o Remote Connect! Disconnect
o Outage! Restoration Reporting | Remote meter reading
• Traditional Sub-station Automation
• Video Monitoring
• Work-force Mobility
• SCADA System (Expanded)
• Transformer Monitoring (DT level)
• Capacitor Bank Control
• Voltage Monitoring
• Reclose Automation
22 I P a g e
23 I P a g e
2.4.4 SMART GRID AT CONSUMER LEVEL
• Informed Consumer• Energy Efficiency
• Dynamic Pricing• Demand Response
• Distributed Generation• Distributed Storage
• Smart Charging of EV
2.4.5 COMMUNICATION REQUIRED
• The DMS solution includes communication from Control Room till• Sub-station level (WAN)
• The additional requirement:
• Sub-station to Consumer premises (NAN)
• Within Consumer premises (HAN)
FIG 7 : Smart Grid in Transmission, Distribution & Generation
23 I P a g e
2.5 CUSTOMER RELATIONS MANAGEMENT
Customer management, particularly regarding increased availability and reduced commercial losses, is key driver for the smart grid. India has a long way to go in customer management because most of its distribution companies are in various stages of updating and organizing their customer information. Under R-APDRP they are investing in business applications that will help integrate the various pieces of customer information over various customer databases.
Utility customers are becoming more demanding and impatient. They expect utilities to produce such benefits as:
Reduced outages
Lower bills
Increased awareness and control over energy consumption through better information on usage patterns (the telecom industry has achieved something akin to this)
More choices for energy sources along with options to supply energy to the grid
More green and renewable choices to increase environmental sustainability
Integrating customer relations management (CRM) and advanced metering infrastructure (AMI) data will be a key enabler here, as it will help derive the benefits of optimized capacity utilization and system performance. Up-to-date load data at each feeder section are required along with customer load profiles in order to develop auto fault detection, location isolation, and service restoration. In addition such data will help evolve fault isolation and service restoration switching sequences for premium customers. This integration will also enable utilities to set up quick response teams that will improve demand response (DR) and lead to the integration of AMI/DR in systems planning and engineering. Coincident load data for optimized load balancing and the potential for using AMI for end voltage monitoring will help complete the load profile data for estimating and minimizing technical losses.
Currently meter vendors in many Indian states own the meter data. A holistic approach for meter data management will help bridge this gap and build the ability to conduct end voltage monitoring. Thus, knowledge of customers‘ profiles with their usage requirements and patterns is critical for utilities wishing to implement a smart grid.
Complete knowledge of customers and their needs will also allow utilities to influence consumers to shift peak demand consumption and protect customers from over-consumption. In addition, it will enable utilities to help customers comply with contract fulfillments, environmental and security regulations. This, in turn, will help utilities to manage their assets, improve customer service, and control costs.
An important aspect of CRM is customer awareness (education) and participation. Customers will be important stakeholders in the smart grid and they will need to be more aware of the risks involved. For example, unless availability-based tariff customers modify their usage patterns, they will see higher bills. Also, because smart meters will be more accurate than current electromechanical meters, customers‘ usage will be tracked more accurately and they may see higher bills. Last, the energy savings accrued through smart grids will need to be distributed and incentives to conserve energy will be needed. Customer participation will be important in all of these activities and will also help improve the smart grid‘s overall governance and utility-wide implementations.
2.6 REQUIRED MEASURES
2.6.1 Automated Call Centers
The infrastructure set up for automated call centers is being developed under the R-APDRP. These centers will allow utilities to integrate customer information, address customer queries and complaints, and provide basic information about office locations, billing information, bill payment centers, modes, connection status, service levels, planned outages, and information on efficiency programs, among others. These initiatives will help utilities measure and drive customer satisfaction, and make customers more aware of opportunities for energy efficiency. They will also help utilities track consumption patterns and payments. In addition, the databases maintained by the centers would enable quick-start smart grid implementations, through targeted programs for home area networks and smart appliances projects to increase availability and reduce commercial losses.
At present, the complaint handling process in India is weak, resulting in low customer satisfaction. However, these centers are helping build better processes and more accountability within the utilities.
2.6.2 Utility Portals
Utility portals (interactive websites that are linked to the call center databases and help customers log directly into websites) are being enhanced under R- APDRP. Their objectives are similar to those of the automated call centers and give customers another medium for interacting with the utility. The private utilities are leading in this area in India. Government-owned utilities are also implementing portals, but a few of these have failed due to a lack of training staff and integration of IT into the workflow. Because of this lack of integration, many state-owned utilities find it necessary to maintain a paper-based system as well, resulting in a duplication of effort.
2.5.3 Informing customers before and during meter change-out
The change-out of an existing meter is often a contentious issue for customers, especially when the new electronic meter registers a higher bill. The reasons why customers‘ bills can be higher after a
25 I P a g e
meter change-out are well known and are not repeated here. In addition, the customer may have to bear some of the costs of the change-out. For example, the customer‘s electrical installation may not comply with electrical safety codes, and the installation may have be the rehabilitated at the customer‘s expense.
A customer relations program is needed to alert customers to the upcoming meter change-out. It should spell out what the customer‘s rights are, explain the long-run benefits of smart meters, and describe how the change-out will be conducted.
2.6.4 Resolving bill complaints
When a new, accurate meter replaces an old, inaccurate or tampered meter, the customer will receive a higher bill. The customer relations program of the utility needs to be ready to address this collateral effect of the re-metering program.
2.6.5 Automatic meter reading
Automatic meter reading is often the most widely implemented smart system in a utility. Its contribution to making the grid smarter is that meter data are rapidly and accurately collected. Many countries have adopted this technology to save labor costs, but labor costs are not an important factor in India. However, in India, as in other countries, automatic meter reading facilitates the collection of data that are critical for utility planning and implementation. Such data also improve the inputs to the retail tariff structure, help with regulatory compliance, and help customers better understand their consumption and plan their usage accordingly.
2.6.6 Remote disconnects and reconnects
The remote disconnection and reconnection of customers who do not pay their bills is an extension of automated meter reading. The meter contains, or controls, a large contactor (relay) that disconnects or reconnects the customer from the head-end system, most often the billing system.
2.6.7 Outage monitoring and evaluation
SAIDI, SAIFI, and CAIDI are common measures of the power system network‘s availability and reliability. The collection of the field data to perform these measurements is time consuming, tedious, prone to arithmetic errors, and open to manipulation by personnel who collect the data. Smart devices on the distribution system (meters, reclosers, circuit breaker controllers, etc.) that are equipped with remote reading capability make the collection of field data automatic and accurate. This will help the utility improve its planning process and optimize the resources deployed in power restoration.
26 I P a g e
2.6.8 Mini-SCADA
In the past, the high cost and large size of RTUs for SCADA limited SCADA systems to the transmission network. As the size of RTUs increased and their cost decreased, SCADA is penetrating the distribution networks.
2.6.9 Demand-side management and load management
Like automated meter reading, demand-side management and load management have long been features of the utility system. As the cost of the field devices for demand-side and load management drops and their functionality increases, these devices will become increasingly integrated into customers‘ lives.
2.6.10 Renewable energy
Wind generation, small hydro, micro hydro, bio gas generation, bio gas fuel cells, solar and similar supply-side technologies need to be integrated into the power system network. Smart control devices are needed to connect these renewable energy sources to the power grid, and exchange information and commands with the energy dispatch center.
2.6.11 Differential tariff
Tariffs involve a sharing of some risks between the utility and the customer. During those times of the day when energy is cheap for the utility (early morning hours and weekends), the savings are passed on to the customer. When energy is expensive for the utility (peak times) the customer experiences the high cost. The objective is for customers to shift their utilization in response to a price signal,
For over two decades electronic static meters have been available to handle differential tariffs. In fact, they handle very complicated and very extensive tariffs (on peak, shoulder peak, and off peak; fixed and variable holidays; seasonal data capture; etc.). A difficulty that a smart grid can overcome is the effort needed to re-configure the meters on a regular basis, which will allow differential tariffs to change as rapidly as desired by the utility and customer. The smart grid, with its telecommunication link between the customer information (billing) computer system and the meter in the field, overcomes this.
2.6.12 Adaptive Islanding
At the transmission level, large sections of a utility, state, or region may be cut off from other sections in order to preserve the electrical system during major system disturbances and block cascading outages. These protection systems operate very fast, and keep generation and load in balance; when a generating unit trips, a corresponding block of load is immediately tripped. Within minutes other generators increase their output and when spinning reserve and frequency are strong, the load that was
27 I P a g e
shed is reconnected, usually within minutes. The philosophy behind this is to keep most of the electric system operating so that power can be restored quickly and efficiently.
The smart grid can do the same thing at the distribution level, rapidly isolating failed portions of the network and restoring service automatically and rapidly.
2.6.13 Capacitor control
Capacitor control in the distribution network has a direct and significant effect on customer satisfaction. It also improves utilities‘ financial performance by reducing a component of technical losses. If capacitor control is implemented poorly, there will be insufficient capacitor support during periods of high demand and low voltage (peak times), and over-compensation during periods of light load and high voltage (midnight to dawn, and weekends).
When integrated into a smart grid, advanced capacitor control by the utility (not the customer) allows the utility to provide the right amount of capacitor injection at the right time. This approach also removes a requirement on customers to install, operate, control, and maintain their own capacitors.
2.6.14 Demand response
Smart grid applications allow electricity producers and customers to communicate with one another and make decisions about how and when to produce and consume. This emerging technology will allow customers to shift from an event-based demand response where the utility requests the shedding of load, towards a more 24/7-based demand response where the customer sees incentives for controlling load at all times. Although this utility-customer dialogue increases the opportunities for demand response, customers are still largely influenced by behavioral as well as economic incentives and many have demonstrated reluctance to relinquish total control of their assets to utility companies.
One advantage of a smart grid application is time-based pricing. Customers who traditionally pay a fixed rate for kWh and kW/month can set their threshold and adjust their usage to take advantage of fluctuating prices. This may require the use of an energy management system to control appliances and equipment, and can involve economies of scale. Another advantage, mainly for large customers with generation, is being able to closely monitor, shift, and balance load in a way that allows the customer to save during times of peak load, not only kWh.
Smart grid applications increase the opportunities for demand response by providing real-time data to producers and consumers, but economic and environmental incentives remain the driving force behind this practice. The foundation for this would again be having accurate customer profiles with load, consumption pattern and asset data so as to be able to evolve customer segmentation and develop business cases for supporting each of those categories with different plans and incentives.
28 I P a g e
2.6.15 Flexible AC transmission system (FACTS)
In this technology high speed thyristors for switching in or out transmission line components such as reactors, capacitors and phase shifting transformer for some desirable performance of the system. Power flow between two systems interconnected through a tie line isThe various devices used in FACTS are
A) Controlled series compensation
B) Advanced controlled series compensationC) Static condenser (STATCON)D) Thyristor controlled phase shifting transformerE) Static Var Compensation (SVC)
In northern regional grid FATCS are installed in Kanpur- Ballabhgarh and Panki- Muradnagar lines to improve the power transfer capability of the lines by using controlled series capacitors (by reducing X).
2.6.16 Static Var Compensation (SVC)
Transmission lines both generate and absorb reactive power. Since the transmitted load varies considerably from one hour to another, the reactive power balance of the line varies as well. A rapidly operating Static Var Compensator (SVC) can continuously control dynamic power swings under various system conditions.
The main reasons for incorporating SVC in transmission and distribution systems are:
• To stabilize voltage in systems
• To reduce transmission losses and improves system power factor
• To increase the transmission capacity
• To increase the transient stability limit
• To improve voltage control and stability
• To increase damping of small disturbances
• To damp power swings
Static Var Compensation (SVC) devices are of four types
A) Thyristor controlled reactor (TCR)B) Thyristor switched capacitor (TSC)C) Combination of Thyristor controlled reactor (TCR) and Thyristor switched capacitor (TSC)D) Saturated reactors
29 I P a g e
The main difference between the SVC and STATCON is, in case of SVC devices the current injected into the system depends upon the system voltage whereas in STATCON current injected in the system is independent of the system voltage.
At present 400 kV Static Var Compensators (SVC’s) are installed in kanpur (2x + 140 MVAR). Vref for SVC’s varies from 390 kV to 410 kV. If the voltage at Kanpur is say 405 kV and Vref is 395kV than SVC ’s absorbs reactive power and vise-versa.
2.6.17 High voltage DC transmission system (HVDC)
National Thermal Power Corporation Limited built a 3000 MW coal-based thermal power station in the Sonebhadra District of Uttar Pradesh State. Part of the power from the Rihand complex is carried by the Rihand-Dadri HVDC bipolar transmission link (Pole-I and Pole-II), which has a rated capacity of 1500 MW at ±500 kV DC and some of the power is transmitted via the existing parallel 400 kV AC lines. These AC lines are as follows:
• 400kV Allahabad- Mainpuri line I
• 400kV Allahabad- Mainpuri line II• 400kV Lucknow- Muradabad• 400kV Unnao- Agra (up)
• 400kV Panki- Muradnagar
• 400KV Kanpur-Ballabgarh
• 400kV Kanpur- Agra (PG)
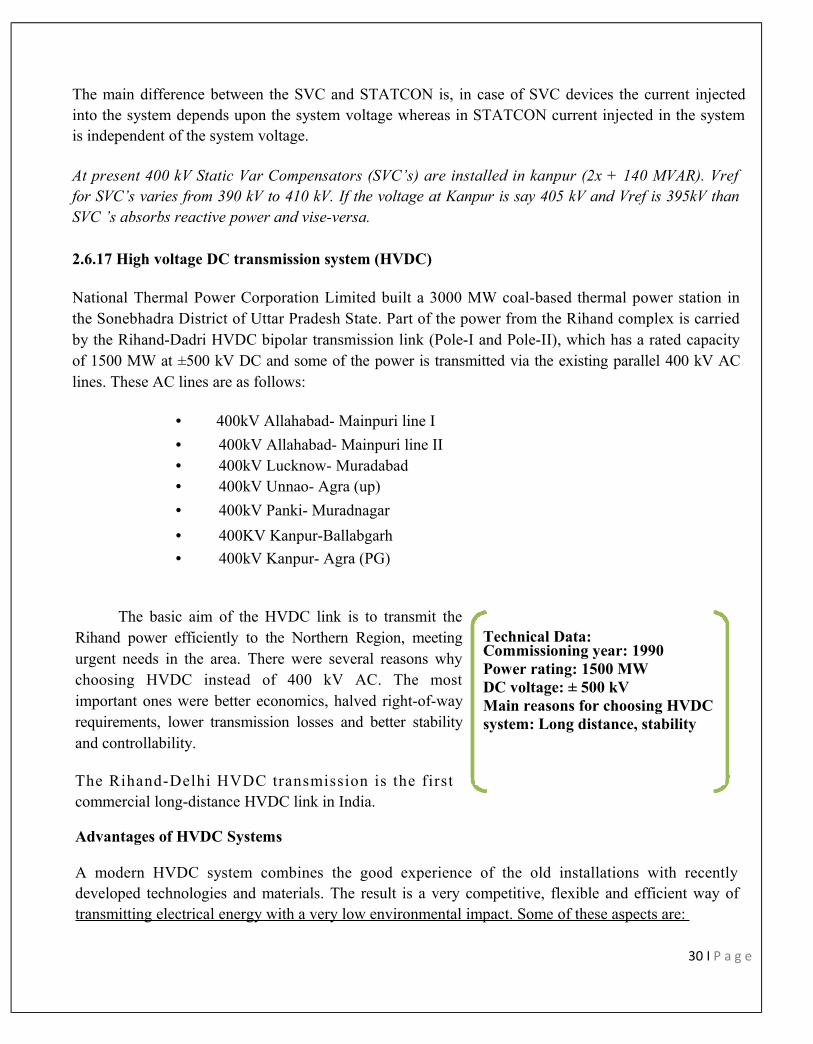
The basic aim of the HVDC link is to transmit the Rihand power efficiently to the Northern Region, meeting urgent needs in the area. There were several reasons why choosing HVDC instead of 400 kV AC. The most important ones were better economics, halved right-of-way requirements, lower transmission losses and better stability and controllability.
The Rihand-Delhi HVDC transmission is the first commercial long-distance HVDC link in India.
Advantages of HVDC Systems
A modern HVDC system combines the good experience of the old installations with recently developed technologies and materials. The result is a very competitive, flexible and efficient way of transmitting electrical energy with a very low environmental impact. Some of these aspects are:
30 I P a g e
Technical Data:Commissioning year: 1990Power rating: 1500 MWDC voltage: ± 500 kVMain reasons for choosing HVDC system: Long distance, stability
• No limits in transmitted distance due absence of charging current.
• HVDC carry more power for a given size of conductor then HVAC.• No skin effect• No compensation required, as DC line operates at unity power factor and charging current is absent.
• Less corona loss and less radio interference in DC system the in AC system. Corona and radio interference slightly decrease by foul weather condition (snow, rain or fog) in case of dc system whereas in case AC system they increases.
• Very fast control of power flow, which implies stability improvements, not only for the HVDC link but also for the surrounding AC system.
• Direction of power flow can be changed very quickly (bi-directionality) by reversing the polarity of direct voltage at both ends of the line while maintaining the sign of their algebraic difference.
• Two separate asynchronous AC systems can be only inter-connected by DC link.
• The need for ROW (Right Of Way) is much smaller for HVDC than for HVAC, for the same transmitted power. The environmental impact is smaller with HVDC.
• An HVDC link don´t increase the short-circuit power in the connecting point. This means that it will not be necessary to change the circuit breakers in the existing network.
• When DC is operated in parallel with Ac system the following objects can be achievedA) Constant Current FlowB) Constant Power FlowC) Constant angle between the AC Bus-Bar VoltagesD) Constant Voltage at either end
• HVDC transmissions have a high availability and reliability rate, shown by more than 30 years of operation.
31 I P a g e
CHAPTER 3
> WAMS(Wide Area Monitoring System)
• PMU• PDC
• Data Storage> Difference Between PMU’s And Existing System> Stages In Utilization Of PMU Data> Advantages Of WAMs
32 I P a g e
3.1 WIDE AREA MANAGEMENT SYSTEMS (WAMS)
Wide-area measurements in power systems have been used in EMS functions for a long time. Economic Dispatch, tie line bias control etc. all requires wide area measurements. These measurements are quasi-steady-state, non-simultaneous and relatively few in numbers. They are used to provide very specific information for very specific tasks. However, the birth of modern wide-area measurement systems can be traced back to a very significant event which took place in 1965.
First prototype of Phasor Measurement Unit (PMU) by Virginia Tech in 1983 Used in American Electric Power (AEP) and Bonneville Power Administrator (BPA) Utilities 1991 First Commercial PMU 1997 First Phasor Data Concentrator (PDC) by BPA developed
Increasing use of PMU and Wide Area Measurement Systems (WAMS) in power system
Regulatory support
• Central Electricity Regulatory Commission (Measures to relieve congestion in real time operation) Regulations, 22nd Dec 2009 – Regulation 3 (3):
“Provided also that when advance measurement techniques like Phasor Measuring Units (PMUs) become available to the NLDC and RLDCs for real-time field measurements, the inference from these measurements would be suitably used for assessment of Total Transfer Capability”
SYNCHROPHASORS
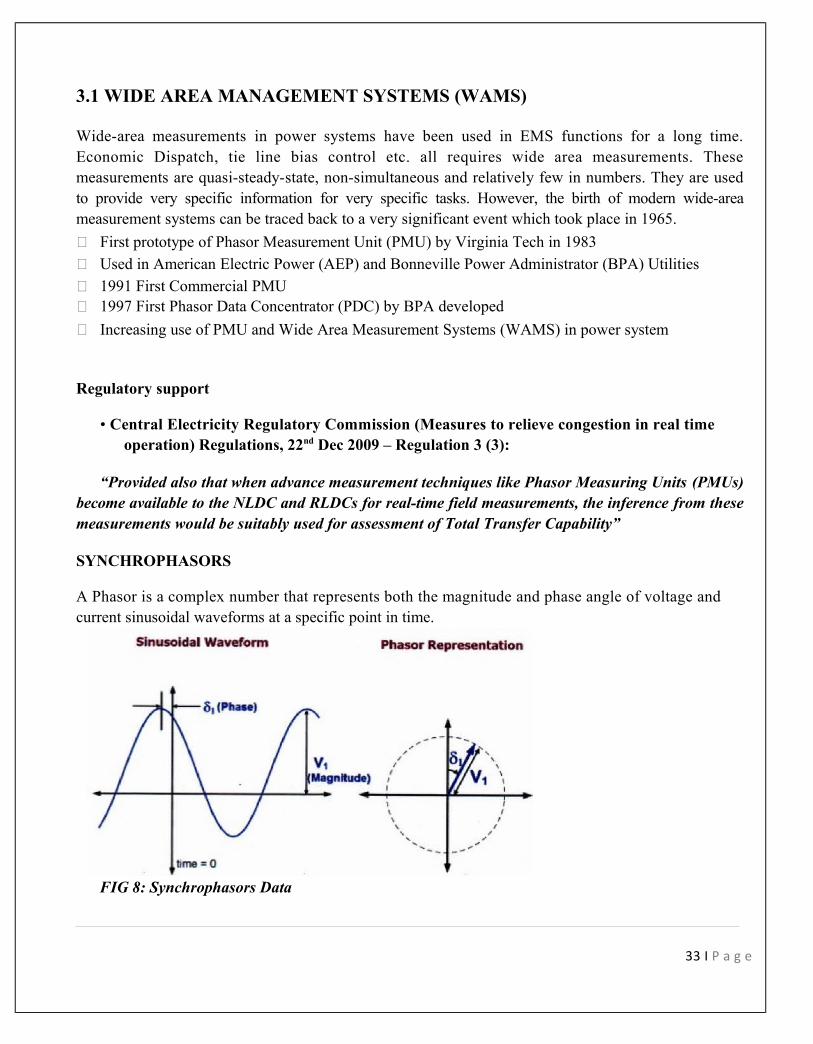
A Phasor is a complex number that represents both the magnitude and phase angle of voltage and current sinusoidal waveforms at a specific point in time.
FIG 8: Synchrophasors Data
33 I P a g e
When a Phasor Measurement taken at same time and time stamped, it is called a Synchrophasors.
Components of Synchrophasors System
3.1.1 PHASOR MEASUREMENT UNIT
Phasor measurement units (PMUs) are the most accurate and advanced technology available for wide area monitoring, protection and control. A well-planned, system-wide PMU deployment over optimal system architecture provides several unique advantages, including the avoidance of outages as the result of a true early warning system, congestion mitigation through better system margin management
and better ―state estimation‖ for the location marginal pricing that will be increasingly required to
enable transmission grids that optimize completion.
Measure Voltage Current & Frequency
Calculate Phasor: digital sampling of AC waveform with time signal from G.P.S
Output data: In a standard protocol at rates of at least 25 - 30 samples per sec.
A wide variety of PMUs are available today
– Typically give Phasor measurement of up to 15 three phase quantities
– Some offer phase sequence measurement, single phase measurement etc
– Some calculate power, energy, quality of power etc
– Some have inbuilt GPS receivers
• Communication
• Transport digital information from PMU
• Various communication links like fiber-optics, microwave
• Single PMU to PDC 10kbps to 100 kbps
• PDC to PDC 100 kbps to 0.5 Mbps
34 I P a g e
3.1.2 PHASOR DATA CONCENTRATOR
• Receives and time synchronizes Phasor data from multiple PMU‘s
35 I P a g e
• Real time, time aligned output data stream.
• Can exchange data with PDC‘s at other locations.
• Output from PMU is communicated to a central PDC
• Rate is settable ( once in every cycle, 2 cycles or 4 cycles)
• Communication in standard format
FIG 9: Block Diagram of PD C
Functions of PDC
Data does not reach at the same time at a PDC from the various PMUs
PDC has to wait, sort and group the received data for meaningful use – that is ‗Data Concentrating‘
Connect to different PMU‘s, receive, sort and filter the data
Produce output data in a standard format
Map the data for archiving
35 I P a g e
• Communicate it to other PDC‘s if any
• Form meaningful subset of data
• Constraint is large volume of incoming data
• PMU‘s may be using different protocols or networks
• Can request PMU‘s for start, stop or send configuration information
• Need for communication with other PDCs
• Need to form subsets of data during such communication – data & rate issues
• Need to form an array of PDCs
• Need for backup PDCs -
3.1.3 DATA STORAGE
4 System to store Synchrophasors data
5 Transfer of output data from PDC to PDC or application – need for standard formats or protocols
6 Interface with SCADA – need for matching protocol requirements and reduced data rate
7 Need for converting to MW & MVAR values
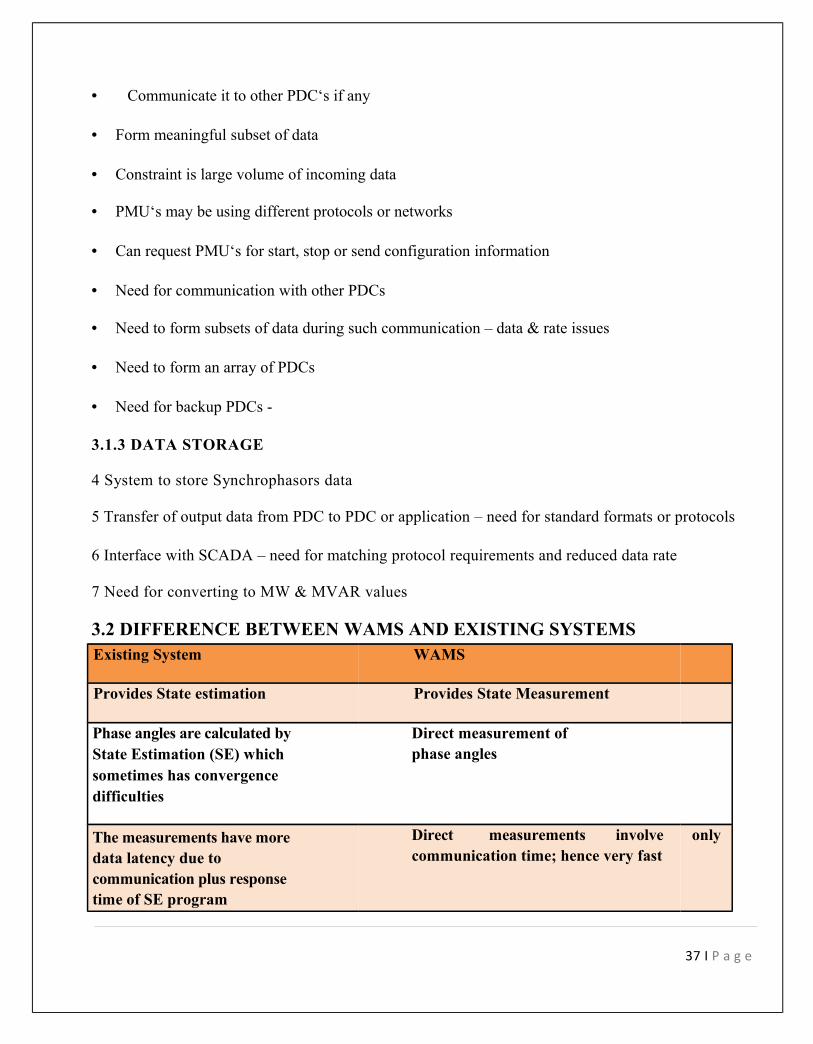
3.2 DIFFERENCE BETWEEN WAMS AND EXISTING SYSTEMSExisting System WAMS
Provides State estimation Provides State Measurement
Phase angles are calculated by State Estimation (SE) which sometimes has convergence difficulties
Direct measurement of phase angles
The measurements have more data latency due tocommunication plus response time of SE program
Direct measurements involvecommunication time; hence very fast
only
37 I P a g e
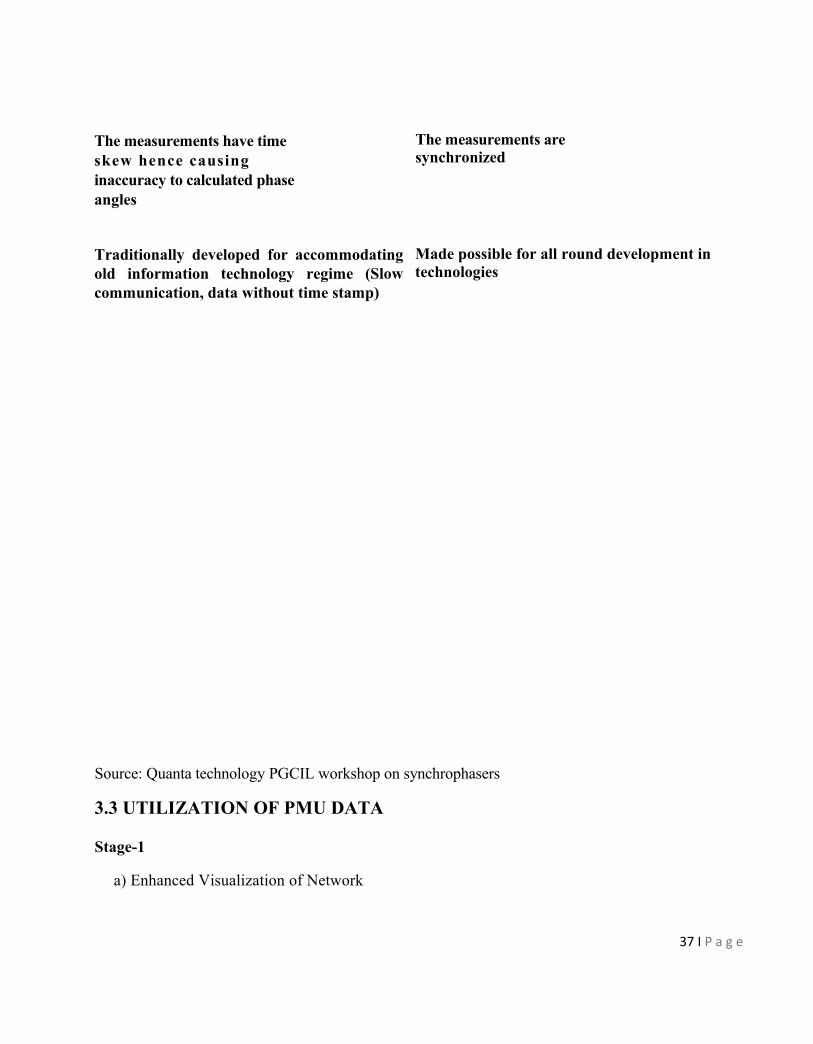
The measurements are synchronized
The measurements have time skew hence causing inaccuracy to calculated phase angles
Traditionally developed for accommodating old information technology regime (Slow communication, data without time stamp)
Made possible for all round development in technologies
Source: Quanta technology PGCIL workshop on synchrophasers
3.3 UTILIZATION OF PMU DATA
Stage-1
a) Enhanced Visualization of Network
37 I P a g e
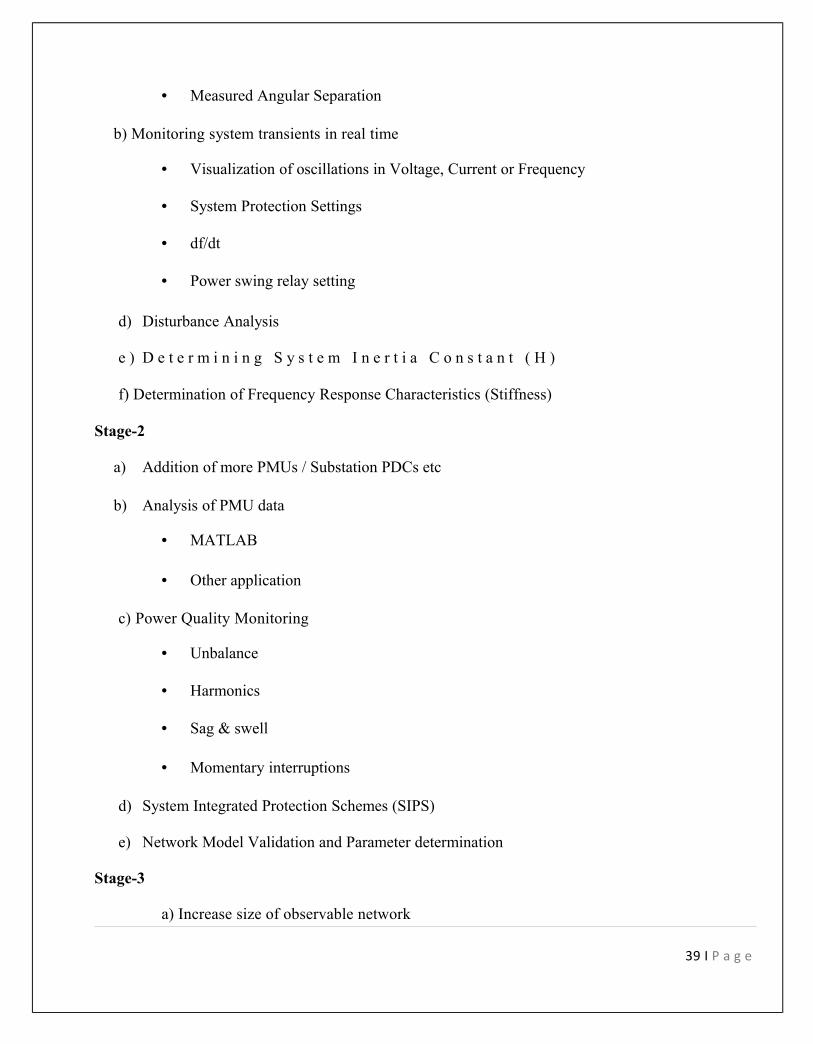
• Measured Angular Separation
b) Monitoring system transients in real time
• Visualization of oscillations in Voltage, Current or Frequency
• System Protection Settings
• df/dt
• Power swing relay setting
d) Disturbance Analysis
e ) D e t e r m i n i n g S y s t e m I n e r t i a C o n s t a n t ( H )
f) Determination of Frequency Response Characteristics (Stiffness)
Stage-2
a) Addition of more PMUs / Substation PDCs etc
b) Analysis of PMU data
• MATLAB
• Other application
c) Power Quality Monitoring
• Unbalance
• Harmonics
• Sag & swell
• Momentary interruptions
d) System Integrated Protection Schemes (SIPS)
e) Network Model Validation and Parameter determination
Stage-3
a) Increase size of observable network
39 I P a g e
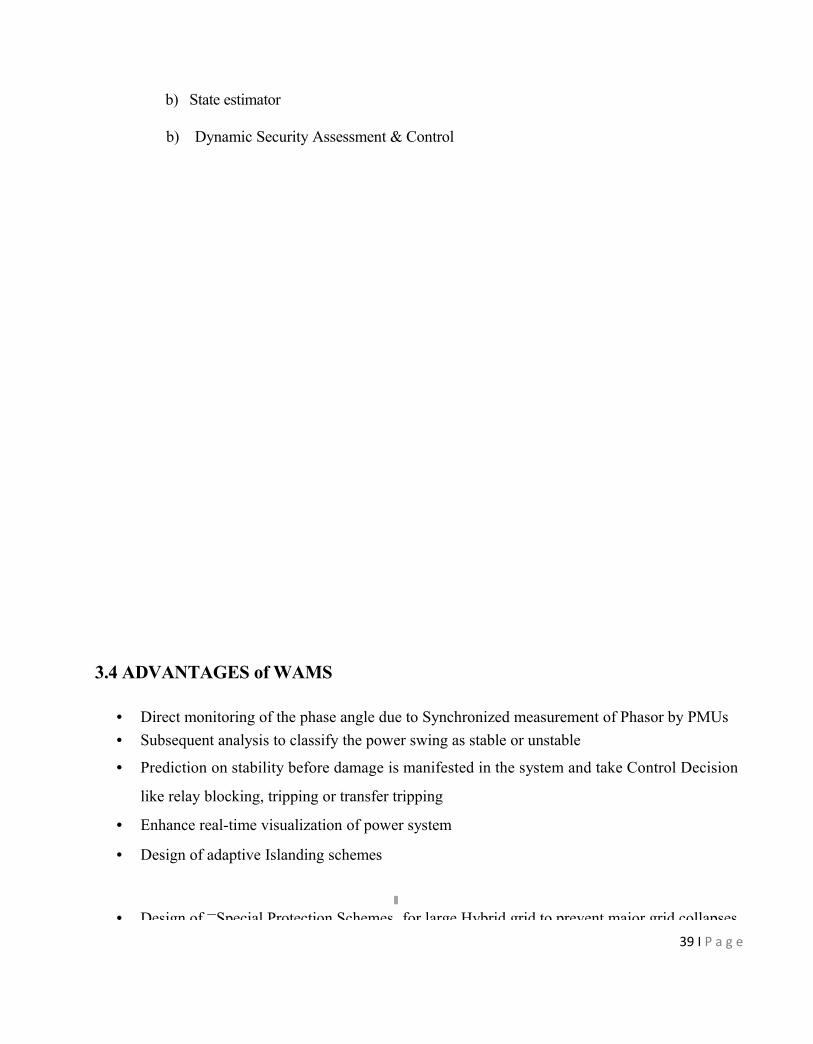
b) State estimator
b) Dynamic Security Assessment & Control
3.4 ADVANTAGES of WAMS
• Direct monitoring of the phase angle due to Synchronized measurement of Phasor by PMUs
• Subsequent analysis to classify the power swing as stable or unstable
• Prediction on stability before damage is manifested in the system and take Control Decision
like relay blocking, tripping or transfer tripping
• Enhance real-time visualization of power system
• Design of adaptive Islanding schemes
• Design of ―Special Protection Schemes‖ for large Hybrid grid to prevent major grid collapses
39 I P a g e

Development of Integrated Protection Scheme (SIPS)
Useful for real-time congestion management
Validation and fine tuning of system models
41 I P a g e

CHAPTER 4
> Security Challenges
> Integration Challenges Given By Many Experts> Initiatives For Smart Grid> Pilot Projects In India
> Smart Grid In Transmission ,Distribution> Ongoing Smart Grid Activities
42 I P a g e
4.1 SECURITY CHALLENGES IN SMART GRID
There is no single set of cyber security requirements and solutions that fits each of the Smart Grid interfaces. Cyber security solutions must ultimately be implementation-specific, driven by The configurations, the actual applications, and the varying requirements for security of all of the
functions in the system. That said, ―typical‖ security requirements can be developed for different
types of interfaces which can then be used as checklists or guidelines for actual
implementations.Typically, security requirements address the integrity, confidentiality, and availability of data. However, in the Smart Grid, the complexity of stakeholders, systems, devices, networks, and Environment precludes simple or one-size-fits-all security solutions. Therefore, additional criteria Must be used in determining the cyber security requirements before selecting the cyber security measures. These additional criteria must take into account the characteristics of the interface, including the constraints and issues posed by device and network technologies, the existence of legacy systems, varying organizational structures, regulatory and legal policies, and cost criteria. Once these interface characteristics are applied, then cyber security requirements can be applied that are both specific enough to be applicable to the interfaces, while general enough to permit the implementation of different cyber security solutions that meet the cyber security requirements or embrace new security technologies as they are developed. This cyber security information can then be used in subsequent steps to select cyber security controls for the Smart Grid.
Network security of distributed systems across meters, substations, poles and In-home devices including authentication, detection, and monitoring
Identity & access management for managing customer information Messaging and application security communications including data, network communications, and
transactions Security policy management and implementing web services security Standards.
4.2 INTEGRATION CHALLENGES GIVEN BY MANY EXPERTS
For many industry and government leaders, the lure of the smart grid appears irresistible. If smart grids can realize their full potential, consumers, utilities, nations, and even the earth itself will benefit. As with nearly any new technology, the industry focus has been on getting smart grids up and running, often with little consideration for cyber security issues. However, a recent report from Pike Research finds that investment in securing the grid from malicious attacks, natural disasters, and other accidents is picking up pace. The cleantech market intelligence firm expects that smart grid cyber
security spending will increase 62% between 2010 and 2011, and by 2015 the annual worldwide
43 I P a g e

market spending in this critical sector will reach $1.3 billion.―Smart grid cyber security is significantly more complex than the traditional IT security world. It is acommon misperception that IT networks and industrial control systems have the same cyber security
44 I P a g e
issues and can be secured with the same countermeasures. They cannot,‖ says senior analyst Bob
Lockhart. ―To successfully secure the electrical grid, utilities and their key suppliers must design
solutions that effectively bridge the worlds of information and operations technology.‖
Lockhart adds that effective smart grid cyber security deployments will address a wide variety of key issues:
• Stronger identity management
• Multi-factor authentication on powerful consoles• Computer incident response• Change management, asset management, and configuration management• Business continuity planning
• Defense-in-depth for IT and ICS networks• Stronger security on SCADA control systems• More secure interfaces between IT and ICS networks• Video monitoring capabilities for substations and control rooms
• End-to-end encryption of data from the home area network (HAN) to the utility central site
• Need to prevent worms from spreading through smart meters• Stronger cyber security software on smart meters• Resiliency throughout the advanced metering infrastructure (AMI)
• Data integrity for electric vehicle recharging transactions• Data privacy for electric vehicle billing data and recharging transactions• Security awareness education for all affected employees
Over the next few years, Pike Research anticipates that growth in the smart grid cyber security market will produce opportunities not only for hardware and software sales, but also for a number of new professional services opportunities. These service offerings will help utilities navigate the minefield of threats and challenges that pose fundamental risks to the integrity of the grid infrastructure.
• Adoption of SOA architecture
• Web service enablement of legacy apps• Format bridging, transformation and routing
• Handling wide variety of non-XML data formats• O
45 I P a g e

vercoming performance bottlenecks for standards based XML interfaces• Interfacing with partners and customers
46 I P a g e

Data Power Usage Patterns:
FIG 10: Data Storage
44 I P a g e
48 I P a g e
Grid connectivity:
FIG 11: Grid Connectivity
4.3 INITIATIVES FOR SMART GRID
ULDC Scheme Implementation: Real Time Phase Angle Calculation Based on SCADA measurement and network model. Real Time Phase angle Measurement
a. First indirectly through Voltage Transducer at a HVDC Back To Back station / Locations where operating in split mode.
b. Then Based on Phase Angle Transducer
c. PMU.PMUs – A Necessity for today‘s grids:
Dynamic Monitoring of the System Parameters under varied grid conditions
• Interconnection of Large networks
• long haulage of power
• Diversity of operating conditions...
• Basis for decision making for charging high Capacity interregional tie lines
• Validate the offline network simulation model• To maximize the utilization of transmission resources by operating the system near limits.
• Development of the wide area Protection Schemes.
4.4 PILOT PROJECTS IN INDIA
Milestones in Pilot Project Implementation:
Dates Milestones June 2009 Management approval
Sep 2009 Floating of TenderOct 2009 vetting of technical specificationsDec 2009 Approval by CERCJan 2010 Award of ContractMay 2010 commissioning
Criteria for PMU Location Selection:
• Monitoring the Network Stability–Locations were short listed based on simulation studies• Locations near Big Generating Stations / Critical Nodes
• Availability of Broad band Network.–For faster implementation.• Area Considered Important by Real Time System Operators• Signature of the entire NR power System.
49 | P a g e
Phasor Measurement Units in Northern Regional Grid of Indian Power System:
FIG 12: PMU in Northern Region
The PMU locations already Operational:
a) 400 kV North Bus of Vindhyachal HVDC back-to-back station
• Proximity to major pithead thermal generation complex
• Proximity to HVDC Rihand terminal of +500kV Rihand-Dadri Bipole
b) 400 kV Kanpur substation
• Connectivity with generation complex
• Connectivity with major load centre in/around National Capital Region of Delhi
c) 400 kV bus of HVDC Dadri station :
• Inverter terminal of the +500 kV Rihand-Dadri HVDC Bipole.
• Close proximity to major load-centre and power stations
47 I P a g e
51 | P a g e
d) 400 kV Moga Substation :
• Pooling station for the present and future hydro generating stations
• Will be upgraded to 765 kV level
• Proximity to Bhiwadi terminal of + 500 kV HVDC Balia-Bhiwadi bipole
FIG 13: Components at PMU Location
GPS (SEL 2404) :– To provided accurate time.
– Time synchronization among all PMUs.Phasor Measurement unit (SEL 45 1):-–3 voltage inputs.–3 Current inputs
Linking of Regional PDC with Master PDC at NLDC
FIG14::L inking of Various LDC’s through PMU
Future road map:
In a gradual manner more than 100 PMUs would be installed and made operational in a time frame of 1 to 1-1/2 years. Capacity building would be achieved in all the regions. Since proposed to be executed under pilot projects, the funding may be achieved relatively
with ease. Being executed separately in terms of small projects the vendor development could be much
better. We shall be equipped with sufficient information / practical experience in respect of PMUs by
the time the present SCADA system in different regions is replaced by the new one.
Determination of Inertia Constant Based on df/dt measured through PMU data: Loss of Generation at Rihand Stage -II =1000 MW
df/dt Measured based on 40 ms PMU data =0.06 Hz / secSize of ―N-E-W
‖ Grid at the instant =66000 MW.
Frequency prior to the Incident =49.47 Hz.Inertia Constant (H) = ( P / P0 ) x f0 /(2 x df/dt)
49 I P a g e
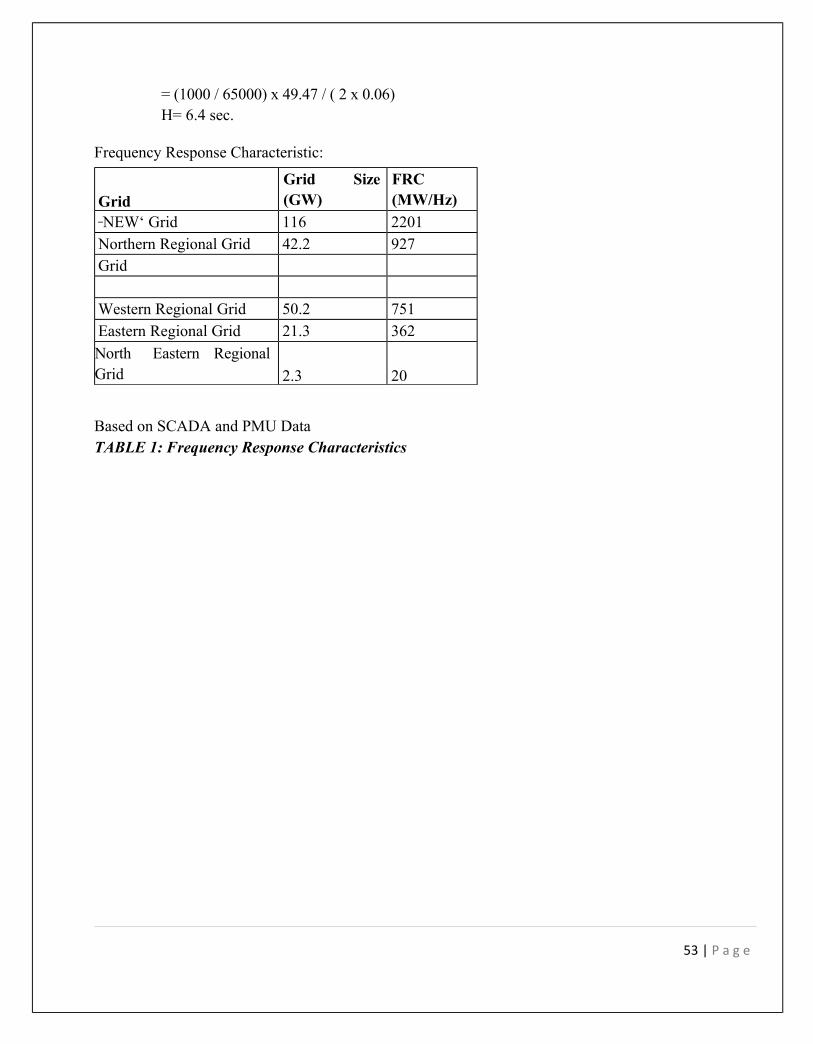
= (1000 / 65000) x 49.47 / ( 2 x 0.06) H= 6.4 sec.
Frequency Response Characteristic:
Grid
Grid Size(GW)
FRC (MW/Hz)
‗NEW‘ Grid 116 2201Northern Regional Grid 42.2 927Grid
Western Regional Grid 50.2 751Eastern Regional Grid 21.3 362
North Eastern RegionalGrid 2.3 20
Based on SCADA and PMU DataTABLE 1: Frequency Response Characteristics
53 | P a g e
Disturbance Analysis:
TABLE 2: Disturbance Analysis
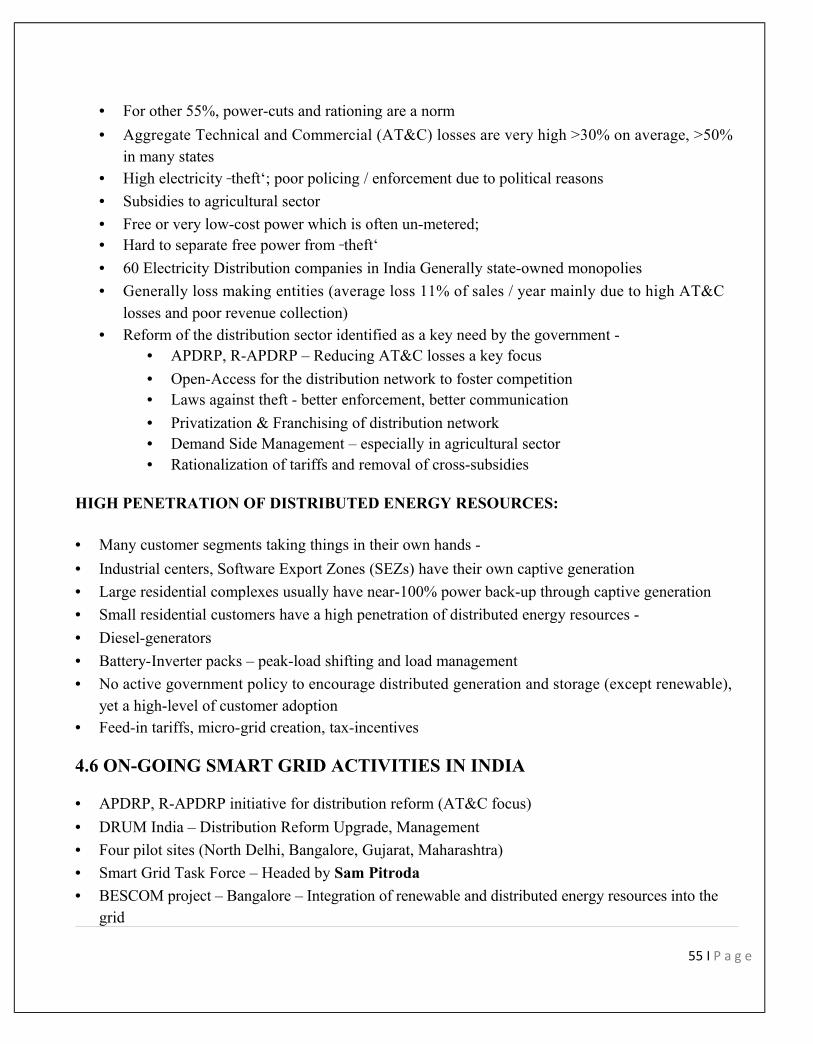
4.5 SMART GRID FOR TRANSMISSION NETWORK
• Power Grid Corp – operation of the national grid• Growing at 40% CAGR;• Aggressive deployment of Phasor Measurement Units (PMUs)
• Northern – already installed 4 PMUs, 20 more in progress
• Western – 25 PMUs• Eastern – 70-80 PMUs• Functioning wholesale electricity trading markets on commodity exchanges
• Low volumes, ~5% of electricity traded on exchanges
• Lot of research activity related to PMUs in universities• Optimal placement of PMUs
• Dynamic State Estimation
• Control schemes, Software for data visualization
DISTRIBUTION INFRASTRUCTURE IN INDIA:
• 80% of villages are ‗electrified‘, 45% of the population doesn‘t have access to electricity
51 I P a g e
• For other 55%, power-cuts and rationing are a norm
• Aggregate Technical and Commercial (AT&C) losses are very high >30% on average, >50% in many states
• High electricity ‗theft‘; poor policing / enforcement due to political reasons
• Subsidies to agricultural sector
• Free or very low-cost power which is often un-metered;• Hard to separate free power from ‗theft‘
• 60 Electricity Distribution companies in India Generally state-owned monopolies
• Generally loss making entities (average loss 11% of sales / year mainly due to high AT&C losses and poor revenue collection)
• Reform of the distribution sector identified as a key need by the government -• APDRP, R-APDRP – Reducing AT&C losses a key focus
• Open-Access for the distribution network to foster competition• Laws against theft - better enforcement, better communication
• Privatization & Franchising of distribution network• Demand Side Management – especially in agricultural sector• Rationalization of tariffs and removal of cross-subsidies
HIGH PENETRATION OF DISTRIBUTED ENERGY RESOURCES:
• Many customer segments taking things in their own hands -
• Industrial centers, Software Export Zones (SEZs) have their own captive generation
• Large residential complexes usually have near-100% power back-up through captive generation
• Small residential customers have a high penetration of distributed energy resources -
• Diesel-generators
• Battery-Inverter packs – peak-load shifting and load management
• No active government policy to encourage distributed generation and storage (except renewable), yet a high-level of customer adoption
• Feed-in tariffs, micro-grid creation, tax-incentives
4.6 ON-GOING SMART GRID ACTIVITIES IN INDIA
• APDRP, R-APDRP initiative for distribution reform (AT&C focus)
• DRUM India – Distribution Reform Upgrade, Management
• Four pilot sites (North Delhi, Bangalore, Gujarat, Maharashtra)
• Smart Grid Task Force – Headed by Sam Pitroda
• BESCOM project – Bangalore – Integration of renewable and distributed energy resources into the grid
55 I P a g e

• KEPCO project in Kerala India - $10 Billion initiative for Smart Grid
56 I P a g e

L&T and Telvent project – Maharashtra – Distribution Management System
Rabirashmi Abasan Housing project – Kolkata (2008). First instance of net metering in India from roof-top Solar
SA Habitat and Valence Energy – Hyderabad (2009). Distributed generation via roof-top solar for 40% in a micro-grid.
57 I P a g e

CHAPTER 5
Conclusion Recommendation
58 I P a g e

CONCLUSION & RECOMMENDATION
The growth of power sector is tremendous since the time of independence but not the one which was sought. We are unable to achieve the projected figures and now should not leave any road unreached to have a SMART NATION. Smart Grid no doubt provides us with many solutions but also leave us with many integration challenges.
5.1 CONCLUSIONS
The five reasons for INDIA to go for smart grid:
Stopping Power Theft
Higher Quality/Reliability of Power, Fewer Blackouts Leapfrog to Smart Grid:
Many people can be given excess through the implementation of Smart Grid for example in Tanzania 80% of the population lives within 5 kilometers of a transmission line but only 10 percent has access to electricity. But “Smart grid represents an opportunity for developing countries to leapfrog in the growth of their power sector to more manageable, reliable, and scalable designs,” writes Tongia.
Growth Justifies the Cost: India will no doubt double its energy needs in a decade and at growing at such a rapid pace addition of smart grid technologies can be justified to utilities by the growth of power consumers.
Renewable Power Needs Smart Grid: Utilities will need a smart grid to manage problems caused by intermittency (the sun and wind only happen during certain times of the day) and distributed power.
Not all smart grid technologies are relevant worldwide. In India, the really useful technologies will be those that can help in constraining the peak demand and peak load growth at reasonable cost with the ability of cutting losses.
The smart grid does not consist of a single technology or solution and different countries and different utilities will focus on different set of goals. Many solutions adopted in highly industrialized countries will not work in places like India. But, there are things that can be done that appear to be worthwhile. India's most urgent problems and needs are not the same as those the smart grid addresses in wealthy countries. India and other countries at a similar developmental stage are not worried about meter reading labor costs as much as accuracy of billing. Electric vehicles are a more distant prospect than in Europe or Japan. Incorporation of Renewable Energy is a more strategic mandate.The morning peak is entirely residential-driven, while the evening peak is commercial plus residential. Another major load is agriculture and is throttled at a feeder level and supplied power only during "off-peak" periods. Taking all considerations into account any peak management system should be design for many small or medium users, instead of a small number of large users.
59 I P a g e
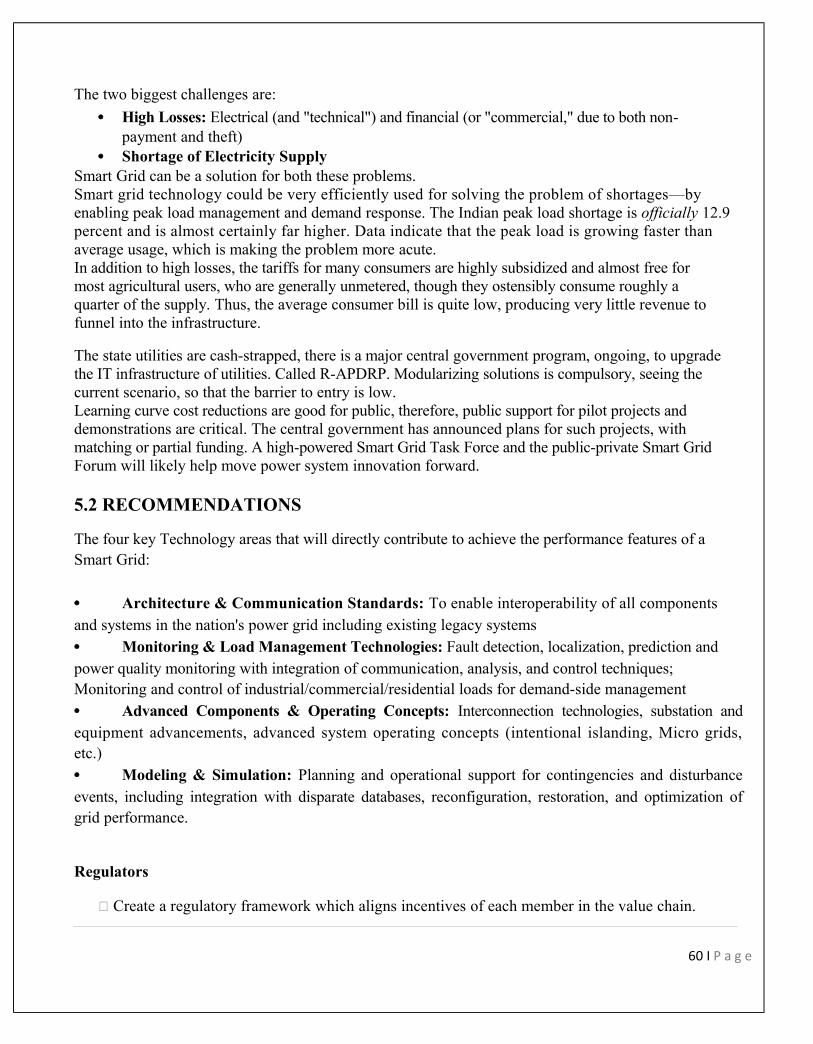
The two biggest challenges are:
• High Losses: Electrical (and "technical") and financial (or "commercial," due to both non-payment and theft)
• Shortage of Electricity SupplySmart Grid can be a solution for both these problems.Smart grid technology could be very efficiently used for solving the problem of shortages—by enabling peak load management and demand response. The Indian peak load shortage is officially 12.9 percent and is almost certainly far higher. Data indicate that the peak load is growing faster than average usage, which is making the problem more acute.In addition to high losses, the tariffs for many consumers are highly subsidized and almost free for most agricultural users, who are generally unmetered, though they ostensibly consume roughly a quarter of the supply. Thus, the average consumer bill is quite low, producing very little revenue to funnel into the infrastructure.
The state utilities are cash-strapped, there is a major central government program, ongoing, to upgrade the IT infrastructure of utilities. Called R-APDRP. Modularizing solutions is compulsory, seeing the current scenario, so that the barrier to entry is low.Learning curve cost reductions are good for public, therefore, public support for pilot projects and demonstrations are critical. The central government has announced plans for such projects, with matching or partial funding. A high-powered Smart Grid Task Force and the public-private Smart Grid Forum will likely help move power system innovation forward.
5.2 RECOMMENDATIONS
The four key Technology areas that will directly contribute to achieve the performance features of a Smart Grid:
• Architecture & Communication Standards: To enable interoperability of all components and systems in the nation's power grid including existing legacy systems• Monitoring & Load Management Technologies: Fault detection, localization, prediction and power quality monitoring with integration of communication, analysis, and control techniques; Monitoring and control of industrial/commercial/residential loads for demand-side management• Advanced Components & Operating Concepts: Interconnection technologies, substation and equipment advancements, advanced system operating concepts (intentional islanding, Micro grids, etc.)• Modeling & Simulation: Planning and operational support for contingencies and disturbance events, including integration with disparate databases, reconfiguration, restoration, and optimization of grid performance.
Regulators
Create a regulatory framework which aligns incentives of each member in the value chain.
60 I P a g e
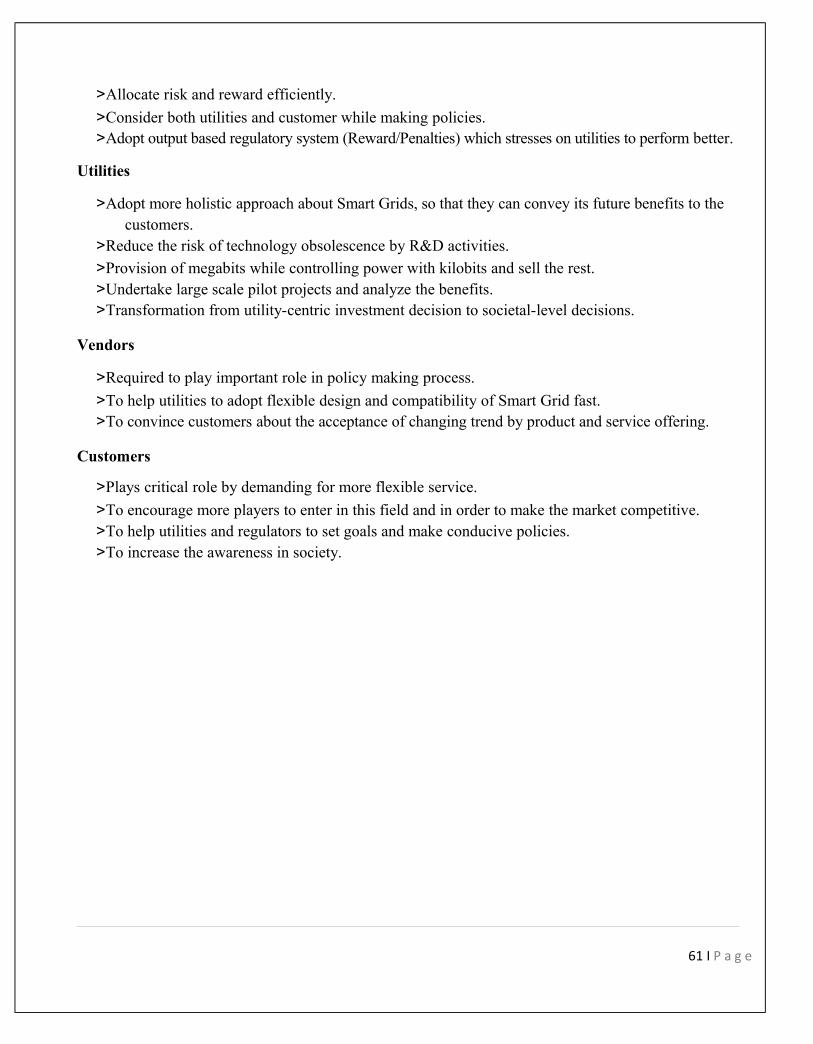
>Allocate risk and reward efficiently.
>Consider both utilities and customer while making policies.>Adopt output based regulatory system (Reward/Penalties) which stresses on utilities to perform better.
Utilities
>Adopt more holistic approach about Smart Grids, so that they can convey its future benefits to the customers.
>Reduce the risk of technology obsolescence by R&D activities.
>Provision of megabits while controlling power with kilobits and sell the rest.>Undertake large scale pilot projects and analyze the benefits.>Transformation from utility-centric investment decision to societal-level decisions.
Vendors
>Required to play important role in policy making process.
>To help utilities to adopt flexible design and compatibility of Smart Grid fast.>To convince customers about the acceptance of changing trend by product and service offering.
Customers
>Plays critical role by demanding for more flexible service.
>To encourage more players to enter in this field and in order to make the market competitive.>To help utilities and regulators to set goals and make conducive policies.>To increase the awareness in society.
61 I P a g e
BIBLIOGRAPHY
• http://www.businesswire.com/news/home/20110414005058/en/Smart-Grid-Cyber - Security-Revenue-Reach-1.3
• http://smartgrid.ieee.org/news-smart-grid-newsletter
• http://www.pikeresearch.com/newsroom/smart-grid-cyber-security-revenue-to-reach-1-3- billion-by-2015
• http://www.accenture.com/us-en/Pages/insight-world-economic-forum-smart-grids - summary.aspx
• http://www.rancoenergy.com/about.html
• http://wpedia.goo.ne.jp/enwiki/Energy_management_system
• http://www.oe.energy.gov/smartgrid_02.htm
• http://wpedia.goo.ne.jp/enwiki/Phasor_measurement_unit
• http://en.wikipedia.org/wiki/Synchrophasors
• http://en.wikipedia.org/wiki/Smart_grid
• http://www.oe.energy.gov/smartgrid.htm
• http://wpedia.goo.ne.jp/enwiki/Energy_management_system
• http://www.powergridindia.com/PGCIL_NEW/home.aspx
• H:\material\STUDY MATERIAL\IT Applications in Power\smart grid material\NEMA - What is Smart
Grid and why is it important .htm
• http://www.powergridindia.com/Pgcil_new/Template3.aspx?pageid=P:1580
• Smart Grid Vision for India, March 2010, PA Government Services, Inc.
• Accelerating Smart Grid Investments, 2009, by World Economic Forum & Accenture
62 I P a g e
Presentation on Smart Grid & Integration of Renewable Energy Resources, IIT JODHPUR
Road map for implementation of Smart Grid for Indian Power Grid, A.G. Phadke
WAMS and Phasor Measurement Technology, A.G. Phadke
Smart Grid in Distribution Sector(Workshop on Smart Grid Initiatives in Indian Power Sector), Jan 28 2010, At Power Grid
PGCIL Seminar - A Smart Grid vision , January 2010, Jean-Louis COULLO(EMS Activity Director)
63 I P a g e


![[Smart Grid Market Research] (Part 1 of 3 Part Series): The U.S. Smart Meter Uprising, Zpryme Smart Grid Insights, August 2011](https://img.pdfslide.us/doc/110x75/577d26a51a28ab4e1ea1c85b/smart-grid-market-research-part-1-of-3-part-series-the-us-smart-meter.jpg)