Embed Size (px)
Citation preview
Smart Grid Roadmap DRAFT IP 1 ISO uses Synchrophasor data for grid operations, control, analysis and
modeling
Document: Grid_Ops-Phasor use case.doc California ISO Document
© Copyright 2010, California Independent System Operator, All Rights Reser
Smart Grid Roadmap
IP-1 ISO Uses Synchrophasor Data for Grid Operations, Control, Analysis and
Modeling Version 3.1
October 29, 2010 Approvals: Signature indicates acceptance of the IP-1 ISO Uses Synchrophasor Data for Grid Operations, Control, Analysis and Modeling for Smart Grid Roadmap Project as complete and sufficiently detailed to allow the project to be successfully executed. __________________________ _ Jim McIntosh, Director, Executive Operations Advisor
__________________________ _ Heather Sanders, Director, Smart Grid Technologies and Strategy
Page 2 of 28
Smart Grid Use Case Template
Smart Grid Project
Review Date:
Policy No.:
IP-1 ISO Us es Synchrophas or da ta fo r g rid opera tions , con tro l and mode ling Version No.: 3.1 Effective Date 10/29/2010
Revision History Date Version Description Author
5/12/10 0.1 Create the document David Hawkins
7/14/10 0.2 Review and edit content. Matthew Varghese David Dieser
7/16/10 0.3
Updates include: • Added assumptions, preconditions & post
conditions sections 4,5,6 • Added flow of event section to replace scenario
step by step analysis description • Added requirements section 8 • Added activity diagrams in section 9 • Removed use case models and redundant use
case description section
Yinka Osoba
7/17/2010 0.4
Updates include: • Revised requirements section 8 • Revised assumptions and preconditions sections
(4 & 5)
Yinka Osoba
7/19/2010 0.5
Updates include: • Revised actors section 3 • Revised requirements & flow of events section 7
& 8
Yinka Osoba
7/21/10 1.0 Accepted all changes, re-organized section 1 and 2 Heather Sanders
8/10/10 1.1 Revised WECC synchrophasor network diagram Matthew Varghese
8/10/10 1.2 Revised Scenario 3 and Scenario 4 Matthew Varghese David Dieser Enamul Haq
8/10/10 1.3 Created Scenario 5 and Scenario 6 Matthew Varghese David Dieser Nan Liu
8/12/2010 1.4 Updated Flow Of Events for Scenarios 3-6 Tarak Thaker
8/12/2010 1.5 Added content to Flow Of Events to describe Actors and events Matthew Varghese
8/13/2010 1.6 Updated Flow of Events, Actors, and Activity Diagrams for Scenarios 1-6. Document Cleanup. Tarak Thaker
8/14/2010 1.7 Review and edit content. Jim Mcintosh Jim Hiebert Sean Crimmins
8/16/2010 1.8 Cleanup and updates. Tarak Thaker
8/17/2010 1.9 Added BRQ-025, BRQ-026 per Michael Karg and Matthew Varghese Tarak Thaker
8/18/2010 2.1 Added Scenario 7 for Optimizing Transmission Capacity based on input from Nan, Mike, Matthew, David Tarak Thaker
9/3/2010 2.2 Minor edits, removed diagram for scenario 7, fixed reference to actor in data flow 7.2 Heather Sanders
9/07/2010 2.3 Edited Scenario 2 Activity Diagram Tarak Thaker
9/07/2010 2.4 Updated non functional requirements & removed obsolete Doug Walker/Yinka
Page 3 of 28
Smart Grid Use Case Template
Smart Grid Project
Review Date:
Policy No.:
IP-1 ISO Us es Synchrophas or da ta fo r g rid opera tions , con tro l and mode ling Version No.: 3.1 Effective Date 10/29/2010
Business requirements in section 8 Updated actor in section 7.3 - scenario 3 steps 3 & 4 and activity diagram in section 9.3 Updated titles of scenarios 3 & 4 to conform with corresponding activity diagrams
Osoba
10/14/10 3.0 Minor edits Heather Sanders
10/29/10 3.1 Added details to Scenario 1 and Scenario 7 Matthew Varghese
Page 4 of 28
Smart Grid Use Case Template
Smart Grid Project
Review Date:
Policy No.:
IP-1 ISO Us es Synchrophas or da ta fo r g rid opera tions , con tro l and mode ling Version No.: 3.1 Effective Date 10/29/2010
Table of Contents 1. USE-CASE: IP-1 ISO USES SYNCHROPHASOR DATA FOR GRID OPERATIONS, CONTROL AND MODELING………………………………………………………………………………………………………………….5
2. BRIEF DESCRIPTION……………………………………………………………………………………………….6
3. ACTORS………………………………………………………………………………………………………………6
4. ASSUMPTIONS……………………………………………………………………………………………………...8
5. PRECONDITIONS…………………………………………………………………………………………………...8
6. POST CONDITIONS………………………………………………………………………………………………...8
7. FLOW OF EVENTS………………………………………………………………………………………………….8
7.1 SCENARIO 1: PHASOR-BASED SYSTEM ALARM OCCURS - A SYSTEM ALARM OCCURS AND THE SYSTEM OPERATOR TAKES ACTION AS A RESULT OF THE ALARM .................................................................................................. 10 7.2 SCENARIO 2: A SYSTEM BREAKUP (ISLANDING) OCCURS AND ISO OPERATOR TAKES ACTION TO RESTORE SYSTEM USING PHASOR DATA ........................................................................................................................................... 11 7.3 SCENARIO 3: POST MORTEM ANALYSIS - ISO SYSTEM OPERATIONS ANALYST USES PHASOR DATA FOR POST EVENT ANALYSIS ...................................................................................................................................................... 12 7.4 SCENARIO 4: MODEL VALIDATION - ISO USES PHASOR DATA FOR MODEL VALIDATION .................................. 13 7.5 SCENARIO 5: SPECIAL PROTECTION SCHEME (SPS) APPLICATION - IDENTIFY CONTROLS THAT CAN RESPOND TO SPECIFIC LOCAL OR WIDE-AREA GRID PROBLEMS ...................................................................................... 14 7.6 SCENARIO 6: SMART CONTROL APPLICATION .................................................................................................. 14 7.7 SCENARIO 7: OPTIMIZE TRANSMISSION CAPACITY ........................................................................................... 15
8. REQUIREMENTS…………………………………………………………………………………………………..16
9. ACTIVITY DIAGRAMS……………………………………………………………………………………………..20
9.1 SCENARIO 1: PHASOR-BASED SYSTEM ALARM OCCURS – A SYSTEM ALARM OCCURS AND THE SYSTEM OPERATOR TAKES ACTION ................................................................................................................................................................... 20 9.2 SCENARIO 2: A SYSTEM BREAKUP (ISLANDING) OCCURS AND ISO OPERATOR TAKES ACTION TO RESTORE SYSTEM USING PHASOR DATA ......................................................................................................................................................... 21 9.3 SCENARIO 3: POST MORTEM ANALYSIS - SYSTEMS OPERATIONS ANALYST USES PHASOR DATA FOR POST EVENT ANALYSIS ........................................................................................................................................................................... 22 9.4 SCENARIO 4: MODEL VALIDATION – ISO USES PHASOR DATA FOR MODEL VALIDATION ......................................... 23 9.5 SCENARIO 5: SPECIAL PROTECTION SCHEME (SPS) APPLICATION – SPS APPLICATION IDENTIFIES CONTROLS THAT CAN RESPOND TO SPECIFIC LOCAL OR WIDE-AREA GRID PROBLEMS ................................................................................ 24 9.6 SCENARIO 6: SMART CONTROL APPLICATION – SMART CONTROL APPLICATION IDENTIFIES CONTROLS THAT CAN RESPOND TO DAMPING CONDITIONS AND/OR SUSTAINED OSCILLATIONS ........................................................................... 25 9.7 SCENARIO 7: OPTIMIZE TRANSMISSION CAPACITY .................................................................................................... 26
10. GLOSSARY…………………………………………………………………………………………………………27
11. BIBLIOGRAPHY……………………………………………………………………………………………………28
Page 5 of 28
Smart Grid Use Case Template
Smart Grid Project
Review Date:
Policy No.:
IP-1 ISO Us es Synchrophas or da ta fo r g rid opera tions , con tro l and mode ling Version No.: 3.1 Effective Date 10/29/2010
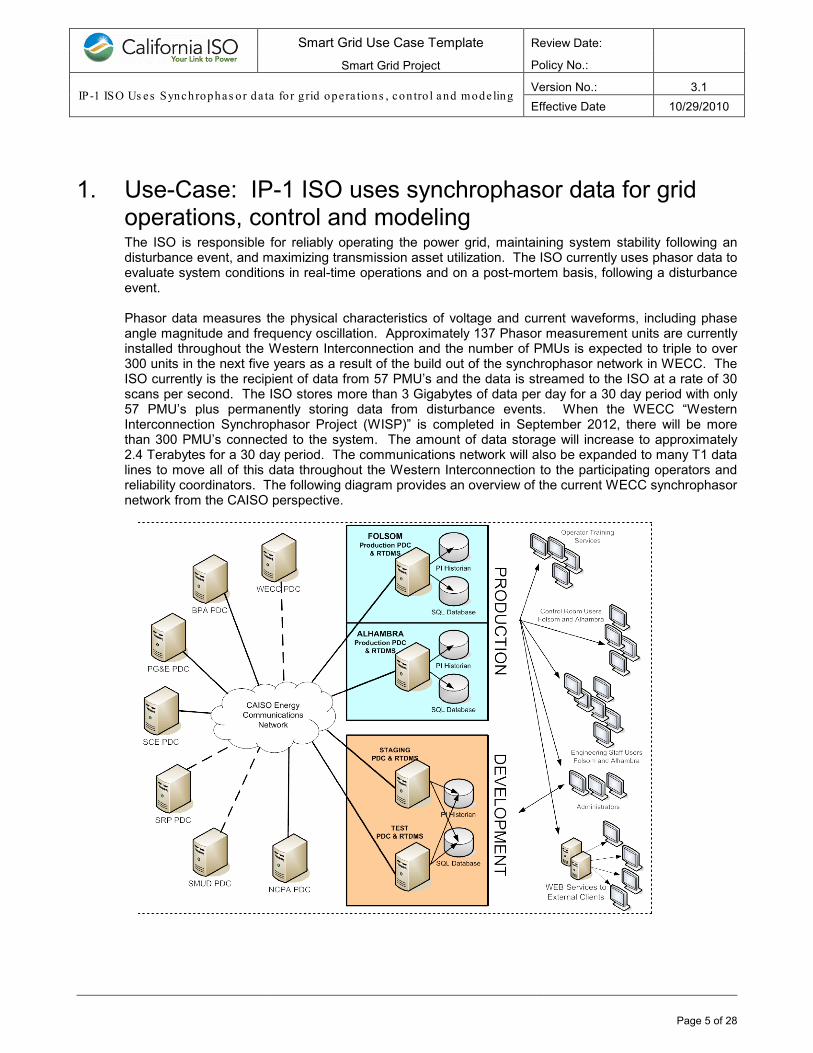
1. Use-Case: IP-1 ISO uses synchrophasor data for grid operations, control and modeling The ISO is responsible for reliably operating the power grid, maintaining system stability following an disturbance event, and maximizing transmission asset utilization. The ISO currently uses phasor data to evaluate system conditions in real-time operations and on a post-mortem basis, following a disturbance event. Phasor data measures the physical characteristics of voltage and current waveforms, including phase angle magnitude and frequency oscillation. Approximately 137 Phasor measurement units are currently installed throughout the Western Interconnection and the number of PMUs is expected to triple to over 300 units in the next five years as a result of the build out of the synchrophasor network in WECC. The ISO currently is the recipient of data from 57 PMU’s and the data is streamed to the ISO at a rate of 30 scans per second. The ISO stores more than 3 Gigabytes of data per day for a 30 day period with only 57 PMU’s plus permanently storing data from disturbance events. When the WECC “Western Interconnection Synchrophasor Project (WISP)” is completed in September 2012, there will be more than 300 PMU’s connected to the system. The amount of data storage will increase to approximately 2.4 Terabytes for a 30 day period. The communications network will also be expanded to many T1 data lines to move all of this data throughout the Western Interconnection to the participating operators and reliability coordinators. The following diagram provides an overview of the current WECC synchrophasor network from the CAISO perspective.
Page 6 of 28
Smart Grid Use Case Template
Smart Grid Project
Review Date:
Policy No.:
IP-1 ISO Us es Synchrophas or da ta fo r g rid opera tions , con tro l and mode ling Version No.: 3.1 Effective Date 10/29/2010
2. Brief Description The purpose of this use case is to describe how the ISO uses synchrophasor data for grid operations, control and modeling. It discusses the use of phasor data as a means of maintaining system stability following a system disturbance (both within and outside ISO’s service territory) and describes the use of phasor data to trigger alarms that will be the source of information to provide recommendations for system operator control actions within seconds of a system event. Synchrophasor data will improve the tools that system operators use to make decisions in a dramatic fashion and in a much more proactive manner. This capability would reduce the likelihood of an event causing widespread catastrophic grid instability. In addition, it proposes plans for future Smart SPS and Smart Control deployments that are based on the synchrophasor technology. The proposed Smart SPS and Smart Control are envisioned to leverage real-time synchrophasor data and the active intelligence derived from the data to detect transient instability and small signal instability, formulate response measures that are tailored for the specific system conditions and trigger automated protection or control actions. This use case also describes the ISO use of phasor data to calibrate dynamic models of generation resources, energy storage resources and system loads for use in transmission planning programs and operations analysis, as well as how phasor measurement data can be used to increase situational awareness of the system. Phasor measurement data is currently used by the ISO on both a real-time basis and a post-mortem basis to understand the cause of system disturbances. The ISO will use phasor visualization and monitoring system as the main application for display of the synchrophasor data and for detecting disturbance events. It will generate an alarm in EMS. The system operator upon receipt of the alarm would determine recommended actions from the ISO’s Operating Procedures and take appropriate remedial action. This use of phasor data represents one method within a portfolio of tools to combat system instability, and should be considered within a broader context of intelligent grid control. The benefits of using phasor data for real-time grid monitoring and control include increased system reliability, reduced costs, and increased customer benefits. Related tools include State Estimator and Voltage Stability Analysis that optimize different system variables such as maximizing transmission capacity, volt/VAR control, distributed generation dispatch, and renewable resource penetration levels.
3. Actors Actor Name Actor Type
(Person, device, system etc.)
Actor Description
Phasor Measurement Unit (PMU)
Device A device that measures the electrical waves on an electricity grid to determine the health of the system. In power engineering, these are also commonly referred to as synchrophasors and are considered one of the most important measuring devices in the future of power systems.
Phasor Data Concentrator (PDC)
Device A PDC forms a node in a system where phasor data from a number of PMUs or PDCs is correlated and fed out as a single stream to other applications. The PDC correlates phasor data by time-tag to create a system wide measurement set. The PDC provides additional functions as well. It performs various quality checks on the phasor data and inserts appropriate flags into the correlated data stream. It checks disturbance
Page 7 of 28
Smart Grid Use Case Template
Smart Grid Project
Review Date:
Policy No.:
IP-1 ISO Us es Synchrophas or da ta fo r g rid opera tions , con tro l and mode ling Version No.: 3.1 Effective Date 10/29/2010
Actor Name Actor Type (Person, device, system etc.)
Actor Description
flags and records files of data for analysis. It also monitors the overall measurement system and provides a display and record of performance. It can provide a number of specialized outputs, such as a direct interface to a SCADA or EMS system.
Super Phasor Data Concentrator (Super PDC)
Device Within a point-to-point phasor network architecture, The Super PDC is simply a central PDC that collects and correlates phasor data from all remote PDCs and PMUs and makes it available to a visualization software package. Typically, the Super PDC is also connected to a central database for long-term archiving of the collected data.
Phasor Visualization / Monitoring System
System Software application that supports real-time Dynamic Monitoring displays and analyzes synchrophasor data.
ISO Generation and Transmission Operators
Person Manages grid access, allocation and mitigation responsibilities. Directs the operation of the interconnection and voltage control equipment. Assists in the management of congestion conditions. Studies and analyzes the cause and extent of system disturbances and interruptions to determine the impact on ISO facilities. Pre-dispatches generation in accordance with operating procedures and related guidelines to ensure system reliability.
ISO Operations/System Planning Engineer
Person Prepares and conducts operating studies and contingency analyses, including power flow, short circuit, stability, and post-transient analyses, to maintain reliable operation of the grid. Extracts and analyzes data for use by Operations management and staff in related work
Transmission Owner Planning Engineer
Person Extracts and analyzes data for use by Transmission Owner management and staff in related work.
Systems Operations Analyst
Person Performs power flow studies and stability analysis for transmission and generation interconnections.
Smart Control Application
System Anticipates, detects, and responds to system problems with embedded sensors and automated controls.
SPS Application System Designed to detect system conditions known to cause unusual stress in the power system and take some type of predetermined action to counteract the observed condition in a controlled manner. The action prescribed may require the opening of one or more lines, tripping of generators, intentional shedding of load, or other measures that will alleviate the problem of concern.
Power System Technology Development Group
Organization Design, develop, support applications to enhance and improve the energy market system and its operation.
Page 8 of 28
Smart Grid Use Case Template
Smart Grid Project
Review Date:
Policy No.:
IP-1 ISO Us es Synchrophas or da ta fo r g rid opera tions , con tro l and mode ling Version No.: 3.1 Effective Date 10/29/2010
4. Assumptions 1. There are currently PMUs in place that have been configured in the ISO’s super PDC. 2. The existing process for registering and configuring new PMUs in the ISO’s super-PDC will continue
to be used as new PMUs become available. 3. The ISO has and will continue to have a Phasor Visualization/Monitoring system that will generate
the necessary alarms and provide Synchrophaser data for analysis. 4. Operating procedures that will determine ISO Generation/ Transmission Operators course of action
based on alarms generated have been established. 5. There are future plans for incorporating an edge router(s) that will also serve as a hub for all PDCs
in the WECC area in addition to the ISOs super PDC. 6. There are future plans to expand the communications network to many T1 data lines to move all of
the data generated by phasors throughout the Western Interconnection to the participating operators and reliability coordinators.
5. Preconditions 1. PMUs/PDCs are functioning and streaming data to the ISO Phasor Visualization/Monitoring System 2. ISO Generation/Transmission Operators, ISO Operation/System Planning Engineers and
Transmission Owner Planning Engineers have access to the Phasor Visualization/Monitoring System
3. ISO Generation/ Transmission Operators have access to the Operating procedures necessary to take corrective action based on the alarms generated from synchrophasor data
6. Post conditions 1. System disturbances captured by synchrophasor data are detected and corrected 2. System breakup occurrences are analyzed and resolved using synchrophasor data and other source
available to ISO Generation/ Transmission Operators 3. Synchrophasor data is available to engineers visually as well as other format required to carry out
post mortem analysis and model validation
7. Flow of Events The ISO has identified seven scenarios that demonstrate the use of synchrophasor data and how the ISO use this information to achieve greater grid reliability and stability.
Scenario 1 – A system alarm occurs and the system operator takes action based on established procedures as a result of the alarm: This scenario describes the process of using phasor measurement data to trigger alarms and the determination of recommended control actions and subsequent actions by the ISO Operator. The Alarm Types should include:
(i) Angle Differences
(ii) Modes of Oscillation
(iii) Rate of Damping
(iv) Absolute and Rate of Change of Frequency
(v) Voltage sensitivity (V/P slope)
Page 9 of 28
Smart Grid Use Case Template
Smart Grid Project
Review Date:
Policy No.:
IP-1 ISO Us es Synchrophas or da ta fo r g rid opera tions , con tro l and mode ling Version No.: 3.1 Effective Date 10/29/2010
An example of CAISO PMU data used for detecting oscillations was the Pacific DC Intertie event in January 2008. The oscillations were not visible on SCADA. The oscillations were observed by the Reliability Coordinator on the phasor monitoring system and the PDCI link was shut down. The “root cause” was the Big Eddy 500/230 kV ties which affected the PDCI lines.
Scenario 2 – System Restoration: Phasor data is used to observe the frequency difference between the main Grid and the islanded system. A system breakup occurs when one or more separate electrical islands are created following a major system disturbance. The challenge is to reconnect the separate pieces to the main grid. Synchrophasor measurements at the interconnecting substation or at the closest substations to the interconnecting station can be used to determine how much generation must be changed to move the frequency and phase angle between the two systems closer together if required to parallel the islands. An example of the separation of the power system into islands occurred in 2008 at Entergy when PMUs were used for islanding and restoration. By having the PMUs' global positioning system (GPS) time-synchronized and measurements at 30 samples per sec, Entergy had an advantage not possible with SCADA.
Scenario 3 – Post mortem analysis: An application such a phasor grid dynamics analyzer will deconstruct events that will assist the ISO in determining the cause of system disturbances. Post mortem analysis is performed offline with archived PMU data for validating models and refining contingency analysis algorithms. Pre-processing must be done to condition data for analysis. This should include:
(I) Interpolation – Used to patch data gaps such as linear, cubic, nearest neighbor.
(II) Detrending – or remove underlying data trends such as mean, linear, first or last value.
(III) Low pass Filtering – Low pass filter the data to eliminate higher frequency content
(IV) Down sampling – Resample the data at a lower rate after low pass anti-alias filtering.
(V) Normalization – Normalize the data’s dynamic range such as max-value and std. deviation.
Scenario 4 – Model Validation: Phasor data is the key to validating the network and market models for new types of resources such as wind generators, concentrated solar generators, and photovoltaic systems that will be added to the system over the next 10 years. An example of model validation is the 07/29/03 event - 1252 MW unit trip at Palo Verde.
Scenario 5 – Smart SPS Application: Detect transient instability, formulate response measures that are tailored for the specific system conditions and trigger automated protection actions. Identify controls that can respond to specific local or wide-area grid problems. Use real-time data to drive control of corrective measures for angular stability, voltage stability and low-frequency oscillations. Real-time phasor data allow identification of grid events and the evaluation of appropriate system protection measures. It will also improve grid reliability by improving transfer capabilities and transient stability in the WECC Grid.
Scenario 6 – Smart Control Application: Identify poorly damped inter-area oscillations. Detune and damp the oscillations by automatically injecting real or reactive power using real-time synchrophasor information and/or reinserting series capacitors or other reactive devices that will increase the damping of the oscillation by reducing the impedance and angle between the clusters of generators that are swinging against each other. These actions can be detected and dampened in milliseconds. An example of a Smart Control Application in Iceland is the use of phasor data for tuning power system stabilizers.
Page 10 of 28
Smart Grid Use Case Template
Smart Grid Project
Review Date:
Policy No.:
IP-1 ISO Us es Synchrophas or da ta fo r g rid opera tions , con tro l and mode ling Version No.: 3.1 Effective Date 10/29/2010
Scenario 7 – Optimize Transmission Capacity: The Smart SPS Application (Scenario 5) and Smart Control Application (Scenario 6) may be utilized in conjunction with synchrophasors to raise transmission lines’ Operating Transfer Capability (OTC) close to its thermal limits (Total Transfer Capability) in real-time. A Smart SPS Application can continuously detect and mitigate critical conditions in real-time. PMU data can detect post contingency violations and trigger the Smart SPS Application to mitigate the violation by reconfiguring the system (increasing generation or load shedding). The Smart Control Application will utilize real-time PMU data to provide damping for stability limited paths, eliminating stability limits and raising the transfer capability to the N-1 limits. Pulsed MW injections are recommended for stabilization at either ends of the Pacific DC Intertie in [14].
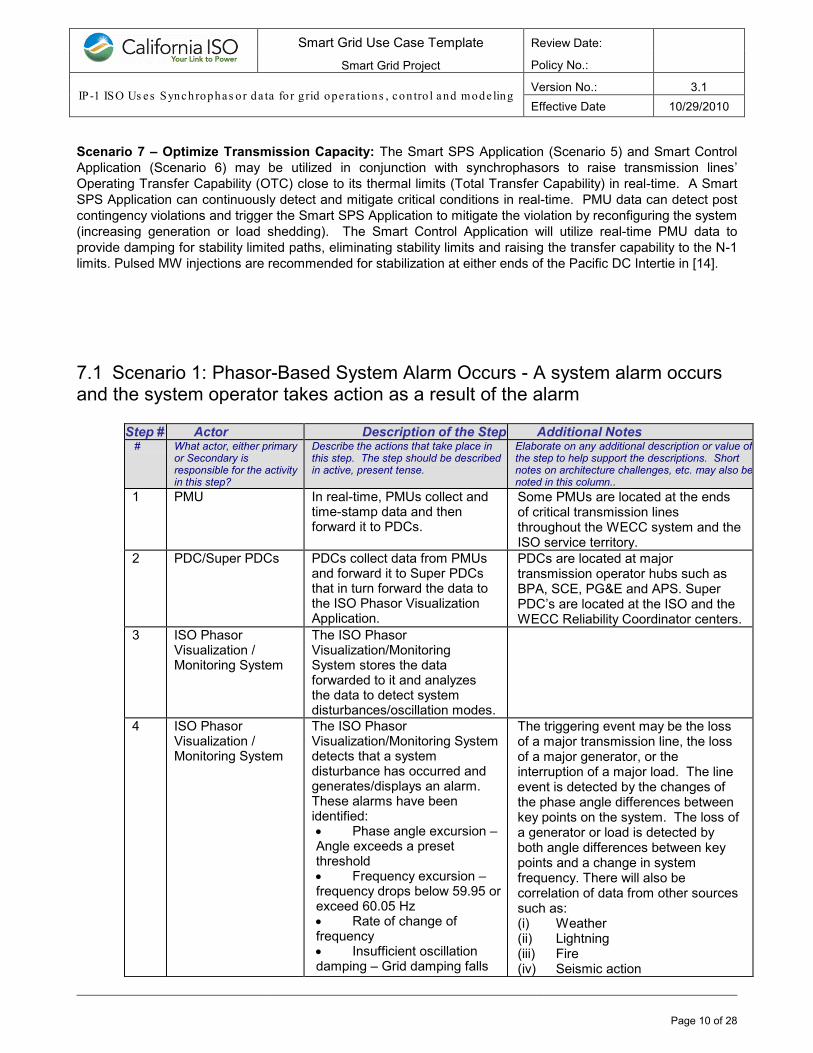
7.1 Scenario 1: Phasor-Based System Alarm Occurs - A system alarm occurs and the system operator takes action as a result of the alarm
Step # Actor Description of the Step Additional Notes # What actor, either primary
or Secondary is responsible for the activity in this step?
Describe the actions that take place in this step. The step should be described in active, present tense.
Elaborate on any additional description or value of the step to help support the descriptions. Short notes on architecture challenges, etc. may also be noted in this column..
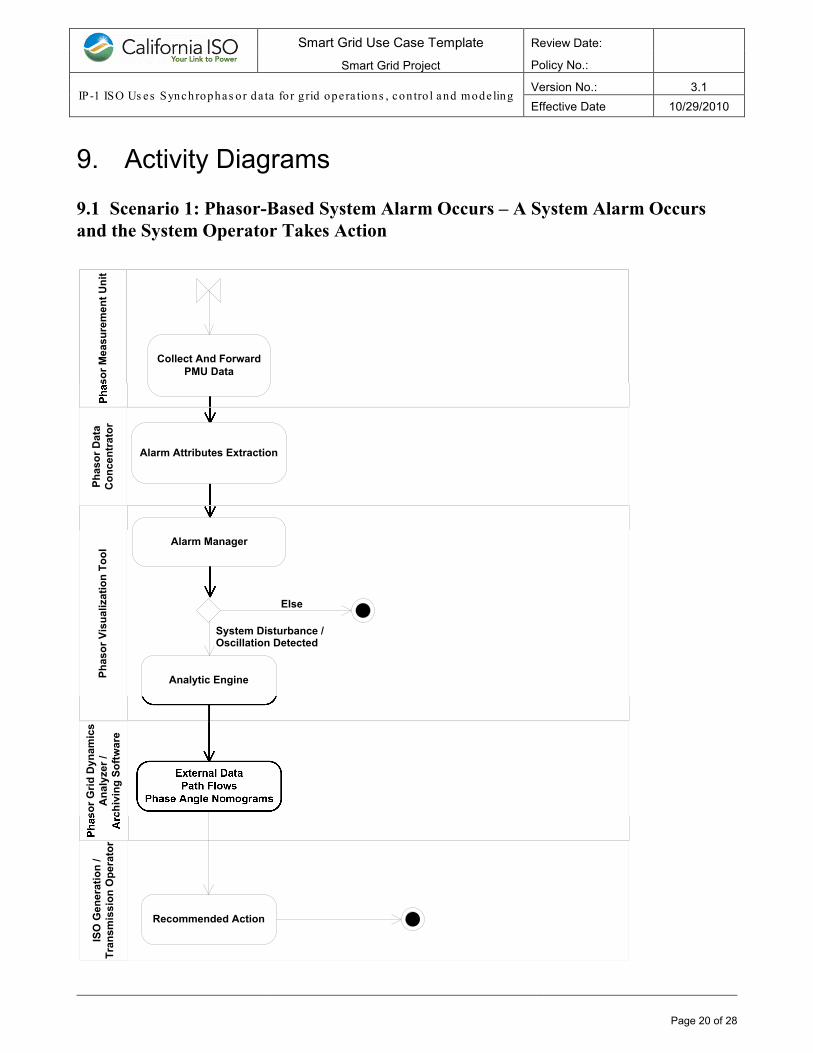
1 PMU In real-time, PMUs collect and time-stamp data and then forward it to PDCs.
Some PMUs are located at the ends of critical transmission lines throughout the WECC system and the ISO service territory.
2 PDC/Super PDCs PDCs collect data from PMUs and forward it to Super PDCs that in turn forward the data to the ISO Phasor Visualization Application.
PDCs are located at major transmission operator hubs such as BPA, SCE, PG&E and APS. Super PDC’s are located at the ISO and the WECC Reliability Coordinator centers.
3 ISO Phasor Visualization / Monitoring System
The ISO Phasor Visualization/Monitoring System stores the data forwarded to it and analyzes the data to detect system disturbances/oscillation modes.
4 ISO Phasor Visualization / Monitoring System
The ISO Phasor Visualization/Monitoring System detects that a system disturbance has occurred and generates/displays an alarm. These alarms have been identified: • Phase angle excursion – Angle exceeds a preset threshold • Frequency excursion – frequency drops below 59.95 or exceed 60.05 Hz • Rate of change of frequency • Insufficient oscillation damping – Grid damping falls
The triggering event may be the loss of a major transmission line, the loss of a major generator, or the interruption of a major load. The line event is detected by the changes of the phase angle differences between key points on the system. The loss of a generator or load is detected by both angle differences between key points and a change in system frequency. There will also be correlation of data from other sources such as: (i) Weather (ii) Lightning (iii) Fire (iv) Seismic action
Page 11 of 28
Smart Grid Use Case Template
Smart Grid Project
Review Date:
Policy No.:
IP-1 ISO Us es Synchrophas or da ta fo r g rid opera tions , con tro l and mode ling Version No.: 3.1 Effective Date 10/29/2010
Step # Actor Description of the Step Additional Notes # What actor, either primary
or Secondary is responsible for the activity in this step?
Describe the actions that take place in this step. The step should be described in active, present tense.
Elaborate on any additional description or value of the step to help support the descriptions. Short notes on architecture challenges, etc. may also be noted in this column..
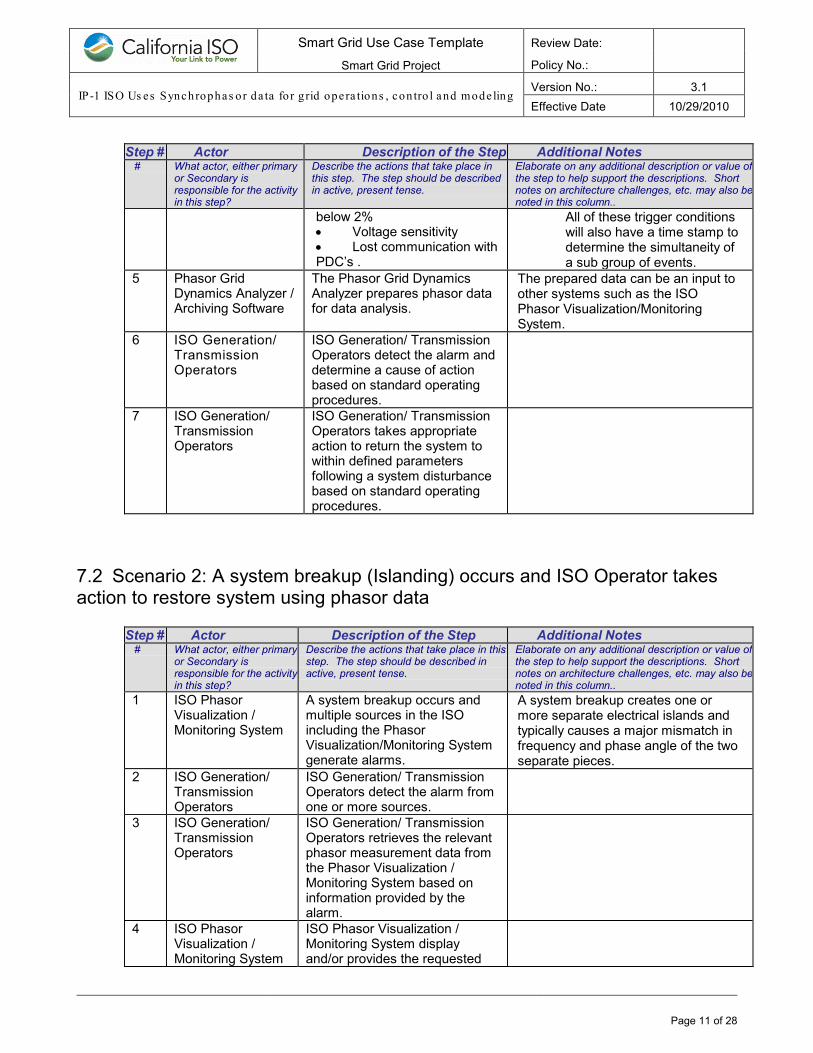
below 2% • Voltage sensitivity • Lost communication with PDC’s .
All of these trigger conditions will also have a time stamp to determine the simultaneity of a sub group of events.
5 Phasor Grid Dynamics Analyzer / Archiving Software
The Phasor Grid Dynamics Analyzer prepares phasor data for data analysis.
The prepared data can be an input to other systems such as the ISO Phasor Visualization/Monitoring System.
6 ISO Generation/ Transmission Operators
ISO Generation/ Transmission Operators detect the alarm and determine a cause of action based on standard operating procedures.
7 ISO Generation/ Transmission Operators
ISO Generation/ Transmission Operators takes appropriate action to return the system to within defined parameters following a system disturbance based on standard operating procedures.
7.2 Scenario 2: A system breakup (Islanding) occurs and ISO Operator takes action to restore system using phasor data
Step # Actor Description of the Step Additional Notes # What actor, either primary
or Secondary is responsible for the activity in this step?
Describe the actions that take place in this step. The step should be described in active, present tense.
Elaborate on any additional description or value of the step to help support the descriptions. Short notes on architecture challenges, etc. may also be noted in this column..
1 ISO Phasor Visualization / Monitoring System
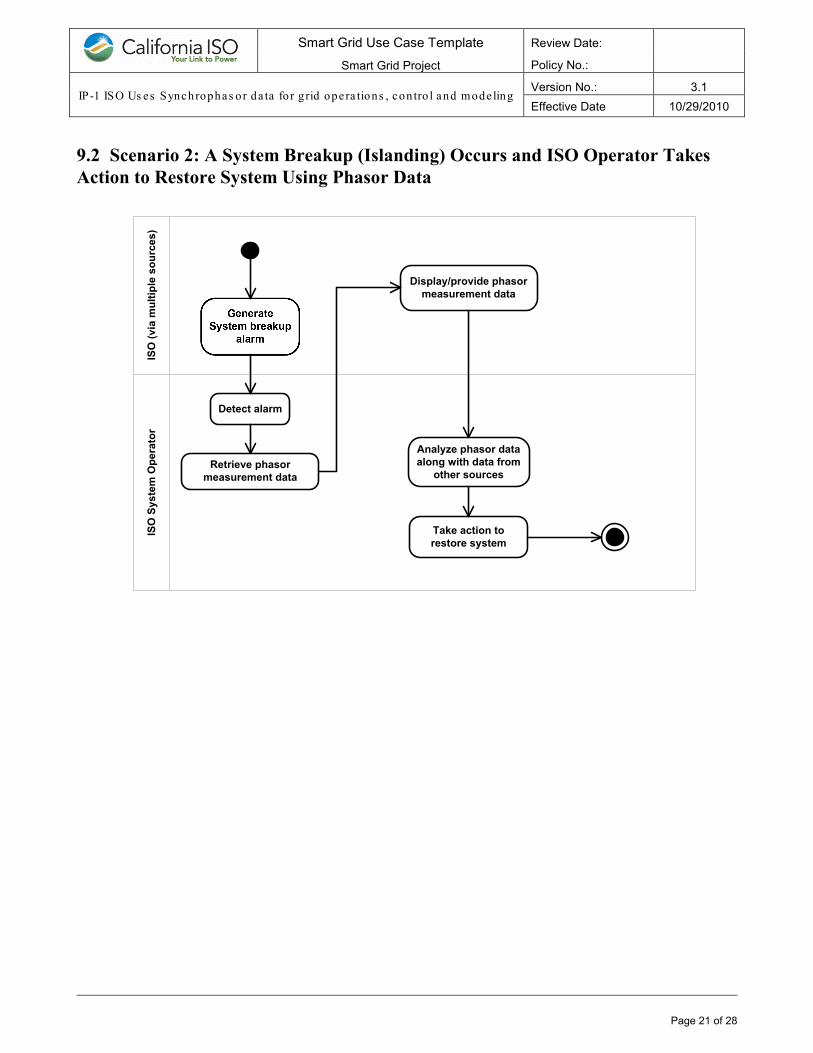
A system breakup occurs and multiple sources in the ISO including the Phasor Visualization/Monitoring System generate alarms.
A system breakup creates one or more separate electrical islands and typically causes a major mismatch in frequency and phase angle of the two separate pieces.
2 ISO Generation/ Transmission Operators
ISO Generation/ Transmission Operators detect the alarm from one or more sources.
3 ISO Generation/ Transmission Operators
ISO Generation/ Transmission Operators retrieves the relevant phasor measurement data from the Phasor Visualization / Monitoring System based on information provided by the alarm.
4 ISO Phasor Visualization / Monitoring System
ISO Phasor Visualization / Monitoring System display and/or provides the requested
Page 12 of 28
Smart Grid Use Case Template
Smart Grid Project
Review Date:
Policy No.:
IP-1 ISO Us es Synchrophas or da ta fo r g rid opera tions , con tro l and mode ling Version No.: 3.1 Effective Date 10/29/2010
Step # Actor Description of the Step Additional Notes # What actor, either primary
or Secondary is responsible for the activity in this step?
Describe the actions that take place in this step. The step should be described in active, present tense.
Elaborate on any additional description or value of the step to help support the descriptions. Short notes on architecture challenges, etc. may also be noted in this column..
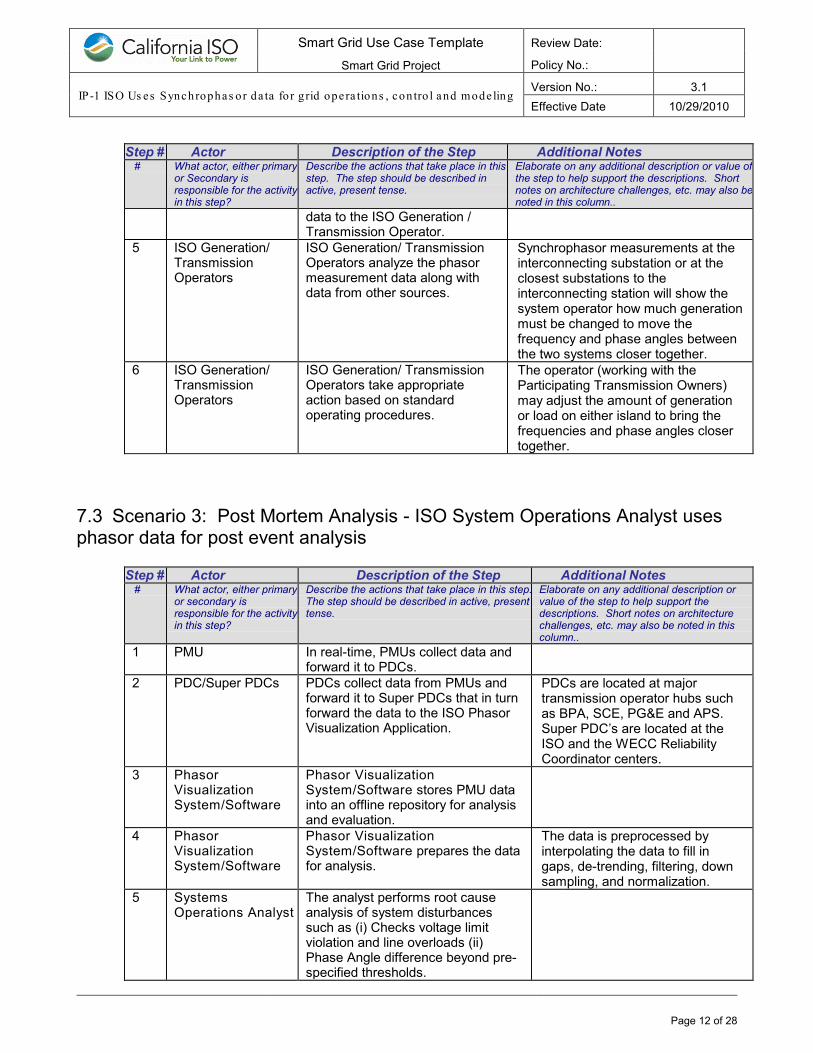
data to the ISO Generation / Transmission Operator.
5 ISO Generation/ Transmission Operators
ISO Generation/ Transmission Operators analyze the phasor measurement data along with data from other sources.
Synchrophasor measurements at the interconnecting substation or at the closest substations to the interconnecting station will show the system operator how much generation must be changed to move the frequency and phase angles between the two systems closer together.
6 ISO Generation/ Transmission Operators
ISO Generation/ Transmission Operators take appropriate action based on standard operating procedures.
The operator (working with the Participating Transmission Owners) may adjust the amount of generation or load on either island to bring the frequencies and phase angles closer together.
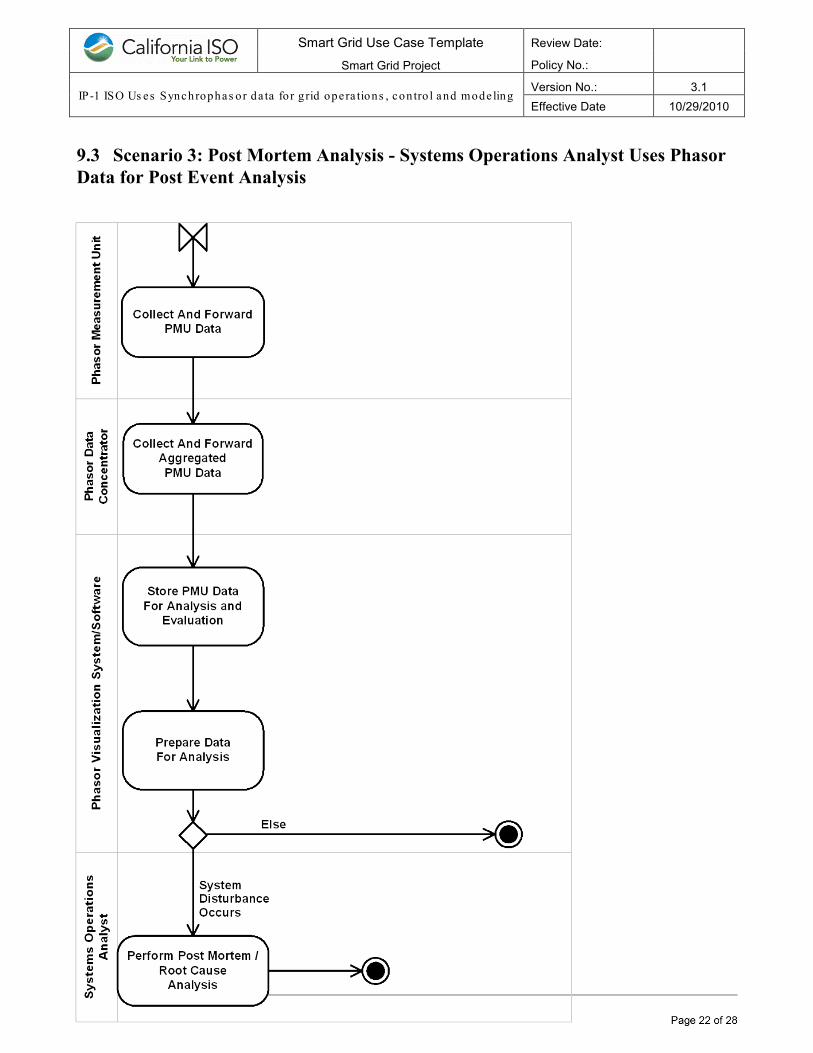
7.3 Scenario 3: Post Mortem Analysis - ISO System Operations Analyst uses phasor data for post event analysis
Step # Actor Description of the Step Additional Notes # What actor, either primary
or secondary is responsible for the activity in this step?
Describe the actions that take place in this step. The step should be described in active, present tense.
Elaborate on any additional description or value of the step to help support the descriptions. Short notes on architecture challenges, etc. may also be noted in this column..
1 PMU In real-time, PMUs collect data and forward it to PDCs.
2 PDC/Super PDCs PDCs collect data from PMUs and forward it to Super PDCs that in turn forward the data to the ISO Phasor Visualization Application.
PDCs are located at major transmission operator hubs such as BPA, SCE, PG&E and APS. Super PDC’s are located at the ISO and the WECC Reliability Coordinator centers.
3 Phasor Visualization System/Software
Phasor Visualization System/Software stores PMU data into an offline repository for analysis and evaluation.
4 Phasor Visualization System/Software
Phasor Visualization System/Software prepares the data for analysis.
The data is preprocessed by interpolating the data to fill in gaps, de-trending, filtering, down sampling, and normalization.
5 Systems Operations Analyst
The analyst performs root cause analysis of system disturbances such as (i) Checks voltage limit violation and line overloads (ii) Phase Angle difference beyond pre-specified thresholds.
Page 13 of 28
Smart Grid Use Case Template
Smart Grid Project
Review Date:
Policy No.:
IP-1 ISO Us es Synchrophas or da ta fo r g rid opera tions , con tro l and mode ling Version No.: 3.1 Effective Date 10/29/2010
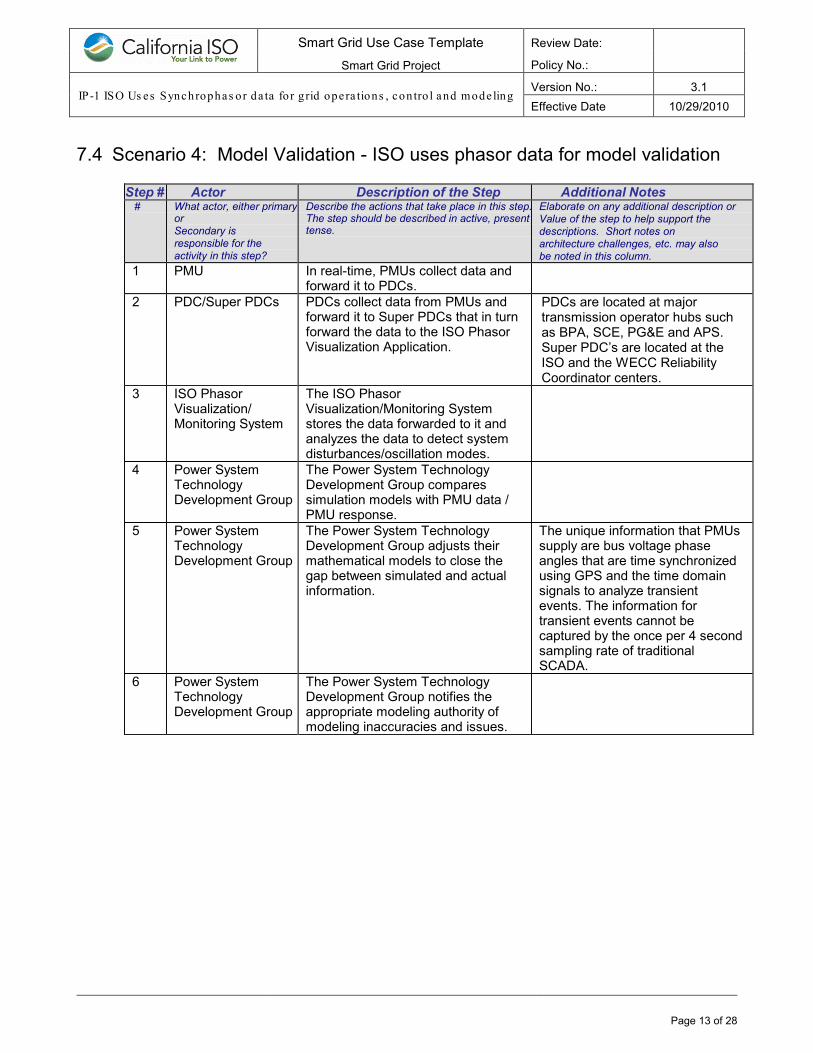
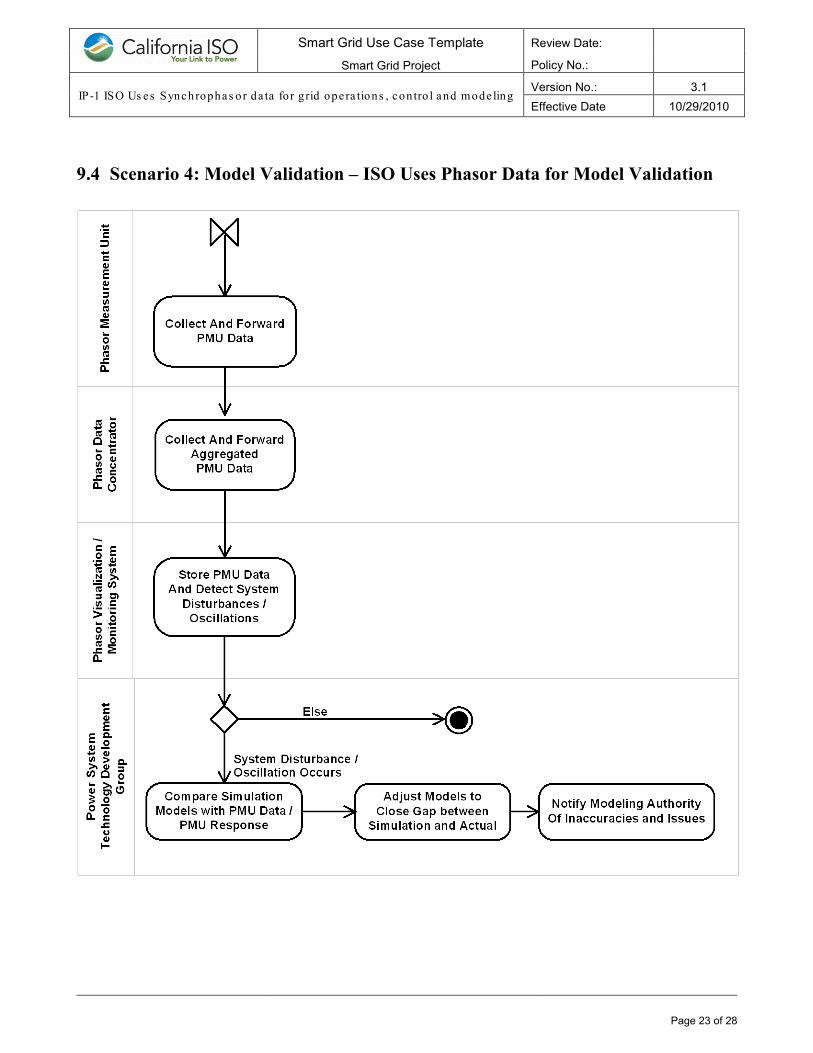
7.4 Scenario 4: Model Validation - ISO uses phasor data for model validation
Step # Actor Description of the Step Additional Notes # What actor, either primary
or Secondary is responsible for the activity in this step?
Describe the actions that take place in this step. The step should be described in active, present tense.
Elaborate on any additional description or Value of the step to help support the descriptions. Short notes on architecture challenges, etc. may also be noted in this column.
1 PMU In real-time, PMUs collect data and forward it to PDCs.
2 PDC/Super PDCs PDCs collect data from PMUs and forward it to Super PDCs that in turn forward the data to the ISO Phasor Visualization Application.
PDCs are located at major transmission operator hubs such as BPA, SCE, PG&E and APS. Super PDC’s are located at the ISO and the WECC Reliability Coordinator centers.
3 ISO Phasor Visualization/ Monitoring System
The ISO Phasor Visualization/Monitoring System stores the data forwarded to it and analyzes the data to detect system disturbances/oscillation modes.
4 Power System Technology Development Group
The Power System Technology Development Group compares simulation models with PMU data / PMU response.
5 Power System Technology Development Group
The Power System Technology Development Group adjusts their mathematical models to close the gap between simulated and actual information.
The unique information that PMUs supply are bus voltage phase angles that are time synchronized using GPS and the time domain signals to analyze transient events. The information for transient events cannot be captured by the once per 4 second sampling rate of traditional SCADA.
6 Power System Technology Development Group
The Power System Technology Development Group notifies the appropriate modeling authority of modeling inaccuracies and issues.
Page 14 of 28
Smart Grid Use Case Template
Smart Grid Project
Review Date:
Policy No.:
IP-1 ISO Us es Synchrophas or da ta fo r g rid opera tions , con tro l and mode ling Version No.: 3.1 Effective Date 10/29/2010
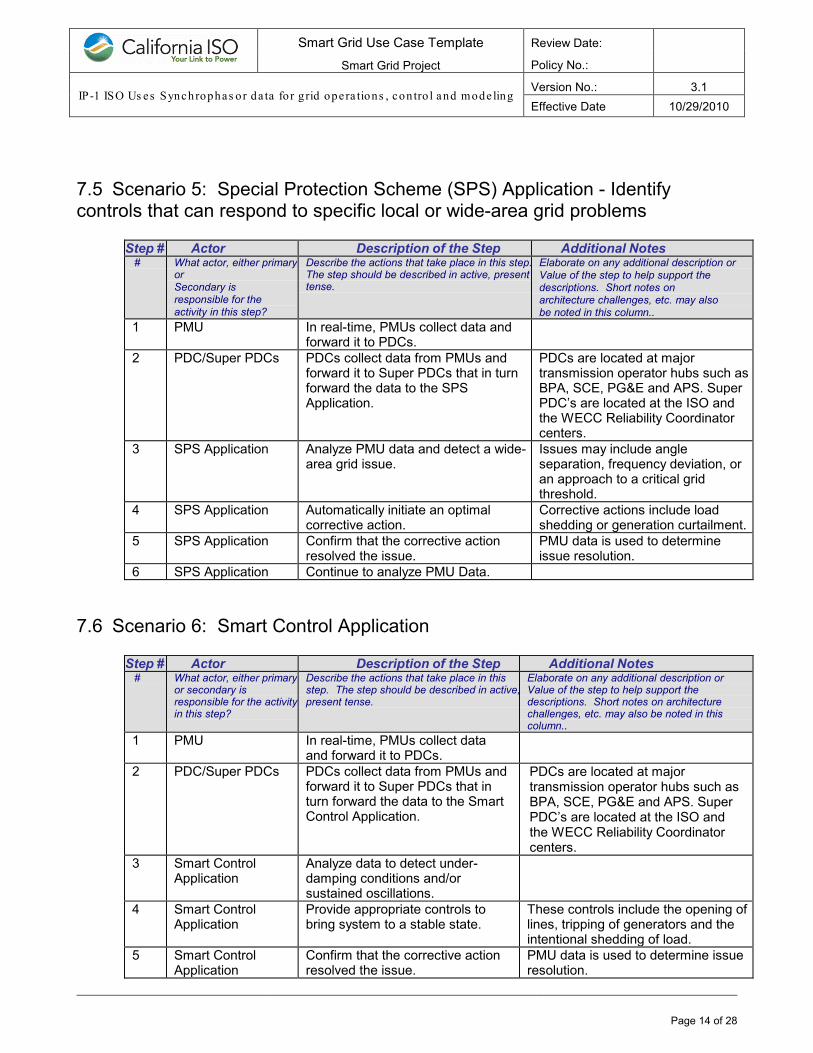
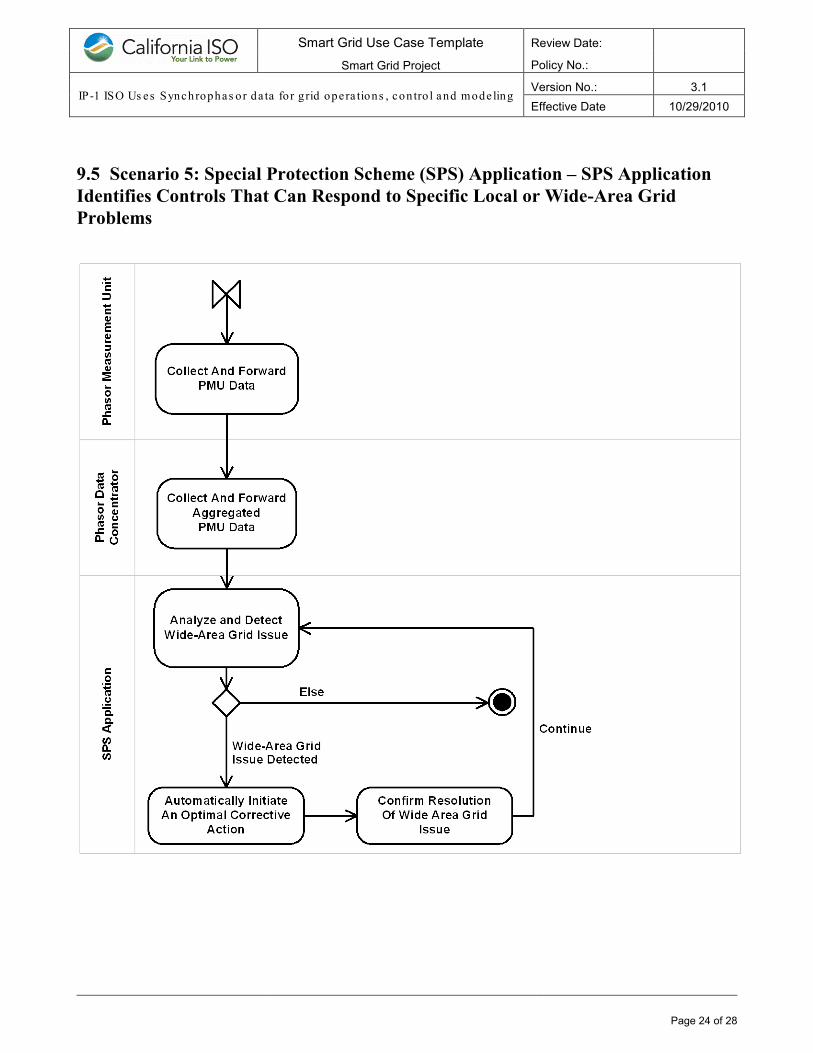
7.5 Scenario 5: Special Protection Scheme (SPS) Application - Identify controls that can respond to specific local or wide-area grid problems
Step # Actor Description of the Step Additional Notes # What actor, either primary
or Secondary is responsible for the activity in this step?
Describe the actions that take place in this step. The step should be described in active, present tense.
Elaborate on any additional description or Value of the step to help support the descriptions. Short notes on architecture challenges, etc. may also be noted in this column..
1 PMU In real-time, PMUs collect data and forward it to PDCs.
2 PDC/Super PDCs PDCs collect data from PMUs and forward it to Super PDCs that in turn forward the data to the SPS Application.
PDCs are located at major transmission operator hubs such as BPA, SCE, PG&E and APS. Super PDC’s are located at the ISO and the WECC Reliability Coordinator centers.
3 SPS Application Analyze PMU data and detect a wide-area grid issue.
Issues may include angle separation, frequency deviation, or an approach to a critical grid threshold.
4 SPS Application Automatically initiate an optimal corrective action.
Corrective actions include load shedding or generation curtailment.
5 SPS Application Confirm that the corrective action resolved the issue.
PMU data is used to determine issue resolution.
6 SPS Application Continue to analyze PMU Data.
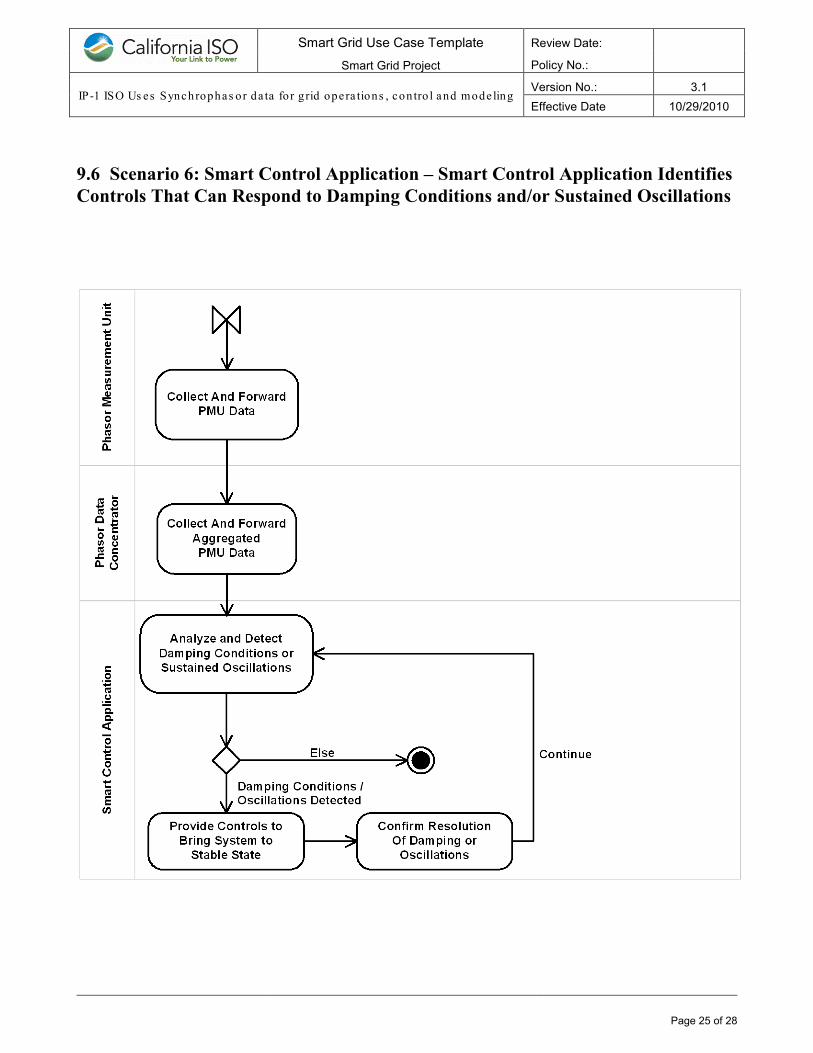
7.6 Scenario 6: Smart Control Application
Step # Actor Description of the Step Additional Notes # What actor, either primary
or secondary is responsible for the activity in this step?
Describe the actions that take place in this step. The step should be described in active, present tense.
Elaborate on any additional description or Value of the step to help support the descriptions. Short notes on architecture challenges, etc. may also be noted in this column..
1 PMU In real-time, PMUs collect data and forward it to PDCs.
2 PDC/Super PDCs PDCs collect data from PMUs and forward it to Super PDCs that in turn forward the data to the Smart Control Application.
PDCs are located at major transmission operator hubs such as BPA, SCE, PG&E and APS. Super PDC’s are located at the ISO and the WECC Reliability Coordinator centers.
3 Smart Control Application
Analyze data to detect under-damping conditions and/or sustained oscillations.
4 Smart Control Application
Provide appropriate controls to bring system to a stable state.
These controls include the opening of lines, tripping of generators and the intentional shedding of load.
5 Smart Control Application
Confirm that the corrective action resolved the issue.
PMU data is used to determine issue resolution.
Page 15 of 28
Smart Grid Use Case Template
Smart Grid Project
Review Date:
Policy No.:
IP-1 ISO Us es Synchrophas or da ta fo r g rid opera tions , con tro l and mode ling Version No.: 3.1 Effective Date 10/29/2010
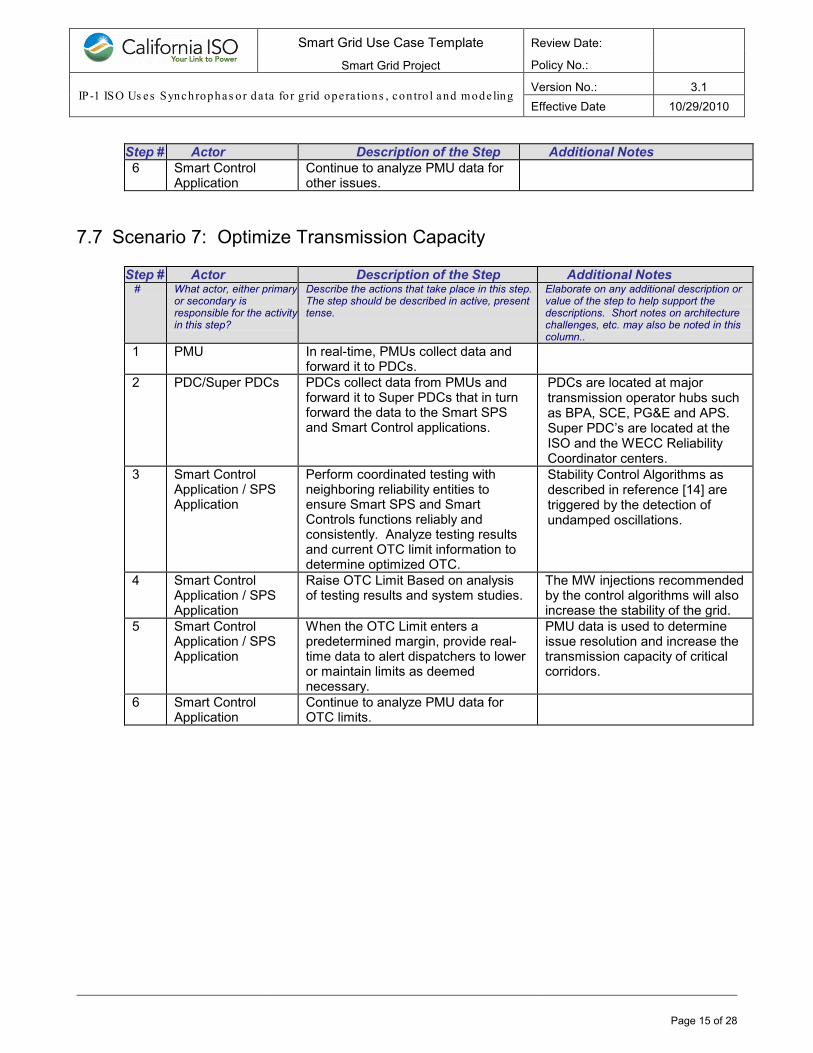
Step # Actor Description of the Step Additional Notes 6 Smart Control
Application Continue to analyze PMU data for other issues.
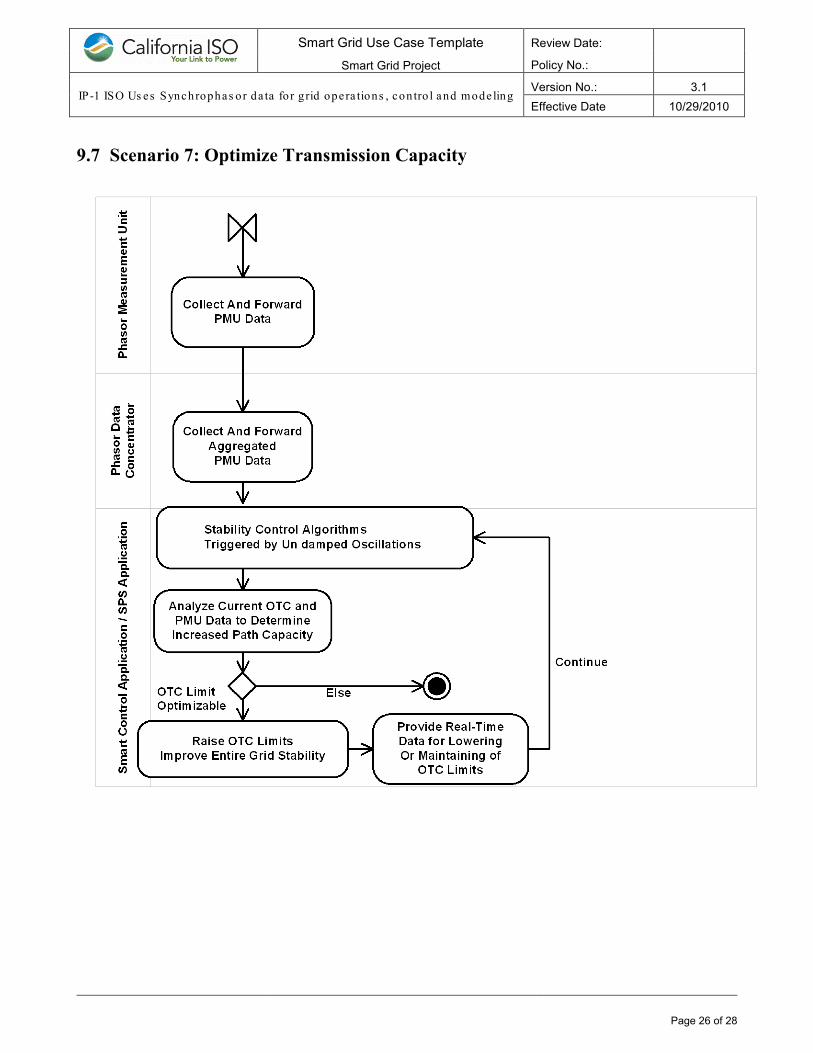
7.7 Scenario 7: Optimize Transmission Capacity
Step # Actor Description of the Step Additional Notes # What actor, either primary
or secondary is responsible for the activity in this step?
Describe the actions that take place in this step. The step should be described in active, present tense.
Elaborate on any additional description or value of the step to help support the descriptions. Short notes on architecture challenges, etc. may also be noted in this column..
1 PMU In real-time, PMUs collect data and forward it to PDCs.
2 PDC/Super PDCs PDCs collect data from PMUs and forward it to Super PDCs that in turn forward the data to the Smart SPS and Smart Control applications.
PDCs are located at major transmission operator hubs such as BPA, SCE, PG&E and APS. Super PDC’s are located at the ISO and the WECC Reliability Coordinator centers.
3 Smart Control Application / SPS Application
Perform coordinated testing with neighboring reliability entities to ensure Smart SPS and Smart Controls functions reliably and consistently. Analyze testing results and current OTC limit information to determine optimized OTC.
Stability Control Algorithms as described in reference [14] are triggered by the detection of undamped oscillations.
4 Smart Control Application / SPS Application
Raise OTC Limit Based on analysis of testing results and system studies.
The MW injections recommended by the control algorithms will also increase the stability of the grid.
5 Smart Control Application / SPS Application
When the OTC Limit enters a predetermined margin, provide real-time data to alert dispatchers to lower or maintain limits as deemed necessary.
PMU data is used to determine issue resolution and increase the transmission capacity of critical corridors.
6 Smart Control Application
Continue to analyze PMU data for OTC limits.
Page 16 of 28
Smart Grid Use Case Template
Smart Grid Project
Review Date:
Policy No.:
IP-1 ISO Us es Synchrophas or da ta fo r g rid opera tions , con tro l and mode ling Version No.: 3.1 Effective Date 10/29/2010
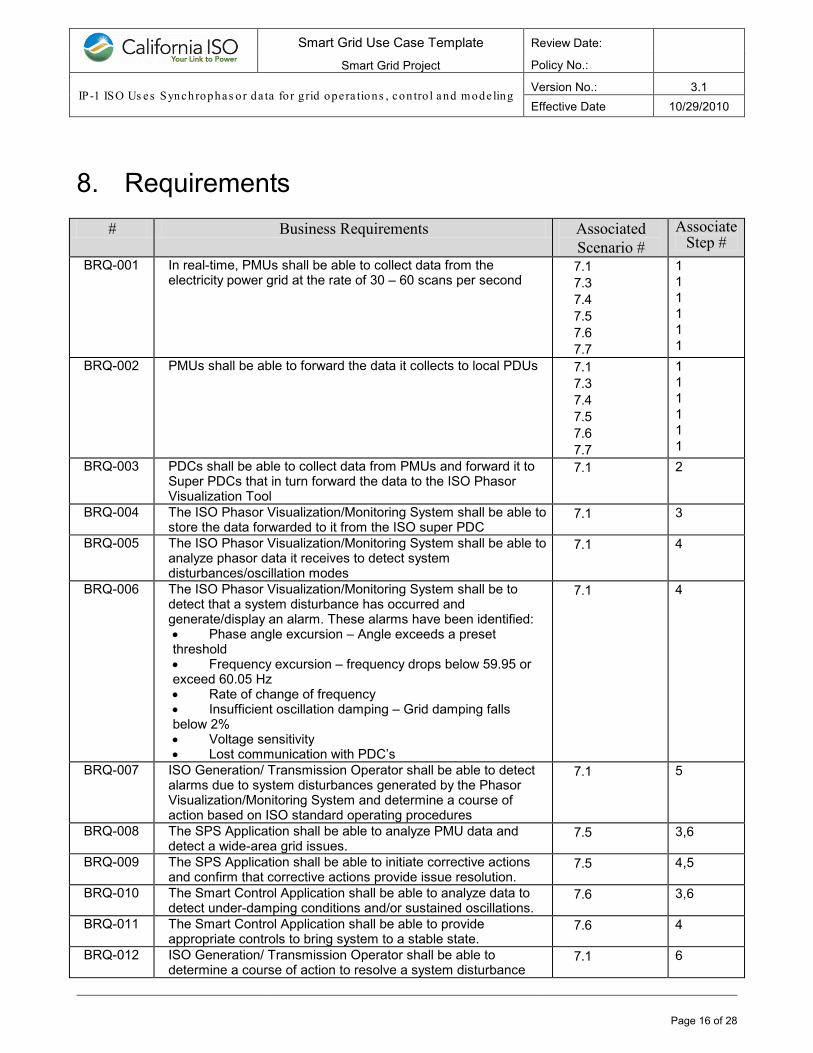
8. Requirements
# Business Requirements Associated Scenario #
Associate Step #
BRQ-001 In real-time, PMUs shall be able to collect data from the electricity power grid at the rate of 30 – 60 scans per second
7.1 7.3 7.4 7.5 7.6 7.7
1 1 1 1 1 1
BRQ-002 PMUs shall be able to forward the data it collects to local PDUs 7.1 7.3 7.4 7.5 7.6 7.7
1 1 1 1 1 1
BRQ-003 PDCs shall be able to collect data from PMUs and forward it to Super PDCs that in turn forward the data to the ISO Phasor Visualization Tool
7.1 2
BRQ-004 The ISO Phasor Visualization/Monitoring System shall be able to store the data forwarded to it from the ISO super PDC
7.1 3
BRQ-005 The ISO Phasor Visualization/Monitoring System shall be able to analyze phasor data it receives to detect system disturbances/oscillation modes
7.1
4
BRQ-006 The ISO Phasor Visualization/Monitoring System shall be to detect that a system disturbance has occurred and generate/display an alarm. These alarms have been identified: • Phase angle excursion – Angle exceeds a preset threshold • Frequency excursion – frequency drops below 59.95 or exceed 60.05 Hz • Rate of change of frequency • Insufficient oscillation damping – Grid damping falls below 2% • Voltage sensitivity • Lost communication with PDC’s
7.1 4
BRQ-007 ISO Generation/ Transmission Operator shall be able to detect alarms due to system disturbances generated by the Phasor Visualization/Monitoring System and determine a course of action based on ISO standard operating procedures
7.1 5
BRQ-008 The SPS Application shall be able to analyze PMU data and detect a wide-area grid issues.
7.5 3,6
BRQ-009 The SPS Application shall be able to initiate corrective actions and confirm that corrective actions provide issue resolution.
7.5 4,5
BRQ-010 The Smart Control Application shall be able to analyze data to detect under-damping conditions and/or sustained oscillations.
7.6 3,6
BRQ-011 The Smart Control Application shall be able to provide appropriate controls to bring system to a stable state.
7.6 4
BRQ-012 ISO Generation/ Transmission Operator shall be able to determine a course of action to resolve a system disturbance
7.1 6
Page 17 of 28
Smart Grid Use Case Template
Smart Grid Project
Review Date:
Policy No.:
IP-1 ISO Us es Synchrophas or da ta fo r g rid opera tions , con tro l and mode ling Version No.: 3.1 Effective Date 10/29/2010
# Business Requirements Associated Scenario #
Associate Step #
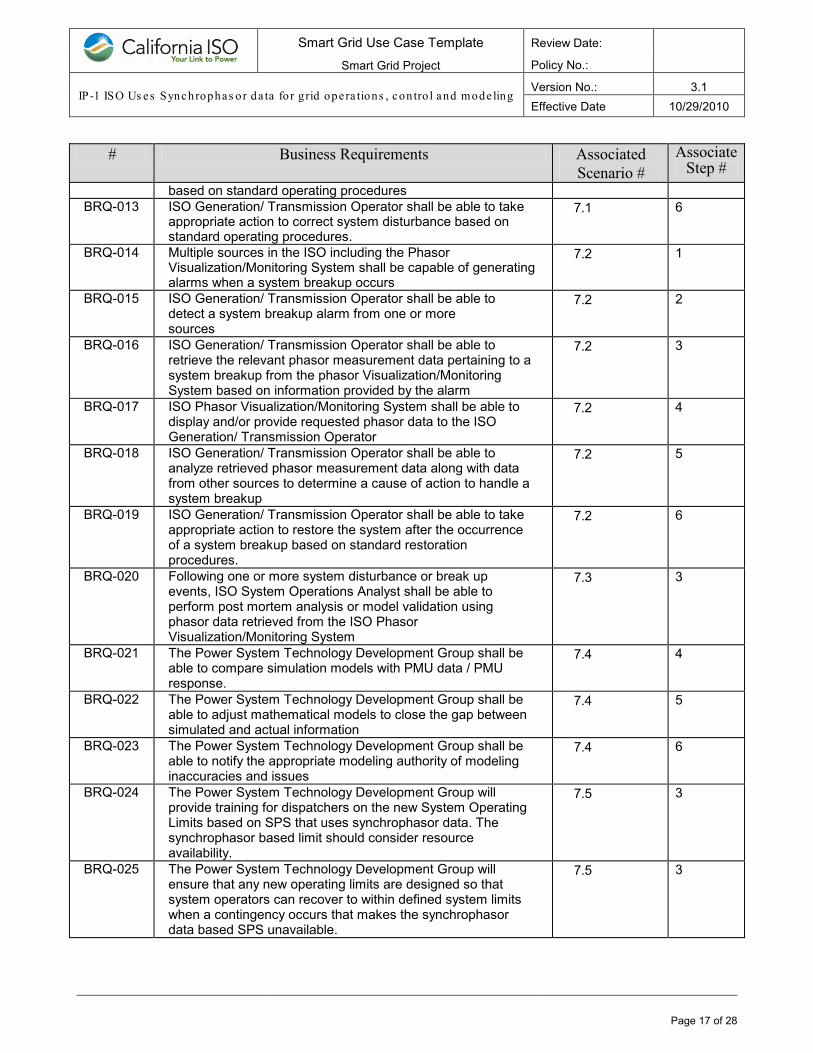
based on standard operating procedures BRQ-013 ISO Generation/ Transmission Operator shall be able to take
appropriate action to correct system disturbance based on standard operating procedures.
7.1 6
BRQ-014 Multiple sources in the ISO including the Phasor Visualization/Monitoring System shall be capable of generating alarms when a system breakup occurs
7.2 1
BRQ-015 ISO Generation/ Transmission Operator shall be able to detect a system breakup alarm from one or more sources
7.2 2
BRQ-016 ISO Generation/ Transmission Operator shall be able to retrieve the relevant phasor measurement data pertaining to a system breakup from the phasor Visualization/Monitoring System based on information provided by the alarm
7.2 3
BRQ-017 ISO Phasor Visualization/Monitoring System shall be able to display and/or provide requested phasor data to the ISO Generation/ Transmission Operator
7.2 4
BRQ-018 ISO Generation/ Transmission Operator shall be able to analyze retrieved phasor measurement data along with data from other sources to determine a cause of action to handle a system breakup
7.2 5
BRQ-019 ISO Generation/ Transmission Operator shall be able to take appropriate action to restore the system after the occurrence of a system breakup based on standard restoration procedures.
7.2 6
BRQ-020 Following one or more system disturbance or break up events, ISO System Operations Analyst shall be able to perform post mortem analysis or model validation using phasor data retrieved from the ISO Phasor Visualization/Monitoring System
7.3 3
BRQ-021 The Power System Technology Development Group shall be able to compare simulation models with PMU data / PMU response.
7.4 4
BRQ-022 The Power System Technology Development Group shall be able to adjust mathematical models to close the gap between simulated and actual information
7.4 5
BRQ-023 The Power System Technology Development Group shall be able to notify the appropriate modeling authority of modeling inaccuracies and issues
7.4 6
BRQ-024 The Power System Technology Development Group will provide training for dispatchers on the new System Operating Limits based on SPS that uses synchrophasor data. The synchrophasor based limit should consider resource availability.
7.5 3
BRQ-025 The Power System Technology Development Group will ensure that any new operating limits are designed so that system operators can recover to within defined system limits when a contingency occurs that makes the synchrophasor data based SPS unavailable.
7.5 3
Page 18 of 28
Smart Grid Use Case Template
Smart Grid Project
Review Date:
Policy No.:
IP-1 ISO Us es Synchrophas or da ta fo r g rid opera tions , con tro l and mode ling Version No.: 3.1 Effective Date 10/29/2010
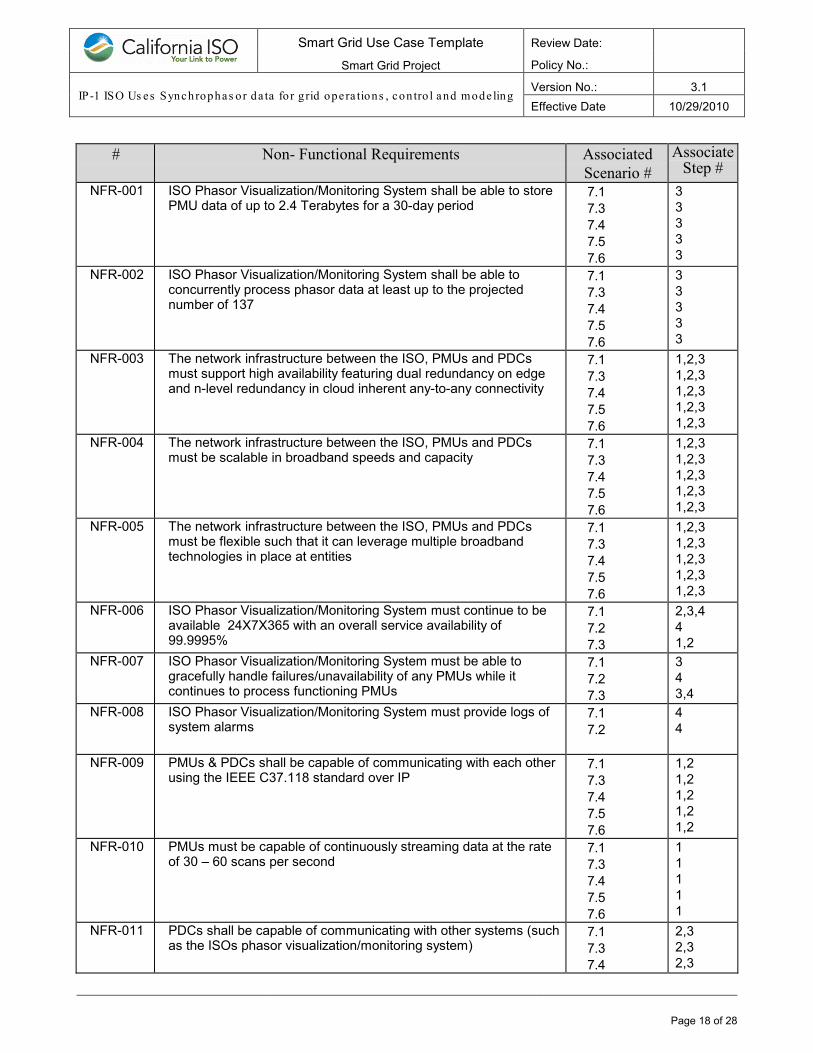
# Non- Functional Requirements Associated Scenario #
Associate Step #
NFR-001 ISO Phasor Visualization/Monitoring System shall be able to store PMU data of up to 2.4 Terabytes for a 30-day period
7.1 7.3 7.4 7.5 7.6
3 3 3 3 3
NFR-002 ISO Phasor Visualization/Monitoring System shall be able to concurrently process phasor data at least up to the projected number of 137
7.1 7.3 7.4 7.5 7.6
3 3 3 3 3
NFR-003 The network infrastructure between the ISO, PMUs and PDCs must support high availability featuring dual redundancy on edge and n-level redundancy in cloud inherent any-to-any connectivity
7.1 7.3 7.4 7.5 7.6
1,2,3 1,2,3 1,2,3 1,2,3 1,2,3
NFR-004 The network infrastructure between the ISO, PMUs and PDCs must be scalable in broadband speeds and capacity
7.1 7.3 7.4 7.5 7.6
1,2,3 1,2,3 1,2,3 1,2,3 1,2,3
NFR-005 The network infrastructure between the ISO, PMUs and PDCs must be flexible such that it can leverage multiple broadband technologies in place at entities
7.1 7.3 7.4 7.5 7.6
1,2,3 1,2,3 1,2,3 1,2,3 1,2,3
NFR-006 ISO Phasor Visualization/Monitoring System must continue to be available 24X7X365 with an overall service availability of 99.9995%
7.1 7.2 7.3
2,3,4 4 1,2
NFR-007 ISO Phasor Visualization/Monitoring System must be able to gracefully handle failures/unavailability of any PMUs while it continues to process functioning PMUs
7.1 7.2 7.3
3 4 3,4
NFR-008 ISO Phasor Visualization/Monitoring System must provide logs of system alarms
7.1 7.2
4 4
NFR-009 PMUs & PDCs shall be capable of communicating with each other using the IEEE C37.118 standard over IP
7.1 7.3 7.4 7.5 7.6
1,2 1,2 1,2 1,2 1,2
NFR-010 PMUs must be capable of continuously streaming data at the rate of 30 – 60 scans per second
7.1 7.3 7.4 7.5 7.6
1 1 1 1 1
NFR-011 PDCs shall be capable of communicating with other systems (such as the ISOs phasor visualization/monitoring system)
7.1 7.3 7.4
2,3 2,3 2,3
Page 19 of 28
Smart Grid Use Case Template
Smart Grid Project
Review Date:
Policy No.:
IP-1 ISO Us es Synchrophas or da ta fo r g rid opera tions , con tro l and mode ling Version No.: 3.1 Effective Date 10/29/2010
# Non- Functional Requirements Associated Scenario #
Associate Step #
7.5 7.6
2,3 2,3
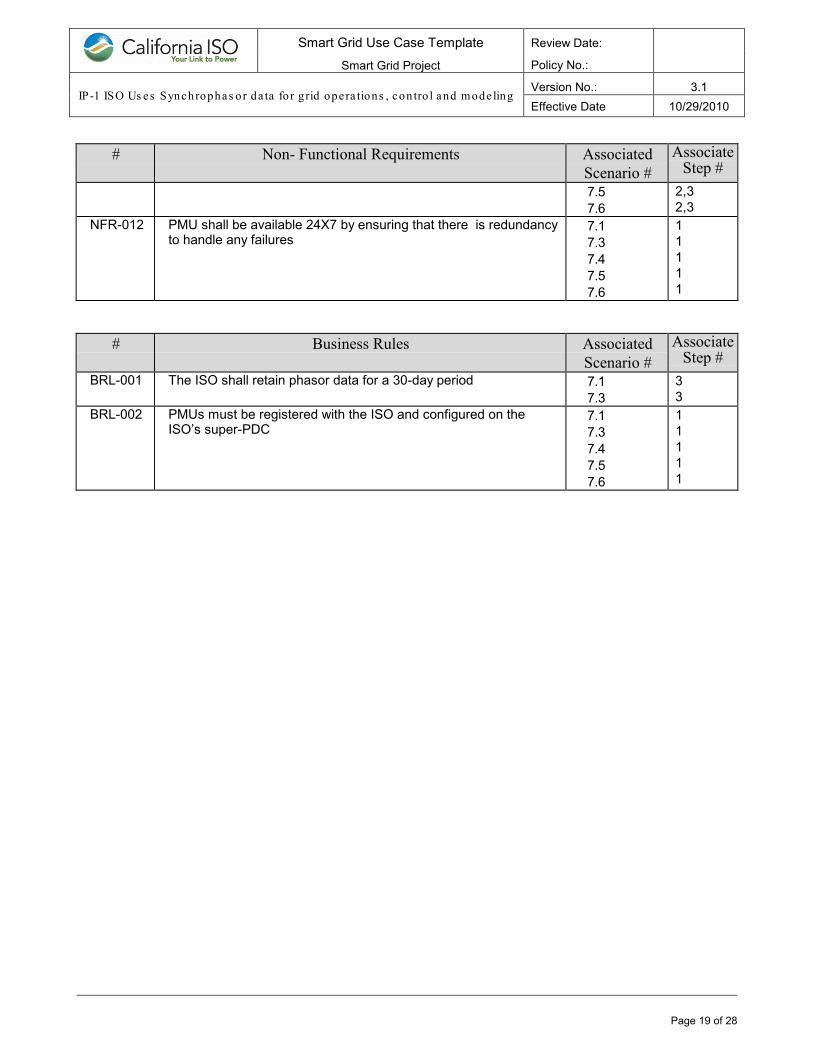
NFR-012 PMU shall be available 24X7 by ensuring that there is redundancy to handle any failures
7.1 7.3 7.4 7.5 7.6
1 1 1 1 1
# Business Rules Associated Scenario #
Associate Step #
BRL-001 The ISO shall retain phasor data for a 30-day period 7.1 7.3
3 3
BRL-002 PMUs must be registered with the ISO and configured on the ISO’s super-PDC
7.1 7.3 7.4 7.5 7.6
1 1 1 1 1
Page 20 of 28
Smart Grid Use Case Template
Smart Grid Project
Review Date:
Policy No.:
IP-1 ISO Us es Synchrophas or da ta fo r g rid opera tions , con tro l and mode ling Version No.: 3.1 Effective Date 10/29/2010
9. Activity Diagrams
9.1 Scenario 1: Phasor-Based System Alarm Occurs – A System Alarm Occurs and the System Operator Takes Action
Phas
or M
easu
rem
ent U
nit
Phas
or V
isua
lizat
ion
Tool
Phas
or D
ata
Con
cent
rato
r
Collect And ForwardPMU Data
Alarm Attributes Extraction
Alarm Manager
Analytic Engine
System Disturbance /Oscillation Detected
Else
External Data Path Flows
Phase Angle Nomograms
Phas
or G
rid D
ynam
ics
Ana
lyze
r /A
rchi
ving
Sof
twar
e
ISO
Gen
erat
ion
/Tr
ansm
issi
on O
pera
tor
Recommended Action
Page 21 of 28
Smart Grid Use Case Template
Smart Grid Project
Review Date:
Policy No.:
IP-1 ISO Us es Synchrophas or da ta fo r g rid opera tions , con tro l and mode ling Version No.: 3.1 Effective Date 10/29/2010
9.2 Scenario 2: A System Breakup (Islanding) Occurs and ISO Operator Takes Action to Restore System Using Phasor Data
ISO
Sys
tem
Ope
rato
r
GenerateSystem breakup
alarm
Detect alarm
Take action torestore system
ISO
(via
mul
tiple
sou
rces
)
Display/provide phasormeasurement data
Retrieve phasormeasurement data
Analyze phasor dataalong with data from
other sources
Page 22 of 28
Smart Grid Use Case Template
Smart Grid Project
Review Date:
Policy No.:
IP-1 ISO Us es Synchrophas or da ta fo r g rid opera tions , con tro l and mode ling Version No.: 3.1 Effective Date 10/29/2010
9.3 Scenario 3: Post Mortem Analysis - Systems Operations Analyst Uses Phasor Data for Post Event Analysis
Page 23 of 28
Smart Grid Use Case Template
Smart Grid Project
Review Date:
Policy No.:
IP-1 ISO Us es Synchrophas or da ta fo r g rid opera tions , con tro l and mode ling Version No.: 3.1 Effective Date 10/29/2010
9.4 Scenario 4: Model Validation – ISO Uses Phasor Data for Model Validation
Page 24 of 28
Smart Grid Use Case Template
Smart Grid Project
Review Date:
Policy No.:
IP-1 ISO Us es Synchrophas or da ta fo r g rid opera tions , con tro l and mode ling Version No.: 3.1 Effective Date 10/29/2010
9.5 Scenario 5: Special Protection Scheme (SPS) Application – SPS Application Identifies Controls That Can Respond to Specific Local or Wide-Area Grid Problems
Page 25 of 28
Smart Grid Use Case Template
Smart Grid Project
Review Date:
Policy No.:
IP-1 ISO Us es Synchrophas or da ta fo r g rid opera tions , con tro l and mode ling Version No.: 3.1 Effective Date 10/29/2010
9.6 Scenario 6: Smart Control Application – Smart Control Application Identifies Controls That Can Respond to Damping Conditions and/or Sustained Oscillations
Page 26 of 28
Smart Grid Use Case Template
Smart Grid Project
Review Date:
Policy No.:
IP-1 ISO Us es Synchrophas or da ta fo r g rid opera tions , con tro l and mode ling Version No.: 3.1 Effective Date 10/29/2010
9.7 Scenario 7: Optimize Transmission Capacity
Page 27 of 28
Smart Grid Use Case Template
Smart Grid Project
Review Date:
Policy No.:
IP-1 ISO Us es Synchrophas or da ta fo r g rid opera tions , con tro l and mode ling Version No.: 3.1 Effective Date 10/29/2010
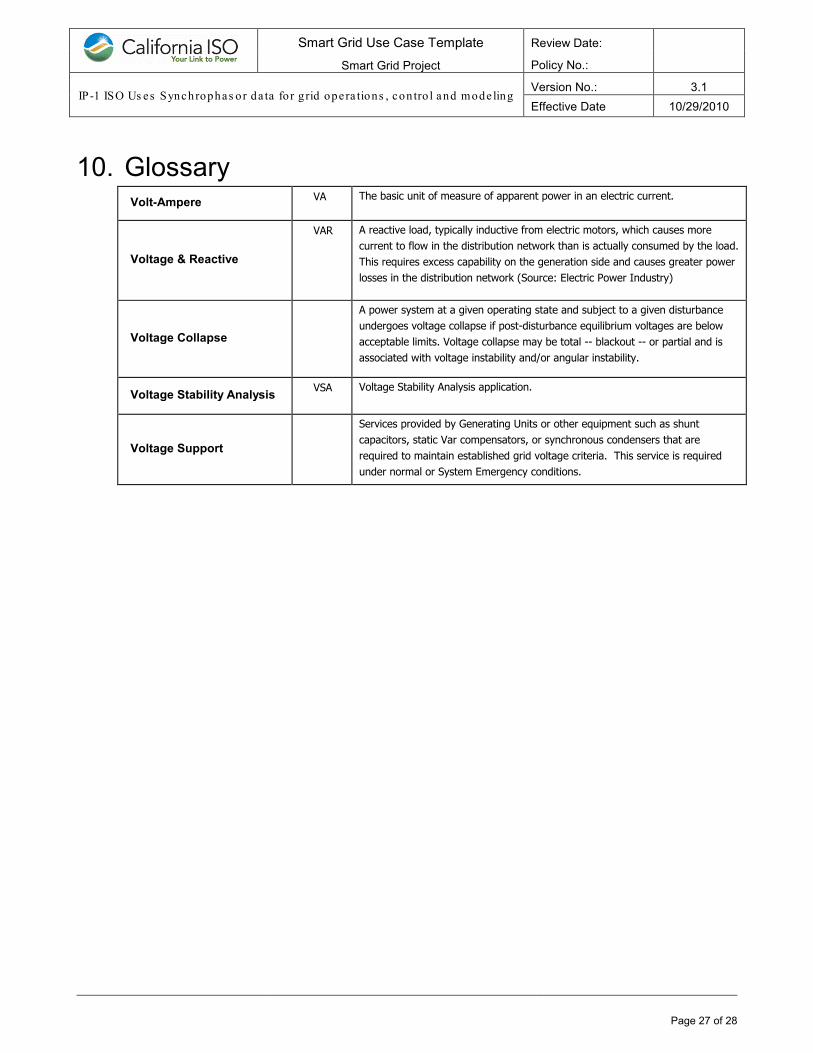
10. Glossary Volt-Ampere
VA The basic unit of measure of apparent power in an electric current.
Voltage & Reactive
VAR R A reactive load, typically inductive from electric motors, which causes more current to flow in the distribution network than is actually consumed by the load. This requires excess capability on the generation side and causes greater power losses in the distribution network (Source: Electric Power Industry)
Voltage Collapse
A power system at a given operating state and subject to a given disturbance undergoes voltage collapse if post-disturbance equilibrium voltages are below acceptable limits. Voltage collapse may be total -- blackout -- or partial and is associated with voltage instability and/or angular instability.
Voltage Stability Analysis
VSA Voltage Stability Analysis application.
Voltage Support
Services provided by Generating Units or other equipment such as shunt capacitors, static Var compensators, or synchronous condensers that are required to maintain established grid voltage criteria. This service is required under normal or System Emergency conditions.
Page 28 of 28
Smart Grid Use Case Template
Smart Grid Project
Review Date:
Policy No.:
IP-1 ISO Us es Synchrophas or da ta fo r g rid opera tions , con tro l and mode ling Version No.: 3.1 Effective Date 10/29/2010
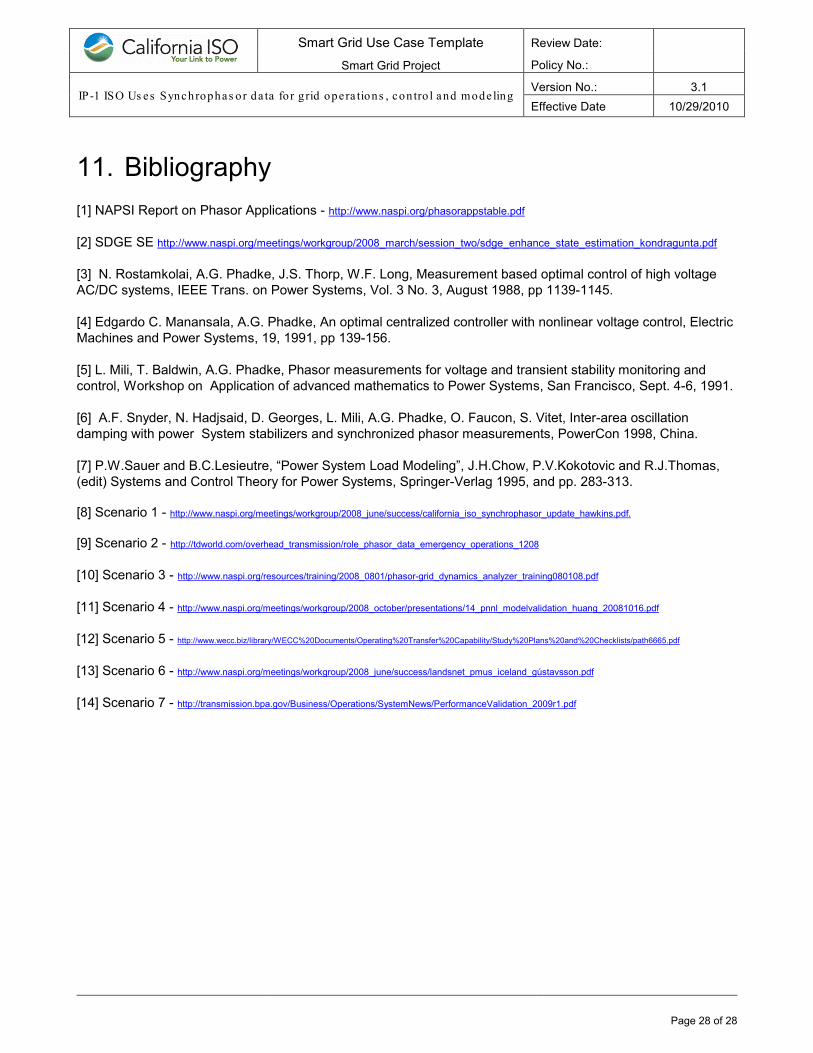
11. Bibliography [1] NAPSI Report on Phasor Applications - http://www.naspi.org/phasorappstable.pdf [2] SDGE SE http://www.naspi.org/meetings/workgroup/2008_march/session_two/sdge_enhance_state_estimation_kondragunta.pdf [3] N. Rostamkolai, A.G. Phadke, J.S. Thorp, W.F. Long, Measurement based optimal control of high voltage AC/DC systems, IEEE Trans. on Power Systems, Vol. 3 No. 3, August 1988, pp 1139-1145. [4] Edgardo C. Manansala, A.G. Phadke, An optimal centralized controller with nonlinear voltage control, Electric Machines and Power Systems, 19, 1991, pp 139-156. [5] L. Mili, T. Baldwin, A.G. Phadke, Phasor measurements for voltage and transient stability monitoring and control, Workshop on Application of advanced mathematics to Power Systems, San Francisco, Sept. 4-6, 1991. [6] A.F. Snyder, N. Hadjsaid, D. Georges, L. Mili, A.G. Phadke, O. Faucon, S. Vitet, Inter-area oscillation damping with power System stabilizers and synchronized phasor measurements, PowerCon 1998, China. [7] P.W.Sauer and B.C.Lesieutre, “Power System Load Modeling”, J.H.Chow, P.V.Kokotovic and R.J.Thomas, (edit) Systems and Control Theory for Power Systems, Springer-Verlag 1995, and pp. 283-313. [8] Scenario 1 -
http://www.naspi.org/meetings/workgroup/2008_june/success/california_iso_synchrophasor_update_hawkins.pdf.
[9] Scenario 2 -
http://tdworld.com/overhead_transmission/role_phasor_data_emergency_operations_1208
[10] Scenario 3 -
http://www.naspi.org/resources/training/2008_0801/phasor-grid_dynamics_analyzer_training080108.pdf
[11] Scenario 4 -
http://www.naspi.org/meetings/workgroup/2008_october/presentations/14_pnnl_modelvalidation_huang_20081016.pdf
[12] Scenario 5 -
http://www.wecc.biz/library/WECC%20Documents/Operating%20Transfer%20Capability/Study%20Plans%20and%20Checklists/path6665.pdf
[13] Scenario 6 - http://www.naspi.org/meetings/workgroup/2008_june/success/landsnet_pmus_iceland_gústavsson.pdf
[14] Scenario 7 -
http://transmission.bpa.gov/Business/Operations/SystemNews/PerformanceValidation_2009r1.pdf