Embed Size (px)
Citation preview

J R C R E F E R E N C E R E P O R T S
Smart Grid projects in Europe: lessons learned and current developments
Vincenzo Giordano, Flavia Gangale, Gianluca Fulli (JRC-IE)Manuel Sánchez Jiménez (DG ENER)
Other JRC-IE contributors: Ijeoma Onyeji, Alexandru Colta, Ioulia Papaioannou, Anna Mengolini,
Corina Alecu, Tauno Ojala, Isabella Maschio
EUR 24856 ENInstitute for Energy

The mission of the JRC-IE is to provide support to Community policies related to both nuclear and non-nuclear energy in order to ensure sustainable, secure and efficient energy production, distribution and use.
European CommissionJoint Research CentreInstitute for Energy
Contact informationGianluca Fulli EC, DG JRC, Institute for EnergyPO Box 2, NL-1755 ZG Petten, The [email protected]
http://ie.jrc.ec.europa.eu/http://www.jrc.ec.europa.eu/
This publication is a Reference Report by the Joint Research Centreof the European Commission.
The Smart Electricity Systems (SES) Action of the Energy Security Unit performs independent scientific research and acts as in-house scientific consultant for EU policy-making actors with particular focus on the on-going transformations of smart electricity systems. The SES Action also develops dedicated power system models and hardware / software simulation tools, as well as an energy security Geographic Information System for EU energy infrastructures. For more information on this report and our activities visit: http://ses.jrc.ec.europa.eu or scan this QR (Quick Response) code using a QR reader app on your phone (no typing required)
Legal NoticeNeither the European Commission nor any person acting on behalf of the Commissionis responsible for the use which might be made of this publication.
The use of trademarks in this publication does not constitute an endorsement by the European Commission.
The views expressed in this publication are the sole responsibility of the author(s) and do not necessarily reflect the views of the European Commission.
Europe Direct is a service to help you find answers to your questions about the European Union
Freephone number (*): 00 800 6 7 8 9 10 11
(*) Certain mobile telephone operators do not allow access to 00 800 numbers or these calls may be billed.
A great deal of additional information on the European Union is available on the Internet.It can be accessed through the Europa server http://europa.eu/.
JRC 65215 EUR 24856 ENISBN 978-92-79-20487-6ISSN 1831-9424 doi:10.2790/32946
Luxembourg: Publications Office of the European Union
© European Union, 2011
Reproduction is authorised provided the source is acknowledged.
Printed in The Netherlands

3
JRC Reference Report
Contents
acKnoWledGementS
eXecutive SummarY
1 introduction
1.1 Definitions and Assumptions 1.1.1 Aim of the study 1.1.2 Boundaries of the Smart Grid catalogue
1.2 Data collection template1.2.1 Qualitative assessment1.2.2 Quantitative assessment
1.3 Reliability and completeness of data
1.4 Overview of Smart Grid landscape in Europe and beyond�
2 inventorY oF collected projectS – in WHicH direction iS europe movinG in tHe
Field oF Smart GridS?
2.1 Projects and budget distribution across countries and project categories
2.2 Project maturity and scale
2.3 Insight into some final applications and their level of maturity
2.4 Who is investing?
3 BuildinG tHe Smart Grid SYStem
3.1 System integration – Smart Grid as a market platform3.1.1 Business models for a transactive grid 3.1.2 Case studies
3.2 What is in it for consumers?
6
7
10
101011
111112
12
13
16
16
21
25
29
35
353838
44

4 Smart Grid contriBution to policY GoalS
4.1.Sustainability4.1.1 Reduction of CO
2 emissions
4.1.2 Integration of DER
4.2 Competitiveness - Open and efficient market4.2.1 Increased market participation through aggregation4.2.2 Interregional markets
4.3 Security and quality of supply
4.4 Activated Smart Grid services and benefits
5 analYSiS oF data protection and SecuritY iSSueS
5.1 Customer security
5.2 A greater number of intelligent devices
5.3 The problem of physical security
5.4 The use of IP and commercial off-the-shelf hardware and software
5.5 More stakeholders�
6 SummarY and Future StepS
6.1 Summary
6.2 Future work
48
484849
505052
53
54
56
57
57
58
58
58
59
59
61

5
JRC Reference Report
reFerenceS
aBBreviationS and acronYmS
countrY codeS
anneX i - data collection template
anneX ii – Smart Grid ServiceS(Smart Grid taSK Force)
anneX iii - Smart Grid BeneFitS and KpiS (Smart Grid taSK Force)
anneX iv - project cataloGue
63
69
69
70
74
76
80

6
JRC Reference Report
Smart Grid projects in Europe: lessons learned and current developments
acKnoWledGementS
We� would� like� to� thank� Marcelo� Masera� (JRC-IE),�Patrick� Van� Hove� (DGRTD),� Patricia� Arsene� (DG�INFSO),� Michal� Spiechowicz� (DGENTR),� Daniel�Hanekuyk�(DGENTR)�and�Steven�Eisenreich�(JRC)�for�their�comments�and�suggestions�regarding�this�re-port.�We�would�also�like�to�express�our�gratitude�to�Ivan�Pearson�(JRC-IE),�Peter�Zeniewski�(JRC-IE)�and�Angelo�L’Abbate�(RSE)�for�scrutinising�the�text.�Our�thanks�also�go�to�all�the�stakeholders�of�the�Smart�Grid� Task� Force,� the� European� Electricity� Grid� Ini-tiative�and�the�Florence�Regulatory�Forum�for�Elec-tricity�who� commented�on�and�provided� feedback�contributing� to� the� improvement� of� intermediate�versions�of�this�report.
7
JRC Reference Report
eXecutive SummarY
Introduction
Meeting�the�EU’s�climate�change�and�energy�policy�objectives�for�2020�and�beyond�will�require�a�major�transformation� of� our� electricity� infrastructure.�Strengthening� and� upgrading� existing� networks�is� of� paramount� importance� to� integrating� an�increasing�amount�of�renewable�energy�generation,�enhancing� grid� security,� developing� the� internal�energy� market� and� realising� energy� saving� and�efficiency.� To� achieve� these� goals� it� is� not� only�necessary� to�build�new� lines�and�substations,�but�it�is�essential�to�make�the�overall�electricity�system�smarter�through�the�integration�of�Information�and�Communication�Technologies�(ICT).�
Smart�Grids�can�be�described�as�an�upgraded�elec-tricity� network� enabling� two-way� information� and�power� exchange� between� suppliers� and� consum-ers,�thanks�to�the�pervasive�incorporation�of�intel-ligent�communication�monitoring�and�management�systems.�For�Smart�Grids�to�deliver�their�envisaged�benefits�however,�the�realisation�of�physical�infra-structures�alone�will�not�be�sufficient�and�must�be�complemented�by�the�emergence�of�new�business�models�and�practices,�new�regulations,�as�well�as�more�intangible�elements�such�as�changes�to�con-sumer�behaviour�and�social�acceptance.�Many�dif-ferent�stakeholders�are�involved�in�this�process�and�different�forms�of�cooperation�are�already�arising.
In� the� last� few� years,� initiatives� on� Smart� Grids,�with�different�aims�and�results,�have�been�growing�in�number�and�scope�throughout�Europe.�Substan-tial�public�and�private�investments�have�been�made�in�research�and�development�(R&D),�demonstration�and�deployment�activities.�At�this�stage,�there�is�a�clear� need� to� survey� the� implemented� projects� in�order� to�monitor� the�direction�Europe� is� taking,� to�benchmark� investments,� and� to� tackle� challenges�and�possible�distortions�from�an�early�stage.�Shar-ing�the�results�of�these�projects�can�also�contribute�in�increasing�the�stock�of�knowledge�and�accelerate�the�innovation�process.
In� this� perspective,� the�main� goal� of� this� study� is�to�prepare�a�comprehensive�inventory�of�Smart�Grid�projects�in�Europe�and�use�project�data�to�support�the� analysis� of� trends� and� developments.� The� re-port� looks�into�several�aspects�of�the�Smart�Grids�landscape� to�describe� the�state�of� the�art�of� their�implementation,�the�emerging�hallmarks�of�the�new�electricity� system�and� some� foreseeable�develop-ments.�
This�report�results�from�a�request�from�Directorate-General�for�Energy�(DG�ENER)�to�start�a�data�collec-tion� effort� to� develop� a� catalogue� of� Smart� Grids�projects� in� Europe� and� to� carry� out� a� qualitative�analysis� of� their� results.� The� analysis� we� carried�out�contributed� to� the�drafting�of� the�Commission�Communication� “Smart� Grids:� from� innovation� to�deployment”,�adopted�in�April�2011�[24].��
This�survey�of�Smart�Grid�projects�in�Europe�brings�together�input�and�feedback�from�a�variety�of�stake-holders� through� a� cooperative� and� transparent�process.�The�interim�version�of�this�study�has�been�presented�on�many�occasions�at�expert�meetings,�including� the� EU� Task� Force� on� Smart� Grids1� and�the�European�Electricity�Grid�Initiative2.�Their�com-ments�and�observations�have�been�carefully�taken�into�consideration�and,�where�possible,�integrated�into�the�analysis.�
This�work� is� intended�to�be�the� first�of�a�series�of�snapshots�that�the�JRC�will�periodically�prepare�on�the� development� status� of� Smart� Grids� in� Europe�to� offer� a� basis� for� discussion� among� Smart� Grid�stakeholders�and�promote�the�sharing�of�knowledge,�experiences�and�best�practices.
Methodology
To� ensure� that� all� projects� could� be� compared� on�a� fair�basis�and� to�support�subsequent�analysis,�a�data�collection�format�was�distributed�to�hundreds�of�stakeholders�at�the�end�of�November�2010.�Within�five� months,� more� than� 300� project� respondents�replied� to� our� survey.� The� responses� were� then�passed� through� a� filtering� process� to� screen� out�projects,� which� did� not� fall� into� the� scope� of� our�study�or�that�did�not�provide�enough�information�for�the�analysis.�Presently,�the�final�catalogue�includes�219�projects�and�represents�the�most�updated�and�comprehensive� inventory�of�Smart�Grid�projects� in�Europe�to�date.
1� http://ec.europa.eu/energy/gas_electricity/smartgrids/taskforce_en.htm
2� http://setis.ec.europa.eu/activities/implementationplans/Grid_EII_Implementation_plan_final.pdf/view

8
JRC Reference Report
Smart Grid projects in Europe: lessons learned and current developments
Data� collected� from� the� project� respondents� were�double-checked� to� ensure� their� consistency.� All�projects’� web� sites,� where� in� place,� and� the� web�site� of� the� leading� organisation�were� examined� to�support� the� information� we� received.� In� the� case�of� discrepancies� or� of� missing� data,� the� leading�organisation� was� contacted� either� via� email� or�telephone.�
This�data�collection�and�analysis�was�complemented�by� a� further� investigation� of� a� restricted� number�of� projects� (around� 30),� shortlisted� in� such� a�way�as� to� ensure� a� fair� representation� of� different�project� sizes,� categories,� development� stages� and�geographical�areas.�The�availability�of�data�was�also�a�main�criterion�for� their�selection.�The�aim�of� this�further�analysis�was�to�get�a�closer�insight�into�the�projects�in�order�to�highlight�the�main�opportunities�and� obstacles� in� the� development� of� Smart�Grids.�To�carry�out� this�analysis,�we�have� interacted�with�project� coordinators,� retrieved� information� from�project�websites�and�gone�through�related�reports,�papers�and�presentations.
Key messages
The� analysis� of� the� collected� projects� highlighted�several�key�observations�and�learning�points.�
Project� investments� and� scale�The� total� budget� of�the�collected�projects� (over�€5�billion)�shows� that�significant� efforts� have� already� been� undertaken,�but� that�we�are� just�at� the�beginning�of� the�Smart�Grid�transition.�To�put�the�investments�in�our�cata-logue�into�context,�conservative�estimates�quantify�Smart�Grid�investments�by�2020�[47]�at�€56�billion.
Deployment�projects�(mainly�smart�meter�roll-outs)�cover�the�lion’s�share�of�investment�commitments-�about�56%�of�the�total-�while�R&D�and�demonstra-tion� projects� account� for� a�much� smaller� share� of�the� total� budget.� Most� R&D� and� demonstration�projects� are� small� to� medium� size� (€4.4� million�for�R&D�projects�and�about�€12�million�for�demon-stration�projects),�suggesting�the�need�to�invest�in�larger�scale�demonstration�projects�to�gain�a�better�knowledge�of�the�functioning�and�impacts�of�some�innovative� solutions� and� to� validate� results� to� a�broader�extent.
Geographical� distribution� Smart� Grid� projects� are�not� uniformly� distributed� across� Europe.� Most� of�the� projects� and� investments� are� located� in� EU15�countries,�while� EU12�Member� States� still� lag� be-hind.� The� uneven� distribution� of� projects� and� the�different�pace,�at�which�Smart�Grids�are�being�de-ployed�across�Europe,�could�make�trade�and�coop-eration�across�national�borders�more�difficult� and�jeopardize�the�timely�achievement�of�the�EU�energy�policy�goals.�
Multidisciplinary� cooperation� The� increased� com-plexity� of� the� electricity� system� requires�multidis-ciplinary� consortia� to� share� competencies� and� re-duce� risks.� Collected� projects� highlight� the� trend�towards� a� fruitful� cooperation� between� different�organisations,� which� brings� together� network� op-erators,� academia,� research� centres,� manufactur-ers�and�IT�companies.�The�implementation�of�Smart�Grids�is�also�a�significant�opportunity�for�European�industry� to� research,�market�and�export�new�tech-nologies,�to�create�new�jobs�and�to�maintain�global�technological�leadership.
System� integration� Most� Smart� Grid� benefits� are�systemic� in� nature� as� they� arise� from� the� combin-ation� of� technological,� regulatory,� economic� and�behavioural� changes.� The� survey� indicates� that� in�almost�all�countries,�a�significant�amount�of�invest-ments�has�been�devoted�to�projects,�which�address�the�integration�of�different�Smart�Grid�technologies�and�applications.�Most�technologies�are�known,�but�the�new�challenge�that�these�projects�are�now�con-fronting�is�their�integration.�
Role� of� regulation� Data� in� the� catalogue� confirm�the� leading� role� that� Distribution� System�Opera-tors� (DSOs)� play� in� coordinating� Smart� Grid� de-ployment� across� Europe.� DSO-led� projects� rep-resent� about� 27%� of� all� projects� and� about� 67%�of� investment.� Current� regulation� in� EU� Member�States�generally�provides�network�owners/opera-tors�with� the� incentive� to� improve�cost�efficiency�by� reducing� operation� costs� rather� than� by� up-grading�grids�towards�a�smarter�system.�The�regu-latory�incentive�model�should�be�revised�in�order�to�accelerate�the�investment�potential�of�network�owners/operators�and�to�encourage�them�to�move�to�a�more�service-based�business�model.�Regula-tion�should�also�ensure�a�fair�sharing�of�costs�and�benefits� in� the� set-up� of� service-based� market�platforms.�Network�owners/operators�are�expect-ed�to�sustain�the�majority�of�upfront�investments�whereas�several�players�might�get�benefits�when�market�platforms�become�operational.�

9
JRC Reference Report
Consumer�awareness�and�participation�Consumers’�awareness�and�participation� is� crucial� for� the� suc-cess�of�Smart�Grid�projects.�Most�projects�highlight�the�need� to� involve�consumers�at� the�early� stages�of�project�development,�to�give�consumers�the�free-dom� to� choose� their� level� of� involvement� and� to�ensure�data�privacy�and�protection.�It�is�imperative�to�ensure�that�consumers�have�trust� in�and�under-standing� of� the�whole� Smart� Grid� process� and� re-ceive� clear� tangible� benefits.� To� differing� extents,�consumers�will�be�able�to�reap�numerous�potential�benefits:�energy�savings,�the�reduction�of�outages,�more� transparent�and� frequent�billing� information,�participation� in� the�electricity�market� via� aggrega-tors,�and�a�better�business�case�for�the�purchase�of�electric�vehicles,�heat�pumps�and�smart�appliances.�
Contribution� to� energy� policy� goals� The� results� of�collected�projects�illustrate�the�numerous�contribu-tions�that�Smart�Grids�can�make�to�the�achievement�of�EU�energy�policy�goals.�A�Smart�Grid�can�contrib-ute�to�sustainability�by�facilitating�the�reduction�of�CO2� emissions,� enabling� the� integration� of� large-scale�renewables�and�increasing�energy�efficiency�in�the�power� sector.� It� supports� competitiveness�and�open� and� efficient� markets� by� increasing� market�participation�through�the�aggregation�of�distributed�prosumers�(consumers�also�able�to�produce�power)�and�through�the�strengthening�of�interregional�mar-kets.�It�contributes�to�security�and�quality�of�supply�by�integrating�technologies/mechanisms�to�balance�flexible�generation�and�by�increasing�the�observabil-ity�and�controllability�of�the�grid�in�order�to�reduce�outage�times.�All�these�potential�benefits�need�to�be�monitored�and�verified�to�adjust�the�framework�for�better�results.�
The� role�of� ICT�An�open�and� secure� ICT� infrastruc-ture�is�at�the�core�of�the�successful�implementation�of�the�Smart�Grid.�Addressing�interoperability,�data�privacy� and� security� is� a� priority� requirement� for�making�the�ICT�infrastructure�truly�open�and�secure�and� reducing� transaction� costs� among� Smart� Grid�users.� A� scan� of� collected� projects� highlights� the�convergence� towards�proven�standards�and� indus-try�best�practices�used�for�IT�systems�(e.g.�Internet�Protocol� communication).� However� further� coord-inated� efforts� are� needed� to� fully� tap� European�potential� in� this� field�and�move�to� the�deployment�phase.�Standardization�developments�are�a�step�in�the� right� direction.�Also,� new�projects� focusing�on�data�handling�would�be�useful�to�assess�how�data�handling� principles� from�other� industries� (e.g.� the�banking�industry)�could�be�applied�to�Smart�Grids.�
Data� collection� and� knowledge� sharing� Finally,� ef-fective�knowledge�sharing�and�the�dissemination�of�best�practices�among�Smart�Grid�stakeholders�are�crucial� for� the�success�of� the�European�Smart�Grid�programme.�The�difficulties�encountered�during�the�data� collection� process� of� this� study� suggest� the�need�for�improvements�in�data�collection/exchange,�such�as�through�a�common�structure�for�data�collec-tion�in�terms�of�definitions,�terminology,�categories,�and� benchmarks,� etc.� and� coordinated� project� re-positories�at�the�national�and�European�levels.�

10
JRC Reference Report
Smart Grid projects in Europe: lessons learned and current developments
�1 introduction
A� shift� in� energy� policy� goals� is� at� the� heart� of�current�transformations�in�the�electricity�sector.�The�smooth� integration� of� renewable� energy� sources,�a�more� efficient� and� secure� electricity� supply,� and�an� internal� energy� market� with� full� inclusion� of�consumers�are�key�priorities�for�the�European�Union�[21,�22,�23].
To� this� end,� it� is� necessary� to� strengthen� the�electricity� system� that� we� have� today� by� building�new�lines,�substations�and�power�plants.�In�parallel,�it� is�also�necessary� to�make� the�electricity� system�smarter� through� the� integration� of� ICT� solutions.�A� smart�electricity�grid� in�place�opens� the�door� to�new� applications� with� far� reaching� impacts:� the�adaptation�of�electricity�demand�to�grid�and�market�conditions,� automatic� grid� reconfiguration� to�prevent�or�restore�outages,�and�the�safe�integration�of�distributed�generators,�electric�vehicles�and�large�scale�renewables�[7,�19,�20,�55,�56,�62].�
Smart� Grids� are� electricity� networks� that� can�efficiently� integrate� the� behaviour� and� actions� of�all�users�connected�to�it�—�generators,�consumers�and� those� that� do� both� —� in� order� to� ensure� an�economically� efficient,� sustainable� power� system�with� low� losses� and� high� quality� and� security� of�supply�and�safety�[24].�In�this�perspective,�a�Smart�Grid� can� be� considered� as� a� Smart� Electricity�System,�which�encompasses�both�the�grid�and�the�users� connected� to� it,� and� includes�both� technical�and�non-technical�building�blocks.
Building� a� Smart� Grid� is� therefore� not� only� a�matter� of� modernisation� of� the� electricity� grid� or�of� deploying� physical� assets� and� technologies.�A� key� role� is� played� by� new� business� models�and� practices,� new� regulations,� as� well� as� more�intangible� elements� like� consumers’� behavioural�changes� and� social� acceptance� [29,� 57,� 58,� 59,].�Steering� this� transition� is�a�challenging,� long-term�task.�It�requires�coupling�a�policy-led�vision�with�a�market-driven�deployment,�balancing�energy�policy�goals�and�market�profitability.��
In� the� last� few� years,� initiatives� on� Smart� Grids�have�been�growing�in�number�and�scope�[37,�63].�A�variety�of�projects�have�been�deployed�throughout�Europe�with�different�aims�and�results.�Substantial�public�and�private� investments�have�been�made� in�research� and� development� (R&D),� demonstration�and� deployment� activities.� At� this� stage,� there�is� a� need� to� evaluate� the� outcome� of� Smart� Grid�projects� in� order� to� monitor� the� direction� Europe�is�taking,�to�benchmark�investments,�and�to�tackle�
challenges� and� possible� distortions� from� an� early�stage.�Particularly,� there� is� the�need� to�unlock� the�investment�potential�of�the�market.�A�clear�business�case�for�investment�is�presently�among�the�biggest�challenges�in�Smart�Grid�implementation.�
Following�a�request�from�DG�ENER,�the�Joint�Research�Centre�Institute�for�Energy�started�a�data�collection�to� assemble� a� catalogue� of� Smart� Grids� projects�in�Europe�and�to�carry�out�a�qualitative�analysis�of�project�results.�In�this�study,�building�on�the�work�of�the�European�Smart�Grid�Task�Force�[18,�19,�20],�we�have� collected� and� analyzed� around� 300� projects.�On�the�basis�of�feedbacks�from�the�field,�this�report�addresses�the�following�specific�questions:
In�which�direction�is�Europe�moving�in�the�•�field� of� Smart� Grids?� Who� is� investing?�What�are�the�motivations?
How� can� system� integration� create� busi-•�ness�value?�What�is�in�it�for�consumers?
How�do�Smart�Grid� projects� contribute� to�•�the�EU’s�main�policy�goals?�
1.1 Definitions and Assumptions
1.1.1 Aim of the study
The�aim�of� this� study� is� to� collect� lessons� learned�and� assess� current� developments� on� Smart� Grids�in�Europe.�In�order�to�support�our�analysis,�we�will�use� data� and� information� collected� from� Smart�Grid� projects� throughout� Europe.� To� the� best� of�our� knowledge,� the� collected� Smart� Grid� projects�represent� the� most� comprehensive� and� up-to-date�inventory�in�Europe�at�present.�An�exhaustive�mapping� of� Smart� Grid� projects� in� the� different�Member� States� is� not� the� primary� scope� of� this�report.� Rather,� this� is� an� ongoing� task.� Further�collected� projects� will� be� included� in� subsequent�updates�of�this�study.

11
JRC Reference Report
1.1.2 Boundaries of the Smart Grid catalogue
In� line�with� the�definition�of� Smart�Grids� reported�above,�we�have�followed�three�main�screening�rules�in�assembling�our�catalogue:
1.� We�have�included�projects�focusing�on�individual�new�energy�technologies�and�resources�(e.g.�new�storage� devices,� Electric� vehicles,� distributed�renewable�generators),�only�if�their�integration�in� the� grid� was� also� part� of� the� project.�
2.� We�have�included�projects�aiming�at�making�the�grid� smarter� (through� new� technologies� and�new�ICT�capabilities).�
3.� We� have� not� included� projects� aiming� at�making� the� grid� stronger� (e.g.� through� new�lines,� substations� and� power� plants)� using�conventional�design�approaches.
Around�80�projects�(out�of�the�300�we�have�received)�have�been�screened�out�from�the�catalogue�because�either� they�did�not�comply�with� the�screening�rules�or�because�insufficient�data�had�been�provided�to�be�fairly�evaluated.�At�this�stage,�these�projects�have�not�been�taken�into�consideration�in�the�analysis�but�they�will�be� included� in�an�update�of� this�study�as�soon�as�more�detailed�information�becomes�available.�The�final�catalogue�includes�219�projects�(see�ANNEX�IV).�
It� is� worth� stressing� that� projects� intended� to� re-inforce�the�transmission�grid,�as�much�as�they�are�crucial�to�modernizing�the�European�power�system�(see�e.g.� [13]),�have�not�been�included�in�our�cata-logue.� In� fact,� transmission� operators� are� mainly�and� heavily� investing� in� what� can� be� defined� as�strengthening�rather�than�smartening�the�transmis-sion�grid,�as� the� transmission�system� is�already�a�partly�smart�system�capable�of�managing�and�bal-ancing�the�resources�(currently)�connected�to�it.�
1.2 Data collection template
To� ensure� that� all� projects� could� be� compared� on�a� fair� basis� and� to� support� later� analysis,� a� data�collection� template� was� prepared� and� distributed�on� the� 5th� of� November� 2010.� The� template� had�to�be� returned�by� the�25th�of�November.�The�data�collection�exercise�was�originally�intended�to�collect�pilot�projects�but�was�then�extended�to�Smart�Grid�projects� across� the� innovation� chain� (from�R&D� to�demonstration/deployment),�by� further� interacting�with� national� contact� points,� project� coordinators�
and�other� relevant�stakeholders.� �Due� to� the� large�number�of� requests�by�project� coordinators� for� an�extension� of� the� deadline,� projects�were� accepted�through� March� 2011.� In� total,� more� than� 300�responses�were�received.
The�data�collection�template�has�been�structured�in�two�parts:�one� for�qualitative�assessment�and�one�for�quantitative�assessment�(see�ANNEX�I).
1.2.1 Qualitative assessment
The�qualitative�assessment�section�of�the�template�included� a� brief� description� of� the� project� and� a�summary�of�goals�and�outcomes.�Other�information�requested�included�the�location�and�duration�of�the�project,�the�budget,�the�participating�organisations�and� their� budget� share� and� the� EU� contribution�(where�applicable).
The�qualitative�assessment�section�of�the�template�also� included� a� specific� request� for� information�on�how� the�project�addressed�data�protection�and�security�issues.
In� addition,� we� have� asked� project� coordinators�to� classify� their� project� according� to� the� following�categories:�
1.� Smart� Meter� and� Advanced� Metering�Infrastructure
2.� Grid�Automation�Transmission
3.� Grid�Automation�Distribution
4.� Integrated�System�
5.� Home�application��Customer�Behaviour�
6.� Specific�Storage�Technology�Demonstration
7.� Other

12
JRC Reference Report
Smart Grid projects in Europe: lessons learned and current developments
This�classification�is�in�line�with�the�mapping�exercise�of� Smart� Grid� projects� that� is� currently� ongoing�in� the� US� (Virginia� Tech� Clearinghouse)3� and� is�intended�to�facilitate�international�sharing�of�Smart�Grid�experiences.�In�the�context�of�the�EUUS�council,�the�JRC�is�collaborating�with�the�US�Department�of�Energy� on� common� assessment� methodologies� of�Smart�Grids.
The� first� category� “Smart� Meter� and� Advanced�Metering� Infrastructure”� includes� projects� which�specifically� address� smart� meter� implementation.�The�second�and� third�categories�“Grid�Automation�Transmission”� and� “Grid� Automation� Distribution”�refer�to�projects�dealing�with�automation�upgrades�of�the�electricity�grid�(e.g.�feeder�automation,�wide�area� monitoring� etc.),� at� the� transmission� and�distribution�level�respectively.
The�fourth�category�“Integrated�System”�focuses�on�the�integration�of�different�Smart�Grid�technologies�and� applications� (e.g.� Smart� meter,� Demand�Response,� grid� automation,� distributed� storage,�renewables,�etc.).�
The� fifth� category� “Home� application� -� Customer�Behaviour”� includes� projects� which� address� new�applications�at�home�or�directly�involve�consumers.Finally,� the� sixth� category� “Specific� Storage�Technology�Demonstration”�includes�projects�which�address� the� potentialities� of� storage� technologies�both�new�and�more�conventional�ones�(e.g.�hydro,�chemical,�and�mechanical).
A�single�project�can�span�over�different�categories.�In� that� case,� project� coordinators� have� expressed�the� relevance� of� the� applicable� categories� with� a�number�between�0�and�1.
1.2.2 Quantitative assessment
The�quantitative�assessment�part�of�the�template�has�been�divided�in�three�sections.��
In� the� first� section,� we� have� asked� participants�who�had�already�performed�a�cost-benefit�analysis�to�share�their�results.�
The� second� section� provided� guidelines� for� the�collection� of� cost-benefit� quantitative� data� from�those�participants�who�had�not�performed�a�study�themselves.� The� respondents� have� been� asked� to�choose� among� the� list� of� benefits� and� KPIs� (Key�Performance� Indicators)�defined�by�the�Smart�Grid�Task�Force�(see�Annex�III).
In�the�third�section�project�coordinators�were�asked�to�fill�in�the�service/benefit�merit�deployment�matrix�developed�by�the�Smart�Grid�Task�Force�[20].�
1.3 Reliability and completeness of data
Data� collected� from� the� project� respondents� were�double-checked�to�ensure�their�consistency�through�different� means.� For� all� projects� we� checked� the�project� web� site� -� where� in� place� -� and� the� web�site�of� the� leading�organisation� to�corroborate� the�information�we�received.�In�case�of�discrepancies�or�in�case�the�template�was�not�clear�enough�we�also�contacted�the�leading�organisation�either�via�email�or�phone.�
For�the�most�relevant�information�there�seems�to�be�fairly� reliable�data.�The� level� of� reliability� of� some�data��particularly�those�concerning�the�budget,�the�project�duration�and� results� � is�higher� for�projects�which� have� already� been� completed:� 33%� of� the�projects� in� the� catalogue�were� completed�by�April�2011,� while� the� remaining� projects� have� different�closing�dates�spanning�up�to�2020.�34%�of�collected�projects�are�expected� to�be� completed�by� the�end�of�2012.�
The�catalogue�includes�a�relatively�small�number�of�projects�which�started�in�2011.�This�circumstance�is�strictly� related�to� the�deadline�set� for� filling� in� the�questionnaire�and�not�to�a�decrease�in�the�number�of�projects�over�time.�
Shortlisted�projects�The�data�collection�and�analysis�was� complemented�by� a� further� investigation� of� a�restricted�number�of�projects�(about�30),�shortlisted�in�a�way�to�ensure�a�fair�representation�of�different�project�size,�categories,�stages�of�development�and�geographical�areas.�The�availability�of�data�was�also�a�main�criterion�for� their�selection.�The�aim�of� this�further�analysis�was�to�get�a�closer�insight�into�the�projects�in�order�to�highlight�the�main�opportunities�and� obstacles� in� the� development� of� Smart�Grids.�This� supplementary� scrutiny� also� allowed� us� to�survey�and�to�compare�the�projects’�expected�results�and�their�contribution�to�the�EU�policy�goals.�To�carry�out�this�deeper�analysis�we�have�contacted�project�coordinators� either� via� phone� or� email,� retrieved�information�from�project�websites�and�gone�through�reports,�papers�and�presentations.
3�http://www.sgiclearinghouse.org/

13
JRC Reference Report
1.4 Overview of the Smart Grid landscape in Europe and beyond
Worldwide,�the�Smart�Grid�landscape�is�highly�dy-namic�and�rapidly�changing�with�emerging�econo-mies�as�major�players� in�Smart�Grid� investments.�The� information�presented� in� this�section�aims�at�giving�an�overview�of�the�main�estimates�of�overall�investments� in� the� electrical� system� and� a� snap-shot� of� the� investments� already� committed� for�Smart�Grid�development�(see�table�I).�Where�avail-able,�we�also�reported�the�plans�concerning�smart�meter�roll-outs.�
European�Union� A� recent� report� by� Pike� Research�[47]� forecasts� that� during� the� period� from�2010� to�2020,�cumulative�European�investment�in�Smart�Grid�technologies�will�reach�€56.5�billion,�with�transmis-sion�counting�for�37%�of�the�total�amount.�The�re-port�also�suggests�that�by�2020�almost�240�million�smart�meters�will�have�been�deployed�in�Europe.�
According�to�the�International�Energy�Agency�(IEA),�Europe� requires� investments� of� €1.5� trillion� over�2007-2030�to�renew�the�electrical�system�from�gen-eration� to� transmission� and� distribution� [30].� This�figure� includes� investments� for� Smart� Grid� imple-mentation� and� for�maintaining� and� expanding� the�current�electricity�system.
United�States��According�to�[16],�full�implementation�of�Smart�Grids� in�the�United�States�will� require� in-vestments�between�$338�and�$476�billion�over�the�next�20�years.�Costs�allocated�for�transmission�and�substations�are�between�19�and�24�%�of�total�costs,�while� costs� allocated� for� distribution� are� between�69� and� 71�%� and� costs� for� consumer� systems� are�between�7�and�10�%.�These�costs�are�in�addition�to�investments�needed�to�maintain�the�existing�system�and�meet�electric�load�growth.
According�to�[5],�$1.5�(€1.06)�trillion�is�necessary�to�update�the�grid�by�2030�(under�current�trends�and�policies)�of�which�$560�(€395)�billion�is�needed�for�new� and� replacement� generating� plants� and� $900�(€635)�billion�for�transmission�and�distribution�to-gether;� the� report� adds� that� benefits� from� Smart�Grids�could�amount�to�$227�(€160)�billion�over�the�next�40�years�[5].�
In�2009,�The�Recovery�Act�provided�additional�fund-ing� for�$4� (€2.8)�billion� in�cost-shared�Smart�Grid�projects.�In�total,�the�funding�will�enable�more�than�$7� (€4.9)� billion� worth� of� pilot� projects� deploy-ment.�At�the�end�of�2009,�the�number�of�Smart�Grid�projects� in�the�US�exceeded�130,�spread�across�44�States�and�two�territories�[42].
According�to�recent�estimates,�more�than�eight�mil-lion� smart� meters� have� been� deployed� by� United�States’�electric�utilities�with�60�million�expected�to�be�in�use�by�2020�[50].�
China� The� State� Grid� Corporation� of� China� (SGCC)�is�the�driving�force�behind�China’s�effort�to�build�a�nationwide�Smart�Grid.�SGCC�plans�to�invest�in�the�period�2009-2020�a�total�of�$601�(€423)�billion�into�a�nationwide�transmission�network�with�$101�(€71)�billion�of�these�funds�to�be�dedicated�to�developing�Smart�Grid� technology� [65].� In�2010�China�granted�Smart�Grid�Stimulus�investments�of�more�than�$7,3�(€5.1)�billion�[49].
Presently,� Chinese� Smart� Grid� efforts� are� focusing�on� the� creation� of� a� large� capacity� interconnected�transmission�backbone�to� transfer�bulk�power�and�to�accommodate�fast�growing�electricity�demand.�
The�distribution�grid�in�China�is�less�mature�than�in�most� developed� countries� and� the� penetration� of�small-scale� renewables� is� limited� at� the� moment.�However,� according� to� a� report� by� Innovation� Ob-servatory� [31],� China� is� set� to� roll-out� 360�million�smart� meters� by� 2030� and� is� investing� heavily� in�more�efficient�distribution�transformers.
South�Korea�The�South�Korean�Government�has�laid�out�plans�to�establish�a�national�Smart�Grid.�Accord-ing�to�[39],�South�Korea�plans�to�spend�$24�(€16.8)�billion� over� the� next� two� decades� on� Smart� Grids�to� make� electricity� distribution�more� efficient,� cut�greenhouse�gas�emissions�and�save�$26�(€18.2)�bil-lion�in�energy�imports.�In�2010�South�Korea�invested�$824�(€580)�million� in�stimulus�funding�for�Smart�Grids�[49].�
State-run�electricity�monopoly�Korea�Electric�Power�Corp�(KEPCO)�plans�to�install�500,000�smart�meters�in� 2010,� 750,000� in� 2011� and� complete� roll-out� by�2020�with�a�total�of�24�million�smart�meters�installed.�The�company�is�expected�to�cover�all�metering�costs�and�retrieve�them�through�regular�power�bills�[51].

14
JRC Reference Report
Smart Grid projects in Europe: lessons learned and current developments
Australia�In�2010�Australia�invested�US$360�(€253)�million�in�stimulus�funding�for�Smart�Grids�[49].�Aus-tralian�utilities�have�a�mandate� for� the� installation�of�smart�meters.�Under� the�Smart�Grid,�Smart�City�initiative�the�Australian�Government�has�committed�AUS$74.6�(€52.5)�million�to�develop,�in�partnership�with�the�energy�sector,�a�Smart�Grid�demonstration�project� which� will� provide� cost-benefit� analysis� of�Smart�Grid�technology�[2].�The�State�of�Victoria�has�planned� a� State-wide� roll-out� of� 2.4�million� smart�meters�by�2013.�
India� According� to� the� Ministry� of� Power,� India’s�transmission� and� distribution� losses� are� among�the� highest� in� the� world,� averaging� 26%� of� total�electricity�production,�with�some�States�as�high�as�62%.�When�nontechnical�losses�such�as�energy�theft�are�included�in�the�total,�average�losses�are�as�high�as� 50%.� The� need� to� decrease� losses� and� energy�theft,�together�with�the�new�trend�towards�increasing�energy� efficiency� and� the� share� of� renewables� in�electricity� generation,� are� all� important� drivers� for�the� development� of� a� smarter� grid� [64].� A� recent�report� by� Innovation� Observatory� [31]� ranks� India�third� among� the� top� ten� countries� for� Smart� Grid�investment� and� reports� that� India� has� announced�massive�smart�meter�roll-out�projects�with�a�plan�for�more�than�130�million�smart�meters�by�2020.
Brazil�In�2010�Brazil�invested�$240�(€143.6)�million�in�stimulus�funding�for�Smart�Grids�[49].�While�Brazil�has�moved�slowly�to�set�guidelines�for�its�smart�meter�mandates,�it�could�see�some�mass�deployments�as�early�as�2012,�and�could�become�one�of�the�biggest�smart�meter�markets�of�the�world�by�the�second�half�of�the�decade.�Brazil�has�announced�massive�smart�meter�roll-out�projects�and�is�planning�to�replace�63�million�electricity�meters�with�smart�meters�by�2021.��As�one�of�the�first�South�American�countries�to�plan�nationwide�smart�metering,�Brazil�could�also�be�an�important� testing� ground� for� deployments� in� the�rest�of�the�continent.�As�with�emerging�economies,�such�as�India,�stopping�power�theft�and�fixing�too-frequent�power�outages�are�key�functions�that�Latin�American� utilities� want� out� of� their� smart� meter�networks.�
Japan�In�2010�Japan�invested�$849�(€143.6)�million�in�stimulus�funding�for�Smart�Grids�[49].�According�to� recent� news,� Japan� is� planning� to� increase�renewable�energy�sources�in�its�new�energy�plan�and�is� considering� the� use� of� Smart� Grid� technologies�in�establishing�a�new�energy�system� following� the�nuclear�crisis�of�Fukushima�[48].�

15
JRC Reference Report
Country / Region
Forecast Smart Grid investments (€/$)
Funding for Smart Grid development (€/$)
Number of smart meters deployed and/or planned
European Union
€56�billion�by�2020�[47]*���������������������������������������������������������������������������������������������
(estimated Smart Grid investments)
€184�million�(FP6�and�FP7�European�funding�for�projects�in�the�JRC�
catalogue)�������������������������������������������������������������������������������������������������������������������About�€200�million�from�European�Recovery�Fund,��
ERDF,�EERA.National�funding:�n/a
45�million�already�installed�(JRC�
catalogue,2011)��������������������������������������������������������������������������������240�million�by�2020�[47]
USA $338�(€238)��to�476�(€334)�billion�
by�2030��[16]���������������������������������������������������������������������������������(estimated investments
for implementation of fully functional
Smart Grid)
$7�(€4.9)��billion�in�2009�[49]
8�million�in�2011�[50]�����������������������������������������������������������������������������������������60�million�by�2020�[50]
China $101�(€71)�billion��[65]�����������������������������������������������������������������������������������������(Smart Grid technology
development)
$7.3�billion�in�2009�(€5.1)�[49]
360�million�by�2030�[31]
South Korea
$24�(€16.8)�billion��by�2030�[40]]�
(estimated�Smart�Grid�investments)
$824��(€580)�million�in�2009�[49]
500,000�in�2010,�750,000�in�2011�and�24�million�by�2020
Australia n/a
n/a
n/a
n/a n/a
n/a
$204�(€143.6)��million��in�2009�
[49]
63�million�by�2020�[31]
$360�(€253)��million�in�2009�[49]
2.4�million�by�2013��in�State�of�Victoria
India 130�million�by�2020�[31]
Brazil
Japan $849�(€143.6)�millions�in�2009�
[49]
*� Other�estimates�(http://setis.ec.europa.eu/newsroom-items-folder/electricity-grids,�June�2011),�referring�to�the�upgrade�of�
transmission�and�distribution�grids�(not�only�Smart�Grids)�forecast�a�required�investment�of�€500�billion�by�2030,�where�distri-bution�accounts�for�75%�and�transmission�for�25%.
Table I Smart Grid investments in Europe and beyond
16
JRC Reference Report
Smart Grid projects in Europe: lessons learned and current developments
2. inventorY oF collected projectS – in WHicH direction iS europe movinG in tHe Field oF Smart GridS?
The� main� goal� of� our� study� is� to� collect� a� wide�inventory� of� Smart� Grid� projects� in� Europe� and�use�project�data� to�support�analysis�of� trends�and�developments.�In�this�chapter�we�will�use�the�results�of� our� analysis� to� describe� what� is� happening� in�the� field� of� Smart� Grids� in� Europe� from� different�perspectives.� In� the� first�paragraph�we�will� look�at�the� projects� to� examine� their� distribution� across�countries� and� project� categories� and� survey� the�budget� allocated� by� each� country� to� Smart� Grid�development.� In� the� second� paragraph� we� will�have�a�closer�look�at�the�projects�to�determine�how�they� distribute� along� the� stages� of� the� innovation�process�and�how�this�distribution�has�changed�with�time.� In� the� third�paragraph�we�will�get�an� insight�on� selected� Smart� Grid� applications,� namely� the�integration� of� distributed� energy� resources� (DER),�Demand�Response�(DR)�and�the�safe�integration�of�large-scale� renewables� (RES).� We� will� survey� the�development� trend�of� these�applications�and� their�level�of�maturity.�Finally,�in�the�fourth�paragraph�we�will� focus�on� the�actors� involved� in� the� innovation�process�to�see�where�they�are�investing�and�why.�
2.1 Projects and budget distribution across countries and project categories
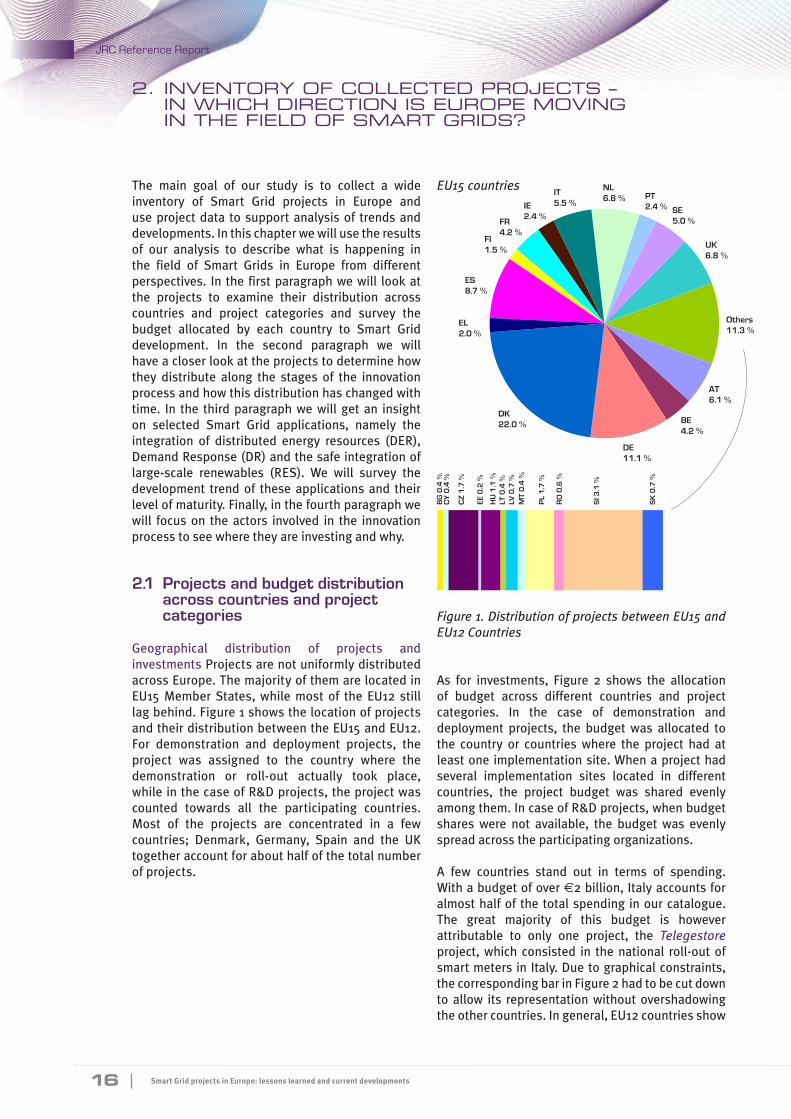
Geographical� distribution� of� projects� and�investments�Projects�are�not�uniformly�distributed�across�Europe.�The�majority�of�them�are�located�in�EU15�Member�States,�while�most�of� the�EU12� still�lag�behind.�Figure�1�shows�the�location�of�projects�and�their�distribution�between�the�EU15�and�EU12.�For� demonstration� and� deployment� projects,� the�project� was� assigned� to� the� country� where� the�demonstration� or� roll-out� actually� took� place,�while�in�the�case�of�R&D�projects,�the�project�was�counted� towards� all� the� participating� countries.�Most� of� the� projects� are� concentrated� in� a� few�countries;� Denmark,� Germany,� Spain� and� the� UK�together�account�for�about�half�of�the�total�number�of�projects.�
Figure 1. Distribution of projects between EU15 and EU12 Countries
EU15 countries
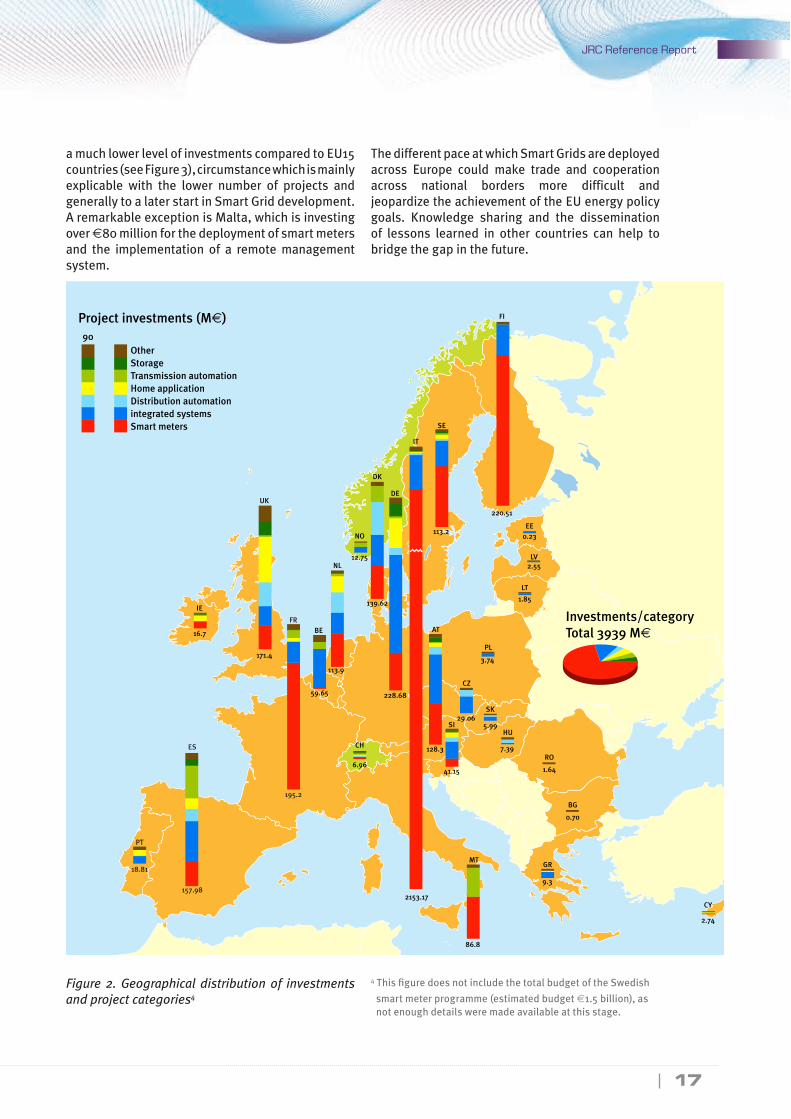
As� for� investments,� Figure� 2� shows� the� allocation�of� budget� across� different� countries� and� project�categories.� In� the� case� of� demonstration� and�deployment� projects,� the� budget�was� allocated� to�the� country� or� countries�where� the� project� had� at�least�one�implementation�site.�When�a�project�had�several� implementation� sites� located� in� different�countries,� the� project� budget� was� shared� evenly�among�them.�In�case�of�R&D�projects,�when�budget�shares�were� not� available,� the� budget� was� evenly�spread�across�the�participating�organizations.
A� few� countries� stand� out� in� terms� of� spending.�With�a�budget�of�over�€2�billion,�Italy�accounts�for�almost�half�of� the�total�spending� in�our�catalogue.�The� great� majority� of� this� budget� is� however�attributable� to� only� one� project,� the Telegestore�project,�which� consisted� in� the�national� roll-out�of�smart�meters�in�Italy.�Due�to�graphical�constraints,�the�corresponding�bar�in�Figure�2�had�to�be�cut�down�to�allow� its� representation�without�overshadowing�the�other�countries.�In�general,�EU12�countries�show�
BG
0.4
%C
Y 0
.4 %
CZ
1.7
%
EE 0
.2 %
HU
1.1
%LT
0.4
%LV
0.7
%M
T 0
.4 %
PL
1.7
%
RO
0.6
%
SI 3
.1 %
SK
0.7
%
UK6.8 %
Others11.3 %
AT6.1 %
BE4.2 %
DE11.1 %
DK22.0 %
EL2.0 %
FI1.5 %
FR4.2 %
IE2.4 %
IT5.5 %
NL6.8 %
SE5.0 %
PT2.4 %
ES8.7 %
17
JRC Reference Report
Other90
Project investments (M€)
StorageTransmission automationHome applicationDistribution automation
Smart metersintegrated systems
16.7
171.4
FR
195.2
157.98
ES
PT
18.81
BE
NL
59.65
6.96
CH
NO
12.75
139.62
DK
DE
IT
SE
113.2
220.51
0.23EE
LV
LT
SK
CZ
AT
2.55
1.85
PL
3.74
5.99HU
SI
RO
1.64
BG
GRMT
86.8
2153.17
2.74
CY
0.70
9.3
41.15
7.39
29.06
128.3
FI
228.68
113.9
IE
UK
Investments/categoryTotal 3939 M€
a�much�lower�level�of�investments�compared�to�EU15�countries�(see�Figure�3),�circumstance�which�is�mainly�explicable� with� the� lower� number� of� projects� and�generally�to�a�later�start�in�Smart�Grid�development.�A�remarkable�exception�is�Malta,�which�is�investing�over�€80�million�for�the�deployment�of�smart�meters�and� the� implementation� of� a� remote�management�system.�
The�different�pace�at�which�Smart�Grids�are�deployed�across� Europe� could� make� trade� and� cooperation�across� national� borders� more� difficult� and�jeopardize�the�achievement�of�the�EU�energy�policy�goals.� Knowledge� sharing� and� the� dissemination�of� lessons� learned� in� other� countries� can� help� to�bridge�the�gap�in�the�future.
4�This�figure�does�not�include�the�total�budget�of�the�Swedish�
smart�meter�programme�(estimated�budget�€1.5�billion),�as�not�enough�details�were�made�available�at�this�stage.��
Figure 2. Geographical distribution of investments and project categories4

18
JRC Reference Report
Smart Grid projects in Europe: lessons learned and current developments
Figure 3. Distribution of investments between EU15 and EU12 countries
Project�distribution�across�project�categories�Figure�2�shows�remarkable�differences� in� the�distribution�of� project� categories� in� Europe.� Generally� speak-ing,� the� investment�pattern�and�project� categories�coverage� in� different� countries� is� strongly� influ-enced� by� different� starting� points� in� the� adoption�of�the�various�Smart�Grid�solutions�and�by�national�circumstances.� Investments� depend� crucially� on�regulation,�generation�and�consumption�structures�in� each� country.� For� example,� countries�with� large�penetration� of� RES�may� favour� developments� that�increase� hosting� capacity� (i.e.� Transmission� Auto-mation,�Integrated�System,�Storage),�whereas�coun-tries�with�a�high�share�of�flexible�electricity�use�(e.g.�space� and�water� heating)�may� favour� investments�that� promote� Demand� Response� (i.e.� Distribution�Automation,� Integrated�System,�Home�Application,�Smart�Meters).
In�our�catalogue,�the�most�represented�project�cate-gories,�which�also�attract�the�highest�level�of�invest-ments,� are� Smart� Meters� and� Integrated� Systems�(Figure�2).�
About�27%�of�the�projects�collected�in�the�catalogue�fall�in�the�Smart�Meters�category;�as�we�will�see�better�later�(see�Box.1)�these�projects�involve�the�installa-tion�of�about�40�million�devices�for�a�total�investment�of�around�€3�billion.�These�figures�are�quite�signifi-cant,� but� a� lot�more�of� investments� are� needed� in�this�field,�as�smart�meters�are�a�key�enabler�for�many�Smart� Grid� applications.� Estimates� forecast� about�240�million�smart�meters�to�be�installed�by�2020�[47].�
The�country�leading�investments�in�smart�meters�is�Italy,�where�a�national�roll-out�(Telegestore�project)�has� already� been� achieved.� In� two� other� coun-tries,�France�and�Finland,� the�great�majority�of� the�budget�is�also�attributable�to�smart�meter�projects.�In�France�the�demonstration�project�Pilot Linky�ac-counts� for� about�75%�of� the� total� spending,�while�in�Finland�the�Smart Meters roll-out�project�by�For-tum�accounts�for�over�80%�of�the�whole�budget.�It�is�worth�stressing�that�the�Swedish�smart�meter�roll-out�is�largely�underrepresented�in�our�catalogue�at�the�moment.�We�have�received�communication�from�the�Swedish�regulator�that�the�full�smart�meter�roll-out� program� consisted� of� 150� projects� for� a� total�estimated� amount� of� €1.5� billion.� However,� so� far�we�have�received�and�included�in�our�analysis�data�from�only�three�projects,� involving�the�deployment�of�about�1.2�million�smart�meters.�
As�for�the�Integrated�System�category,�Figure�2�shows�that�in�almost�all�countries,�a�significant�amount�of�investments� has� been� devoted� to� projects,� which�address� the� integration� of� different� Smart� Grid�technologies� and� applications.� Integrated� System�projects� represent� about� 34%� of� the� projects� and�about�15%�of�the�total�budget.�Most�of�the�technolo-gies�are�known,�but�their�integration�is�the�new�chal-lenge.� This� result� highlights� the� need� to� consider�the�Smart�Grid�as�a�system�rather�than�simply�a�col-lection� of� different� technologies� and� applications.�For�a�more�detailed�discussion,� refer� to�Chapter�3.
***
Combining�the�overall�investment�from�the�catalogue�(around�€4�billion)�with�the�investment�costs�of�the�Swedish�smart�meter�roll-out�(around�€1.5�billion),�we� can� estimate� the� investments� in� Smart� Grid�projects� in�Europe� to�be�about�€5.5�billion� so� far.�
NL PT
SE
UK
Other
AT
BE
BG, CY
CZ
EEHU, LT, LV
MT
PL, RO
SI
SK
DE
DK
ELES
FIFR
IT
IE

19
JRC Reference Report
These� figures�show�that� important�efforts�have�al-ready�been�undertaken,�but�we�are�just�at�the�begin-ning�of�the�Smart�Grid�transition.�To�put�the�invest-ments� in� our� catalogue� into� context,� conservative�estimates�quantify�Smart�Grid�investments�by�2020�[47]�at�€56�billion�(see�Chapter�1).
BOX 1. SMART METERING
The� introduction�of�smart�metering�systems� in�Eu-rope�has�received�an�important�regulatory�push�by�the� European�Union’s� Third� Energy� Package� provi-sions�and�especially�Annex�I.2�of�the�Electricity�Di-rective�.�The�Annex�explicitly�asks�Member�States�to�assess� the� roll-out�of� intelligent�metering�systems�as�a�key�step�towards�the�implementation�of�Smart�Grids�and� to� roll�out�80%�of� those� that�have�been�positively�assessed.�
Many�Member� States� have� already� started� imple-menting�provisions� in�their� legislation,�while�some�others�are�still�lagging�behind.�
Independently� of� the� legislative� and� regulatory�framework,� in� some� Member� States� utilities� have�started� to� introduce� smart� meters� as� a� means� to�modernise�the�grids�and�to�bring�about�operational�changes,�i.e.�reduce�nontechnical�losses,�introduce�remote�reading�and�switching�or�simplify�the�billing�procedures.�
In�our�catalogue,�a�set�of�Member�States�is�leading�the�investments�in�the�deployment�of�smart�meters.�
ITALY� started� a� national� roll-out� already� in� 2001�(Telegestore�project).�By�the�end�of�2006�about�30�million�meters�had�already�been�installed.�Pursuant�to� Regulatory� Order� No.� 292/06� of� 18� December�2006,� automatic� metering� infrastructure� is� now�mandatory.�The�focus�of�the�Italian�metering�system�is�on�reduction�of�nontechnical�losses�more�than�on�energy�savings�[1].
SWEDEN� Already� in� 2003,� Sweden� mandated�monthly�automatic�meter� reading� for�all�electricity�meters� by� July� 2009.� Within� the� given� timeframe�DSOs�were�free�to�decide�the�pace�of�implementation.�Thanks� to� the� new� legislation,� investments� in�Smart�Metering�developed� fast� and� the� roll-out� at�national�level�was�achieved�in�time.�Given�the�high�number� of� DSOs� in� the� country,� since� 2003� there�has�been�a� correspondingly�high�number�of� smart�meter� roll-outs.� Overall,� the� national� deployment�
of�smart�meters�was�carried�out�by�means�of�about�150�projects,�amounting�to�around�€1.5�billion�and�involving�the�installation�of�approximately�5�million�smart�meters.�In�our�analysis�we�have�included�three�of�these�projects,�accounting�for�the�installation�of�about�1.2�million�smart�meters.��FRANCE�The�demonstration�project Pilot Linky�start-ed�in�2007�and�involved�the�installation�of�300,000�smart�meters.� Building� on� the� results� of� the� pilot�phase,�a�national�roll-out�is�in�preparation.�The�roll-out�phase�envisages� the�deployment�of�35�million�smart�meters,�with�an�expected�investment�of�about�€4�billion.�The�goal� is�from�January�2012�to� install�only�electronic�meters�and�to�have�95%�coverage�by�the�end�of�2016.�The�regulator�defined�some�guide-lines�and�minimum�functional�requirements�for�elec-tricity�meters.�A�cost-benefit�analysis�with�a�positive�result�was�presented�in�2007.
MALTA� The� deployment� of� smart� meters� started�in�Malta� in� 2008� with� a� 5� year� pilot� phase� which�provides�for�the�installation�of�250,000�meters.�The�pilot�project�uses�the�Enel�technology�and�it�is�aimed�at� identifying� any� problems� ahead� of� the� planned�replacement� of� all� electricity� and�water�meters.� In�2010�Enemalta� launched�a� roll-out�plan� to� replace�all�electricity�and�water�meters�by�the�end�of�2012.
FINLAND�The�smart�meter�roll-out�is�well�on�its�way�in�Finland.�The�new�electricity�market�act�(66/2009�Act�on�electricity�supply�reporting�and�metering)�re-quired�all�connection�points�over�63�Ampere�to�have�remotely�readable�hourly�metering�by�2011.�By�2014�the� Act� demands� for� full� smart� meter� penetration�with�no�more� than�20%�exception.�The�Ministry�of�Employment� and� Economy� has� estimated� roughly�that� the�cost�of�a� full� roll-out� is�€565–940�million�(for�2.2�million�customers�who�do�not�yet�have�AMR�–�Automated�Meter�Reading).�

20
JRC Reference Report
Smart Grid projects in Europe: lessons learned and current developments
UK�The� Smart�Meter� National� Roll-out� Program� in�the�UK�is�planned�to�start�in�2012�and�be�completed�in�2020,�with�an�estimated�investment�of�more�than�€11�billion.�
Highlights�from�collected�projects�Most�of�the�smart�metering�projects�are�demonstration�projects�(59%),�followed� by� deployment� (32%)� and� R&D� projects�(9%).� All� the� smart� metering� projects� together�account� for� about� 75%� of� the� catalogue’s� total�budget,�but�a�considerable�share�of�this�figure�(71%)�is�attributable� to�a�single�project,� the�smart�meter�roll-out� in� Italy.� Although� a� substantial� amount� of�money�has�already�been�invested�in�this�field,�there�is�still�need�for�considerable�investments.
Estimates�forecast�€51�billion�investments�in�smart�meters�by�2020�[27].�The�projects� in�the�catalogue�will�result�in�the�installation�of�more�than�40�million�smart�meters,�of�which�32�million�in�Italy.�
Business�case�for�investments�Investment�in�smart�meters� is�currently�mainly� justified�on�the�basis�of�the�expected�reduction�of�DSO’s�operational�expen-ditures,� typically� resulting� from� the� elimination� of�meter� reading� costs,� reduction� of� power� theft,� re-mote� activation� and� deactivation� of� service,� faster�detection�of�power�outages,�and�improved�manage-ment�of�bad-payers.�This�investment�is�also�likely�to�yield�additional�benefits�arising�from�the�provision�of� dynamic� pricing� for� consumers.� These� benefits�are�usually�not�considered�in�the�business�case�for�deployment�of�smart�meters,�as�they�depend�on�the�development� of� future� functionalities� and� applica-tions�(i.e.�in-home�displays,�smart�appliances).�
Examples�of�operational�benefits� recorded�by�DSO�from�smart�meter�deployment
� •�With� the� Telegestore� project,� Enel� has� gained�approximately €500� million� in� yearly� savings,�with�a�5�year�payback�period,�and�a�16%�internal�rate�of�return.
� •�The�period�for�settlement�of�balance�power�was�reduced� from� 13� to� 2� months� after� the� delivery�month�(Storstad Smart Metering project).
� •� Contribution� to� a� decrease� in� the� SAIDI� index�(System�Average�Interruption�Duration�Index)�from�128�min�to�49�min,�and�a�consequent�decrease�of�cash�cost/customer�from�€80�to�€48�from�2001�to�2009�(Telegestore).
� •� With� the� Telegestore� Project,� Enel� managed�3,027,000�bad�payers�in�2008�(Telegestore).
� •� Lead� time� for� exporting� meter� readings� to�suppliers�was�shortened� from�30�days� to�5�days�(Project�AMR).�
� •�Over�a�two�year�period,�the�number�of�calls�for�both� meter-reading� and� invoice� related� issues�dropped� by� 56%� (Storstad Smart Metering project).
�

21
JRC Reference Report
2.2 Project maturity and scale
Projects�were�classified�according�to�their�stage� in�the� innovation� chain.� To� identify� R&D� projects� we�used�the�definition�laid�out�in�the�Frascati�Manual,�according�to�which�R&D�projects�comprise�creative work undertaken on a systematic basis in order to increase the stock of knowledge, including knowledge of man, culture and society, and the use of this stock of knowledge to devise new applications�[43].� The� term� R&D� covers� three� activities:� basic�research,� applied� research� and� experimental�development.
For� demonstration� projects� we� referred� to� the�conceptualisation� largely� used� in� the� literature,�which� defines� a� demonstration� project� as� a� finite�initiative�to�test�a�technology�according�to�the�project�objectives.� A� technology� could�be� everything� from�a� base� technology� to� a� complete� system� concept�[33].� The� project� starts� with� a� conceptual� design�and� ends� when� the� technology� is� implemented�and� the� results� are� evaluated� and� communicated�[11].�Demonstration�projects�can� therefore�be�seen�as�a�‘preview’�phase�when�the�interaction�between�users�and�support�systems�and�emergent�products�is�tested.�The�concept�includes�projects�designed�to�test�the�performance�of�the�technology�in�different�operational� environments,� through� to� full� market�trials� in�which� the� technology� is�used� in� customer�installations�[3].�These�projects�aim�at�exposing�the�technology�to�realistic�user�environments�to�test�its�suitability�for�more�extensive�diffusion.�
Finally,� deployment� projects� refer� to� the�implementation� of� a� technology,� application� or�system� as� a� default� solution� within� the� project�geographical� boundaries.� Some� deployment�projects�are�nationwide;�some�others�are�limited�to�a�more�restricted�geographical�area.�
Some�projects�in�the�catalogue�include�two�different�stages,� typically�R&D�and�demonstration.� In� these�cases,�for�the�sake�of�simplicity,�we�have�assigned�the� project� to� the� stage� that� seemed� to� best�characterize� the� project� and� to�which�most� of� the�time�and�budget�were�allocated.
***
! "# $ %& ( ) "* + % ", $ + "- . - / 0 %- 1& 2 + *
3 4- . # + 5 & * + 3 # & * - / + 5 &
". .- 6 3 + "- . 2 5 3 ".
! "# $ %& ' ( ' ) "* + % ", $ + "- . ' - / '
". 0 & * + 1 & . + * ' 2 3- . # ' + 4 & ' * + 2 # & * '
- / ' + 4 & ' ". .- 0 2 + "- . ' 5 4 2 ".
The�collected�projects�span�across�all�the�stages�of�the�innovation�process,�but�the�majority�of�them�are�concentrated�in�the�R&D�and�demonstration�phases�(Figure�4).�Only�7%�of�the�projects�are�in�the�deploy-ment�phase.��
When� we�move� our� attention� from� the� number� of�projects�to�the�corresponding�investments,�the�pic-ture�changes�considerably�(Figure�5).�As�expected,�deployment� covers� the� lion’s� share� of� investment�commitments;� 7%� of� the� projects� account� for� al-most�60%�of� the� investments.� An� important� share�of�these�investments�however�is�attributable�to�only�one�project,�the�massive�roll-out�of�smart�meters�in�Italy�(Telegestore�project,�€2,106�million).�R&D�and�demonstration�projects�account�for�a�much�smaller�portion�of�the�total�budget.�Most�of�these�projects�are�small�to�medium�size,�with�an�average�budget�of�€4.4�million�for�R&D�projects�and�about�€12�million�for�demonstration�projects.�In�the�future�there�might�be�the�need�for�larger�scale�demonstration�projects�to� improve� our� knowledge� of� the� functioning� and�impacts�of� some� innovative�solutions�at�a� realistic�scale�and�to�validate�results�to�a�wider�extent.�
Figure 4. Distribution of projects along the stages of the innovation chain
Figure 5. Distribution of investments along the stages of the innovation chain

22
JRC Reference Report
Smart Grid projects in Europe: lessons learned and current developments
R&D�and�demonstration�projects�can�be�found�in�al-most� all� the� countries� in� the� catalogue� (Figure� 6),�while�deployment�projects�are�concentrated�only�in�a� few� countries.�Given� that� almost� all� of� them�are�smart�metering�projects,� the�main� reason� for� their�concentration�might�lie�in�the�favourable�legislative�and�regulatory�environment.�
Denmark�stands�out�in�terms�of�the�number�of�R&D�and�demonstration�projects..�This�is�partly�explained�by� the� fact� that� Denmark� has� already� achieved� a�very�high�penetration�of�renewables�and�distributed�generation�and�therefore�needs�to�update� its�elec-tricity�system.�Moreover,�the�Danish�TSO�is�charged�with� supporting�R&D� and� demonstration� activities�in� the� electricity� sector,� activities� which� are� then�financed�through�a�Public�Service�Obligation�(PSO)�tariff5.� This� system� also� implies� the� traceability� of�the�projects�which�can�then�be�easily�monitored�and�communicated,� favouring� the� assessment� of� their�
Figure 6. Stages of development and participating countries across collected projects
results�and�knowledge�sharing.�This�is�not�the�case�for�many�other�countries,�where�retrieving�informa-tion�about�Smart�Grid�projects�proved�to�be�a�more�difficult�task.
Figure�6�shows�a�very�high�number�of�R&D�projects,�which�might�give� the� impression�of�a�higher�share�than�presented�in�Figure�4.�In�reality,�this�is�explained�by� the� fact� that�about�25%�of�R&D�projects� in�our�catalogue�involve�the�participation�of�several�coun-tries,�and�they�have�therefore�been�counted�towards�each�one�of� them.�All� of� these�projects�have�been�co-funded�by� the� European�Union,�mainly� through�the�FP6�and�FP7�programmes�and�they�represent�an�important�means�of�enhancing�international�cooper-ation,�knowledge�sharing�and�the�dissemination�of�lessons�learned.�
5� Under�the�PSO�Programme�ForskEL,�the�Danish�TSO�admin-isters�PSO�funding�of�130�million�DKK�a�year�which,�through�a�call�process,�is�granted�to�research,�development�and�demonstration�projects�within�selected�and�prioritized�focus�areas.�The�ForskEL�program�has�run�since�1998.

23
JRC Reference Report
Figure 7. Investments in collected Smart Grids (SG) R&D projects per country
As�for�the�investments,�Figure�7�focuses�on�R&D�ac-tivities,�grouping�countries�according�to�their�level�of� investments� in� R&D� projects.� Relevant� differ-ences�can�be�noted�between�countries;�as�stated�in�§�1.1.2�however,�the�investments�we�reported�in�our�catalogue�are�only�those�which�fall�into�the�scope�of�our�analysis.�R&D�projects� in�our�catalogue�range�from� network� assessment� and� planning� tools� to�the�investigation�of�new�market�solutions�and�con-sumers’�behaviour.�

24
JRC Reference Report
Smart Grid projects in Europe: lessons learned and current developments
Finally,� Figures�8� and�9� show� the� trend�of� the�dif-ferent� maturity� stages� over� time.� The� number� of�R&D�and�demonstration�projects�grows�constantly�while�the�number�of�deployment�projects�has�not�in-creased�dramatically�since�the�first�project�in�2001.�The� constant� growth� of� demonstration� projects� is�particularly�important�as�it�shows�an�increasing�con-fidence�in�the�viability�of�Smart�Grid�projects.
Figure 8. Share of R&D, demonstration and deployment over time
Figure 9. Project status and stage of development

25
JRC Reference Report
2.3 Insight into some final applications and their level of maturity
As�aptly�stated�by�[17],�Smart�Grids�are�not�an�end�in�itself�but�a�means�to�an�end.�The�project�categories�in� Figure� 2� can� be� seen� as� the� key� technological�areas� addressed� by� the� projects� to� achieve� Smart�Grid�solutions.�Building�on�the�categorisation�effort�carried� out� by� project� respondents� and� through�an� in-depth� analysis� of� the� project� elements,� we�identified� three� main� final� applications� pursued�by� the� projects� in� the� catalogue,� namely� the�safe� integration� of� Distributed� Energy� Resources�(Distributed�Generation,� Storage,� EVs,� see� Box� 2),�the�possibility� for� consumers� to� respond� to�prices�(Demand�Response�and�dynamic�pricing,�see�Box�3),�and� the�safe� integration�of� large-scale� renewables�(see�Box�4).�
In� this� section� we� will� analyse� these� three�applications� and� their� level� of� maturity� in� the�context� of� the� general� results� of� the� survey� to�gain� an� insight� into� the� current� developments� in�the� Smart� Grid� landscape.� Since� smart� meters�are�a�key� technological�enabler� for�many�of� these�developments,� we� have� included� them� in� the�analysis�as�well.�
BOX 2. Integration of Distributed Energy Resources
The� deployment� of� Distributed� Energy� Resources�(DER)� is� useful� to� (1)� offer� alternatives� to� large�centralized� plants� facing� permit� problems� and�construction�uncertainties,�(2)�exploit�the�potential�of� dispersed� Renewable� Energy� Sources� (RES),�and� (3)� include� prosumers� in� the� electricity�market.� Decentralization� supports� scalability� and�robustness,� i.e.� the� capability� to� integrate� new�components�or� cope�with� component� failures.�The�trend� toward� decentralization� is� also� encouraged�by� consumers’� push� for� more� control� over� energy�consumption.�
The� integration� of� large� quantities� of� DER� is�extremely� challenging� both� from� a� physical� and�market� point� of� view.� The� goal� of� projects� in� this�area� is�the�online�coordination�of�electric�vehicles,�distributed� generators� and/or� storage� devices� to�adjust�to�grid�and�market�conditions,�guaranteeing�grid� stability,� optimization� of� energy� resources,�easier� access� to� the� electricity� market� for� small�players.�Different�methods�are�implemented�across�projects�to�explore�the�capabilities�of�DER�units�to�provide� ancillary� services� through� an� aggregated�DER�portfolio.
Scanning� through� the� projects,� we� observe� that,�while�some�make�use�of�the�concept�of�diversification�by�combining�a�variety�of�types�of�micro-generation�units,�others�focus�on�just�one�single�type�of�energy�source�by�compensating�for�the�variability�of�power�flows�through�means�of�storage�and/or�modification�of� load� profiles� (instantaneous� modification� of�electricity�consumption�levels).

26
JRC Reference Report
Smart Grid projects in Europe: lessons learned and current developments
BOX 3. Demand Response
Demand�Response�(DR)�is�one�of�the�central�themes�in� the� catalogue.� Its� target� is� to� enable� active�participation� of� commercial/domestic� consumers�in�the�market�through�the�provision�of�consumption�flexibility�services�to�different�players�in�the�power�system.�This�is�achieved�by�aggregating�consumers’�reduced� load� into� larger� amounts� for�participation�in�market�sales�(e.g.�to�sell�to�network�companies,�balancing� responsible� parties,� owners� of� non-controllable� generation,� etc.).� Aggregators� are� the�key�players�to�mediate�between�consumers�and�the�market.
Particularly� challenging� is� the� integration� of�domestic� consumers� who,� as� opposed� to� DG� and�large� industrial� consumers,� are� less� motivated�by� purely� economic� concerns� (minimal� gains).�Furthermore� domestic� consumers� are� generally�unable�to�make�precise�predictions�on�their�available�load�flexibilities;�therefore�it�is�difficult�for�them�to�‘offer’� services� in� the� classical� sense.� Rather,� the�idea�is�for�their�services�to�be�made�available�at�the�market’s�‘request’,�i.e.�through�price�and/or�volume�signal�mechanisms,�and�for�the�provision�of�services�to�be�on�a�voluntary�and�contractual�basis.
BOX 4. Large-scale integration of renewable energy
More� and� more� variable� renewable� energy�generation,� for� the� time� being� mainly� based� on�wind� and� in� future� also� expected� to� include� other�technologies� (e.g.� concentrated� solar� power),� is�grouped� in� large-sized� plants� often� installed� far�from�existing�power�infrastructure�(e.g.�offshore�or�in�remote�areas).�
This� large-scale� renewable� generation� poses�a� number� of� challenges� on� the� power� system�architecture�and�operation:�
It� requires�adequate�connection� to� the�existing�•�infrastructure� and� appropriate� internal� grid�reinforcements� in� order� to� wheel� the� renewable�power� to� the� demand� centres� (often� far� from� the�connection�point);
Due� to� a� more� marked� time-variability� and�•�weather-dependence� of� its� energy� output� (com-pared� to� other� generation� technologies),� the� bal-ancing� task� of� power� system� operators� becomes�harder�to�carry�out;�as�a�matter�of�fact,�since�elec-tricity�is�not�stored�on�a�massive�scale�to�date,�the�power�produced�must�at�all�times�equal�the�power�consumed�(and�lost).
As� the� current� power� grids� do� not� generally�•�appear� adequate� to� reliably� cope� with� large-scale� penetration� of� such� intermittent� renewable�generating� plants,� network� operators� are� getting�together�with�research�centres,�academia�and�other�partners�to�study�and�demonstrate�how�to�overcome�the�barriers�of�grid�access�and�system�integration�for� large-scale� renewables;� as� a� consequence,�large�investments�are�being�committed�to�upgrade�the� existing� grids� and� to� demonstrate/implement�measures� such� as� reserve� capacity� increase,�balancing� area� expansion,� redesigned� market�mechanisms,�load�shifting�and�storage�integration�to�cope�with�renewable�energy�variability.

27
JRC Reference Report
� Figure�10�shows�the�number�and�the�starting�year�of�projects�focusing�on�the�integration�of�Distributed�Energy� Resources� (DER),� on� Demand� Response�(DR)� and� on� the� safe� integration� of� large-scale�RES.� Figure� 11� shows� the� investments� associated�to�these�projects.�For�sake�of�simplicity,�the�entire�project�budget�was�allocated� to� the� starting�year.�Figure�12�reports�the�classification�of�the�projects�in�these�three�areas�according�to�R&D,�demonstration�and�deployment�stages.
Projects�focusing�on�the� integration�of�distributed�energy�resources�are�steadily�growing.�Most�of�the�work�is�still�focusing�on�the�R&D�and�demonstration�stages� to� test� aggregation� concepts� (e.g.� Virtual�Power� Plant,� Vehicle2Grid).� None� of� the� collected�projects� has� moved� these� concepts� to� the�deployment�stage.
Demand� Response� projects� testing� dynamic�pricing�and�consumer�participation,�are�growing�in�number.�They�are�benefiting� from�the�deployment�of� smart� meters,� which� are� key� enablers� for� the�increase� of� Demand� Response� initiatives.� More�and�more� Demand� Response� projects� are�moving�from� R&D� applications� to� demonstrations� to� test�actual� consumer� engagement.� Gaining� consumers�trust� and� participation� is� the� main� challenge� in�this� field.� Potentially,� consumers’� benefits� are�significant.�They�range�from�energy�savings�(up�to�10-15%,�see�e.g.�GAD�project)�to�a�more�favourable�business� case� for� the� purchase� of� home� energy�resources� (heat�pumps,�EVs,�CHPs�etc.)� through�a�direct�participation�in�the�electricity�market�(selling�power�and/or�load�flexibility).�However,�in�order�to�capture�most� of� these� benefits� the�whole� system�(infrastructure�+�market)�needs�to�be�in�place.
There�is�an�increase�in�the�number�of�projects�and�budget�available� for� the� integration�of� large-scale�RES�with�time,�but�at�a�lower�level�compared�to�other�applications.�However,�we�remark�that�the�majority�of�investments�in�this�area�are�concentrated�in�grid�reinforcement�and�they�do�not�appear�in�our�analysis�as�we�have�only�focused�on�Smart�Grid�projects.�
Figure 10. Trend in the number of projects focusing on integration of Distributed Energy Resources, De-mand Response and large-scale Renewable Energy Sources over time

28
JRC Reference Report
Smart Grid projects in Europe: lessons learned and current developments
Figure 11. Budget allocated to projects focusing on the integration of Distributed Energy Resources, Demand Response and large-scale Renewable Energy Sources over time
Figure 12. Level of maturity of projects focusing on the integration of Distributed Energy Resources, Demand Response and large-scale Renewable Energy Sources

29
JRC Reference Report
Finally,� Figure� 13� shows� the� maturity� level� of�smart� meters,� a� key� enabler� of� many� Smart� Grid�applications.� Over� 30%� of� smart� meter� projects�are�in�the�deployment�phase,�while�the�R&D�stage�comprises� a� very� limited� number� of� projects� (e.g.�see� projects� OpenNode,� OpenMeter,� SyM2).� The�demonstration� and� deployment� of� smart� meters�has� made� R&D� and� demonstration� activities� in�other�Smart�Grid�areas�possible.�In�particular,�many�demonstration�projects�combine�the� installation�of�smart�meters�with�Demand�Response�programmes�(e.g.� see� projects� MeRegio,� ESB Smart Meter,�E-telligence).
Figures�12�and�13�also�confirm�what�we�have�already�observed� in� the� previous� paragraphs.� R&D� and�demonstration� projects� are� smaller� in� size� and�they� have� a� wider� portfolio� of� technologies� and�applications.�
Figure 13. Level of maturity of projects focusing on smart meters
2.4 Who is investing?
A� wide� variety� of� respondent� organisations� are�investing�in�the�Smart�Grid�projects�of�the�catalogue.�Taking�stock�of�the�work�presented�by�[17],�we�have�grouped� the� leading� organisations� of� the� projects���in�the�following�categories:�
1.� Energy�Companies�(e.g.�EDF)
2.� Distribution�System�Operators�(e.g.�Enel�Distri-bution)
3.� Transmission�System�Operators
4.� Service�Providers�(manufacturers,�aggregators,�retailers,�IT�companies�etc.)
5.� Universities,� Research� Centres,� Public� Organi-sations

30
JRC Reference Report
Smart Grid projects in Europe: lessons learned and current developments
Figure�14�shows�the�progression�of�investments�by�leading�organisations�over�time.�The�high�figure�for�2001�is�due�to�the�national�smart�meter�roll-out�run�by�Enel�in�Italy�(Telegestore project).�The�decrease�in�investments�in�2011�is�due�to�the�fact�that�many�projects�planned�to�start�this�year�have�not�answered�to�our�survey�yet.
Figure 14. Starting time across budget (€ million) and leading organisations
The�players�leading�and�participating�in�the�projects�in� the� catalogue� are� diverse,� as� the� increased�complexity� of� the� electricity� system� requires�multidisciplinary� consortia.� Network� operators�are� establishing� fruitful� cooperation� with� diverse�partner� organisations,� ranging� from�academia� and�research� centres� to� manufacturers� and� service�providers,� particularly� IT� companies.� As� a� whole,�the� implementation�of�Smart�Grids� is� a� significant�opportunity� for� the�European� industry� to� research,�market�and�export�new�technologies,�to�create�new�jobs,�to�keep�global�technological�leadership�and�to�contribute� to� achieving� the� environmental� targets�the�EU�has�set�(see�also�[10]).

31
JRC Reference Report
Figure 15. Investment distribution across leading organizations
Figure� 15� shows� the� cumulated� investments�of� different� leading� organisations� across� our�catalogue.� The�data� seems� to� confirm� the� leading�role�DSOs�play�in�promoting�Smart�Grid�development�in�Europe.�Current� total� investment� in�projects� led�by�DSOs�amounts�to�over�€3�billion.
To� leverage� further� investments� for� the� rapid�development� of� Smart� Grids� and� ensure� the�necessary� involvement� of� risk-averse� network�operators,� it� is�necessary� to� find� the� right�balance�in� sharing� costs,� benefits� and� risks.� The� main�responsibility� for� achieving� this� balance� lies� with�regulators.�
The� high� number� of� DSO-led� projects� in� our�catalogue� allowed� us� to� get� an� insight� into� the�source� of� financing� of� these� projects.� Generally�speaking,�investment�costs�of�DSO-led�projects�are�mainly� covered� either� through� tariffs� or� through�funding� made� available� at� European� or� national�level.� In�many�cases�costs�were�covered�through�a�combination�of�both.�
The�majority�of�DSO-led�projects�in�our�catalogue�are�financed�by�DSOs�themselves,�i.e.�through�revenues�received� from� tariffs� charged� to� the� end� user� for�distribution� of� electricity� in� the� Low� Voltage� grid.�
Other�examples�of�tariff-based�funding�are�regulatory�incentives�funded�through�tariffs,�such�as�the�UK’s�Innovation�Funding�Incentive�introduced�in�2005�by�the�regulator�OFGEM,�allowing�up�to�0.5%�of�annual�revenue�to�be�spent�on�innovation.�In�2010,�OFGEM�established� the� Low�Carbon�Network� Fund� (LCNF),�which�allows�up�to�£500�(€577)�million�specifically�in� support� of� DSO-sponsored� projects� testing�operating� and� commercial� arrangements,� and�new�technology.� In� fact,� all� DSO-led� projects� from� the�UK�included�in�our�catalogue�are�supported�by�the�LCNF,� enabling� a� total� investment� of�€118�million.
Another� best-practice� scheme,� though� not� part�of� our� catalogue,� is� implemented� by� the� Italian�energy� regulator� AEEG� who� recently� launched� a�competition-based� procedure� providing� specific�incentives� for� Smart� Grid� demonstration� projects�related� to� the� active� distribution� network.� The�motivation� for� DSOs� to� invest� is� that� they� are�guaranteed� an� extra� 2%� return� on� capital� on�distribution� network� related� investments� for� a�period�of�12�years�[38].�
In� terms� of� public� financing� for� Smart� Grid�investments,� the� European� Commission� funds� a�whole� series� of� projects� dealing� with� different�issues� concerning� the� implementation� of� Smart�

32
JRC Reference Report
Smart Grid projects in Europe: lessons learned and current developments
Grid�technologies.�The�EC’s�contribution�toward�the�projects� considered� in� our� catalogue� amounts� to�about�€184�million,�25%�of�which�went�to�DSO-led�projects�(Figure�16).�
Figure 16. Distribution of EC Funding across Leading Organisations
The� majority� of� EC� funded� projects� in� the� cata-logue�are�supported�either�by�the�6th�or�the�7th�EU�Framework� Programme� for� Research� and� Techno-logical�Development�(FP6�or�FP7,�respectively,�see�Box�5).�However,�project�funding�was�also�received�from�the�European�Regional�Development�Fund�as�well�as�the�EU�Recovery�Plan.�In�all,�9%�of�DSO-led�projects�are�supported�with�funding�by�the�EC.�
Box 5. FP6 and FP7 projects in the catalogue
8� projects� financed� by� FP6� framework�•�funding�–�total�financing��€38�million
23� projects� financed� by� FP7� framework�•�funding�–�total�financing�€146�million
About� 10%�of�DSO-led�projects�are� co-financed�by�national� funding� schemes,� such� as� the� Austrian�Climate� and� Energy� Fund� KLIEN,� which� funds�Austrian� projects� included� in� the� catalogue� worth�€33.5� million.� The� fund� was� set� up� in� 2007� by�the� Federal� Ministry� of� Transport,� Innovation� and�Technology�in�support�of�sustainable�energy�supply�and�the�reduction�of�GHG�emissions.�
Other�examples�of�national�co-funding�represented�in� the� catalogue� include� financial� support� from�the� Portuguese� National� Strategic� Reference�Framework�(QREN),�the�Spanish�Ministry�of�Science�and� Innovation’s� Centre� for� Industrial� Technology�Development� (CDTI)� and� the� German� Federal�Ministry� for� Economics� and� Technology’s� funding�program�“E-Energy”.
Figure�17�reports�the�number�of�DSO-led�projects�and�the�corresponding�investments�in�key�technological�applications:� Advanced� Metering� Infrastructure,�Integration� of� DERs� and� Demand� Response.� DSO-led� projects� are� concentrated� on� smart� metering�whose� business� case� is� mainly� based� on� savings�in�areas�like�revenue�protection�(e.g.�energy�theft),�logistics,�field�operations�(e.g.�readings,�activation/deactivation)�and�customer�service�(e.g.�bad-payers,�invoicing),� resulting� in� the� reduction� of� operation�costs�(see�Box�1�for�more�details).�

33
JRC Reference Report
Figure 17. Investments in DSO-led projects by application
Budget�(€million)�������Number�of�Projects
For�other�deployments,�such�as�that�of�the�electric�vehicles� (EV)� charging� infrastructure,� the�business�case�of�DSOs�is�still�unclear�(see�Box�6).�The�main�problem� is� the� uncertainty� regarding� the� demand�side.� Whether� a� “pay-per-use”� model� (consumers�pay� per� kWh� charged)� or� a� subscription� model�(consumers�pay�an�annual�or�monthly�subscription�fee)� is� applied,� expected� utilisation� rates� as� well�as� the� expected� number� of� charging� stations� per�car�are�currently�still�unclear.�In�our�catalogue�11%�of� DSO-led� projects,� about� 50%� of� DER� projects,�study�consumers’�EV�charging�behaviour�indicating�quite�some�interest�towards�the�uptake�of�charging�infrastructure�among�European�network�operators.�
3000 30
2500 25
2000 20
1500 15
1000 10
500 5
0 0AMI DER DR

34
JRC Reference Report
Smart Grid projects in Europe: lessons learned and current developments
BOX 6. EV Charging infrastructure
Whether�or�not�the�charging�infrastructure�is�•�to�be�a�regulated�asset�is�still�a�much�debated�issue,� which�makes� the� business� case� for�DSOs� ambiguous.� It� can� be� considered�as� an� extension� of� the� distribution� grid,�much� like� a� telephone� booth� in� the�phone� infrastructure.� In� this� case� direct�governmental� intervention� would� allow�DSOs� to� socialize� the� costs.� Rather� than�operating� them,� DSOs� could� generate�revenue� by� selling� charging� equipment� as�well�as�related�consulting�services�to�public�or� private� entities.� Alternatively,� charging�infrastructure� can� be� regarded� as� a� post-sale� service� comparable� to� a� fuelling� gas�station,� in� which� case� private� companies�are�entirely�responsible�for�its�provision�as�well�as�operation�
The� MiniE-Berlin� project� (50� customers�•�and� 100� recharging� stations� 50� public�stations� and� 50� home� stations)� pursues�an� open� access� approach.� Customers� can�buy� specific� electricity� product� of� their�dedicated� electricity� provider.� Contrary� to�a�roaming�approach,�a�customer�could�only�buy�the�electricity�product� from�the�owner�of�the�charging�spot.
In� the� e-Mobility� project� (100� customers�•�and� 400� recharging� stations� -� 300� public�stations� and� 100� home� stations)� the�charging� infrastructure� is� built� by� a� DSO�(Enel� Distribuzione)� and� is� likely� to� be�considered� a� regulated� asset.� The� same�open� access� approach� of� the�MiniE-Berlin�project�is�pursued.
Caution� in� performing� charging� spots� roll-•�outs�is�an�indication�of�the�lack�of�a�strong�business� case,� which� is� largely� due� to�uncertainties�regarding�future�demand.
At� the� transmission� level,� projects� are� exploring�new�technologies�(e.g.�High�Voltage�Direct�Current�-�HVDC,�Flexible�AC�Transmission�Systems�-�FACTS)�and�new�tools�to�increase�transfer�capacity,�enhance�cooperative� and� flexible� operation� and� cope� with�permit� limitations� and� high� costs� of� new� grid�infrastructures.� The� amount� of� investment� already�committed/mobilised� for� transmission� projects� in�our� catalogue� is� around� €45� million� for� research�and�€95�million� for� demonstrations.� According� to�[12],� required� R&D� investments� for� transmission�projects� amount� to�€270�million� for� research� and�€290�million� for�demonstrations�over� the�next� ten�years.�
The�gap�between�the�investments�already�mobilised�and�those�required�can�be�partly�explained�by�the�fact�that�transmission�operators�are�mainly�and�heavily�investing� in�what� can�be�defined�as� strengthening�rather�than�smartening�the�transmission�grid,�as�one�can� claim� that� the� transmission� system� is� already�partly� a� smart� system� capable� of� managing� and�balancing�the�resources�(currently)�connected�to�it.�These�investments�do�not�appear�in�the�catalogue,�which�only�focuses�on�Smart�Grid�projects.
Furthermore,� considering� that� the� demonstration�projects� at� the� transmission� level� are� particularly�capital� intensive,�TSOs�need� to�carefully�plan�R&D�projects�and�move�to�the�demonstration�phase�with�vey�well�tested�solutions.�In�this�perspective,�TSOs�are� increasingly� teaming�up�with�research�centres,�universities� and� industrial� partners.� Also,� another�step� in� the� right� direction� is� the� set-up� of� joint�projects� by� different� TSOs� (e.g.� projects�Twenties,�Optimate).�The�coordination�of�R&D�efforts�reduces�R&D� and� demonstration� costs� and� facilitates� a�common�European�network�operation.�

35
JRC Reference Report
3 BuildinG tHe Smart Grid SYStem
Successful� Smart� Grid� deployment� requires� a�systemic� perspective,� as� most� of� Smart� Grid�benefits� are� systemic� in� nature.� As� aptly� stated� in�[32]� “In a major infrastructural shift, technologies do not replace technologies, rather systems replace systems”.� Individual� technologies� should� not� be�considered� “just an add-on feature to be fit in established existing electricity systems, otherwise their disruptive impact cannot be captured and their business case is negatively biased”�[59].�In�the�current�playing�field,�each�individual�new�technology�faces�significant�barriers�for�its�widespread�market�adoption� against� established� business� practices,�consumers’� habits� and� regulation.� Market� forces�alone� can� take� many� years� to� fit� new� Smart� Grid�applications�into�the�existing�electricity�system.
The�majority�of�benefits�arising�from�Smart�Grids�are�revealed�in�the�long-term�and�can�only�be�captured�when� the� whole� system� is� in� place.� However,� the�Smart� Grid� needs� to� be� built� brick� by� brick.� The�challenge� is� to� ensure� that� at� every� step� of� the�way� intermediate� benefits� or� the� clear� prospects�of� final�benefits�can�support� the�business�case� for�investments.
Key�elements�to�build�the�Smart�Grid�are:
System�integration�to�enhance�the�business�case�•�of� individual� Smart� Grid� technologies� and� to�fairly�share�costs�and�benefits�among�players.
Full� engagement� of� consumers� through� clear�•�tangible�benefits,�understanding�and�trust.
In� this� perspective,� using� data� from� collected�projects,�the�main�questions�we�want�to�address�in�this�chapter�are:
How� can� system� integration� create� business�•�value?�
What�is�in�it�for�consumers?•�
3.1 System integration – Smart Grid as a market platform�
ICT� integration� is� transforming� the� power� system�from�a�merely�physical�platform�for�one-way�trans-actions�of�electricity�supply� for�passive�consumers�into�a�market�platform�for�the�transactions�of�elec-tricity�supply�and�services�among�several�heteroge-neous�and�distributed�grid�users�(see�e.g.�[58]).�As�stated�in� [35],�“a Smart Grid is a rich transactional environment, a market platform, a network con-necting producers and consumers who contract and negotiate their mutual exchange of value (product, service) for value (payment). A Smart Grid is a trans-active grid”.�
This�concept�is�widely�represented�in�the�catalogue.�Several� projects� focus� on� the� set-up� of� market�platforms� for� the� transactions� of� a� wide� range� of�electricity� services:� ancillary� services,� Demand�Response,�aggregation�of�DERs�and�V2G6�services.�In�the�Web2energy project,�a�large�number�of�small�power�producers� (PV,�CHP,�wind�etc.),� storage�and�controllable�loads�(industry)�are�connected�through�Remote�Terminal�Units�with�a�Control�Center,�which�coordinates� the� exchange� of� power� and� energy�services� among� the� producers� and� consumers�(Virtual� power� plant)7.� The� platform� components�include� 11� MW� of� intermittent� power� (wind,� PV)�and� 300� MW� of� controllable� power� (controllable�loads,�CHP,�storage,�gas�turbine�etc.).�Through�the�installation� of� smart� meters,� domestic� consumers�are� also� connected� with� the� Control� Center� and�have�access�to�variable�tariffs�mainly�to�reduce�their�consumption�during�peak�hours.�Their�controllable�load�is�mainly�thermal�storage�heating.�
In�the�Lastbeg project,�a�platform�is�set�up�for�the�coordination�of�200MW�RES�(wind-based),�a�pumped�storage�power�plant� (PSPP)� facility� and�a�Demand�Response� aggregated� output� of� 5,000� customers�endowed�with�smart�meters.�The�interaction�among�the�platform�participants�enables�predictive�power�balancing� and� a�more� efficient� and� reliable� power�supply.
6� Vehicle-to-grid�(V2G)�describes�a�system�in�which�plug-in�electric�vehicles,�such�as�electric�cars�(BEVs)�and�plug-in�hybrids�(PHEVs),�communicate�with�the�power�grid�to�sell�demand�response�services�by�either�delivering�electricity�into�the�grid�or�by�throttling�their�charging�rate.
7� A�virtual�power�plant�is�a�cluster�of�distributed�generation�installations�(such�as�CHP,�wind�turbines,�small�hydro�etc.)�which�are�collectively�run�by�a�central�control�entity.

36
JRC Reference Report
Smart Grid projects in Europe: lessons learned and current developments
These�examples�suggest�how�the�set-up�of�market�platforms� for� the� transaction�of�electricity�services�can�create�systemic�benefits�from�the�interactions�of�different�grid�users.
The�set-up�of�such�platforms�requires�the�integration�into�a�coherent�system�of:
1.� a� physical� layer� (i.e.� optimal� and� secure�infrastructure� for� power/data� flows� among�producers�and�consumers);
2.� a� market� layer� (i.e.� efficient� mechanisms�for� coordinated� transactions� among� system�operators,�prosumers,�aggregators�etc.).
Most�of�the�scanned�projects,�in�one�way�or�another,�are� contributing� to� either� the� physical� or� market�layer�or�both.�
From�an�engineering�perspective,�scanned�projects�focus� on� digital� communication� and� control�capabilities� to� enable� a� two� way� power� and�information� flows� across� the�whole� grid.� The� goal�is� to�accommodate�a�whole�new�set�of�distributed�technological� applications,� optimize� overall� grid�management,� increase� reliability� and� self-healing�capabilities.
From� a� functional� perspective,� projects� focus� on�coordination�mechanisms�to�set�transactions�among�a�network�of�distributed�grid�users.�
Physical� layer� � System� operators� are� the� main�investors� in� the� set-up� of� the� physical� layer� of�the� Smart� Grid.� At� the� transmission� level,� since�building�or�upgrading�conventional�overhead�lines�to� increase� the� transmission� capacity� is� becoming�progressively�more�difficult,�alternative�technologies�are�either�being�deployed�or�are�under�development.�High�Voltage�Direct�Current�(HVDC)�systems,�already�mature�for�long�distance�and�undersea�transmission�(also� suitable� for� connecting� offshore�wind� farms)�may�contribute�to�regulate�the�current�flow�through�the� network.� Flexible� AC� Transmission� Systems�(FACTS),� gradually� more� deployed,� are� power�electronics-based� devices� aiming� to� increase� the�control� over� voltages� and� power� flows� in� the� grid�(see�e.g.�projects TWENTIES, ICOEUR, 220 kV SSSC device for power flow control).�
Advanced�network�sensing�and�control�capabilities�(e.g.�wide�area�monitoring�systems)�are�employed�to� improve� the� observability� of� the� transmission�grid,� increase� safety� margins� and� facilitates� the�safe� integration� of� renewables� (e.g.� projects� Cell Controller, PEGASE).�A� lot�of�work� is� also�devoted�to� improve� tools� to� analyze� expansion� options�and� to� assess� system� vulnerability� (e.g.� projects�ALMACENA, REALISEGRID).�At�the�distribution�level,�as�partly�shown�in�Chapter�2,�investments�presently�concentrate�on�smart�meters,�network�automation,�and� physical� integration� of� DERs� (including� EV�charging�infrastructure).
A� key� component� of� the� physical� layer� is� an� ICT�infrastructure�to�share�information,�price�and�control�signals� among� distributed� users� and� producers�(see� e.g.� projects� E-telligence, Web2Energy, Cell Controller, Virtual Power Plant).� The� set-up� of�an� ICT� infrastructure� is� a� precondition� to� create�a� distributed� collaborative� market,� and� allow� the�integration�of� new� technological� applications� (e.g.�EVs,� DER)� and� the� participation� of� new� energy�players� (aggregators,� prosumers,� RES� producers�etc.).� Energy�management� devices� (see� Box� 7)� for�consumers� (e.g.� Energy� boxes� -�ADDRESS� project,�Energiebutler�-�Model City Manheim project)�or�DER�management� systems� (Fenix� Box� –� Fenix� project,�DEMS� –� Virtual Power Plant� project)� and� smart�meters� represent� grid� users’� gateways� to� the� ICT�infrastructure.�
Market� layer� � With� the� physical� layer� in� place,�consumers,� producers� and� prosumers� are�interconnected�with�two�way�power�and�information�flows.� Transactions� of� a� wide� range� of� electricity�services�among�them�then�become�possible.
Electric� vehicles� are� used� as� storage� devices� to�provide� ancillary� services� in� presence� of� a� high�level� of� renewables� (Mini E Berlin project).� The�outputs� of� distributed� generators� are� monitored�and�coordinated�to�control�voltage�levels�in�specific��portions�of�the�grid�(ISOLVES, DG Demonet�projects)�or� aggregated� to� provide� the� required� amount� of�reactive�power�(Cell Controller�project).�

37
JRC Reference Report
The� concept� of� aggregation� is� central� in� this�context� (see�Box�8� for�more�details).� For�example,�on� behalf� of� consumers,� aggregators� can� buy� and�sell�load�flexibilities�on�the�electricity�markets�(see�e.g.� ADDRESS� project)� or� provide� V2G� services� to�optimize� EV� use� (see� e.g.� Charging infrastructure project).� Aggregated� demand� can� be� controlled� to�reduce�peaks,�to�help�DSOs�to�dispatch�the�system�or� to� reduce� risk� exposure� of� retailers� (ADDRESS�project).
Through� aggregation,� Distributed� Generators�can� provide� ancillary� services� and� contribute� to�dispatching�tasks�of�DSOs.�For�instance,�the�goal�of�the�E-telligence�project�is�to�use�the�reactive�power�of�CHP�to�actively�control�the�voltage�gradients�on�the�medium�voltage�lines.�The�EDISON�project�is�testing�an�EV�charging�system� that�optimizes�EV�charging�based�on�EV�and�grid�conditions.�The From wind to heat pumps�project�links�aggregation�of�DER�on�the�supply�and�on�the�demand�side�by�investigating�the�use�of�heat�pumps�as�heat�storage�devices�of�wind�power.�
Finally,� as� advanced� ICT� capabilities� make� it�possible� to� measure� electricity� attributes� (power�quality,� generation� source,� real-time� price� etc.)�and� consumers’� profiles,� energy� players� are� able�to� bundle� value-added� services� to� the� electricity�commodity�and�offer�tailored�products�to�consumers�according� to� specific� preferences� and� to� real-time�grid� conditions.� For� example,� the� Smart Watts�project� aims� at� implementing� solutions� to� inform�customers�about�where�and�how�the�electricity�was�produced,� how� it� was� transported� and� how�much�the� power� currently� costs.� The� Smart Charging�project� is� setting� up� a� charging� infrastructure� for�electric� vehicles� that� explicitly� introduces� the�concept� of� mobility� service� for� EVs.� The� charging�costs�of�EVs�can�be�measured�in�terms�of�Kilometres�rather�than�kWhs.�The�association�of�business�value�to� electricity� services� rather� than� kWhs� makes� it�possible� to� include�efficiency�and�sustainability�as�part�of�the�electricity�service�(see�e.g.�[29]).
BOX 7. Energy Management Devices
An� energy� management� device� is� the� ‘consumer’s�interface� with� the� external� world.� It� can� be� the�hub� for� smart� home� energy� services� and� can� be�used� to� automatically� reshape� the� energy� profile�of� the� house� by� reacting� to� aggregators’� signals.�It� connects� consumers� with� aggregators� and�automatically� controls� electric� appliances� (loads)�in� response� to� price� signals,� requests� from� the�aggregator� and� consumers’� energy� preferences.�(e.g.�the�“Energy�Butler”�in�the�Model city Mannheim�project).� It� facilitates� customers’� individual� energy�management� as� well� as� the� implementation� of�dynamic� pricing� and� active� demand� mechanisms.�For� example,� customers� will� have� the� option� of�switching� electric� power� consumption� to� off-peak� times� or� switching� appliances� off� when� the�electricity�does�not�come�from�a�renewable�source.��The� MeRegio� project� provides� another� example�where� household� appliances� are� interlinked� via�communication�devices�and�connected�to�an�energy�management� system.� The� electric� vehicle� battery�is� automatically� charged� whenever� the� mini-CHP�installed� in� households� generates� more� electric�power�than�the�grid�requires.�Vice�versa,�electricity�from�the�battery�can�be�fed�into�the�grid�whenever�the�need�arises.

38
JRC Reference Report
Smart Grid projects in Europe: lessons learned and current developments
3.1.1 Business models for a transactive grid
With�the�physical�and�market�layers�in�place,�systemic�benefits�arise� from�the�collective�participation�and�interaction�of�the�different�grid�users.�In�a�Demand�Response� application,� for� example,� aggregators�mediate� interactions� among� different� grid� users,�like�collecting�demand�flexibilities�from�consumers�and� selling� them� to� retailers� and�DSOs.� The�more�members� of� one� party� join� the� platform� (e.g.�consumers),�the�more�members�of�the�other�parties�have�an�incentive�to�join�(e.g.�retailers,�DSOs,�Smart�Appliance�manufacturers).�
In� related� literature,� these� market� structures� are�called� multi-sided� platforms� (MSP).� According� to�[26],� “A Multi-Sided platform provides goods or services to two or more distinct groups of customers who need each other in some way and who rely on the platform to intermediate transactions between them”.�Business�models�based�on�MSPs�have�gained�prominent�economic�importance�with�the�advent�of�Internet� because� they� represent� an� efficient� way�of� creating� business� value� out� of� the� interactions�among�different�consumer�groups�([58]).
The� costs� of� establishing� market� platforms� for�transaction�of�electricity�services�(by�setting�up�its�physical� and�market� layers)� require� facing�upfront�costs� and� investment� risks� before� the� platform�can�pay�back.�However,�once�in�place,�the�platform�can� provide� systemic� benefits� to� its� participants�and� provide� a� business� case� for� investments� to�players� that�may�not�enter� the�market� individually�(aggregators,� prosumers,� EV� producers� etc.).� In�the� context� of� Smart� Grids,� the� costs� of� building�the� physical� layer� of� the� platform� are� typically�incurred� by� DSOs,� whereas� a� key� role� in� the� set-up�of�the�market�layer�of�the�platform�is�played�by�aggregators.�
Under�current�regulation,�DSOs�might�not�have�the�business� case� to� sustain� the� investments� to� build�the� physical� layer,� as� potential� indirect� systemic�benefits� (e.g.� peak� load� shaving� and� deferred�investments� due� to� Demand� Response)� cannot�be� factored� in� to� receive� regulatory� support.� Also,�as� several� players� share� the� final� benefits� of� the�complete�market�platform,� it� is� necessary� to� fairly�share� costs� and� benefits� and� avoid� free-rider�effects.
Presently�the�electricity�system�is�mainly�based�on�the�exchange�of�electricity� commodity�and�current�regulation� recognizes� rates�of� return�based�on� the�quantity�of�electricity�delivered.�Regulation�should�encourage� DSOs� to� contribute� to� the� set-up� of�market�platforms� for� the� transactions�of�electricity�services�by� stimulating� innovation�and� specifically�rewarding�the�provision�of�services.�
3.1.2 Case studies
In� this� section� we� present� two� case� studies� from�our�catalogue�to�illustrate�the�process�of�setting�up�platforms� for� the� transaction�of�electricity�services�and� to� discuss� concretely� the� integration� of� the�physical�and�market�layers.�Each�case�study�results�from� linking� together� different� projects� from� the�catalogue.�We�will�use�these�case�studies�to�discuss�three�key�points�highlighted�in�this�chapter:�the�set-up�of�a�market�platform�for�Demand�Response�(case�study�1)�and�for�DER�aggregation�(case�study�2).
Case study 1 - From smart metering to Demand Response
In�case�study�1,�we�analyze�through�a�set�of�projects�(see�table�II),�the�path�envisioned�by�Enel�(leading�Italian� DSO)� to� move� from� the� roll-out� of� smart�meters�to�the�set-up�of�a�Demand�Response�market�platform�(see�Box�9).�
1.� With�the Telegestore�project�(2001-2006),�Enel�has�performed�the�roll-out�of�32�million�smart�meters� in� Italy.�With� the StAMI project� (2010-2011)� Enel� has� developed� a� dedicated� web�interface� to� collect,�on�demand�and� real-time,�accurate� data� stored� in� smart�meters� for� grid�optimisation.
2.� The�smart�meter�deployment�(total�budget�€2.1�billion)� has� been� financed� through� tariffs� and�resulted� in� reduced� operational� expenditures�of� €500�million� a� year.� The� business� case� for�investments� focused� on� concrete� benefits� on�the�utility�side,�which�should�then�trickle�down�to� consumers� through� reduced� tariffs.� The�new�applications�a�smart�meter�would�enable�(e.g.� Demand� Response)� and� the� consequent�benefits�for�consumers�have�not�been�factored�in�to�justify�the�investment.

39
JRC Reference Report
3.� With� smart� meters� in� place,� in� 2008� Enel�launched� a� 1,000� households� trial� of� an� in-home� display� (Smart� Info)� connected� to� the�smart�meter,�to�show�consumption�and�prices.�In-home� displays� encouraged� 57%� of� the�involved�consumers�to�change�their�behaviour.�At� this�stage,� the�physical� layer� is� completed,�but�the�inclusion�of�consumers�is�rather�limited.�Promising�initial�benefits�for�consumers�refer�to�the� growing� number� of� consumers� switching�energy�retailer�every�year�and�the�possibility�for�consumers�to�opt�for�dynamic�tariffs�(in�2008,�6�million�customers�were�in�the�free�market;�2�million�consumers�switch�energy�retailer�every�year)
4.� With� the� Energy@Home� project� (2009-2011),�Enel�aims�at�testing�the�link�between�the�physical�and�the�market�layer.�The�goal�of�the�Energy@Home�project�is�to�demonstrate�the�integration�of�the�Smart�Meter/Smart�Info�with�the�Energy�Management� device� (e.g.� Energy� Box,� Energy�Butler� etc.)� which� performs� automatic� energy�management� in�the�household�and�represents�the�consumer’s�gateway� toward� the�electricity�market.�
5.� The�ADDRESS�project�(2008-2012)�goes�a�step�further�and� focuses�on�the�establishment�of�a�market�layer�for�Demand�Response.�It�assumes�the� presence� of� a� smart� meter� (for� billing�purposes)�and�of�an�Energy�Management�Device�(Energy� Box)� to� act� as� a� consumer� interface�for� the� aggregator.� The� Demand� Response�platform� analyzed� in� the ADDRESS� project� is�a�MSP� (led� by� an� aggregator)�where� platform�participants�can�interact�with�each�other�to�buy�and�sell� load�flexibility.�The�profitability�of�the�platform�is�linked�to�the�number�of�participating�consumers.�One�of�the�project’s�focus�is�in�fact�the�engagement�of�consumers.
6.�When�the�platform�(composed�of�a�physical�and�of�a�market�layer)�is�in�place,�new�benefits�can�be� shared� among� participants.� The� DSO� can�benefit�from�demand-side�management�(even�if�these�benefits� could�not�be� considered� in� the�smart�metering�business�case).�It�can�possibly�shave�peaks,�postpone�network�reinforcements,�and� have� more� options� for� ancillary� services.�Aggregators� can� make� profits� by� offering�electricity� services.� By� participating� in� the�electricity� market,� consumers� can� sell� load�flexibilities,�optimize�consumption�and�have�a�better�business�case�for�purchasing�DERs�(e.g.�EVs,�heat�pumps,�smart�appliances).
Project Name
Leading Organisation
Budget (€ million)
Stage
DeploymentTelegestore
StAMI
Energy@Home
ADDRESS
Deployment
R&D
R&D
Location Dates Description
Roll-out�of�32�million�smart�meters.�Focus�on�the�physical�layer
2001-2006
2100Enel IT
Use�of�smart�metering�data�for�grid�optimisation.�Focus�on�the�
physical�layer
2010-2011
2,1Enel IT
Interface�between�smart�meter�and�home�energy�management�device�for�the�provision�of�value�added�services.�Focus�on�the�link�between�the�physical�and�
market�layers
2009-2011
n/aEnel IT
Market�structure�to�aggregate�and�integrate�Demand�Response.�
Focus�on�the�market�layer
2008-2012
4.27Enel IT
Table II Selected Projects Case Study 1

40
JRC Reference Report
Smart Grid projects in Europe: lessons learned and current developments
BOX 8. AGGREGATION
An� aggregator� can� be� defined� as� an� entity,� which�groups� individual� load� or� generation� profiles� of�consumers,� producer� and/or� those� that� do� both�(prosumers)� and� introduces� them� to� the� electric�system�a�single,�large(r)�power�unit.�The�single,�large�power�unit�does�not�really�exist;�rather�its�existence�is�virtual,�enabled�by�a�software�used�to�manage�the�various�flows.
Aggregators� act� as� mediators� between� small�producers�and/or�consumers�and�the�markets�(refer�e.g.� to ADDRESS� project).� The� primary� role� of� an�aggregator� is� to� provide� energy-related� support�services� to� key� participants� of� the� power� system�(consumers,�producers,�system�operators,�electricity�traders,� etc)� by� managing� a� diversified� portfolio�of� (dispersed)� power� flows,� thereby� fostering� the�implementation�of�concepts�of�the�smart�electricity�system.��
The� goal� of� the� ADDRESS� project,� for� example,�is� to� enable� active� participation� of� small� and�commercial�consumers�in�market-related�activities,�i.e.�provision�of�services�to�the�different�players�of�the�power�system.�This�is�achieved�by�aggregating�consumers’� reduced� load� into� larger� amounts� for�participation�in�market�sales�(e.g.�to�sell�to�network�companies,� balancing� responsible� parties,� owners�of�non-controllable�generation,�etc.).�The�aggregator�uses� consumers’� ‘demand� modifications’,� i.e.� the�deviation�from�the�anticipated�load�size�rather�than�a�specific�level�of�demand�to�form�the�active�demand�it�sells.

41
JRC Reference Report
BOX 9. CASE STUDy 1 - LESSONS LEARNED
Systemic� benefits� -� The� business� case� of� a� single�technology� plugged� in� the� existing� system� is�conservative;� it� does� not� include� the� future�applications� and� functionalities� that� the� new�technology�enables.�Smart�Metering�might�represent�a�positive�exception,�but�it�is�true�that�the�business�case�for�Smart�Grid�investments�can�be�difficult�and�unclear� because� potential� long-term� benefits� are�systemic,� i.e.� can� be� obtained� only� if� a� system� is�built�around�the�single�new�component.�
Fair� sharing� between� short� term� investment� and�long�term�benefits�
Network�owners/operators�are�supposed�to�sustain�the� main� investments� for� a� demand� response�platform� (establishment� of� the� physical� layer�through� an� Advanced� Metering� Infrastructure� to�make� billing� data� available� to� all� participants),�whereas� all� players� can� get� benefits� out� of� it.�Smart� metering� projects� are� at� the� deployment�stage� as� Enel� managed� to� recover� investments�independently� from� the� setup� of� a� demand�response�platform.� Instead,� the�business�case� to�move�the�other�projects�(still�at�the�demonstration�or�R&D�stage)� to� the�deployment�phase�depends�on� the�systemic�benefits�deriving� from�the�setup�of�the�Demand�Response�platform.�
To� unlock� further� investments� there� is� a� need� to�balance� short-term� investment� costs� and� long-term� benefits.� Unless� a� fair� cost� sharing�model� is�developed,� the� willingness� of� grid� operators� to�undertake� any� substantial� investment� might� be�limited.�
Multidisciplinary�consortia� �Diverse�companies�are�brought� together� in� multi-disciplinary� consortia�to� undertake� Smart� Grid� projects� (R&D� and�demonstrations� mainly).� In� the� Energy@Home project,� Enel� has� teamed� up� with� an� appliance�manufacturer� and� a� Telecom� company.� In� the�ADDRESS project,�Enel�has�teamed�up�with�several�other� DSOs,� energy� retailers,� manufacturers� and�research�centres.
Consumers� -� Consumers� can� get� most� of� tangible�benefits� when� the� whole� system� is� in� place,� i.e.�when� both� the� physical� and� market� layers� are�established.�
The� profitability� of� Demand� Response� platforms�depends�on�the�number�of�participating�consumers.�A� lack� of� transparency� on� privacy� issues� or�excessive�use�complexity�might�severely�hinder�the�participation� of� consumers� and� consequently� the�profitability�of�the�Demand�Response�platform.�
Topology� constraints� The� topological� relations�between�the�physical�and�service� layer�need�to�be�taken�into�account�to�ensure�its�proper�functioning.�Clear� coordination� mechanisms� and� protocols�among�the�owner�of�the�physical�and�of�the�service�platforms�(typically�DSOs�and�aggregators)�need�to�be� in�place� to�map�geographical� areas� to�network�users�and�to�ensure�the�compatibility�of�transacted�services� with� physical� constraints.� Any� necessary�information� about� geographical� characteristics� of�platforms� should� also� be� readily� available� to� all�relevant�platform�participants.�(ADDRESS�project).

42
JRC Reference Report
Smart Grid projects in Europe: lessons learned and current developments
Case study 2 - Setting up a platform for aggregation of Distributed Energy Resources
In�case�study�2,�we�analyze�through�another�set�of�projects� (see� table� III),� the�different� steps�needed�to�set-up�a�market�platform� for� the�aggregation�of�DERs.� On� the� basis� of� project� data,� we� will� then�derive�some�lessons�learned�on�the�concrete�steps�and�the�key�challenges�to�achieve�this�objective�(see�Box�10).�
Table III Selected Projects Case Study 2
1.� Setting� up� the� physical� layer� -� The� set-up� of�the� physical� layer� for� a� market� platform� for�DER� starts� with� the� deployment� of� advanced�grid�monitoring�and�control�capabilities.�In�this�area,�the�primary�goal�is�to�grant�safe�access�to�DERs�especially�on�the�supply�side�(distributed�generators).�The�benefits�for�utilities�range�from�operational� improvements� to� reduced� number�of�outages�and�voltage�oscillations.�
� An�essential�component�of�the�physical�layer�is�then�the�ICT� infrastructure�to�aggregate�DERs.�By� interlinking�DERs� via� ICT,� the�market� layer�can�be�set�up�and�new�benefits�achieved.�Once�the�physical�layer�is�completed,�the�market�layer�can�be�established�through�market�mechanisms�for�the�aggregation�of�DERs.�
2.� Setting�up�the�market�layer�-�First�of�all,�DERs�can� be� coordinated� by� a� DSO� for� system�management� services� (voltage� control,�balancing).�The�aggregation�of�DERs�for�system�management� purposes� is� called� technical�virtual� power� plant� (FENIX project).� Technical�virtual�power�plant�aggregates�resources�from�the�same�geographical�area.
� Secondly� DERs� can� be� coordinated� by� an�aggregator�and�reach�a�size�that�is�sufficient�to�enter�energy�power�markets�and�have�positive�economic� margins.� Commercial� virtual� power�plants�aggregate�DERs�that�are�not�necessarily�from�the�same�geographical�area.�
Project Name
Leading Organisation
Budget (€ million)
Stage
Demo
Demo
Demo
Cell�Controller
Virtual�Power�Plant
EcoGrid�EU
Dates Description
Control�architecture�for�the�central�coordination�of�DERs
Demonstration�of�the�technical�and�economical�feasibility�of�the�VPP�concept�(aggregation�of�CHP,�
Biomass�or�Windturbines).
Set-up�of�a�complete�platform�for�the�transactions�of�electricity�
services�through�DERs
2004-2011
2008-2010
2011-2014
13.4
0.8
8.3
Energinet
RWE
Energinet
Location
DK
DE
DK

43
JRC Reference Report
� Technical� Virtual� power� plant� In� the� Cell Controller�Project�an� ICT� infrastructure�and�an�innovative� control� scheme� demonstrates� the�coordination� of� a� high� number� of� distributed�energy� resources,� particularly� CHPs� and� wind�turbines.�Each�unit�is�endowed�with�an�industry�central� processing� unit� (CPU),� a� remote�terminal�unit�(RTU)�or�a�smart�meter.�Important�applications�are�achieved�through�coordination�of� individual�units:� islanding�operation,�black-starting,�voltage�control,�reactive�power�control.�DSOs� are� in� charge� of� technical� virtual� power�plants�and�assume�a�dispatching�role�similar�to�the�role�of�TSOs�at�the�transmission�level.�The�rationale�for�investments�include�the�following�benefits:� solving� voltage� band� violations,�reduced�grid�expansion�costs,�reduced�outage�times� through� self-healing� capabilities,� asset�optimisation�and�improved�efficiency,�improved�planning.�Typically,� the�benefits�are�mainly�on�the�utility�side.
� Commercial� Virtual� power� plant� In� the�Virtual Power Plant� project� led� by� RWE� (DE),�distributed�generators�(CHP,�biomass�and�wind)�are�interlinked�via�ICT�to�form�a�VPP.�All�the�DGs�are�endowed�with�a�DER� controller� connected�with�a�distributed�energy�management�system�(DEMS).� The� DEMS� collects� information� from�DERs�and�enables�a�demand-driven�production�planning�of� individual�DGs.�RWE�has�currently�about� 10MW� integrated� into� its� first� Virtual�Power� Plant� (VPP).� Through� VPP,� small�producers� can� offset� the� communication� and�the� transaction� costs� for� their� participation� in�the�market�(according�to�the�EU-DEEP�project,�participation� to�VPPs� is� economically� efficient�for�generation�units�with�a�minimum�capacity�of�500�kW).Using�DEMS,�DERs�are�able�to�predict�more�precisely�energy�availability�and�demand�and� reduce� stand-by-costs� and� penalties� for�incorrect�forecasts.
3.� Integration� of� DER� on� the� demand� side� –� By�building� on� the� physical� architecture� of� the�Cell�Controller�project,�the ECO-Grid EU�project�(Bornholm,�Denmark)�goes�a� step� further�and�includes� market� mechanisms� for� aggregation�not�only�on�the�supply�but�also�on�the�demand�side.�The�project�is�testing�a�complete�integrated�market�platform�for�the�exchange�of�electricity�services�through�aggregation�of�DERs,�with�no�restriction�on�power�size.�The�project�develops�a�real-time�distributed�market�(5�minutes�update�of� price� signals)� which� includes� distributed�generators,� heat� pumps� and� EVs,�with� a� total�penetration�of�more�than�50%�of�the�electricity�consumption.�2,000�residential�consumers�are�able�to�benefit�from�the�participation�in�Demand�Response�market.�The�diffusion�of�demand�side�management�strengthens�the�business�case�for�the� purchase� of� EVs� and� heat� pumps.� On� the�same�distribution�network,�multiple�aggregated�portfolios�of�DERs�participate�in�the�market.�By�setting�up�a�complete�market�platform,�the�ECO-Grid�EU�project�aims�at�complementing�several�other� projects� in� Bornholm� (roll-out� of� PVs,�heat�pumps,�EV�charging�infrastructures,�smart�appliances)�and�enhancing�the�benefits�of�each�of� these� projects.� Systemic� benefits� include:�small� consumers� able� to� access� balancing�market,� improvement� of� production� forecasts,�minimisation�of� balancing� costs,� and� targeted�roll-out�of�Smart�Grid�solutions.�

44
JRC Reference Report
Smart Grid projects in Europe: lessons learned and current developments
BOX 10. CASE STUDy 2 - LESSONS LEARNED
Steps�for�the�set-up�of�a�market�platform�for�the�•�aggregation�of�DERs:���1.���Physical�layer:��
a)�Advanced�grid�monitoring�and�control�capabilities�
b)�ICT�infrastructure�to�interlink�DERs�
2.���Market�Layer
a)�Aggregation�of�DERs�on�the�supply�side�(distributed�generators):��technical/commercial�VPP�
b)�Aggregation�of�DERs�on�the�demand�side�also�(e.g.�heat�pumps�and�EVs)
A� new� real-time� market� for� electricity� services�•�through� aggregation� of� DERs� is� based� on�a� open,� reliable� and� secure� ICT� platform� to�transmit�information�and�price�signals�to�market�participants�and�operational�units.�
Once� the� physical� layer� is� completed� and� the�•�technical� integration� of� DERs� in� the� grid� is� in�place,� the� market� layer� can� be� established�through�market�mechanisms�for�the�aggregation�of� DERs.� Projects� look� into� the� range� of� new�services� that� can� be� provided� through� the�physical�infrastructure.�New�business�models�are�needed� to� maximize� the� business� value� of� the�market�platform�for�several�players.
In�some�areas,�integration�of�DER�on�the�supply�•�side� (especially� distributed� generators)� has�already�reached�commercial�maturity�(according�to� the�EU-DEEP�project,�participation� to�VPPs� is�economically� efficient� for� generation� units� with�a�minimum�capacity�of�500�kW).�The�integration�of� DER� on� the� demand� side� (e.g.� heat� pumps,�EVs)� is� the� natural� complement,� but� more�demonstrations�are�needed.
An�emerging�trend�is�that�DSOs�will�increasingly�•�perform� dispatching� of� distributed� resources,�will� rely� on� voltage� control� through� distributed�generators� and� will� coordinate� more� tightly�with� TSOs.� IT� infrastructure� of� the� distribution�operators�will�need�to�be�tightly�connected�with�that�of�the�transmission�operator.
3.2 What is in it for consumers?
For� Smart� Grids� to� be� economically� and� socially�sustainable,� consumers� need� to� be� engaged�through� understanding,� trust� and� clear� tangible�benefits.� Customers� will� need� to� recognize� the�value�that�these�technologies�can�provide�and�be�willing� to�make�behavioural� changes�and�pay� for�the�products�and�services�on�offer�[62].�
Benefits for Consumers
A� scan� of� collected�projects� highlights� that,�with�the� Smart� Grid� in� place,� potential� benefits� for�consumers� are� numerous:� reduction� of� outages,�more�transparent�and�frequent�billing�information,�participation� in� the� electricity� market� via�aggregators,� energy� savings� (see�more�details� in�Box�11).�
On�the�consumption�side,�consumers�could�reduce�their�energy�use�or� shift� it�over� time� in� response�to� electricity� prices.� They� could� choose� among�a� wider� range� of� providers� (energy� retailers,�aggregators� etc.)� and� power� options� (e.g.� green�electricity� and� power� quality� premiums).� On� the�production� side,� the� Smart� Grid� can� increase�consumers’� opportunities� in� the� electricity�market� by� supporting� the� connection� and� use� of�distributed�generation�(e.g.�PV)�and�energy�storage�(e.g.�EV).�New�players�(e.g.�aggregators)�and�new�devices�(e.g.�home�energy�controllers)�can�provide�consumers�with�opportunities�and�means�to�take�advantage�of�these�options.�However,�as�stressed�before,�most�of� these�benefits� for�consumers�are�systemic� in� nature;� to� be� captured,� the� whole�system�(consisting�of�physical�and�market�layers)�needs�to�be�in�place.
Also,�it�is�worth�remarking�that�not�all�consumers�will� benefit� to� the� same� extent� from� Smart� Grid�applications.�For�example,�not�all� consumers�will�be� able� to� shift� consumption� according� to� price�signals�and�benefit�from�Demand�Response.�In�this�context,� transparency� over� the� different� options�and� benefits� available� to� different� consumers� is�necessary.

45
JRC Reference Report
BOX 11. Benefits for consumers – Some examples from collected projects
The�deployment�of�32�million�smart�meters�in�•�Italy�provides�a�first�example�of�the�potential�outcomes� of� a� national� roll-out.� The� large�market�test�carried�out�at�the�beginning�of�2008�shows� that� the�deployment�of�smart�meters� and� home� displays� encouraged�57%� of� the� involved� customers� to� change�their�behaviours�(29.3%�delayed�the�use�of�domestic�appliances�to�the�evening;�11.9%�avoided� the� simultaneous� use� of� different�appliances;� 7.5%� switched� off� appliances�instead� of� leaving� them� in� standby;� 6.6%�used�less�the�white-goods)�(Telegestore);
In� the�•� Storstad Smart Metering� project� in�Sweden,�the�deployment�of�about�370,000�smart� meters� contributed� to� a� significant�change� in� customer� interest� in� their�electricity�consumption.�Customer�contacts�regarding� meter� readings� or� estimated�reads� has� decreased� significantly� (approx�60%)� and� was� replaced� by� contacts� more�related� to� energy� consumption� or� energy�usage;
The� introduction� of� hourly� energy� price�•�can� encourage� consumers� to� react� by�modifying� their� loads� in� order� to� reduce�their� bills� (deferring� or� decreasing� their�consumption).� The� forecasts� developed�by� the� GAD� project� show� that� a� usual�consumer�could�save�15%�of�his�total�energy�consumption;
The� introduction� of� time-based� rates� is�•�expected�to�reduce�energy�consumption�by�5-10%�and�shift�1%�of�the�energy�demand�to�low�peak� load� times� (Telegestore�project).�Other� projects� under� preparation� expect�higher�benefits�for�consumers;
The�development�of�enabling�structures�and�•�technologies,� such� as� smart� meters,� can�foster� the� emergence�of� new�partnerships�where�the�customer�may�at�times�turn�into�a�supplier.�The�business�models�tested�in�the�framework�of� the�EU Deep�project�showed�that� it� is� possible,� under� specific� market�conditions,� to� run� aggregation� businesses�that�can�spare�up� to�3%�of� today’s�annual�electricity�bill�(EU Deep project);
With�the�roll-out�of�smart�meters,�the�time�•�to� correct� the� billing� and� settlement� was�shortened� from� 13� months� to� 2� months.�Lead� time� for� exporting�meter� readings� to�suppliers�was�shortened�from�30�days�to�5�days�(Project AMR).
Consumers�and�electricity�market�platforms
The� emergence� of� two� classes� of� small�•�consumers—active� and� non-active—� and�the� increasing� importance� of� aggregators,�may�lead�to�unexpected�cross-subsidies;�as�aggregators� potentially� hurt� the� business�of� retailers,� retailers� might� try� to� recoup�losses� through�higher� rates� for� non-active�consumers�(ADDRESS�project).
Profitability� of� market� platforms� depends�•�on� consumer� engagement.� The� more�consumers� join,� the� higher� the� business�value� of� the� platform.� It� is� imperative� to�ensure� tangible�benefits,�privacy�and�easy�access� for� consumers;� and� to� grant� open�access�and�fair�competition�among�energy�players.
Project� results� confirm� that� energy�•�management�devices�and�aggregators� can�provide�consumers�with�more�effective�and�compelling�incentives�to�take�advantage�of�efficiency,� conservation� and� sustainability�opportunities� offered� by� new� Smart� Grid�technologies.

46
JRC Reference Report
Smart Grid projects in Europe: lessons learned and current developments
Consumers’ Behaviour and Needs
It� is� necessary� to� offer� clear� tangible� benefits� to�engage� consumers.� However,� the� whole� system�needs�to�be�in�place�to�deliver�most�of�the�benefits,�and� to� this� end,� full� consumer� participation� is�necessary.
To�solve�this�deadlock,�the�starting�point�is�to�make�sure�that�consumers�have�trust�and�understanding�in� the� whole� Smart� Grid� development.� It� is�necessary� to� involve� consumers� early� on� in� trials�and� demonstrations,� to� target� early� adopters�before�moving�to�full-scale�deployment,�and�to�give�consumers� the� freedom� to� choose� their� level� of�involvement.�Special�attention�needs�to�be�devoted�to�the�needs�of�vulnerable�consumers.�An�effective�set�of�marketing�and�outreach�activities�is�integral�to� the� success� of� consumer-centric� projects� to�counter�negative�consumer�perceptions�and�to�build�trust�and�understanding�between�the�consumer,�the�utility/consortia�and�smart�technologies�[36,�63].
Some� projects� in� the� catalogue� are� going� in� this�direction.� The� participation� in� Demand� Response�actions� in� Model City Manheim’s� field� test,� for�instance,� is� on� a� completely� voluntary� basis.�Participants� have� the� freedom� to� choose�whether�or�not�to�react�to�the�information�displayed�by�the�energy�box�installed�in�their�homes,�e.g.�displaying�varying� electricity� prices.� Furthermore,� if� they�choose� to� respond� to�dynamic�pricing,� there� is�no�financial�risk�for�customers�as�they�are�guaranteed�not� to� pay�more� than� they� would� have� under� the�old�pricing�scheme.�This�help�to�mitigate�consumer�fears�and�encourages�participation.
According� to� a� questionnaire� distributed� to� about�2,000� customers� within� the GAD� project,� 62%� of�consumers� would� modify� their� behaviour� if� they�were�notified�when�the�current�energy�production�came�from�renewable�energies.�More�than�55%�of�the�consumers�would�also�modify�their�habits�if�the�energy� price� varied� during� different� hours� of� the�day.� Another� survey� conducted� at� the� end� of� the�GAD� project� among� 300� advanced� users� revealed�that�65%�would�use�the�system�in�the�short�term�if�the�cost�did�not�exceed�€500.�
In� the� Inovgrid� project� the� installation� of� energy�boxes� led� to� an� increase� of� efficiency� levels� in�customers’� energy� consumption� by� about� 20%�as� a� result� of� increased� awareness� of� power�consumption.�
Consumer Segmentation
Up� to� now,� energy� players� have� made� little�distinction� among� small� consumers.� With� few�exceptions,� prices,� services� and� communication�have�been�the�same.�
Through� energy� management� devices� and� smart�meters,�with�consumer’s� consent,� it� is�possible� to�segment�consumers�and�target�different�consumers�in�different�ways.�The�Inovgrid�project,�for�example,�segments�consumers�according�to�consumption�of�electricity� in� view� of� offering� tailored� tariffs� and/or� conservation� advice� to� increase� customers’�efficiency.� Consumer� segmentation� is� useful� to�contribute�to�an�open�and�competitive�retail�market,�as�it�implies�(1)�more�tailored�electricity�services�to�meet�consumers’�needs�with�possibly�a�higher�rate�of�acceptance�of�new�products�and�services�and�(2)�the�possibility�to�target�energy-savvy�and�wealthy�consumers�as�early�adopters�of�new�technologies.�At� this� stage,� in� several� projects� consumers� are�recruited� based� on� their� technical� interest� and�are� therefore� not� representative� of� the� entire�population.�They�can�be�targeted�as�early�adopters�rather� than� a� reliable� test� group� before� full-scale�deployment.�
Segmentation� of� consumers� is� also� necessary� to�understand� the� consumer� interactions� and� age�dependent� behaviours.� In� some� projects,� the� use�of�social�media�has�proven�successful�in�increasing�interaction� between� the� utility� and� consumers.� In�the� pilot� project� Märkisches Viertel,� customers�can� access� historical� and� real-time� consumption�data� on� their� electricity� consumption� via� meter�display,�TV,� smart�phone/tab�devices�or�an�online�portal.�About�14%�of�customers�in�the�project�chose�the� in-house� (TV� or� smart� phone/tab� devices)� or�online�visualisation�of�data.�Similarly,� the BeWare�project�enables�its�customers�to�access�information�on� the� energy� consumption� of� their� appliances� in�an� engaging� user� interface� as� a� web� application�running�on�smart�phone.�This�allows�users�to�track�their� consumption� habits� and� how� much� energy�they�are�saving�for�individual�appliances�as�well�as�the�entire�household.�
However,� the� effectiveness� of� these� tools� can�significantly� depend� on� the� age� of� consumers.�According�to�[57],�over�55�year-old�people�consider�their�governments�a�trusted�information�source�on�energy�matters,�while� 18-24� year-old� see� internet�collaborative� platforms� and� social� networking� as�important�sources.�

47
JRC Reference Report
This� generational� gap� should� also� be� taken� into�account� to� protect� vulnerable� consumers.� For�instance,�using�prices�to�control�demand�might�be�especially� hard� on� less� technically� savvy� people,�like�the�elderly.�The�impact�of�higher�energy�prices�is�often�overlooked�in�relation�to�the�most�vulnerable�members�of�society.
Free Rider Effects
Finally,� possible� free� rider� effects� should� be� dealt�with,� in� order� to� guarantee� a� sense� of� fairness�in� consumers.� For� example,� dynamic� pricing� and�Demand�Response� can� lead� to�peak� load� shaving.�The�consequent� reduction�of�peak�electricity�costs�are� spread� across� all� consumers,� including� those�who� did� not� shift� their� consumptions.� Also,� the�emergence� of� two� classes� of� small� consumers—active� and� non-active—� and� the� increasing�importance�of�aggregators,�may�lead�to�unexpected�cross-subsidies;� as� aggregators� potentially� hurt�the� business� of� retailers,� retailers� might� try� to�recoup� losses� through� higher� rates� for� non-active�consumers�(ADDRESS�project);
Social impact
A� scan� of� collected� projects� seems� to� suggest� a�lack�of�specific�attention�to�the�social�implications�of� Smart� Grids.� Only� one� project� (Distribution Automation project)� clearly� mentions� among� its�goals� the� need� to� “anticipate� the� shortages� of�technical� workforce� due� to� the� ‘field� workforce�ageing”.�
However,� a� literature� review� of� available� public�reports� and� scientific� publications� on� the� future�Smart�Grids�have�highlighted�other�social�aspects�of�Smart�Grids�that�should�be�taken�into�consideration�for�the�future�Smart�Grids�to�be�successful.�These�are�detailed�in�Box�12.�
BOX 12. Social impact of Smart Grid implementation
Jobs.�•� In�USA�280,000�new�direct�jobs�(2009-2012)�and�more�than�140,000�new�indirect�jobs�will�per-sist�beyond�Smart�Grid�deployment�[34];�job�cre-ation�will�provide�an�annual�benefit�of�$215�mil-lion�[41];� in�the�US�electricity�sector�a�major�job�market�for�early-career�engineers�is�shaping�up:�the� power� industry� needs� to� hire� thousands� of�new�engineers�by�2030”�[54].�At�the�same�time,�in� EU15� almost� 250,000� jobs� were� lost� in� the�electricity�sector�since�1995�[25].�Mergers�and�ac-quisitions�will�also�play�a�part�in�employment�de-cline�with�large�scale�operations�rendering�many�employees�redundant�[25].
�•� Ageing�work�force�–�gap�in�skills�and�personnel.�“Greying�workforce”:�in�the�next�five�to�10�years�many�utilities�will�lose�their�current�workforce�to�retirement�[63];�nearly�25�to�35%�of�utility�techni-cal�workforce�will�retire�within�5�years�[4];�in�the�USA�the�average�utility�worker�is�48�year�old,�five�years�older�than�the�median�age�for�US�workers;�the� power� industry� needs� to� hire� thousands� of�new�engineers�by�2030�[54];� ‘field�force�ageing,�i.e.� shortages� of� qualified� technical� personnel�(refer�to�e.g.�Distribution Automation�project).�
New�skill�requirements�–�training.•� ��New�job�pro-files:� high� level� of� flexibility,� adaptability,� cus-tomer-focused�approach,�sales�skills,�regulatory�expertise.� Need� for� investment� in� the� develop-ment� of� relevant� undergraduate,� postgraduate�and� vocational� training� to� ensure� the� building�of�a�sufficient�pipeline�of�next�generation,�Smart�Grid� savvy� electrical� engineers� [62].� Adequate�training,� re-skilling,�up-skilling�of� the�workforce�is�essential.�
New�pools�of�skills�and�knowledge.�•� China�is�the�largest�producer�of�engineering�graduates�in�the�world:� 600,000� engineering� graduates� in� 2009.�India:� 500,000� engineering� graduates� a� year.��United� States:� 70,000� engineering� graduates�every� year.� All� of� Europe:� 100,000� engineering�graduates�[63].�There�is�the�need�for�Smart�Grid�investors�to�look�beyond�national�borders.

48
JRC Reference Report
Smart Grid projects in Europe: lessons learned and current developments
O•� rganizational� and� management� issues.� Shift�from� SMEs� (small� and� medium� enterprises)� to�big�corporation�due�to�mergers�and�acquisitions�[9,�25];�changing�views�on�personnel�and�human�resources� that� start� to� be� considered� as� highly�strategic�[25].
Safety.•� �Reduction�of�hazard�exposure�with�annual�benefit�$1�million�[41,�63];�fewer�field�workers�due�to�remote�reading�through�smart�meters�[4].
Privacy.•� � Detailed� information� about� electricity�use�could�be�used�by�insurers,�market�analysts,�or�even�criminals�to�track�the�daily�routine�of�con-sumers�[52];�35%�customers�would�not�allow�the�utility� to� control� thermostats� in� their� homes� at�any�price�[53].
�Gender�issues.�•� In�EU�women�represent�only�15%�of� the� workforce� in� the� energy� sector� and� the�share� has� not� been� rising;� gender� issues� have�been�put�in�focus�only�recently�and�up�to�now�lit-tle�has�been�done�to�make�jobs�in�energy�sector�more�appealing� to�women;� initiative� in� the� are-as�of� flexible�working� time,�equal�pay� for�equal�work,� monitoring� schemes� and� gender� focused�recruitment� could�be� carried� out� in� order� to� at-tract�more� female�workers�and�managers� in� the�electricity�sector�[25].
4 Smart Grid contriBution to
policY GoalS
In�the�following�sections,�we�will�perform�an�analysis�of�specific�project�results�in�terms�of�their�relevance�to�the�European�energy�policy�goals:�sustainability,�competitiveness�and�security�of�supply.�
4.1. Sustainability
4.1.1 Reduction of CO2 emissions
The� reduction� of� CO2� emissions� is� one� of� the�drivers� of� the� scanned� projects,� even� though� only�few� of� them� have� tried� to� quantify� the� impacts� of�the�deployed�solutions�over� the�business�as�usual�scenario�(see�Box�13).
Demand� response� Demand� Response� has� an�important� potential� for� energy� saving� and�peak� load� shaving� and� can� therefore� produce�measurable� reductions� in� customers’� total�energy�use�and�associated�emissions.�Demand�Response�contributes� to� reduce� consumption� during� peak�times,� but� the� shifted� usage� does� not� always�“rebound”� at� other� times� of� day,� entailing� a� net�reduction� of� kWh.� Many� scanned� projects� have�explored�the�effectiveness�of�such�mechanisms�in�reducing�and�shifting�energy�consumption.
For� the� success� of� Demand�Response� and� energy�conservation� projects,� end-user� awareness� and�participation� is�a�crucial�point.�The�deployment�of�smart�meters�and�in-home�displays�is�a�main�enabler�of� Demand� Response� and� energy� conservation�projects.�When�smart�meters�are�coupled�with�the�appropriate� in-home� interfaces,� customers� can�receive�time-based�easy-to-read�price�signals�that�encourage�them�to�reduce�their�consumption�or�to�postpone� it� to� times� when� the� electricity� price� is�lower.�Many�demonstration�projects�have�coupled�the� installation� of� smart� meters� with� in-home�interfaces� and� dynamic� pricing� (i.e.� Model city Manheim, Etelligence, ESB Smart Meter Project, MeRegio).�

49
JRC Reference Report
In� order� to� deliver� energy� savings� and� to� reduce�CO
2�emissions�from�the�generation�sector,�Demand�
Response� will� need� to� be� complemented� by�the� deployment� of� smart� appliances� and� by� the�emergence� of� a� service-based� market� platform�where�energy�players�(aggregators)�can�trade�load�flexibility�on�consumers’�behalf.��The�regulatory�framework�will�play�an�important�role�in�supporting�these�changes.�Regulatory�incentives�should�encourage�network�operators�to�move�from�a�‘volume-based’�business�model�to�a�service-based�model�focused�on�quality�and�efficiency.
System losses� -� Smart� Grid� solutions� can�contribute� to� the� reduction� of� transmission� and�distribution� losses�and�therefore� to� the�reduction�of�the�amount�of�generation�(and�related�emissions)�needed�to�serve�a�given�load�(Smart Green Circuit; Optimal Power network Design and Operation).�The� deployment� of� smart� meters� can� contribute�to�the�reduction�of�grid�losses�in�several�ways.� In�particular,�the�reduction�can�derive�from�decreased�technical� losses� (faulty� meters� which� were� not�detected�before);�decreased�administrative�losses�(consumption� that� was� not� measured� before)�and� the� fact� that� the� internal� consumption� of�electronic� meters� is� lower� that� the� consumption�of� electromechanical� meters� (Storstad Smart Metering).�
Transportation sector� Important� CO2� reductions�can�derive�from�the�Smart�Grids’�ability�to�support�a�deeper�penetration�of�electric�vehicles,�particularly�in�the�case�of�renewable�electricity�use�and�off-peak�charging�(i.e.�Charge stand; EV Network integration; Large-scale demonstration of charging of electric vehicles; Fieldtrail Mobile Smart Grid)
4.1.2 Integration of DER
Another�major�driver�of�the�scanned�projects�is�the�integration� of� large� amounts� of� DERs,� including�renewables�and�storage,�into�the�grid�(see�Box�14).�The� large-scale� deployment� of� these� technologies�entails� a� high� potential� for� emissions� reductions�and,�at�the�same�time,�it�can�have�a�positive�impact�on�the�diversification�of�the�energy�mix�and�therefore�on�energy�security.�
BOX 13. Energy savings and CO2 reduction –
Some project highlights
Telegestore:�According�to�a�large�market�test�carried�out�at�the�beginning�of�2008�in�Italy,�the�deployment�of�smart�meters�coupled�with�the�supply�of�in-home�displays�encouraged�57%�of�the�customers�involved�to�change�their�behaviours.�The�following�changes�were� observed:� 29.3%� moved� the� usage� of� white�goods�to�the�evening�hours;�11.9%�alternated�usage�of�white�goods;�7.5%�switched�off�electronic�appli-ances� instead� of� leaving� them� in� standby�modus;�6.6%� reduced� the� usage� of� white� goods.� Enel� es-timates� that� at� national� level,� the� introduction� of�time-based� rates,�made�possible�by� the� roll-out�of�smart� meters,� could� reduce� energy� consumption�by�5-10%�and�shift�1%�of�the�energy�demand�to�low�peak�load�times.
Inovgrid� (PT):� The� deployment� in� the� Portuguese�city�of�Evora�of�an�integrated�system�including�sev-eral� components� (among�which�an�energy�box),� is�expected�to�deliver�a�reduction�of�378�tons�of�CO2�(considering� an� average� annual� household� con-sumption�of�3,5MWh,�an�emission� factor�of�360g/kWh�and�an�annual�reduction�in�consumption�of�1%).�According�to�the�project�developers,�the�nationwide�replication� of� the� entire� project� could� account� for�8%�of�the�national�CO2�reduction�target�by�2020.�
Energy� forecast:� The� introduction� of� tailored� and�simple� power� supply� agreements� at� national� level�(Denmark),�coupled�with�customer�information�and�awareness,�has�a�potential�impact�of�about�50�MW�of�reduced�peak�capacity.
GAD:� The� developed� forecasts� show� that,� follow-ing�the�introduction�of�hourly�energy�prices,�a�usual�consumer� could� save� 15%� of� his/her� total� energy�consumption� (12%� due� to� a� decrease� of� the� con-sumption;�3%�due�to�a�deferral�of� the�energy�con-sumption�from�the�appliances).�
Fenix:� Large-scale� use� of� flexible� operational�aggregation� of� distributed� energy� resources� by�a� virtual� power� plant� can� result� in� reduction� of�system� gas� consumption� and� therefore� in� CO2�emission� reductions.� According� to� the� economy-wide�scenarios�developed�within�the�Fenix�project,�by� 2020,� CO2� emissions� in� the� electricity� sector�could� be� reduced� by� 7.5� kg� CO2/kWflexibleDG/year�in�a�northern�European�scenario�and�by�13�kg�CO2/kWflexibleDG/year� in� a� southern� European�scenario,�compared�to�the�reference�case.

50
JRC Reference Report
Smart Grid projects in Europe: lessons learned and current developments
Demand� response� Through� smart� metering,�consumers� will� also� be� able� to� select� how� their�electricity�is�generated.�Green�conscious�consumers�might�be�willing�to�opt�for�green�electricity�at�home�and� accept� the� extra� costs� (e.g.� Dynamic tariffs, Energy @ home, Smart Watts).�
Electric�vehicles�as�storage�capacity� for� renewable�energy� resources� � Finally,� projects� investigate� and�test� the� viability�of�using�electric� vehicle�batteries�as�storage�capacity�to�help�balancing�the�grid�during�periods� of� high� energy� feed-ins� by� fluctuating�renewable� energy� sources� (e.g.:� Mini E Berlin, Charge stands, EV network integration, Harz.EEMobility, Eflex).� This� solution� has� mainly� been�tested�with�excess�wind�energy�but�clearly�it�can�be�applied�to�other�flexible�energy�sources.�
4.2 Competitiveness - Open and efficient market
From�the�scanned�projects,�we�have� identified�two�contributions�to�a�more�open�and�efficient�electricity�market:
1.� Increased� market� participation� (lower� market�barriers)�through�
the� aggregation� of� distributed� energy�•resources�
the� establishment� of� multi-sided� open�•market�platforms�(MSP)
2.� Increased� efficiency� of� interregional� markets:�coordination� mechanisms� among� TSOs,� new�interconnectors�for�large-scale�renewables
4.2.1 Increased market participation through aggregation
Smart� Grids� are� considered� key� enablers� for� an�open� and� efficient� energy� market� in� Europe.� The�current� electrical� system� has� been� designed� to�accommodate�a�limited�number�of�large,�centralized�power�plants.�For�this�reason�distributed�generation�and/or� responsive� loads,�which�are� limited� in�size�and�boundless�in�number,�are�neither�fully�integrated�into�power�system�operation�activities�nor�into�the�power�market.� The� aggregation� of� these� sources,�allowing�small�producers�as�well�as�consumers� to�access�the�electricity�market,�enables�market�entry�to�otherwise�restricted�participants�and�allows�for�
Box 14. Integration of DER – Some project highlights
Inovgrid:� The� implementation� of� a� fully� active�distribution� network� is� an� important� step� towards�the�integration�of�greater�amounts�of�RES�and�DER�into� the� electrical� grids.� The� Inovgrid� project� is�testing�a�new�grid�architecture�in�an�urban�area�with�about�32,000�customers�in�Portugal.�The�project�is�expected� to:� � increase� the� capability� to� integrate�RES� into� the� grid� by� 10-50%� through� enhanced�planning;� increase� the� integration� of� RES� into� the�grid�by�50-100%�through�active�asset�management;�increase�the�integration�of�EVs�into�the�grid�by�50%�through�active�network�and�charging�management.�The�project�developers�believe�that�the�nationwide�replication�of�the�project�could�account�for�3.5%�of�the�national�RES�target�by�2020.
However,� the� accommodation� of� a� large� number�of� disparate� generation� and� storage� resources�into� the� grid� poses� the� challenge� of� anticipating�intermittency�and�unavailability,�while�guaranteeing�system� reliability� and� economic� efficiency.� To�meet� these� challenges,� Smart� Grid� projects� are�researching�and�testing�different�solutions.
DER� aggregation� As� already� discussed,� across�the� collected� projects,� particular� attention� has�been� devoted� to� the� viability� of� VPP� and� Demand�Response� (i.e.� Fenix, Cell controller, Heat Pumps as an active tool in the energy supply system, Regenerative Modellregion Harz, Virtual Power Plant Germany, Integral – PowerMatchingCity, Smart Power System).�
Large-scale�use�of�flexible�operational�aggregation�of�distributed�energy� resources�by�a� virtual�power�plant�allows�more�penetration�of�renewables/DER�in�distribution.�This�is�possible�thanks�to�direct�control�of� DER� from� the� network� control� programs,� which�avoids� overloads/voltage� violations,� and� releases�the�hard�regulatory�limits�to�DER�(Fenix).�Preliminary�results� show� that� both� VPPs� and� active� demand�can� help� absorb� fluctuating� renewables� at� lower�costs,� reduce� CO2� emissions� and� improve� market�functioning.��Aggregation�business�models�can�play�a�key�role�for�the�success�of�DER�but�there�is�a�strong�need�for�regulatory�and�contractual�frameworks,�as�results�from�the EU-Deep�and�Fenix projects.

51
JRC Reference Report
a�more�efficient�market�through�the�optimisation�of�operations.�In�this�sense�the�concept�of�aggregation�has�a�potentially�huge�contribution�to�make�to�the�openness�and�efficiency�of�the�power�market.�
Aggregation�of�Distributed�Generation�FENIX�project�is�one�demonstration�of�the�aggregation�of�different�DG�units�to�a�single�Virtual�Power�Plant.� It�aims�at�maximizing� voltage� control� capacity� of� VPPs� with�the�use�of� a�distribution�management�application,�which�helps�determine�what�measures�need� to�be�taken� in� order� to�maintain� voltage� levels.� The� ap-plication�can�determine�the�reactive�power�needed�from�each�DG�unit,�prompting� the�VPP� to�alter� the�reactive�power�output�of�appropriate�units.�This�ap-proach�increases�the�participation�of�a�multitude�of�small�DG�that�could�not�otherwise�take�part�in�mar-ket-related�activities.��
Aggregation�of�Storage�The�main� idea�behind� the�aggregation�of�storage�is�to�accumulate�electricity�when�demand� is� low�relative� to�power�supply�and�inject� stored� electricity� into� the� system� at� peak�loads� or� to� compensate� fluctuating� output� of� RE�generation.��
The�aggregation�of�heat�pumps� is�one�example�of�how� the� integration� of� DG� can� be� facilitated.� The�Danish�project�From wind power to heat pumps,�for�instance,�proposes�to�store�electricity,�derived�from�wind�power,�in�the�form�of�heat�by�aggregating�300�smart� heat� pumps� into� one� huge� energy� storage�facility.� Estimates� show� that� 32,000� heat� pumps�generate�an�approximate�output�of�200�MW,�which�corresponds� to� a� large� amount� of� flexible� load�adjustable�according�to�wind�speed.�
The�integration�of�storage�facilities�not�only�assists�in� counterbalancing� stochastic� generation� profiles�often� encountered� in� distributed� generation� but�it� also� allows� house� owners� to� make� an� active�contribution� to� the� electric� power� system� in�unprecedented� ways.� Considering� the� outcome� of�the�Danish�project�and�given�that�there�are�currently�about� 80,000� heat� pumps� installed� in� Denmark,�the�potential� of�widespread�active�participation�of�consumers�through�the�integration�of�the�concept�of�storage�is�huge.�
Other� examples� include� the� aggregation� of� water�heating� storage.� The� EUDEEP� project� tested� this�concept� in� a� residential� area� (10� customers)� in�Berlin,� Germany,� allowing� heat� generated� from�
Micro-CHP�installed�in�the�households�to�be�stored�whenever�there�was�no�instantaneous�heat�demand.�Alternatively,�the�battery�of�electric�vehicles�(EVs)�can�be�used�as�a�storage�facility.�The�MeRegio�project,�among�others,�applied�this�concept�by�automatically�charging�batteries�whenever�the�mini-CHP�installed�in�model�households�generated�more�electric�power�than� the�grid� required.�Aggregated�electricity� from�customers’�vehicles�batteries�could�then�be�fed�into�the�grid�whenever�needed.
Aggregation�of�Demand�Response.�Projects� in� this�category� suggest� that� the� aggregation� of� a� large�number� of� reduced� loads� potentially� translates�into�a�rather�significant�total�load�cut,�which�can�be�used�to�balance�varying�output�of�renewable�energy�sources�(RES).��
Aggregation� of� Demand� Response� enables� active�participation�of�small�and�commercial�consumers�in�market-related� activities,� i.e.� provision� of� services�to� the� different� players� of� the� power� system� (e.g.�network�companies,�balancing�responsible�parties,�owners�of�non-controllable�generation,�etc.).�
A�primary�focus�is�on�integrating�domestic�consumers�who,� as� opposed� to� DG� and� large� industrial�consumers,�are� less�motivated�by�purely�economic�concerns� (minimal� gains).� Furthermore� they� are�generally�unable�to�make�precise�predictions�on�their�available�load�flexibilities;�therefore�it�is�difficult�for�them�to�‘offer’�services�in�the�classical�sense.�Rather,�the� idea� is� for� their� services� to�be�made�available�at� the�market’s� ‘request’,� i.e.� through�price�and/or�volume�signal�mechanisms,�and�for�the�provision�of�services�to�be�on�a�voluntary�and�contractual�basis.
Other� projects� focus� on� the� application� of� active�demand�for� large�consumers.�For� instance�the�EU-DEEP� project� explores� the� aggregation� of� small-scale� (10� kW� to� 1.5�MW)� load�management� in� UK�industrial� and� commercial� market� segments� with�a� customer� portfolio� made� up� of� industrial� and�commercial�sites�with�different� flexible� loads�(e.g.�supermarket,� shops,� hotel,� factory,� cold� store,�offices).� One� notable� result� that� emerged� is� that�the� current� minimum� requirement� in� the� UK� of�3� MW� or� more� of� steady� demand� reduction� (or�more� generation)� in� order� to� provide� Short� Term�Operating�Reserve�(STOR)�can�be�reduced�and�sites�as� small� as� 500�kW�could�partake� in� the� scheme.�This� increases� electricity� market� participation�potential�significantly.�

52
JRC Reference Report
Smart Grid projects in Europe: lessons learned and current developments
Improved market transparency through multisided platforms
As�discussed� in�Chapter�3,� in� light�of� the�growing�trend�toward�distributed�generation�and�increased�electricity�market�participation,�the�set-up�of�open�market� platforms� is� a� common� theme� of� many�collected�projects.� In�general,�a�platform�provides�the�possibility�for�buyers�and/or�sellers�of�products�and�services�to�interact,�thereby�lowering�the�costs�of� providing� services� (see� e.g.� [58])� Such� a�multi-sided� platform� (MSP)� is� instrumental� for� granting�access� to� retailers,� energy� service� companies,�aggregators� and� for� the� increased� market�transparency�and�contributes�to�the�functioning�of�a� liberalized�electricity�market� (see�e.g.�ADDRESS�project).�
As�shown�before,�the�profitability�of�a�MSP�based�service� (e.g.� for� Demand� Response� services)�depends�on�the�number�of�participating�consumers.�To� ensure� platform� value,� consumers� need� to� be�willing�to�actively�access�to�the�services�provided�by�the�platform�(e.g.�Demand�Response,�V2G�services�etc.).�In�this�context,�interoperability,�user�friendly�interfaces�and�data�protection�are�key�elements�to�foster�market�participation.
Concerns�over�privacy�issues�and�transparent�access�to� the�market� (e.g.� use� of� complicated� hardware/software,� need� to� do� energy� calculations)� might�severely�hinder�the�participation�of�consumers�and�therefore� the� profitability� of� MSPs� and� of� Smart�Grid� investments.� Also,� MSPs� should� be� open�to� guarantee� fair� access� to� all� players� on� board,�prevent� dominant� positions� and� give� consumers�a� wider� choice� of� service� providers.� Consumers�should� have� the� possibility� to� easily� switch� from�one�service�MSP�to�another�without�being�locked�in�specific�hardware/software�choices.�
4.2.2 Interregional markets
The�lack�of�harmonized�market�rules�in�the�different�Member� States� can� lead� to� market� segmentation�and�higher�transaction�costs,�even�in�regions�where�interconnection�exists.�TSOs�are�aware�of�the�need�for�greater� cooperation�on�planning�and�operation�of� transmission� networks� and� are� undertaking�multinational� projects� on� this� topic.� Project� goals�include� (1)� the� development� of� common� European�models� to� simulate� power� flows� and� power� and�energy�exchanges�and�(2)�the�definition�of�a�set�of�common�grid�planning�principles.�
For�instance,�in�the�Optimate�project�five�TSOs�from�Belgium,�France,�Germany�and�Spain�are�developing�an�open�simulation�platform�with�TSOs�and�market�participants�as�key�players.�The� idea� is� to�analyze�and� validate� new� market� designs� aiming� at� the�integration�of�flexible�energy�sources�across�several�regional�power�markets.�
A�consistent�number�of�FP7�projects�(e.g. Realisegrid, Pegase, Icoeur, Susplan)� investigate�new�planning�tools�to�analyze�options�for�a�pan�European�network�integration�and�expansion.�

53
JRC Reference Report
4.3 Security and quality of supply
Integration�of�DER�Much�attention�has�been�given�to�synergies�between�DER�and�storage�technologies�to� increase� the� reliability� of� supply.� Intelligent,�coordinated� control� of� distributed� generation,�including� storage� can� provide� immediate� backup�when�the�primary�source�is�lost.�
Several�projects�have�investigated�intentional�island�operations8� as� a� deliberate� emergency� measure�or� as� the� result� of� automatic� protection�or� control�action�(e.g.�see�projects�Cell Controller; Control and regulation of modern distribution system; Agent based control of power systems; MoreMicrogrids; Smart Region).� Islanding� is� a� situation� in�which� a�power� system� becomes� electrically� isolated� from�the�remainder�of�the�system�and�yet�continues�to�be�supplied� by� the� Distributed� Generation� connected�to� it.� Integrated� distributed� generation� sources�can� therefore� support� the� island� operation� during�contingencies� and� contribute� to� maintaining� the�security�of�power�supply.�
Several�projects� focusing�on� this� topic�are� located�in�Denmark,�as� the�high�penetration�of�distributed�generation� reached� in� the� Country� makes� it�ideally� suited� for� such� an� investigation.� The� Cell Controller� project� is� particularly� interesting� as�it� demonstrates� the� possibility� of� leveraging�increasingly� distributed� resources� so� as� to� ensure�secure�supply� to� the�majority�of�end-users� in�case�of�an�outage�of�central�generation�or�transmission.�Under� emergency� conditions,� the� cell� controller�can�disconnect�a�portion�of�a�distribution�network�from� the� transmission�grid,�manage� it� as�a� stable,�islanded� network,� and,� on� receiving� a� signal� from�the�transmission�system�operator,� resynchronize� it�with�the�grid.�
Many�other�projects�have�investigated�the�potential�of� electric� vehicles� to� contribute� to� securing� the�stability� of� the� grid,� otherwise� endangered� by�fluctuating� renewables� in� excess� situations� (e.g.�see�projects�Mini EBerlin; NetElan; Harz.EEMobility; Edison; Large-scale demonstration of charging of electric vehicles).�
Safe� integration�of� large-scale�RES�The� integration�of� large-scale� fluctuating� energy� resources� poses�several�challenges�to�the�operation�and�management�of�the�power�system.�Many�projects�in�the�catalogue�focus� on� their� safe� integration� in� the� electricity�network.� The� most� explored� solutions� are� the�development� of� balancing,� grid� integration� of� off-shore�wind�parks,� the�maximisation�of� the� current�operation�limits�of�the�network�(e.g.�Twenties�project)�and� the� improvement� of� production� predictability�(e.g.� Safewind� project).� Wind� is� by� far� the� most�investigated�energy�resource.�
Cyber�security�and�data�protection�Cyber�security�is�of�great�importance�in�order�to�avoid�potential�risks�arising� from� external� “attacks”.� Data� protection�with� encrypted� and� authenticated� algorithms�should� be� always� considered.� (e.g.� see� projects�NES, Telegestore, Stami, MoreMicrogrids).�A�more�in-depth�analysis�of�the�challenges�related�to�data�protection�and�security�can�be�found�in�Chapter�5.
Operational�improvements�The�installation�of�smart�metering� infrastructures,� SCADA9� systems� and�supervising� equipments� open� new� possibilities�to� prevent� and� solve� problems� in� the� low� voltage�distribution�network�and� to�obtain� further� savings�in� the� operational� costs.� Smart� metering� offers�many� advanced� functions� such� as� remote� control,�output�control�and�various�forms�of�quality�control�(see�e.g.�projects�Telegestore, Stami, Project AMR, Storstad Smart Metering).�Smart�meters�allow�the�collection�of�outage�information,�which�can�be�used�for�statistical�purposes�and�for�the�investigation�of�customer� claims� regarding� quality� of� supply,� and�allows�for�the�identification�of�the�specific�point�of�delivery�affected�by�the�problem�(see�e.g.�Storstad Smart Metering�project).�More�accurate�settlement�enables� aggregators� to�make�better� forecasts� and�simplifies� production� planning� for� producers� and�system�operators�(e.g.�KEL project).
8� According�to�the�definition�adopted�by�ENTSOE,�an�island�represents�a�portion�of�a�power�system�or�of�several�power�systems�that�is�electrically�separated�from�the�main�interconnected�system.
9� Supervisory�Control�and�Data�Acquisition.�It�generally�refers�to�industrial�control�systems:�computer�systems�that�monitor�and�control�industrial,�infrastructure,�or�facility-based�processes.

54
JRC Reference Report
Smart Grid projects in Europe: lessons learned and current developments
As� field� data� are� transmitted� to� central� control�rooms,� technical� problems� can� be� traced� and�solved� more� rapidly,� reducing� the� duration� of�outages.� As� a� consequence,� the� prevention� of�disturbances� assures� the� uninterruptable� power�supply� in� feeders,� the� voltage� quality� and� the�voltage�interruptions.�Remote�work�and�restoration�of�grid�operation�is�also�possible.�Data�acquisition�is�used�for�analysis�and�reporting,�which�can�be�very�useful� in� statistics,� maintenance� and� operation,�troubleshooting�activities.�
Furthermore,� continuous� supervision� of� the� grid�leads�to�rapid�detection�of�system�stress�and�thus�rapid�actions� in� relief� the�network� from�conditions�of� peak� loading,� congestions� and� bottleneck.�Equipment�is�not�subject�to�stressful�conditions�and�can�work�more�efficiently�and�up�to�its�operational�life�duration.�
BOX 15. Security and quality of supply – Some project highlights
Telegestore:�Thanks�to�the�Telegestore�project,�Enel�reports� that� the� indicator� “minutes�of� interruption�per� year”� decreased� from� 128� to� 49� over� the�period�2001�–�2009.� In� the�same�period,� thanks�to�the� energy� balance� data� from� the� smart� metering�system,�the�success�rate�of�the�verification�activity�has�increased�from�5%�to�50%.�
Storstad:� The� deployment� of� smart� meters� has�allowed�a�significant�reduction�in�customer�service�calls.�Over� a� two� year� period,� the� number� of� calls�for� both� meter-reading� and� invoice-related� issues�dropped�by�56%.�
Inovgrid:� The� Inovgrid� project� involves� the�deployment� of� advanced� control� and� automation�functionalities� distributed� over� different� levels� of�a� hierarchical� control� structure� that� matches� the�physical� structure� of� the� electrical� distribution�grid.� This� system� allows� the� active� management�of�the�distribution�network�by�the�DSO�and�entails�the� following� envisaged� results:� 3-10%� reduction�of� SAIDI� (System� Average� Interruption� Duration�Index);� 1-5%� reduction� of� SAIFI� (System� Average�Interruption�Frequency�Index).
4.4 Activated Smart Grid services and benefits
In� this� section� we� characterise� the� contributions�of� the� projects� in� our� catalogue� according� to� the�definitions� of� Smart� Grid� services� and� benefits�elaborated� by� the� EC� Smart� Grid� Task� Force� (see�Annexes� II� and� III).� Services� and�benefits� are� very�much�linked�to�the�EU�policy�goals�that�are�driving�the� Smart� Grid� deployment.� They� can� therefore�be� considered�as�useful� indicators� to�evaluate� the�contribution�of�projects�toward�the�achievement�of�these�energy�policy�goals.
The�Smart�Grid�services�represent�the�characteristics�of� the� “ideal”� Smart� Grid� (see� [18]).� Progresses�along� these� characteristics� are� directly� linked� to�progresses� toward� the� energy� policy� goals� and�the� expected�outcomes� the� ideal� Smart�Grid� is� an�enabler�for.�
The� Smart� Grid� benefits� represent� the� outcomes�deriving�from�the�implementation�of�the�ideal�Smart�Grid� (see� [18]).� A� characterisation� of� projects� in�terms�of�associated�services�and�benefits�is�a�useful�tool�to�map�the�contribution�of�projects�to�different�areas�of�the�Smart�Grid�landscape.�
In�our�questionnaire,�we�asked�project�coordinators�to�indicate�the�benefits�and�the�services�associated�with�their�project�and�to�fill�in�the�merit�deployment�matrix�proposed�by�[20].�
Figures� 18� and� 19� show� the� cumulative� benefits�and�services�across�the�different�projects�split�into�different� project� typologies� (R&D,� Demonstration�and�Deployment).�As�not�all� respondents� reported�about� the� services� and� benefits� pertinent� to� their�projects,� the� diagrams� refer� to� a� restricted� set� of�around� 20� projects� for� Figure� 18� and� of� around�80� projects� for� Figure� 19.� Also,� only� few� project�coordinators�actually�filled�in�the�merit�deployment�matrix.� In� the� update� of� this� study,� further� work�will� be� devoted� to� collect� more� data� from� project�coordinators,�in�order�to�refine�this�analysis.

55
JRC Reference Report
Figure 18. Cumulative activated benefits across projects
Figure 19. Cumulative activated services across projects

56
JRC Reference Report
Smart Grid projects in Europe: lessons learned and current developments
5 analYSiS oF data protection and SecuritY iSSueS
BOX 16. Data Protection and Security Issues
A� scan� of� collected� projects� highlights� the�•�convergence� towards� IP� communication� and�other�standards-based�solutions.�The�promises�of� Smart� Grids� will� only� realise� if� low-priced�consumer�devices�are�available.
Proven�standards�and� industry�best�practices�•�used�for�IT�systems�should�be�considered�and�adapted,�and�security�measures�not�reinvented.�Open� standards� at� the� European� and�international�level�are�necessary�for�updating�and� upgrading� the� security� mechanisms� of�these�devices�as�threats�and�risks�evolve.
Most� of� collected�projects� have�not� provided�•�responses�on�data�protection�and� security.� It�seems�that�the�potential�to�tackle�this�issue�is�not� fully�exploited.�New�projects� focusing�on�data�handling�would�be�useful�to�assess�how�data�handling�principles�from�other�industries�(e.g.�banking�industry)�can�be�applied�to�Smart�Grids.
Smart�Grid�projects� require� the� collaboration�•�of�several�players�with�different�competencies�and� background.� Since� security� in� the� ICT�infrastructure� is� a� collective� effort,� it� is�imperative� that� roles� and� responsibilities� are�clearly�defined�and� that�both� the�energy�and�ICT�communities�work�together� to�coordinate�security�measures�to�prevent�blind�spots.�
An�open�and�secure�ICT�infrastructure�is�at�the�•�core�of�a�successful�Smart�Grid�implementation.�Addressing� interoperability,� data� privacy� and�cyber-security�is�a�priority�requirement�to�make�the�ICT�infrastructure�truly�open�and�secure.�
A� privacy-by-design� approach� needs� to� be�•�adopted� to� ensure� customer� security.� A�wide�consensus�among�stakeholders�is�emerging�in�Europe�on�this�[19].
�Given� the� interdependence� of� existing� energy� and�information� infrastructures,� the� electricity� sector�also� feels� the� impact� of� mounting� cyber� security�concerns.� Along� with� big� opportunities� of� Smart�Grids�comes�the�bad�news�that�the�next�generation�of� Europe’s� electricity� grids� will� face� a� greater�variety�of�cyber�vulnerabilities�than�those�of�today.�Therefore� a� special� emphasis� is� put� on� critical�infrastructure� protection,� especially� infrastructure�supporting�energy,� transport,� telecommunications,�and�water�[44].
Either� directly� or� indirectly,� consumers� will� be�affected� by� several� threats� (natural� threats,� smart�thieves,� hackers,� terrorism,� warfare,� accidental�threats,� intentional� attacks,� load� shedding).�Therefore�consumers�will�also�need�to�be�informed�about� these� threats,� the�potential�attack�vectors10,�and�the�protections�needed�to�defend�against�them.�To� this� aim,� a� combined� effort� from� government,�corporate,� and� consumer� advocacy� organisations�will�most�likely�develop�a�combined�effort�[28].�
From�the�data�protection�and�security�point�of�view,�five�important�challenges�arise�[46]:
1)� the� large� amount� of� sensitive� customer�information�the�grid�will�transmit;�
2)� the� greater� number� of� control� devices� in� the�Smart�Grid;�
3)�the�poor�physical�security�of�a�great�proportion�of�these�devices;�
4)� the� use� of� Internet� Protocol� (IP)� as� a�communication�standard;�
5)�the�greater�number�of�stakeholders�the�grid�will�rely�on�for�its�smooth�operation.�
The� responses� we� have� received� from� project�coordinators�have�been�generally�quite�poor�in�data�protection�and�security� (see�Figure�20).�Therefore,�the� analysis� in� this� section� (see�Box� 16)� is�mostly�based�on� the� results�of� the OpenMeter�project,�by�far�the�most�significant�and�detailed�project�across�our�catalogue�in�this�domain.
10�Attack�vector�refers�to�any�method�or�mode�of�attacks�chosen�by�hackers�or�crackers�to�identify�weak�points�or�vulnerabil-ity�on�the�client�or�server-end�of�a�network�for�engineering�defects�in�the�user�system�or�the�server,�mostly�in�order�to�infect�or�gain�control�over�system�resources.

57
JRC Reference Report
Figure 20. Questionnaire responses on data protection and security
5.1 Customer security
It� seems� clear� that� a� paradigm� shift� is� needed� in�energy� industry� from� the� current� hardware-centric�focus� on� system�adequacy� and� reliability,� towards�the� inclusion�of�a�more�directly�consumer-oriented�view� of� security.� Security� services� are� needed� for�each� data,� network� and� component� of� which� the�entire� grid� is� composed.� Customer� privacy� issues�need� to� be� addressed� to� protect� confidential� or�otherwise� sensitive� data,� but� measures� are� also�needed�to�ensure�the�supply�of�energy�to�customers�and� to� make� the� grid� even� more� reliable� than�currently�in�spite�of�cyber�threats.�
In� the� Open Meter� project� [44],� minimum�requirements�are�set�to
authenticate�and�authorise�users,�groups�and�•�devices� on� all� interfaces� (such� as� GUI� and�other�IT�systems)
guarantee� the� integrity� and� confidentiality�of�•�data�exchanged�and�stored
recommend� the� use� of� certificates� to� enable�•�application�level�security
strongly�encrypt�the�data�in�transit.•�
All� of� these� requirements� are� satisfied� by� using�already� existing� proven� technologies� and� it� is�likely� that� further� developments� in� ICT� make� the�implementation�even�more�feasible.
The� legislative� framework� needs� to� support� these�technical� developments.� At� the� European� level,�there� is� a� general� agreement� among� stakeholders�that�Smart�Grid�solutions�have�to�comply�fully�with�the� binding� rules� on� privacy� and� data� protection.�As� recommended� by� [19],� a� privacy-by-design11��approach�needs�to�be�adopted�to�ensure�customer�security.� This� approach� has� been� integrated� in�the� Mandate� M49012� for� European� Smart� Grid’s�standards,� issued� early� in� 2011.� Furthermore,� the�European� Commission� is� also� ready� to� support�the�Member� States� in� ensuring,� when� deciding� of�roles� and� responsibilities� regarding� ownership,�possession�and�access�to�data�[24].
5.2 A greater number of intelligent devices
It�is�inevitable�that�Smart�Grids�will�be�reliant�on�an�exponentially�greater�number�of�digital�devices�than�today’s�grids�ranging�from�smart�meters�at�home�to�centralised�and�well-protected�Supervisory�Control�and� Data� Acquisition� (SCADA)� systems.� The� well-known�concept�of�“defence�in�depth”�13�has�to�be�ap-plied�to�the�global�system:�multiple,�even�redundant�security� techniques�at�each� layer�of� the� infrastruc-ture� to� mitigate� the� risk� of� one� component� being�compromised.�
11� Privacy�by�design�aims�at�building�privacy�and�data�protec-tion�up�front,�into�the�design�specifications�and�architecture�of�information�and�communication�systems�and�technolo-gies,�in�order�to�facilitate�compliance�with�privacy�and�data�protection�principles�http://www.edps.europa.eu/EDPSWEB/edps/EDPS
�12� http://ec.europa.eu/energy/gas_electricity/smartgrids/
doc/2011_03_01_mandate_m490_en.pdf
13� Defense�in�depth�is�an�information�assurance�(IA)�strategy�in�which�multiple�layers�of�defense�are�placed�throughout�an�information�technology�(IT)�system.�It�addresses�secu-rity�vulnerabilities�in�personnel,�technology�and�operations�for�the�duration�of�the�system’s�life�cycle.

58
JRC Reference Report
Smart Grid projects in Europe: lessons learned and current developments
The� much� greater� number� of� different� types� of�intelligent� devices� in� the� power� production/consumption� chain� can� be� seen� as� analogous� to�current� mobile� device� networks� which� also� have�security� concerns� and� are� built� on� international�standards�and�commercial� technologies.�Therefore�the� industry� is� likely� to� already� have� learned�important� lessons� in� managing� such� gigantic�communication�networks�with�billions�of�nodes.�
Even�if�there�were�no�plans�to�connect�Smart�Grids�to�the�Internet,�the�possibility�of�a�deeper�convergence�should�not�be�left�unanticipated�(e.g.�see Internet of Energy�project).
5.3 The problem of physical security
Physical� access� to� sensitive� components� should�be� secured,� which� is� already� the� case� with� e.g.�SCADA� systems.� Most� attention� will� be� needed�at� the� level�of� the�distribution�network�where� the�passive,�radial�architecture�of�the�past�will�give�way�to� a� new� meshed� structural� design� that� requires�the�introduction�of�many�intelligent�control�devices�where�once�there�were�few.�
Systemic� exposure� to� faults� and�malicious� activity�originating�from�smart�meters�at�customers’�homes�will�need�to�be�minimized.�The�physical�security�at�homes�will�be�altogether� impossible� to�guarantee,�making� intelligent� devices� at� homes� much� more�vulnerable�and,�given� the� two-way� communication�capabilities�with� the�Smart�Grid,�also�a� theoretical�point�of�access�for�malicious�intentions.�
The�overarching�principle�of�not�compromising�one�component�to�compromise�the�whole�system�must�apply� also� in� the� planning� for� risk� mitigation� for�shortcomings�in�physical�security.�In�the�“Advanced�Metering� Infrastructure”� specifications� this� has�been�addressed�by�specifying�different�profiles� for�different�interfaces�(Open Meter project�[45]).
5.4 The use of IP and commercial off-the-shelf hardware and
software
Because� interoperability� and� affordability� will� be�key� challenges� in� the� transition� to� Smart� Grids,� it�will�be�difficult,�if�not�impossible,�to�resist�the�broad�use�of� IP�and�COTS14�hardware�and�software�in�the�networks�of�the�future.�A�wealth�of�proven�security�standards�and�implementations�exist�on�all�layers�of�the�TCP/IP�protocol�stack�and�choosing�not�to�utilise�this�common�accumulated�knowledge�seems�hardly�possible.� Security� risks� do� exist� in� any� network�technology� and� architecture.� IP� based� networks,�however,�have�by�far�the�best�proven�track�record�as�large-scale�digital�communication�networks.
OpenMeter� project� recommends� using� proven�standards� and� industry� best� practices� used� for�IT� systems� in� other� domains.� Additionally� they�recommend�not�reinventing�security�measures�[44].The�vast�market�potential�of�Smart�Grid�devices�and�experience�with�other� recent�developments�makes�it�very�likely�that�COTS�hardware�and�software,�from�grid’s�mission� critical� controllers� to� smart�meters,�are� extensively� and� pervasively� deployed.� In� this�perspective,� open� standards� are� necessary� for�updating�and�upgrading�the�security�mechanisms�of�these�devices�as�threats�and�risks�evolve.
5.5 More stakeholders
The� number� of� active� stakeholders� in� Smart�Grids�is�increasing�by�definition�as�small�scale�generation�units�–�and�even�home�customers�–�become�integral�to� supply� in� the�market� in� the� coming� years.�New�value�networks�and�new�types�of�services�are�likely�to�appear�which�must�be�built�on�a�network�capable�of� guaranteeing� high� enough� confidentiality,�integrity�and�availability�of�the�information.�
As�highlighted� in� the�OpenMeter� project,� security�is� everywhere� in� the� metering� process,� from� the�meter� and� the� data� concentrator� to� the� back-office� information�system,� including�each�network�and� media� used� to� communicate.� All� partners,�from� manufacturers� to� suppliers� and� regulation�authorities� have� to� work� together� for� awareness-raising� and� securing� the� future�metering� systems�[44].
�14�Commercial�off�the�shelf

59
JRC Reference Report
6 SummarY and Future StepS
6.1 Summary
A� number� of� lessons� learned� and� interesting�developments�have�emerged�from�the�analysis�of�the�collected�projects.�They�are�summarised�in�Box�17.
BOX 17. SUMMARy AND CONCLUSIONS
The� difficulties� encountered� during� the�•�data� collection� process� suggest� the� need�for� improvements� in� data� collection/exchange.�These� include�a�common�structure�for� data� collection� in� terms� of� definitions,�terminology,� categories,� and� benchmarks,�and�strengthening�project� repositories�at� the�national�and�European�level.
Lack� of� quantitative� data� to� perform� cost-•�benefit�assessments.
SMART GRID LANDSCAPE IN EUROPE
Projects� in� the� catalogue� are� not� evenly�•�distributed�across�Europe.�Most�of�the�projects�and�of�the�investments�are�in�EU15�countries.�Smart�Grids�are�deployed�at�different�pace�and�not�in�a�homogenous�way�across�the�Member�States:�this�could�lead�to�challenges�both�for�trade�and�cross-border�cooperation.
There�is�a�significant�amount�of�investments�in�•�the�project�catalogue�(over�€5�billion),�which,�however,� is� still� lagging� behind� compared� to�several� estimates� of� required� investments�needed� to� realize� smarter� and� stronger�European�grids�(some€500�billion).�We�are�just�at�the�beginning�of�the�Smart�Grid�transition.
In� almost� all� countries,� a� significant� amount�•�of� investments� has� been� devoted� to� projects�which� address� the� integration� of� different�Smart� Grid� technologies� and� applications.�Most� of� technologies� are� known,� but� their�integration�is�the�new�challenge.
The�data�in�the�catalogue�confirms�the�leading�•�role�DSOs�play�in�coordinating�the�Smart�Grid�deployment�across�Europe.�
Deployment� covers� the� lion’s� share� of�•�investment� commitments;� 7%�of� the�projects�account� for� almost� 60%� of� the� investments.�R&D� and� demonstration� projects� account�for�a�much�smaller�share�of�the�total�budget.�Most� of� these� projects� are� small� to� medium�sized,�with�an�average�budget�of�€4.4�million�for� R&D� projects� and� about� €12� million� for�demonstration�projects.
LARGE SCALE MULTIDISCIPLINARy DEMONSTRATORS
A� consistent� number� of� projects� in� the�•�catalogue� present� promising� results� in� small�or� medium� scale� implementations.� As� also�recommended� in� the� EEGI� of� the� SET-Plan,�large-scale� demonstrators,� involving� a� high�number� of� sites� and� real� communities,� are�needed�to�prove�the�up-scaling�and�reliability�of� technical,�market�and� regulatory�solutions�and�to�better�understand�their�social�impact.�
The� increased� complexity� of� the� electricity�•�system�requires�multidisciplinary�consortia�to�share�competencies�and�hedge�risks.�Network�operators�are�establishing�fruitful�cooperation�with� diverse� partner� organizations,� ranging�from� academia� and� research� centres� to�manufacturers�and�IT�companies.�
SETUP OF MARKET PLATFORMS FOR THE PROVISION OF SERVICES
Current� regulation� in� EU� Member� States�•�generally�provides�network�owners/operators�with� the� incentive� to� improve� cost-efficiency�by� reducing� operation� costs� rather� than� by�upgrading� grids� towards� a� smarter� system.�The� regulatory� incentive� model� should� be�revised� in�order� to�accelerate� the� investment�potential� of� network� owners/operators� and�to�encourage�them�to�move�to�a�more�service-based�business�model.�
60
JRC Reference Report
Smart Grid projects in Europe: lessons learned and current developments
Service-based� business� models,� differently�•�from� volume-based,� can�make� efficiency� and�sustainability� part� of� the� industry’s� mission,�not�simply�a�constraint�to�deal�with.
Most� of� Smart� Grid� benefits� are� systemic�•�in� nature.� The� set-up� of� service-based�market� platforms� (e.g.� Demand� Response)�is� instrumental� to� offer� a� business� case� to�several� participants� that� may� not� enter� the�market�individually.�
Regulation� should� also� ensure� a� fair� sharing�•�of�costs�and�benefits�in�the�set-up�of�service-based� market� platforms.� Network� owners/operators�are�expected�to�sustain�the�majority�of� up-front� investments� whereas� several�players� might� get� benefits� when� market�platforms�become�operational.�
CONSUMERS
It�is�crucial�to�make�sure�that�consumers�have�•�trust� and� understanding� in� the� whole� Smart�Grid� process� and� can� receive� clear� tangible�benefits.�It�is�necessary�to�involve�consumers�early� on� in� trials� and� demonstrations,� to�target� early� adopters� before� moving� to� full-scale�deployment,�and�to�give�consumers�the�freedom�to�choose�their�level�of�involvement.
Most� projects� require� an� active� role� of�•�consumers.� Grid-centric� application� and�consumer-centric� applications� are� equally�important�in�the�catalogue.�Smart�Grid�players�recognize�that�consumer�engagement�is�crucial�to�have�a�business�case�for�investments�and�to�make�electricity�service�platforms�develop.
Potential�benefits�for�consumers�are�numerous:�•�reduction� of� outages,� more� transparent� and�frequent� billing� information,� participation� in�the�electricity�market�via�aggregators,�energy�savings.�However,�most�of� these�benefits�are�systemic�in�nature;�to�be�captured,�the�whole�system� (consisting� of� physical� and� market�layers)�needs�to�be�in�place.
Segmentation� of� consumers� is� another�•�hallmark� of� the� Smart� Grid.� Consumer�segmentation� implies� (1)� more� tailored�energy� services� to� meet� consumers’� needs�with�possibly�a�higher� rate�of�acceptance�of�new�products�and�services�(2)�possibility� to�target� energy-savvy� and�wealthy� consumers�as� early� adopters� of� new� technologies� (3)�possibility� to� guarantee� different� levels� of�involvement� of� consumers� in� Smart� Grid�applications�and�guarantee� the�protection�of�vulnerable�consumers.
INTEROPERABILITy, DATA PROTECTION AND DATA SECURITy
An�open�and�secure�ICT�infrastructure�is�at�the�•�core�of�a�successful�Smart�Grid�implementation.�Addressing� interoperability,� data� privacy� and�security�is�a�priority�requirement�to�make�the�ICT� infrastructure� truly� open� and� secure� and�reduce�transaction�costs�among�its�users.�
A� scan� of� collected� projects� highlights� the�•�convergence� towards� IP� communication� and�other� standards-based� solutions.� Proven�standards�and�industry�best�practices�used�for�IT�systems�should�be�considered�and�adapted,�and�security�measures�not�reinvented.�
Smart�Grid�projects� require� the� collaboration�•�of�several�players�with�different�competencies�and� background.� Since� security� in� the� ICT�infrastructure� is� a� collective� effort,� it� is�imperative� that� roles� and� responsibilities� are�clearly�defined�and� that�both� the�energy�and�ICT�communities�work�together� to�coordinate�security�measures�to�prevent�blind�spots.�
T•� he� legislative� framework� needs� to� support�these� developments.� As� stated� in� [24],�the� EC� is� ready� to� support� the� Member�States� in� ensuring,� when� deciding� roles�and� responsibilities� regarding� ownership,�possession�and�access�to�data.�
Most� of� collected�projects� have�not� provided�•�responses�on�data�protection�and� security.� It�seems�that�the�potential�to�tackle�this�issue�is�not� fully�exploited.�New�projects� focusing�on�data�handling�would�be�useful�to�assess�how�data�handling�principles�from�other�industries�(e.g.�banking�industry)�can�be�applied�to�Smart�Grids.�A�privacy-by-design�approach�needs�to�be�adopted�[19].�

61
JRC Reference Report
6.2 Future work
As�future�work,�we�aim�at�achieving�an�exhaustive�and� continuous� mapping� of� Smart� Grid� projects�throughout�Europe.�Building�upon� the� results�and�feedbacks�of�this�first�data�collection�exercise,�we�will� continue� to� collect� new� Smart� Grid� projects�and� to� include� new� available� data� on� existing�projects�as�projects�progress.�Also,�acknowledging�that� projects� aimed� at� making� the� grid� stronger�(e.g.� through� new� lines� and� substations)� cover� a�large� share� of� the� investment� for� the� bulk� power�system,�we�aim�at�developing�a�data� collection� in�this�area�as�well.�Accordingly,�we�intend�to�perform�an� exhaustive� and� continuous� mapping� of� power�system� projects� throughout� Europe� that� will� be�presented�in�a�review�of�the�present�study.
Future� work� will� also� be� devoted� to� perform�a� quantitative� analysis� of� the� performance� of�collected� projects,� which� has� not� been� included�in� this� report� for� the� lack� of� quantitative� data�gathered.�We�are�presently�working�on�two�different�quantitative�analyses:�a�performance�assessment�(Key� Performance� Indicator-KPI� analysis)� and� a�cost-benefit� analysis.� In� the� following,� we� briefly�discuss� the� guidelines� we� are� following� for� the�application�of�both�methodological�approaches.
KPI analysis
As�stated�in�section�4.4,�we�can�evaluate�the�merit�of� the� deployment� of� a� Smart� Grid� project� by�measuring� how�much� it� contributes� to� progresses�toward�Smart�Grids�services�and�by�measuring�how�much�it�contributes�to�progresses�toward�expected�benefits�and�outcomes.�
The� performance� assessment� measures� the�contribution� of� a� project� toward� the� achievement�of� the� benefits� that� are� associated� with� the� ideal�functionalities�of�a�Smart�Grid.�The�analysis�is�based�on� the� definitions� of� a� set� of� KPIs� to� evaluate� the�benefits�of�a�Smart�Grid�project.�
The� Smart� Grid� Task� Force� has� elaborated� a�methodology� to� make� the� evaluation� process�structured� and� systematic.� The� merit� deployment�matrix� introduced� in� [20]� is� used� to� identify� the�relationship� between� services/functionalities�with� corresponding�benefits/KPI�and� to�define� the�strength�of�the�link.
The� set� of� KPIs� defined� by� the� EC� Task� Force� [20]�is� mainly� focused� on� consumers’� benefits� and� is�meant�to�be�used�by�regulators�to�assess�the�impact�of�project�deployment�using� the�merit�deployment�matrix.
At�the�European�level,�another�set�of�KPIs�is�under�discussion�for�the�assessment�of�the�contribution�of�EEGI�projects�to�SET-Plan�objectives�[14].
The� set� of� KPIs� defined� in� this� context� is� mainly�focused�on�the�technical�performance�of�Smart�Grid�projects� and� is� mainly� tailored� for� grid� operators�rather�than�regulators.�

62
JRC Reference Report
Smart Grid projects in Europe: lessons learned and current developments
BOX 18. Future Work - Highlights
We� aim� at� an� exhaustive� and� continuous�•�mapping� of� Smart� Grid� projects� throughout�Europe.�We�will�continue�to�collect�new�Smart�Grid� projects� and� to� include� new� available�data�on�existing�projects�as�projects�progress.�Also,� acknowledging� that� projects� aiming� at�making� the� grid� stronger� (e.g.� through� new�lines� and� substations)� cover� a� large� share�of�the�investment�for�the�bulk�power�system,�we�aim�at�developing�a�data�collection�in�this�area�as�well.��Accordingly,�a�periodic�review�of�this�study�will�be�presented.�
Coordination�with�other�European�initiatives�on�•�Smart�Grids�which�the�Commission�expects�to�launch�at�the�end�of�2011.�Further�revisions�of�this�study�aim�at�closer�collaboration�with�the�EEGI.�This� is� important� to�have�clear� in�mind�the�common�ground�between�the�EEGI�and�the�JRC�mapping�and�keep�track�of�and�exchange�data�and�results.�
KPI�analysis� –�Presently,� the�Smart�Grid�Task�•�Force� and� EEGI� have� developed� two� sets� of�KPIs� to� assess� progresses� in� Smart� Grids.�The� KPIs� developed� by� the� Task� Force� are�intended� for� regulators.� They� cover� not� only�technical� aspects� of� Smart� Grids� and� have� a�particular�focus�on�the�impact�of�Smart�Grids�on� consumers.� The� KPIs� developed� by� EEGI�are�particularly�useful�for�utilities.�They�mainly�cover� technical� aspects� of� Smart� Grids.� The�Commission�is�working�to�ensure�consistencies�and�synergies�between�the�two�sets�of�KPIs.
Cost-Benefit� analysis� –In� the� framework� of�•�the� EU-US� Energy� Council,� the� Commission�is� collaborating� with� the� DoE� on� common�assessment� methodologies� for� Smart� Grids.�In� this� context,� we� plan� to� adapt� the� EPRI�methodology� to� the� European� context.� With�this� goal� in� mind,� the� JRC� is� collaborating�with� industrial�partners� to� test�a�cost-benefit�methodology� on� case� studies� from� the�catalogue.
Cost benefit analysis
The� cost-benefit� analysis� weighs� the� investment�costs� against� some� concrete� benefits� that� result�from�the�implementation�of�the�project.�
As�shown�in�section�2.1,�the�great�majority�of�projects�did� not� provide� any� data� on� cost-benefit� analysis.�Presumably,�some�projects�did�not�perform�a�cost-benefit� analysis� as� they� have� not� been� completed�yet;� others� may� have� not� shared� the� data� for�business� confidentiality.� In� many� other� instances,�however,� a� detailed� cost-benefit� analysis� was� not�in�the�scope�of�the�project,�as�most�of�the�collected�projects� focused� on� testing� the� effectiveness� of�technologies,� applications� and� solutions,� rather�than� their� business� case.� Overall,� it� emerged� the�need�for�the�development�of�a�common�cost-benefit�methodology� and� of� a� dedicated� data� collection�template�for�fair�comparisons.�
We�therefore�conducted�a�wide�literature�review�on�this�topic.�It�emerged�that�at�the�international�level,�the� need� to�measure� costs� and� benefits� of� Smart�Grid�projects� is�widespread.�However,�a�structured�approach� to� cost-benefit� analysis� in� this� field� has�not�been�tested�yet�on�a�concrete�case�study.
In�related�literature,�the�most�advanced�work�on�cost-benefit�analysis�for�Smart�Grids�has�been�published�by� the� Electrical� Power� Research� Institute� (EPRI)�in� 2010� [15].� The� US� Department� of� Energy� (DoE)�commissioned�this�study�to�perform�a�cost-benefit�analysis� on� a� set� of� 9� demonstrators� that� were�financed� in� 2007.�DoE� and� EPRI� intend� to� use� the�cost-benefit�methodology�for�ex-post�evaluation.In�the�framework�of�the�EU-US�Energy�Council,�the�Commission� is� collaborating� with� the� DoE.� In� this�context,�the�JRC�is�working�with�industrial�partners�to� adapt� the� EPRI� methodology� to� the� European�context.� Currently,� a� few� case� studies� from� the�JRC� catalogue� are� being� used� to� test� the� EPRI�methodology.

63
JRC Reference Report
reFerenceS
[1]� AEA�(Austrian�Energy�Agency)�(2011),�European Smart Metering Landscape Report,�SmartRegions�Deliverable�2.1,�February�2011,�AEA,�Vienna.�
[2]� AUSTRADE�(Australian�Trade�Commission)�(2010),�Australian�Energy�Efficiency�Market�Industry�Capability�Report,�AUSTRADE,�July�2010,�available�at:�http://di.dk/SiteCollectionDocuments/Markedsudvikling/2%20Australian%20Energy%20Efficiency%20Industry%20Capability%20Report.pdf,�accessed�February�2011.
[3]� Brown�J.,�Hendry�C.�(2009),�Public�demonstration�projects�and�field�trials:�Accelerating��commercialization�of�sustainable�technology�in�solar�photovoltaics”,�Energy Policy,�Vol.��37,�pp.�2560-2573.
[4]� Christensen,�A.,�Green,�J.,�Roberts,�R.�(2010),�Maximizing value from smart grids,�McKinsey�on�Smart�Grid,�Number�1,�McKinsey&Company,�available�at:�www.mckinsey.com/.../McK%20on%20smart%20grids/MoSG_MaxValue_VF.aspx,�accessed�February�2011.
[5]� Chupka�M.W.,�Earle�R.,�Fox-Penner�P.,�Hledik�R.�(2008),�Transforming America’s Power Industry: The Investment Challenge 2010-2030,�The�Edison�Foundation,�Washington,�D.C.,�available�at:�http://www.eei.org/ourissues/finance/Documents/Transforming_Americas_Power_Industry.pdf,�accessed�January�2011.
[6]� DECC�(Department�of�Energy�and�Climate�Change)�(2009),�Smarter Grids: The Opportunity,�available�at:��http://www.decc.gov.uk/assets/decc/what%20we%20do/uk%20energy%20supply/futureelectricitynetworks/1_20091203163757_e_@@_smartergridsopportunity.pdf,�accessed�January�2011.�
[7]� DOE�(U.S.�Department�of�Energy)�(2009),�Guidebook for ARRA Smart Grid Program Metrics and Benefits,�US�DOE:�Washington,�DC.�
[8]� DOE�(U.S.�Department�of�Energy)�(2009),�Smart Grid System Report,�US�DOE:�Washington,�DC.�
[9]� Eichin�R.,�Heng�A.�(2010),�U.S. Smart Grid Vendor Ecosystem - Report on the companies and market dynamics shaping the current U.S. Smart Grid landscape,�Cleantech�Group,�available�at:�http://www.technologyresearch.org/wp-content/uploads/2010/09/SmartGridVendor.pdf,�accessed�January�2011.
[10]� Electra�(2009),�Twenty solutions for growth and investment to 2020 and beyond,�available�at:�http://ec.europa.eu/enterprise/sectors/electrical/files/electrareport_en.pdf,�accessed�December�2010.
[11]� Elzen,�B.,�Moon,�D.�(2000),�Demonstrating Cleaner Vehicles: Guidelines for Success.�Utopia.�European�Commission,�Transport�RTD�Programme.�EC�contract�UR-97-SC-2076,�available�at�:�http://www.transport-research.info/Upload/Documents/200310/utopia.pdf,�accessed�December�2010.
[12]� ENTSOE�(European�Network�of�Transmission�System�Operators�for�Electricity)�(2010),�Research and Development Plan, European Grid Towards 2020 Challenges and Beyond,���available�at:�https://www.entsoe.eu/fileadmin/user_upload/_library/Key_Documents/100331_ENTSOE_R_D_Plan_FINAL.pdf,�accessed�February�2011.
[13]� ENTSOE�(European�Network�of�Transmission�System�Operators�for�Electricity)�(2010),�Ten-Year Network Development Plan 2010-2020,�available�at:�https://www.entsoe.eu/fileadmin/user_upload/_library/SDC/TYNDP/TYNDP-�final_document.pdf,�accessed�January�2011.
[14]� ENTSOE�(European�Network�of�Transmission�System�Operators�for�Electricity)�(2010),�The European Electricity Grid Initiative (EEGI) Roadmap 2010-18 and Detailed Implementation Plan 2010-12,�available�at:�http://ec.europa.eu/energy/technology/initiatives/doc/grid_implementation_plan_final.pdf,�accessed�January�2011.

64
JRC Reference Report
Smart Grid projects in Europe: lessons learned and current developments
[15]� EPRI�(Electric�Power�Research�Institute)�(2010), Methodological Approach for Estimating the Benefits and Costs of Smart Grid Demonstration Projects,�EPRI,�January�2010,�available�at:�http://www.smartgrid.gov/sites/default/files/pdfs/methodological_approach_for_estimating_the_benefits_and_costs_of_sgdp.pdf,�accessed�December�2010.
[16]� EPRI�(Electric�Power�Research�Institute)�(2011),�Estimating the Costs and Benefits of the Smart Grid - A Preliminary Estimate of the Investment Requirements and the Resultant Benefits of a Fully Functioning Smart Grid,�EPRI,�April�2011,�available�at:�http://my.epri.com/portal/server.pt?space=CommunityPage&cached=true&parentname=ObjMgr&parentid=2&control=SetCommunity&CommunityID=404&RaiseDocID=000000000001022519&RaiseDocType=Abstract_id,�accessed�April�2011.
[17]� ERGEG�(European�Regulators�Group�for�Electricity�and�Gas)�(2010),�Position Paper on Smart Grids - an ERGEG Conclusions Paper,�ERGEG,�June�2010,�available�at:�http://www.energy-regulators.eu/portal/page/portal/EER_HOME/EER_PUBLICATIONS/CEER_PAPERS/Electricity/2010/E10-EQS-38-05_SmartGrids_Conclusions_10-Jun-2010_Corrigendum.pdf,�accessed�December�2010.
[18]� EU�Commission�Task�Force�for�Smart�Grids�(2010),�Expert�Group�1:�Functionalities of smart grids and smart meters,�available�at:�http://ec.europa.eu/energy/gas_electricity/smartgrids/doc/expert_group1.pdf,�accessed�February�2011.
[19]� EU�Commission�Task�Force�for�Smart�Grids�(2011),�Expert�Group�2:�Regulatory Recommendations for Data Safety, Data Handling and Data Protection,�available�at:�http://ec.europa.eu/energy/gas_electricity/smartgrids/doc/expert_group2.pdf,�accessed�March�2011.
[20]� EU�Commission�Task�Force�for�Smart�Grids�(2011),�Expert�Group�3:�Roles and Responsibilities of Actors involved in the Smart Grids Deployment,�available�at:�http://ec.europa.eu/energy/gas_electricity/smartgrids/doc/expert_group3.pdf,�accessed�May�2011.
[21]� EUROPEAN�COMMISSION�(2006)�Directorate-General�for�Research,�European Smart Grids Technology Platform: Vision and Strategy for Europe’s Electricity Networks of the Future,�Brussels�2006,�available�at:�http://ec.europa.eu/research/energy/pdf/smartgrids_en.pdf,�accessed�December�2010.�
[22]� EUROPEAN�COMMISSION�(2007)�Communication�from�the�Commission�to�the�European�Council�and�the�European�Parliament,�An Energy Policy for Europe,�Brussels,�10.1.2007�COM(2007)�1�final,�available�at:�http://ec.europa.eu/energy/energy_policy/doc/01_energy_policy_for_europe_en.pdf,�accessed�January�2011.
[23]� EUROPEAN�COMMISSION�(2007)�Directorate-General�for�Research,�Strategic Research Agenda for Europe’s Electricity Networks of the Future,�Brussels�2007,�available�at:�http://bookshop.europa.eu/is-bin/INTERSHOP.enfinity/WFS/EU-Bookshop-Site/en_GB/-/EUR/ViewPublication-Start?PublicationKey=KINA22580,�accessed�December�2010.
[24]� EUROPEAN�COMMISSION�(2011)�Communication�from�the�Commission�to�the�European�Parliament,�the�Council,�the�European�Economic�and�Social�Committee�and�the�Committee�of�the�Regions,�Smart Grids: From Innovation to Deployment,�Brussels,�12.4.2011,�COM(2011)�202�final,�available�at:�http://eur-lex.europa.eu/LexUriServ/LexUriServ.do?uri=COM:2011:0202:FIN:EN:PDF,�accessed�April�2011.
[25]� European�Foundation�for�the�Improvement�of�Living�and�Working�Conditions�(EUROFUND)�(2008),�Trends and drivers of change in the European energy sector: Mapping report,�available�at:�http://www.eurofound.europa.eu/pubdocs/2008/12/en/1/ef0812en.pdf,�accessed�January�2011.
[26]� Evans�D.�S.�(2003),�Some�Empirical�Aspects�of�Multi-sided�Platform�Industries,�Review of Network Economics,�Vol.2�Issue�3�–�2003.

65
JRC Reference Report
[27]� Faruqui�A.,�Harris�D.,�Hledik�R.�(2009)�Unlocking�the €53�Billion�Savings�from�Smart�Meters�in�the�EU�-�How�increasing�the�adoption�of�dynamic�tariffs�could�make�or�break�the�EU’s�smart�grid�investment,�The�Brattle�Group,�Discussion�Paper,�October�2009,�available�at:�http://www.brattle.com/_documents/uploadlibrary/upload805.pdf,�accessed�January�2011.
[28]� Flink�T.,�Morehouse�J.�(2010),�Securing the Smart Grids. Next Generation power grids security,�October�2010,�Syngress,�Burlington.
[29]� Fox-Penner�P.�(2010),�Smart Power. Climate Change, the Smart Grid and the Future of Electric Utilities,�April�2010,�Island�Press,�Washington�DC.
[30]� IEA�(International�Energy�Agency)�(2008),�World Energy Outlook�2008,�OECD/IEA,�Paris.
[31]� Innovation�Observatory�(2011),�Smart Grid Technology Investment: Forecast for 2010- 2030,�February�2011.
[32]� Johnson,�M.�W.,�Suskewicz,�J.�(2009),�How�to�jump-start�the�clean-tech�economy,�Harvard Business Review,�Harvard�Business�Publishing,�Boston,�available�at�http://hbr.org/2009/11/how-to-jump-start-the-clean-tech-economy/ar/1,�accessed�February�2011.
[33]� Karlstrom,�M.,�Sanden�B.A.�(2004),�Selecting�and�assessing�demonstration�projects�for�technology�assessment:�The�cases�of�fuel�cells�and�hydrogen�systems�in�Sweden,�Innovation: management and policy practice,�Vol.�6,�pp.�286-293.
[34]� KEMA�(2008),�The U.S. Smart Grid Revolution – KEMA’s Perspectives for Job Creation,�prepared�for�the�GridWise�Alliance,�December�2008,�available�at:�http://www.smartgridnews.com/artman/uploads/1/KEMA_s_Perspectives_for_Job_Creation.pdf,�accessed�December�2010.��
[35]� Kiesling,�L.�(2009),�A smart grid is a transactive grid,�Kellogg�Graduate�School�of�Management,�Northwestern�University.
[36]� Kostyk,�T.�(2010,�February�16),�Smart�Grid�Backlash:�How�to�Put�an�End�to�Consumer�Resistance,�SmartGridNews.com,�available�at:�http://www.smartgridnews.com/artman/publish/�Business_Planning_News/Smart-Grid-Backlash-How-to-Put-an-End-to-Consumer-Resistance-1887.html,�accessed�March�2011.
[37]� Leeds�D.J.�(2009),�The Smart Grid In 2010: Market Segments, Applications and Industry Players,�GTM�research,�July�2009,�available�at:�http://www.greentechmedia.com/research/report/smart-grid-in-2010,�accessed�February�2011.
[38]� Lo�Schiavo,�L.�(2011),�Smart Metering and Smart Grids: The Italian Regulatory Experience,�prepared�for�the�KSA�Smart�Grid�Workshop,�8-9�January�2001,�Riyadh,�available�at:�http://ksasmartgrid.org/Content/Mr_Luca_Lo_Schiavo.pdf,�accessed�March�2011.
[39]� Miyoung,�K.�(2010,�January�25),�South�Korea�targets�$24�billion�smart�grid�spending�by�2030,�Reuters,�available�at�http://www.reuters.com/article/2010/01/25/us-smartgrid-korea-idUSTRE60O0YC20100125,�accessed�March�2011.
[40]� NETL�(National�Energy�Technology�Laboratory)�(2010)�Understanding the Benefits of the Smart Grid,�U.S.�Department�of�Energy�(DOE),�available�at:�http://www.netl.doe.gov/smartgrid/referenceshelf/whitepapers/�06.18.2010_Understanding%20Smart%20Grid%20Benefits.pdf,�accessed�February�2011.
[41]� NETL�(National�Energy�Technology�Laboratory)�(2010),��West Virginia Smart Grid Implementation Plan – Roadmap Framework,�U.S.�Department�of�Energy�(DOE)�,�prepared�for�GridWeek�2010,�October�18�2010,�Washington,�DC,�available�at�http://www.smartgrid.gov/sites/default/files/pdfs/10182010_gw_wv_sgip.pdf,�accessed�February�2011.

66
JRC Reference Report
Smart Grid projects in Europe: lessons learned and current developments
[42]� NIST�(National�Institute�of�Standards�and�Technology)�(2010),�NIST Framework and Roadmap for Smart Grid Interoperability Standards – Release 1.0,�U.S.�Department�of�Commerce,�NIST�Special�Publication�1108,�available�at:�http://www.nist.gov/public_affairs/releases/upload/smartgrid_interoperability_final.pdf,�accessed�March�2011.
[43]� OECD�(Organisation�for�Economic�Co-operation�and�Development)�(2002),�Frascati Manual 2002: Proposed Standard Practice for Surveys on Research and Experimental Development,�OECD:�Paris.
[44]� OpenMeter�Deliverable�D1.1�(2010), Report on the Identification and Specification of Functional, Technical, Economical and General Requirements of Advanced Multi-Metering Infrastructure, Including Security Requirements,�OPEN�Meter�Energy�Project�No�226369.�Funded�by�EC.�Available�at:�http://www.openmeter.com/files/deliverables/Open%20Meter_D3%201_Architecture_v6_.pdf,�accessed�March�2011.
[45]� OpenMeter�Deliverable�D3.1�(2010),�Design of the Overall System Architecture,�OPEN�meter,�Energy�Project�No�226369.�Funded�by�EC.�Available�at:�http://www.openmeter.com/files/deliverables/Open%20Meter_D3%201_Architecture_v6_.pdf,�accessed�April�2011.
[46]� Pearson�I.L.G.�(2011),�Smart�grid�cyber�security�for�Europe.�Energy Policy�(2011),�doi:10.1016/j.enpol.2011.05.043.
[47]� Pike�Research�(2011),�Smart Grids in Europe,�Pike�Research�Cleantech�Market�Intelligence,�available�at:�http://www.pikeresearch.com/research/smart-grids-in-europe,�accessed�February�2011.
[48]� Sakamaki�S.�(2011),�Japan�to�Consider�Using�Energy-Saving,�Smart�Grid�Technologies,�Bloomberg,�available�at:�http://www.bloomberg.com/news/2011-05-18/japan-to-consider-using-energy-saving-smart-grid-technologies-edano-says.html,�accessed�March�2011.
[49]� SmartGridnews.com�(2010,�January�27),�Smart Grid Snapshot: China Tops Stimulus Funding,�SmartGridNews.com,�available�at:�http://www.smartgridnews.com/artman/publish/�Stimulus_News_Digest_Products/Smart-Grid-Snapshot-China-Tops-Stimulus-Funding-1827.html,�accessed�March�2011.
[50]� Smartmeters.com�(2011,�January�1),�Smart Meters Deployment Looks Strong for 2011,�available�at:�http://www.smartmeters.com/the-news/1476-smart-meters-deployment-looks-strong-for-2011.html,�accessed�January�2011.
[51]� Stromback,�J.,�Dromacque,�C.�(2010),�Evaluation of residential smart meter policies, WEC-ADEME Case studies on Energy Efficiency Measures and Policies,�VaasaETT�Global�Energy�Think�Tank,�available�at:�http://worldenergy.org/documents/�ee_case_study__smart_meters.pdf,�accessed�March�2011.
[52]� The�Economist�(2008,�March�6),�Power plays,�available�at:�http://www.economist.com/�node/10789425,�accessed�January�2011.
[53]� The�Economist�(2010,�February�26),�Home sweet passive home – A lazy man’s guide to cutting energy costs,�available�at:�http://www.economist.com/node/�15585504?�story_id�=15585504,�accessed�February�2011.
[54]� Thornton,�J.�(2010),�Growth�of�Opportunity,�Mechanical Engineering,�Vol.�132(10).
[55]� Union�of�the�Electricity�Industry–EURE-LECTRIC�(2007),�The Role of Electricity A New Path to Secure, Competitive Energy in a Carbon-Constrained World,��EURE-LECTRIC,�June�2007,�available�at:�http://www2.eurelectric.org/DocShareNoFrame/Docs/2/MCDCHIMBLGDIPAEBLJOHILB-KFAY1YD1HYO5CM1OLFLM6/Eurelectric/docs/DLS/FullreportCOMPLETEfinallay-out040607-2007-030-0612-2-.pdf,�accessed�December�2010.
67
JRC Reference Report
[56]� Union�of�the�Electricity�Industry–EURELECTRIC�(2009),�Smart Grids and Networks of the Future - EURELECTRIC Views,�EURELECTRIC,�May�2009,�Brussels,�available�at:�www.eurelectric.org/Download/Download.aspx?DocumentID=26620,�accessed�December�2010.
[57]� Valocchi�M.,�Juliano�J.,�Schurr�A.�(2009),�Lighting the way, Understanding the smart energy consumer,�February�2009,�IBM�Global�Services,�Somers.�
[58]� Valocchi�M.,�Juliano�J.,�Schurr�A.�(2010),�Switching perspectives - Creating new business models for a changing world of energy,�IBM�Institute�for�Business�Value,�Executive�report,�available�at:�http://public.dhe.ibm.com/common/ssi/ecm/en/gbe03289usen/GBE03289USEN.PDF,�accessed�February�2011.�
[59]� Valocchi�M.,�Schurr�A.,�Juliano�J.,�Nelson�E.�(2007), Plugging in the Consumer Innovating Utility Business Models for the Future,�2007,�IBM�Global�Services,�Somers.
[60]� Vasconcelos,�J.�(2009), Smart Metering: An Overview of Regulatory and Technological Challenges,�Florence�School�of�Regulation�Seminar,�February�6�2009,�Florence,�available�at:�http://www.florence-school.eu/portal/page/portal/FSR_HOME/ENERGY/Policy_Events/Workshops/2009/Smart_Metering1/VASCONCELOS.pdf,�accessed�December�2010.
[61]� Watson-Currie,�E.�(2010,�February�9),�Blowback�Attack:�The�Smart�Grid’s�Greatest�Danger?,�SmartGridNews.com,�available�at�http://www.smartgridnews.com/artman/publish/�Business_Strategy/Blowback-Attack-The-Smart-Grid-s-Greatest-Danger-1875.html,�accessed�March�2011.
[62]� WEF�(World�Economic�Forum)�(2009),�Accelerating Successful Smart Grid Investments,�WEF�in�partnership�with�Accenture,�WEF:�Geneva.
[63]� WEF�(World�Economic�Forum)�(2010),�Accelerating Successful Smart Grid Pilots,�WEF�in�partnership�with�Accenture,�WEF:�Geneva.
[64]� Zheng,�A.�Y.�(2007),�A Smarter Grid for India,�SmartGridNews.com,�available�at�http://www.smartgridnews.com/artman/publish/article_303.html,�accessed�February�2011.
[65]� Zypryme�Research�&�Consulting�(2011),�China: Rise of the Smart Grid,�Special�Report�by�Zypryme’s�Smart�Grid�Insights,�available�at:�http://www.zpryme.com/�SmartGridInsights/China_Rise_of_the_Smart_Grid_January_2011_Zpryme_Research.pdf,�accessed�February�2011.

68
JRC Reference Report
Smart Grid projects in Europe: lessons learned and current developments

69
JRC Reference Report
aBBreviationS and acronYmS
AEEG� Autorità�per�l’Energia�Elettrica�e�il�Gas�(IT)
AMI� Advanced�Metering�Infrastructure�CHP� Combined�Heat�and�PowerCO2� Carbon�DioxideCOTS� Commercial�off-the-shelfDEMS� Distributed�Energy�Management�
SystemDER� Distributed�Energy�ResourcesDG�ENER� Directorate-General�for�EnergyDG� Distributed�GenerationDMS� Distribution�Management�SystemDR� Demand�ResponseDSO� Distribution�System�OperatorEC� European�CommissionEEGI� European�Electricity�Grid�InitiativeEU� European�UnionEV� Electric�VehicleFP6� Sixth�Framework�ProgramFP7� Seventh�Framework�Program�GHG� Greenhouse�GasICT� Information�and�Communication�
TechnologiesIEA� International�Energy�AgencyIP� Internet�ProtocolIT� Information�Technologies�JRC� Joint�Research�CentreKPI� Key�Performance�IndicatorKWh� Kilowatt-HourMSP� Multi-Sided�PlatformOFGEM� Office�of�the�Gas�and�Electricity�
Markets�(UK)PV� PhotovoltaicsR&D� Research�and�DevelopmentRES� Renewable�Energy�SourcesSAIDI� System�Average�Interruption�
Duration�IndexSAIFI��� System�Average�Interruption�
Frequency�IndexSCADA� Supervisory�Control�and�Data�
AcquisitionSET-Plan� Strategic�Energy�Technology�PlanSMEs� Small�and�Medium�EnterprisesTSO� Transmission�System�OperatorV2G� Vehicle�to�GridVPP� Virtual�Power�Plant
countrY codeS
AT� � AustriaBE� � BelgiumBG� � BulgariaCH� � Switzerland,�HelvetiaCY� � CyprusCZ� � Czech�RepublicDE� � GermanyDK� � DenmarkEE� � EstoniaEL� � GreeceES� � SpainFI� � Finland,�SuomiFR� � FranceHR� � CroatiaHU� � HungaryIE� � IrelandIT� � ItalyLI� � LiechtensteinLT� � LithuaniaLU� � LuxemburgLV� � LatviaMK� � MacedoniaMT� � MaltaNL� � Netherlands,�TheNO� � NorwayPL� � PolandPT� � PortugalRO� � RomaniaSE� � SwedenSI� � SloveniaSK� � SlovakiaUK� � United�KingdomUSA� � United�States�of�America

70
JRC Reference Report
Smart Grid projects in Europe: lessons learned and current developments
anneX i - data collection template
Qualitative assessment:
PILOT PROJECT DESCRIPTION
Project�name
Leading�Organization(Name�and�Country)
Other�Participants(Names�and�Countries)
Contact�Person�(Name,�Phone�Email)�and�Project�Website
Start�date�and�duration�of�the�project
Budget�and�contributing�organizations�(indicating�share�of�contribution)
Location/s
Project�category�(a)(If�more�than�one�category�applies,�please�express�the�relevance�of�the�category�with�a�number�between�0�and�1)
Quantitative�sizing�of�the�project:�number�of�metering�points,�average�and�peak�power�delivered,�number�of�generators�directly�involved
Duration�of�the�data�collection�within�the�operational�pilot
How�are�actors�involved�representative�of�a�full�deployment�(socially,�technically,�geographically,�motivation,�etc.)?
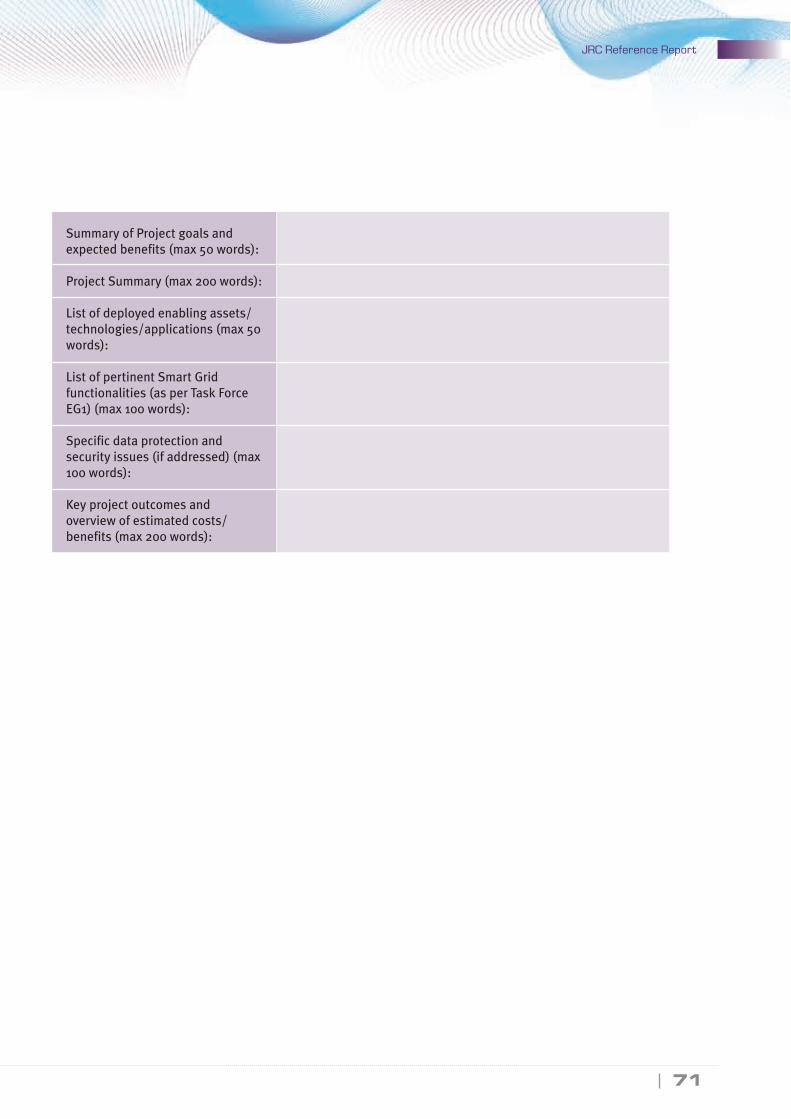
71
JRC Reference Report
Summary�of�Project�goals�and�expected�benefits�(max�50�words):
Project�Summary�(max�200�words):
List�of�deployed�enabling�assets/technologies/applications�(max�50�words):
List�of�pertinent�Smart�Grid�functionalities�(as�per�Task�Force�EG1)�(max�100�words):
Specific�data�protection�and�security�issues�(if�addressed)�(max�100�words):
Key�project�outcomes�and�overview�of�estimated�costs/benefits�(max�200�words):

72
JRC Reference Report
Smart Grid projects in Europe: lessons learned and current developments
Quantitative assessment:
1)� If�you�have�performed�a�cost-benefit�assessment�of�the�project,�please�provide�the�study�or�provide�a�summary�which�includes�at�least�the�following�elements:
•� Description�of�the�baseline�(i.e.�the�system�condition�that�would�have�occurred�had�the�project�not�been�taken)
•� Description�of�the�assumptions�made•� Description�of�the�conditions�(e.g.�hourly�consumption,�CO2�emissions,�congestions�(MW)�
etc.)�that�have�been�monitored�to�assess�the�impact�of�the�pilot�project•� Quantification�(and,�possibly,�monetization)�of�the�benefits�via�suitable�metrics•� Quantification�of�the�costs�for�both�baseline�and�project�conditions•� Main�results�and�figures,�including�assessment�of�beneficiaries
2)� It�might�be�possible�that�you�have�not�performed�a�cost-benefit�assessment�of�the�project�but�you�have�data�that�are�useful�for�the�estimation�of�benefits�and�costs.�In�this�case,�in�order�to�perform�a�cost-benefit�assessment�to�be�included�in�the�report,�please�provide�the�data�by�following�these�steps:
a)� Choose�the�relevant�benefits/criteria�from�the�list�provided�in�Task�Force�EG3.
b)� According�to�the�data�in�your�possession,�please�advise�a�metric�that�might�be�used�to�quantify�the�benefits/criteria.
c)� Please�provide�all�the�data�that�may�be�useful�to�calculate�the�relevant�benefit�metric,�both�with�and�without�the�project�in�place
Here�is�an�example�of�the�breakdown�to�link�data�to�benefits:
Example of map benefit-data
Benefit
Informed�consumers’�decisions
Benefit
Informed�consumers’�decisions
Benefit Criteria
Coherence�between�tariffs�and�behaviors
Benefit Criteria
Coherence�between�tariffs�and�behaviors
Consumers
Lower�electricity�bills
DSO
Peak�load�reduction
Society
Lower�emissions�due�to�demand�side�management
Metric
E.g.�Price�elasticity�
Necessary Data
Hourly�consumption�data�and�prices�
(with�and�without�the�project�in�place)
Beneficiaries
d)� For� each� benefit,� please� provide� a� brief� qualitative� description� of� the� expected� impact� on�beneficiaries,�as�reported�in�the�hypothetical�example�below:
Example of map benefit-beneficiaries
e)� Please�provide�annual�cost�estimate�for�both�baseline�and�project�conditions

73
JRC Reference Report
Benefit
Informed�consumers’�decisions
Benefit Criteria
Coherence�between�tariffs�and�behaviors
Activated functionalities
Consumption/injection�data�and�price�signals�by�
different�means
Installation�of�in-home�display�and�smart�meter�to�stimulate�Demand�
Response�
Contribution:�0.6
Improve�energy�usage�information
Installation�of�in-home�display�and�smart�meter�to�stimulate�Demand�
Response
Contribution:�0.3
3)� Finally,�we�would�like�to�use�the�benefit-functionality�matrix�developed�in�Task�Force�EG�3�to�further�an-alyze�the�impact�of�selected�pilot�projects�on�Smart�Grid�Functionalities.�To�contribute�to�this�exercise,�please�follow�the�following�steps:
a)� Identify�benefits/criteria�and�functionalities�that�are�relevant�to�your�pilot�project.�Select�the�cor-responding�matching�cells.
b)� For�each�cell,�briefly�explain�project�contribution�and�assign�a�weight�to�it�(0�for�no�contribution,�1�for�high�contribution�and�a�value�between�0�and�1�for�some�degree�of�contribution)
The�table�below�reports�an�illustrative�example,�in�which�a�pilot�project�delivers�one�benefit�through�the�activation�of�two�functionalities.�Corresponding�matrix�cells�(highlighted�in�grey)�report�how�the�project�links�the�functionalities�with�the�benefit�and�the�weight�of�the�contribution.

74
JRC Reference Report
Smart Grid projects in Europe: lessons learned and current developments
anneX ii – Smart Grid ServiceS (Smart Grid taSK Force)
A. Enabling the network to integrate users with new requirements Outcome:� Guarantee�the�integration�of�distributed�energy�resources�(both�large�
and�small-scale�stochastic�renewable�generation,�heat�pumps,�electric�vehicles�and�storage)�connected�to�the�distribution�network.
Provider:� DSOsPrimary�beneficiaries:� Generators,�consumers�(including�mobile�consumers),�storage�owners.
B. Enhancing efficiency in day-to-day grid operation Outcome:� Optimise�the�operation�of�distribution�assets�and�improve�the�efficiency�
of�the�network�through�enhanced�automation,�monitoring,�protection�and�real�time�operation.�Faster�fault�identification/resolution�will�help�improve�continuity�of�supply�levels.�
� �Better�understanding�and�management�of�technical�and�nontechnical�losses,�and�optimised�asset�maintenance�activities�based�on�detailed�operational�information.
Provider:�� DSOs,�metering�operatorsPrimary�beneficiaries:� Consumers,�generators,�suppliers,�DSOs.
C. Ensuring network security, system control and quality of supplyOutcome:� Foster�system�security�through�an�intelligent�and�more�effective�control�
of�distributed�energy�resources,�ancillary�backup�reserves�and�other�ancillary�services.�Maximise�the�capability�of�the�network�to�manage�intermittent�generation,�without�adversely�affecting�quality�of�supply�parameters.
Provider:�� DSOs,�aggregators,�suppliers.Primary�beneficiaries:� Generators,�consumers,�aggregators,�DSOs,�TSOs.
D. Enabling better planning of future network investment Outcome:� Collection�and�use�of�data�to�enable�more�accurate�modelling�of�
networks�especially�at�LV�level,�also�taking�into�account�new�grid�users,�in�order�to�optimise�infrastructure�requirements�and�so�reduce�their�environmental�impact.�Introduction�of�new�methodologies�for�more�‘active’�distribution,�exploiting�active�and�reactive�control�capabilities�of�distributed�energy�resources.
Provider:�� DSOs,�metering�operators.Primary�beneficiaries:� Consumers,�generators,�storage�owners.
E. Improving market functioning and customer serviceOutcome:� Increase�the�performance�and�reliability�of�current�market�processes�
through�improved�data�and�data�flows�between�market�participants,�and�so�enhance�customer�experience.�
Provider:�� Suppliers�(with�applications�and�services�providers),�power�exchange�platform�providers,�DSOs,�metering�operators.
Primary�beneficiaries:� Consumers,�suppliers,�applications�and�services�providers.

75
JRC Reference Report
F. Enabling and encouraging stronger and more direct involvement of consumers in their energy usage and managementOutcome:� Foster�greater�consumption�awareness�taking�advantage�of�Smart�
Metering�systems�and�improved�customer�information,�in�order�to�allow�consumers�to�modify�their�behaviour�according�to�price�and�load�signals�and�related�information.
� Promote�the�active�participation�of�all�actors�to�the�electricity�market,�through�Demand�Response�programmes�and�a�more�effective�management�of�the�variable�and�nonprogrammable�generation.�Obtain�the�consequent�system�benefits:�peak�reduction,�reduced�network�investments,�ability�to�integrate�more�intermittent�generation.�
Provider:�� Suppliers�(with�metering�operators�and�DSOs),�ESCOs.Primary�beneficiaries:� Consumers,�generators.� The�only�primary�beneficiary�which�is�present�in�all�services�is�the�
consumer.�Indeed,�consumers�will�benefit:-� either�because�these�services�will�contribute�to�the�20/20/20�
targets-� or�directly�through�improvement�of�quality�of�supply�and�other�
services
The�hypothesis�made�here� is� that�company�efficiency�and� the�benefit�of� the�competitive�market�will�be�passed�to�consumers–�at�least�partly��in�the�form�of�tariff�or�price�optimisation,�and�is�dependent�on�effective�regulation�and�markets.�

76
JRC Reference Report
Smart Grid projects in Europe: lessons learned and current developments
anneX iii Smart Grid BeneFitS and KpiS (Smart Grid taSK Force)
Benefit Potential key performance indicators1
(1) Increased sustainability
Quantified reduction of carbon emissions
Environmental impact of electricity grid infrastructure
Quantified reduction of accidents and risk associated to generation technologies
(during mining, production, installations, etc.)
(2) Adequate capacity of transmission and
distribution grids for “collecting” and bringing
electricity to the consumers
Hosting capacity for distributed energy resources in distribution grids
Allowable maximum injection of power without congestion risks in transmission
networks
Energy not withdrawn from renewable sources due to congestion and/or security
risks
An optimized use of capital and assets
(3) Adequate grid connection and access for all
kind of grid users
Benefit (3) could be partly assessed by:
first connection charges for generators, consumers and those that do both
grid tariffs for generators, consumers and those that do both
methods adopted to calculate charges and tariffs
time to connect a new user
optimisation of new equipment design resulting in best cost/benefit
faster speed of successful innovation against clear standards
(4) Satisfactory levels of security and quality of
supply
Ratio of reliably available generation capacity and peak demand
Share of electrical energy produced by renewable sources
Measured satisfaction of grid users with the “grid” services they receive
Power system stability
Duration and frequency of interruptions per customer
Voltage quality performance of electricity grids (e.g. voltage dips, voltage and
frequency deviations)
(5) Enhanced efficiency and better service in
electricity supply and grid operation
Level of losses in transmission and in distribution networks (absolute or
percentage)2. Storage induces losses too, but also active flow control increases
losses.
Ratio between minimum and maximum electricity demand within a defined time
period (e.g. one day, one week)3
Percentage utilisation (i.e. average loading) of electricity grid elements
Demand side participation in electricity markets and in energy efficiency measures
Availability of network components (related to planned and unplanned maintenance)
and its impact on network performances
Actual availability of network capacity with respect to its standard value (e.g. net
transfer capacity in transmission grids, DER hosting capacity in distribution grids)

77
JRC Reference Report
Benefit Potential key performance indicators1
(6) Effective support of transnational electricity
markets by load-flow control to alleviate loop-
flows and increased interconnection capacities
Ratio between interconnection capacity of one Country/region and its electricity
demand
Exploitation of interconnection capacities (ratio between mono-directional energy
transfers and net transfer capacity), particularly related to maximisation of capacities
according to the Regulation of electricity cross-border exchanges and the congestion
management guidelines
Congestion rents across interconnections
(7) Coordinated grid development through
common European, regional and local grid
planning to optimize transmission grid
infrastructure
Benefit (7) could be partly assessed by:
impact of congestion on outcomes and prices of national/regional markets
societal benefit/cost ratio of a proposed infrastructure investment
overall welfare increase, i.e. running always the cheapest generators to supply the
actual demand → this is also an indicator for the benefit (6) above
Time for licensing/authorisation of a new electricity transmission infrastructure.
Time for construction (i.e. after authorisation) of a new electricity transmission
infrastructure.
(8) Enhanced consumer awareness and
participation in the market by new players
Demand side participation in electricity markets and in energy efficiency measures
Percentage of consumers on (opt-in) time-of-use / critical peak / real time dynamic
pricing
Measured modifications of electricity consumption patterns after new (op-tin) pricing
schemes.
Percentage of users available to behave as interruptible load.
Percentage of load demand participating in market-like schemes for demand
flexibility.
Percentage participation of users connected to lower voltage levels to ancillary
services
(9) Enable consumers to make informed decisions
related to their energy to meet the EU Energy
Efficiency targets
Base to peak load ratio
Relation between power demand and market price for electricity
Consumers can comprehend their actual energy consumption and receive,
understand and act on free information they need / ask for
Consumers are able to access their historic energy consumption information for free
in a format that enables them to make like for like comparisons with deals available
on the market.
Ability to participate in relevant energy market to purchase and/or sell electricity
Coherent link is established between the energy prices and consumer behaviour
(10) Create a market mechanism for new energy
services such as energy efficiency or energy
consulting for customers
‘Simple’ and/or automated changes to consumers’ energy consumption in reply to
demand/response signals, are enabled
Data ownership is clearly defined and data processes in place to allow for service
providers to be active with customer consent
Physical grid related data are available in an accessible form
Transparency of physical connection authorisation, requirements and charges
Effective consumer complaint handling and redress. This includes clear lines of
responsibility should things go wrong

78
JRC Reference Report
Smart Grid projects in Europe: lessons learned and current developments
Benefit Potential key performance indicators1
(11)Consumer bills are either reduced or upward
pressure on them is mitigated
Transparent, robust processes to assess whether the benefits of implementation
exceed the costs in each area where roll-out is considered are in place, and a
commitment to act on the findings is ensured by all involved parties
Regulatory mechanisms exist, that ensure that these benefits are appropriately
reflected in consumer bills and do not simply result in windfall profits for the industry
New smart tariffs (energy prices) deliver tangible benefits to consumers or society in
a progressive way
Market design is compatible with the way the consumers use the grid
1� Some�of�these�indicators�are�already�used�today�in�different�EU�Member�States.2� In�case�of�comparison,�the�level�of�losses�should�be�corrected�by�structural�parameters�(e.g.�by�the�presence�of�distributed�generation�in�distribution�grids�and�its�production�pattern).�Moreover�a�possibly�conflicting�character�of�e.g.�aiming�at�higher�network�elements’�utilization�(loading)�vs.�higher�losses,�should�be�considered�accordingly.
3� In�case�of�comparison,�a�structural�difference�in�the�indicator�should�be�taken�into�account�due�e.g.�to�electrical�heating�and�weather�conditions,�shares�of�industrial�and�domestic�loads.

79
JRC Reference Report

Pr
ojec
t nam
eO
rgan
izat
ion
nam
e B
rief
pro
ject
des
crip
tion
Peri
odCo
untr
y*Pr
ojec
t cat
egor
y
10.4�kV
�remote�co
ntrol
Not�ava
ilable
Opp
ortunities
�to�estab
lish�remote�co
ntrol/DNM�of�the
�0.4�kV�grids
�ha
ve�bee
n�an
alyz
ed.�T
he�opp
ortunities
�for�integ
ration
s�from
�the�ca
ble�
registration
�to�th
e�remote�co
ntrol�h
ave�be
en�in
vestigated
�and
�pilo
t�projec
ts�hav
e�be
en�perform
ed�w
ith�integrations
�of�s
ection
s�of�th
e�low-
voltag
e�grid.
Not�
available
DK
Smart�M
eter�and
�AMI
222
0�kV
�SSSC
�dev
ice�for�p
ower�
flow�con
trol
Red�Eléc
trica�de
�Es
paña
�(ES)
Des
ign,�con
struct,�s
et�up�in�ope
ration
�and
�test�a�FAC
TS�(S
SSC
)�to�prev
ent�
overload
�situa
tion
s�in�th
e�22
0�kV
�tran
smission
�grid�an
d�redu
ce�th
e�mea
sures�that�th
e�Sy
stem
�Ope
rator�h
as�to
�mak
e�for�s
olving
�ove
rloa
ds,�
like�redu
ce�th
e�mes
hing
�of�the
�network�or�cur
tail�wind�prod
uction
.
Jul�2
009-Jul�
2014
ES�
Grid�Au
tomation�Tran
smission
3A�co
mplete�an
d�no
rmalized
�61
850�su
bstation
Red�Eléc
trica�de
�Es
paña
�S.A.�(ES
)
Use
�the�stan
dard�IE
C618
50�as�a�mea
ns�to
�improv
e�the�de
sign
,�mainten
ance
�and
�ope
ration
�of�the
�sub
station�au
tomation�sy
stem
s.�
Des
ign�a�stan
dard�sub
station�co
nsidering�the�ex
isting
�and
�new
�solutions
�de
velope
d�by
�the�ve
ndors�co
llabo
rating
�in�th
e�projec
t.�Build�and
�set-up�
in�ope
ration
�a�IE
C618
50�HV�sub
station.�
Oct�200
9-�
Dec
�201
5ES
�Grid�Au
tomation�Tran
smission
4Ac
tiva
tion
�of�2
00�M
W�re
fuse
-ge
nerated�CH
P�up
ward�
regu
lation
�effec
t
EMD�In
ternationa
l�A/
S,�(D
K)
Was
te�CHP�plan
ts�can
�be�us
ed�in
�the�elec
tricity�marke
t�for�upw
ard�
regu
lation
�by�by
pass
ing�the�stea
m�tu
rbine.�The
�tech
nica
l�des
ign�for�t
his�
purpos
e�mus
t�ens
ure�that�fa
ctors�su
ch�as�resp
onse
�and
�activation�time�
do�not�re
sult�in
�more�ex
pens
ive�turbine�mainten
ance
.�
Jul�2
009�-�
Dec
�201
0DK
Integrated
�Sys
tem
5Ac
tive
�Network�Man
agem
ent�
Smart�G
rid�So
lution
s�(U
K)
Delivering�a�fully
�autom
ated
,�rem
otely�co
nfigu
rable�an
d�se
lf�he
aling�
power�distribution�Network�that�w
ill�allo
w�grid�wide�de
man
d�/�load
�man
agem
ent�in�real�time.
Apr�2
010-
Apr�2
011
UK
Grid�Au
tomation�Distribution
6Almac
ena
Red�Eléc
trica�de
�Es
paña
�(ES)
Installation
�and
�testing�of�1�M
W�electroch
emical�battery�in
�a�sub
station�
of�th
e�tran
smission
�grid.
Sept�200
9�-�
Dec
�201
3ES
�
Spec
ific�Storag
e�Te
chno
logy
�Dem
onstration
Grid�Au
tomation�Distribution
7Ad
dres
sEn
el�Distribuz
ione
�(IT)
The�projec
t�aim
s�at�delivering�a�co
mpreh
ensive
�com
mercial�and
�tech
nica
l�fram
ework�for�t
he�dev
elop
men
t�of�“
Active
�Dem
and”
�in�th
e�sm
art�
grids�of�th
e�future.��AD
DRES
S�inve
stigates
�how
�to�effec
tive
ly�activate�
participation�of�dom
estic�an
d�sm
all�c
ommercial�cus
tomers�in�pow
er�
system
�marke
ts�and
�in�th
e�prov
ision�of�service
s�to�th
e�differen
t�pow
er�
system
�participa
nts.
Jun�20
08�-�
Jun�20
12
ES�
Integrated
�Sys
tem
FR ITHom
e�ap
plication�-�C
ustomer�
Beh
avior�
CH� �
SE
8AD
ELE�Projec
t�AA-CAE
SRW
E�Po
wer�AG,�(DE)�
Compres
ses-air�e
nergy�storag
e�(cas
e)�as�bu
ffer�fo
r�electricity�from
�wind�
and�su
n.�
Dec
�200
9�-�
Dec
�201
3DE
Spec
ific�Storag
e�Te
chno
logy
�Dem
onstration
an
neX
iv - p
ro
jec
t c
ata
lo
Gu
e

Pr
ojec
t nam
eO
rgan
izat
ion
nam
e B
rief
pro
ject
des
crip
tion
Peri
odCo
untr
y*Pr
ojec
t cat
egor
y
9Ad
vanc
ed�Sys
tems�of�
Effic
ient�Use
�of�E
lectrica
l�En
ergy
�-�SURE
Tece
s�(S
L)
The�main�pu
rpos
e�of�th
e�projec
t�is�to�build�active�ne
twork�co
ncep
ts�
base
d�on
�new
�tech
nologica
l�solutions
�and
�to�te
st�th
ese�so
lution
s�in�actua
l�pow
er�networks
.�In�the�fram
e�of�th
e�projec
t�a�num
ber�o
f�de
mon
stration
�projects�in�th
e�fie
ld�of�a
ctive�ne
tworks
�will�be�ca
rried�ou
t.�
Jan�20
11�-�
Jan�20
14SI
Integrated
�Sys
tem
Hom
e�ap
plication�-�C
ustomer�
Beh
avior�
10
AFTE
R�-�A�Fram
ework�for�
elec
trical�pow
er�sys
Tems�
vulnerab
ility�id
entific
ation,�
dEfens
e�an
d�Re
storation
RSE�–�Ricerca
�sul�
Sistem
a�En
erge
tico
�(IT)
AFTE
R�add
ress
es�vulne
rability�ev
alua
tion
�and
�con
ting
ency
�plann
ing�of�
the�en
ergy
�grids
�and
�ene
rgy�plan
ts�con
side
ring
�also�the�ICT�sy
stem
s�us
ed�in
�protection�an
d�co
ntrol.�Main�ad
dres
sed�prob
lems�co
ncern�high
�im
pact,�w
ide�sp
read
,�multiple�co
ntinge
ncies�an
d�ca
scad
ing.�
2011�-�20
14
IT
Grid�Au
tomation�Tran
smission
NO IE UK FR DE
BE
CZ
11Ag
ent�b
ased
�con
trol�of�p
ower�
system
s,�Forsk
EL�
CET-DTU
,�(DK)
The�pu
rpos
e�is�to
�exp
lore�th
e�po
ssibilities
�of�u
sing
�age
nt�te
chno
logy
�to�dyn
amic�break
down�of�electrica
l�pow
er�sup
ply�sy
stem
�for�e
xample.�
“Islan
ding
”�of�sub
system
s�an
d�to�study
�how
�age
nts�ca
n�be
�use
d�for�
implem
entation
�of�fl
exible�con
trol�strateg
ies.�
Apr�2
006�-�
Mar�201
0DK
Smart�M
eter�and
�AMI
Grid�Au
tomation�Distribution
12AMI
Elek
tro�Goren
jska
�d.d.�
(SL)
The�pu
rpos
e�of�th
e�projec
t�“AMI�s
ystem�fo
r�the
�Elektro�Goren
jska
”�is�th
e�introd
uction
�of�rem
ote�meter�re
ading,�con
trol�and
�dem
and�man
agem
ent�
of�th
e�elec
tricity�an
d�also
�water,�g
as�and
�hea
t�con
sumption�in�th
e�area
�of�
Goren
jska
.
� �SI
Smart�M
eter�and
�AMI
Integrated
�Sys
tem
13AMI
ENER
GA-OPE
RAT
OR�
SA����(P
L)
The�projec
t�is�focu
sed�on
��Inc
reas
ing�the�effectiven
ess�of�ope
ration
al�
activity�and
�facilitating�man
agem
ent�o
f�the
�network�an
d�its�de
velopm
ent;�
Remote�man
agem
ent�o
f�meter�sys
tems�an
d�ob
taining�meter�data;�
Activa
tion
�of�c
lients�in�ene
rgy�effectiven
ess�an
d�disp
erse
d�ge
neration
;�Co
mpletion�of�re
gulatory�re
quirem
ents�in
�the�sc
ope�of�m
eter�re
adings
;�Fa
cilitating�un
restricted
�acces
s�to�th
e�ne
twork.
2010
-201
7PL
Smart�M
eter�and
�AMI
14AMIS�
Energie�AG
�OÖ�Netz�
GmbH
�(AT)
Automation�of�m
etering-�and
�cus
tomer�proce
sses
,�fur
ther�autom
ation�
of�grid�co
mpo
nents,�creation�of�a�te
chno
logy
�platform�fo
r�smart�g
rid�
applications
,�tec
hnolog
y�platform
�for�c
ustomer�app
lications
.
Jan�20
05�–�
Jun�20
12AT
Integrated
�Sys
tem

Pr
ojec
t nam
eO
rgan
izat
ion
nam
e B
rief
pro
ject
des
crip
tion
Peri
odCo
untr
y*Pr
ojec
t cat
egor
y
15Ap
plication�of�smart�g
rid�in�
photov
oltaic�pow
er�sys
-tem
s,�
ForskE
L
Dan
foss
�Solar�
Inve
rters,�(D
K)
The�target�of�the
�propo
sed�projec
t�is�to�study
�how
�to�in
tegrate�large�
amou
nt�of�R
enew
able�Ene
rgy�So
urce
s�(R
ES)�into�the�ne
twork,�w
itho
ut�
having
�to�re
inforce�the�ne
twork.�This�is�don
e�by
�exa
mining�differen
t�type
s�of�grid�vo
ltag
e�co
ntrol,�ap
plying
�Smart�G
rid�func
tion
alities�an
d�introd
ucing�othe
r�anc
illary�se
rvices
�integrated
�into�th
e�RES
.
Oct�201
0�-�
Dec
�201
3DK
Smart�M
eter�and
�AMI
Integrated
�Sys
tem
Grid�Au
tomation�Distribution
16Au
tomation�an
d�se
curity�of�
Supp
lyNot�ava
ilable
The�co
mpa
ny�in
�focu
s�ha
s�es
tablishe
d�DSO
�–�Distribution�–�Co
ntrol�–
�Su
rveilla
nce�at�in
dividu
al�station
s.�O
n�thes
e�10
/0.4�kV�station
s�there�is�
full�remote�co
ntrol,�with�co
mman
ds,�rep
orts,�m
etering�an
d�alarms,�w
hich
�in�a�fa
ult�s
itua
tion
�mak
es�it�pos
sible�to�quick
ly�gain�an
�ove
rview�of�the
�grid�status�for�t
he�m
edium-voltage
�grid.
Not�
available
DK
Grid�Au
tomation�Distribution
17Au
tomation�sy
stem
s�for�
Dem
and�Re
spon
se,�F
orsk
EL
Dan
ish�En
ergy
�Indu
stries
�Fed
eration�
(DK)
More�than
�500
�hou
seho
lds�with�elec
tric�hea
ting
�participa
ted�in�a�
demon
stration
�project�abo
ut�dem
and�resp
onse
.�Participa
nts�pa
id�fo
r�elec
tricity�ba
sed�on
�spo
t�price
s.�The
�group
s�no
tifie
d�of�th
e�ne
xt�day
’s�
prices
�by�E-mail�a
nd/o
r�SMS�did�no
t�cha
nge�their�d
eman
d�pa
ttern.
Mar�200
6�-�
Jul�2
009
DK
Smart�M
eter�and
�AMI
Integrated
�Sys
tem
18BeA
ware
Tekn
illinen
�Ko
rkea
koulu�(FI)
BeA
ware�stud
ies�ho
w�ubiqu
itou
s�inform
ation�ca
n�turn�ene
rgy�co
nsum
ers�
into�active�play
ers�by
�dev
elop
ing:�-A
n�op
en�and
�cap
illary�infras
truc
ture�
sens
ing�wireles
sly�en
ergy
�con
sumption�at�app
lianc
e�leve
l�in�the�ho
me;�
-Ambien
t�and
�mob
ile�in
teraction�to�in
tegrate�en
ergy
�use
�profiles
�into�
users’�eve
ryda
y�life;�-V
alue
�add
ed�service
�platforms�an
d�mod
els�whe
re�
cons
umers�ca
n�ac
t�on�ub
iquitous
�ene
rgy�inform
ation�an
d�en
ergy
�prod
ucers�an
d�othe
r�stake
holders�ga
in�new
�bus
ines
s�op
portun
ities.�
May
�201
0�-M
ay�201
3
FI
Hom
e�ap
plication�-�C
ustomer�
Beh
avior�
IT SE
19Bey
Watch
Telefonica
�Inve
stigac
ion�y�
Des
arrollo
�SA,��(ES
)
Bey
Watch
�will�dev
elop
�an�en
ergy
-aware�an
d�us
er-cen
tric�solution,�able�
to�provide
�intellige
nt�ene
rgy�mon
itoring/
control�a
nd�pow
er�dem
and�
balanc
ing�at�hom
e/bu
ilding�&�neigh
borhoo
d�leve
l.
Dec
�200
8-May
�201
1
FR
Hom
e�ap
plication�-�C
ustomer�
Beh
avior�
UK SI
EL IT ES�

Pr
ojec
t nam
eO
rgan
izat
ion
nam
e B
rief
pro
ject
des
crip
tion
Peri
odCo
untr
y*Pr
ojec
t cat
egor
y
20Belgium
�eas
t�loo
p�ac
tive
�network�man
agem
ent
�Ores�(B
E)Th
e�projec
t�aim
s�at�des
igning
�an�ac
tive
�network�so
lution
�bas
ed�on�the�
power�sys
tems�an
alys
is.�It�w
ill�defi
ne�princ
iples�of�acces
s�for�g
enerators�
to�perform
�a�cur
tailm
ent�a
sses
smen
t�tha
t�will�help�to�estim
ate�ho
w�
often�lim
its�are�ch
alleng
ed.�T
his�will�le
ad�to
�the�ge
nerators�m
odulation�
nece
ssary�to�kee
p�po
wer�flow
s�within�lim
its.�The
�project�w
ill�provide
�gu
idelines
�for�t
he�active�ne
twork�so
lution
�dep
loym
ent�a
s�well�a
s�a�co
st�
estimation.
Sept�201
0�-�
Jun�20
11BE
Grid�Au
tomation�Distribution
Elia�(B
E)Grid�Au
tomation�Tran
smission
21Building�to�Grid�(B
2G)
Salzbu
rg�AG�(A
T)
In�th
e�co
ntex
t�of�s
o-ca
lled�sm
art�g
rids
,�buildings
�are�exp
ected�to�
integrate�in�a�coo
perative
�man
ner�a
nd�to
�exp
ose�their�c
urrently�
unus
ed�flex
ibility�of�o
peration
s,�sup
ported
�by�bu
ilding�au
tomation�an
d�inform
ation�tech
nology
.�
Jul�2
010�-�
Dec
�201
3AT
Hom
e�ap
plication�-�C
ustomer�
Beh
avior�
22
Central�N
etworks
�Low
�Ca
rbon
�Hub
�-�Optim
izing�
rene
wab
le�ene
rgy�reso
urce
s�in�Linco
lnsh
ire
Central�N
etworks
�UK)
The�low�Carbo
n�Hub
�will�dem
onstrate�how
�sub
stan
tial�le
vels�of�
rene
wab
le�gen
eration�ca
n�be
�con
nected
�to�a�primary�distribu
tion
�ne
twork.
Jan�20
11-D
ec�
2014
UK
Grid�Au
tomation�Distribution
Other
23CE
T200
1�Cu
stom
er�Led
�Network�Re
volution
CE�Electric�(U
K)
This�project�w
ill�exp
lore�how
�new
�tariffs�ca
n�alter�c
ustomer�beh
avior,�
enab
le�networks
�to�re
spon
d�more�fle
xibly�to�cus
tomers�by
�using
�ad
vanc
ed�voltage
�con
trol�dev
ices
,�exp
lore�w
ays�for�n
etworks
�and
�smart�
meters�to�com
mun
icate,�m
onitor�600
�intellige
nt�w
hite�goo
ds�and
�14,00
0�sm
art�m
eters.
Jan�20
11-D
ec�
2013
UK
Smart�M
eter�and
�AMI
Grid�Au
tomation�Distribution
Hom
e�ap
plication�-�C
ustomer�
Beh
avior�
Spec
ific�Storag
e�Te
chno
logy
�Dem
onstration
24Ch
arge
�stand
sSy
dEne
rgi,��(D
SO),�
(DK)
Gain�kn
owledg
e�of�w
hether�it�is
�tech
nica
lly�pos
sible�an
d�fin
ancially/
environm
entally
�adv
antage
ous�for�t
he�cus
tomer�and
�the�elec
tricity�
system
�to�offer�owne
rs�of�e
lectrica
l�veh
icles�an
�intellige
nt�cha
rging�
facility�co
mprising�po
ssible�use
�of�s
pot�e
lectricity�agree
men
ts,�a
nd�th
e�ch
oice
�of�c
harging�mos
t�che
aply�or�m
ost�g
reen
ly.
Jan�20
10�
-�Not�
available
DK
Smart�M
eter�and
�AMI
Integrated
�Sys
tem
25Ch
arging
�Infras
truc
ture�
for�E
lectric�Ve
hicles
Goteb
org�En
ergy
�AB�
(SE)
The�projec
t�built�and
�tested
�app
roximately�50
�cha
rging�po
ints,�a
ll�of�
them
�equ
ippe
d�with�sm
art�m
eters�en
ablin
g�su
b-metering�at�use
r�spe
cific
�leve
l�and
�remote�on
-off�fu
nction
ality.�
A�on
e-stop
-sho
p�ch
arging
�offer�w
as�te
sted
�on�the�marke
t�and
�furthe
r�de
velope
d�within�the�projec
t.�An�internal�dev
elop
men
t�plan�for�c
harging�
of�electrica
l�veh
icles�was
�produ
ced.
Jan�20
08�-�
Dec
�201
0SE
Integrated
�Sys
tem
26Clyd
e�Gatew
aySc
ottish
�Pow
er�(U
K)
To�dem
onstrate�th
e�latest�smart�g
rid�tech
nology
�and
�use
�the�learning
�to�dev
elop
�propo
sals�fo
r�wider�and
�larger�sca
le�smart�g
rid�ap
plications
�ac
ross
�Glasg
ow�and
�UK�ope
ration
s.
Apr�2
010-
Apr�2
011
UK
Grid�Au
tomation�Distribution

Pr
ojec
t nam
eO
rgan
izat
ion
nam
e B
rief
pro
ject
des
crip
tion
Peri
odCo
untr
y*Pr
ojec
t cat
egor
y
27Co
ncep
t�for�M
anag
emen
t�of�
the�Fu
ture�Electricity�Sys
tem
Energine
t.dk
,��(TSO
),�
(DK)
To�dev
elop
�and
�des
cribe�a�co
ncep
t�for�th
e�ne
cess
ary�an
d�su
fficien
t�man
agem
ent�o
f�the
�future�pow
er�sys
tem�in
�202
5.�The
�con
cept�
desc
ription�sh
ould�be�at�a�le
vel�tha
t�allo
ws�a�su
bseq
uent�break
down�in�
spec
ific�projec
ts�to
�an�ea
rly-stag
e�ph
ased
�rollo
ut.�
Jan�20
09�-�
Dec
�201
1DK
Other
28Co
nsum
er�to
�Grid�(C2G
)Sa
lzbu
rg�AG�(A
T)Th
is�study
�inve
stigates
�the�way
�in�w
hich
�inform
ation�ab
out�p
oten
tial�
energy
�sav
ings
�is�bes
t�prese
nted
�to�th
e�co
nsum
er�in
�order�to
�redu
ce�
energy
�con
sumption�in�th
e�sm
art-grid.
Jul�2
010-�
Jun2
012
ATHom
e�ap
plication�-�C
ustomer�
Beh
avior�
29Co
nsum
er�w
eb�
Vestforsyn
ing�A/
S�(D
SO),�(D
K)
Mak
e�co
nsum
ption�da
ta�ava
ilable�to�con
sumers�in�a�w
ay�th
at:�h
elps
�them
�to�und
erstan
d�their�o
wn�co
nsum
ption,�th
eir�c
onsu
mption�pa
ttern�
and�en
ergy
�con
sumption�in�gen
eral;�m
otivates
�them
�to�optim
ize�their�
cons
umption;�and
�ena
bles
�them
�to�ach
ieve
�ene
rgy�sa
ving
s.�Gives
�strong
er�com
mun
ication�with�cu
stom
ers�in�order�to
�ach
ieve
�better�a
nd�
faster�cus
tomer�service
�and
�more�se
rvices
.
Jan�20
10�-�
Jan�20
11DK
Hom
e�ap
plication�-�C
ustomer�
Beh
avior�
Smart�M
eter�and
�AMI
30Co
ntrol�a
nd�re
gulation
�of�
mod
ern�distribu
tion
�sys
tem,�
ForskE
L
Dep
artm
ent�o
f�Ene
rgy�
Tech
nology
-�Aalbo
rg�
Unive
rsity�(D
K)
The�projec
t’s�objec
tive
�is�to
�study
�the�effects�of�lo
ad�m
anag
emen
t�sy
stem
s�an
d�on
line�real�time�elec
tricity�pricing�sy
stem
s�in�m
odern�
distribu
tion
�sys
tems�an
d�to�dev
elop
�the�mod
els,�ope
ration
�and
�con
trol�
strategies
�for�s
uch�distribu
tion
�sys
tems�an
d�fin
ally�to
�estab
lish�the�
control�a
pproac
h�for�t
he�sys
tems�in�con
ting
ency
�situa
tion
s,�i.e.�is
land
�op
eration.
Oct�200
6�-�
Dec
�201
0DK
Grid�Au
tomation�Distribution
Smart�M
eter�and
�AMI
31Co
st�ben
efit�a
nalysis�for�t
he�
implem
entation
�of�s
mart�
metering�with�pilot�p
roject
Ministry�of�eco
nomy�
of�th
e�Slov
ak�re
public�
(SK)
Prim
ary�projec
t�goa
ls�are�to
�find
�releva
nt�fa
cts�an
d�proo
fs�fo
r�which
�se
gmen
ts�of�c
ustomers�the�sm
art�m
etering�co
uld�be
�eco
nomical.
Jan�20
11-D
ec�
2011
SK
Smart�M
eter�and
�AMI
Hom
e�ap
plication�-�C
ustomer�
Beh
avior�
32Cr
yoge
nic�Storag
eHigh�view
�Pow
er�
Storag
e�(U
K)
The�projec
t�is�be
ing�run�in�tw
o�ph
ases
:�Pha
se�1:�the
�CryoG
ense
t �pilo
t�de
mon
strator�h
as�bee
n�co
mmission
ed�fo
r�six�m
onths�an
d�runs
�on�a�
regu
lar�b
asis�exp
orting
�electricity�to
�the�Nationa
l�Grid.�Pha
se�2:�the
�fully
�integrated
�CryoE
nergy�Sy
stem
.
Apr�2
010-
Apr�2
011
UK
Spec
ific�Storag
e�Te
chno
logy
�Dem
onstration
33Cu
stom
er�Value
��Prop
osition�Sm
art�G
rid��
(KEL
)
Goteb
org�En
ergy
�AB�
(SE)
The�co
mpa
ny�is
�und
ergo
ing�an
�exten
sive
�cha
nge�proc
ess�go
ing�from
�pa
rtly�m
anua
l�to�fully
�autom
ated
�proce
sses
�for�e
nergy�co
nsum
ption�
mea
suremen
t�on�ho
urly�bas
is�and
�invo
icing�ba
sed�on
�this.�T
he�project�
conc
erns
�the�laun
ching�of�hou
rly�mea
suring
�and
�new
�hou
rly�ba
sed�
tariffs.
Jan�20
08�-�
Dec
�201
2SE
�Sm
art�M
eter�and
�AMI
Hom
e�ap
plication�-�C
ustomer�
Beh
avior�
34Cy
prus
�Smart�m
etering�de
mo
Elec
tricity�Au
thority�of�
Cyprus
�(EAC
),�(C
Y)Installation
�of�3
000�sm
art�m
eters�with�the�requ
ired
�infras
truc
ture�fo
r�full�
func
tion
ality�ev
alua
tion
�of�the
�bes
t�practice�ap
proa
ch�fo
r�full�roll�o
ut.
Jul�2
010�-�Jul�
2012
CYSm
art�M
eter�and
�AMI
35DA�(D
istribution�Au
tomation)
Enex
is�BV�(N
L)Building�an
�integrated
�architecture�(i.c.:�interaction�be
twee
n�bu
sine
ss-
proc
esse
s,�in
form
ation-arch
itec
ture�and
�primary�ne
twork�layo
ut)�to�
max
imize�En
exis’�M
V-grid�perform
ance
�(10-20
�kV).
2007
-201
0NL
Grid�Au
tomation�Distribution

Pr
ojec
t nam
eO
rgan
izat
ion
nam
e B
rief
pro
ject
des
crip
tion
Peri
odCo
untr
y*Pr
ojec
t cat
egor
y
36Data�Ex
chan
geNationa
l�Grid�(U
K)
The�Data�Ex
chan
ge�w
as�estab
lishe
d�to�id
entify�an�en
during
�solution�to�
the�interaction�be
twee
n�the�ST
C�an
d�Grid�Co
de�re
garding�the�ex
chan
ge�of�
Use
r�data.
Apr�2
010-
Apr�2
011
UK
Grid�Au
tomation�Tran
smission
37DCN
4TSO
Elek
tro-Slov
enija
�(TSO
),�(S
I)
DCN
�sys
tem�w
ill�ena
ble�sm
art�p
rotection,�m
etering,�ene
rgy�man
agem
ent,�
automation�an
d�da
ta�exc
hang
e�with�othe
r�Europ
ean�TS
O�using
�stand
ard�
protoc
ols.�
2004
SI
Grid�Au
tomation�Tran
smission
Integrated
�Sys
tem
38DataH
ub�project
Energine
t.dk
,��(TSO
),�
(DK)
A�more�free
�com
petition
�in�th
e�Dan
ish�elec
tricity�marke
t,�eas
ier�a
cces
s�to�
inform
ation,�and
�more�tran
sparen
cy�fo
r�con
sumers�who
�cho
ose�to�switch
�su
pplie
r,�a�de
sire�fo
r�more�stan
dardized
�com
mun
ication�be
twee
n�play
ers�
on�th
e�Dan
ish�elec
tricity�marke
t.
Apr�2
009�-�
Apr�2
012
DK
Smart�M
eter�and
�AMI
39Dec
entralized
�cus
tomer-lev
el�
unde
r�frequ
ency
�load
�she
d-ding
�in�Switze
rlan
d
Unive
rsity�of�
Applied�Sc
ienc
es,�
Nor
thwes
tern�Switze
r-land
�(CH)�
Swiss�Fe
deral�Ins
titute�
of�Tec
hnolog
y,�Zurich�
(CH)
The�projec
t�foc
uses
�on�a�sm
art�d
eman
d�side
�man
agem
ent�o
f�ho
useh
old�co
nsum
ers.�M
odern�co
mmun
ication�tech
nology
�ena
bles
�the�man
agem
ent�o
f�large
�group
s�of�distributed
�load
s�un
der�a
�single�
inno
vative
�con
trol�sch
emes
�to�use
�the�fle
xibility�of�electrica
l�loa
ds�fo
r�po
wer�sys
tem�purpo
ses.
Sept�201
0-Fe
b�20
12CH
Integrated
�Sys
tem
40Dem
and�resp
onse
�med
ium�
size
d�indu
stry�con
sumers
Dan
ish�Te
chno
logica
l�Institute,�(D
K)
To�in
vestigate�the�po
ssibility�of�introdu
cing
�flex
ible�electricity�dem
and�
and�regu
lation
�pow
er�in
�Dan
ish�Indu
stry�con
sumers�via�a�price-�and
�co
ntrol�s
igna
l�from�th
e�su
pplie
r�of�e
lectricity.�T
he�aim
�is�to
�dev
elop
�a�va
luab
le�solution�for�t
he�in
dustry�con
sumers�giving
�them
�various
�be
nefits�an
d�afterw
ards
�to�te
st�th
e�sy
stem
.
Jan�20
09�-�
Dec
�201
1DK
Integrated
�Sys
tem
41DER
-IREC
�22@
Microgrid
GTD
�Sistemas
�de�
Inform
acion�SA
�(ES)
DER
�-�IR
EC�22�@�M
ICRO
GRID
�is�a�re
search
�project�fo
cuse
d�to�create�
prod
ucts�and
�service
s�arou
nd�Distributed
�Ene
rgy�Re
source
s�(D
ER)�a
nd�
EV.�T
he�m
ain�go
al�is
�to�build�a�platform�w
here�re
search
�cou
ld�be�do
ne�
in�order�to
�integrate�all�tho
se�com
pone
nts�into�a�new
�sys
tem�of�e
nergy�
supp
ly.
Jun�20
09�-�
Nov
�201
1ES
�Integrated
�Sys
tem
42Dev
elop
men
t�of�E
arly�W
arning
�Sy
stem
s�(PMU/W
AMS)
Energine
t.dk
,��(TSO
),�
(DK)
The�pu
rpos
e�is�to
�dev
elop
�sys
tems�that�can
�mon
itor�th
e�ov
erall�p
ower�
system
�state�and
�alert�sys
tem�ope
rators�and
�other�protection�sy
stem
s�for�c
ritica
l�situa
tion
s�in�th
e�po
wer�sys
tem.
�200
6�-�2
012�
DK
Grid�Au
tomation�Tran
smission
43
Dev
elop
men
t�of�a
�Sec
ure,�
Econ
omic�and
�Env
iron
-men
tally
�friend
ly�M
odern�
Power�Sys
tem
Dep
artm
ent�o
f�Ene
rgy�
Tech
nology
-�Aalbo
rg�
Unive
rsity,�(D
K)
The�projec
t�dev
elop
s�a�nu
mbe
r�of�n
ew�con
cepts�an
d�intellige
nt�
approa
ches
�for�a
�mod
ern�po
wer�sys
tem�w
hich
�includ
es�re
newab
le�
energy
,�storage
�units,�d
istributed
�gen
eration,�plug-in�hyb
rid�elec
tric�
vehicles
.
Jan�20
10�-�
Dec
�201
4DK
Smart�M
eter�and
�AMI
Grid�Au
tomation�Distribution
Integrated
�Sys
tem

Pr
ojec
t nam
eO
rgan
izat
ion
nam
e B
rief
pro
ject
des
crip
tion
Peri
odCo
untr
y*Pr
ojec
t cat
egor
y
44DG�Dem
onet�
Smart�L
V�Grid
Austrian
�Institute�of�
Tech
nology
�(AT)
The�projec
t�aim
s�to�ena
ble�an
�efficien
t�and
�cos
t�effec
tive
�use
�of�e
xisting�
grid�in
fras
truc
tures�ba
sed�on
�a�th
ree-step
�con
cept:�intellig
ent�p
lann
ing,�
on-line�mon
itoring�an
d�ac
tive
�grid�man
agem
ent.�Com
mun
ication-ba
sed�
system
s�for�a
utom
atic�con
trol�con
cepts�for�low
�voltage
�networks
�will�be�
deve
lope
d�an
d�ev
alua
ted�by
�putting
�them
�into�practice.
Mar�201
1�-�
Mar�14
AT
Integrated
�Sys
tem
Grid�Au
tomation�Distribution
Smart�M
eter�and
�AMI
45DG��
Dem
onetz�Va
lidierung
AIT�Au
stria�(AT)
The�projec
t�“DG�Dem
oNet�–�Smart�L
V�Grid”
�sea
rche
s�for�s
olutions
�for�a
n�ac
tive
�network�op
eration�at�th
e�low�voltage
�leve
l.�Th
e�projec
t�dev
elop
s�an
d�ev
alua
tes�sm
art�p
lann
ing,�m
onitoring,�m
anag
emen
t�and
�con
trol�
approa
ches
�for�t
he�sys
tem�in
tegration�of�lo
cal�e
nergy�prod
uction
�an
d�fle
xible�load
s�in�lo
w�voltage
�networks
.�The
�project�objec
tive
�is�to
�so
lve�ab
ove�ch
alleng
es�w
ith�ac
ceptab
le�cos
ts�re
garding�inve
stmen
t,�
mainten
ance
�and
�ope
ration
.�
Jan�20
06�-�
Feb�20
13AT
Grid�Au
tomation�Distribution
46Dem
onstration
�project�Smart�
Charging
Enex
is�(N
L)
Test�and
�dem
onstrate�an�en
vironm
ent�in�which
�com
mercial�m
arke
t�pa
rties�are�en
abled�to�
prov
ide�ch
arge
�service
s�to�EV�cus
tomers�in�coo
peration
�with�EV
�infras
truc
ture�parties
�and
�grid�ope
rators.�
Sept�201
0-Dec
�201
1NL
Grid�Au
tomation�Distribution
Integrated
�Sys
tem
Hom
e�ap
plication�-�C
ustomer�
Beh
avior�
47Distributed
�con
nected
�wind�
farm
sES
B�Networks
�(IE)
This�project�com
prises
�three�inde
pend
ent�s
tran
ds,�a
ll�with�the�go
al�of�
enab
ling�max
imum
�wind�ge
neration
�pen
etration
�on �the�distribu
tion
�sy
stem
.
May
�200
9�-�
Apr�2
012
IEOther
48Distribution�Sy
stem
�plann
ing�
for�S
mart�G
rids
,�Forsk
ELRisø�DTU
,�(DK)
The�pu
rpos
e�of�th
e�projec
t�is�to�id
entify�limitations
�of�e
xisting�simulation�
and�plan
ning
�tools�for�d
istribution�grids,�w
ith�a�pa
rticular�fo
cus�on
�the�
challeng
es�im
pose
d�by
�the�introd
uction
�of�S
mart�G
rid�tech
nologies
.
Mar�201
1�-�
Jul�2
012
DK
Other
49DLC
+VIT4IP
Kema�Ned
erland
�BV�
(NL)
DLC
+VIT4IP�will�dev
elop
,�verify
�and
�test�a�high-sp
eed�na
rrow
-ban
d�po
wer�line
�com
mun
ications
�infras
truc
ture�using
�the�Internet�Protoco
l�(IP)�
which
�is�cap
able�of�s
uppo
rting�ex
isting
�and
�exten
ding
�new
�and
�multiple�
commun
ication�ap
plications
.�The
se�sha
ll�includ
e�the�ex
isting
�pow
er�
distribu
tion
�network�for�n
ovel�service
s�in�smart�e
lectricity�distribution�
netw
orks
�suc
h�as
�dem
and�side
�man
agem
ent,�con
trol�of�d
istributed
�ge
neration
�and
�cus
tomer�in
tegration.
Jan�20
10�-�
Jan�20
13
DE
Other
AT UK
NL IT BE IL

Pr
ojec
t nam
eO
rgan
izat
ion
nam
e B
rief
pro
ject
des
crip
tion
Peri
odCo
untr
y*Pr
ojec
t cat
egor
y
50DSO
-pilo
t�project
SydE
nergi,��(D
SO),�
(DK)
The�test�w
ill�be�the�ba
sis�to�better�u
tiliz
ation�of�in
form
ation�from
�the�
netw
ork,�fo
r�exa
mple.�fo
r�fas
ter�a
ction�by
�mistake
s�an
d�to�re
duce
�the�
outage
.�Fur
thermore�it�allo
ws�for�a
utom
ation�by
�switch
ing�on
�failu
re.
2009
-201
0DK
Smart�M
eter�and
�AMI
51�DSO
-Pilo
t�project�-�Au
tomatic�
rece
ipt�o
f�sho
rt�circu
iting�
indica
tors
Not�ava
ilable
Automatic�re
ceipt�o
f�sho
rt-circu
iting�indica
tors�from
�the�10
�kV�grid�
ensu
res�rapid�inform
ation�to�th
e�du
ty�office
r�in�the�ev
ent�o
f�high-vo
ltag
e�faults.
Jun�20
09�-�
Dec
�201
0DK
Smart�M
eter�and
�AMI
52Dyn
amic�ta
riffs
Not�ava
ilable
To�in
vestigate�the�op
portun
ities�for�a
nd�effec
ts�of�c
hang
ed�ta
riffs�for�
elec
tricity�with�the�sp
ecial�o
bjec
tive
�of�b
etter�integ
ration
�of�ren
ewab
le�
energy
�from
,�amon
g�othe
r�thing
s,�eve
r-increa
sing
�wind�po
wer�produ
ction.
Jan�20
10�-�
Jun�20
10DK
Other
53Ea
sy�Stree
tEn
exis�(N
L)Insigh
t�into�the�working
s�of�te
chno
logy
,�inc
entive
s�an
d�interaction�in�
orde
r�to�mob
ilize
�flex
ibility�from
�cus
tomer’s�electricity�usa
ge.
Jan�20
11-Jun
�20
14NL
Integrated
�Sys
tem
Hom
e�ap
plication�-�C
ustomer�
Beh
avior�
54Ec
oGrid�Den
mark,�Forsk
ELDan
ish�Te
chno
logica
l�Institute,�(D
K)
To�dev
elop
�new
�long
�term
�tech
nologies
�and
�marke
t�solutions
�for�p
ower�
system
s�with�increa
sed�sh
are�of�distributed
�gen
eration�an
d�rene
wab
le�
energy
�sou
rces
�while�m
aintaining
�the�relia
bility�of�sup
ply.
May
�200
7�-�
Apr�2
009
DK
Integrated
�Sys
tem
Grid�Au
tomation�Distribution
Smart�M
eter�and
�AMI
55Ec
oGrid�EU
Energine
t.dk
,�(DK)
To�build�and
�dem
onstrate�a�com
plete�prototyp
e�of�th
e�future�pow
er�
system
�with�more�than
�50%
�rene
wab
le�ene
rgy.�The
�primary�focu
s�is�on�
marke
t�integ
ration
�and
�inclus
ion�of�electricity�cus
tomers�in�th
e�bu
ilding�
of�to
morrows�Sm
art�G
rid.
Jan�20
11�-�
Dec
�201
4DK
Integrated
�Sys
tem
Grid�Au
tomation�Distribution
Smart�M
eter�and
�AMI
56ED
ISON
Dan
ish�En
ergy
�As
sociation,�(D
K)
The�projec
t�will�ass
ess�the�introd
uction
�of�e
lectrica
l�veh
icles�in�th
e�Dan
ish�elec
tricity�sy
stem
�and
�dev
elop
�fram
eworks
�and
�tech
nica
l�so
lution
s�that�ena
ble�a�more�wide-sc
ale�de
mon
stration
.�The
�solutions
�mus
t�allo
w�th
e�elec
trical�veh
icles�to�be�ch
arge
d�intellige
ntly�in
�term
s�of�
system
�stability�an
d�bo
ttlene
cks�in�th
e�loca
l�electricity�grid.
Feb�20
09�-�
Dec
�201
1DK
Grid�Au
tomation�Distribution
Smart�M
eter�and
�AMI
57E-DeM
aRW
E�RW
N,�(DE)
The�go
al�of�E
-DeM
a�is�to
�reac
h �more�en
ergy
�ben
efits�and
�efficien
cy�fo
r�elec
tricity�ge
nerators,�m
unicipal�utilities,�dev
ice�man
ufac
turers�and
�ab
ove�all�c
ustomers.
2009
-201
4DE
Integrated
�Sys
tem
Hom
e�ap
plication�-�C
ustomer�
Beh
avior�

Pr
ojec
t nam
eO
rgan
izat
ion
nam
e B
rief
pro
ject
des
crip
tion
Peri
odCo
untr
y*Pr
ojec
t cat
egor
y
58E-En
ergy
�Project�“MeR
egio”
EnBW�Ene
rgie�Bad
en-
Wür
ttem
berg�AG�
(EnB
W)(DE)
The�Projec
t�MeR
egio�aim
s�to�dem
onstrate�th
at�a�shift�from
�the�pres
ent�
day�po
wer�sup
ply�sy
stem
�to�“minim
um�emission
�region
s”�is
�pos
sible�by
�intellige
ntly�com
bining
�tech
nica
l�ene
rgy�man
agem
ent�a
nd�in
nova
tive
�ICT.
2008
-201
2DE
Integrated
�Sys
tem
59eF
lex
DONG�Ene
rgy,�(D
SO),�
(DK)
The�pu
rpos
e�of�eFlex
�project�is
�to�gain�ex
perien
ce�w
ith�mob
iliza
tion
�of�
private�cu
stom
ers’�flex
ible�ene
rgy�co
nsum
ption,�esp
ecially
�from
�electric�
cars,�e
lectric�he
ating�an
d�he
at�pum
ps.
2010
�-�20
11DK
Grid�Au
tomation�Distribution
Smart�M
eter�and
�AMI
60Elec
trical�veh
icles�
impa
cts�on
�the�grids
Ores�(B
E)Mea
suremen
ts�and
�mod
els�of�im
pact�of�e
lectrica
l�veh
icles�slow
�and
�fast�
charging
�on�the�Ores�grid.
Sept�201
0�-�
Dec
�201
1BE
Grid�Au
tomation�Distribution
Hom
e�ap
plication�-�C
ustomer�
Beh
avior�
61Elec
tricity�de
man
d�as
�freq
uenc
y�co
ntrolle
d�re-
serves
,�ENS�
CET-DTU
,�(DK)
Throug
h�11�w
ork�pa
ckag
es,�inc
luding
�hardw
are,�des
ign,�dev
elop
men
t,�
labo
ratory�te
st,�p
ractical�im
plem
entation
,�data�an
alys
es,�e
tc.,�a�
tech
nology
�will�be�de
velope
d�in�w
hich
�the�elec
tricity�co
nsum
ption�will�be�
used
�as�a�freq
uenc
y-co
ntrolle
d�rese
rve�(D
FR).
Apr�2
009�-�
Mar�201
2DK
Integrated
�Sys
tem
62Elec
tricity�de
man
d�as
�freq
uenc
y�co
ntrolle
d�re-
serves
,�Forsk
ELCE
T-DTU
,�(DK)
The�projec
t�dev
elop
ed�te
chno
logy
�for�d
eman
d�freq
uenc
y�co
ntrolle
d�rese
rve�(D
FR)�implem
entation
,�a�sys
tem�th
at�autom
atically�stops
�or�starts�elec
tricity�co
nsum
ption�in�re
spon
se�to
�sys
tem�freq
uenc
y�va
riations
.
Apr�2
006�-�
Jun�20
08DK
Integrated
�Sys
tem
63Elec
tricity�storag
e�for�s
hort�
term
�pow
er�sys
tem�service
Materials�Res
earch�
Division�at�Riso�DTU
,�(D
K)
To�eva
luate �an
d�co
mpa
re�–�te
chnica
lly�and
�eco
nomically�–�th
e�av
ailable�
option
s�for�u
sing
�ded
icated
�electricity�storage
�units�to
�provide
�sho
rt�
term
�sys
tem�service
s�at�tran
smission
�sys
tem�le
vel�in�the�Dan
ish�po
wer�
system
.�
Mar�201
0�-�
Dec
�201
0DK
Spec
ific�Storag
e�Te
chno
logy
�Dem
onstration
64E-mob
ility
Enel�(IT)
E-mob
ility�Italy�en
ables�the�diffus
ion�an
d�the�us
e�of�electric�ve
hicles
,�with�state�of�th
e�art�rec
harging�tech
nologies
,�tha
nks�to�ad-ho
c�de
velopm
ent�o
f�rec
harging�infras
truc
ture,�o
ffering�intellige
nt�and
�sec
ure�
services
�and
�resp
ecting
�the�en
vironm
ent.�
Smart®
�Electric�ve
hicles
�will�be�prov
ided
�to�100
�cus
tomers�an
d�40
0�rech
arging
�station
s�(300
�pub
lic�station
s�an
d�10
0�ho
me�stations
)�will�be�
installed�by
�Ene
l�in�Ro
me,�M
ilan �an
d�Pisa
.�Th
e�ne
w�cha
rging�po
ints�w
ill�le
verage
�Ene
l’s�te
chno
logy
,�inc
luding
�the�En
el�smart�m
eter�as�a�ke
rnel�fo
r�providing
�all�ce
rtified
�metering�
func
tion
alities�an
d�gu
aran
teeing
�uniform
ity�with�rega
rd�to
�data�
acqu
isition�an
d�fin
al�cus
tomer�billing�man
agem
ent.
Dec
�200
8�-�
Dec
�201
3IT
Integrated
�Sys
tem
Daimler�(
DE)

Pr
ojec
t nam
eO
rgan
izat
ion
nam
e B
rief
pro
ject
des
crip
tion
Peri
odCo
untr
y*Pr
ojec
t cat
egor
y
65Elforsk�Sm
art�g
rid�prog
ramme
Elforsk�AB
�(SE)
Elforsk�Sm
art�G
rid�Prog
ram�is
�drive
n�as
�a�nationa
l�program
mer�fo
r�fou
r�ye
ars�with�fin
ancing
�and
�participa
ting
�from
�Swed
ish�utilities
�and
�other�
compa
nies
.�A�com
mon
�steering�grou
p�take
s�de
cision
�for�e
ach�projec
t/su
b�projec
t�in�the�prog
ram.��Th
e�no
rmal�delivery�from
�a�project�w
ill�be�
an�ope
n�repo
rt�ava
ilable�for�a
ll�pa
rticipan
ts�and
�normally�also�pu
t�on�
internet�as�a�pu
blic�doc
umen
t.�The
�program
�will�also�interact�w
ith�othe
r�large�pilot�p
rojects�as
�Stock
holm
�Roy
al�Sea
port�w
ith�Fo
rtum
�and
�ABB�and
�Gotland
�Smart�G
rid�projec
t�with�Va
tten
fall�an
d�AB
B.
Jan�20
11�-�
Dec
�201
4SE
Smart�M
eter�and
�AMI
Grid�Au
tomation�Tran
smission
Grid�Au
tomation�Distribution
Integrated
�Sys
tem
Hom
e�ap
plication�-�C
ustomer�
Beh
avior�
Spec
ific�Storag
e�Te
chno
logy
�Dem
onstration
Other
66Elec
tricity�for�r
oad�tran
spor
t,�
flexible�po
wer�sys
-tem
s�an
d�wind�po
wer
Risø�DTU
,�(DK)
The�projec
t�aim
s�to�ana
lyze
�the�interaction�be
twee
n�the�elec
tricity/
CHP�indu
stry�and
�the�tran
s-po
rt�in
dustry�in
�a�situa
tion
�of�inc
reas
ed�use
�of�electric�ca
rs�and
�plug-in�hyb
rid�ca
rs.�T
he�project�fo
cuse
s�on
�all�the�
tech
nica
l�asp
ects�in
�the�ch
ain:�th
e�status
�of�the
�electric�ca
r,�testing�of�
hybrid�cars�in�a�lo
cal�e
lectricity�grid,�con
nection�po
ints�as�well�a
s�the�
load
�and
�cap
acity�requ
irem
ents�of�the
�electricity�grid.
Jan�20
08�-�
Jan�20
11DK
Grid�Au
tomation�Distribution
Integrated
�Sys
tem
67E-mob
ility
ELM€-ÉM
ÁSZ�Nyrt., �
(HU)
To�get�fe
ed�bac
k�ab
out�c
ustomer’s�exp
ectation
s�for�e
€veh
icles�an
d�ch
arging
�infras
truc
ture.�To�ge
t�information�ab
out�c
harging�be
havior�
and�load
�profiles
.�Ana
lysis�of�re
quirem
ents�of�c
harging�infras
truc
ture.�
Defi
ning
�hom
e�ch
arging
�infras
truc
ture,�a
nd�dev
elop
ing�ne
w�ta
riffs.
Not�
Available�
HU
Integrated
�Sys
tem
Spec
ific�Storag
e�Te
chno
logy
�Dem
onstration
68EM
PORA�1�+�2�-�E
-Mob
ile�
Power�Aus
tria
VER
BUND�AG�(A
T)
The�em
porA
�projects�bring�toge
ther�autom
obile
�indu
stry,�infrastructure�
tech
nology
,�and
�ene
rgy�su
pply�sec
tors�in
�order�to
�ach
ieve
�a�com
plete�
system
�for�e
lectric�mob
ility�in
�a�use
r-oriented
�and
�internationa
l�co
ordina
ted�way
.
Jan�20
10�–�
Jun�20
14AT
Grid�Au
tomation�Distribution
Integrated
�Sys
tem
Spec
ific�Storag
e�Te
chno
logy
�Dem
onstration
69EN
ERGOZ
Institute�of��
Tech
nology
,�Slova
k�Ac
adem
y�of�Scien
ces,�
Bratislav
a,�(S
K)
Applied�rese
arch
�in�th
e�fie
ld�of�e
fficien
t�produ
ction,�use
�and
�storage
�of�
energy
�from
�rene
wab
le�sou
rces
.�Max
imizing�the�so
cio�-�e
cono
mic�effec
t�of�th
e�rese
arch
�in�th
e�fie
ld�of�ren
ewab
le�ene
rgy.
May
�201
0-May
�201
3SK
Integrated
�Sys
tem

Pr
ojec
t nam
eO
rgan
izat
ion
nam
e B
rief
pro
ject
des
crip
tion
Peri
odCo
untr
y*Pr
ojec
t cat
egor
y
70En
ergy
�@�hom
e
Inde
sit�(IT)
“Ene
rgy@
Hom
e”�project�aim
s�to�dev
elop
�a�sys
tem�in
�which
�“sm
art�
applianc
es”�ca
n�man
age�them
selves
�by�ad
justing�po
wer�con
sumption�
depe
nding�on
�pow
er�sup
ply�an
d�prices
,�or�in�orde
r�to�av
oid�ov
erload
s�within�the�ho
use.�
In�add
ition�En
ergy
@Hom
e�prov
ides
�inform
ation�to�th
e�us
er,�s
uch�as
�po
wer�con
sumption�of�app
lianc
es,�h
ourly�co
st�of�e
nergy,�green
�leve
l�of�
the�en
ergy
�being
�sup
plied;�th
is�in
form
ation�is�m
ade�av
ailable�on
�the�
user’s�PC,�m
obile
�or�o
n�the�disp
lay�of�th
e�ap
plianc
e.
Jan�20
09�-�
Dec
�201
1IT
�Hom
e�ap
plication�-�C
ustomer�
Beh
avior�
Enel�Distribuz
ione
�(IT)
Smart�M
eter�and
�AMI
Teleco
m�Italia�(IT)
Integrated
�Sys
tem
Elec
trolux
�(IT)
71En
ergy
�Forec
ast,�Forsk
EL�
Rambø
ll,�(D
K)
The�pu
rpos
e�of�th
is�project�is
�to�add
ress
�the�follo
wing�ba
rriers:�1
.�Lac
k�of�
suitab
le�pow
er�sup
ply�ag
reem
ents,�m
eeting
�both�the�clients’�dem
and�for�
cost�stability�an
d�-�a
t�the
�sam
e�time�-�e
ncou
rage
s�a�de
man
d�resp
onse
.�2.�Lac
k�of�in
form
ation�an
d�aw
aren
ess�ab
out�the
�pos
sibilities�an
d�op
portun
ities�of�dem
and�resp
onse
.
Feb�20
07�-�
Mar�201
0DK
Smart�M
eter�and
�AMI
Hom
e�ap
plication�-�C
ustomer�
Beh
avior�
72E-price
Eind
hove
n�Unive
rsity�
of�Tec
hnolog
y�(N
L)
This�project�propo
ses�an
�adv
ance
d�ICT�an
d�co
ntrol�framew
ork�for�
ancilla
ry�service
s�(res
erve
�cap
acity)�w
hich
�allo
ws�a�more�intellige
nt�
solution
�by�giving
�con
sumers�an
d�prod
ucers�clea
r,�real-tim
e�fin
ancial�
ince
ntives
�to�ada
pt�th
eir�c
onsu
mption/
prod
uction
�according
�to�th
e�ac
tual�
need
s�of�th
e�po
wer�sys
tem.�T
his�de
man
d-side
�man
agem
ent�is�be
ing�
mad
e�po
ssible�by�the�large�sc
ale�introd
uction
�of�S
mart�m
eters.�
Feb�20
10�-�
Feb�20
13
NL
Grid�Au
tomation�Tran
smission
IT
Grid�Au
tomation�Distribution
CH
73ES
B�Smart�M
eter�Projects
Elec
tricity�Su
pply�
Boa
rd�-�Networks
�(IE)
The�projec
t�aim
s�at:�-�ass
essing
�the�im
pact�of�T
ime�of�Use
�pricing
�and
�billing
/information�stim
uli�o
n�the�Cu
stom
er�Beh
avior;�-�as
sess
ing�the�
available�tech
nologies
�for�A
MI�roll�o
ut�in
�an�Irish�co
ntex
t.�The
�abo
ve�w
ill�
inpu
t�to�the�co
st�ben
efit�a
nalysis�for�t
he�fu
ll�roll�ou
t�of�A
MI�in�Irelan
d.
Jan�20
09�-�
Apr�2
011
IE
Smart�M
eter�and
�AMI
Hom
e�ap
plication�-�C
ustomer�
Beh
avior �
74ES
TER,�E
nel�integ
rated�
System
�for�T
Ests�on�stoR
age
ENEL
,�(IT)
Not�ava
ilable
Apr�2
009�-�
Apr�2
013
ITSp
ecific�Storag
e�Te
chno
logy
�Dem
onstration
75E-tellige
nce
EWE�AG
�(DE)
The�idea
�beh
ind�eT
ellig
ence
�is�th
e�intellige
nt�sys
tem�in
tegration�of�
elec
tricity�ge
neration
�and
�con
sumption.�To�this�aim
,�the
�project�w
ill�
deve
lop�an
d�fie
ld-tes
ts:�•
�a�re
gion
al�m
arke
t�place
�for�e
lectricity;�•
�feed
back
�sys
tems,�ta
riffs�an
d�ince
ntive�prog
rams;�•�pow
er�gen
eration�
and�de
man
d�side
�con
trol�sys
tems;�•�m
odern�ICT�an
d�internationa
l�stan
dards.
Nov
�200
9�-�
Oct�201
2DE
Integrated
�Sys
tem
Smart�M
eter�and
�AMI
Hom
e�ap
plication�-�C
ustomer�
Beh
avior�

Pr
ojec
t nam
eO
rgan
izat
ion
nam
e B
rief
pro
ject
des
crip
tion
Peri
odCo
untr
y*Pr
ojec
t cat
egor
y
76ET
M�(D
istribution�Network�
Automation�on
�10�
kV�cab
le�line
�station
s)
ELM�
Hálóz
ati�K
ft.�
(HU)
Nea
rly�76
0�piec
es�of�1
0�kV
�switch
ing�stations
�(on�ca
ble�ne
tworks
)�will�be�
equipp
ed�by�RT
Us,�to
�provide
�remote�ob
servab
ility�and
�remote�co
ntrol.�
The�co
mmun
ication�(con
nection)�is
�estab
lishe
d�via�GSM
�network.
2009
-201
3HU
Grid�Au
tomation�Distribution
77EU
-DEE
PGDF�Su
ez�(F
R)
The�projec
t�bring
s�toge
ther�eight�Europ
ean�en
ergy
�utilities�an
d�aims�
at�re
mov
ing�mos
t�of�the
�tech
nica
l�and
�non
-tec
hnical�barriers�that�
prev
ent�a
�mas
sive
�dep
loym
ent�o
f�distributed
�ene
rgy�reso
urce
s�(D
ER)�
in�Europ
e.�In
�partnersh
ip�w
ith�man
ufac
turers,�res
earch�orga
niza
tion
s,�
profes
sion
als,�nationa
l�age
ncies�an
d�a�ba
nk,�the
y�im
plem
ented�a�
deman
d-pu
ll�rather�th
an�te
chno
logy
-pus
h�ap
proa
ch.�T
his�ne
w�app
roac
h�prov
ided
�three�tentative�“fas
t-trac
ks�options
”�to�spe
ed�up�the�large-sc
ale�
implem
entation
�of�D
ER�in
�Europ
e,�by�de
fining�three�client�por
tfolios�in�
variou
s�marke
t�seg
men
ts�w
hich
�cou
ld�ben
efit�from�DER
�solutions
,�and
�by�
fostering�the�R&D�re
quired
�to�ada
pt�DER
�tech
nologies
�to�th
e�de
man
ds�of�
thes
e�se
gmen
ts.�
Jan�20
04�-�
Jun�20
09
FR
Integrated
�Sys
tem
EL UK
DE
BE
ES�
SE PL LV AT HU IT FI CY CZ TR
78EV
COM
Energine
t.dk
,��(TSO
),�
(DK)
The�prim
ary�pu
rpos
e�is�to
�estab
lish�a�co
ncep
t�for�electric�ve
hicles
�and
�their�c
ommun
ication�with�the�po
wer�sys
tem.�T
he�con
cept�disse
minated
�to�th
e�stan
dardization�work�an
d�to�re
leva
nt�stake
holders.
Jan�20
08�-��
Dec
�201
0DK
Smart�M
eter�and
�AMI
Integrated
�Sys
tem

Pr
ojec
t nam
eO
rgan
izat
ion
nam
e B
rief
pro
ject
des
crip
tion
Peri
odCo
untr
y*Pr
ojec
t cat
egor
y
79EV
�Network�integration
ESB�Networks
�(IE)
This�project�w
ill�ta
ke�tw
o�typica
l�LV�(2
20V)�c
ircu
its,�one
�urban
�and
�on
e�rural,�an
d�will�exa
mine�in�detail�throu
gh�m
odeling�an
d�throug
h�de
mon
stration
,�the
�impa
ct�of�E
V’s�on�the�ne
twork.
Dec
�200
9�-�
Dec
�201
2IE
Hom
e�ap
plication�-�C
ustomer�
Beh
avior�
Spec
ific�Storag
e�Te
chno
logy
�Dem
onstration
Other
80EW
IS�-�Eu
rope
an�w
ind�
integration�stud
y
ELIA�SYS
TEM�
OPE
RAT
OR�SA�(B
E)
The�projec
t�aim
s�to�w
ork�with�all�the
�releva
nt�stake
holders�es
pecially�
repres
entative
s�of�w
ind�ge
neration
�dev
elop
ers.�The
�study
�will�use
�resu
lts�
from
�detailed�ne
twork�an
d�marke
t�mod
els�of�th
e�Eu
rope
an�tran
smission
�sy
stem
�for�s
cena
rios
�repres
enting
�immed
iate�and
�long
er-term�nee
ds.�
The�reco
mmen
dation
s�will�be�aimed
�at �d
evelop
ing,�w
here�pos
sible�an
d�ap
prop
riate,�com
mon
�Europ
ean�so
lution
s�to�w
ind�integration�ch
alleng
es.
Jun�20
07-
Oct�200
9
BE
Other
AT DE
FR PT ES�
PL UK EL IE DK CZ NL
81ew
z-Stud
ie�Smart�M
etering
ewz�-�E
lektrizitätswerk�
der�S
tadt�Zürich�(CH)
Cond
ucting
�a�field�ex
perimen
t�to�prov
ide�ba
sic�da
ta�fo
r�dec
ision�mak
ing,�
whe
ther�or�n
ot�to
�roll�ou
t�hom
e�ap
plications
.Jul�2
010-Dec
�20
12CH
Hom
e�ap
plication�-�C
ustomer�
Beh
avior�

Pr
ojec
t nam
eO
rgan
izat
ion
nam
e B
rief
pro
ject
des
crip
tion
Peri
odCo
untr
y*Pr
ojec
t cat
egor
y
82Fe
nix
Iberdrola�Distribuc
ion�
(ES)
The�ob
jective�of�FEN
IX�is
�to�boo
st�DER
�(Distributed
�Ene
rgy�Re
source
s)�
by�m
axim
izing�their�c
ontribution�to�th
e�elec
tric�pow
er�sys
tem,�throu
gh�
aggreg
ation�into�Large
�Sca
le�Virtual�Pow
er�Plants�(LSV
PP)�a
nd�
dece
ntraliz
ed�m
anag
emen
t.�The
�project�is
�organ
ized
�in�th
ree�ph
ases
:�§�Ana
lysis�of�th
e�DER
�con
tribution�to�th
e�elec
trical�sys
tem,�a
sses
sed�
in�tw
o�future�sce
narios
�(Nor
thern�an
d�So
uthe
rn)�w
ith�realistic�DER
�pe
netration;�§�Dev
elop
men
t�of�a
�laye
red�co
mmun
ication�an
d�co
ntrol�
solution
�validated
�for�a
�com
preh
ensive
�set�of�n
etwork�us
e�ca
ses�,�
includ
ing�no
rmal�and
�abn
ormal�ope
ration
,�as�well�a
s�reco
mmen
dation
s�to�ada
pt�in
ternationa
l�pow
er�stand
ards
;�§�Validation�throug
h�2�large�fie
ld�
deploy
men
ts,�o
ne�fo
cuse
d�on
�dom
estic�CH
P�ag
greg
ation,�and
�the�se
cond
�ag
greg
ating�large�DER
�in�LSV
PPs�(w
ind�farm
s,�in
dustrial�cog
eneration),�
integrated
�with�glob
al�network�man
agem
ent�a
nd�m
arke
ts.
Oct�05�-�O
ct�
2009
ES�
Integrated
�Sys
tem
UK SI
AT DE
NL
FR RO
83Fieldtrail�Mob
ile�Smart�G
rid
Enex
is�(N
L)Dem
onstrate�an�ea
rlier�t
ested�proo
f-of-con
cept�(P
oC)�for�dem
and�
resp
onse
�with�on
e�EV
�on�multiple�EV
s�an
d�ch
arge
�spo
ts�in
�one
�loca
tion
�ba
sed�on
�individu
al�drive
r�dem
ands
.
Apr�2
010-
Apr�2
011
NL
Grid�Au
tomation�Distribution
Integrated
�Sys
tem
84Flex
com,�F
orsk
EL�
Risø�DTU
,�(DK)
The�projec
t�aim
s�at�produ
cing
�a�con
ceptua
l�framew
ork�for�t
he�unifie
d�an
d�ex
tens
ible�re
pres
entation
�and
�exc
hang
e�of�pow
er�sys
tem�in
form
ation�
and�da
ta,�it�w
ill�fo
cus�on
�con
cept�des
ign�an
d �proo
f-of-con
cept�te
sting,�to
�prov
ide�inpu
t�to�the�ex
isting
�stand
ardiza
tion
�effor
t.
Jun�20
08�-�
May
�201
0DK
Grid�Au
tomation�Distribution
85Flex
�pow
er�-�pe
rspe
ctives
�of�
indirect�pow
er�sys
tem�con
trol�
throug
h�dy
namic�pow
er�price
EA�ene
rgiana
lyse
,�(DK)
The�aim�of�the
�project�is
�to�dev
elop
,�tes
t,�ana
lyze
�persp
ective
s�of,�
iden
tify�cha
lleng
es�by,�eva
luate�an
d�reco
mmen
d�on
�metho
dologies
�to�
use�dy
namic,�b
road
casted
,�rea
l-time�po
wer�price
’s)�for�in
direct�con
trol�
of�th
e�individu
al�pow
er�flow
�of�m
any,�small,�intellige
nt�and
�con
trollable�
power�units�in
�the�po
wer�sys
tem.
Jun�20
10�-�
Jun�20
13DK
Integrated
�Sys
tem
Smart�M
eter�and
�AMI
Grid�Au
tomation�Distribution
86From
�wind�po
wer�to
�hea
t�pu
mps
Energine
t.dk
,��(TSO
),�
(DK)
Tto�co
ntrol�3
00�in
tellige
nt�hea
t�pum
ps�as�if �they
�were�on
e�big�en
ergy
�storag
e�facility�ca
pable�of�storing
�electricity�as�he
at.
Nov
�200
9�-�
Dec
�201
1DK
Integrated
�Sys
tem
Smart�M
eter�and
�AMI

Pr
ojec
t nam
eO
rgan
izat
ion
nam
e B
rief
pro
ject
des
crip
tion
Peri
odCo
untr
y*Pr
ojec
t cat
egor
y
87G4V
�-�Grid�for�V
ehicles
RWE�RHEINLA
ND�
WES
TFALE
N�NET
Z�AG
�(D
E)
The�projec
t�of�the
�G4V
�con
sortium�w
ill�gen
erate�fast�and
�ope
nly�av
ailable�
resu
lts:�an�an
alytical�fram
ework�to�eva
luate�the�im
pact�of�a
�large�sc
ale�
introd
uction
�on�the�grid�in
fras
truc
ture�and
�a�visiona
ry�“road
�map
”�for�t
he�
year�202
0�an
d�be
yond
.
Jan�20
10�-�
Jun�20
11
ES�
Other
PT NL
FR DE
SE IT UK
88GAD
Iberdrola�Distribuc
ion�
(ES)
The�fir
st�aim
�of�the
�GAD
�Dem
and�Side
�Man
agem
ent�P
roject�is
�to�optim
ize�
elec
trical�ene
rgy�co
nsum
ption�an
d�its�as
sociated
�cos
ts�at�d
omes
tic�leve
l,�while�m
eeting
�con
sumer�nee
ds�and
�maintaining
�qua
lity�stan
dards.
Jan�20
07�-�
Dec
�201
0ES
�
Smart�M
eter�and
�AMI
Integrated
�Sys
tem
Hom
e�ap
plication�-�C
ustomer�
Beh
avior�
89Gen
eric�virtual�pow
er�plant�
for�o
ptim
ized
�micro�CHP�
operation�an
d�integration
CET-DTU
,�(DK)
To�dev
elop
,�tes
t,�validate�an
d�ev
alua
te�a�nov
el�con
trol�architecture�for�
optimized
�ope
ration
�and
�sea
mless
�integration�of�m
icro�CHP�ba
sed�on
�a�
gene
ric�virtua
l�pow
er�plant�(V
PP)�c
once
pt.�T
he�con
cept�sha
ll�prov
ide�a�
foun
dation
�for�future�op
eration�an
d�integration�of�m
icro�CHP.
Sept�200
7�-�
Dec
�201
0DK
Smart�M
eter�and
�AMI
Grid�Au
tomation�Distribution
90Grid4
EUER
DF�(FR)
Grid4
EU�is
�led�by
�a�group
�of�E
urop
ean�DSO
s�an
d�aims�at�te
sting�in�re
al�
size
�som
e�inno
vative
�sys
tem�con
cepts�an
d�tech
nologies
�in�order�to
�high
light�and
�help�to�re
mov
e�so
me�of�th
e�ba
rriers�to
�the�sm
art�g
rids
�de
ploy
men
t �(tech
nica
l,�ec
onom
ic,�s
ocietal,�en
vironm
ental�o
r�reg
ulatory).�
It�fo
cuse
s�on
�how
�DSO
s�ca
n�dy
namically�m
anag
e�elec
tricity�su
pply�and
�de
man
d,�w
hich
�is�crucial�fo
r�integ
ration
�of�large
�amou
nts�of�re
newab
le�
energy
,�and
�empo
wers�co
nsum
ers�to�bec
ome�ac
tive
�participa
nts�in�th
eir�
energy
�cho
ices
.
Apr�2
011�-�
Apr�1
5
DE
Integrated
�Sys
tem
SE
ES�
IT CZ FR

Pr
ojec
t nam
eO
rgan
izat
ion
nam
e B
rief
pro
ject
des
crip
tion
Peri
odCo
untr
y*Pr
ojec
t cat
egor
y
91Grid-integration�of�Electricity�
Storag
e
Frau
nhofer-
Ges
ellsch
aft�z
ur�
Förderun
g�de
r�an
gewan
dten
�Fo
rsch
ung�e.V.�(F
hG),�
(DE)
Not�ava
ilable�
Apr�2
009�-�
Mar�201
1DE
Integrated
�Sys
tem
92Grid�Integration�of�O
ffsh
ore�
Windp
arks
Frau
nhofer-Ins
titut�
für�W
inde
nergie�und
�En
ergies
ystemtech
nik�
(IWES
),�(D
E)
With�the�WCM
S�the�sc
attered�wind�farm
s�ha
ve�bee
n�co
mbine
d�in�to
�a�clus
ter�a
nd�th
e�co
ntrol�roo
m�of�the
�releva
nt�network�op
erator�is
�co
ntrolle
d�ce
ntrally
.�While�th
e�wind�farm
�cluster�m
anag
emen
t�sys
tem,�
prov
ides
�calcu
lus�for�t
he�fo
reca
sting�so
ftware�wind�po
wer�m
anag
emen
t�sy
stem
�using
�artificial�neu
ral�n
etworks
�bas
ed�on�wea
ther�fo
reca
sts.
Jul�2
008-Jun�
2011
DE
Integrated
�Sys
tem
93GRO
W-D
ERS�Dem
onstration
�of�Grid�Co
nnec
ted�Elec
tricity�
System
sKEM
A�(N
L)Th
e�GRO
W-D
ERS�projec
t�(Grid�Re
liability�an
d�Ope
rability�with�Distributed
�Gen
eration�us
ing�Flex
ible�Storage
)�inv
estiga
tes�the�im
plem
entation
�of�
(trans
portab
le)�d
istributed
�storage
�sys
tems�in�th
e�ne
tworks
.�
Jul�2
009�-�Jul�
2011
FR
Spec
ific�Storag
e�Te
chno
logy
�Dem
onstration
DE
ES�
NL
94Harz.EE
-Mob
ility
Unive
rsity�Mag
debu
rg�
(DE)
The�Harz.EE
-mob
ility�project�aim
s�to�harne
ss�as�muc
h�of�th
is�re
newab
le�
energy
�as�po
ssible�to
�enh
ance
�pas
seng
er�m
obility.�B
y�do
ing�so
,�the
�projec
t�also�aims�to�ens
ure�the�stab
ility�of�e
nergy�ne
tworks
,�to�bo
ost�
econ
omic�perform
ance
,�and
�to�fo
ster�ene
rgy�se
curity�and
�clim
ate�
protec
tion
.
Aug�20
09-
Jul�2
011
DE
Integrated
�Sys
tem
Hom
e�ap
plication�-�C
ustomer�
Beh
avior�
95Hea
t�Pum
ps�as�an
�active�tool�
in�th
e�en
ergy
�sup
ply�sy
stem
,�Fo
rskE
L�
Dan
ish�Te
chno
logica
l�Institute,�(D
K)
Hea
t�pum
ps�w
ill�provide
�flex
ibility�due
�to�th
e�po
ssibility�to
�eithe
r�increa
se, �d
ecreas
e�or�in
terrup
t�the
�pow
er�con
sumption.�The
�project�w
ill�
deal�w
ith�the�ab
ility�of�h
eat�p
umps
�to�ope
rate�in
�so-ca
lled�Virtua
l�Pow
er�
Plan
ts,�to�de
liver�re
gulating
�pow
er�and
�to�re
act�o
n�sp
ot-m
arke
t�electricity�
prices
.
Apr�2
010�-�
Jul�2
012
DK
Integrated
�Sys
tem
96HiperDNO
Brune
l�Unive
rsity�UK)
The�aim�of�this�rese
arch
�project�is
�to�dev
elop
�a�new
�gen
eration�of�
distribu
tion
�network�man
agem
ent�s
ystems�that�exp
loits�no
vel�n
ear�
to�re
al-tim
e�HPC
�solutions
�with�inhe
rent�sec
urity�an
d�intellige
nt�
commun
ications
�for�s
mart�d
istribution�ne
twork�op
eration�an
d�man
agem
ent.�Cos
t�effec
tive
�sca
lable�HPC
�solutions
�will�be�de
velope
d�an
d�initially
�dem
onstrated�for�r
ealis
tic�distribu
tion
�network�da
ta�traffic
�an
d�man
agem
ent�s
cena
rios
�via�off-line �fie
ld�tr
ials�in
volving�se
veral�
distribu
tion
�network�ow
ners�and
�ope
rators.
Feb�20
10�-�
Jan�20
13
SI
Grid�Au
tomation�Distribution
ES�
UK FR DE IL

Pr
ojec
t nam
eO
rgan
izat
ion
nam
e B
rief
pro
ject
des
crip
tion
Peri
odCo
untr
y*Pr
ojec
t cat
egor
y
97HiT
Salzbu
rg�AG�(A
T)
A�de
mon
stration
�building�is�to
�be�plan
ned�an
d�co
nstruc
ted�as
�flag
ship�
projec
t,�in
�order�to
�inve
stigate�the�po
ssibilities
�and
�ben
efits�of�S
mart�
Grids
�in�con
nection�with�bu
ildings
,�which
�sho
uld�then
�be�brou
ght�to�the�
attention�of�th
e�broa
d�pu
blic�to
�mak
e�this�to
pic�visible�an
d�co
ncrete.�
Jan�20
08�-�
Jan�20
11AT
Integrated
�Sys
tem
98Hyd
roge
n�-�S
otav
ento�projects
Gas
�Natural�Fen
osa�
(ES)
The�main�go
al�is
�to�dem
onstrate�a�w
ind�po
wer�m
anag
emen
t�sys
tem�
base
d�on
�H2.�The
�installation
�prese
nted
�here�is�one
�of�the
�larges
t�globa
l�ca
pacities
,�whe
re�hyd
roge
n�is�use
d�in�th
e�en
ergy
�man
agem
ent�o
f�the
�prod
uction
�of�a
�wind�farm
.
2005
-201
1ES
�
Spec
ific�Storag
e�Te
chno
logy
�Dem
onstration
Integrated
�Sys
tem
99ICOEU
R�
TECH
NISCH
E�UNIVER
SITAE
T�DORT
MUND�(D
E)
The�de
velopm
ent�a
nd�prototypica
lly�im
plem
entation
�of�n
ew�m
etho
ds�and
�tools�is�th
e�major�goa
l�of�the
�ICOEU
R�project.�N
ew�te
chno
logies
�like
�Wide�
Area
�Mon
itoring,�Con
trol�and
�Protection�as
�well�a
s�ad
vanc
ed�network�
controlle
rs�(F
ACTS
)�and
�HVDC�sy
stem
s�will�be�co
nsidered
.�The
�project�
will�in
vestigate�sm
art�interco
nnec
tion
�betwee
n�co
ntinen
tal�E
urop
e�an
d�Rus
sian
�sys
tems.
Jan�20
09-
Dec
�201
1
IT
Grid�Au
tomation�Tran
smission
BE
EE SI
LV SE
UK
CH RU TR
100
IMPR
OSUME�-�T
he�Im
pact�of�
Pros
umers�in�a�Smart�G
rid�
base
d�En
ergy
�Marke
t�
Inku
bator�H
alde
n,�
Norweg
ian�Ce
nter�of�
Expe
rtise�for�E
nergy�
and�Em
ission
�Trading
�(N
O)
IMPR
OSUME�will�estab
lish�a�be
tter�und
erstan
ding
�of�the
�prosu
mer’s�ro
le�
in�th
e�future�pow
er�m
arke
t�sup
ported
�by�a�Sm
art�G
rid�an
d�as
sociated
�tech
nologies
.�The
�project�w
ill�add
ress
�stimuli�tha
t�are�like
ly�to
�motion�
cons
umers�to�ta
ke�an�ac
tive
�role�in
�the�marke
t�also�as
�sup
pliers.�
Oct�201
0�-�
Oct�201
1
NO
Other
CHIntegrated
�Sys
tem
DK
Other

Pr
ojec
t nam
eO
rgan
izat
ion
nam
e B
rief
pro
ject
des
crip
tion
Peri
odCo
untr
y*Pr
ojec
t cat
egor
y
101
Increa
sed�en
ergy
�sup
ply�
flexibility�an
d�effic
ienc
y�by
�us
ing�de
centraliz
ed�hea
t�pu
mps
�in�CHP�stations
Dan
ish�Te
chno
logica
l�Institute�(D
TU),�(D
K)
The�projec
t�dem
onstrates�the�ne
wly�dev
elop
ed�hea
t�pum
p�tech
nology
�in�fu
ll�sc
ale�at�tw
o�de
centraliz
ed�CHP�stations
.�Fur
thermore,�a�num
ber�
of�id
eas�co
ncerning
�the�integration�of�com
pres
sion
�hea
t�pum
ps�in
�the�
energy
�sys
tem�w
ill�be�tested
�via�sim
ulation�mod
els�an
d�also
�in�practice.�
Fina
lly,�h
eat�p
umps
�will�be�inve
stigated
�in�con
nection�with�redu
ction�of�
grid�lo
ss�in
�district�h
eating
�(20-40
%)�v
ia�ultra-cold�district�hea
ting
.
Feb�20
07�-�
Dec
�201
0DK
Integrated
�Sys
tem
102
Inform
ation�an
d�ed
ucation�of�
the�future�pow
er�con
sumer,�
ForskE
L
Østkraft�H
olding
�A/S
,�(D
SO),�(D
K)
This�project�fo
cuse
s�on
�cus
tomer�beh
avior�a
nd�w
hat�a
ctions
�are�nee
ded�
to�in
form
�the�cu
stom
er.�T
he�project�w
ill�re
sult�in
�broch
ures
,�a�new
�en
ergy
�con
sultan
cy�service
�and
�edu
cation
�of�tee
nage
rs�fo
llowing�a�yo
uth�
educ
ation�prog
rams.
Jan�20
11�-�
Dec
�201
4DK
Hom
e�ap
plication�-�C
ustomer�
Beh
avior�
103
�Inform
ation�from
�the�
elec
tricity�grid�-�remote�
read
ing
Not�ava
ilable
The�remote�read
ing�projec
t�in�ad
dition
�to�con
sumption�da
ta�also�mak
es�it�
poss
ible�to
�retrieve
�inform
ation�on
�con
sumption�pa
tterns
,�loa
ds,�v
oltage
�va
riations
.�The
se�are�all�related�initiative
s�to�ach
ieve
�smart�g
rid�so
lution
s�on
�the�low-voltage
�grid.
Not�
available
DK
Smart�M
eter�and
�AMI
104
INOVG
RID
EDP�Distribuc
ao�SA�
(PT)
INOVG
RID
�aim
s�at�re
plac
ing�the�cu
rren
t�LV�m
eters�with�elec
tron
ic�dev
ices
�ca
lled�En
ergy
�Box
es�(E
B),�using
�AMM�(A
utom
ated
�Meter�M
anag
emen
t)�
stan
dards.�The
se�EB�are�in
tegrated
�in�an�au
tomated
�third�ge
neration
�elec
trical�grid�(smart�g
rid)�in
�which
�network�de
vice
s�are�plac
ed�(D
TC)�
that�w
ill�m
anag
e�the�EB
�throug
h�ne
w�TI/SI�s
olutions
�by�ag
greg
ating�the�
gathered
�inform
ation�an
d�prov
iding�ne
w�service
s�to�con
sumers.
2007
�-�20
11PT
�Integrated
�Sys
tem
Hom
e�ap
plication�-�C
ustomer�
Beh
avior
105
Installation
�of�rem
otely�read
�elec
tricity�meters
Not�ava
ilable
Supp
ort�for�th
e�bu
sine
ss�fo
unda
tion
�of�the
�com
pany
,�and
�for�m
eeting
�tomorrow’s�re
quirem
ents�fo
r�settlem
ent�a
nd�visua
lization�of�electricity�
cons
umption�to�con
sumers.�The
�objec
tive
s�are:�preco
ndition�for�t
he�
introd
uction
�and
�settlem
ent�o
f�intellig
ent�s
olutions
�in�th
e�elec
tricity�
system
�of�the
�future.
2005
�-�20
10DK
Smart�M
eter�and
�AMI
106
INTE
GRAL
ECN,�E
nergy�rese
arch
�Ce
ntre�of�the
�Nethe
rlan
ds�(N
L)
The�IN
TEGRAL�projec
t�aim
s�to�build�and
�dem
onstrate�an�indu
stry-qua
lity�
referenc
e�so
lution
�for�D
ER�agg
rega
tion
-lev
el�con
trol�and
�coo
rdination,�
base
d�on
�com
mon
ly�ava
ilable�ICT�co
mpo
nents,�stand
ards
,�and
�platforms.
2009
-201
0
NL
Integrated
�Sys
tem
ES�
FR
107
Integrated
�Utilities�Bus
ines
s�Sy
stem
s
Enem
alta�Corpo
ration
�an
d�Water�Service
s�Co
rporation,�(M
T)
Replac
emen
t�of�2
50,000
�meters�with�sm
art�m
eters�an
d�im
plem
entation
�of�re
mote�man
agem
ent.�SCAD
A�for�v
oltage
�leve
ls�132
kV,�a
nd�33k
V.�
Reen
gine
ering�of�th
e�utilities
�proce
sses
.
Sept�200
8�-�
Sept�201
3MT
Smart�M
eter�and
�AMI
Grid�Au
tomation�Tran
smission
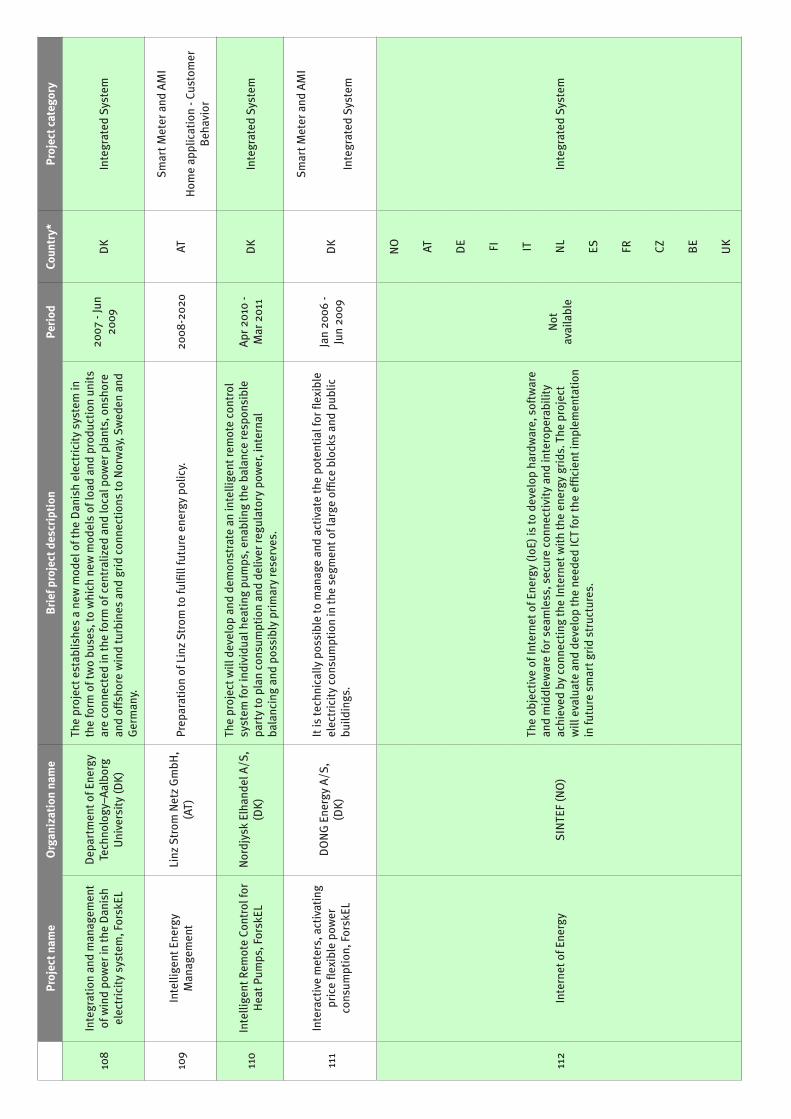
Pr
ojec
t nam
eO
rgan
izat
ion
nam
e B
rief
pro
ject
des
crip
tion
Peri
odCo
untr
y*Pr
ojec
t cat
egor
y
108
Integration�an
d�man
agem
ent�
of�w
ind�po
wer�in
�the�Dan
ish�
elec
tricity�sy
stem
,�Forsk
EL�
Dep
artm
ent�o
f�Ene
rgy�
Tech
nology
–Aalbo
rg�
Unive
rsity�(D
K)
The�projec
t�estab
lishe
s�a�ne
w�m
odel�of�the
�Dan
ish�elec
tricity�sy
stem
�in�
the�form
�of�two�bu
ses,�to
�which
�new
�mod
els�of�lo
ad�and
�produ
ction�un
its�
are�co
nnec
ted�in�th
e�form
�of�c
entralized
�and
�loca
l�pow
er�plants,�ons
hore�
and�offsho
re�w
ind�turbines
�and
�grid�co
nnec
tion
s�to�Norway
,�Swed
en�and
�German
y.
2007
�-�Jun�
2009
DK
Integrated
�Sys
tem
109
Intellige
nt�Ene
rgy�
Man
agem
ent�
Linz
�Strom
�Netz�GmbH
,�(AT)
Prep
aration�of�Linz�Strom�to
�fulfill�future�ene
rgy�po
licy.
2008
-202
0AT
Smart�M
eter�and
�AMI
Hom
e�ap
plication�-�C
ustomer�
Beh
avior�
110
Intellige
nt�Rem
ote�Co
ntrol�for�
Hea
t�Pum
ps,�F
orsk
EL�
Nordjys
k�Elha
ndel�A/S
,�(D
K)
The�projec
t�will�dev
elop
�and
�dem
onstrate�an�intellige
nt�re
mote�co
ntrol�
system
�for�ind
ividua
l�hea
ting
�pum
ps,�e
nabling�the�ba
lanc
e�resp
onsible�
party�to�plan�co
nsum
ption�an
d�de
liver�re
gulatory�pow
er,�interna
l�ba
lanc
ing�an
d�po
ssibly�primary�rese
rves
.�
Apr�2
010�-�
Mar�201
1DK
Integrated
�Sys
tem
111
Interactive�meters,�activating�
price�fle
xible�po
wer�
cons
umption,�Forsk
EL
DONG�Ene
rgy�A/
S,�
(DK)
It�is
�tech
nica
lly�pos
sible�to�m
anag
e�an
d�ac
tiva
te�th
e�po
tential�for�flex
ible�
elec
tricity�co
nsum
ption�in�th
e�se
gmen
t�of�large
�office
�block
s�an
d�pu
blic�
build
ings
.�
Jan�20
06�-�
Jun�20
09DK
Smart�M
eter�and
�AMI
Integrated
�Sys
tem
112
Internet�of�E
nergy
SIN
TEF�(N
O)
The�ob
jective�of�In
ternet�of�E
nergy�(IoE
)�is�to�dev
elop
�hardw
are,�softw
are�
and�middlew
are�for�s
eamless
,�sec
ure�co
nnec
tivity�and
�interope
rability�
achiev
ed�by�co
nnec
ting
�the�Internet�w
ith�the�en
ergy
�grids
.�The
�project�
will�eva
luate�an
d�de
velop�the�ne
eded
�ICT�for�t
he�efficien
t�implem
entation
�in�fu
ture�smart�g
rid�structures
.�
Not�
available
NO
Integrated
�Sys
tem
AT DE FI IT NL
ES�
FR CZ BE
UK

Pr
ojec
t nam
eO
rgan
izat
ion
nam
e B
rief
pro
ject
des
crip
tion
Peri
odCo
untr
y*Pr
ojec
t cat
egor
y
113
Introd
uction
�of�e
merge
ncy�
Dem
and�Side
�Res
pons
e�(D
SR)�
prog
rams
PSE�Ope
rator�S
.A.(PL
)
The�main�go
al�of�the
�pilo
t�project�is
�to�gain�prac
tica
l�exp
erienc
e�of�th
e�func
tion
ing�of�emerge
ncy�DSR
�program
s�in�Smart�G
rid/
smart�M
eters�
environm
ent.�This�ex
perien
ce�w
ill�be�us
ed�to
�dev
elop
�the�target�DSR
�prog
rams.
Jan�20
11-
Mar�201
2PL
Integrated
�Sys
tem
114
iPow
erRisø�DTU
,�(DK)
The�go
al�of�the
�platform�is
�to�con
tribute�to�th
e�de
velopm
ent�o
f�an�
intellige
nt�and
�flex
ible�electricity�sys
tem�cap
able�of�h
andling�a�large�pa
rt�
of�sus
tainab
le�electricity�produ
ction�in�areas
�whe
re�produ
ction�va
ries
�du
e�to�w
eather�con
dition
s�(sun
,�wind�etc).�
Jan�20
11�-�
Dec
�201
6DK
Smart�M
eter�and
�AMI
Grid�Au
tomation�Distribution
Integrated
�Sys
tem
115
IRIN
Verein�zur�Förde
rung
�de
r�wisse
nsch
aftliche
n�Fo
rsch
ung�(D
E)
The�rese
arch
�project�aim
s�to�dev
elop
�the�institutiona
l�framew
ork�that�
guides
�efficien
t�and
�effec
tive
�network�de
velopm
ent�tow
ards
�smart�g
rids
.Dec
�200
9-May
�201
1DE
Other
116
Isolve
s�PS
SA-M
Austrian
�Institute�of�
Tech
nology
�(AT)
The�ob
jective�of�th
e�projec
t�is�to�defi
ne�and
�dev
elop
�the�requ
ired
�tech
nica
l�fou
ndations
�to�ena
ble�an
�increa
sing
�num
ber�o
f�distributed
�en
ergy
�feed
-in�opp
ortunities
�in�LV�networks
.�For�th
is�purpo
se�a�m
etho
d�is�
deve
lope
d�to�ta
ke�an�instan
tane
ous�im
age�of�th
e�ne
twork,�th
e�so
-called�
“Pow
er�Sna
p-Sh
ot�Ana
lysis�by
�Meters”
,�and
�is�app
lied�toge
ther�w
ith�
adap
ted�sm
art�m
eters.�
Jul�2
009�-�
Jan�20
12AT
Smart�M
eter�and
�AMI
Integrated
�Sys
tem
117
Kybe
rnet
INEA
�d.o.o.�(SL
)Th
e�projec
t�objec
tive
�is�th
e�de
velopm
ent�o
f�a�sys
tem�prototype
�for�
control�o
f�ind
ustrial�loa
ds�and
�dispe
rsed
�electrica
l�pow
er�plants�on
�a�
distribu
tion
�electrica
l�grid.
Jan�20
09�-�
Jan�20
11SI
Grid�Au
tomation�Distribution
118
Large-sc
ale�de
mon
stration
�of�
charging
�of�e
lectric�ve
hicles
,�Fo
rskE
LCh
oosE
V�A/S
,�(DK)
Dev
elop
ing�of�Cho
osCO
M�fo
r�intellig
ent�c
harging�an
d�co
mmun
ication�
with�elec
tric�cars�an
d�is�te
st�it�by�24
00�fa
milies
�in�300
�EVs
.�Main�
inve
stigation�is�w
hether�it�is
�pos
sible�to�m
ove�the�ch
arge
�of�E
Vs�to
�a�
more�prod
uction
�and
�env
iron
men
tal�frien
dly�time�–�an
d�is�th
e�EV
�owne
r�interested
�in�it.
Jan�20
11�-�
Dec
�201
3DK
Smart�M
eter�and
�AMI
Integrated
�Sys
tem
119
LAST
BEG
�-�La
rge�Sc
ale�To
ol�
for�P
ower�Balan
cing
�in�Electric�
Grid�
NANOTE
CH�SAS�AIX�EN
�PR
OVEN
CE�(F
R)
This�project�w
ill�dem
onstrate�an�op
timization�of�re
newab
le�ene
rgy�
supp
lies�(R
ES),�primarily
�wind�en
ergy
�sou
rced
�ons
hore�and
�offsh
ore,�
with�an
�existing�pu
mpe
d�storag
e�po
wer�plant�(P
SPP
).�It�w
ill�in
tegrate�
smart�m
eters�with�po
wer�dem
and�an
d�su
pply�fo
reca
sting�to�ena
ble�
cons
istenc
y�of�pow
er�sup
ply�in�a�small�E
urop
ean�co
untry�(Lithu
ania).�
The�less
ons�learnt�from
�this�dem
onstration
�project�w
ill�be�diss
eminate�
directly�to
�the�pa
rticipan
ts�in
�this�project�and
�indirectly�th
roug
h�them
�to�m
ajor�globa
l�Trans
mission
�Sys
tem�O
perators�(T
SOs),�e
nsuring�a�
two�way
�exc
hang
e�of�bes
t�practice.�This�work�will�th
erefore�en
able�a�
grea
ter�p
enetration
�of�R
ES�as�pa
rt�of�the
�drive
�to�m
eet�the
�EC’s�20
:20:20
�ob
jectives
.
Jan�20
09-
Oct�200
9
FR
Integrated
�Sys
tem
LT UK
DE
ES�
HU

Pr
ojec
t nam
eO
rgan
izat
ion
nam
e B
rief
pro
ject
des
crip
tion
Peri
odCo
untr
y*Pr
ojec
t cat
egor
y
120
LINEA
RVITO�(B
E)
LINEA
R�project�is
�a�first�c
rucial�step�in�th
e�tran
sition
�towards
�smart�g
rids
�in�Fland
ers.�The
�project�fo
cuse
s�on
�the�realization�of�a�te
chno
logica
l�and
�im
plem
entation
�break
throug
h�by
�inno
vative
�tech
nologica
l�res
earch�an
d�a�large�sc
ale�pilot�in�a�reside
ntial�a
rea.�This�will�be�ac
hiev
ed�in
�close
�co
llabo
ration
�with�indu
strial�partners�an
d�as
sociated
�Flemish�inno
vation
�platform
s.�Sco
pe�of�the
�project:�ins
talling
�of�d
istributed
�ene
rgy�so
urce
s�an
d�load
�man
agem
ent�a
t�100
0�clients�within�the�sm
art�m
etering�projec
t�in�Hom
beek
�and
�Lee
st.
2011-201
4BE
Integrated
�Sys
tem
121
Low�Carbo
n�Lo
ndon
�–�A�
Learning
�Journe
y
UK�Pow
er�Networks
�(formerly�EDF�En
ergy
�Networks
),�(U
K)
This�project�w
ill�im
plem
ent�n
ew�ta
riffs�for�E
V’s,�s
et�up�a�learning
�labo
ratory�at�Impe
rial�College
�Lon
don�to�te
st�how
�large�sc
ale�low�carbo
n�tech
nologies
�impa
ct�on�ne
tworks
,�Ins
tall�an
d�mon
itor�5,000
�smart�
meters�an
d�mon
itor�EV�cha
rging�pa
tterns
.�An�integrated
,�large
-sca
le�tr
ial�
of�th
e�en
d-to-end
�electricity�sup
ply�ch
ain.�Cum
ulative�CO
2�sa
ving
s�of�
0.6�billion
�tons
�betwee
n�20
11�and
�205
0.�In
�fina
ncial�terms,�th
e�ca
rbon
�be
nefits�from
�a�nationa
l�rollout�w
ould�give�an
�NPV
�of�£
29�billion�to�205
0.�
£12�billion
�NPV
�of�fi
nanc
ial�b
enefi
ts�fo
r�cus
tomers�up
�to�205
0.
Jan�20
11-Jun
�20
14UK
Smart�M
eter�and
�AMI
Grid�Au
tomation�Distribution
Integrated
�Sys
tem
Hom
e�ap
plication�-�C
ustomer�
Beh
avior�
Other
122
LV�Network�Te
mplates
�for�a
�Lo
w-carbo
n�Fu
ture’
Wes
tern�Pow
er�
Distribution�UK)
Assist�in
�the�de
sign
�and
�plann
ing�of�nationa
l�networks
�in�th
e�future,�in�
orde
r�to�ac
commod
ate�large-sc
ale�rene
wab
le�gen
eration�an
d�ch
ange
s�in�
custom
er�utiliz
ation.
Jan�20
11-D
ec�
2013
UK
Smart�M
eter�and
�AMI
Other
123
Man
age�Sm
art�in�Sm
art�G
rid
Tieto�En
ergy
�AS(
NO)
The�projec
t�aim
s�to�estab
lish�un
derstand
ing�an
d�mod
els�for�e
fficien
t�en
ergy
�man
agem
ent�for�priva
te�and
�pub
lic�end
-use
rs�bas
ed�on�AMI/AMS�
and�a�sm
arter�p
ower�grid.�
Jan�20
10-
Dec
�201
2NO
Integrated
�Sys
tem
Hom
e�ap
plication�-�C
ustomer�
Beh
avior�
Smart�M
eter�and
�AMI
124
Marina�po
wer�dist.�hub
�with�
smart-grid�fu
nction
ality,�
ForskE
L�
Dan
ish�Te
chno
logica
l�Institute,�(D
K)
Pilot�p
roject�w
ill�ana
lyze
�the�ne
ed�fo
r�and
�poten
tial�of�a
�marina�po
wer�
distribu
tion
�hub
�with�sm
art-grid�fu
nction
ality�for�t
he�exp
ected�increa
sing
�sh
are�of�electrica
l�tou
r-�and
�pleas
ure�bo
ats�in�Den
mark.
Feb�20
11�-�
Jan�20
12DK
Smart�M
eter�and
�AMI
Integrated
�Sys
tem
125
Marke
t�Bas
ed�Dem
and�
Resp
onse
SIN
TEF�En
ergy
�Re
search
,�(NO)
The�main�ob
jectives
�of�the
�pilo
t�study
�were�to�ach
ieve
�daily�lo
ad�shifting�
and�to�exp
lore�cus
tomer�accep
tanc
e�an
d�load
�cur
ve�im
pacts�of�hou
rly�
base
d�tariffs�an
d�au
tomatic�lo
ad�con
trol�sch
emes
.20
05-200
8NO
Smart�M
eter�and
�AMI
Hom
e�ap
plication�-�C
ustomer�
Beh
avior�
126
Matning
�200
9Goteb
org�En
ergy
�AB�
(SE)
The�sm
art�m
etering�projec
t�at�G
oteb
org�En
ergi�in
clud
es�all�cu
stom
ers�up
�to�63A
�and
�provide
s�for�t
he�dep
loym
ent�o
f�265
�000
�smart�m
eters.
Mar�200
6�-�
Jul�2
010
SE
Smart�M
eter�and
�AMI

Pr
ojec
t nam
eO
rgan
izat
ion
nam
e B
rief
pro
ject
des
crip
tion
Peri
odCo
untr
y*Pr
ojec
t cat
egor
y
127
MER
GE�-�M
obile
�Ene
rgy�
Reso
urce
s�in�Grids
�of�
Elec
tricity�
PUBLIC�PO
WER
�CO
RPO
RAT
ION�S.A.�
(EL)
Elec
tric�pow
er�sys
tems�are�facing
�a�m
ajor�new
�cha
lleng
e:�fu
ture�m
assive
�integration�in�th
e�elec
tric�grid�of�electric�plug
-in�veh
icles�(EV).�The
�project�
will�add
ress
�com
preh
ensive
ly�th
e�im
pact�of�e
lectric�plug
-in�veh
icles�(EV)�
pres
ence
�rega
rding�stea
dy�state�ope
ration
,�intermittent�RES
�integration,�
system
�stability�an
d�dy
namic�beh
avior,�sy
stem
�restoration,�re
gulatory�
aspe
cts�an
d�marke
t�arran
gemen
ts.
Jan�20
10�-�
Dec
�201
1
ES�
Integrated
�Sys
tem
IE EL DE
BE
NO
UK PT
128
Micro-Req
uest-B
ased
�Ag
greg
ation,��
Foreca
sting�an
d�Sc
hedu
ling�
of�Ene
rgy��
Dem
and,�Sup
ply�an
d�Distribution�(M
IRAC
LE)
SAP�AG
�(DE)
The�projec
t’s�m
ain�go
al�is
�to�dev
elop
�a�con
cept�fo
r�flex
-offers�that�spe
cify�
elec
tricity�de
man
d�an
d �su
pply�w
hich
�is�flex
ible�in
�time�an
d�am
ount�and
�an
�infras
truc
tural�a
pproac
h�to�proce
ss�lo
ts�of�the
se�flex
-offers�issu
ed�by�
small�c
onsu
mers�an
d�prod
ucers�in�nea
r�rea
l-time.�
The�po
ssibility�to
�shift�dem
and�within�the�mas
s�of�hou
seho
lds�de
velope
d�within�the�MIRAC
LE�project�w
ill�allo
w�fo
r�a�highe
r�sha
re�of�fl
uctuating�
rene
wab
le�ene
rgy�so
urce
s�in�th
e�en
ergy
�mix�on�the�grid�and
�redu
ce�th
e�pe
ak�dem
and.�W
e�ex
pect�th
at�th
e�sh
are�of�RES
�can
�be�increa
sed�by
�5%�
and�that�th
e�pe
ak�dem
and�ca
n�be
�redu
ced�by
�8-9%�(b
ut�at�lea
st�by�5%
)�for�t
he�to
tal�g
rid.�
We�will�fu
rthe
rmore�redu
ce�th
e�mea
n �time�be
twee
n�tran
sactions
,�which
�will�re
sult�in
�more�stab
ility�of�the
�ene
rgy�grid�but�also�in�re
duction�of�
costs�of�BRPs
,�by�redu
cing
�the�differen
ce�betwee
n�their�p
lann
ed�and
�ac
tual�electricity�sch
edules
.
Jan�20
10�-�
Jan�20
13
EL
Integrated
�Sys
tem
DE
PT NL
DK
CH IT ES�
FR PL MK
UK

Pr
ojec
t nam
eO
rgan
izat
ion
nam
e B
rief
pro
ject
des
crip
tion
Peri
odCo
untr
y*Pr
ojec
t cat
egor
y
129
Mini�B
erlin
�pow
ered
��by
�Vattenfall
Vatten
fall�Eu
rope
�Inno
vation
�GmbH
�(DE)
The�func
tion
al�dem
onstration
�MIN
I�E�Berlin
�pow
ered
�by�Va
tten
fall�is�
a�co
-ope
ration
�betwee
n�Va
tten
fall�an
d�BMW.�T
here�are�50�MIN
I�E�(3
5�kW
h,�ra
nge�~�180
-200
�km,�m
ax�spe
ed�152
�km/h
)�mos
tly�us
ed�by�Berlin
�reside
nts�bu
t�also�in�flee
t�app
lications
.�
Dec
�200
8�-�
Nov
�201
0DE
Integrated
�Sys
tem
Hom
e�ap
plication�-�C
ustomer�
Beh
avior�
130
Mod
el�City�Man
heim
MW�Ene
rgie�(D
E)
The�projec
t�con
centrates�on
�an�urba
n�co
nurbation�in�w
hich
�rene
wab
le�
and�de
centraliz
ed�sou
rces
�of�e
nergy�are�us
ed�to
�a�la
rge�ex
tent.�W
ithin�
the�fram
ework�of�th
e�E-En
ergy
�project,�a
�repres
entative
�large-sc
ale�trial�
is�being
�con
ducted
�both�in�M
anhe
im�and
�in�Dresd
en�to
�dem
onstrate�th
e�projec
t�can
�be�ap
plied�an
d�tran
slated
�to�other�re
gion
s.�
Nov
�200
8�-�
Oct�201
2DE
Integrated
�Sys
tem
131
More�Microgrids
ICCS
/Nationa
l�Te
chnica
l�Unive
rsity�of�
Athe
ns�(E
L)
The�aims�of�th
is�Tes
t�Fac
ility�is
�to:�•
�Tes
t�cen
tralized
�and
�dec
entralized
�co
ntrol�s
trateg
ies�in�grid�intercon
nected
�mod
e;�•�Tes
t�com
mun
ication�
protoc
ols�an
d�co
mpo
nents�includ
ing�as
pects�related�to�ene
rgy�trad
ing;�
•�A�co
ntrol�a
nd�m
onitoring�sy
stem
�built�aroun
d�IEC�61
850�stan
dard�
design
ed�and
�prototype
d;�•�Con
trol�strateg
ies�resu
lting�from
�age
nt�
software�to�m
ake�us
e�of�th
ese�co
ntrol�a
nd�m
onitoring�func
tion
s;�•�
Dev
elop
men
t�of��intellige
nt�m
odules
�embe
dding�the�requ
ired
�func
tion
s�to�allo
w�a�fu
ll�integration�of�eac
h�ge
nerating
/loa
d�un
it�in
to�th
e�sy
stem
.
Jan�20
06�-�
Dec
�200
9
ES�
Integrated
�Sys
tem
EL PT NL
Smart�M
eter�and
�AMI
ITGrid�Au
tomation�Distribution
DK
Hom
e�ap
plication�-�C
ustomer�
Beh
avior�
MK
DE
132
More�PV
2Grid
Fron
ius�Internationa
l�GmbH
�(AT)
The�projec
t�aim
s�at�dev
elop
ing�an
d�va
lidating�co
ncep
ts�fo
r�con
trollin
g�the�vo
ltag
e�with�ph
otov
oltaic�in
stallation
s.�The
�con
cepts�allow�num
erou
s�distribu
ted�PV
-sys
tems�to�con
tribute�to�voltage
-kee
ping
�by�au
tono
mou
s�ad
justmen
t�of�p
ower�and
�reac
tive
�pow
er�in
jection�witho
ut�sup
er�ordinate�
system
�and
�com
mun
ication�tech
nology
.�The
se�con
cepts�sh
all�u
ltim
ately�
allow�th
e�co
st-effec
tive
�integration�of�a�la
rge�nu
mbe
r�of�p
hotovo
ltaic�
gene
rators.�
Mar�201
0�-�
Mar�201
3AT
Integrated
�Sys
tem
133
“Mülhe
im�zäh
lt”�Sm
art�M
eter�
Prog
ramm
RWE�DAG
�(DE)
RWE�DAG
�installin
g�up
�to�100
.000
�smart�m
eters�in�th
e�city�of�M
ülhe
im�in
�ho
useh
olds
.20
09-201
1DE
Smart�M
eter�and
�AMI
134
NET
-ELA
NFo
rsch
ungs
zentrum�
Jülic
h�GmbH
�(DE)
This�project�aim
s�to�ans
wer�th
e�qu
estion
�of�w
hether�and
�how
�it�can
�be
�in�te
rms�of�a�m
ulti-sec
tor�s
ystem�solution,�a�num
ber�o
f�veh
icles�
with�elec
trified
�drive
�com
pone
nts�us
ed�both�us
eful�as�a�distribu
ted�
energy
�storage
�in�th
e�elec
tric�network�an
d�the�co
nsum
er�side�de
man
d�man
agem
ent.�
Dec
�200
8-Nov
�201
1DE
Spec
ific�Storag
e�Te
chno
logy
�Dem
onstration
Hom
e�ap
plication�-�C
ustomer�
Beh
avior�
Integrated
�Sys
tem

Pr
ojec
t nam
eO
rgan
izat
ion
nam
e B
rief
pro
ject
des
crip
tion
Peri
odCo
untr
y*Pr
ojec
t cat
egor
y
135
Network�de
sign
�and
��man
agem
ent�in�a��
smart�c
ity�with�large��
deploy
men
t�of�D
ER
Ores�(B
E)Th
e�projec
t�aim
s�at�in
tegrating�all�s
mart�tec
hnolog
ies�on
�the�distribu
tion
�grid�of�a
�given
�city�an
d�at�defi
ning
�new
�network�de
sign
�rules�an
d�man
agem
ent�p
rinc
iples�de
finition.
Dec
�201
0�-�
not�a
vaila
ble
BE
Smart�M
eter�and
�AMI
Integrated
�Sys
tem
Grid�Au
tomation�Distribution
Hom
e�ap
plication�-�C
ustomer�
Beh
avior�
Spec
ific�Storag
e�Te
chno
logy
�Dem
onstration
136
Netze
�der�Strom
versorgu
ng�
der�Z
ukun
ftRW
E�DAG
�(DE)
One
�of�the
�mos
t�promising�inve
stigated
�grid�structures
�will�be�
demon
strated�in�a�ty
pica
l�rural�M
V�grid,�w
hich
�has
�to�cop
e�with�a�
mas
sive
�implem
entation
�of�R
ES.�S
everal�te
chno
logies
,�like�elec
tron
ic�
sub-stations
,�autom
atic�ta
p�ch
ange
r,�the�us
age�of�th
e�fle
xibility�of�an�
biog
as�plant�etc.�w
ill�be�tested
�and
�dem
onstrated.
2008
-201
1DE
Grid�Au
tomation�Distribution
137
Nex
tGen
CET-DTU
,�(DK)
To�con
tribute�to�th
e�de
velopm
ent�o
f�nex
t�gen
eration�co
mmun
ication�
system
�for�s
ystem�in
tegration�of�distributed
�gen
eration�(N
extG
en)�b
ased
�on
�the�ne
w�in
ternationa
l�IEC
6185
0-family
�of�o
pen�stan
dards�de
velope
d�in�th
ese�ye
ars.
Apr�2
006�
-Jun
�201
0DK
Smart�M
eter�and
�AMI
Grid�Au
tomation�Distribution
138
NIG
HT�WIN
D�
NED
ERLA
NDSE��
ORGANISAT
IE�VOOR�
TOEG
EPAST
�NAT
UUR-
WET
ENSC
HAP
PELIJK�
ONDER
ZOEK
�(NL)
The�Night�W
ind�projec
t�propo
ses�to�des
ign�grid�architectures
�for�
Wind�Po
wer�Produ
ction�co
mbine
d�with�En
ergy
�Storage
�mea
ns�of�loa
d�man
agem
ent�o
f�Refrige
rated�Wareh
ouse
s�(Cold�Stores
),�Refrige
rated�
Wareh
ouse
s�are�co
nstant�pow
er�use
rs,�d
ay�and
�night.
Jul�2
006-Jun�
2008
DK
Other
BG ES�
NL
139
Ope
n�meter
Iberdrola�(ES)
��
The�main�ob
jective�of�th
e�OPE
N�m
eter�project�is
�to�spe
cify�a�
compreh
ensive
�set�of�o
pen�an
d�pu
blic�stand
ards
�for�A
dvan
ced�Metering�
Infras
truc
ture�(A
MI)�sup
porting�multi�com
mod
ities�(Electricity,�G
as,�
Water�and
�Hea
t),�b
ased
�on�the�ag
reem
ent�o
f�the
�mos
t�relev
ant�
stak
eholde
rs�in
�the�area
.
Jan�20
09�-�
Jun�20
11
ES�
Smart�M
eter�and
�AMI
IT DE
FR NL
CH BE

Pr
ojec
t nam
eO
rgan
izat
ion
nam
e B
rief
pro
ject
des
crip
tion
Peri
odCo
untr
y*Pr
ojec
t cat
egor
y
140
Ope
n�Nod
eAt
os�O
rigin�Sa
e�(ES)
Ope
nNod
e�projec
t�is�focu
sed�on
�the�elec
trical�distribution�grid�ope
ration
�an
d�ex
plores
�ans
wers�on
�the�three�ch
alleng
es�in
trod
uced
:�•�How
�to�im
prov
e�the�distribu
tion
�grid�mon
itoring�to�cop
e�with�vo
latile�
states
�in�th
e�grid�
•�How
�to�in
tegrate�the�“smart”�sub
station�au
tomation�de
vice
s�to�
increa
se�th
e�effic
ienc
y�of�th
e�distribu
tion
�grid�
•�How
�to�in
terope
rate�w
ith�the�differen
t�roles
�e.g.�o
peration
�of�the
�smart�
meters,�pow
er�and
�grid�op
eration
Jan�20
10�-�
Jun�20
12
ES�
Integrated
�Sys
tem
FR PT NL
DE AT
141
Opp
ortunities
�to�use
�Co
mpres
sed�air�e
nergy�
storag
e�for�s
torage
�of�
elec
tricity�in�th
e�elec
tricity�
system
�of�the
�future
DTU
�Mec
hanica
l�En
gine
ering,�(D
K)
The�projec
t�objec
tive
�is�to
�determine�whe
ther�Com
pres
sed�Air�E
nergy�
Storag
e�(C
AES)
�will�be�a�so
und�alternative�in�fina
ncial�a
nd�ene
rgy�term
s�to�other�ty
pes�of�electricity�storage
�(hyd
roge
n,�battery,�p
umpe
d�storag
e�po
wer�station
s�ab
road
)�and
�regu
lation
�metho
ds�in
�con
nection�with�
elec
tricity�ov
erflo
w�and
�other�re
gulation
�nee
ds�in
�the�elec
tricity�sy
stem
�of�th
e�future.
Dec
�200
5�-�
Dec
�201
0DK
Spec
ific�Storag
e�Te
chno
logy
�Dem
onstration
142
Optim
al�Pow
er�Network�
design
�and
�Ope
ration
Norweg
ian�Unive
rsity�
of�Scien
ce�and
�Te
chno
logy
�(NO)
Improv
ed�pow
er�sys
tem�stability,�plann
ing�an
d�op
eration,�Training�of�
PhD’s,�Improv
ed�und
erstan
ding
�of�e
lectricity�m
arke
t�des
ign�to�m
inim
ize�
operationa
l�los
ses.
Jul�2
011�-�Jun
�20
14NO
Grid�Au
tomation�Tran
smission
143
OPT
IMAT
ETE
CHNOFI�–�(F
R)
The�projec
t�aim
s�at�dev
elop
ing�a�nu
merical�te
st�platform�to
�ana
lyze
�and
�to�validate�ne
w�m
arke
t�des
igns
�which
�may
�allo
w�in
tegrating�mas
sive
�fle
xible�ge
neration
�dispe
rsed
�in�sev
eral�re
gion
al�pow
er�m
arke
ts.
2009
-201
2
FR
Integrated
�Sys
tem
DE
ES�
BE
DK IT UK
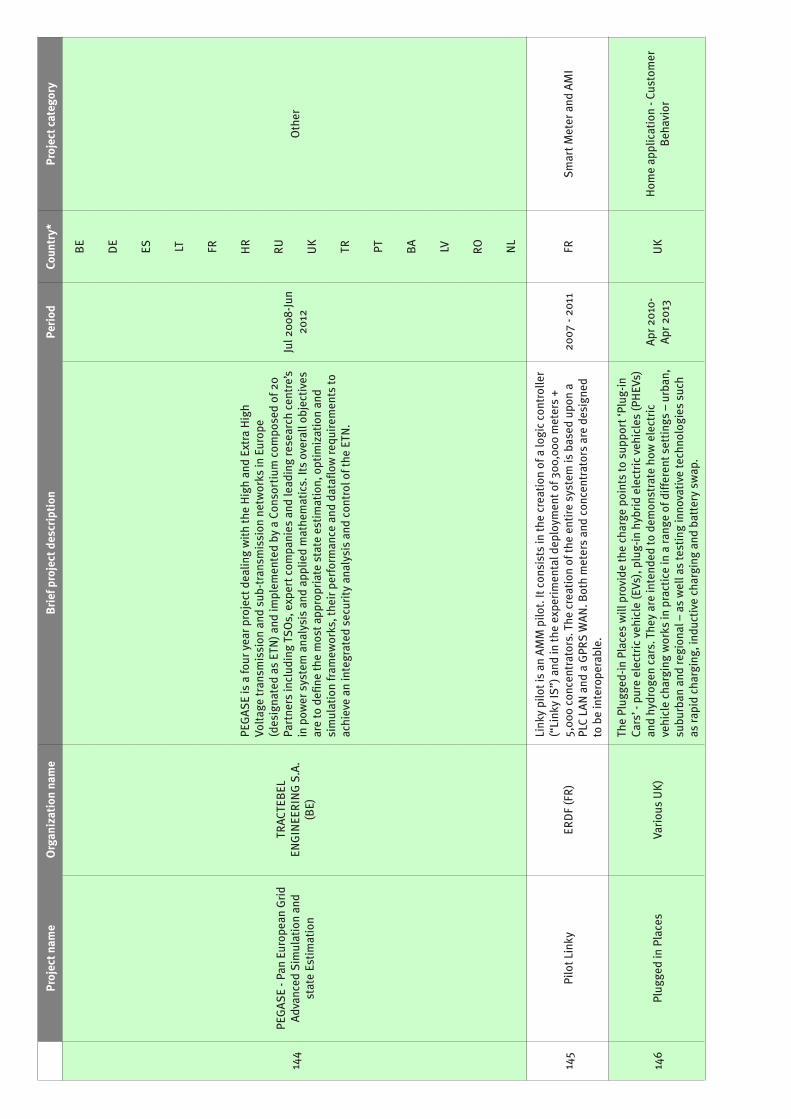
Pr
ojec
t nam
eO
rgan
izat
ion
nam
e B
rief
pro
ject
des
crip
tion
Peri
odCo
untr
y*Pr
ojec
t cat
egor
y
144
PEGASE�-�P
an�Europ
ean�Grid�
Adva
nced
�Sim
ulation�an
d�state�Es
timation�
TRAC
TEBEL
�EN
GIN
EERIN
G�S.A.�
(BE)
PEGASE�is�a�fo
ur�yea
r�project�dea
ling�with�the�High�an
d�Ex
tra�High�
Voltag
e�tran
smission
�and
�sub
-trans
mission
�networks
�in�Europ
e�(des
igna
ted�as
�ETN
)�and
�implem
ented�by
�a�Con
sortium�com
pose
d�of�20�
Partne
rs�in
clud
ing�TS
Os,�exp
ert�c
ompa
nies
�and
�lead
ing�rese
arch
�cen
tre’s�
in�pow
er�sys
tem�ana
lysis�an
d�ap
plied�mathe
matics.�Its�ov
erall�o
bjec
tive
s�are�to�defi
ne�th
e�mos
t�app
ropriate�state�estim
ation,�optim
ization�an
d�simulation�fram
eworks
,�the
ir�perform
ance
�and
�datafl
ow�re
quirem
ents�to
�ac
hiev
e�an
�integrated
�sec
urity�an
alys
is�and
�con
trol�of�the
�ETN
.
Jul�2
008-Jun�
2012
BE
Other
DE
ES�
LT FR HR
RU
UK
TR PT BA LV RO NL
145
Pilot�L
inky
ERDF�(FR)
Link
y�pilot�is�an
�AMM�pilo
t.�It�con
sists�in�th
e�crea
tion
�of�a
�logic�co
ntrolle
r�(“Link
y�IS”)�and
�in�th
e�ex
perimen
tal�d
eploym
ent�o
f�300
,000
�meters�+�
5,00
0�co
ncen
trators.�The
�creation�of�th
e�en
tire�sys
tem�is
�bas
ed�upo
n�a�
PLC�LA
N�and
�a�GPR
S�WAN.�B
oth�meters�an
d�co
ncen
trators�are�de
sign
ed�
to�be�interope
rable.
2007
�-�20
11FR
Smart�M
eter�and
�AMI
146
Plug
ged�in�Place
sVa
riou
s�UK)
The�Plug
ged-in�Place
s�will�provide
�the�ch
arge
�points�to�sup
port�‘P
lug-in�
Cars’�-�pure�elec
tric�veh
icle�(E
Vs),�plug-in�hyb
rid�elec
tric�veh
icles�(PHEV
s)�
and�hy
drog
en�cars.�The
y�are�intend
ed�to
�dem
onstrate�how
�electric�
vehicle�ch
arging
�works
�in�practice�in�a�ra
nge�of�differen
t�setting
s�–�urba
n,�
subu
rban
�and
�region
al�–�as�well�a
s�testing�inno
vative
�tech
nologies
�suc
h�as
�rapid�ch
arging
,�ind
uctive
�cha
rging�an
d�ba
ttery�sw
ap.
Apr�2
010-
Apr�2
013
UK
Hom
e�ap
plication�-�C
ustomer�
Beh
avior�

Pr
ojec
t nam
eO
rgan
izat
ion
nam
e B
rief
pro
ject
des
crip
tion
Peri
odCo
untr
y*Pr
ojec
t cat
egor
y
147
Plug
�n’�p
lay-co
ncep
t�for�
intellige
nt�in
deklim
astyring
,�Fo
rskE
L
Neo
grid�Tec
hnolog
ies,�
(DK)
A�co
ncep
t�for�ene
rgy�effic
ient�con
trol�of�a
ir-air�h
eat�p
umps
�and
�electric�
storag
e�water�hea
ters�w
ith�focu
s�on
�indo
or�clim
ate,�ene
rgy�sa
ving
s�an
d�de
man
d�resp
onse
�is�dev
elop
ed.
Jan�20
11�-�
Jan�20
13DK
Integrated
�Sys
tem
Hom
e�ap
plication�-�C
ustomer�
Beh
avior�
Spec
ific�Storag
e�Te
chno
logy
�Dem
onstration
148
PMU/W
AMS�target�area
Energine
t.dk
,�(TS
O),�
(DK)
The�pu
rpos
e�is�to
�dev
elop
�sys
tems�that�can
�mon
itor�th
e�ov
erall�p
ower�
system
�state�and
�alert�sys
tem�ope
rators�and
�other�protection�sy
stem
s�ab
out�for
thco
ming�critical�situa
tion
s�in�th
e�po
wer�sys
tem.�
2006
�-�20
12DK
Grid�Au
tomation�Tran
smission
149
Pilotprojekt�M
arkisc
hes�
Viertel
Vatten
fall�Eu
rope
�Distribution�Berlin
�GmbH
�(DE)
Vatten
fall�su
ppor
ts�th
e�en
ergy
�efficien
cy�program
�in�Berlin
-�Märkisc
hes�
Viertel�w
ith�installation
�of�1
0.00
0�sm
art�m
eters.�In
�Berlin
�Märkisc
hes�
Viertel�the
re�are�m
ore�than
�10.00
0�ap
artm
ents�w
ith�more�than
�50.00
0�reside
nts.�The
�project�aim
s�at�te
sting�ne
w�m
eter�te
chno
logies
�com
bine
d�with�ne
w�IC
T-sy
stem
s.�
Jan�20
10�-�
Jun�20
11DE
Smart�M
eter�and
�AMI
Hom
e�ap
plication�-�C
ustomer�
Beh
avior�
150
Pilot�S
mart�M
etering
Enex
is�(N
L)
Rese
arch
�has
�bee
n�focu
sed�on
�alterna
tive
�data-co
m�in
fras
truc
tures,�
AMI-sy
stem
�perform
ance
s,�stand
ardiza
tion
�of�m
eter�re
quirem
ents,�
poss
ibilities
�of�fi
rmware�up
grad
es,�s
ecurity�&�priva
cy�guide
lines
�and
�mea
sures,�m
ass�roll�ou
t�proce
sses
�and
�cus
tomer�satisfaction.
2007
-201
0NL
Smart�M
eter�and
�AMI
151
Power�pit
DONG�Ene
rgy,��(DSO
),�
(DK)
The�pu
rpos
e�of�th
e�Po
wer�Pit�project�is
�state�estim
ation�in�10�kV
�network�
and�visu
alization�of�re
sults
2007
�-�20
09DK
Grid�Au
tomation�Distribution
152
Price�elas
tic�elec
tricity�
cons
umption�an
d�elec
tricity�
prod
uction
�in�in
dustry
Dan
sk�Ene
rgi�A
nalyze
�a/
s�(D
K)
The�projec
t�aim
s�at�promoting�indu
stry’s�acces
s�to�price
-elastic�electricity�
cons
umption�by
�creating�interest�amon
g�co
mpa
nies
�in�th
e�op
portun
ity�to�
max
imize�ga
ins,�and
�mak
ing�it�eas
ier�for�th
em�to
�ass
ess�their�p
oten
tial�
with�de
pend
ence
�on�e.g.�th
e�ac
tiva
tion
�pay
men
t,�and
�by�de
veloping
�the�
contractua
l�con
dition
s�in�th
e�elec
tricity�marke
ts.
Mar�200
6�-�
Jun�20
10DK
Integrated
�Sys
tem
153
Price�elas
tic�elec
tricity�
cons
umption�as
�rese
rve�
power�-�a�de
mon
stration
�projec
t�in�the�ho
rticultural�
sector
DEG
�Green
�Tea
m�(D
K)
The�projec
t�objec
tive
�is�cha
rting�the�sc
ale�of�th
e�realizab
le�poten
tial�fo
r�price-elas
tic�elec
tricity�co
nsum
ption�within�the�ho
rticultural�s
ector,�an
d�de
mon
stration
�of�the
�tech
nica
l�opp
ortunities
�and
�the�fin
ancial�in
centive�
for�t
he�in
dividu
al�m
arke
t�garde
ns�to
�participa
te�in
�the�marke
ts�fo
r�regu
lated�an
d�rese
rve�po
wer�via�price
-elastic�electricity�con
sumption.
Apr�2
006�-�
Jun�20
10DK
Integrated
�Sys
tem
154
Proa
ctive�pa
rticipation�
of�w
ind�in�th
e�elec
tricity�
marke
ts,�F
orsk
EL��
EMD�In
ternationa
l,�(D
K)
This�project�w
ants�to
�dem
onstrate�th
at�w
ind�turbines
�them
selves
�may
�de
liver�an�im
portan
t�part�o
f�the
�balan
cing
�task
s�ne
eded
,�thu
s�redu
cing
�high
�unb
alan
ce�price
s�an
d�prom
oting�the�de
velopm
ent�o
f�wind�en
ergy
�in�
Europe
.
Jun�20
09�-�
Dec
�201
0DK
Integrated
�Sys
tem

Pr
ojec
t nam
eO
rgan
izat
ion
nam
e B
rief
pro
ject
des
crip
tion
Peri
odCo
untr
y*Pr
ojec
t cat
egor
y
155
Projec
t�AMR
Vatten
fall�AB
�(SE)
Eche
lon’s�Network�En
ergy
�Service
s�sy
stem
�provide
s�Va
tten
fall�with�
an�ope
n,�bidirec
tion
al,�a
nd�exten
sible�infras
truc
ture�th
at�ena
bles
�a�
compreh
ensive
�rang
e�of�utility�ap
plications
�that�bring
s�be
nefits�to�
every�as
pect�of�the
ir�ope
ration
,�from�m
etering,�to
�cus
tomer�service
s,�to
�distribu
tion
�ope
ration
s,�to
�value
-add
ed�service
s.
2006
�-�20
09SE
Smart�M
eter�and
�AMI
156
Projec
t�“Intellige
nt�hom
e”SEA
S-NVE,��(DSO
)�(DK)
The�aim�is
�throug
h�inform
ation�to�cus
tomers�to�ach
ieve
�ene
rgy�sa
ving
�be
havior�cha
nge�by
�mak
ing�visible�the�bigg
est�e
nergy�co
nsum
ers.�The
�projec
t�also�includ
es�th
e�man
agem
ent�o
f�ind
ividua
l�com
pone
nts�ba
sed�
on�defi
ned�co
nditions
.
2009
-201
1DK
Smart�M
eter�and
�AMI
Hom
e�ap
plication�-�C
ustomer�
Beh
avior�
157
Projec
t�“Th
e�Island
�of�F
ur�on�
the�map
”Not�ava
ilable
The�projec
t�has
�arise
n�in�coo
peration
�with�Sk
ive�Mun
icipality.�The
�vision�
is�to
�mak
e�Fu
r�a�VEØ
�(ren
ewab
le�ene
rgy�island
),�th
at�is
�inde
pend
ent�
of�fo
ssil�fuels�an
d�thereb
y�do
es�not�disch
arge
�CO2�em
ission
s�to�th
e�en
vironm
ent.�
Mar�201
0�-�
Mar�202
0DK
Integrated
�Sys
tem
158
Prøv
1Elbil
Dan
ish�Te
chno
logica
l�Institute�(D
K)
The�pu
rpos
e�of�th
is�project�is
�to�collect�in
form
ation�on
�driving
�patterns,�
need
s�an
d�us
er�exp
erienc
es,�c
harging�times
�and
�patterns�an
d�load
s�on
�the�ne
twork.
Jan�20
09�-�
Dec
�201
2DK
Integrated
�Sys
tem
159
PV-Islan
d�Bornh
olm,�F
orsk
EL�
EnergiMidt�A
/S,�(DK)
The�“P
V�Is
land
�Bornh
olm”�(PVIB
)�project�aim
s�at�estab
lishing
�5�M
Wp�PV
�on
�the�island
�of�B
orn-ho
lm.�A
pp.�1
MWp�of�th
em�w
ill�be�installed�du
ring
�this�pha
se.�P
VIB
�will�fo
cus�on
�dem
onstration
�and
�furthe
r�utiliz
ation�of�
PV�and
�as�su
ch�provide
�uniqu
e�facilities�to�te
st�how
�PV�as�a�flu
ctua
ting
�en
ergy
�sou
rce�ca
n�be
�implem
ented�in�a�fu
ture�in
tellige
nt�pow
er�sys
tem.
Jan�20
10�-�
Dec
�201
2DK
Integrated
�Sys
tem
160
REA
LISEG
RID
RSE�(IT)
The�ob
jective�of�REA
LISEG
RID
�is�to
�dev
elop
�a�set�of�c
riteria,�m
etrics
,�metho
ds�and
�tools�to�ass
ess�ho
w�th
e�tran
smission
�infras
truc
ture�
shou
ld�be�op
timally�dev
elop
ed�to
�sup
port�th
e�ac
hiev
emen
t�of�a
�relia
ble,�
compe
titive
�and
�sus
tainab
le�electricity�sup
ply�in�th
e�Eu
rope
an�Union
�(EU).
Sept�200
8�-�
May
�201
1
IT
Other
NL
AT FR RU DE
UK SI
BE

Pr
ojec
t nam
eO
rgan
izat
ion
nam
e B
rief
pro
ject
des
crip
tion
Peri
odCo
untr
y*Pr
ojec
t cat
egor
y
161
Real-tim
e�de
mon
stration
�test�
and�ev
alua
tion
�of�B
ornh
olm�
elec
tricity�ne
twork�with�high
�wind�po
wer�pen
etration
CET-DTU
,�(DK)
Crea
te�a�re
search
�platform,�w
here�elemen
ts�of�future�the�en
ergy
�sys
tem�
can�be
�tested
.�Tes
ting
�can
�be�pe
rformed
�from
�the�labo
ratory�le
vel�a
nd�up�
to�fu
ll�sc
ale�de
mon
stration
�on�Bornh
olm.�
Oct�200
9�-�
Dec
�201
2DK
Smart�M
eter�and
�AMI
Grid�Au
tomation�Distribution
Integrated
�Sys
tem
162
Rege
nerative
�Mod
ellreg
ion�
Harz�
(Reg
Mod
Harz)
Frau
nhofer�IW
ES�(D
E)
Within�this�project,�g
rid�op
erators,�ene
rgy�su
pplie
rs,�m
unicipal�utilities,�
wind�farm
�ope
rators,�u
nive
rsities,�re
search
�institutes
�and
�RES
/ICT
�related�co
mpa
nies
�will�dev
elop
�tools,�in
fras
truc
tures�an
d�strategies
�to�sup
ply�a�co
mplete�district�w
ith�elec
tricity�so
lely�from
�Ren
ewab
le�
Energies
.
2008
-201
2DE
Smart�M
eter�and
�AMI
Grid�Au
tomation�Distribution
Integrated
�Sys
tem
Spec
ific�Storag
e�Te
chno
logy
�Dem
onstration
163
Regu
lated�po
wer,�O
UH
Not�ava
ilable
The�projec
t’s�m
ission
�is�to
�con
tribute�to�th
e�de
velopm
ent�o
f�a�sus
tainab
le�
energy
�sys
tem�by�be
ing�av
ailable�to�re
gulate�out�th
e�va
rying�se
rvices
�that�w
ind�turbines
�con
tribute�to�in
�the�va
riou
s�wea
ther�con
dition
s.
Jan�20
09�-�
Jun�20
09DK
Integrated
�Sys
tem
164
Remote�Se
rvices
�for�C
HP,�
ForskE
L�Eu
risc
o,�(D
K)
The�main�pu
rpos
e�of�th
e�projec
t�is�to�ana
lyze
�and
�dev
elop
�a�con
cept�fo
r�remote�su
pervision�of�Com
bine
d�Hea
t�and
�Pow
er�plants.
Apr�2
009�-�
Dec
�201
0DK
Integrated
�Sys
tem
165
SAFE
WIN
DRT
E,�(F
R)
The�projec
t�will�dev
elop
:�New
�foreca
sting�metho
ds�fo
r�wind�ge
neration
�focu
sing
�on�un
certainty�an
d�ch
alleng
ing�situations
/extremes
.�-�M
odels�
for�“
alarming”
:�providing
�inform
ation�for�t
he�le
vel �o
f�predictab
ility�in
�the�
(very)�sho
rt-term.�-�M
odels�for�“
warning
”:�providing
�inform
ation�for�t
he�
leve
l�of�p
redictab
ility�in
�the�med
ium-term�(n
ext�d
ay(s)).
Sept�200
8�-�
Aug�20
12
DK
Other
FR ES�
DE IE UK EL
166
SACS
eDONG�Ene
rgy,��(DSO
),�
(DK)
The�ob
jective�of�th
e�SA
CSe�projec
t�was
�autom
atic�con
version�in�th
e�10
�kV�
grid�in
�order�to
�improv
e�su
pply�qua
lity�in�con
nection�with�10
�kV�fa
ults�–�
the�so
�called�“self-he
aling”
�grid.
2008
�-�20
10DK
Grid�Au
tomation�Distribution

Pr
ojec
t nam
eO
rgan
izat
ion
nam
e B
rief
pro
ject
des
crip
tion
Peri
odCo
untr
y*Pr
ojec
t cat
egor
y
167
Seco
nd1�-�S
ecurity�co
ncep
t�for�D
EREU
RISCO
�ApS
�(DK)
The�projec
t�objec
tive
�is�to
�ana
lyze
�and
�implem
ent�a
�sec
urity�co
ncep
t�that�can
�be�us
ed�in
�a�pow
er�sys
tem�w
ith�a�high
�deg
ree�of�dec
entralized
�prod
uction
�and
�with�man
y�ac
tors�in
�an�un
bund
led�marke
t.�It�w
ill�also�
inve
stigate�va
riou
s�form
s�of�ro
le�bas
ed�acces
s�co
ntrol�(RBAC
).
Mar�201
0�-�
Jul�2
011
DK
Smart�M
eter�and
�AMI
168
Self-orga
nizing
�distributed
�co
ntrol�o
f�a�distributed
�en
ergy
�sys
tem�w
ith�a�high
�pe
netration�of�re
new-able�
energy
DTU
�Inform
atics,�(D
K)
The�projec
t�studied
�asp
ects�of�the
�bas
is�fo
r�distributed
�reso
urce
s�su
ch�
as�w
ind�turbines
,�pho
tovo
ltaics
�and
�not�le
ast�c
onsu
mers�pa
rticipating�
in�pow
er�sys
tem�con
trol,�inc
luding
�the�as
pect�of�h
ow�build-up�of�suc
h�co
ntrol�c
an�be�au
tomated
.
Jan�20
07�-�
Jun�20
10DK
Grid�Au
tomation�Distribution
169
Service�op
timization�of�th
e�distribu
tion
�network
Not�ava
ilable
To�in
vestigate�differen
t�param
eters�which
�can
�optim
ize�the�op
eration�of�
the�distribu
tion
�network�on
�the�ba
sis�of��T
he�Dan
ish�En
ergy
�Reg
ulatory�
Authority’s�regu
lation
�of�the
�distribution�ne
twork�co
mpa
nies
�in�th
e�form
�of�fina
ncial�reg
ulation�an
d�regu
lation
�of�the
�sec
urity�of�sup
ply.
2009
�-�20
10DK
Integrated
�Sys
tem
170
Smartcity�Malag
aEn
desa
�(ES)
The�go
als�of�SmartCity�Málag
a�ca
n�be
�sum
marized
�into�th
e�follo
wing�
ones
:-�T
est�a
nd�dep
loym
ent�o
f�the
�new
�ene
rgy�man
agem
ent�m
odel;
-�Implem
entation
�and
�integration�of�Distributed
�Ene
rgy�Re
source
s,�
Energy
�Storage
�facilities,�Electric�Ve
hicles
�cha
rging�proc
esse
s�an
d�intellige
nt�Pub
lic�Lighting�de
vice
s�into�th
e�ne
w�ope
ration
�grid�sy
stem
s
Mar�200
9�-�
Mar�201
3ES
�
Smart�M
eter�and
�AMI
Grid�Au
tomation�Tran
smission
Grid�Au
tomation�Distribution
Integrated
�Sys
tem
Hom
e�ap
plication�-�C
ustomer�
Beh
avior�
Spec
ific�Storag
e�Te
chno
logy
�Dem
onstration
171
Smart�E
nergy�Co
llective
KEM
A�(N
L)
The�Sm
art�E
nergy�Co
llective�is�an�indu
stry-w
ide�co
llective�that�is
�setting
�up
�5�to
�10�large-sc
ale�sm
art�g
rids
�dem
onstration
�projects�ac
ross
�the�
Nethe
rlan
ds�w
ith�a�total�o
f�aroun
d�5,00
0�private�an
d�sm
all�b
usines
s�en
d-us
ers.�This�indu
stry�in
itiative
�is�ded
icated
�to�th
e�prac
tica
l�dev
elop
men
t�of�
smart�e
nergy�se
rvices
�and
�networks
,�integ
rating
�interope
rable�se
rvices
,�tech
nologies
,�and
�infras
truc
tures,�i.e.�electricity,�g
as,�h
eat,�and
�ICT.�
2010
-201
3NL
Grid�Au
tomation�Distribution
Integrated
�Sys
tem
Hom
e�ap
plication�-�C
ustomer�
Beh
avior�
172
SmartG
enSw
eco�Norge
�AS,�(N
O)
Dem
onstrate�and
�qua
ntify
�the�be
nefits�of�com
bining
�SGT�with�DG�and
�LM
�and
�sha
re�th
is�kno
wledg
e�with�stak
eholde
rs�and
�dec
ision�mak
ers�
in�priva
te�and
�pub
lic�sec
tor.�Dev
elop
�the�“S
martG
en�M
odels”
�which
�illus
trates
�both�en
ergy
�reso
urce
s�an
d�grid�in
form
ation�visu
ally�by�
combining
�SGT�sc
enarios�with�inpu
t�from�GIS�and
�NIS.
Oct�201
0-Se
pt�201
3
NO
Integrated
�Sys
tem
DK LV CH

Pr
ojec
t nam
eO
rgan
izat
ion
nam
e B
rief
pro
ject
des
crip
tion
Peri
odCo
untr
y*Pr
ojec
t cat
egor
y
173
Smart�g
reen
�circu
its,�ESB
�Networks
�-�Sm
art�g
rid�
demon
stration
�project
ESB�Networks
�(IE)
This�project�aim
s�to�ena
ble�the�crea
tion
�of�s
mart�g
reen
�circu
its,�th
roug
h�the�im
plem
entation
�of�tec
hnolog
y�to�re
duce
�distribution�loss
es,�improv
e�co
ntinuity�w
ith�se
lf�he
aling�loop
s,�optim
ally�use
�distribution�co
nnec
ted�
gene
ration
,�eva
luate�an
d�op
timize�sy
stem
�voltage
s�an
d�po
wer�fa
ctors�
and�inve
stigate�op
timal�sys
tem�sec
tion
alization�an
d�po
wer�flow
s.��
Jan�20
10�-�
Dec
�201
2IE
Grid�Au
tomation�Distribution
Integrated
�Sys
tem
Other
174
Smart�G
rid��
SEA
S�NVE�(D
K)
SEA
S�NVE�de
cide
d�to�dep
loy�the�NES
�sys
tem�fo
r�all�of�its�ne
arly�400
,000
�cu
stom
ers�to�ass
ist�w
ith�a�go
al�to
ward�en
ergy
�inde
pend
ence
.�The
�sy
stem
�will�help�them
�to�better�u
nderstan
d�the�op
eration�of�th
eir�g
rid�
and�co
mmun
icate�bi-direc
tion
ally�w
ith�their�c
ustomers�in�order�to
�better�
man
age�su
pply�and
�dem
and.
2008
�-�20
11DK
Smart�M
eter�and
�AMI
175
Smart�G
rid�Dem
onstration
�Sy
stem
Arqiva
�(UK)
Arqiva
�will�use
�its�de
dica
ted�UHF�sp
ectrum
,�com
bine
d�with�Se
nsus
’�pu
rpos
e�de
sign
ed�sec
urity�mea
sures,�to
�provide
�a�bes
poke
�co
mmun
ications
�network�for�ind
epen
dent�use
�by�the�UK’s�w
ater,�g
as�and
�elec
tric�utilities.
Apr�2
010-
Apr�2
011
UK
Integrated
�Sys
tem
176
Smart�g
rids
�and
�ene
rgy�
marke
tsClee
n�Oy,�(F
I)
Gen
eral�objec
tive
s�of�th
e�rese
arch
�program
�are:�c
reate�an
�inno
vation
�foun
dation
�for�n
ew�solutions
,�produ
cts�an
d�se
rvices
�to�ena
ble�the�
implem
entation
�of�the
�Smart�G
rids
�vision;�dem
onstration
s�of�solutions
�in�
real�env
iron
men
t;�cultiva
te�th
e�co
mpe
tenc
e�ac
cumulation�in�th
e�rese
arch
�an
d�bu
sine
ss�env
iron
men
ts�to
�sec
ure�the�long
�term
�com
petitive
ness
;�internationa
l�res
earch�co
operation�is�a�pre-req
uisite�to
�ach
ieve
�the�
objectives
.
Sept�200
9�-�
Sept�201
4FI
Integrated
�Sys
tem
177
Smart�G
rid�Fu
el�Cell�C
HP�on
�Bornh
olm,�F
orsk
EL�
Dan
therm�Pow
er�A/S
,�(D
K)
The�projec
t�will�in
trod
uce�po
wer�produ
cing
�elemen
ts�to
�the�Sm
art�G
rid�
implem
ented�in�th
e�“E
c-oG
rid.EU
”�projec
t�exe
cuted�on
�Bornh
olm.�T
he�
power�produ
cing
�elemen
ts�w
ill�be�ba
sed�on
�fuel�cell�tec
hnolog
y�an
d�will�
prod
uce�bo
th�electricity�and
�hea
t�for�e.g.�c
entral/d
istrict�h
eating
,�FCC
HP�
units.
Jan�20
11�
-Oct�201
1DK
Integrated
�Sys
tem
178
Smart�G
rid�Gotland
Vatten
fall�AB
�(SE)
The�Sm
art�G
rid�Gotland
�R&D�dem
onstration
�project�in
tend
s�to�dev
elop
�strategies
�for�t
he�plann
ing,�con
struction�an
d�op
eration�of�a�fu
lly�
deve
lope
d,�la
rge-sc
ale�sm
art�g
rid,�in
clud
ing�a�large�sh
are�of�in
term
ittent�
prod
uction
,�primarily
�from
�wind�po
wer�in
�the�distribu
tion
�network.�
Nov
�201
0�-�
Dec
�201
5SE
Integrated
�Sys
tem
179
Smart�G
rid�Ta
sk�Force
�project
Energine
t.dk
,��(TSO
),�
(DK)
To�des
cribe�an
d�ca
lculate�a�“D
anish�bu
sine
ss�cas
e�for�full�S
mart�G
rid�
diss
emination”
�from
�a�soc
io�eco
nomical�persp
ective
.Jan�20
09�-�
Sept�201
0DK
Other
180
Smart�H
eat�N
etworks
Salzbu
rg�AG�(A
T)
The�ob
jective�is�to
�ana
lyze
�and
�eva
luate�the�po
tential�o
f�Smart�G
rid�
conc
epts�fo
r�district�h
eating
�sys
tems�in�th
e�mod
el�re
gion
�of�S
alzb
urg.�
Dyn
amic�network�simulation�an
d�mod
el�calcu
lation
s�are�ap
plied�to�
inve
stigate�intellige
nt�ope
ration
�strateg
ies �an
d�co
ntrol�m
echa
nism
s�for�
the�redu
ction�of�pea
k�load
s.
Mar�201
0�-D
ec�201
2AT
Integrated
�Sys
tem

Pr
ojec
t nam
eO
rgan
izat
ion
nam
e B
rief
pro
ject
des
crip
tion
Peri
odCo
untr
y*Pr
ojec
t cat
egor
y
181
SmartH
ouse
/SmartG
rid
SAP�Re
search
�(DE)
The�Sm
artH
ouse
/SmartG
rid�projec
t�sets�ou
t�to�va
lidate�an
d�test�how
�ICT-en
abled�co
llabo
rative
�tech
nica
l-co
mmercial�agg
rega
tion
s�of�Smart�
Hou
ses�prov
ide�an
�ess
ential�step�to�ach
ieve
�the�ne
eded
�radica
lly�highe
r�leve
ls�of�e
nergy�effic
ienc
y�in�Europ
e.�
Not�
available�
NL
Hom
e�ap
plication�-�C
ustomer�
Beh
avior�
DE EL
182
Smart�M
etering��
Fortum
�(FI)
Fortum
�selec
ted�Ec
helon’s�NES
�Value
-Add
ed�Res
eller�p
artner�Telve
nt�
as�prime�co
ntractor�to
�sup
ply�the�NES
�(Networke
d�En
ergy
�Service
s)�
adva
nced
�metering�sy
stem
�integrated
�with�Te
lven
t’s�Smart�M
etering�
Titanium
�for�5
50,000
�cus
tomers�in�Finland
�in�order�to
�fulfill�ke
y�ob
jectives
�of�o
ffering�en
ergy
�sav
ing�an
d�ho
me�au
tomation�prog
rams�for�
homeo
wne
rs.
2010
�-�20
14FI
Smart�M
eter�and
�AMI
183
Smart�m
etering�
ZSE�Distribúc
ia�a.s.�-�
E.ON�group
,�(SK)
Test�differen
t�typ
es�of�two-way
�com
mun
ication�be
twee
n�the�meter�and
�ce
ntral�in�typica
l�areas
�of�a
pplic
ation.�Ass
ess�the�tech
nica
l�pos
sibilities�
and�iden
tify�ope
n�qu
estion
s�an
d�prob
lems.�
Jul�2
008-Oct�
2010
SK
Smart�M
eter�and
�AMI
184
Smart�M
etering�Multi�Utility�
Pilot
ELM€�Hálóz
ati�K
ft.�
(Electricity,�D
SO),�(H
U)
The�prim
ary�ob
jective�of�th
e�pilot�p
roject�is
�to�obtain�ex
perien
ce�in
�the�
field�of�e
stab
lishing
�a�pilo
t�project,�o
perating
�the�installed�pilot�s
mart�
metering�sy
stem
s,�and
�to�obtain�de
taile
d�an
d�ac
curate�in
form
ation�ab
out�
the�ad
vantag
es�and
�disad
vantag
es,�p
roblem
s�of�th
e�sm
art�m
etering�
system
.
Feb�20
11-
Aug�20
12HU
Smart�M
eter�and
�AMI
185
Smart�M
etering�NTA
�Roll�O
utEn
exis�(N
L)To
�introd
uce �the�NTA
-smart�m
eter�as�the�de
fault�m
eter�in
�all�proc
esse
s�an
d�to�be�read
y�for�t
he�obligations
�introd
uced
�by�the�ne
w�la
w.�Inv
olving
�the�co
ntracting�of�in
stallation
�cap
acity�an
d��training
�of�p
eople.
Jul�2
010-Dec
�20
11NL
Smart�M
eter�and
�AMI
186
Smart�m
etering��
proo
f�of�c
once
ptOres�(B
E)15
00�electricity�and
�gas
�smart�m
eters�will�be�installed�in�th
e�cities
�of�
Nivelles�an
d�Mare-en
-Fam
enne
.Jun�20
09�-�
Sept�201
2BE
Smart�M
eter�and
�AMI
187
Smart�n
eigh
boring
�hea
t�su
pply�bas
ed�on�grou
nd�hea
t�pu
mps
,�Forsk
EL
Solrød
�Mun
icipality�
(DK)
The�prop
osed
�projects�is�to
�dev
elop
�and
�dem
onstrate�th
e�co
ncep
t�of�‘n
eigh
boring
�hea
ting
’�bas
ed�on�sm
art�c
ontrol�of�a
�hea
t�pum
p�in�a�
combina
tion
�with�a �ho
t�water�storage
,�whe
re�th
e�po
ssibilities
�of�‘tapp
ing’�
chea
p�elec
tricity�from
�the�grid�in
�periods
�with�low�electricity�dem
and�or/
and�high
�wind�prod
uction
�are�ana
lyze
d�an
d�de
mon
strated.
Jan�20
11�-�
Apr�2
012
DK
Integrated
�Sys
tem
Spec
ific�Storag
e�Te
chno
logy
�Dem
onstration
188
Smart�P
ower�Sys
tem�-�First�
trial
ECN,�E
nergy�rese
arch
�Ce
ntre�of�the
�Nethe
rlan
ds�(N
L)
The�main�go
al�of�the
�field�test�w
as�to
�dem
onstrate�th
e�ab
ility�of�s
uch�
a�VPP
�to�re
duce
�the�loca
l�pea
k�load
�on�the�sing
le�lo
w-voltage
�grid�
segm
ent.�
2006
-200
7NL
Integrated
�Sys
tem
189
SyM2-Projec
tE.ON�Netz�AG
,�EnB
W,�
RWE�DAG
�(DE)
Toge
ther�w
ith�the�pa
rtne
rs�E.O
N�and
�EnB
W�in
�200
6�RW
E�laun
ched
�a�
projec
t�to�de
velop�a�ne
w�m
eter�fo
r �ind
ustrial�a
nd�com
mercial�app
lianc
es�
(I&C�meter).�The
se�kind�of�m
eters�are�de
ploy
ed�in
�German
y�at�cos
tumers�
with�an
�ann
ual�c
onsu
mption�>
�100
.000
kWh.
Jun�20
06-
Dec
�200
9DE
Smart�M
eter�and
�AMI

Pr
ojec
t nam
eO
rgan
izat
ion
nam
e B
rief
pro
ject
des
crip
tion
Peri
odCo
untr
y*Pr
ojec
t cat
egor
y
190
Smart�R
egion
CEZ�Distribuc
e�a.s.,�
(CZ)
Fully
�autom
ated
�and
�mon
itored
�LV�and
�MV�grid,�balan
ced�distribu
tion
�grid�w
hich
�can
�eas
ily�switch
�betwee
n�island
�and
�normal�ope
ration
�mod
e,�
high
er�qua
lity�an
d�se
curity�of�p
ower�sup
ply,�CHP�un
its�an
d�rene
wab
les�
operation.
2011-201
4CZ
Grid�Au
tomation�Distribution
Integrated
�Sys
tem
191
Smart�S
ynergy
Salzbu
rg�AG�(A
T)
For�S
mart�G
rid�an
d�e-mob
ility�app
lications
�differen
t�data�an
d�inform
ation�ha
ve�to
�be�reco
rded
�and
�distributed
�with�differen
t�tec
hnical�
requ
irem
ents,�w
hich
�also�fund
amen
tally
�affec
ts�th
e�co
nstruc
tion
�cos
ts�of�
ICT�infras
truc
ture.�T
he�syn
ergistic�use
s�of�IC
T�infras
truc
ture�fo
r�multiple�
applications
�includ
ing�the�va
lidation�of�th
e�ac
tual�re
alizab
le�syn
ergies
�are�ke
y�ob
jectives
�of�the
�project.
Jun�20
10�
-May
2012
ATIntegrated
�Sys
tem
192
Smart�W
atts�
Utilic
ount�GmbH
�&�Co.�
KG,�A
ache
n,�(D
E)
The�Sm
art�W
atts�projects�im
plem
ents�th
e�co
ncep
t�of�the
�‚smart�w
att‘,�
i.e.�the
�intellige
nt�kilo
watt�h
our:�an�op
en�sys
tem,�w
hich
�ena
bles
�new
�se
rvices
,�value
�add
ed�and
�increa
sed�effic
ienc
y�for�u
tility�co
mpa
nies
,�de
vice
�man
ufac
turers,�s
ervice
�provide
rs�and
�con
sumers.
Nov
�200
8-Se
pt�201
2DE
Smart�M
eter�and
�AMI
Hom
e�ap
plication�-�C
ustomer�
Beh
avior�
Integrated
�Sys
tem
193
Smart�W
eb�Grid
Salzbu
rg�AG�(A
T)
Future�smart�g
rids
�will�re
ly�on�da
ta�exc
hang
e�be
twee
n�differen
t�ap
plications
�and
�marke
t�participa
nts.�Smart�W
eb�Grid�an
alyz
es�use
r�interaction,�te
chno
logy
,�cos
t�effec
tive
ness
�and
�data�se
curity�of�s
uch�a�
data�exc
hang
e�by
�mea
ns�of�three
�con
crete�ex
amples
�in�th
e�mod
el�re
gion
�Sa
lzbu
rg.�T
he�goa
l �is�the�co
ncep
tual�des
ign�of�an�inform
ation�mod
el�fo
r�Web
�service
-bas
ed�acces
s�to�smart�g
rids
�data�so
urce
s.
Mar�201
1�-�
Feb�20
13AT
Integrated
�Sys
tem
194
STAm
i:�Ad
vanc
ed��
Metering�Interfac
eEn
el�SpA
�(IT)
The�projec
t�aim
s�at�dev
elop
ing�a�de
dica
ted�ap
plication�for�L
V�network�
man
agem
ent�a
nd�bus
ines
s�pu
rpos
es�w
hich
�leve
rage
s�the�ex
isting
�metering�infras
truc
ture.�S
TAmi�p
rovide
s�ne
twork�op
erators�with�a�
dedica
ted�web
�interfac
e�to�collect,�o
n�de
man
d�an
d�real-tim
e,�spe
cific
�high
�qua
lity�an
d�ac
curate�data�stored
�in�smart�m
eters�witho
ut�
addition
al�lo
ad�fo
r�the
�Adv
ance
d�Meter�M
anag
emen
t�(AMM)�s
ystem.�
Both�the�op
erators�in�th
e�co
ntrol�roo
m,�in�the�ba
ck�office
�and
�on�fie
ld�
work�op
erators�(via�ta
blet�PC)�are�provide
d�with�a�de
dica
ted�su
ite�of�
func
tion
alities�an
d�tools�ba
sed�on
�web
�interfac
es.
Jan�20
10�-�
Jan�20
11IT
Smart�M
eter�and
�AMI
195
Star
Iberdrola�Distribuc
ion�
(ES)
The�projec
t�aim
s�at�in
tegrating�10
0k�smart�m
eters�with�a�va
riety�of�
equipm
ent�m
anufac
turers�and
�com
mun
ications
�into�an�Ad
vanc
ed�
Metering�Man
agem
ent�(AMM)�S
ystem�and
�man
age�it�re
motely.�Build�an�
interope
rable�an
d�future�proof�solution�for�s
mart�m
etering.
Apr�2
010�-�
Mar�201
1ES
�
Smart�M
eter�and
�AMI
Grid�Au
tomation�Distribution
Integrated
�Sys
tem

Pr
ojec
t nam
eO
rgan
izat
ion
nam
e B
rief
pro
ject
des
crip
tion
Peri
odCo
untr
y*Pr
ojec
t cat
egor
y
196
Steink
jer�P
ilot�P
roject
The�Norweg
ian�Sm
art�
Grid�Ce
ntre,�(NO)
The�projec
t�objec
tive
�is�to
�prepa
re�fo
r�the
�nationa
l�roll-ou
t�of�s
mart�
metering�infras
truc
ture�i.e.�building�kn
owledg
e,�te
sting�of�differen
t�tech
nologies
�and
�interope
rability.�
Jan�20
11-D
ec�
2015
NO
Integrated
�Sys
tem
Hom
e�ap
plication�-�C
ustomer�
Beh
avior�
197
Stoc
kholm�Roy
al�sea
port�pre-
stud
y�ph
ase
Fortum
�Distribution�
AB�(F
I)
The�pre-stud
y�for�S
tock
holm
�Roy
al�Sea
port�-�an
�urban
�smart�g
rid�
area
,�will�deliver�a�con
cept�des
cription
�includ
ing�marke
t�mod
els�an
d�de
scription�of�te
chnica
l�solutions
�read
y�for�implem
entation
�and
�testing�
as�a�new
�project�pha
se.�
Oct�201
0�-�
Mar�201
1SE
Smart�M
eter�and
�AMI
Grid�Au
tomation�Distribution
Integrated
�Sys
tem
Hom
e�ap
plication�-�C
ustomer�
Beh
avior�
Spec
ific�Storag
e�Te
chno
logy
�Dem
onstration
Other
198
Storstad
��Sm
art�M
etering
E.ON�Sve
rige
�AB�(S
E)
Eche
lon’s�Network�En
ergy
�Service
s�sy
stem
�provide
s�E.ON�w
ith�an
�ope
n,�
bidirectiona
l,�an
d�ex
tens
ible�in
fras
truc
ture�th
at�ena
bles
�a�com
preh
ensive
�rang
e�of�utility�ap
plications
�that�bring
s�be
nefits�to�eve
ry�asp
ect�o
f�their�o
peration
,�from�m
etering,�to
�cus
tomer�service
s,�to
�distribution�
operations
,�to�va
lue-ad
ded�se
rvices
.
2006
�-�20
09SE
Smart�M
eter�and
�AMI
199
SUMO
Elek
tro-Slov
enija
�(TSO
),�(S
I)
Dyn
amic�th
ermal�ra
ting
�will�be�inco
rporated
�in�SCAD
A/EM
S�en
vironm
ent.�
Network�an
alys
es�w
ill�use
�nea
r�rea
l�tim
e�sy
stem
�cap
abilities
.�Calcu
lation
�of�elemen
t�ratings
�will�use
�ambien
t�param
eters�from
�releva
nt�
geog
raph
ical�areas
.
2011-201
4SI
not�a
vaila
ble
200
Supe
rmen
Iskra�MIS�d.d.�(SL
)
Optim
ization�of�th
e�op
eration�of�distribution�as
sets�and
�improv
e�the�
effic
ienc
y�of�th
e�ne
twork�throug
h�en
hanc
ed�autom
ation,�m
onitoring,�
protec
tion
�and
�real�time�op
eration.�Fas
ter�fau
lt�id
entific
ation/
reso
lution
�will�help�im
prov
e�co
ntinuity�of�s
upply�leve
ls.
Sept�200
9�-�
Jan�20
11SI
Integrated
�Sys
tem

Pr
ojec
t nam
eO
rgan
izat
ion
nam
e B
rief
pro
ject
des
crip
tion
Peri
odCo
untr
y*Pr
ojec
t cat
egor
y
201
SUSPL
AN
SIN
TEF�
ENER
GIFORSKNIN
G�
A/S�(N
O)
The�ov
erall�impa
ct�from
�SUSPL
AN�is
�con
tribution�to�a�sub
stan
tially�
increa
sed�sh
are�of�re
newab
le�ene
rgy�so
urce
s�(R
ES)�in�Eu
rope
�at�a
n�ac
ceptab
le�le
vel�o
f�cos
t,�th
ereb
y�increa
sing
�sec
urity�of�sup
ply�an
d�co
mpe
titive
ness
�of�R
ES�in
dustry.�T
he�m
ain�ob
jective�is�to
�dev
elop
�gu
idelines
�for�m
ore�effic
ient�in
tegration�of�RES
�into�fu
ture�in
fras
truc
tures�
as�a�sup
port�fo
r�dec
ision�mak
ers�at�re
gion
al�as�well�a
s�Pa
n-Eu
rope
an�
leve
l.�Th
e�gu
idelines
�sha
ll�co
nsist�o
f�strateg
ies,�re
commen
dation
s,�
criteria�and
�ben
chmarks
�for�p
olitical,�infrastructure�an
d�ne
twork�de
cision
�mak
ers�an
d�po
wer�distributors�with�a�time�pe
rspe
ctive�20
30-205
0.
Sept�200
8-Se
pt�201
1
PL
Other
RO DE AT UK
NL
ES�
BG CZ IT RS
202
Sustaina
ble�urba
n�liv
ing
Fortum
�Electricity�
solution
s�an
d�distribu
tion
�(FI)
Dev
elop
�a�new
�building�co
ncep
t�for�urban
�reside
ntial�c
onstruction�aiming�
to�m
inim
ize�the�en
ergy
�con
sumption�an
d�en
able�cus
tomers�to�m
ake�
intellige
nt�cho
ice�for�c
onse
rving�en
ergy
.
Sept�200
9�-�
Dec
�201
3FI
Integrated
�Sys
tem
Hom
e�ap
plication�-�C
ustomer�
Beh
avior�
203
Swiss2
GKraftwerke
�Obe
rhas
li�(K
WO),�(C
H)
The�go
al�of�the
�project�is
�the�de
velopm
ent�o
f�an�algo
rithm�w
hich
�allo
ws�a�
grid�con
nected
�dev
ice�to�id
entify�th
e�status
�of�the
�(distribution)�grid�an
d�to�m
ake�ap
prop
riate�ac
tion
s�to�stabiliz
e�an
d�im
prov
e�its�be
havior.
2010
-201
3CH
Grid�Au
tomation�Distribution
204
System
�outpu
t�project
Not�ava
ilable
To�ach
ieve
�regu
lation
�reso
urce
s�that�can
�sup
port�th
e�sa
fe�and
�efficien
t�op
eration�of�th
e�elec
tricity�sy
stem
�and
�also�crea
te�th
e�ba
sis�for �
realization�of�con
tinu
ous�co
st�sav
ing.
Jan�20
10�-�
Dec
�201
0�DK
Integrated
�Sys
tem
205
System
s�with�High�Le
vel�
Integration�of�Ren
ewab
le�
Gen
eration�Units
Dep
artm
ent�o
f�Ene
rgy�
Tech
nology
�–�Aalbo
rg�
Unive
rsity,�(D
K)
The�projec
t�dev
elop
ed�proba
bilis
tic�metho
ds�fo
r�optim
um�ope
ration
�and
�plan
ning
�of�c
ontempo
rary�distribution�sy
stem
s,�in
clud
ing�prob
abilistic�
mod
els�for�w
ind�po
wer,�s
mall-sc
ale�CH
P�plan
ts�and
�load
.
Jan�20
07�-�
Dec
�200
9DK
Integrated
�Sys
tem

Pr
ojec
t nam
eO
rgan
izat
ion
nam
e B
rief
pro
ject
des
crip
tion
Peri
odCo
untr
y*Pr
ojec
t cat
egor
y
206
Telege
store
Enel�Distribuz
ione
�(IT)
Enel’s�Teleg
estore�Project�provide
s�the�installation
�of�m
ore�than
�32�
million�sm
art�m
eters.��T
hese
�smart�m
eters�allow�Ene
l�to�pe
riod
ically�
colle
ct�data�on
�voltage
�qua
lity�an
d�interrup
tion
s,�daily�con
sumptions
,�ac
tive
�and
�reac
tive
�ene
rgy�mea
suremen
ts,�a
nd�re
motely�man
age�
contractua
l�activities.��M
eters�are�ab
le�to
�tran
smit�data�rega
rding�
cons
umptions
,�rec
eive
�upd
ates
�of�the
�con
trac
tual�param
eters�an
d�remotely�man
age�the�su
pply�con
nectivity.
Dec
�200
1�-�
Dec
�200
6IT
Smart�M
eter�and
�AMI
207
Tertiary�re
serve�po
wer�w
ith�
zero�CO2�em
ission
Elek
tro-Slov
enija
�(TSO
),�(S
I)
Dem
and�side
�man
agem
ent�a
nd�re
newab
le�produ
cers�w
ill�be�integrated
�in�TSO
’s�anc
illary�se
rvices
�as�ad
dition
al�te
rtiary�re
serve�po
wer�fo
r�loa
d�freq
uenc
y�co
ntrol.
2011-201
4SI
not�a
vaila
ble
208
The�ce
ll�co
ntrolle
r�project
Energine
t.dk
,��(TSO
),�
(DK)
Via�a�full-sc
ale�Sm
art�G
rid�de
velopm
ent�a
nd�dem
onstration
�project�in
�a�
60�kV�distribution�grid�it�is
�sou
ght�to�ac
hiev
e�su
fficien
t�kno
wledg
e�an
d�a�ba
sis�for�a
�long
-term�re
-des
ign�proc
ess,�in
�order�to
�turn�th
e�trad
itiona
l�pa
ssive�distribu
tion
�grids
�into�active�grids�that�can
�optim
ally�utiliz
e�the�
grow
ing�vo
lume�of�dec
entralized
�produ
ction.
Nov
�200
4�-�
Oct�201
1DK
Grid�Au
tomation�Distribution
209
The�metering�da
ta�proce
ssing�
and�ce
ntral�rep
ository�
conc
ept
PSE�Ope
rator�S
.A.(PL
)
The�go
al�of�the
�project�is
�to�prepa
re�cos
t�ben
efit�a
nalysis�of�smart�
metering�im
plem
entation
�in�Polan
d�an
d�to�dev
elop
�the�lega
l�and
�orga
niza
tion
al�fram
ework�to��implem
ent�m
etering�da
ta�proce
ssing�an
d�ce
ntral �rep
ository�co
ncep
t.��
Jan�20
10-�
Mar�201
1PL
Integrated
�Sys
tem
210
Trials�w
ith�he
at�pum
ps�on�
spot�agree
men
tsSy
dEne
rgi,��(D
SO),��
(DK)
The�ob
jective�of�th
e�projec
t�is�to�gain�kn
owledg
e�of�th
e�tech
nica
l�ch
alleng
es�of�e
stab
lishing
�a�hea
t�pum
p�so
lution
�in�priva
te�hou
seho
lds�in�
orde
r�to�plan
�the�he
at�pum
p’s�elec
tricity�co
nsum
ption�for�w
hen�elec
tricity�
prod
uction
�is�highe
st/g
reen
est.�
Mar�201
0�-�
Dec
�201
1DK
Smart�M
eter�and
�AMI
Grid�Au
tomation�Distribution
211
TWEN
TIES
Red�Eléc
trica�de
�Es
paña
�(REE
)�(ES)
TWEN
TIES
�Project�aim
s�to�dem
onstrate�th
roug
h�real-life
,�large
-sca
le�
demon
stration
s,�th
e�be
nefits�an
d�im
pact�of�s
everal�critica
l�typ
es�of�
tech
nology
�requ
ired
�to�im
prov
e�the�Eu
rope
an�tran
smission
�network,�th
us�
giving
�Europ
e�the�ab
ility�to
�increa
se�th
e�sh
are�of�re
newab
les�in�its�en
ergy
�mix�by�20
20�and
�bey
ond,�w
hile�kee
ping
�its�pres
ent�reliability.
2010
-201
3
DK
Grid�Au
tomation�Tran
smission
ES�
FR BE
212
Vehicle�to�Grid�-�Interface
sSa
lzbu
rg�AG�(A
T)
New
�con
cepts�for�u
ser�interface
s�for�e
-mob
ility�cos
tumers�within�the�
Smart�G
rids
�mod
el�re
gion
�of�S
alzb
urg�are�de
velope
d;�param
eters�an
d�co
st/b
enefi
ts�of�a
�future�Veh
icle�to
�Grid�im
plem
entation
�will�be�ev
alua
ted�
by�th
is�fe
asibility�study
.
Jun�20
10-
May
�201
1AT
Other
213
Vehicle�to�Grid�-�S
trateg
ies
Salzbu
rg�AG�(A
T)Th
e�op
tion
s�of�sys
tem�re
lated�e-mob
ility�in
tegration�in�urban
�and
�rural�
case
�studies
�are�ana
lyze
d�de
veloping
�active�grid�in
tegration�as
�well�a
s�ne
w�bus
ines
s�mod
els�for�G
rid�to�Veh
icle�and
�Veh
icle�to
�Grid�co
ncep
ts.
Jun�20
10�- �
Dec
�201
2AT
Other

Pr
ojec
t nam
eO
rgan
izat
ion
nam
e B
rief
pro
ject
des
crip
tion
Peri
odCo
untr
y*Pr
ojec
t cat
egor
y
214
Virtua
l�Pow
er�Plant
RWE�DAG
�(DE)
The�aim�of�this�pilot�p
roject�is
�the�de
mon
stration
�of�the
�tech
nica
l�and
�ec
onom
ical�fe
asibility�of�the
�VPP
�con
cept-W
ithin�the�projec
t�duration�
furthe
r�dec
entralized
�pow
er�produ
cer,�lik
e�CH
P,�Biomas
s�or�W
ind�
turbines
,�will�be�includ
ed�in
to�th
e�VPP
.
2008
-201
0DE
Integrated
�Sys
tem
215
WAMPA
CElek
tro-Slov
enija
�(TSO
),�(S
I)
Existing
�wide�area
�mea
suremen
t�sys
tem�w
ill�be�up
grad
ed�w
ith�protec
tion
�an
d�co
ntrol�fun
ctions
.�Relev
ant�c
ritica
l�ope
ration
�sce
narios
�will�be�
inve
stigated
�in�due
�cou
rse.�
2011-201
4SI
not�a
vaila
ble
216
web
2ene
rgy
HSE�AG
�(DE)
The�projec
t�Web
2Ene
rgy�is�direc
ted�to�im
plem
ent�a
nd�app
rove
�all�
three�pilla
rs�of�“
Smart�D
istribution”
.�Smart�M
etering�–�the�co
nsum
er�
participates
�in�th
e�en
ergy
�marke
t�Smart�E
nergy�Man
agem
ent�–
�Clustering�
of�small�p
ower�produ
cers.�S
mart�D
istribution�Au
tomation�–�high
er�
relia
bility�of�sup
ply.
Jan�20
10-
Dec
�201
2
DE
Smart�M
eter�and
�AMI
NL
Grid�Au
tomation�Tran
smission
ATSm
art�M
eter�and
�AMI
PLGrid�Au
tomation�Tran
smission
CH�
217
WIN
DGRID
RED
�ELE
CTRICA�DE�
ESPA
ÑA,�S.A.�(ES
)
Wind�on
�the�Grid�is�a�project�fo
cuse
d�on
�prepa
ration
�of�the
�Europ
ean�
elec
tricity�ne
twork�for�t
he�la
rge-sc
ale�integration�of�w
ind�farm
s�throug
h�the�de
sign
,�dev
elop
men
t�and
�validation�of�new
�tools�an
d�de
vice
s�for�its�
plan
ning
,�con
trol�and
�ope
ration
�in�a�com
petitive
�marke
t.
Dec
�200
6�-D
ec�200
9
ES�
Other
PT DK SI IT CZ DE
218
Zone
�con
cept�and
�smart�
protec
tion
�pilo
tFo
rtum
�Sah
kons
iirto�
Oy�(FI)
The�pilot�a
ims�to�te
st�a�smart�p
rotection�co
ncep
t�which
�sho
uld�redu
ce�
the�ou
tage
�times
�and
�autom
ation �inve
stmen
t�nee
ds.�T
he�sys
tem�con
sists�
of�cen
tral�unit�in�the�prim
ary�su
bstation
�which
�ana
lyse
s�the�ne
twork�
status
�and
�faults.
2010
�-�20
13FI
Grid�Au
tomation�Distribution
219
ZUQDE
Salzbu
rg�AG�(A
T)ZU
QDE�will�dev
elop
�furthe
r�the
�DMS�ap
plication�Vo
lt/v
ar�Con
trol�(V
VC)�to�
keep
�a�certain�voltage
�leve
l�in�the�who
le�distribution�ne
twork�with�a�high
�pe
netration�of�Distributed
�Gen
eration�(D
G).��
Jul�2
010-
May
�201
2AT
Grid�Au
tomation�Distribution

European Commission
EUR 24856 EN – Joint Research Centre – Institute for Energy
Title: Smart Grid projects in Europe: lessons learned and current developments
Authors: Vincenzo Giordano, Flavia Gangale, Gianluca Fulli (JRC-IE), Manuel Sánchez Jiménez (DG ENER)Other JRC-IE contributors: Ijeoma Onyeji, Alexandru Colta, Ioulia Papaioannou, Anna Mengolini, Corina Alecu, Tauno Ojala, Isabella Maschio
Luxembourg: Publications Office of the European Union2011 – 118 pp. – 21.0 x 29.7 cmEUR – Scientific and Technical Research series – ISSN 1831-9424 ISBN 978-92-79-20487-6 Catalogue number LD-NA-24856-EN-N doi:10.2790/32946
AbstractThe main goal of this study is to provide a complete catalogue of Smart Grid projects in Europe to date and use project data to support analysis on trends and developments. The report looks into several aspects of the Smart Grids landscape to describe the state of the art of their implementation, the emerging hallmarks of the new electricity system and the foreseeable developments. A key focus of the Report is to describe how Smart Grid projects address and respond to the EU energy policy challenges and to point out potential benefits and benefi-ciaries. Particular attention is devoted to identifying the most important obstacles to investments and the possible solutions that could help to overcome them.

The mission of the Joint Research Centre (JRC) is to provide customer-driven scientific and technical sup-port for the conception, development, implementation and monitoring of European Union policies. As a service of the European Commission, the JRC functions as a reference centre of science and technology for the Union. Close to the policy-making process, it serves the common interest of the Member States, while being independent of special interests, whether private or national.
LD-NA-248
56-EN-N