Embed Size (px)
Citation preview

Journal of Mechatronics, Electrical Power, and Vehicular Technology 10 (2019) 36–47
Journal of Mechatronics, Electrical Power, and Vehicular Technology
e-ISSN: 2088-6985
p-ISSN: 2087-3379
www.mevjournal.com
doi: https://dx.doi.org/10.14203/j.mev.2019.v10.36-47
2088-6985 / 2087-3379 ©2019 Research Centre for Electrical Power and Mechatronics - Indonesian Institute of Sciences (RCEPM LIPI).
This is an open access article under the CC BY-NC-SA license (https://creativecommons.org/licenses/by-nc-sa/4.0/).
Accreditation Number: (LIPI) 633/AU/P2MI-LIPI/03/2015 and (RISTEKDIKTI) 1/E/KPT/2015.
Smart grid photovoltaic system pilot scale using sunlight intensity and state of charge (SoC) battery based on
Mamdani fuzzy logic control
Kamil Faqih a, *, Wahyu Primadi a, Anik Nur Handayani a, Ari Priharta a, Kohei Arai b a Electrical Engineering Postgraduate, Electrical engineering Department, Universitas Negeri Malang
Jl. Semarang No 5. Sumbersari, Lowokwaru, Malang, East Java, Indonesia b Department of Information Science, Saga University
1 Honjo-machi, Saga-city, Saga, 840-8502, Japan
Received 13 August 2019; accepted 12 December 2019; Published online 17 December 2019
Abstract
The Utilization of renewable energy such as a photovoltaic system is the foremost alternative in transfers generated by
conventional power plants, but the lack of photovoltaics is support for light intensity. The purpose of this research is to develop a pilot-scale smart grid photovoltaic system that can regulate the supply of electrical energy from either the battery
or the power supply. The control system in this study uses the Mamdani fuzzy logic method in determining automatic system performance. This system monitors the intensity of light and battery which are then used as automatic safety parameters on
the power supply, battery, and photovoltaic. The results of this study display the indicator results from the microcontroller in supplying electrical energy for the use of electrical loads, Power Supply has been served the load when the battery is in a low
state which have a voltage <11 Volts, the battery has been served the load when the condition of the battery is in a medium
and high condition which has a voltage of 11.5 <; ....; <13 Volts. PV has been served batteries or loads when the light intensity is cloudy and bright which have a light intensity of 3585 <; ...; <10752 Lux. This system can reduce dependence on
conventional energy without reducing the quality of the energy supply at load and Photovoltaic system dependence on light intensity does not affect the supply of energy consumption to electrical loads.
©2019 Research Centre for Electrical Power and Mechatronics - Indonesian Institute of Sciences. This is an open access article under the CC BY-NC-SA license (https://creativecommons.org/licenses/by-nc-sa/4.0/).
Keywords: renewable energy; photovoltaic systems; fuzzy logic.
I. Introduction
The benefits of photovoltaic panels can be relied upon especially in areas that have high sunlight intensity and high temperature. Most of the electrical energy sources for electricity generation come from fossil fuels. While fossil fuel reserves on earth are increasingly limited so the price of electricity is getting more expensive every time. Fossil fuels themselves are fuels formed from the bowels of the earth which have been used for millions of years. At this time fossil fuel reserves in nature are increasingly scarce. This is caused by the use of electricity which is too dependent on fossil-powered electricity. Solar electronic devices utilize photovoltaic cells (PV) which are used to produce small power but are
relatively expensive devices, where the costs can be easily absorbed [1]. The development of hybrid systems on smart grids that prioritize Utility Grid as the main electricity source does not provide significant changes to the creation of environmentally friendly technology.
Green technology and smart grid technology have changed the use of electricity to become more efficient. This technology enables power system operators and consumers to increase energy efficiency and reduce greenhouse gas emissions (eg carbon dioxide) by optimizing energy distribution and management [2][3]. This study uses PV as the main source of smart grid systems which hybrid with conventional energy, so that the supply of electricity is more efficient and the electrical load remains stable.
The high price of PV devices and batteries that are not comparable to the energy produced, this study uses a source of electricity and a pilot-scale electric load (lite scale) that still meets the stability
* Corresponding Author. Tel: +62 819 4976 1774
E-mail address: [email protected]

K. Faqih et al. / Journal of Mechatronics, Electrical Power, and Vehicular Technology 10 (2019) 36–47 37
requirements of electricity supply with energy-efficient and environmentally friendly loads. Research on the use of smart grid pilot project PV systems has been developed by Ramakrishna Kappagantu (2015) [4]. with the theme of obstacle analysis of the system implementation of a smart pilot solar PV roof project in the Puducherry area. This system utilizes PV that is hybridized with a utility grid without utilizing a battery as a backup. So that it can reduce the dependence on the utility grid during the day and when the intensity of sunlight is high. Without utilizing the battery SoC system, this research is less than optimal in suppressing the dependence on the utility grid.
The application of fuzzy logic (Fuzzy Inference System, hereinafter abbreviated as FIS) can be done using various methods, including the Tsukamoto method, the Mamdani method, and the Takagi-Sugeno method [5]. In the Mamdani method, the application of the implication function uses MIN, while the composition of the rules uses the MAX method [6]. The output of the inference results for each rule is expressed in z, which is in the form of a regular set (crisp) determined based on its µ-predicate (degree of membership). The final result is obtained using the weighted average. The Sugeno method is similar to the Mamdani method, only that the (consequent) output is not a fuzzy set, but a constant or linear equation [7]. The value generated from the light intensity and battery voltage in this study, the system is used as an automatic control for power supply.
The fuzzy logic method used as a control in a photovoltaic system was developed by Neerparaj Rai (2018) [8] with the theme of fuzzy logic-based control on a hybrid PV-Battery system independently for DC loads. This research focuses on the use of PV and batteries to serve electricity loads. This system works without relying on energy sources from the utility grid so that the stability of the load supply is less than the maximum. Similar research has been developed by (Sofia Lalouni and Djamila Rekioua) (2009) with the theme of modeling and simulation of a photovoltaic system using fuzzy logic controller [9], the basis of this system was developed for maximum power point tracking (MPPT) control simulations aimed at maximizing supply of electricity from PV, this research is still in the form of simulation, so there is no real scale of the system. Many other studies on MPPT-based PV systems, such as those developed by C. S. Chin and K. T. K. Teo (2011) with the theme of MPPT-based fuzzy logic for PV modules that are influenced by solar radiation and cell temperature [10].
This system utilizes solar radiation and cell temperature to maximize the power supply from photovoltaics, This system does not utilize battery back up SoC and without hybrid with the utility grid. other studies based on MPPT were developed by Chia Seet Chin and Yit Kwong Chin (2012) with the theme of MPPT-based fuzzy logic for PV arrays in partially shaded conditions [11]. This system was developed to stabilize the power supply in PV when some of the PV modules shine in the sunlight, The stability of the electrical load in this study is less than the maximum
because it does not utilize batteries and hybrid with a utility grid. Another MPPT-based fuzzy logic research system developed by Ayaz Ahmad and Dr. L. Rajaji (2013) with the theme of Modeling and Design of Novel Control Algorithms for Grid-Connected Photovoltaic (PV) Inverters [12]. This system was developed to maximize the power supply from the inverter connected to the inverter, this research only maximizes inverter performance without maximizing PV and SoC batteries for load supply. Other research has been conducted by Efrain Bernal, et al (2017) [13] on fuzzy-based reactive power control for smart PV inverters in LV distribution systems. The research can reduce the reactive power injection of the PV and minimize the increase of the voltage and power loss. However, this research only stabilizes the performance at the PV inverter without considering the battery SoC.
Previous research on photovoltaic systems with fuzzy logic control has been developed with the theme of fuzzy logic on energy management from photovoltaics for solar homes developed by Fathia Chekired (2017) [14]. This research presents a strategy in supplying electricity load from a photovoltaic network system back up, where this system utilizes a Photofoltaik network as a backup energy source, while the main energy source uses a utility grid. Fuzzy logic control in this study focuses on photovoltaic systems and the use of loads without involving the utility grid. Input data used in this study is the production of power in PV, the power stored in batteries, then the use of loads on consumers, this research is still less than optimal in reducing dependence on utility grids because the PV system and battery are not as main electrical energy but are still as back up of electrical energy.
Research developed by Ramakrishna Kappagantu has no battery system, so the renewable energy system is less than optimal in reducing dependence on conventional sources of energy. While the research by Neeparaj Rai, the system has not utilized the renewable energy sources without utilizing conventional energy sources, so that the load is only supplied by PV that works optimally when the environment is supportive. Other research developed by Fathia Chekired renewable energy systems has not been a primary source (back up). So it still depends on the utility grid as the main source.
The purpose of this study is to create a device system on a pilot-scale that can to automatically control energy supply by adjusting environmental conditions. the novelty in this study is to prioritize renewable energy as the main source and power supply as a back up of energy. With this pilot-scale system, it is expected that the electrical load can reduce dependence on conventional energy.
II. Materials and Methods
A. Hardware construction
The control circuit is designed by adjusting the shape of the solar cell monitoring trainer, where the trainer is equipped with a PV with a capacity of 100 Wp which is located separately from the trainer, an LDR sensor to measure the intensity of light placed in
K. Faqih et al. / Journal of Mechatronics, Electrical Power, and Vehicular Technology 10 (2019) 36–47
38
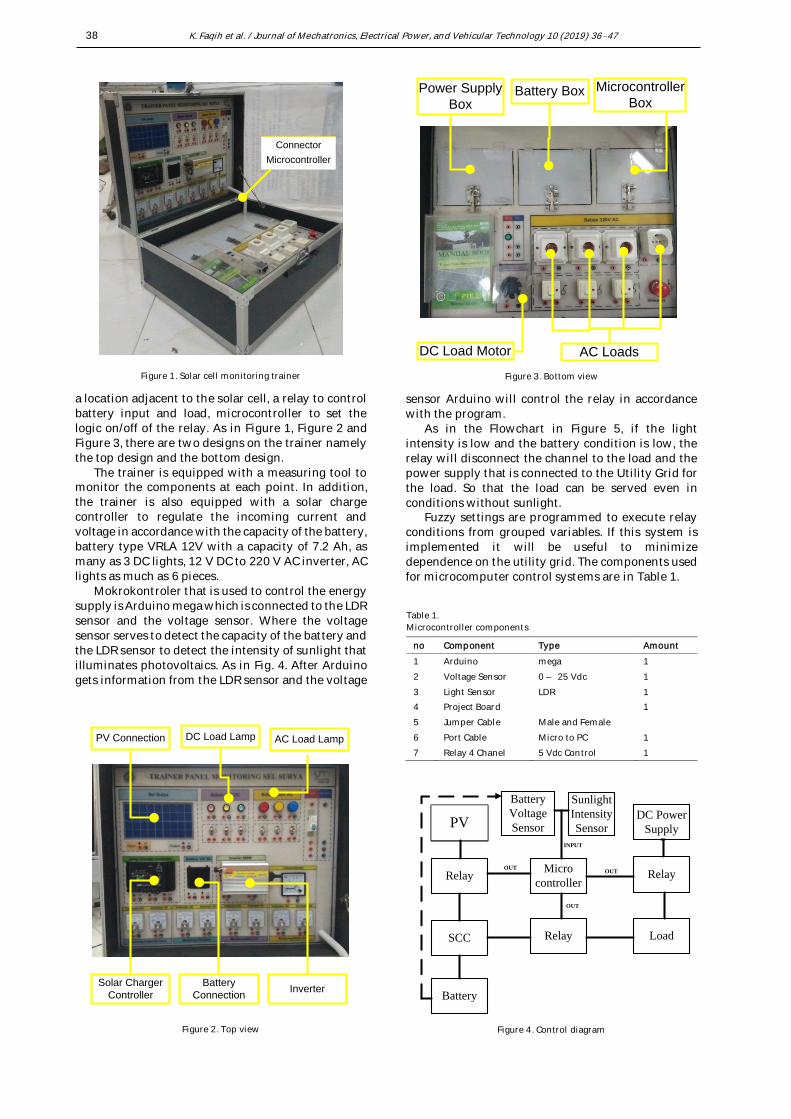
a location adjacent to the solar cell, a relay to control battery input and load, microcontroller to set the logic on/off of the relay. As in Figure 1, Figure 2 and Figure 3, there are two designs on the trainer namely the top design and the bottom design.
The trainer is equipped with a measuring tool to monitor the components at each point. In addition, the trainer is also equipped with a solar charge controller to regulate the incoming current and voltage in accordance with the capacity of the battery, battery type VRLA 12V with a capacity of 7.2 Ah, as many as 3 DC lights, 12 V DC to 220 V AC inverter, AC lights as much as 6 pieces.
Mokrokontroler that is used to control the energy supply is Arduino mega which is connected to the LDR sensor and the voltage sensor. Where the voltage sensor serves to detect the capacity of the battery and the LDR sensor to detect the intensity of sunlight that illuminates photovoltaics. As in Fig. 4. After Arduino gets information from the LDR sensor and the voltage
sensor Arduino will control the relay in accordance with the program.
As in the Flowchart in Figure 5, if the light intensity is low and the battery condition is low, the relay will disconnect the channel to the load and the power supply that is connected to the Utility Grid for the load. So that the load can be served even in conditions without sunlight.
Fuzzy settings are programmed to execute relay conditions from grouped variables. If this system is implemented it will be useful to minimize dependence on the utility grid. The components used for microcomputer control systems are in Table 1.
PV Connection DC Load Lamp AC Load Lamp
Solar Charger
Controller
Battery
ConnectionInverter
Figure 2. Top view
Table 1.
Microcontroller components
no Component Type Amount
1 Arduino mega 1
2 Voltage Sensor 0 – 25 Vdc 1
3 Light Sensor LDR 1
4 Project Board 1
5 Jumper Cable Male and Female
6 Port Cable Micro to PC 1
7 Relay 4 Chanel 5 Vdc Control 1
Figure 4. Control diagram
PVPV
Battery
Voltage
Sensor
Sunlight
Intensity
SensorDC Power
Supply
Micro
controller
SCC
Relay
Relay
Relay
Battery
Load
INPUT
OUTOUT
OUT
AC LoadsDC Load Motor
Power Supply
BoxBattery Box Microcontroller
Box
Figure 3. Bottom view
Connector
Microcontroller
Figure 1. Solar cell monitoring trainer
K. Faqih et al. / Journal of Mechatronics, Electrical Power, and Vehicular Technology 10 (2019) 36–47 39
Before going to the testing phase, we conducted a simulation using the proteus application as shown in Figure 6. The simulation was conducted aiming to find out the working principle of the microcontroller circuit to be operated The circuit simulation component uses Arduino Uno, four batteries with different conditions, a relay equipped with L1 and L2 and L3 for on or off indicators.
B. Fuzzy smart control
The decision-making process is carried out using the Fuzzy Mamdani Method. Several previous studies using the Mamdani fuzzy method are the Mamdani fuzzy inference approach to assess ecological security in the Pearl River Delta urban agglomeration, China [15] and the rule-based fuzzy control method for static pressure reset [16]. Fuzzy control is carried out through several stages, namely the formation of fuzzy sets; application function implications; composition of rules; defuzzification.
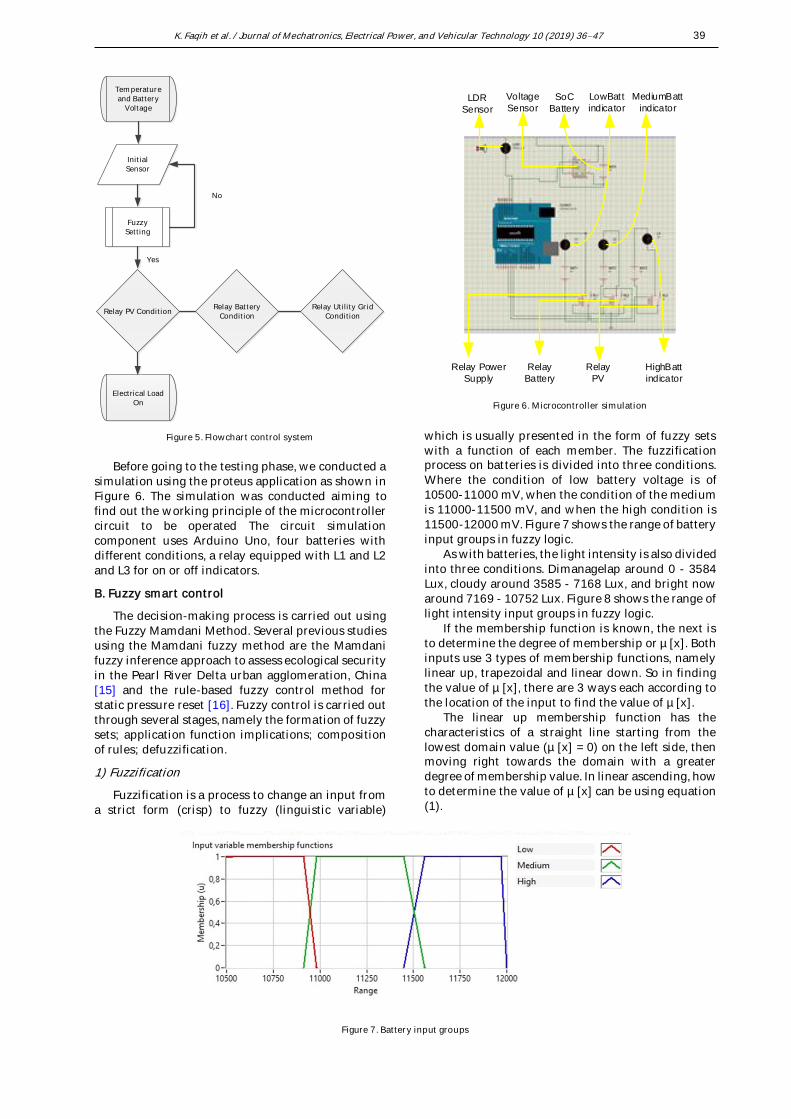
1) Fuzzification
Fuzzification is a process to change an input from a strict form (crisp) to fuzzy (linguistic variable)
which is usually presented in the form of fuzzy sets with a function of each member. The fuzzification process on batteries is divided into three conditions. Where the condition of low battery voltage is of 10500-11000 mV, when the condition of the medium is 11000-11500 mV, and when the high condition is 11500-12000 mV. Figure 7 shows the range of battery input groups in fuzzy logic.
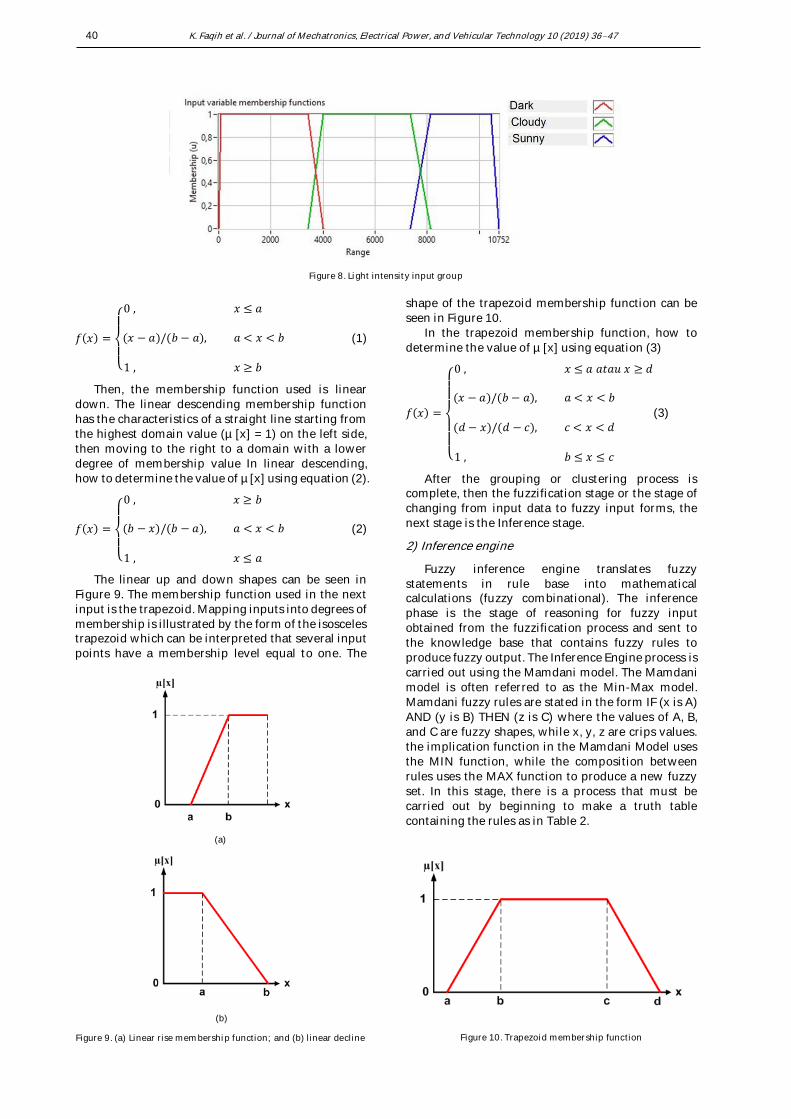
As with batteries, the light intensity is also divided into three conditions. Dimanagelap around 0 - 3584 Lux, cloudy around 3585 - 7168 Lux, and bright now around 7169 - 10752 Lux. Figure 8 shows the range of light intensity input groups in fuzzy logic.
If the membership function is known, the next is to determine the degree of membership or µ [x]. Both inputs use 3 types of membership functions, namely linear up, trapezoidal and linear down. So in finding the value of µ [x], there are 3 ways each according to the location of the input to find the value of µ [x].
The linear up membership function has the characteristics of a straight line starting from the lowest domain value (µ [x] = 0) on the left side, then moving right towards the domain with a greater degree of membership value. In linear ascending, how to determine the value of µ [x] can be using equation (1).
Temperature and Battery
Voltage
Initial Sensor
Fuzzy Setting
Relay PV ConditionRelay Battery
ConditionRelay Utility Grid
Condition
Electrical Load On
Yes
No
Figure 5. Flowchart control system
LDR
Sensor
Voltage
Sensor
LowBatt
indicatorSoC
Battery
MediumBatt
indicator
HighBatt
indicator
Relay Power
Supply
Relay
Battery
Relay
PV
Figure 6. Microcontroller simulation
Figure 7. Battery input groups
K. Faqih et al. / Journal of Mechatronics, Electrical Power, and Vehicular Technology 10 (2019) 36–47
40
𝑓(𝑥) =
{
0 , 𝑥 ≤ 𝑎
(𝑥 − 𝑎)/(𝑏 − 𝑎), 𝑎 < 𝑥 < 𝑏
1 , 𝑥 ≥ 𝑏
(1)
Then, the membership function used is linear down. The linear descending membership function has the characteristics of a straight line starting from the highest domain value (µ [x] = 1) on the left side, then moving to the right to a domain with a lower degree of membership value In linear descending, how to determine the value of µ [x] using equation (2).
𝑓(𝑥) =
{
0 , 𝑥 ≥ 𝑏
(𝑏 − 𝑥)/(𝑏 − 𝑎), 𝑎 < 𝑥 < 𝑏
1 , 𝑥 ≤ 𝑎
(2)
The linear up and down shapes can be seen in Figure 9. The membership function used in the next input is the trapezoid. Mapping inputs into degrees of membership is illustrated by the form of the isosceles trapezoid which can be interpreted that several input points have a membership level equal to one. The
shape of the trapezoid membership function can be seen in Figure 10.
In the trapezoid membership function, how to determine the value of µ [x] using equation (3)
𝑓(𝑥) =
{
0 , 𝑥 ≤ 𝑎 𝑎𝑡𝑎𝑢 𝑥 ≥ 𝑑
(𝑥 − 𝑎)/(𝑏 − 𝑎), 𝑎 < 𝑥 < 𝑏
(𝑑 − 𝑥)/(𝑑 − 𝑐), 𝑐 < 𝑥 < 𝑑
1 , 𝑏 ≤ 𝑥 ≤ 𝑐
(3)
After the grouping or clustering process is complete, then the fuzzification stage or the stage of changing from input data to fuzzy input forms, the next stage is the Inference stage.
2) Inference engine
Fuzzy inference engine translates fuzzy statements in rule base into mathematical calculations (fuzzy combinational). The inference phase is the stage of reasoning for fuzzy input obtained from the fuzzification process and sent to the knowledge base that contains fuzzy rules to produce fuzzy output. The Inference Engine process is carried out using the Mamdani model. The Mamdani model is often referred to as the Min-Max model. Mamdani fuzzy rules are stated in the form IF (x is A) AND (y is B) THEN (z is C) where the values of A, B, and C are fuzzy shapes, while x, y, z are crips values. the implication function in the Mamdani Model uses the MIN function, while the composition between rules uses the MAX function to produce a new fuzzy set. In this stage, there is a process that must be carried out by beginning to make a truth table containing the rules as in Table 2.
Figure 8. Light intensity input group
Figure 10. Trapezoid membership function
(a)
(b)
Figure 9. (a) Linear rise membership function; and (b) linear decline

K. Faqih et al. / Journal of Mechatronics, Electrical Power, and Vehicular Technology 10 (2019) 36–47 41
Based on the truth table the following conclusions can be drawn: • If the light is dark and the battery is low, then
the PS Rel is on • If the light is dark and the battery is medium,
then the PS Rel is on • If the light is dark and the battery is high, then
the Rel Bat is on • If the light is cloudy and the battery is low, then
the PS + PV Rel is on • If the light is cloudy and the battery is medium,
then the PS + PV Rel is on • If the light is cloudy and the battery is high, then
the PV + Bat Rel is on • If the light is bright and the battery is low, then
the PV + PS Rel is on • If the light is bright and the battery is medium,
then the PV + Bat Rel is on • If the light is bright and the battery is high, then
the PV + Bat Rel is on Fuzzy Set Operations are needed that will produce
α-predicate values for each rule. In the inference process using the Mamdani Model the value of the degree of membership in each rule is applied with the minimum implication function (MIN) of the linguistic
value using the conjunction rule (∩). The formula used to determine α-predicates with a minimum implied
function is
α − predicate = μ (x1) ∩ μ (x2)
= min {μ (x1),μ (x2)} (4)
Where x1 is a degree of membership of set 1 and x2 is a degree of membership of set 2.
Then after applying the MIN function, an output linguistic value is obtained which is then composed by the MAX function with the disjunction (∪) rule. The formula used to determine the new μ value from the rule composition results is:
μthen = {α− predicate μ (x1) ∪ α− predicate μ (x2)
= max {α− predicate μ (x1),− predicate μ (x2)} (5)
Where α-predicate μ (x1) equals output linguistic
value 1, α-predicate μ (x2) equals output linguistic value 2.
After the input parameters of the light intensity and battery are identified, the relay output parameters can be grouped as can be seen in Figure 11.
3) Defuzzification
Defuzzification can be defined as the process of changing the amount of Fuzzy that is presented in the form of sets of Fuzzy outputs with the membership function to get back its strict form (crisp). The defuzzification process in the Mamdani Model uses equation 6.
𝑍∗ =∑ 𝑧.𝜇(𝑧)
∑𝜇(𝑧) (6)
Where Z* is defuzzification, Z is fuzzification, and μ
represents linguistic value. The result of defuzzification determines the measuring value of the performance of microcomputer automatically on a pilot-scale smart grid PV system.
III. Results and Discussions
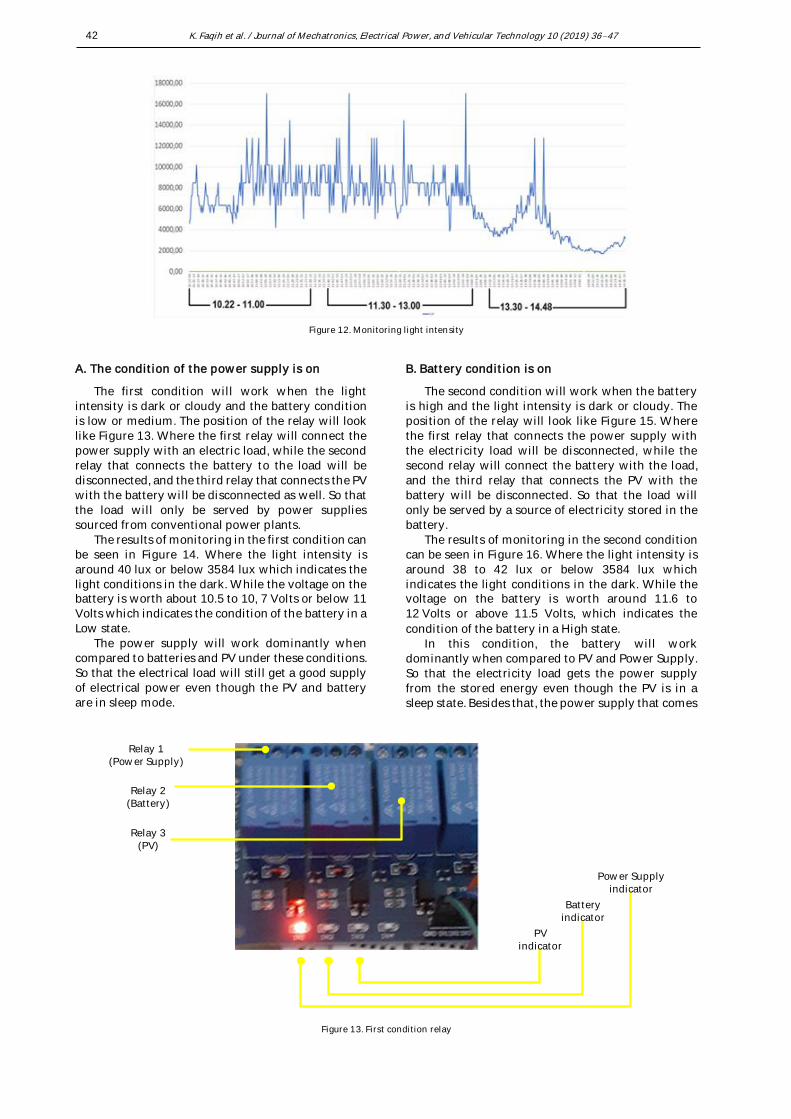
At the time of the trial, the sensors and components that have been installed are inspected first. There are obstacles to the light intensity sensor. As shown in Figure 12. The Lux meter value is not stable. Even though the microcontroller records the monitor results every second, the value of the recorded light intensity is quite far.
Table 2.
Principles of automatic micro control work
Light Intensity (Weather) Battery SoC
Low Medium High
Dark Rel PS on Rel PS on Rel Bat on
Cloudy Rel PS+PV on Rel PS+PV on Rel PV+Bat on
Sunny Rel PS+PV on Rel PV+Bat on Rel PV+Bat on
Note: Rel = Relay; PS = Power Supply; Bat = Battery; PV = Photovoltaic
Figure 11. Relay output groups
K. Faqih et al. / Journal of Mechatronics, Electrical Power, and Vehicular Technology 10 (2019) 36–47
42
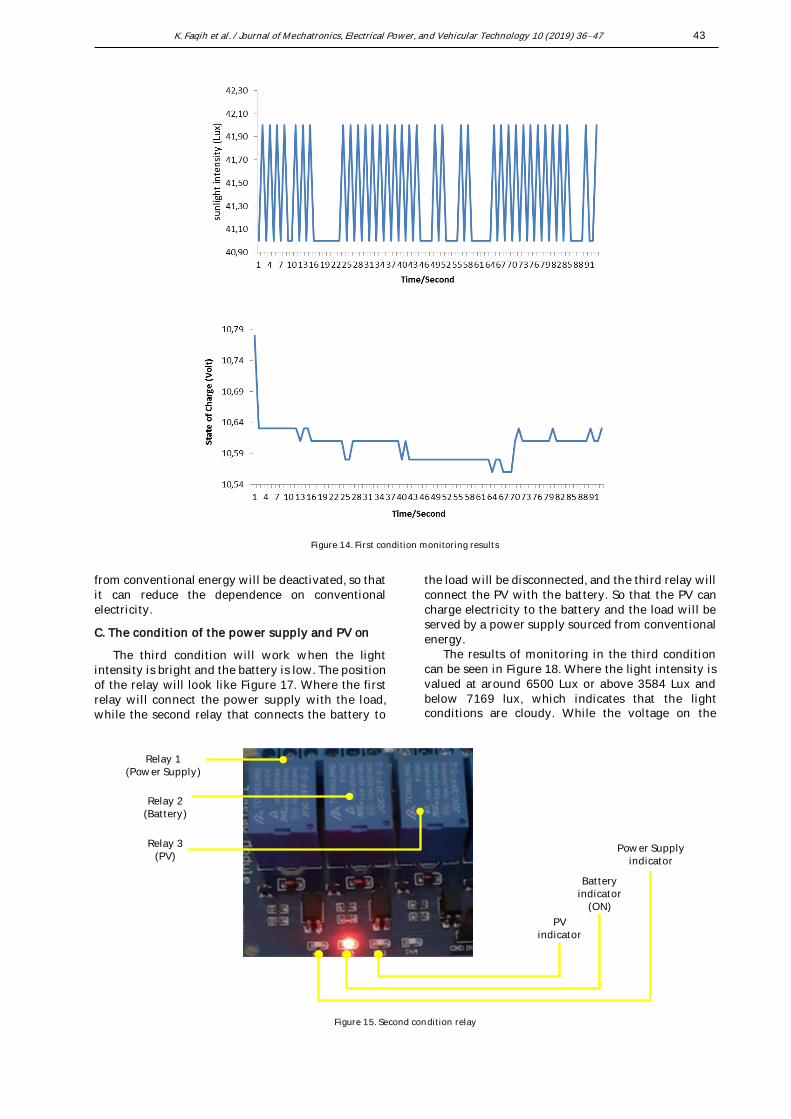
A. The condition of the power supply is on
The first condition will work when the light intensity is dark or cloudy and the battery condition is low or medium. The position of the relay will look like Figure 13. Where the first relay will connect the power supply with an electric load, while the second relay that connects the battery to the load will be disconnected, and the third relay that connects the PV with the battery will be disconnected as well. So that the load will only be served by power supplies sourced from conventional power plants.
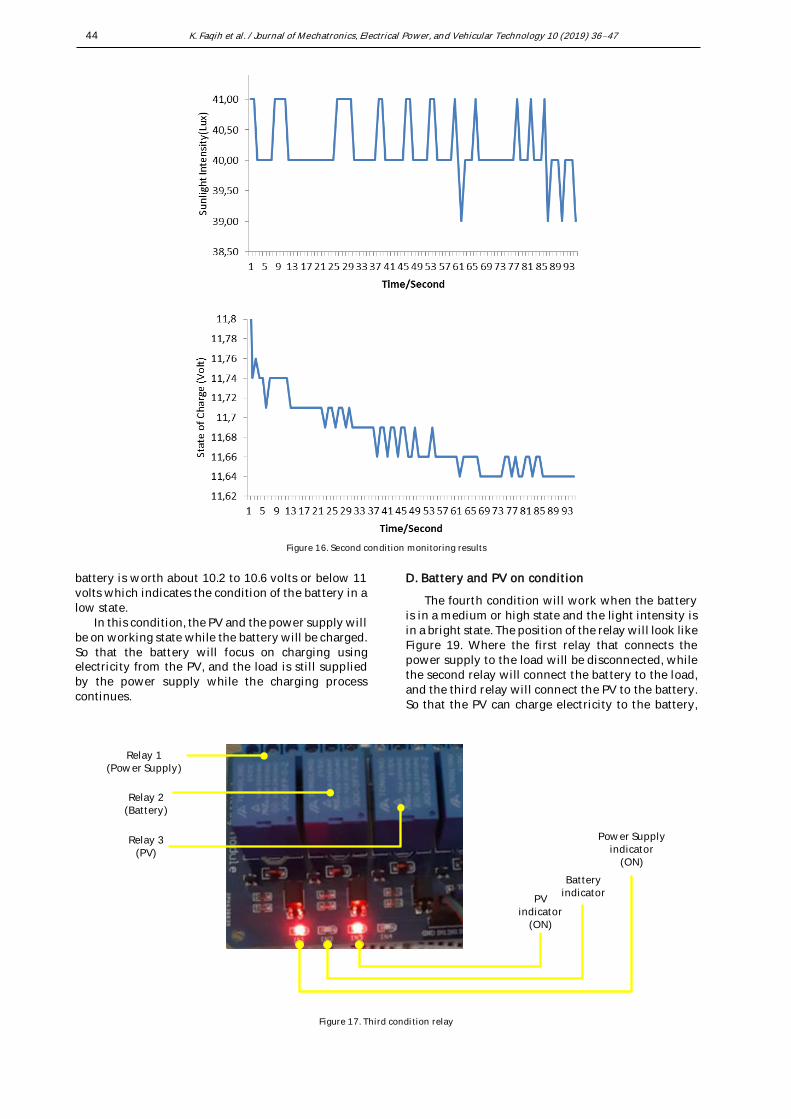
The results of monitoring in the first condition can be seen in Figure 14. Where the light intensity is around 40 lux or below 3584 lux which indicates the light conditions in the dark. While the voltage on the battery is worth about 10.5 to 10, 7 Volts or below 11 Volts which indicates the condition of the battery in a Low state.
The power supply will work dominantly when compared to batteries and PV under these conditions. So that the electrical load will still get a good supply of electrical power even though the PV and battery are in sleep mode.
B. Battery condition is on
The second condition will work when the battery is high and the light intensity is dark or cloudy. The position of the relay will look like Figure 15. Where the first relay that connects the power supply with the electricity load will be disconnected, while the second relay will connect the battery with the load, and the third relay that connects the PV with the battery will be disconnected. So that the load will only be served by a source of electricity stored in the battery.
The results of monitoring in the second condition can be seen in Figure 16. Where the light intensity is around 38 to 42 lux or below 3584 lux which indicates the light conditions in the dark. While the voltage on the battery is worth around 11.6 to 12 Volts or above 11.5 Volts, which indicates the
condition of the battery in a High state. In this condition, the battery will work
dominantly when compared to PV and Power Supply. So that the electricity load gets the power supply from the stored energy even though the PV is in a sleep state. Besides that, the power supply that comes
Figure 12. Monitoring light intensity
Relay 2(Battery)
Relay 1(Power Supply)
Relay 3(PV)
PV indicator
Battery indicator
Power Supply indicator
Figure 13. First condition relay
K. Faqih et al. / Journal of Mechatronics, Electrical Power, and Vehicular Technology 10 (2019) 36–47 43
from conventional energy will be deactivated, so that it can reduce the dependence on conventional electricity.
C. The condition of the power supply and PV on
The third condition will work when the light intensity is bright and the battery is low. The position of the relay will look like Figure 17. Where the first relay will connect the power supply with the load, while the second relay that connects the battery to
the load will be disconnected, and the third relay will connect the PV with the battery. So that the PV can charge electricity to the battery and the load will be served by a power supply sourced from conventional energy.
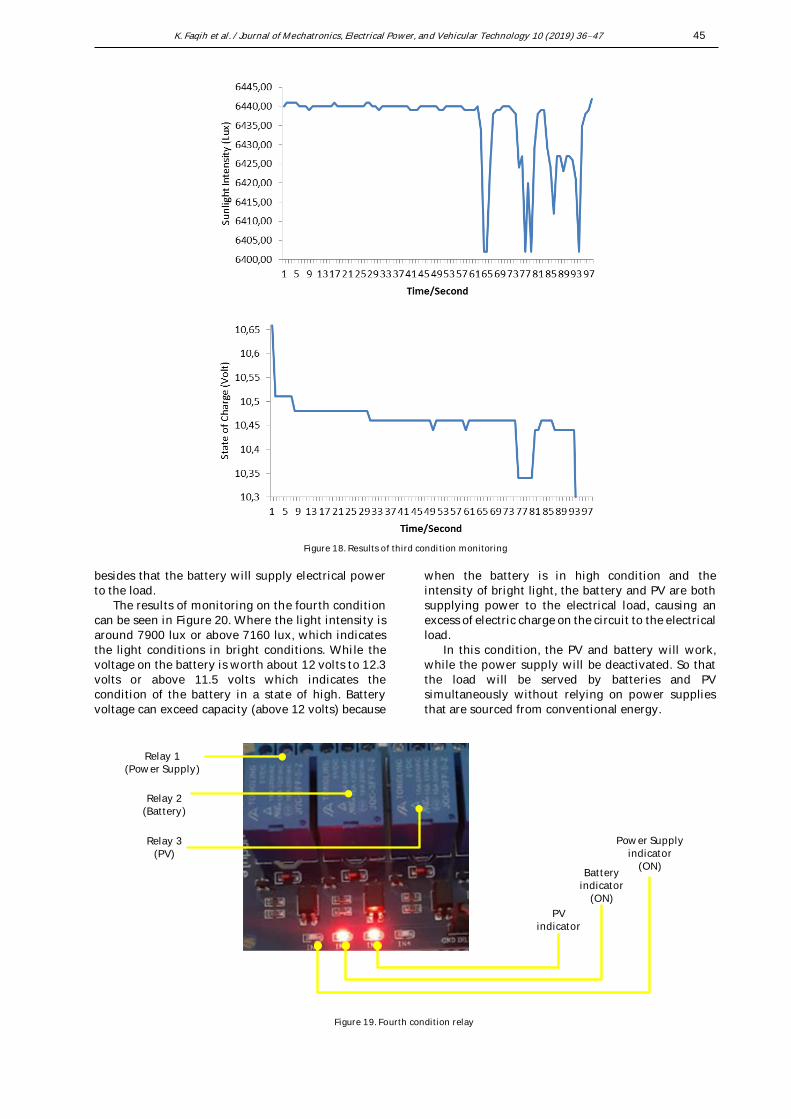
The results of monitoring in the third condition can be seen in Figure 18. Where the light intensity is valued at around 6500 Lux or above 3584 Lux and below 7169 lux, which indicates that the light conditions are cloudy. While the voltage on the
Figure 14. First condition monitoring results
Relay 2(Battery)
Relay 1(Power Supply)
Relay 3(PV)
PV indicator
Battery indicator
(ON)
Power Supply indicator
Figure 15. Second condition relay
K. Faqih et al. / Journal of Mechatronics, Electrical Power, and Vehicular Technology 10 (2019) 36–47
44
battery is worth about 10.2 to 10.6 volts or below 11 volts which indicates the condition of the battery in a low state.
In this condition, the PV and the power supply will be on working state while the battery will be charged. So that the battery will focus on charging using electricity from the PV, and the load is still supplied by the power supply while the charging process continues.
D. Battery and PV on condition
The fourth condition will work when the battery is in a medium or high state and the light intensity is in a bright state. The position of the relay will look like Figure 19. Where the first relay that connects the power supply to the load will be disconnected, while the second relay will connect the battery to the load, and the third relay will connect the PV to the battery. So that the PV can charge electricity to the battery,
Relay 2(Battery)
Relay 1(Power Supply)
Relay 3(PV)
PV indicator
(ON)
Battery indicator
Power Supply indicator
(ON)
Figure 17. Third condition relay
Figure 16. Second condition monitoring results
K. Faqih et al. / Journal of Mechatronics, Electrical Power, and Vehicular Technology 10 (2019) 36–47 45
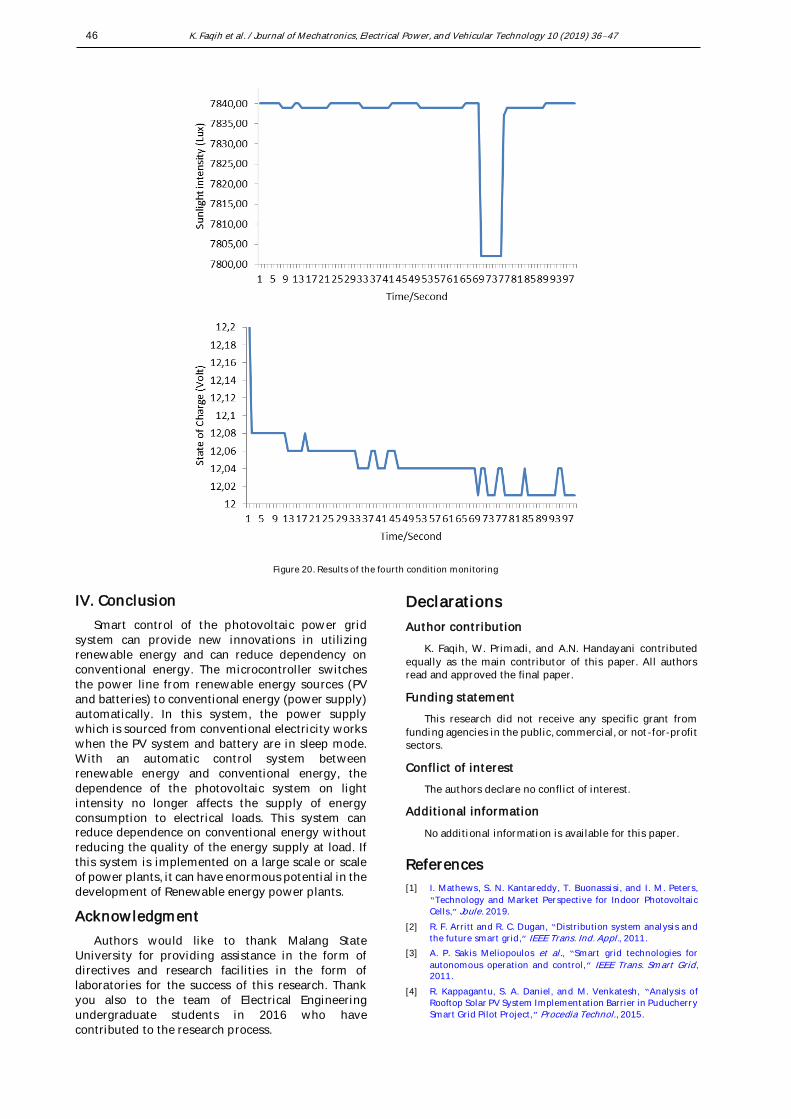
besides that the battery will supply electrical power to the load.
The results of monitoring on the fourth condition can be seen in Figure 20. Where the light intensity is around 7900 lux or above 7160 lux, which indicates the light conditions in bright conditions. While the voltage on the battery is worth about 12 volts to 12.3 volts or above 11.5 volts which indicates the condition of the battery in a state of high. Battery voltage can exceed capacity (above 12 volts) because
when the battery is in high condition and the intensity of bright light, the battery and PV are both supplying power to the electrical load, causing an excess of electric charge on the circuit to the electrical load.
In this condition, the PV and battery will work, while the power supply will be deactivated. So that the load will be served by batteries and PV simultaneously without relying on power supplies that are sourced from conventional energy.
Figure 18. Results of third condition monitoring
Relay 2(Battery)
Relay 1(Power Supply)
Relay 3(PV)
PV indicator
Battery indicator
(ON)
Power Supply indicator
(ON)
Figure 19. Fourth condition relay
K. Faqih et al. / Journal of Mechatronics, Electrical Power, and Vehicular Technology 10 (2019) 36–47
46
IV. Conclusion
Smart control of the photovoltaic power grid system can provide new innovations in utilizing renewable energy and can reduce dependency on conventional energy. The microcontroller switches the power line from renewable energy sources (PV and batteries) to conventional energy (power supply) automatically. In this system, the power supply which is sourced from conventional electricity works when the PV system and battery are in sleep mode. With an automatic control system between renewable energy and conventional energy, the dependence of the photovoltaic system on light intensity no longer affects the supply of energy consumption to electrical loads. This system can reduce dependence on conventional energy without reducing the quality of the energy supply at load. If this system is implemented on a large scale or scale of power plants, it can have enormous potential in the development of Renewable energy power plants.
Acknowledgment
Authors would like to thank Malang State University for providing assistance in the form of directives and research facilities in the form of laboratories for the success of this research. Thank you also to the team of Electrical Engineering undergraduate students in 2016 who have contributed to the research process.
Declarations
Author contribution
K. Faqih, W. Primadi, and A.N. Handayani contributed
equally as the main contributor of this paper. All authors read and approved the final paper.
Funding statement
This research did not receive any specific grant from
funding agencies in the public, commercial, or not-for-profit sectors.
Conflict of interest
The authors declare no conflict of interest.
Additional information
No additional information is available for this paper.
References
[1] I. Mathews, S. N. Kantareddy, T. Buonassisi, and I. M. Peters,
“Technology and Market Perspective for Indoor Photovoltaic
Cells,” Joule. 2019.
[2] R. F. Arritt and R. C. Dugan, “Distribution system analysis and
the future smart grid,” IEEE Trans. Ind. Appl., 2011.
[3] A. P. Sakis Meliopoulos et al., “Smart grid technologies for
autonomous operation and control,” IEEE Trans. Smart Grid, 2011.
[4] R. Kappagantu, S. A. Daniel, and M. Venkatesh, “Analysis of
Rooftop Solar PV System Implementation Barrier in Puducherry
Smart Grid Pilot Project,” Procedia Technol., 2015.
Figure 20. Results of the fourth condition monitoring

K. Faqih et al. / Journal of Mechatronics, Electrical Power, and Vehicular Technology 10 (2019) 36–47 47
[5] Dr. Eng. A. Naba, “Belajar Cepat Fuzzy Logic Menggunakan
MATLAB,” in Belajar Cepat Fuzzy Logic Menggunakan MATLAB, 2009.
[6] I. Iancu, “A Mamdani Type Fuzzy Logic Controller,” in Fuzzy Logic - Controls, Concepts, Theories and Applications, 2012.
[7] R. Khosravanian, M. Sabah, D. A. Wood, and A. Shahryari,
“Weight on drill bit prediction models: Sugeno-type and
Mamdani-type fuzzy inference systems compared,” J. Nat. Gas Sci. Eng., 2016.
[8] N. Rai and B. Rai, “Control of fuzzy logic based PV-battery
hybrid system for stand-alone DC applications,” J. Electr. Syst. Inf. Technol., 2018.
[9] S. Lalouni and D. Rekioua, “Modeling and simulation of a
photovoltaic system using fuzzy logic controller,” in
Proceedings - International Conference on Developments in eSystems Engineering, DeSE 2009, 2009.
[10] C. S. Chim, P. Neelakantan, H. P. Yoong, and K. T. K. Teo, “Fuzzy
logic based MPPT for photovoltaic modules influenced by solar
irradiation and cell temperature,” in Proceedings - 2011 UKSim 13th International Conference on Modelling and Simulation, UKSim 2011, 2011.
[11] R. Ramaprabha, M. Balaji, and B. L. Mathur, “Maximum power
point tracking of partially shaded solar PV system using
modified Fibonacci search method with fuzzy controller,” Int. J. Electr. Power Energy Syst., 2012.
[12] A. Ahmad and L. Rajaji, “Modeling and design of a novel control
algorithm for grid connected photovoltaic (PV) inverter
system,” in Proceedings - 2013 3rd International Conference on Advances in Computing and Communications, ICACC 2013, 2013.
[13] E. Bernal A., M. Bueno-López, and F. Salazar-Caceres, “Fuzzy-
Based Reactive Power Control for Smart PV Inverters in LV
Distribution Systems,” IFAC-Pap., vol. 50, no. 1, pp. 7705–7710, Jul. 2017.
[14] F. Chekired, A. Mahrane, Z. Samara, M. Chikh, A. Guenounou,
and A. Meflah, “Fuzzy logic energy management for a
photovoltaic solar home,” in Energy Procedia, 2017.
[15] J. Sun, Y. P. Li, P. P. Gao, and B. C. Xia, “A Mamdani fuzzy
inference approach for assessing ecological security in the Pearl
River Delta urban agglomeration, China,” Ecol. Indic., 2018.
[16] X. Li, T. Zhao, P. Fan, and J. Zhang, “Rule-based fuzzy control
method for static pressure reset using improved Mamdani
model in VAV systems,” J. Build. Eng., 2019.