Embed Size (px)
Citation preview
Smart Freeways Operational Efficiency Audit Guidelines 2/03/2021

These guidelines are produced for the purpose of works to be carried out by Main Roads Western Australia or under contract with Main Roads. Although the guidelines are believed to be correct at the time of publication, Main Roads Western Australia does not accept the responsibility for any consequences arising from the use of the information in the guidelines by others. The users of these guidelines should rely on their own skill and judgment when applying the content of the guidelines.
Smart Freeways Operational Efficiency Audit Guidelines
© Main Roads Western Australia March 2021
For comments or further information, please contact Acting Network Operations Planning Manager, Bita Charehjoo, phone: (08) 9323 4439, email: [email protected].
Keywords: Smart Freeways, Operational Efficiency, Audit
Smart Freeways Operational Efficiency Audit Guidelines
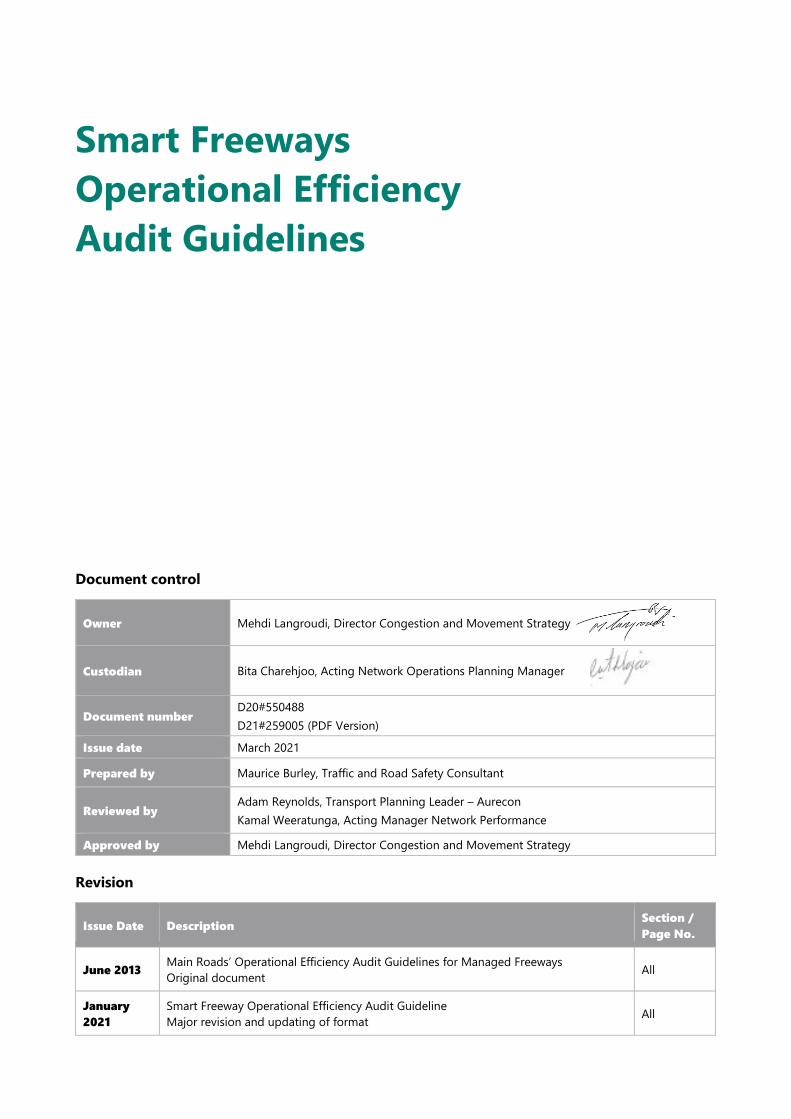
Document control
Revision
Owner Mehdi Langroudi, Director Congestion and Movement Strategy
Custodian Bita Charehjoo, Acting Network Operations Planning Manager
Document number D20#550488 D21#259005 (PDF Version)
Issue date March 2021
Prepared by Maurice Burley, Traffic and Road Safety Consultant
Reviewed by Adam Reynolds, Transport Planning Leader – Aurecon Kamal Weeratunga, Acting Manager Network Performance
Approved by Mehdi Langroudi, Director Congestion and Movement Strategy
Issue Date Description Section / Page No.
June 2013 Main Roads’ Operational Efficiency Audit Guidelines for Managed Freeways Original document All
January 2021
Smart Freeway Operational Efficiency Audit Guideline Major revision and updating of format All
Smart Freeways Operational Efficiency Audit Guidelines – March 2021
Document No: D20#550488 i
Foreword Smart Freeways policy and guidelines
The Main Roads Western Australia (Main Roads) Smart Freeways policy and various guidelines influence overall planning, project development, delivery and ongoing operation of Smart Freeways in Western Australia.
The Smart Freeways documents were originally developed as part of the Managed Freeways policy framework in 2012. At that time Main Roads used the term ‘Managed Freeways’, which was changed to ‘Smart Freeways’ at the time of the first Smart Freeways project on Kwinana Freeway northbound. The 2020 updated documents supersede the previous Managed Freeways documents.
Historically, intelligent transport systems (ITS) on freeways were typically considered case by case. Our current approach is outlined in the Smart Freeways Policy, which states that all freeways are considered for ITS provision at either foundation or higher-order standard according to these guidelines.
Main Roads’ Smart Freeways policy and guidelines comprise the documents listed in the table below. This document is shown highlighted.
Document Description
Smart Freeways Policy One page high-level policy statement setting out Smart Freeways objectives and principles.
Smart Freeways Policy Framework Overview
Smart Freeways context, principles, corporate governance, processes and intended outcomes to achieve policy objectives.
Smart Freeways Provision Guidelines
Guidelines and warrants for application of Smart Freeways traffic management treatments and ITS devices.
Smart Freeways Operational Efficiency Audit Guidelines
Guidelines for formal examination of traffic analysis and design of all freeway projects.
Guidelines for Variable Message Signs
Guidelines for the design and use of variable message signs for traveller information for safe and efficient travel for road users.
Supplement to Victoria’s Managed Motorway Design Guide, Volume 2: Design Practice, Parts 2 and 3
Main Roads’ Supplement relating to: • Network optimisation tools (benefits and operation of coordinated ramp
signals). • Planning and design for mainline, entry ramps (including ramp signals), exit
ramps and interchanges.
Supplement to Victoria’s Managed Freeways Handbook for Lane Use Management and Variable Speed Limits
Main Roads’ Supplement relating to: • Lane use management system (LUMS). • Variable speed limits (VSL).
Smart Freeways Operational Efficiency Audit Guidelines – March 2021
Document No: D20#550488 ii
Smart Freeways concept Smart Freeways make the best use of the existing freeway network, particularly during times of high demand and traffic incidents. We use ITS and operational strategies that enable dynamic network management and operation in real-time. Smart Freeways traffic management initiatives, complemented by appropriate mainline and ramp geometric improvements, work together as an integrated system to achieve and maintain optimal freeway traffic conditions, with minimal delays and congestion.
Over recent years, Victoria’s approach to managed motorways in Melbourne has achieved unparalleled, sustainable benefits to freeway operations for safety, productivity, efficiency and reliability. We have applied the same holistic principles and learnings, while also working towards national consistency.
About operational efficiency audits
An operational efficiency audit involves a formal examination – from a network operations viewpoint – of the traffic analysis and design of a freeway project, as part of an existing or new freeway. The aim is to ensure that when built, the freeway operates at optimum efficiency, and also it is ‘future-proofed’ for retrofitting Smart Freeway technologies as traffic demand increases.
Audits are undertaken by an independent, qualified team that reports on whether the project will result in efficient management and operation of a section of freeway, including its interface with the wider freeway / arterial road network. They propose recommendations for improvement as appropriate. The scope includes both civil (i.e. mainline / ramps / interchanges) and ITS components.
The audit process provides the opportunity to review the ability of project proposals (in whatever stage of development) to achieve the operational objectives set for that section of freeway. It should be considered a constructive process with independent advice for design refinement to deliver the best operational outcomes for the road user and road manager.
Need for operational efficiency audits
Operational efficiency audits shall be undertaken in accordance with Main Roads’ policies for Smart Freeways. Smart Freeway ITS technologies shall be considered for application across the network. All projects on freeways as defined in the Smart Freeways Policy Framework Overview (2020) should be audited.
Audits are most cost effective and have the greatest potential to deliver benefits when undertaken as early as practical in the planning and design development stages. Audits may be conducted at various stages in the project lifecycle. Like road safety audits, operational efficiency audits are expected to be common practice and integrated with Main Roads’ project development and delivery process, RO&DS (Recognising Opportunities and Delivering Solutions), [Main Roads 2009], as a routine part of the project lifecycle.
Operational efficiency audits are complementary to the road safety audits and other Road Safety Management processes (ROSMA), for which there are separate guidelines.

Smart Freeways Operational Efficiency Audit Guidelines – March 2021
Document No: D20#550488 iii
Objectives of an operational efficiency audit
Operational efficiency audits seek to achieve the following objectives:
• On the basis of information available at the time of the audit, identify critical risks to operational efficiency (when the project is built), considering the operational objectives for the freeway section
• Develop recommendations on how to address those risks and to otherwise improve design
• Facilitate improved communications and knowledge transfer on Smart Freeway design between project teams, Main Roads and other industry experts.
The audit is not just a check on compliance with standards, but a check on the fitness for purpose of the design to ensure standards have been applied appropriately to a specific section of freeway. The final deliverable is an audit report outlining any design and operational concerns and corresponding recommendations.
Benefits and costs of operational efficiency audits
The key benefits to Main Roads of conducting operational efficiency audits range from the project-level to broader organisational and societal benefits. They include the following:
• Well-designed, sustainable freeways that operate at optimal efficiency, with reduced occurrence of flow breakdown and congestion
• Improved network performance outcomes such as productivity, travel efficiency, travel reliability, safety, driver experience, resilience and sustainability
• Identification of opportunities to improve project development, design and operation for a small proportion of the total project cost
• Reduced whole-of-life costs of freeway projects
• Promotion of early consideration in project development and design of how the freeway section will operate, including integration with ‘whole-of-network operations’
• Support of informed decision making at key hold points throughout the project lifecycle – even an audit where no deficiencies have been identified will provide Main Roads with assurance of project performance.
The cost of an operational efficiency audit will be largely dependent on the type of audit (e.g. what stage in the project lifecycle) as well as the size of the project and / or audit scope. This cost is considered a relatively low percentage of the total project or overall design costs.
The audit process
There is a defined process for conducting the audit as well as managing the response to the audit recommendations and implementing identified corrective actions. These guidelines provide detailed advice on how to audit each component in a Smart Freeway environment, including checklists for use by the audit team.
Smart Freeways Operational Efficiency Audit Guidelines – March 2021
Document No: D20#550488 iv
Key design principles
The overriding philosophy behind achieving operational efficiency is to keep traffic moving. This is supported by operational safety principles that seek to ensure this does not compromise road user safety.
The following principles should form the basis of Smart Freeway operation. They should be considered by all operational efficiency audits of freeway projects:
• Prevent flow breakdown, particularly during peak times of high demand
• Actively manage traffic demand and flow within the freeway’s capacity
• When demand is high, achieve and sustain optimal traffic flows subject to the maximum operational capacity of the freeway
• Restore traffic flow to normal conditions as quickly as possible after flow breakdown, e.g. following an incident
• Minimise incidents that threaten road user safety or disrupt traffic flow
• Plan for operations and maintenance requirements to minimise risk to road user safety (including road workers and incident response units) as well as disruption to traffic flow
• Provide real-time traveller information to road users either using or intending to use the freeway
• Minimise adverse impacts on traffic flows on connecting or intersecting freeways and other arterial roads, to deliver improved network-wide performance and end-to-end journeys.
Smart Freeways Operational Efficiency Audit Guidelines – March 2021
Document No: D20#550488 v
Abbreviations AADT Annual average daily traffic
AAWDT Annual average weekday traffic
ALR All lane running
ANPR Automatic number plate recognition
AID Automated incident detection
AP Access point (for wireless detectors)
AS Australian Standard
CAR Corrective actions report
CCTV Closed circuit television
CIC Customer Information Centre
CRS Coordinated ramp signals
ESB Emergency stopping bay
ESL Emergency stopping lane
GPS Global positioning system
HCM Highway Capacity Manual
HERO Heuristic ramp metering coordination
ICT Information and communications technology
ITS Intelligent transport systems
LUMS Lane use management system
LCS Lane control signal
LOS Level of service
LUS Lane use sign
MM Managed motorway
MMDG Managed Motorway Design Guide
MSFR Maximum sustainable flow rate
Smart Freeways Operational Efficiency Audit Guidelines – March 2021
Document No: D20#550488 vi
OSOM Over-size, over-mass
PTA Public Transport Authority
PTZ Pan, tilt and zoom
RC1 ramp control sign 1
RC2 ramp control sign 2
RC3 ramp control sign 3
ROSMA Road safety management
RO&DS Recognising opportunities and delivering solutions
RNOC Road Network Operations Centre
RP Repeater point (for wireless detectors)
RRPM Retro-reflective pavement markers
RTMT Real-time monitoring team
SCATS Sydney Coordinated Adaptive Traffic System
SF Smart Freeway
TCSN Traffic control system network
TIRTL The Infra-Red Traffic Logger
VDS Vehicle detection system
VMS Variable message sign
VSL Variable speed limit
WA Western Australia
WAPOL Western Australia Police
WIM Weigh-in-motion
Smart Freeways Operational Efficiency Audit Guidelines – March 2021
Document No: D20#550488 vii
Contents
1 Introduction ................................................................................................................................................................... 1
1.1 Future development of the freeway network .......................................................................................... 1
1.2 Background to operational efficiency audit concept ........................................................................... 1
1.3 Purpose of guidelines ....................................................................................................................................... 3
2 Operational efficiency audits overview ............................................................................................................... 4
2.1 About operational efficiency audits ............................................................................................................ 4
2.2 When operational efficiency audits apply ................................................................................................ 4
2.3 Principles for building a safe and efficient freeway system ............................................................... 5
2.4 Operational efficiency audits objectives .................................................................................................... 6
2.5 Benefits and costs .............................................................................................................................................. 6
2.6 Project lifecycle and audit stages ................................................................................................................. 8
2.7 Scope of guidelines ......................................................................................................................................... 10
3 Conducting an audit ................................................................................................................................................. 11
3.1 Audit process ..................................................................................................................................................... 11
3.2 Select the audit team ...................................................................................................................................... 12
3.3 Provide analysis, design and background information ..................................................................... 13
3.4 Hold an initial meeting................................................................................................................................... 13
3.5 Assess the documents and inspect the site ........................................................................................... 13
3.6 Write the audit report..................................................................................................................................... 14
3.7 Hold a completion meeting ......................................................................................................................... 15
3.8 Write the responses and implement changes ....................................................................................... 15
3.9 Communications............................................................................................................................................... 16
3.10 Governance and organisational arrangements .................................................................................... 16
3.11 Relevant policies and design standards .................................................................................................. 17
3.12 Use of these guidelines .................................................................................................................................. 18
4 Performance objectives and Smart Freeway solutions ............................................................................... 20
4.1 Overview .............................................................................................................................................................. 20
4.2 Key principles ..................................................................................................................................................... 21
4.3 Freeway performance ..................................................................................................................................... 21
4.4 Selection of Smart Freeway services and ITS technologies .............................................................. 23
5 Design traffic volume determination ................................................................................................................. 29
5.1 Overview .............................................................................................................................................................. 29
Smart Freeways Operational Efficiency Audit Guidelines – March 2021
Document No: D20#550488 viii
5.2 Key principles ..................................................................................................................................................... 30
5.3 Design traffic volumes .................................................................................................................................... 31
6 Mainline operation.................................................................................................................................................... 35
6.1 Overview .............................................................................................................................................................. 35
6.2 Key principles ..................................................................................................................................................... 36
6.3 Flow and capacity analysis ............................................................................................................................ 37
6.4 Capacity and geometric layout ................................................................................................................... 42
6.5 Priority vehicle facilities ................................................................................................................................. 48
6.6 Safety considerations ...................................................................................................................................... 48
7 Entry ramp operation ............................................................................................................................................... 53
7.1 Overview .............................................................................................................................................................. 53
7.2 Key principles ..................................................................................................................................................... 54
7.3 Entry flows and ramp control ...................................................................................................................... 54
7.4 Ramp signal capacity and storage ............................................................................................................. 55
7.5 Geometric layout .............................................................................................................................................. 57
7.6 Equipment layout ............................................................................................................................................. 59
7.7 Priority vehicle facilities ................................................................................................................................. 60
7.8 Safety considerations ...................................................................................................................................... 61
8 Freeway-to-freeway operation ............................................................................................................................. 63
8.1 Overview .............................................................................................................................................................. 63
8.2 Key principles ..................................................................................................................................................... 64
8.3 Entry flows and ramp control ...................................................................................................................... 64
8.4 Discharge capacity and geometric layout .............................................................................................. 65
8.5 Equipment layout ............................................................................................................................................. 66
8.6 Priority vehicle facilities ................................................................................................................................. 67
8.7 Exit ramps ............................................................................................................................................................ 67
8.8 Safety considerations ...................................................................................................................................... 67
9 Exit ramp operation .................................................................................................................................................. 69
9.1 Overview .............................................................................................................................................................. 69
9.2 Key principles ..................................................................................................................................................... 70
9.3 Capacity and geometric layout ................................................................................................................... 70
9.4 Priority vehicle facilities ................................................................................................................................. 72
9.5 Safety considerations ...................................................................................................................................... 72
10 Arterial interchange operation .................................................................................................................... 74
10.1 Overview .............................................................................................................................................................. 74
10.2 Key principles ..................................................................................................................................................... 75
Smart Freeways Operational Efficiency Audit Guidelines – March 2021
Document No: D20#550488 ix
10.3 Geometric layout and intersection control ............................................................................................ 75
10.4 Priority vehicle facilities ................................................................................................................................. 78
10.5 Safety considerations ...................................................................................................................................... 78
11 On-road traveller information ..................................................................................................................... 80
11.1 Overview .............................................................................................................................................................. 80
11.2 Key principles ..................................................................................................................................................... 82
11.3 Geometric layout .............................................................................................................................................. 82
11.4 Equipment layout ............................................................................................................................................. 82
11.5 Safety considerations ...................................................................................................................................... 85
12 Lane use management systems .................................................................................................................. 87
12.1 Overview .............................................................................................................................................................. 87
12.2 Key principles ..................................................................................................................................................... 88
12.3 Geometric layout .............................................................................................................................................. 88
12.4 Equipment layout ............................................................................................................................................. 88
12.5 Priority vehicle facilities ................................................................................................................................. 91
12.6 Safety considerations ...................................................................................................................................... 91
13 Variable speed limits ....................................................................................................................................... 95
13.1 Overview .............................................................................................................................................................. 95
13.2 Key principles ..................................................................................................................................................... 96
13.3 Geometric layout .............................................................................................................................................. 96
13.4 Equipment layout ............................................................................................................................................. 96
13.5 Safety considerations ...................................................................................................................................... 98
14 Vehicle detection systems ......................................................................................................................... 100
14.1 Overview ........................................................................................................................................................... 100
14.2 Key principles .................................................................................................................................................. 101
14.3 Mainline flow optimisation ........................................................................................................................ 101
14.4 Equipment layout .......................................................................................................................................... 102
15 CCTV cameras ................................................................................................................................................. 106
15.1 Overview ........................................................................................................................................................... 106
15.2 Key principles .................................................................................................................................................. 107
15.3 Equipment layout .......................................................................................................................................... 107
16 Emergency stopping bays and roadside help phones................................................................... 111
16.1 Overview ........................................................................................................................................................... 111
16.2 Key principles .................................................................................................................................................. 112
16.3 Equipment layout .......................................................................................................................................... 112
Smart Freeways Operational Efficiency Audit Guidelines – March 2021
Document No: D20#550488 x
16.4 Safety considerations ................................................................................................................................... 113
17 General guidance .......................................................................................................................................... 114
17.1 Planning for operations and maintenance .......................................................................................... 114
17.2 Retrofitting Smart Freeways ...................................................................................................................... 114
17.3 Technology and systems compatibility ................................................................................................ 115
18 References ........................................................................................................................................................ 116
APPENDIX A Audit checklists ............................................................................................................................ 118
APPENDIX B Audit report outline ................................................................................................................... 144
APPENDIX C Template for corrective actions report ............................................................................... 146
Smart Freeways Operational Efficiency Audit Guidelines – March 2021
Document No: D20#550488 1
1 Introduction 1.1 Future development of the freeway network The role of freeways in Western Australia is vital to the future transport needs and economic development of urban areas. The efficient operation of freeways is essential for a safe and reliable level of service that maximises infrastructure productivity and provides optimum operation in relation to throughput, travel time and incident management.
Many of Western Australia’s existing high standard arterial roads and freeways are currently in the process of (or planned for) widening or upgrading to meet current and future traffic demand on the network. Other parts of the freeway network are fully developed within the available right-of-way but are experiencing significant traffic demands.
Main Roads has moved towards the active management of freeways to minimise congestion and optimise travel conditions, particularly on sections of the network where there is recurrent flow breakdown and congestion. Where further widening is not viable, applying Smart Freeway treatments, incorporating intelligent transport systems (ITS) and operational strategies, enables road managers to get the most out of the existing infrastructure and improve capacity.
All existing urban freeways will be progressively upgraded to operate as part of a Smart Freeway network. As a minimum, they will be upgraded to foundation-level ITS, incorporating foundation power and communications infrastructure, network intelligence and traveller information services, as outlined in the Main Roads’ Smart Freeway Provision Guidelines (2020).
Some freeways will be upgraded to Smart Freeways with a specific focus on sections with critical bottlenecks. Smart Freeway control with coordinated ramp signals will be applied to minimise flow breakdown and congestion. All new freeways will be considered for Smart Freeway technologies and built with at least a foundation level of ITS.
1.2 Background to operational efficiency audit concept In the past, freeway design has been based on uncongested traffic flow and did not consider operational requirements for active traffic management. Highway Capacity Manual (HCM) analysis (Transportation Research Board, 2010) has traditionally been applied when analysing freeway capacity, however operational performance was generally aimed at free-flowing levels of service (LOS), to achieve LOS C (stable flow) or D, (approaching unstable flow) with spare capacity.
With increasing traffic demand, many existing freeways designed to operate as free-flowing facilities are now operating inefficiently at LOS E (unstable) or LOS F (forced or breakdown flow).
When flow breakdown occurs, throughput can drop by up to 25 per cent and speeds can drop to less than 60 km/h with shock waves (stop-start conditions) also affecting traffic flow. As physical expansion opportunities may be limited, designers and road operators now need to consider new freeway analysis methodologies. This means designing the freeway for traffic flow relative to maximum sustainable flow rates (MSFR), for example with low-flow breakdown risk, to avoid congested conditions after construction.
Road operators also need to develop appropriate management strategies to minimise flow breakdown and manage traffic demand.
Smart Freeways Operational Efficiency Audit Guidelines – March 2021
Document No: D20#550488 2
Historically, road designers have assumed that maximum theoretical design capacities are achievable. It is now understood that, in reality, operational capacities are lower, and can vary through time and space, because of:
• mainline and entry ramp bottlenecks
• exit ramp queues
• changing environmental conditions
• driver behaviour
• heavy vehicle mix, and
• new operational regimes, such as emergency stopping lanes.
This means road authorities need to provide facilities that actively manage traffic demand and flow within the freeway’s operational capacity, and aim to prevent flow breakdown. This requires an understanding of contemporary traffic theory and the application of new traffic management tools, such as ramp signals, variable speed limits, lane-use management and traveller information systems. A managed freeway is not just a freeway with ITS devices and a traditional traffic management centre, but an integrated system that delivers various services to road users, incorporating ‘state-of-the-art’ control systems and algorithms.
As a starting point for Smart Freeway design, civil infrastructure should be designed to eliminate geometric bottlenecks and turbulence. It should facilitate the most efficient flows at all times (whether in unmanaged or managed operation), as well as support the operation of ITS services that monitor and control traffic and deliver information to road users.
ITS infrastructure shall be designed to support day-to-day operations. This is both relevant to new freeways, and existing freeways being retrofitted with ITS tools. In many cases, Smart Freeway tools are part of an interim solution and a sequenced design approach is required. Investment in freeway infrastructure also needs to be sustainable, so that it can continue to support efficient operations as priorities for road use change over time.
Main Roads is continuing to develop and refine guidelines and standards to address new requirements for freeways operating within a Smart Freeway regime. The Smart Freeway concept is still a relatively new area and introduces innovative design concepts that necessitate a multi-disciplinary approach. Effective application of Smart Freeway guidelines in project delivery requires close communication and collaboration between Smart Freeway experts, project managers and design teams.
Operational efficiency audits for Smart Freeways play an important part in assisting Main Roads and its consultants to understand and respond to freeway design requirements and operation, towards a successful Smart Freeway network in Western Australia.

Smart Freeways Operational Efficiency Audit Guidelines – March 2021
Document No: D20#550488 3
1.3 Purpose of guidelines The purpose of these guidelines is to introduce the concept and benefits of operational efficiency audits, and provide detailed guidance on when and how they should be conducted.
These guidelines do not replace other specific design guidelines for the analysis or design of Smart Freeways, traffic management tools or ITS devices. The audit team will need to be familiar with, and refer to, current design standards and guidelines as part of an audit. These guidelines supplement current guides and provide further information to help the audit team and provide additional background material about freeway operational efficiency. On some topics, guidance is provided where current guidelines may not be available.
The guidelines contain the following sections:
• Section 2 – definition and overview of operational efficiency audits, including principles and objectives, benefits and costs, and an overview of the project lifecycle
• Section 3 – description of the audit process and advice on how to use these guidelines
• Sections 5 to 16 – guidance on how to review each design component within an operational efficiency audit
• Section 17 – general guidance relevant to all design components.
See Appendix A for the design components in Sections 5 to 16.

Smart Freeways Operational Efficiency Audit Guidelines – March 2021
Document No: D20#550488 4
2 Operational efficiency audits overview
2.1 About operational efficiency audits This type of audit involves examining, from a network operations viewpoint, the traffic analysis and design of a freeway project, as part of an existing or new freeway. The aim of the audit is to ensure that when built or upgraded, the freeway will operate at optimum efficiency in response to the traffic demands and provide effective real-time traveller information to road users.
Audits are conducted by an independent, qualified team that reports on whether the project will result in efficient management and operation of a section of freeway. This includes the freeway’s interface with the wider freeway / arterial road network, and recommendations for improvement as appropriate. The audit scope includes both civil, (i.e. mainline / ramps / interchanges) and ITS components. Components considered in scope are detailed in Sections 5 to 16.
The audit process provides the opportunity to review project proposals, in any stage of development, to achieve operational objectives set for that particular section of freeway. It should be considered a constructive process for design refinement to deliver the best outcomes.
An audit is:
• a formal process and not an informal check
• an objective assessment carried out by professionals independent of the project team
• carried out by professionals with appropriate experience and training
• limited to operational efficiency issues.
The resulting operational efficiency audit report will identify any deficiencies in design and make recommendations on how they can be addressed. Operational efficiency audits are similar to road safety audits, as outlined in the Guide to Road Safety Part 6A: Implementing Road Safety Audits (Austroads 2019).
Operational efficiency audits are complementary to operational safety audits, for which there are separate guidelines.
2.2 When operational efficiency audits apply Operational efficiency audits shall be undertaken in accordance with the Main Roads’ policies for Smart Freeways. Smart Freeway interventions shall be considered for application across the network, therefore projects on all freeways as defined in the Smart Freeways Policy Framework Overview (2020), are subject to auditing.
Smart Freeways Operational Efficiency Audit Guidelines – March 2021
Document No: D20#550488 5
2.3 Principles for building a safe and efficient freeway system The overriding philosophy behind achieving operational efficiency is to keep traffic moving. This is supported by operational safety principles that seek to ensure operational efficiency does not compromise road user safety.
The following principles form the basis of Smart Freeway operation and should be considered by all operational efficiency audits of freeway projects:
• Prevent flow breakdown from occurring, particularly during peak times of high demand
• Actively manage traffic demand and flow within the freeways’ capacity
• When demand is high, achieve and sustain optimal traffic flows subject to the freeway’s maximum operational capacity
• Restore traffic flow to normal conditions as quickly as possible after flow breakdown, e.g. following an incident
• Minimise likelihood of incidents that may threaten road user safety or disrupt traffic flow
• Plan for operations and maintenance requirements to minimise risk to road user safety (including road workers and incident response units) and disruption to traffic flow
• Provide real-time traveller information to road users either using, or intending to use, the freeway
• Minimise adverse impacts to traffic flow on connecting or intersecting freeways and other arterial roads, to deliver improved network-wide performance and end-to-end journeys.
The safety performance of Smart Freeways managed with coordinated ramp signals (see Victoria’s Managed Motorway Design Guide, Volume 2: Part 2 – Section 6), when compared with unmanaged freeways, is that they have the following benefits:
• Reductions in casualty crashes (fatal, serious and other injury)
• Reduction in the crash rate.
The above benefits were also achieved with higher average speeds (+20 km/h).
Freeways with coordinated ramp signalling are safer due to the benefits of preventing and minimising freeway congestion, as well as assisting with merging and weaving manoeuvres along the freeway.
A study by Zheng (2012) has shown that the crash occurrence likelihood in the congested condition is approximately six times that in the free-flow condition. Safety benefits also result from the other freeway traffic management tools, e.g. by using variable speed limits (VSL) to provide queue protection and reduce secondary incidents.
Other studies (e.g. Federal Highways Administration 2003) have found that ramp signals reduce crashes by up to 50 per cent.
Smart Freeways Operational Efficiency Audit Guidelines – March 2021
Document No: D20#550488 6
2.4 Operational efficiency audits objectives
2.4.1 Objectives
Operational efficiency audits aim for the following objectives:
• On the basis of information available at the time of the audit, identify critical risks to operational efficiency (when the project is built), with consideration to the operational objectives for the freeway section.
• Develop recommendations on how to address those risks and to otherwise improve design
• Facilitate improved communications and collaboration on Smart Freeway design between project teams, Main Roads and other industry experts.
2.4.2 More than just a standards check
There are many examples of well-designed freeways built according to design standards but that may not always deliver the best operational outcomes. While standards are a critical starting point for any freeway project, they do not guarantee operational efficiency outcomes as they are often only minimum requirements and cannot cover all situations.
Projects are designed considering a range of factors, for example, cost, safety and traffic capacity, and sometimes when applying guidance and standards, designers need to balance competing demands to reach the best overall outcomes. It is important to understand the implications of those decisions on performance of the infrastructure once it is being used, and to ensure that the project’s ability to meet the operational objectives for that section of road is not compromised. Also, individual freeway sections, designed to standard, may be considered operationally efficient in isolation, but have adverse impacts on other adjacent or intersecting sections of the freeway network.
Operational efficiency audits therefore play an important role in ensuring that designers are interpreting and applying the available standards (or other good practice design guidance) appropriately. In this sense, the audit is not checking on compliance, but checking fitness for purpose according to performance-based design principles. Project audits may also lead to refinement of standards as experience and best practice based on further operational research is improved.
2.5 Benefits and costs
2.5.1 Benefits
The key benefits to Main Roads of conducting these audits range from the project-level to broader organisational and societal benefits. They include the following:
• Well-designed, sustainable freeways that operate at optimal efficiency with minimal flow breakdown and congestion
• Improved network performance such as productivity, travel efficiency, travel reliability, safety, driver experience, resilience and sustainability
• Identification of opportunities to improve project development, design and operation for a small proportion of the total project cost

Smart Freeways Operational Efficiency Audit Guidelines – March 2021
Document No: D20#550488 7
• Reduced whole-of-life costs of freeway projects, including sustained optimal operations over a longer time period prior to the need for further upgrading
• Reduced need to modify freeway infrastructure after it has been built
• Assurance that standards and good practice guidance are applied appropriately in a design, and that variations are justified and accepted
• Promotion of early consideration in project development and design of how the freeway section will operate, including integration with ‘whole-of-network operations’
• Communication and collaboration between technical experts in this field, e.g. audit team, Main Roads’ staff, design / delivery contractors, traffic operators
• Informed decision making at key points throughout the project lifecycle – even an audit where no deficiencies have been identified will provide Main Roads with assurance of project performance
• Internal quality assurance processes to provide a level of protection to the client and customer in any investment project
• Improved civil and technical design, construction and maintenance standards and specifications that affect ongoing freeway performance.
Through successful delivery of freeway projects and ongoing operations there will be flow-on benefits to road users and the community.
2.5.2 Costs
The cost of an audit will be largely dependent on the type of audit, for example what stage in the project lifecycle, as well as the size of the project and / or audit scope.
Audits are envisaged to involve a minimum of two independent experts for up to about a fortnight, subject to the size of the project and scope of audit components. This cost is a relatively low percentage of the total project or overall design costs.
For larger projects, it may be necessary for more audit stages during the project lifecycle (see Section 2.6). The total cost spent on audits, therefore, may increase incrementally with the size of project but should result in an appropriate percentage of total cost.
The cost of rectifying any inadequacies depends on how early in the design process they are identified and the consequent amount of redundant design time and re-work necessary.
Experience from operational efficiency audits carried out during the assessment or design stages of a project has generally found that identified concerns and recommended options typically have a minimal effect on project design or capital costs. In some cases, they result in cost savings. The audits have also enabled refinement of quantities and project costs. In any event, if cost increases did occur, this would likely be significantly less than the cost of modification or re-work if changes were required to a completed project or a project under construction.
Smart Freeways Operational Efficiency Audit Guidelines – March 2021
Document No: D20#550488 8
2.6 Project lifecycle and audit stages Operational efficiency audits may be undertaken at various stages in the lifecycle of a project. Audits seek to ensure a ‘right first time’ approach to project development and design. They are most cost-effective and have the greatest potential to deliver benefits when conducted early in the project lifecycle.
For example, an outcome of traffic analysis may be that it is not yet appropriate to install coordinated ramp signalling on a section of freeway as the forecast traffic volumes are too low and it is not yet a worthwhile investment. Nevertheless, it is important to verify that the right decision has been made and that civil infrastructure design will facilitate cost-effective retrofitting of managed freeways in the future (when demand levels are reached). In this case, civil works may be required to increase ramp storage to support future ramp signal operation. The audit can also assess the design of ITS foundation infrastructure components that should be incorporated in all freeway projects, such as vehicle detectors, closed circuit television (CCTV) cameras and variable message signs (VMS).
Similar to road safety audits, operational efficiency audits shall be common practice and integrated with Main Roads’ project development and delivery process. Audits should recognise opportunities and deliver solutions (RO&DS, Main Roads 2009), as a part of the project lifecycle.
The RO&DS process consists of five phases:
• Assess opportunities
• Select option
• Develop project plans
• Deliver solution
• Operate, maintain and evaluate.
The framework for potential operational efficiency audit stages throughout the RO&DS project lifecycle is detailed in Table 2.1.
The proposed framework represents the most comprehensive auditing process and may only be applicable for some projects. It is flexible to meet the different requirements for a range of projects. The number of audits conducted may vary depending on the size and type of each project.
For example, for large projects it may be necessary to have an audit at each stage of the RO&DS process. However, a small-medium sized project may only require an audit at the ‘select’ phase, to confirm that the traffic analysis has been conducted appropriately and to check that the concept design for the selected Smart Freeway services will deliver the desired performance outcomes. A refresher audit may then be required at the ‘deliver’ phase to provide feedback on the detailed design of all Smart Freeway civil and technology infrastructure components.
The minimum requirements are that:
• each audit component is covered by at least one audit, and
• audits for each component are conducted as early as is feasible or appropriate in the project lifecycle, to ensure a ‘right-first-time’ approach and to feed into project hold / decision points.
Smart Freeways Operational Efficiency Audit Guidelines – March 2021
Document No: D20#550488 9
The overall philosophy is to ensure appropriate consideration is given at each phase in the project lifecycle as to whether the project will deliver desirable outcomes for operational efficiency. It is not intended that the audit process become overly cumbersome or inefficient in terms of time or cost versus outcomes.
There may be an advantage in scheduling an efficiency audit in parallel with a road safety audit, so that all design review decisions are carried out at the same time.
As the project progresses along the RO&DS lifecycle, there is opportunity to refresh / review on whether the recommendations of previous audits have been addressed appropriately and to build on (but not repeat) existing audits as more information on the project design becomes available. The auditing sequence is intended to accommodate the level of information available in each RO&DS phase at the time of the audit, and will result in more detailed recommendations over time.
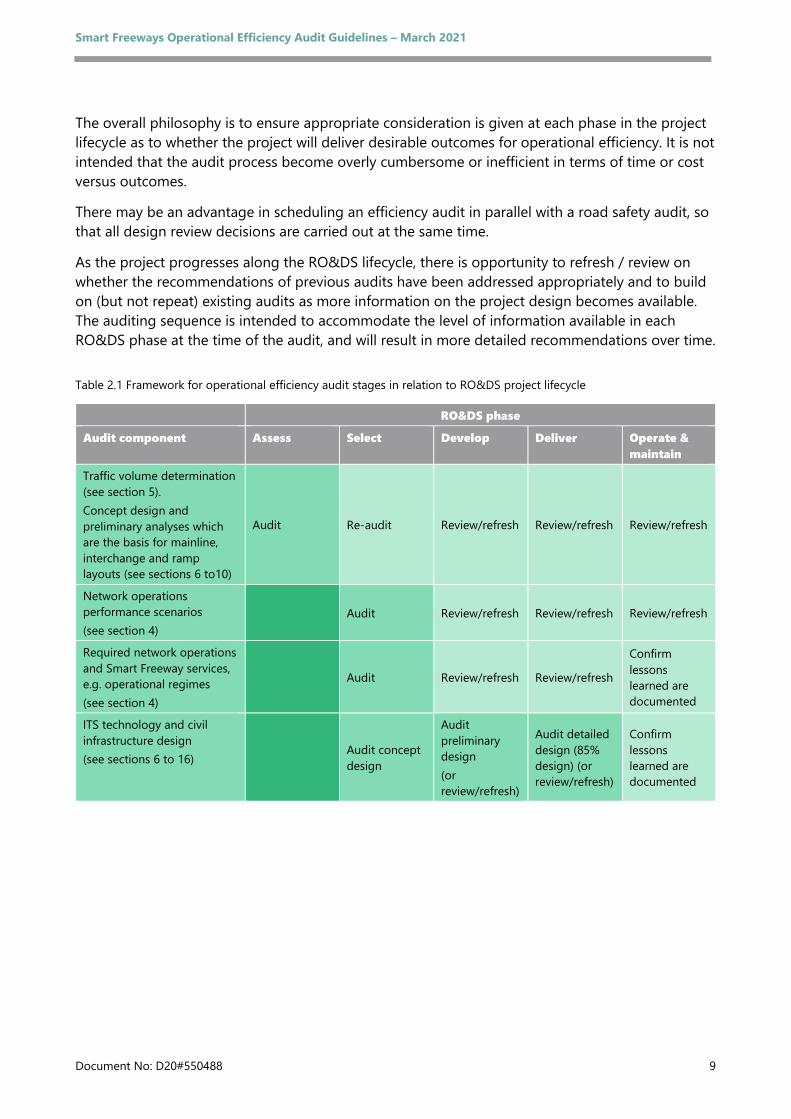
Table 2.1 Framework for operational efficiency audit stages in relation to RO&DS project lifecycle
RO&DS phase
Audit component Assess Select Develop Deliver Operate & maintain
Traffic volume determination (see section 5). Concept design and preliminary analyses which are the basis for mainline, interchange and ramp layouts (see sections 6 to10)
Audit Re-audit Review/refresh Review/refresh Review/refresh
Network operations performance scenarios (see section 4)
Audit Review/refresh Review/refresh Review/refresh
Required network operations and Smart Freeway services, e.g. operational regimes (see section 4)
Audit Review/refresh Review/refresh
Confirm lessons learned are documented
ITS technology and civil infrastructure design (see sections 6 to 16) Audit concept
design
Audit preliminary design (or review/refresh)
Audit detailed design (85% design) (or review/refresh)
Confirm lessons learned are documented
Smart Freeways Operational Efficiency Audit Guidelines – March 2021
Document No: D20#550488 10
2.7 Scope of guidelines These guidelines cover the critical civil and ITS components for consideration in Smart Freeway design and operation, excluding those components not implemented at the project level but as part of network-wide development initiatives.
The following design components are not currently considered explicitly in the scope of an operational efficiency audit:
• Foundation communications infrastructure (including ITS control cabinets).
• Foundation power infrastructure.
• Central control system, control algorithms, integration of Smart Freeway tools and ITS architecture.
• Lane markings and static / fixed regulatory and warning signs (aside from where they affect the design of other signing that is in scope, see Sections 7, 11 and 16).
• Lighting.
• In-car and off-road interventions, e.g. in relation to network monitoring, incident response and traveller information.
• Other ITS technologies used at highly specific locations or primarily for other purposes such as safety, e.g. advanced warning signs, environmental monitoring systems.
These guidelines also do not cover guidance on auditing of technical specifications for ITS infrastructure.
Smart Freeways Operational Efficiency Audit Guidelines – March 2021
Document No: D20#550488 11
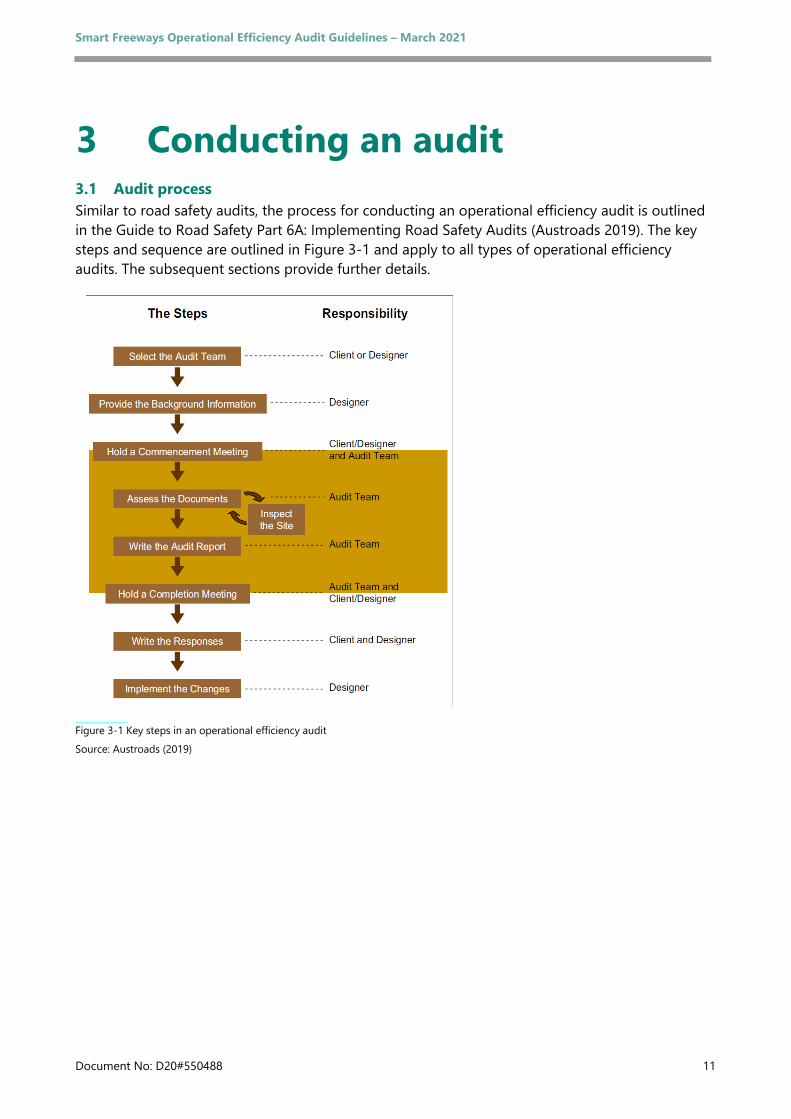
3 Conducting an audit 3.1 Audit process Similar to road safety audits, the process for conducting an operational efficiency audit is outlined in the Guide to Road Safety Part 6A: Implementing Road Safety Audits (Austroads 2019). The key steps and sequence are outlined in Figure 3-1 and apply to all types of operational efficiency audits. The subsequent sections provide further details.
Source: Austroads (2019)
Figure 3.1 Figure 3-1 Key steps in an operational efficiency audit

Smart Freeways Operational Efficiency Audit Guidelines – March 2021
Document No: D20#550488 12
3.2 Select the audit team There should be a minimum of two auditors (preferably three) per audit team with a mix of relevant experience to encourage a balanced and comprehensive review. The total number of audit team members will depend on the size and type of project. It may be necessary to have larger team sizes to ensure appropriate coverage of all disciplines appropriate to the project.
The audit team leader shall be a Main Roads accredited senior operational efficiency auditor, as per the definition below, relevant to audit experience. At least one other team member shall be a Main Roads accredited operational efficiency auditor. The remaining members shall have, as a minimum, completed the Main Roads’ Smart Freeways and Operational Efficiency Audit training course.
The three requirements for all audit team members are:
• Independence – the audit team member shall be independent of the project team. This ensures that the audit is undertaken objectively and with a ‘fresh’ pair of eyes. Suitable auditors may be sourced from public / private organisations or independent consultants.
• Relevant skills – the audit team member shall have relevant skills, knowledge and experience of current standards and best practice in one or more of the following disciplines:
– Smart Freeway design, i.e. design of coordinated ramp signals, all lane running and LUMS – freeway geometric design – network operations planning – traffic modelling and analysis – traffic engineering and management – road safety – ITS design – Smart Freeway operations including control systems and algorithms
• Adequate experience – as below:
– senior operational efficiency auditor (team leader):
o minimum seven years’ relevant experience in at least four of the disciplines listed above, including Smart Freeway design and / or freeway design
o completion of Main Roads’ Smart Freeways and Operational Efficiency Audit training course, or similar training course acceptable to Main Roads
o undertaken at least three formal operational efficiency audits1 o be able to demonstrate that they have kept their professional experience current
– operational efficiency auditor:
o minimum of three years relevant experience in at least one of the disciplines listed above
o completion of Main Roads’ Smart Freeways and Operational Efficiency Audit training course, or similar training course acceptable to Main Roads.
Main Roads’ policy and processes should be followed in appointing the audit team. A register of accredited auditors is available from Network Operations Planning Manager.
1 In the absence or unavailability of accredited auditors, the Main Roads’ project director should liaise with the custodian of the operational efficiency audit process (Manager Network Performance) to identify suitable candidates.
Smart Freeways Operational Efficiency Audit Guidelines – March 2021
Document No: D20#550488 13
3.3 Provide analysis, design and background information The client or designer shall provide the audit team with all the necessary information to allow an adequate assessment of the project analyses and design. The information shall be provided in a clear and structured manner according to the components being audited, and with the most recent information consistent with the latest design being audited.
The presentation of design drawings shall be according to the requirements in the Main Roads’ Supplement to Victoria’s MMDG Volume 2: Part 3 - new Section 1.7: Additional Information.
The audit inputs may vary depending on the stage of the project as well as the types of components to be assessed. For example, the inputs for an assessment of ‘entry ramp operation’ as part of a detailed design audit (at the RO&DS ‘Deliver’ phase) are expected to include detailed design layouts, forecast design volumes and analyses. However, this is likely to be unavailable for a traffic flow analysis audit (at the RO&DS ‘Assess’ phase).
Audits conducted later in the project lifecycle are expected to refresh / review previous audits and therefore may require all previous documentation, particularly where updates have been made. In essence, the more progressed along the project lifecycle, the greater the level of detail and information needed to inform the audit process.
The quality and reliability of traffic data may be a key constraint for both project design and the audit. All efforts shall be made to source the best available data, and where it is unavailable, any assumptions and limitations shall be clearly recorded.
Aside from project-specific documentation, additional sources of information include relevant policies and design standards / guidelines. The client / designer should highlight any aspects of design where standards have not been achieved and the reasons why.
See Section 3.11 for a list of relevant policies and design standards / guidance that may need to be considered by the audit team. There are examples of audit inputs relating to project documentation for each component discussed in Sections 5 to 16. Relevant policies and design standards / guidance is available on the Main Roads’ website (generally recorded in the References section of these guidelines).
3.4 Hold an initial meeting This meeting should be held between the audit team and Main Roads’ Project Manager / Director (or their representative) for the project being audited, with other staff attending as necessary. This is an opportunity to confirm the scope, objectives, process and desirable outcomes of the audit.
The meeting should also be used to give the audit team background information to the project and to highlight any issues, constraints or unique aspects of the project that require special consideration.
3.5 Assess the documents and inspect the site All available information shall be reviewed in detail to form conclusions about the adequacy of Smart Freeway control and ITS as well as the operational efficiency performance of the project.
Smart Freeways Operational Efficiency Audit Guidelines – March 2021
Document No: D20#550488 14
A site inspection is generally required to enable the audit team to:
• understand the project context
• become familiar with, and appreciate the significance of traffic movements and traffic demands in the AM and PM peaks, particularly where Smart Freeway control and other ITS are being retrofitted to existing routes
• understand the road features, for example curves, grades, lane reductions, and
• understand the potential causes of flow breakdown and characteristics of the critical bottlenecks.
In some instances, traffic data may not always provide the full story, particularly if the quality of data is poor. In other instances, such as a new freeway, there will be greater reliance on strategic modelling and forecast travel patterns / volumes. A site visit can enable the audit team to better understand the role and context of the route within the road network, for example, the significance of the route in relation to connectivity, major interchanges or traffic flows, mix of traffic, freight vehicles and so on. A site visit also enables photographs that more clearly illustrate any findings or recommendations within the report. CCTV images also may provide additional insight on traffic flows or problems.
3.6 Write the audit report The length and format of the audit report may vary depending on the size of audit and client requirements. The audit report outline in Appendix B should be used as a guide. As a minimum, the audit report should incorporate:
• Project outline – includes a description of the project being audited.
• Background information – outlines the audit purpose and objectives, audit type (e.g. which stage in project lifecycle), audit date, the audit team, audit activities (e.g. site inspections) and list of audit inputs (e.g. project documentation and design standards / guidelines referenced).
• Findings and recommendations – includes concise reporting of findings on operational efficiency deficiencies and related concerns, with recommendations or suggested options on how they can be addressed. Recommendations should be numbered throughout the report and then tabulated for ease of reference either within the report or as an appendix. This table will also serve as the corrective action report (CAR). It should have blank columns for the client / designer to provide a response against each issue, as shown in Section 3.8 and Appendix C.
• Formal statement – e.g. concluding statement signed by all audit team members advising they have conducted the audit.
For some findings, concerns may be of a general nature about the route or project as a whole. Other concerns may relate to specific locations or design issues. To help the client / designer in their decision-making, auditors should provide as much information as possible about the reason why a design aspect poses a risk and the cause and nature of the problem.
Smart Freeways Operational Efficiency Audit Guidelines – March 2021
Document No: D20#550488 15
All concerns / findings should have a corresponding recommendation. In some instances, these may be specific and targeted to an aspect of design. In other instances, there may be no obvious solution or several potential solutions, in which case it may be recommended that further investigation be carried out. Unless the identified concern represents a substantial shortcoming in the design related to performance, recommendations should not result in any significant redesign, except if there are critical operational or safety risks, or the design has been based on inaccurate information or assumptions.
Generally, the audit team should prioritise or rank the concerns and recommendations based on their judgement and expertise. This should consider the seriousness of the matter raised (e.g. very important / important / less important), or in terms of the level of risk (e.g. high / medium / low).
The audit report shall be submitted to the Main Roads’ project director or their representative, who should then distribute it within the project team for formal responses to the findings and recommendations. The report should also be distributed internally to the custodian of the operational efficiency audit process (Network Operations Planning Manager) and other stakeholders as appropriate.
3.7 Hold a completion meeting This meeting may be held between the audit team leader (or nominated member of the audit team) and the Main Roads’ project manager / director (or their representative), with other staff attending as necessary. This is an opportunity to discuss the audit findings / recommendations and for the audit team leader to provide any additional guidance on appropriate corrective actions.
In other situations, follow-up discussions with the audit team leader may be needed on the audit report as part of the process as the project team reviews the report findings and recommendations.
3.8 Write the responses and implement changes The final step is critical to ensuring that the audit process is effective in delivering improvements to the design phase for the project, as well as providing general feedback that may inform better design in future projects. As a formal process it may also be ‘audited’ in the future, so it is important that all decisions are documented, together with reasons for those decisions.
The detailed steps are as follows:
• Review audit findings and recommendations – the audit recommendations are not mandatory, and in some cases may not be feasible due to other factors such as cost, approved scope or political considerations. Each concern and recommendation should be reviewed by an appropriate officer from the project team to determine if it will be accepted, rejected, or if an alternative solution will be investigated or adopted.
• Document response in a corrective action report – the Main Roads’ project manager / director will determine the action required in response to each of the concerns / recommendations, in consultation with relevant technical specialists, and document the decision within the CAR. Copies of the CAR shall be submitted to the audit team, Network Operations Planning Manager and other stakeholders for information and / or feedback.

Smart Freeways Operational Efficiency Audit Guidelines – March 2021
Document No: D20#550488 16
• Provide feedback to organisations – Main Roads’ project manager / director should provide feedback from the auditing process to the client and designer organisations as necessary to prevent similar design deficiencies or issues reoccurring. This may be through recording a ‘lessons learned’ log that is disseminated to key stakeholders, or through updating of standards and guidelines, if appropriate. Feedback may also be provided to the audit team in terms of the outcomes, as well as how the audit was conducted.
3.9 Communications Although the audit process is independent, effective and clear communications between the audit team and project team are essential to ensure that the audit objectives are understood by all, and that the outcomes are useful and accepted by stakeholders. This includes engagement at the commencement and completion meetings as well as informally throughout the audit process. This helps to ensure that any reasoning behind design decisions and audit recommendations is understood.
3.10 Governance and organisational arrangements
3.10.1 Key personnel
The key personnel and their responsibilities in the audit are summarised in Table 3.1.
Table 3.1 Key personnel and governance responsibilities
Role Responsibility
Main Roads’ Project Director (or their representative)
• Primary contact for audit team leader • Provide all relevant information to the audit team
and oversee the audit process • Review audit report and ensure that the CAR is implemented (in
consultation with the Manager Network Performance as required) • Liaise with relevant stakeholders, such as the Main Roads’ asset owner • Provide feedback to the wider organisation
Custodian of the operational efficiency audit process (Network Operations Planning Manager , Main Roads)
• Assist the project manager/director in audit planning, including determination of audit stages within the project lifecycle and selection of the audit team
• Discuss the CAR and its subsequent implementation with the project manager/director
• Ensure that relevant stakeholders are being kept informed by the Project Manager/Director
• Seek and collate feedback on the audit process
Audit team leader (senior operational efficiency auditor)
• Primary contact for project manager/director • Lead audit team • Submit audit report
Audit team members (operational efficiency auditors)
• Assist the senior operational efficiency auditor (team leader) to review the project, identify operational concerns and write the report
Smart Freeways Operational Efficiency Audit Guidelines – March 2021
Document No: D20#550488 17
3.10.2 Legal issues
Potential legal issues are a critical concern for road safety audits, due to the potential risk of incurring liability as a result of any recommendations made through the audit process. This risk is generally reduced in relation to operational efficiency audits, which are not responsible for reviewing all aspects of safety in relation to a project. Nevertheless, an operational efficiency audit may comment on a road safety matter in which case a duty of care is required for road users.
Care should always be taken when writing the audit report and recording any responses in terms of decisions / actions, as there is always the possibility it could be made a public document in the future.
3.11 Relevant policies and design standards When auditing the operational efficiency of a freeway project, the audit team should be aware of, and refer to, the latest relevant Smart Freeway policies and design standards and guidelines. When requested, the project director or their representative shall provide relevant information on the standards and guidelines used for the project design. The audit team should make sure to use the latest best practice and up-to-date knowledge.
The Main Roads’ Smart Freeways policy, guidelines and supplement that make up the primary references and basis for audits are listed in the Foreword. Current guidelines, standards and specifications are published on Main Roads’ website.
Other important documents to be used in the design and audit context include:
• Victoria’s Managed Motorways Design Guide (Department of Transport), Volume 2: Design Practice, Part 2, Network Optimisation
• Victoria’s Managed Motorways Design Guide (Department of Transport), Volume 2: Design Practice, Part 3, Motorway Planning and Design
• Victoria’s Managed Motorways Design Guide (Department of Transport), Volume 2: Design Practice, Part 4, Lane Use Management, Variable Speed Limits and Traveller Information
• Main Roads Western Australia 2019, Guidelines for Analysing Freeway sections: Obtaining Peak Hour Volumes from ROM24 and Adjustment Process, Main Roads Western Australia, East Perth, WA.
Where the audit team considers that available documents may not represent best practice, or wish to determine applicable standards where conflicting advice is available, they should consult with the Network Operations Directorate as custodian of all Smart Freeway documents, or the Planning and Technical Services Directorate in relation to geometry and device layout drawings.
The following guidelines may be noteworthy:
Austroads guides: latest issues in various parts, together with Main Roads’ supplements:
• Guide to Traffic Management
• Guide to Road Design
• Guide to Road Safety.
Smart Freeways Operational Efficiency Audit Guidelines – March 2021
Document No: D20#550488 18
Australian standards together with Main Roads’ supplements:
• AS 1428 Set-2010: Design for Access and Mobility
• AS 1742 Set-2010: Manual of Uniform Traffic Control Devices
• AS 1743-2001: Road Signs: Specifications.
The References section includes additional documents relevant to the auditors. Examples of previous operational efficiency audits may also be requested from Main Roads.
Where there are conflicts between various standards, the Main Roads’ guides as listed in the Foreword shall take precedence.
3.12 Use of these guidelines
3.12.1 Purpose of the guidelines document
These guidelines are intended to provide advice to the audit team on how to assess each design component. They are meant to be flexible, not prescriptive, and should be applied appropriately based on the experience and judgement of the audit team.
The following Sections (5 to 16) of the guidelines are organised according to each component of the operational efficiency audit. The components cover the initial problem assessment and solution identification phases in project delivery, as well as the detailed geometric and ITS equipment layouts for Smart Freeway operation.
Not all components may be relevant to all audit stages or projects. For example, an audit undertaken at the RO&DS ‘Assess’ phase may only be able to comment on the ‘Traffic Flow Analysis’ component. Another example is if a project does not incorporate VSL, then this component cannot be audited. The audit report should clearly indicate the scope of the audit.
3.12.2 Use and purpose of the checklists
The use of checklists (see Appendix A) can help the audit team consider the basic issues associated with the various components of the operational efficiency audit. As there are many aspects to cover when carrying out an audit, checklists can be used as a guide to focus the audit team’s attention on typical matters that should be covered.
Each project differs and will raise issues that may have implications relating to operational efficiency including road layout, as well as the type and positions of devices. The audit team is not limited to the items on the checklists and need to keep in mind that they are seeking to identify operational efficiency deficiencies, which in some cases may be outside of the range of the checklist items.
The following approaches can be adopted when using checklists as part of an audit:
• At the start of an audit, the audit team may review the lists of items as a general guide and then plan the review accordingly.
• The audit team may systematically work through each checklist relevant to the project being audited.

Smart Freeways Operational Efficiency Audit Guidelines – March 2021
Document No: D20#550488 19
• Near the end of a review, the audit checklist can be used to determine whether any matters have been overlooked.
Using a checklist alone may not reveal issues associated with interactions between layout and traffic management tools. Some design elements in themselves may be safe and satisfactory, but the interaction or proximity of signs / devices may lead to safety or operational problems.
To summarise:
• Checklists are used as a guide to systematically focus attention on various matters and ensure that all important issues are considered.
• An audit team should not be restricted by the items on the checklists.
Checklists are a useful prompt for the audit team, particularly those with limited audit experience. There is no requirement to include the checklists within the audit report.
Smart Freeways Operational Efficiency Audit Guidelines – March 2021
Document No: D20#550488 20
4 Performance objectives and Smart Freeway solutions
4.1 Overview
4.1.1 Component description
The development of a Smart Freeway project takes place within the context of understanding road network operational problems, project needs and identifying solutions that can be considered to define a scope of works.
The Smart Freeways Policy Framework Overview (Main Roads 2020) provides background and an outline on the objectives and intended outcomes of Smart Freeways provisions and improvements. Each project considered needs to be designed in the context of the desired performance after the project is constructed, and with a clear intent in the context of designing for operations.
This audit component includes assessment of a network operations plan (NOP), in particular the strategic objectives and identified Smart Freeways solutions. A NOP may be prepared for the road network or for the project area. In the project context, the plan would assess the current operational traffic problems and performance within the project area against strategic objectives. It would then identify and evaluate potential management and operations options relative to the objectives and desired performance for Smart Freeways.
This process is supported by the traffic analysis activities described in Section 5, and results in the selection of preferred options or concept designs. These may comprise a combination of ITS technologies as well as geometric improvements, for example, civil upgrades.
The Smart Freeways Provision Guidelines (Main Roads 2020) defines a managed freeway as a freeway comprising well-designed infrastructure where higher-order ITS interventions (above foundation-level ITS) of at least CRS have been applied, as appropriate to achieve Main Roads’ objectives for optimal freeway performance.
Additional interventions may also be applied to help achieve the desired network performance, or in some cases, warrants for CRS may not yet be achieved and only a foundation-level of ITS is required.
This component of the operational efficiency audit process provides a high-level audit of the general project scope and proposed Smart Freeway services, and ITS components relating to achieving the defined project objectives and targeted performance. The approach is aligned with the systems engineering model adopted by Main Roads for delivery of Smart Freeway ITS projects. Other detailed checks relating to specific operational components are provided in Sections 6 to 16 of the guidelines.
Smart Freeways Operational Efficiency Audit Guidelines – March 2021
Document No: D20#550488 21
4.1.2 Audit objective
The key objective for auditing this component is to confirm that the project scope and selection of Smart Freeway services is consistent with the project goals, objectives and performance targets.
4.1.3 Audit inputs
Audit inputs for the performance and service definition component may include the following, if applicable:
• network operations plan
• business case (for the purpose of understanding the problem and project objectives, as well as for details such as proposed design year and staging of works)
• concept-of-operations document
• design brief and specification, including functional requirements.
The checklist for this component is provided in in Appendix A, Checklist 1: Checklist for Performance and Service Definition.
4.2 Key principles The key principles for determining freeway performance and Smart Freeway services are to:
• identify and understand project objectives and design intent, in the context of Main Roads’ policy and wider network performance objectives
• identify and understand project performance targets relative to various road user groups.
• evaluate project scope, including civil upgrades and proposed Smart Freeway ITS components, relative to achieving the defined project objectives and performance targets.
4.3 Freeway performance
4.3.1 Operations objectives
Operations objectives for a project are usually defined in the project’s NOP or project master plan. These objectives should align with Main Roads’ objectives for Smart Freeway projects included in the Smart Freeways Policy (Main Roads 2020) and Smart Freeways Policy Framework Overview (Main Roads 2020).
While objectives may vary for different projects or sections of freeways, typical operations objectives are listed in Table 4.1.
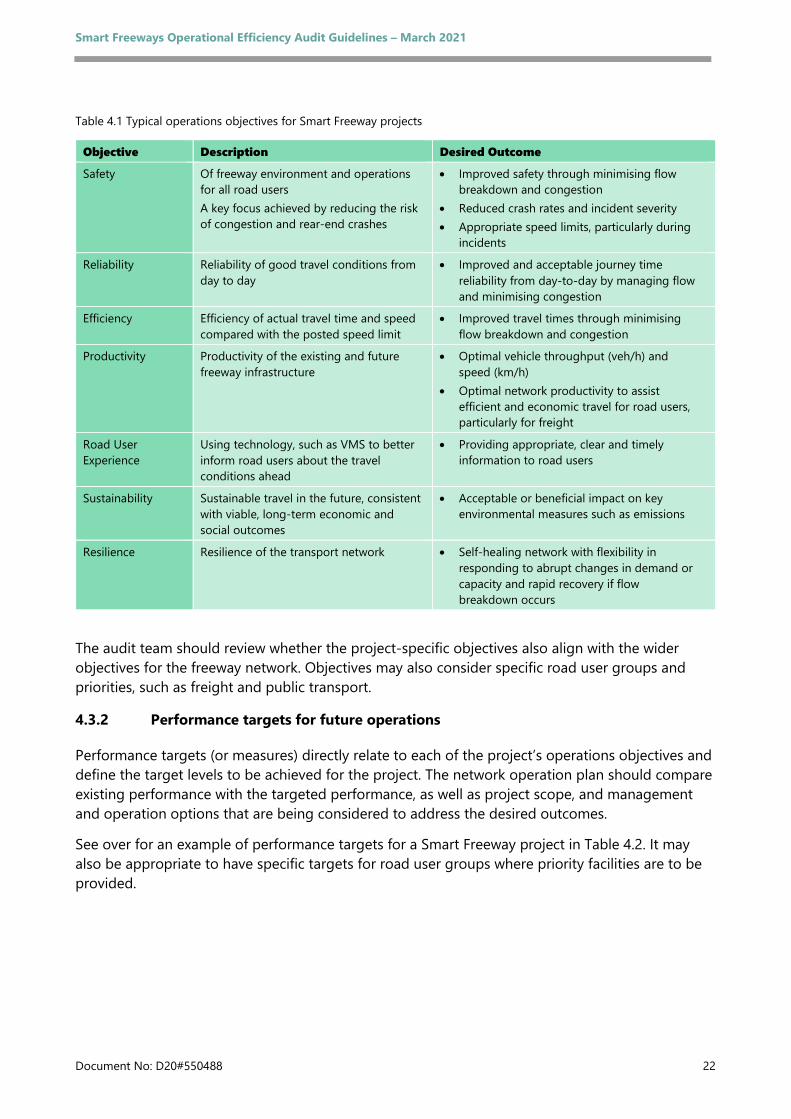
Smart Freeways Operational Efficiency Audit Guidelines – March 2021
Document No: D20#550488 22
Table 4.1 Typical operations objectives for Smart Freeway projects
The audit team should review whether the project-specific objectives also align with the wider objectives for the freeway network. Objectives may also consider specific road user groups and priorities, such as freight and public transport.
4.3.2 Performance targets for future operations
Performance targets (or measures) directly relate to each of the project’s operations objectives and define the target levels to be achieved for the project. The network operation plan should compare existing performance with the targeted performance, as well as project scope, and management and operation options that are being considered to address the desired outcomes.
See over for an example of performance targets for a Smart Freeway project in Table 4.2. It may also be appropriate to have specific targets for road user groups where priority facilities are to be provided.
Objective Description Desired Outcome
Safety Of freeway environment and operations for all road users A key focus achieved by reducing the risk of congestion and rear-end crashes
• Improved safety through minimising flow breakdown and congestion
• Reduced crash rates and incident severity • Appropriate speed limits, particularly during
incidents
Reliability Reliability of good travel conditions from day to day
• Improved and acceptable journey time reliability from day-to-day by managing flow and minimising congestion
Efficiency Efficiency of actual travel time and speed compared with the posted speed limit
• Improved travel times through minimising flow breakdown and congestion
Productivity Productivity of the existing and future freeway infrastructure
• Optimal vehicle throughput (veh/h) and speed (km/h)
• Optimal network productivity to assist efficient and economic travel for road users, particularly for freight
Road User Experience
Using technology, such as VMS to better inform road users about the travel conditions ahead
• Providing appropriate, clear and timely information to road users
Sustainability Sustainable travel in the future, consistent with viable, long-term economic and social outcomes
• Acceptable or beneficial impact on key environmental measures such as emissions
Resilience Resilience of the transport network • Self-healing network with flexibility in responding to abrupt changes in demand or capacity and rapid recovery if flow breakdown occurs
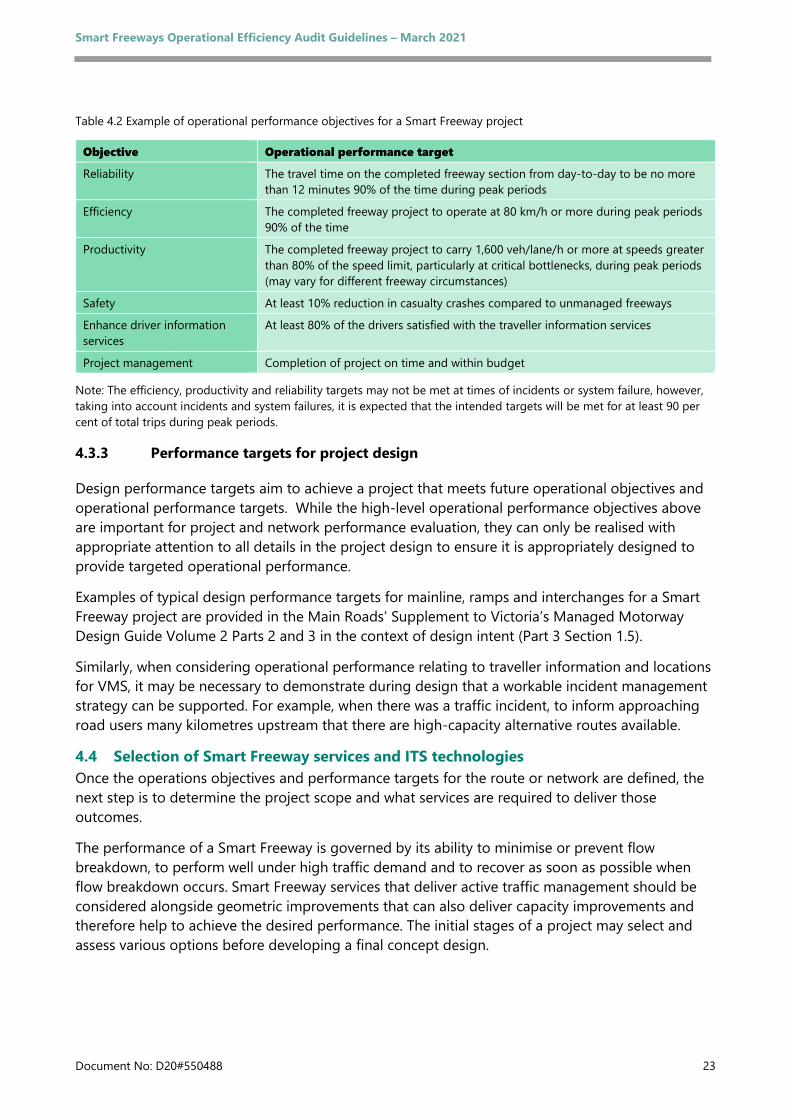
Smart Freeways Operational Efficiency Audit Guidelines – March 2021
Document No: D20#550488 23
Table 4.2 Example of operational performance objectives for a Smart Freeway project
Note: The efficiency, productivity and reliability targets may not be met at times of incidents or system failure, however, taking into account incidents and system failures, it is expected that the intended targets will be met for at least 90 per cent of total trips during peak periods.
4.3.3 Performance targets for project design
Design performance targets aim to achieve a project that meets future operational objectives and operational performance targets. While the high-level operational performance objectives above are important for project and network performance evaluation, they can only be realised with appropriate attention to all details in the project design to ensure it is appropriately designed to provide targeted operational performance.
Examples of typical design performance targets for mainline, ramps and interchanges for a Smart Freeway project are provided in the Main Roads’ Supplement to Victoria’s Managed Motorway Design Guide Volume 2 Parts 2 and 3 in the context of design intent (Part 3 Section 1.5).
Similarly, when considering operational performance relating to traveller information and locations for VMS, it may be necessary to demonstrate during design that a workable incident management strategy can be supported. For example, when there was a traffic incident, to inform approaching road users many kilometres upstream that there are high-capacity alternative routes available.
4.4 Selection of Smart Freeway services and ITS technologies Once the operations objectives and performance targets for the route or network are defined, the next step is to determine the project scope and what services are required to deliver those outcomes.
The performance of a Smart Freeway is governed by its ability to minimise or prevent flow breakdown, to perform well under high traffic demand and to recover as soon as possible when flow breakdown occurs. Smart Freeway services that deliver active traffic management should be considered alongside geometric improvements that can also deliver capacity improvements and therefore help to achieve the desired performance. The initial stages of a project may select and assess various options before developing a final concept design.
Objective Operational performance target
Reliability The travel time on the completed freeway section from day-to-day to be no more than 12 minutes 90% of the time during peak periods
Efficiency The completed freeway project to operate at 80 km/h or more during peak periods 90% of the time
Productivity The completed freeway project to carry 1,600 veh/lane/h or more at speeds greater than 80% of the speed limit, particularly at critical bottlenecks, during peak periods (may vary for different freeway circumstances)
Safety At least 10% reduction in casualty crashes compared to unmanaged freeways
Enhance driver information services
At least 80% of the drivers satisfied with the traveller information services
Project management Completion of project on time and within budget
Smart Freeways Operational Efficiency Audit Guidelines – March 2021
Document No: D20#550488 24
Examples of Smart Freeway services and traffic management tools include:
• road user services
– real-time traffic control, including CRS, LUMS and VSL – real-time traveller information, including display via VMS
• operational (road authority) services
– real-time network intelligence, including collection of traffic data, real-time monitoring of the network and automatic incident detection
– freeway performance evaluation and system / device performance management.
These services are described further in the Smart Freeways Provision Guidelines (Main Roads 2020). Each service contributes to achieving the project objectives in different ways. For example, managing density (occupancy) on the mainline via coordinated ramp signalling can help to achieve and sustain maximum operational capacities of the infrastructure and support incident and event management. This can deliver productivity, reliability, efficiency and safety benefits.
Using the full pavement asset with all lane running (ALR) is another possible operating strategy for achieving Smart Freeway objectives. These strategies provide additional capacity within the existing infrastructure and are enabled by managing lane use (and speed) to optimise capacity and safety in response to changing traffic demand or incidents on the network.
Selection of the services / tools relating to real-time traffic control is also dependent on whether peak-period traffic flow thresholds have been reached by an appropriate forecast year, as otherwise it is not a worthwhile investment at the current time (see Section 5).
The Smart Freeways Provision Guidelines (Main Roads 2020) include guidance on Smart Freeway warrants and is a key reference for auditing this component.
Where there are several different project options under consideration, the audit should assess the logic for selection of the preferred option, based on information provided in relevant documents such as the business case or network operations plan. This should consider the extent to which the option can satisfy future demand, particularly at key bottlenecks, and achieve the operational objectives that have been set as well as whole-of-life cost-benefit analysis.
Once the core Smart Freeway services are accepted, the key functional requirements should be defined to inform the appropriate selection and combination of traffic management tools. Functional requirements should be based on user needs, which should be recorded in the Concept of Operations document prepared for the project.
In some cases, one service may require several technology elements, for example CRS (ramp signals for corridor management) requires vehicle detectors, freeway ramp signals, CCTV and VMS (such as RC1, RC2 and RC3 signs). Equally, one technology element may deliver against a number of services, such as vehicle detectors provide traffic data for algorithms used in CRS, VSL, LUMS, incident detection and travel time calculations, and support freeway performance evaluation.
The audit should assess whether the appropriate combination of technologies has been selected to cover all desired Smart Freeway services. This assessment should be aligned with Main Roads’ guidance for mapping ITS services and ITS elements, as per the matrix in Table 4.3.

Smart Freeways Operational Efficiency Audit Guidelines – March 2021
Document No: D20#550488 25
In summary, the operations objectives are the key starting point for Smart Freeway design and operations. They shall be considered throughout the project lifecycle, to guide and understand the implications of design decisions.
There shall also be an awareness that operations objectives and performance targets, as well as priorities for the use of freeways, may change in the short-to-medium term and with the staging of road improvements. However, freeway infrastructure, in particular the civil components, is a long-term investment so when developing the optimal design, especially in the initial stages, designers should be aware of how objectives may change over time.
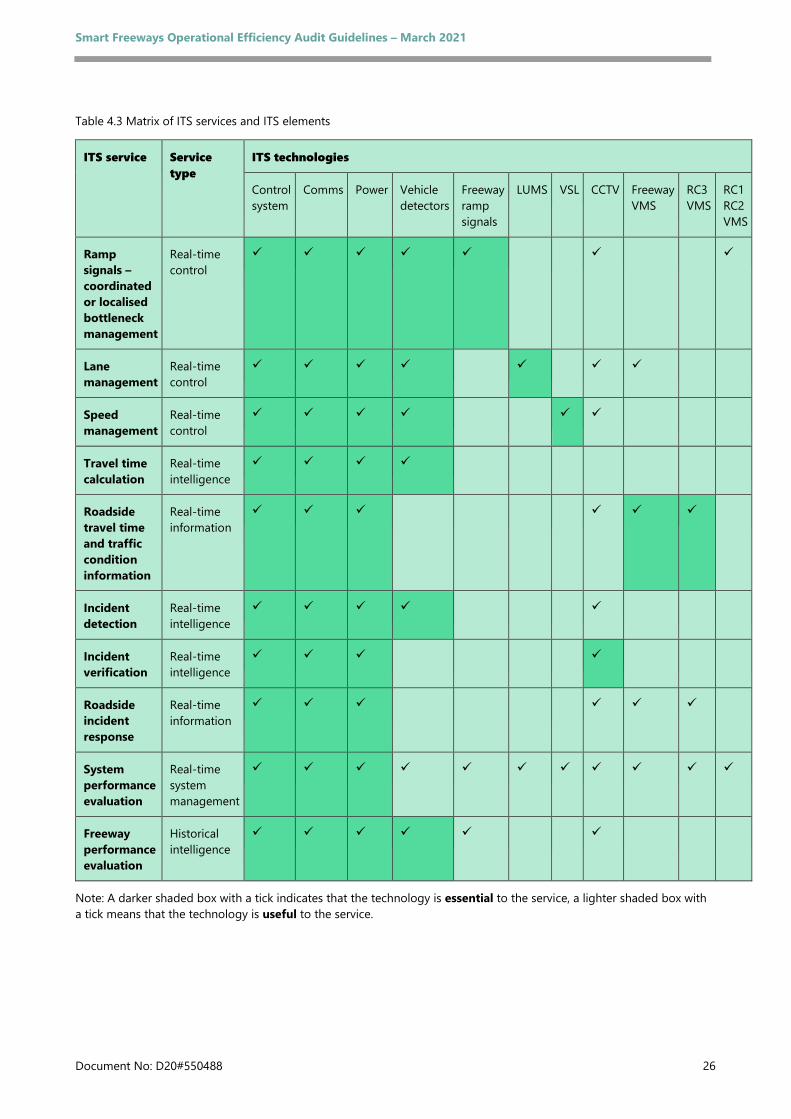
Smart Freeways Operational Efficiency Audit Guidelines – March 2021
Document No: D20#550488 26
Table 4.3 Matrix of ITS services and ITS elements
Note: A darker shaded box with a tick indicates that the technology is essential to the service, a lighter shaded box with a tick means that the technology is useful to the service.
ITS service Service type
ITS technologies
Control system
Comms Power Vehicle detectors
Freeway ramp signals
LUMS VSL CCTV Freeway VMS
RC3 VMS
RC1 RC2 VMS
Ramp signals – coordinated or localised bottleneck management
Real-time control
Lane management
Real-time control
Speed management
Real-time control
Travel time calculation
Real-time intelligence
Roadside travel time and traffic condition information
Real-time information
Incident detection
Real-time intelligence
Incident verification
Real-time intelligence
Roadside incident response
Real-time information
System performance evaluation
Real-time system management
Freeway performance evaluation
Historical intelligence
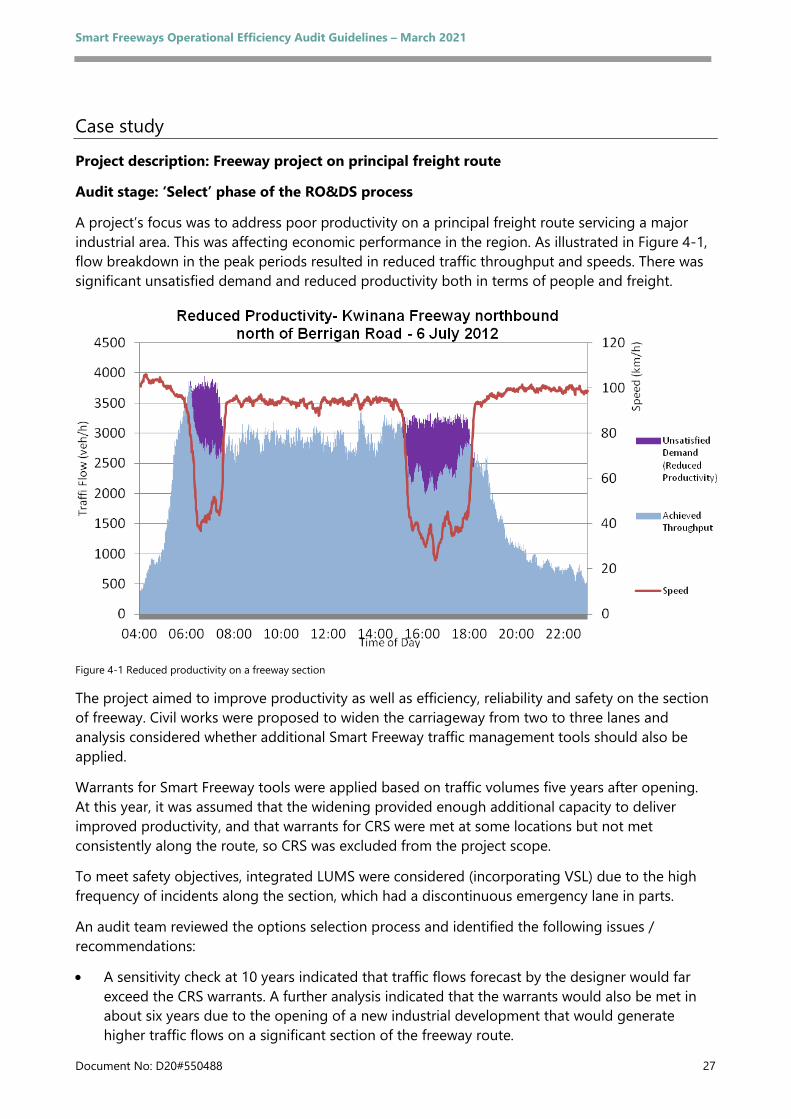
Smart Freeways Operational Efficiency Audit Guidelines – March 2021
Document No: D20#550488 27
Case study
Project description: Freeway project on principal freight route
Audit stage: ‘Select’ phase of the RO&DS process
A project’s focus was to address poor productivity on a principal freight route servicing a major industrial area. This was affecting economic performance in the region. As illustrated in Figure 4-1, flow breakdown in the peak periods resulted in reduced traffic throughput and speeds. There was significant unsatisfied demand and reduced productivity both in terms of people and freight.
Figure 4-1 Reduced productivity on a freeway section
The project aimed to improve productivity as well as efficiency, reliability and safety on the section of freeway. Civil works were proposed to widen the carriageway from two to three lanes and analysis considered whether additional Smart Freeway traffic management tools should also be applied.
Warrants for Smart Freeway tools were applied based on traffic volumes five years after opening. At this year, it was assumed that the widening provided enough additional capacity to deliver improved productivity, and that warrants for CRS were met at some locations but not met consistently along the route, so CRS was excluded from the project scope.
To meet safety objectives, integrated LUMS were considered (incorporating VSL) due to the high frequency of incidents along the section, which had a discontinuous emergency lane in parts.
An audit team reviewed the options selection process and identified the following issues / recommendations:
• A sensitivity check at 10 years indicated that traffic flows forecast by the designer would far exceed the CRS warrants. A further analysis indicated that the warrants would also be met in about six years due to the opening of a new industrial development that would generate higher traffic flows on a significant section of the freeway route.
Smart Freeways Operational Efficiency Audit Guidelines – March 2021
Document No: D20#550488 28
• The sections where the CRS warrants were met within five years represented the critical bottlenecks on the route. Therefore, although the whole route did not meet the numerical warrants for CRS, the audit team advised the installation of CRS at all entry ramps was necessary to manage and balance demand to meet the capacity of those critical bottlenecks. In this instance, it appeared that the designers may not have fully understood the Smart Freeway principles for identifying that CRS would be needed for mainline route management and control.
• The safety analysis conducted justifying the LUMS system confirmed that the high incident rate was mainly due to congested conditions. Installing CRS would minimise flow breakdown and deliver associated safety benefits of reduced congestion. Therefore, installation of LUMS (with relatively high capital as well as maintenance and operations costs) would be considered a low priority, particularly since the discontinuous emergency lane was only for very short sections (< 100 m).
• For this project, it was therefore recommended to incorporate CRS with the widening in the project scope. This would generally satisfy the forecast demand for the 10-year timeframe, and deliver against the project performance targets, particularly in terms of improving productivity on the route.
Smart Freeways Operational Efficiency Audit Guidelines – March 2021
Document No: D20#550488 29
5 Design traffic volume determination
5.1 Overview
5.1.1 Component description
A comprehensive traffic analysis for a Smart Freeway is required to deliver a project that can be managed effectively. This requires:
• determining sound and appropriate design (forecast) traffic flows for the mainline as well as the interchanges, entry ramps and exit ramps
• selecting appropriate Smart Freeway ITS and traffic management tools that meet traffic flow warrants, provide for safety needs and deliver the necessary traffic management to achieve desired freeway performance that suits current and / or future staging options.
5.1.2 Audit objective
The key objective for auditing this component is to confirm a sound basis for traffic determination and analysis for the Smart Freeway design, and that the design will enable full control of all entry flows, therefore achieve Smart Freeway traffic flow objectives.
5.1.3 Audit inputs
Audit inputs for the traffic flow analysis may include:
• a business case for the purpose of understanding the problem and project objectives, as well as for details such as proposed design year and staging of works
• layout plan of freeway mainline, interchanges, ramps and emergency stopping bays (ESB), where applicable
• existing AM and PM peak traffic flows on the mainline, entry ramps and exit ramps, as well as through and turning movements at interchanges, where the project involves retrofitting or upgrading of an existing route, and including adjacent and intersecting sections of freeway
• analyses of existing traffic flow and operational problems including flow profiles through the AM and PM peak periods as well as on-site observations where the project involves retrofitting or upgrading of an existing route. Occupancy and speed profiles through the peak periods should also be provided, if available
• forecast AM and PM peak design flows (including the design year) for the mainline, entry ramps, exit ramps and interchanges for the project, including the adjacent and intersecting sections of freeway (usually provided on a project layout schematic)
• strategic traffic model outputs and analysis / methodology for forecast demand adjustment and determining design volumes
Smart Freeways Operational Efficiency Audit Guidelines – March 2021
Document No: D20#550488 30
• for staged construction of a project, the ultimate and initial construction forecast AM and PM peak design flows (including the design years) for the mainline, entry ramps, exit ramps and interchanges for the project, including the adjacent and intersecting sections of freeway (usually provided on a project layout schematic)
• design drawings of mainline and interchanges, including longitudinal and vertical alignment (concept, preliminary, detailed design depending on the stage of audit)
• safety analysis and assessment of current accident problems along the route based on incident records where the project involves retrofitting or upgrading of an existing route
• other information or assumptions used to determine design flows and analysis including mainline capacity (some sections may have reduced capacity due to their physical characteristics), traffic mix (per cent heavy vehicles) and peak / 24-hour volume ratio, as appropriate.
The checklist for this component is provided in in Appendix A, Checklist 2: Checklist for Traffic Volume Determination.
5.2 Key principles The philosophy behind a managed freeway is that capacity optimisation and safety are achieved primarily by managing traffic flows with coordinated ramp signals (CRS). This is achieved by controlling traffic demands at the entry ramps and managing all entry traffic flows to match the capacity of the mainline at various locations along the route as these change during operations. Additional traffic ITS technologies can also be applied to improve freeway performance.
Sound traffic flow analyses are required to evaluate the project needs against warrants to determine appropriate traffic management tools as outlined in the Smart Freeways Provision Guidelines (Main Roads 2020). These analyses should be provided as part of the project in a form that can be easily understood by the audit team.
The key principles for undertaking traffic flow analyses to ensure satisfactory freeway design and operation are to:
• understand the current and future performance of the network, particularly characteristics of critical bottlenecks and congested flows
• determine sound design traffic flows for the peak periods using suitable methodologies. This also requires information relating to traffic mix, such as proportion of heavy vehicles
• check the adequacy of the proposed roadway layout and operational environment (e.g. safety and capacity) to ensure that appropriate Smart Freeway traffic management tools are provided to suit the traffic needs
• review the design (forecast) traffic flows to ensure that they are within the mainline maximum sustainable flow rates of the freeway.
Smart Freeways Operational Efficiency Audit Guidelines – March 2021
Document No: D20#550488 31
5.3 Design traffic volumes
5.3.1 Overview
Good quality data and careful determination of realistic design traffic information is essential to confirm that a project will perform well on completion. Good design information can ensure that critical areas are well understood and appropriate treatments (layouts / devices etc) are provided to address traffic needs.
For upgrading of an existing route, an initial starting point is usually obtaining existing data and analysing existing flows and operation to understand problem areas and likely future traffic patterns.
The freeway mainline and ramp forecast design flows for existing and / or new ramps or freeways should generally be based on:
• existing peak period flows (AM and PM) with an appropriate growth factor
• forecast volumes obtained from a strategic model that has been suitably calibrated using existing traffic data
• an appropriate forecast design year – see Main Roads’ Provision Guidelines (2020).
Design traffic volume determination may also need to consider traffic flow changes and / or implications on adjacent or intersecting freeways, particularly where a project area will be affected. In some cases, a project’s scope of works may need to include works on those routes.
5.3.2 Design volumes based on existing flows
Where existing AM and PM peak flows are used, the measured peak values may not represent potential maximum or capacity hourly flows, as recorded 15-minute or hourly maximum flows can be significantly less than operational capacity in the case of flow breakdown. Capacity flow may occur for a very short time before flow breakdown, but this is generally not sustained throughout the peak period. The peak values are, by definition, the maximum flows achieved. Capacity, by definition, is the maximum flow that potentially can be achieved. Therefore, in practice, the throughput achieved over a peak period may be significantly less than capacity if flow breakdown occurs.
Existing traffic profiles through the peak period need to be analysed by the designer to determine if there is flow breakdown. This is apparent if there is already significant peak spreading with slow-moving traffic. It would include situations where there is flow breakdown on the network, noting times and durations. In some situations, flow breakdown can occur before the usual times considered for peak travel. Where peak period data is available, say 6 to 10 AM and 3 to 7 PM, traffic densities (occupancy), speeds and flows may need to be examined in more detail to evaluate the current performance.
Existing hourly flows may not necessarily reflect peak demand traffic flows if congestion occurs that leads to road users taking alternative routes. This can mean there is suppressed demand, and this should be factored into design flows for an upgraded facility. Similarly, reviewing growth rates based on historical information may also lead to inappropriate assumptions for future forecasting if growth rates have flattened out due to a suppressed demand as a result of congested freeway operation.
Smart Freeways Operational Efficiency Audit Guidelines – March 2021
Document No: D20#550488 32
The impact of a Smart Freeway on traffic demand may also need to be considered in the projected volumes. For example, improved flows on the freeway may arise from the use of ramp signalling that may attract more drivers onto the freeway.
5.3.3 Design volumes based on strategic modelling
Strategic modelling may be used to determine future traffic design values. This would generally be needed for a significant upgrade of an existing route or for a new route, particularly if ultimate layouts are being decided.
Models need to be calibrated and validated to ensure that travel patterns are appropriately accommodated within the model. Running the strategic model to determine forecast flows should generally be based initially on unconstrained capacity to ensure that traffic demands are realistic. This should use managed or unmanaged lane capacities, as appropriate (see Section 5), and appropriate mode and route choice settings to ensure freeway use is not over-, or under-estimated. Adjustments can then be made for pre-defined limitations on project scope, if any, such as critical bottleneck constraints, e.g. a bridge, depending on whether the project includes a capacity upgrade with freeway widening or only implementation of Smart Freeway interventions, such as CRS.
For example, initially the potential ‘ultimate unconstrained’ demands for various sections could be determined, based mainly on the sum of lane capacities and ramp volumes. A second pass could then be made to adjust the volumes to a ‘constrained’ demand set based on the known current / future critical bottlenecks that could reasonably affect the freeway section(s).
The Main Roads’ Guidelines for Analysing Freeway Sections: Obtaining Peak Hour Volumes from ROM24 and Adjustment Process (2019) may also need to be considered.
The link capacity values used in strategic modelling should be relatively consistent with the maximum sustainable flow rates used for the more detailed volume / capacity assessment (see Section 6.3 in this guide and the Main Roads’ Supplement to Victoria’s Managed Motorway Design Guide). These capacity values will generally be less than highway capacity manual values used historically, and will vary according to scenarios tested including the base case, unmanaged and managed operation, number of lanes, etc.
Even in a suitably calibrated strategic model, one implication relating to forecast flows is that although general flows to / from, or on, the freeway may be realistic or to a reasonable order of magnitude, the flow on a specific ramp may not be precise and therefore designs may need to be flexible to allow for potential variations in flow, such as between adjacent entry ramps.
In some situations where an existing freeway is being upgraded, the modelling forecasts may need to be adjusted according to current travel patterns and existing flows, to establish appropriate traffic flows for design. Otherwise, they should be considered indicative and used for relative comparison rather than as absolute values, with suitable flexibility built into the ramp designs. This may require a sensitivity test, for example plus or minus 20 per cent of forecast ramp flows, or adding spare capacity to the ramp storage, such as an extra 10 per cent.
Smart Freeways Operational Efficiency Audit Guidelines – March 2021
Document No: D20#550488 33
Where a strategic model is used to derive forecast daily project volumes, these should be converted to peak hour design flows for the purposes of traffic design. The peak/24-hour ratio is generally used for determining peak hour traffic flows from modelled daily volumes. The ratio used for peak hour traffic is typically in the order of 10 per cent of the 24-hour flow for general application, or 9 per cent for freeways with high demand during the inter-peak period.
This provides an estimated maximum hourly flow for meeting peak-hour demand. Lower percentage values may be observed in real data, for example 8.5 per cent or lower in some instances. This means that the actual hourly value is lower than true traffic demand due to flow breakdown. Lower peak / 24-hour percentages do not mean that the peak demand is any less or that the peak is less congested, but that the demand is high for longer periods of the day. Peak / 24-hour percentage values less than 9 per cent should therefore generally not be used for design purposes as this could result in inadequate designs. See the Smart Freeways Provision Guidelines (2020) for further guidance.
The matters above related to modelling may be critical for consideration in an audit if there is no flexibility in the provision of infrastructure relative to forecast traffic demand. Running strategic models as ‘unconstrained’ and ‘constrained’ can aid understanding of forecast traffic demand.
5.3.4 Design year
The design year for determining forecast traffic volumes needs to be appropriate to the infrastructure being provided. Smart Freeways ITS treatments and devices may require different design-life assumptions to those used for the road design aspects of the project.
Further guidance and principles are in the Smart Freeways Provision Guidelines (section 4.1.2).
5.3.5 Heavy vehicles
The proportion of trucks in the traffic stream has an impact on traffic flow and capacity. For several Smart Freeway ITS tools, warrants or analyses of traffic volumes are in vehicles per hour (veh/h) with appropriate percentage of heavy vehicles, or passenger cars per hour (pc/h) to account for presence of heavy vehicles in the traffic mix.
Knowledge of the proportion of trucks in the design volumes is important, e.g. in Victoria’s MMDG Volume 2, Part 3, the design capacity values (maximum sustainable flow rates) are based on consideration of the number of lanes, grade and proportion of trucks, due to the effects of these factors on capacity. In other situations, there may be a need to confirm the need for a truck facility such as a priority access lane as part of a ramp signals design.
Guidance relating to conversion factors is in the Smart Freeways Provision Guidelines (section 4.1.3).
5.3.6 Ramp and interchange design volumes
The design (forecast) peak period traffic volumes are also used to develop designs for ramps and interchanges. These guidelines provide separate details for these areas in the following sections:
• entry ramp flows and analysis (see Sections 7 and 8)
• exit ramp and interchange flows and analyses (see Sections 9 and 10).
Smart Freeways Operational Efficiency Audit Guidelines – March 2021
Document No: D20#550488 34
Case study
Project description: New freeway link in the network
Audit stage: ‘Select’ phase of the RO&DS process
Strategic modelling was used to forecast 10-year traffic volumes for a new freeway link in the network to determine first stage works of an ultimate freeway. Freeway link capacities used in the model were based on the capacities from the highway capacity manual (HCM).
The audit team commented that although:
• a 10-year forecast for design volumes may have been appropriate for consideration of the level of ITS treatments, a 20- or 30-year project life and forecast volumes is more appropriate to first identify ultimate freeway layouts, traffic needs and ITS technologies. This ultimate project could then be constructed in stages according to shorter timeframes and budgets
• historically HCM capacities have been used in modelling, these values overestimate capacity based on recent research and consideration of the probability of flow breakdown. This could lead to inadequate provision of infrastructure and / or shorter project life than expected. It is recommended that freeway capacity values used in the model should more closely align with the maximum sustainable flow rates used for design capacity.
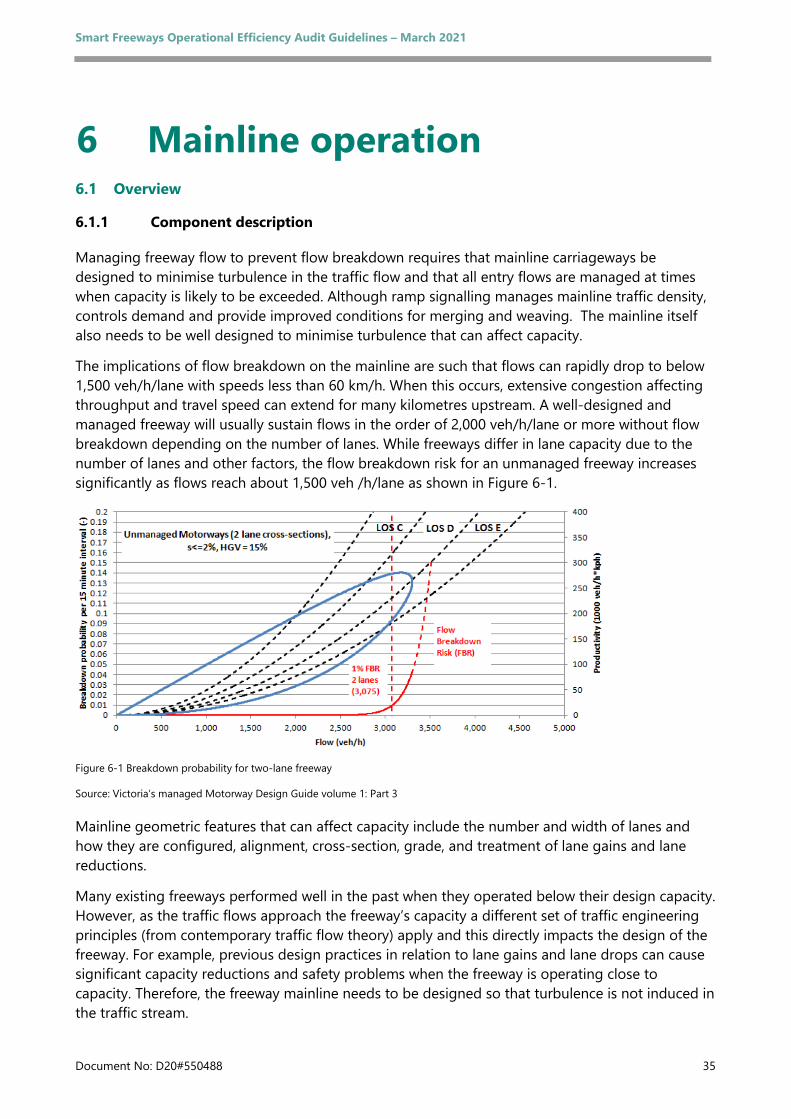
Smart Freeways Operational Efficiency Audit Guidelines – March 2021
Document No: D20#550488 35
6 Mainline operation 6.1 Overview
6.1.1 Component description
Managing freeway flow to prevent flow breakdown requires that mainline carriageways be designed to minimise turbulence in the traffic flow and that all entry flows are managed at times when capacity is likely to be exceeded. Although ramp signalling manages mainline traffic density, controls demand and provide improved conditions for merging and weaving. The mainline itself also needs to be well designed to minimise turbulence that can affect capacity.
The implications of flow breakdown on the mainline are such that flows can rapidly drop to below 1,500 veh/h/lane with speeds less than 60 km/h. When this occurs, extensive congestion affecting throughput and travel speed can extend for many kilometres upstream. A well-designed and managed freeway will usually sustain flows in the order of 2,000 veh/h/lane or more without flow breakdown depending on the number of lanes. While freeways differ in lane capacity due to the number of lanes and other factors, the flow breakdown risk for an unmanaged freeway increases significantly as flows reach about 1,500 veh /h/lane as shown in Figure 6-1.
Figure 6-1 Breakdown probability for two-lane freeway
Source: Victoria’s managed Motorway Design Guide volume 1: Part 3
Mainline geometric features that can affect capacity include the number and width of lanes and how they are configured, alignment, cross-section, grade, and treatment of lane gains and lane reductions.
Many existing freeways performed well in the past when they operated below their design capacity. However, as the traffic flows approach the freeway’s capacity a different set of traffic engineering principles (from contemporary traffic flow theory) apply and this directly impacts the design of the freeway. For example, previous design practices in relation to lane gains and lane drops can cause significant capacity reductions and safety problems when the freeway is operating close to capacity. Therefore, the freeway mainline needs to be designed so that turbulence is not induced in the traffic stream.
Smart Freeways Operational Efficiency Audit Guidelines – March 2021
Document No: D20#550488 36
Capacity analyses, including allowances for areas of turbulence, should be considered in the design. Assumptions and adjustments then need to be systematically checked in the operational efficiency audit. Appropriate traffic analysis during the design process can maximise operational efficiency on project completion.
6.1.2 Audit objective
The key objective for auditing of this component is to confirm that the project proposals relating to the mainline provide appropriate capacity and minimise the potential for traffic turbulence and capacity drop.
6.1.3 Audit inputs
Audit inputs for the mainline operation component may include:
• a business case - for the purpose of understanding the problem and project objectives, as well as for details such as proposed design year and staging of works
• a design brief and specification
• layout plans of the freeway mainline, ramps, interchange intersections and emergency stopping bays, including device layouts. Where a project is to be stage constructed, separate sets of plans shall be provided for ultimate and interim project construction
• design drawings for the mainline, including longitudinal and vertical alignment (concept / preliminary / detailed design depending on the stage of audit
• mainline design volume / capacity (MSFR) analysis (see Victoria’s MMDG Volume 2: Part 3 Section 4.3) for existing AM and PM peak traffic flow data, and traffic problems, if project involves retrofitting of an existing freeway
• mainline design volume / capacity (MSFR) analysis (see Victoria’s MMDG Volume 2: Part 3 Section 4.3) for project design forecast AM and PM peak traffic flows for the freeway mainline. Where a project is to be stage constructed, separate design volume / capacity analyses shall be provided for ultimate and staging options
• safety analysis and assessment of current accident problems along the route based on incident records (where project involves retrofitting or upgrading of an existing route)
• other assumptions or information used in the determination of the freeway layout.
See in Appendix A, Checklist 3: Checklist for Mainline Operation.
6.2 Key principles The key principles for design of the freeway mainline to facilitate safe and efficient freeway operation are to:
• provide adequate capacity throughout the route to suit peak demand flows
• balance flow and capacity by designing sections along the route to match the capacity of the critical bottlenecks. Adjacent sections of freeway may also need to be considered, particularly if the volumes are to increase due to the project
Smart Freeways Operational Efficiency Audit Guidelines – March 2021
Document No: D20#550488 37
• design for a high standard alignment and cross-section for operating speeds of 100 km/h, where feasible
• minimise turbulence associated with steep grades, tight curves, weaving, lane reductions, narrow lanes and sag vertical curves in tunnels
• consider providing additional capacity when required through widening or trafficking of the ESL pavement, e.g. ALR.
6.3 Flow and capacity analysis For design and analysis purposes, traffic flows (veh/h) should generally be converted to passenger cars per unit time (pc/h) to take account of the effect of heavy vehicles in the traffic stream. Alternatively, the units adopted need to be consistent with the capacity flow values adopted, such as the maximum sustainable flow rates in veh/h appropriate to heavy vehicles, number of lanes and grade. The analysis procedure shall be consistent with the Main Roads’ Supplement to Victoria’s Managed Motorway Design Guide Volume 2 Part 3.
6.3.1 Capacity flows for design (maximum sustainable flow rates)
For the operational efficiency audit, the assessment needs to be undertaken in the context of an unmanaged or managed system according to project proposals. For some projects, partially managed transition zones may need to be considered at the start of a CRS system or if there are any uncontrolled ramps in the system.
In the planning phase of a project there may be uncertainty about the future staging of the project construction and the time when Smart Freeway traffic management tools, especially CRS, might be provided. For example, an ultimate project concept may include four mainline lanes with capacity for long-term forecast volumes, say 20 years. However, if the freeway is staged and built initially to suit 10-year forecast volumes, the interim and ultimate traffic management needs may differ. Therefore, designs should be checked for interim and ultimate operations to ensure satisfactory operation over the design life of the facility.
Similarly, when initial demand is lower than design capacity and ramp signals may not be required, a project should be checked for unmanaged operations, and then also checked for managed operations in future years when demand gets closer to, or exceeds capacity.
6.3.2 Operational capacity relative to the highway capacity manual
Theoretical capacity values for a freeway with uninterrupted traffic flow have traditionally been derived from the Highway Capacity Manual (HCM) (Transportation Research Board, 2010). These values shall not be used for lane capacity in strategic modelling or in design volume / design capacity analysis because flows at this level are rarely achieved, and when they do occur, cannot be sustained for a full hour.
Roess (2009) carried out research relating to the HCM speed-flow curves where the investigation was based on a database consisting of 48 basic freeway sites over nine states in the USA. This provided significant information on actual operational freeway capacity flows relative to the HCM theoretical values.
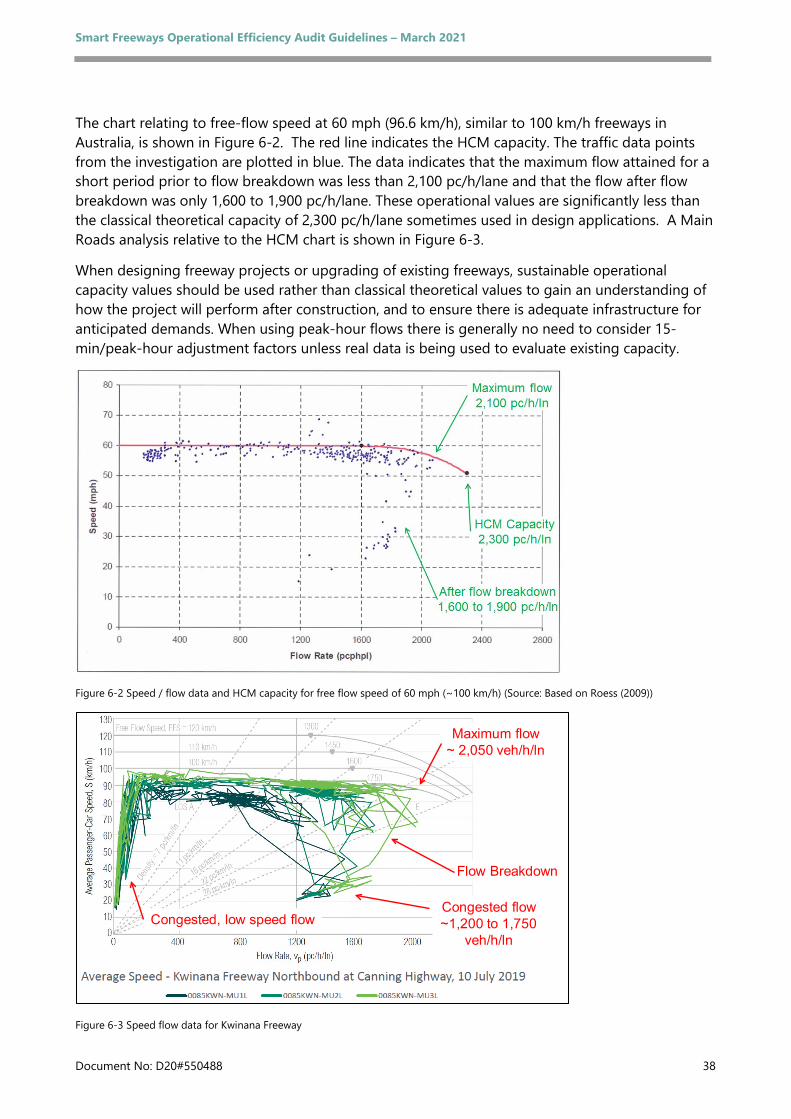
Smart Freeways Operational Efficiency Audit Guidelines – March 2021
Document No: D20#550488 38
The chart relating to free-flow speed at 60 mph (96.6 km/h), similar to 100 km/h freeways in Australia, is shown in Figure 6-2. The red line indicates the HCM capacity. The traffic data points from the investigation are plotted in blue. The data indicates that the maximum flow attained for a short period prior to flow breakdown was less than 2,100 pc/h/lane and that the flow after flow breakdown was only 1,600 to 1,900 pc/h/lane. These operational values are significantly less than the classical theoretical capacity of 2,300 pc/h/lane sometimes used in design applications. A Main Roads analysis relative to the HCM chart is shown in Figure 6-3.
When designing freeway projects or upgrading of existing freeways, sustainable operational capacity values should be used rather than classical theoretical values to gain an understanding of how the project will perform after construction, and to ensure there is adequate infrastructure for anticipated demands. When using peak-hour flows there is generally no need to consider 15-min/peak-hour adjustment factors unless real data is being used to evaluate existing capacity.
Figure 6-2 Speed / flow data and HCM capacity for free flow speed of 60 mph (~100 km/h) (Source: Based on Roess (2009))
Figure 6-3 Speed flow data for Kwinana Freeway
Flow Breakdown
Congested flow~1,200 to 1,750
veh/h/ln
Maximum flow~ 2,050 veh/h/ln
Congested, low speed flow
Smart Freeways Operational Efficiency Audit Guidelines – March 2021
Document No: D20#550488 39
Based on research, operational investigations and design guidelines, Victoria’s Managed Motorway Design Guide Volume 2 Part 3 shall be used for volume / MSFR capacity analysis. The values may need to be adjusted for site-specific conditions that will affect freeway capacity, including road characteristics.
Strategic modelling software, while less precise in the volume / capacity context considering traffic mix and freeway features affecting capacity, needs to use link capacity values similar to those in Victoria’s design guide (see Section 5).
6.3.3 Balancing flow and capacity
Design flows need to be reviewed to ensure they are within the mainline capacity of the freeway (managed, partially managed or unmanaged). Generally, the locations with the highest flow / capacity ratio are the areas that become the critical bottlenecks (see Section 6.3.4). For each freeway direction in each of the peak periods, the critical sections of the route where the mainline traffic flow / capacity ratios are greatest need to be assessed relative to the number of lanes available.
In a managed CRS system, ramp signals are operated so demand flows on the entry ramps are managed to match the capacity of the mainline. Therefore, in design, balanced flow and capacity along the route is desirable, taking into account the proportion of traffic entering and exiting. This is the most efficient arrangement as it avoids overdesigning some sections of the freeway.
For retrofitting of existing freeways with ITS, traffic demands into the future may not be able to be accommodated, for example where the freeway is fully developed within the existing constraints and property boundaries. The operational philosophy in these situations is to operate the ramp signals to manage traffic demand so that the flows on the entry ramps match the capacity of the mainline. With this form of operation, the control of all entering flows is essential and ramp storages become a critical part of the ramp signal designs.
6.3.4 Mainline bottlenecks
Areas of turbulence and critical bottleneck locations, plus design features where a lower capacity value may be applicable, need to be considered when reviewing the design (forecast) traffic flows and capacity analyses. Consider the following:
• Mainline entry ramp merge areas
– Any uncontrolled entry ramp merge areas will generally result in a downstream bottleneck capacity lower than the maximum managed freeway capacity value and should be analysed with unmanaged capacity
– Any mainline sections near the start of a CRS managed system will generally result in bottleneck capacities lower than the maximum managed freeway capacity value and should be analysed in the context of a partially managed transition zone
• Bottleneck locations due to other geometric features. For example, lane drops just before lane gains, steep upgrades, tight curves, transitions related to vertical geometry, such as a long downhill sections (including in tunnels) that flatten out where drivers do not adjust their speed control to account for the flatter grade, sag vertical curves in tunnels or other tunnel effects (e.g. walls adjacent to running lanes), change in median treatment (such as going from wide, open median to narrow concrete barrier) etc
Smart Freeways Operational Efficiency Audit Guidelines – March 2021
Document No: D20#550488 40
• Mainline areas with high weaving movements / significant lane changing, including closely spaced interchanges / ramps
• Potential for over-spilling of exit ramp queues into the mainline
• The emergence of new bottlenecks after project changes, including new ramp signalling locations, for example, increased flow at existing bottlenecks being improved may trigger a critical bottleneck further downstream on adjacent sections of the freeway.
The implications of the project may also need to include consideration of changes to traffic flows and capacity implications on intersecting freeways and adjacent arterial road networks.
The combination of geometric features or close arrangement of geometric and operational bottlenecks may also affect capacity whereas one feature on its own may not result in significant impact, for example, a high-volume entry ramp and a tight horizontal curve close together.
For each mainline bottleneck area, the design flow / MSFR capacity ratio needs to be checked to ensure that the mainline has adequate capacity and that the flows can be managed. Examples of analysis based on unmanaged and managed freeway operations are in Figure 6-4 and Figure 6-5.
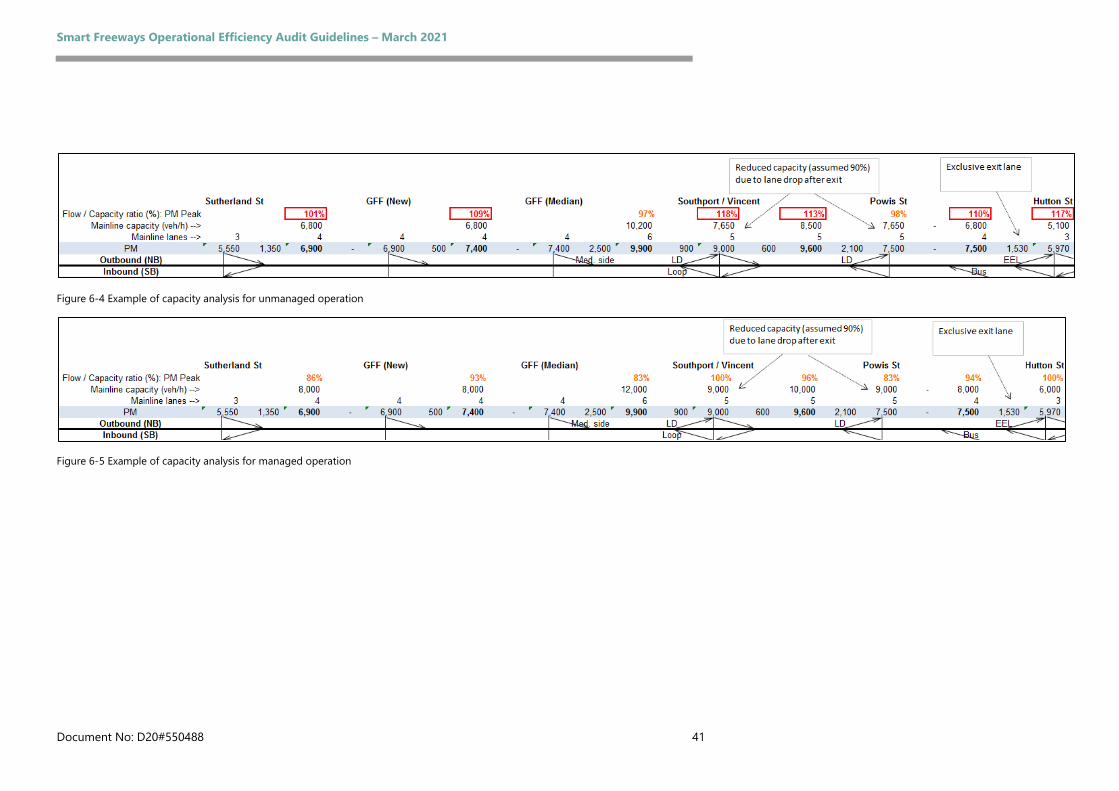
Smart Freeways Operational Efficiency Audit Guidelines – March 2021
Document No: D20#550488 41
Figure 6-4 Example of capacity analysis for unmanaged operation
Figure 6-5 Example of capacity analysis for managed operation
Smart Freeways Operational Efficiency Audit Guidelines – March 2021
Document No: D20#550488 42
6.4 Capacity and geometric layout
6.4.1 Capacity and number of lanes
The balancing of the number of lanes relative to design flows is important to ensure the mainline has adequate capacity to cater for the design flows. Mainline design should include an assessment of design flows relative to capacity for each section along the route and highlight potential problem areas, i.e. critical bottlenecks (see Figure 6-4 and Figure 6-5). This assessment can be used to check if the number of lanes is appropriate as well as the proposed locations for added lanes and lane reductions.
Providing consistency along a significant length of the route and balancing capacity to demand flow is desirable, taking into account the proportion of traffic entering and exiting. This leads to efficient design as can avoid either over-designing or under-designing some sections of the freeway.
In this context consideration also needs to be given to the basic number of lanes (see the Guide to Traffic Management Part 6, Austroads 2007) to maintain lane continuity and to minimise frequent changes in cross-section. However, in some instances consideration of safer and more productive flow outcomes may need to take priority over the basic number of lanes concept. Where changes to lane configuration are needed for improved traffic flow outcomes, e.g. for an exclusive exit lane (see Section 6.4.6) or a lane gain (see Section 6.4.7), appropriate signing and pavement markings shall be provided to manage driver expectations and ensure safe and efficient operation.
When developing new freeway projects or when upgrading existing freeways, design capacity values should be used in design, i.e. maximum sustainable flow rates, rather than outdated theoretical values. This will allow an understanding of how the project will perform after construction and ensure that adequate infrastructure is provided for anticipated demands.
An important principle of balanced capacity is designing sections along the route to match the capacity of the critical bottlenecks. Design capacity values shall generally be adjusted for site-specific road characteristics that will affect freeway capacity. These include steep upgrades, low radius curves, high weaving areas (e.g. between entry and exit ramps or upstream of a lane gain), lane drops, unmanaged merges, a lower speed limit (e.g. due to sub-standard stopping sight distance) and sag vertical curves in tunnels. See the sections below and refer to Victoria’s Managed Motorway Design Guide and Main Roads’ Supplement for further information about operational capacity values and capacity adjustments for various road features.
Ideally, designs should avoid features that affect operational capacity. Where this is not possible, a likely outcome in operations is that the CRS system will need to manage actual flows to lower values to avoid flow breakdown. Therefore, it is important that operational capacity values used in design and analysis account for areas of capacity drop, and are realistic relative to the freeway’s physical characteristics.
6.4.2 Horizontal alignment
The horizontal alignment of the main carriageway can impact capacity when the design speed does not allow comfor operation at 100 km/h. Minimum standard curve radii and sight distances can contribute to traffic turbulence. For example, curves in the order of 600 m radius (which meet a design speed of 110 km/h) can contribute to slowing traffic and flow breakdown in a 100 km/h speed environment, particularly when associated with an upgrade and / or minimal sight distance.
Smart Freeways Operational Efficiency Audit Guidelines – March 2021
Document No: D20#550488 43
Although lower design speeds may be necessary in some environments such as tunnels and areas restricting the horizontal alignment, where possible, high design speeds should form the basis of design.
Where operational speeds may be affected by alignments that restrict a comfortable free-flow speed of 100 km/h, including designs for 80 km/h operation or with minimum sight distances, the capacity relative to operation at 100 km/h is likely to be reduced. Typically, a capacity reduction in the order of five per cent (say 100 pc/h/lane), or up to 10 per cent if combined with other factors, could be considered.
6.4.3 Vertical alignment
The vertical alignment of the main carriageway can impact capacity when a long, steep grade does not allow comfortable operation at 100 km/h. For example, long freeway grades in the order of 2.5 per cent have been known to contribute to slowing traffic and flow breakdown in a 100 km/h speed environment, particularly when associated with a high proportion of trucks, a curve, or lane changing.
Although reasonably steep grades may be necessary in some environments, such as tunnels, where possible, flatter grades should form the basis of design. Trucks are particularly affected by long, steep grades as the truck/passenger car equivalent (PCE) generally increases as the length of the grade increases (grades > two per cent), and this impacts the overall traffic flow.
Flatter grades enable more consistent travel speeds along the route for all vehicles. They enable trucks to maintain speeds as close as possible to the rest of the traffic stream, to enhance high capacity flows.
Where operational speeds may be affected by grades that restrict a comfortable free-flow speed of 100 km/h, the capacity relative to operation at 100 km/h is likely to be reduced. The MSFR values in Victoria’s MMDG include adjustments for grade and the percentage of trucks in the traffic stream.
6.4.4 Auxiliary lanes
In the mainline context, an auxiliary lane is formed at an entry ramp that enters the freeway as an added lane that generally continues at least to the next interchange or possibly beyond to a second interchange, i.e. it is not a short parallel speed change or storage lane extension to an entry or exit ramp.
Auxiliary lanes may be used when entry and exit lanes are closely spaced or to increase capacity where there are high weaving flows. In this context, auxiliary lanes generally cater for entering and exiting traffic weaving and lane changing between interchanges.
As an auxiliary lane is not continuous over a significant distance, the auxiliary lane capacity is generally less than the adjacent through lanes, and no more than the volume leaving the auxiliary lane at the downstream exit ramp. Therefore, it should not be used to determine average lane flows across the carriageway for the purposes of capacity analysis. Analysis of design volume relative to capacity for the through traffic can, however, consider the remaining lanes with adjustment for weaving as required (see Section 6.4.5 and Victoria’s MMDG).
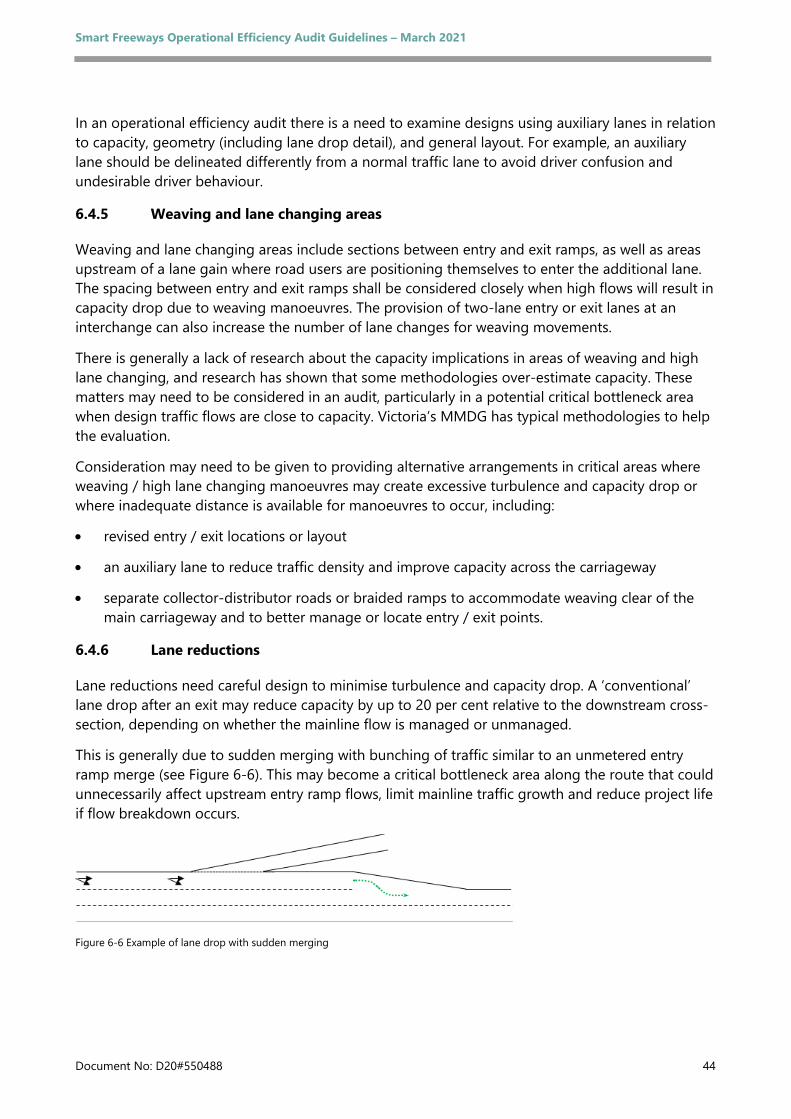
Smart Freeways Operational Efficiency Audit Guidelines – March 2021
Document No: D20#550488 44
In an operational efficiency audit there is a need to examine designs using auxiliary lanes in relation to capacity, geometry (including lane drop detail), and general layout. For example, an auxiliary lane should be delineated differently from a normal traffic lane to avoid driver confusion and undesirable driver behaviour.
6.4.5 Weaving and lane changing areas
Weaving and lane changing areas include sections between entry and exit ramps, as well as areas upstream of a lane gain where road users are positioning themselves to enter the additional lane. The spacing between entry and exit ramps shall be considered closely when high flows will result in capacity drop due to weaving manoeuvres. The provision of two-lane entry or exit lanes at an interchange can also increase the number of lane changes for weaving movements.
There is generally a lack of research about the capacity implications in areas of weaving and high lane changing, and research has shown that some methodologies over-estimate capacity. These matters may need to be considered in an audit, particularly in a potential critical bottleneck area when design traffic flows are close to capacity. Victoria’s MMDG has typical methodologies to help the evaluation.
Consideration may need to be given to providing alternative arrangements in critical areas where weaving / high lane changing manoeuvres may create excessive turbulence and capacity drop or where inadequate distance is available for manoeuvres to occur, including:
• revised entry / exit locations or layout
• an auxiliary lane to reduce traffic density and improve capacity across the carriageway
• separate collector-distributor roads or braided ramps to accommodate weaving clear of the main carriageway and to better manage or locate entry / exit points.
6.4.6 Lane reductions
Lane reductions need careful design to minimise turbulence and capacity drop. A ‘conventional’ lane drop after an exit may reduce capacity by up to 20 per cent relative to the downstream cross-section, depending on whether the mainline flow is managed or unmanaged.
This is generally due to sudden merging with bunching of traffic similar to an unmetered entry ramp merge (see Figure 6-6). This may become a critical bottleneck area along the route that could unnecessarily affect upstream entry ramp flows, limit mainline traffic growth and reduce project life if flow breakdown occurs.
Figure 6-6 Example of lane drop with sudden merging
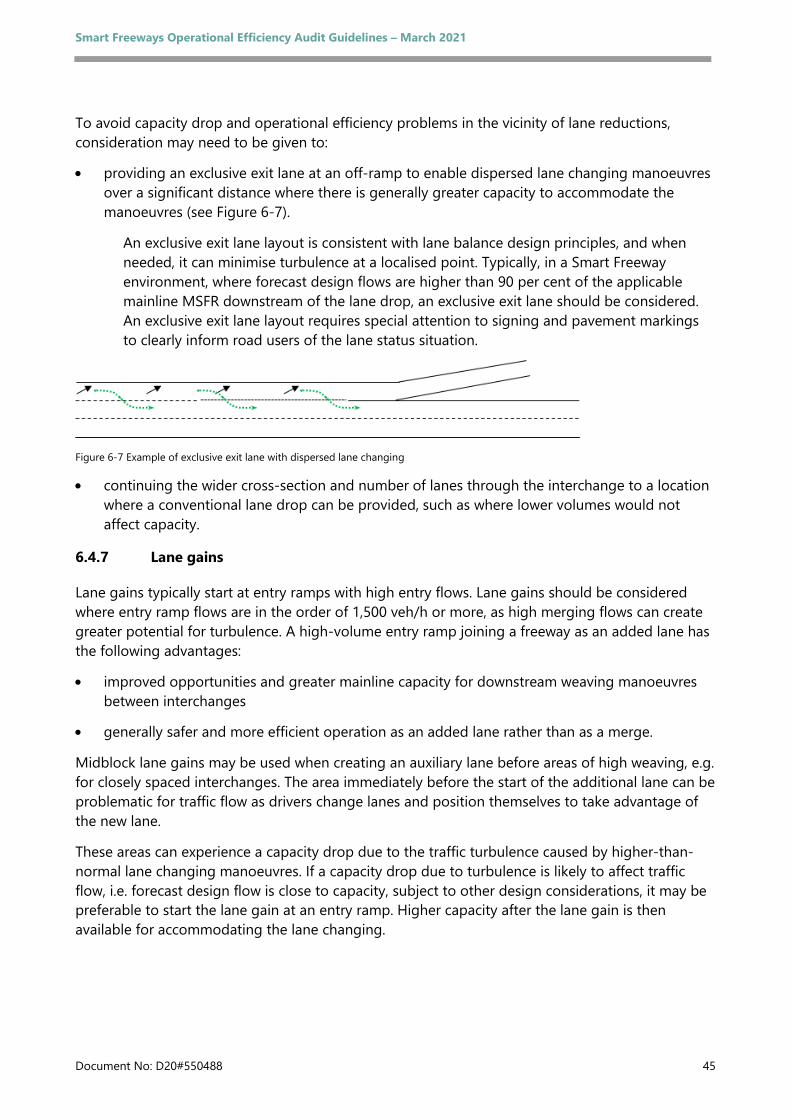
Smart Freeways Operational Efficiency Audit Guidelines – March 2021
Document No: D20#550488 45
To avoid capacity drop and operational efficiency problems in the vicinity of lane reductions, consideration may need to be given to:
• providing an exclusive exit lane at an off-ramp to enable dispersed lane changing manoeuvres over a significant distance where there is generally greater capacity to accommodate the manoeuvres (see Figure 6-7).
An exclusive exit lane layout is consistent with lane balance design principles, and when needed, it can minimise turbulence at a localised point. Typically, in a Smart Freeway environment, where forecast design flows are higher than 90 per cent of the applicable mainline MSFR downstream of the lane drop, an exclusive exit lane should be considered. An exclusive exit lane layout requires special attention to signing and pavement markings to clearly inform road users of the lane status situation.
Figure 6-7 Example of exclusive exit lane with dispersed lane changing
• continuing the wider cross-section and number of lanes through the interchange to a location where a conventional lane drop can be provided, such as where lower volumes would not affect capacity.
6.4.7 Lane gains
Lane gains typically start at entry ramps with high entry flows. Lane gains should be considered where entry ramp flows are in the order of 1,500 veh/h or more, as high merging flows can create greater potential for turbulence. A high-volume entry ramp joining a freeway as an added lane has the following advantages:
• improved opportunities and greater mainline capacity for downstream weaving manoeuvres between interchanges
• generally safer and more efficient operation as an added lane rather than as a merge.
Midblock lane gains may be used when creating an auxiliary lane before areas of high weaving, e.g. for closely spaced interchanges. The area immediately before the start of the additional lane can be problematic for traffic flow as drivers change lanes and position themselves to take advantage of the new lane.
These areas can experience a capacity drop due to the traffic turbulence caused by higher-than-normal lane changing manoeuvres. If a capacity drop due to turbulence is likely to affect traffic flow, i.e. forecast design flow is close to capacity, subject to other design considerations, it may be preferable to start the lane gain at an entry ramp. Higher capacity after the lane gain is then available for accommodating the lane changing.
Smart Freeways Operational Efficiency Audit Guidelines – March 2021
Document No: D20#550488 46
6.4.8 Exit ramp traffic affecting mainline capacity
The performance of exit ramps can have a significant effect on mainline capacity in the following circumstances:
• Vehicles queuing onto the mainline from the exit ramp due to inadequate capacity of the ramp or interchange intersection
• Vehicles slowing down before entering an exit ramp due to inadequate deceleration distance or presence of ramp queues
• High exit flows having difficulties accessing the ramp due to capacity at the exit ramp nose, i.e. a two-lane exit may be needed to minimise turbulence and lane changing.
These matters are discussed further in Section 9.
6.4.9 Lane widths
Narrow lane widths can affect free-flow speed and hence operational capacity. This matter may need to be considered where cross-sections are modified to accommodate additional lanes, such as when an existing cross-section with an emergency stopping lane (ESL) is reconfigured to provide all lane running (ALR).
Narrow lanes (i.e. less than 3.35 metres) can generally be accommodated over short distances, such as up to 500 metres, on bridges or sections where providing an additional lane without ESL may be preferable to having widespread congestion. For longer sections, other Smart Freeway traffic management systems such as LUMS may be needed to support the narrow lanes or the elimination of an emergency stopping lane (ESL) (see Section 6.4.11 and Section 12).
6.4.10 Emergency stopping lanes (ESL)
ESL are desirable on freeways for the following reasons:
• To provide a trafficable area clear of through lanes for emergency stopping and incident response / vehicle breakdown services
• To provide an initial recovery area for an errant vehicle
• To provide clearance to lateral obstructions
• To facilitate stopping sight distance on the inside of curves.
Where a restricted cross-section has narrow shoulders, it is generally preferable to provide a wider shoulder (up to the desirable three metres width as in the Main Roads’ Supplement to Austroads Guide to Road Design - Part 3 (Main Roads 2012) on the left, rather than narrow shoulders of equal width on both sides.
Drivers tend to move to the left when needing to stop in an emergency and a wider left lane generally provides a safer width and speed environment for a stopped vehicle, as well as the activity associated with any assistance the driver or vehicle may need. However, a wider shoulder should be retained adjacent to the median if it is needed for stopping sight distance reasons. A wider shoulder adjacent to the median should also be considered at road sections where a breakdown vehicle on the far-right lane is unlikely to be able to cross safely to the left shoulder, due to the number of lanes and / or traffic density.
Smart Freeways Operational Efficiency Audit Guidelines – March 2021
Document No: D20#550488 47
In some instances, a narrow ESL may be necessary adjacent to a constricted area, for example adjacent to a bridge pier / safety barrier, where widening may have significant cost implications.
6.4.11 All lane running (ALR)
In areas where an ESL cannot be provided, such as where widening of a freeway is not feasible or realistic within project budgets, consideration may be given in design to remove an ESL to provide ALR.
Designs that include sections with ALR should be checked for traffic management provisions that offset safety and operational disadvantages. These include:
• a lane use management system (LUMS) to facilitate incident management – e.g. lane closure in case of a broken-down vehicle and to facilitate access for incident response / vehicle breakdown services (see Section 12). This would also incorporate a VSL capability
• surveillance cameras (CCTV) to monitor the road section, e.g. for stranded vehicles and debris (see Section 15)
• a lower default speed limit, particularly if there are sight distance restrictions.
• A VSL system (see Section 13)
• an automated incident detection (AID) system (see Smart Freeway Provision Guidelines, 2020)
• emergency stopping bays (ESB) (see Section 6.4.12).
Other design matters that may need to be checked in an audit include:
• clearance from the edge of the lane to structures and safety barriers
• sight distance for the operating speed, particularly on curves.
6.4.12 Emergency stopping bays (ESB)
On freeways with ALR, i.e. where no ESL is provided, ESB are required on the left side of the road to store vehicles clear of trafficable lanes when drivers are needing emergency assistance. An ESB provides a safe pull-off area for broken-down vehicles and access to emergency telephones.
ESB replacing a continuous ESL or at the locations of roadside help phones with ESL, need to be provided according to Main Roads’ Guideline for Emergency Stopping Bays and Roadside Help Phones (2018). See Section 16 for further guidance about roadside help phones. The following principles relate to the mainline context for consideration of ESBs:
• Locations are preferably separated from manoeuvring areas such as entry ramp merge areas, exit ramp diverge areas and lane drops
• Locations should satisfy minimum sight distance requirements
• The parallel storage area should be of sufficient width from the nearest traffic lane to provide for the safety of vehicles / road users stopped in the bay
• The length of the storage area and deceleration / acceleration distance / tapers to enable its safe and effective use for a variety of purposes e.g. incident management and maintenance and enforcement (see Main Roads’ guideline drawing).
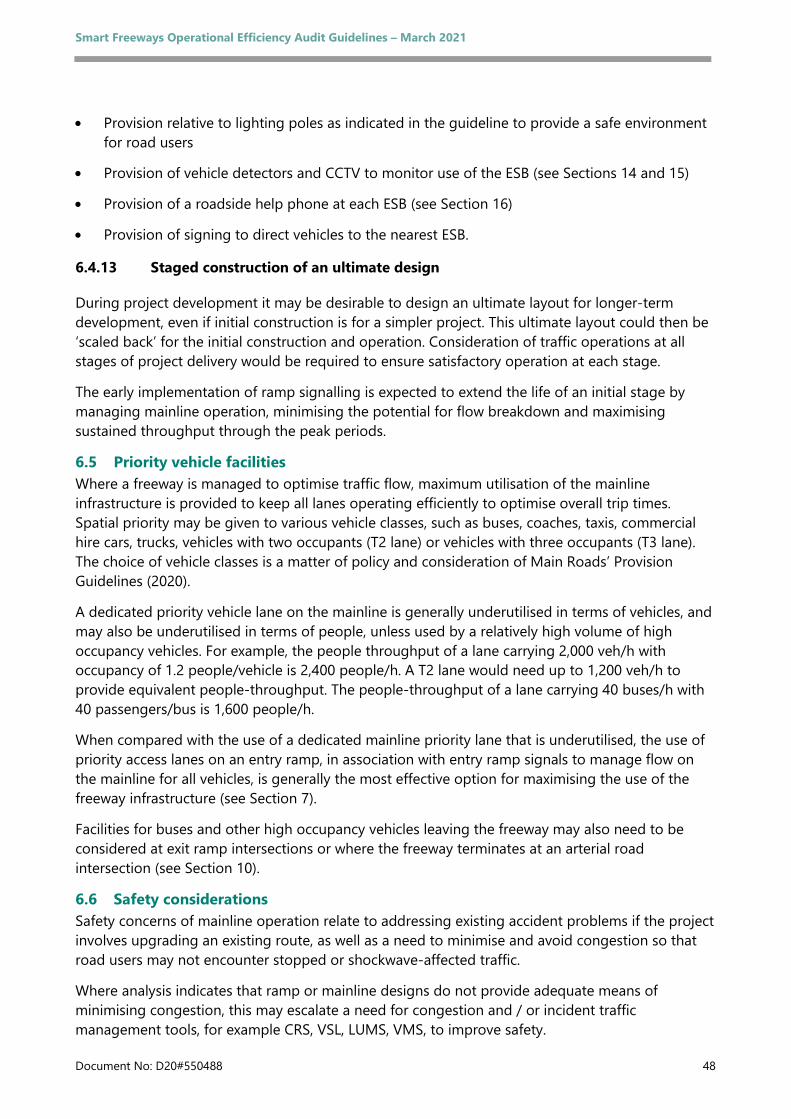
Smart Freeways Operational Efficiency Audit Guidelines – March 2021
Document No: D20#550488 48
• Provision relative to lighting poles as indicated in the guideline to provide a safe environment for road users
• Provision of vehicle detectors and CCTV to monitor use of the ESB (see Sections 14 and 15)
• Provision of a roadside help phone at each ESB (see Section 16)
• Provision of signing to direct vehicles to the nearest ESB.
6.4.13 Staged construction of an ultimate design
During project development it may be desirable to design an ultimate layout for longer-term development, even if initial construction is for a simpler project. This ultimate layout could then be ‘scaled back’ for the initial construction and operation. Consideration of traffic operations at all stages of project delivery would be required to ensure satisfactory operation at each stage.
The early implementation of ramp signalling is expected to extend the life of an initial stage by managing mainline operation, minimising the potential for flow breakdown and maximising sustained throughput through the peak periods.
6.5 Priority vehicle facilities Where a freeway is managed to optimise traffic flow, maximum utilisation of the mainline infrastructure is provided to keep all lanes operating efficiently to optimise overall trip times. Spatial priority may be given to various vehicle classes, such as buses, coaches, taxis, commercial hire cars, trucks, vehicles with two occupants (T2 lane) or vehicles with three occupants (T3 lane). The choice of vehicle classes is a matter of policy and consideration of Main Roads’ Provision Guidelines (2020).
A dedicated priority vehicle lane on the mainline is generally underutilised in terms of vehicles, and may also be underutilised in terms of people, unless used by a relatively high volume of high occupancy vehicles. For example, the people throughput of a lane carrying 2,000 veh/h with occupancy of 1.2 people/vehicle is 2,400 people/h. A T2 lane would need up to 1,200 veh/h to provide equivalent people-throughput. The people-throughput of a lane carrying 40 buses/h with 40 passengers/bus is 1,600 people/h.
When compared with the use of a dedicated mainline priority lane that is underutilised, the use of priority access lanes on an entry ramp, in association with entry ramp signals to manage flow on the mainline for all vehicles, is generally the most effective option for maximising the use of the freeway infrastructure (see Section 7).
Facilities for buses and other high occupancy vehicles leaving the freeway may also need to be considered at exit ramp intersections or where the freeway terminates at an arterial road intersection (see Section 10).
6.6 Safety considerations Safety concerns of mainline operation relate to addressing existing accident problems if the project involves upgrading an existing route, as well as a need to minimise and avoid congestion so that road users may not encounter stopped or shockwave-affected traffic.
Where analysis indicates that ramp or mainline designs do not provide adequate means of minimising congestion, this may escalate a need for congestion and / or incident traffic management tools, for example CRS, VSL, LUMS, VMS, to improve safety.
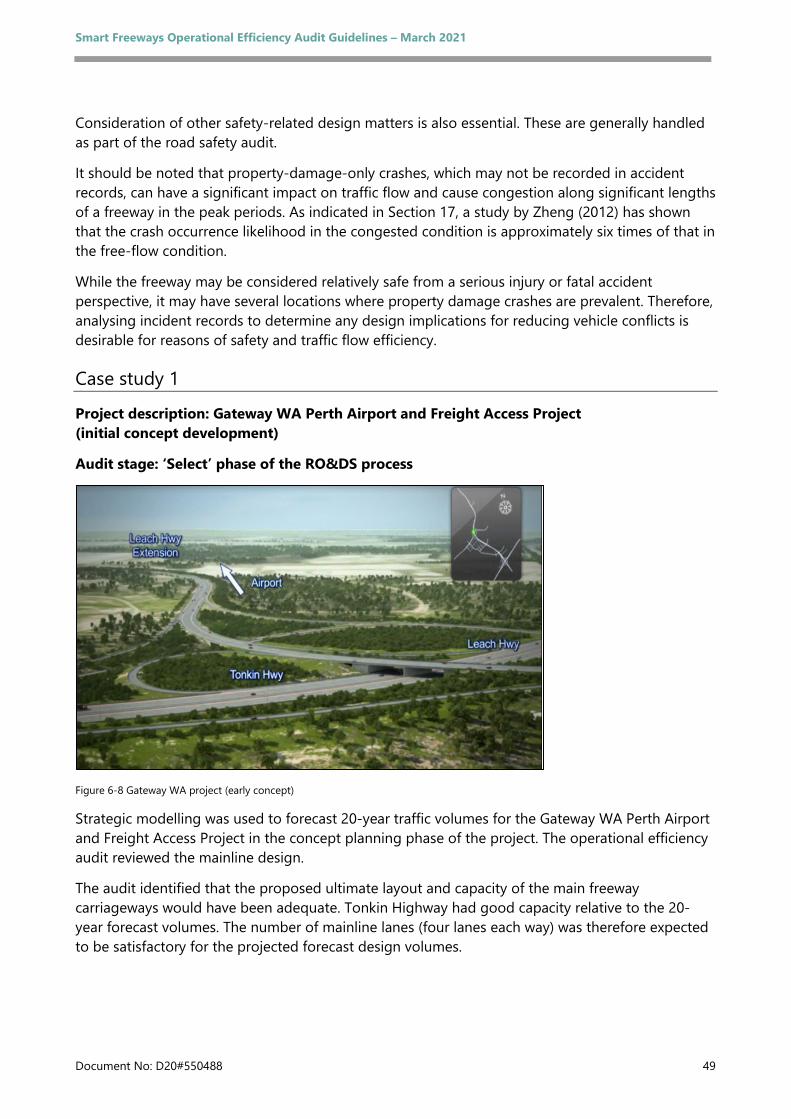
Smart Freeways Operational Efficiency Audit Guidelines – March 2021
Document No: D20#550488 49
Consideration of other safety-related design matters is also essential. These are generally handled as part of the road safety audit.
It should be noted that property-damage-only crashes, which may not be recorded in accident records, can have a significant impact on traffic flow and cause congestion along significant lengths of a freeway in the peak periods. As indicated in Section 17, a study by Zheng (2012) has shown that the crash occurrence likelihood in the congested condition is approximately six times of that in the free-flow condition.
While the freeway may be considered relatively safe from a serious injury or fatal accident perspective, it may have several locations where property damage crashes are prevalent. Therefore, analysing incident records to determine any design implications for reducing vehicle conflicts is desirable for reasons of safety and traffic flow efficiency.
Case study 1
Project description: Gateway WA Perth Airport and Freight Access Project (initial concept development)
Audit stage: ‘Select’ phase of the RO&DS process
Figure 6-8 Gateway WA project (early concept)
Strategic modelling was used to forecast 20-year traffic volumes for the Gateway WA Perth Airport and Freight Access Project in the concept planning phase of the project. The operational efficiency audit reviewed the mainline design.
The audit identified that the proposed ultimate layout and capacity of the main freeway carriageways would have been adequate. Tonkin Highway had good capacity relative to the 20-year forecast volumes. The number of mainline lanes (four lanes each way) was therefore expected to be satisfactory for the projected forecast design volumes.
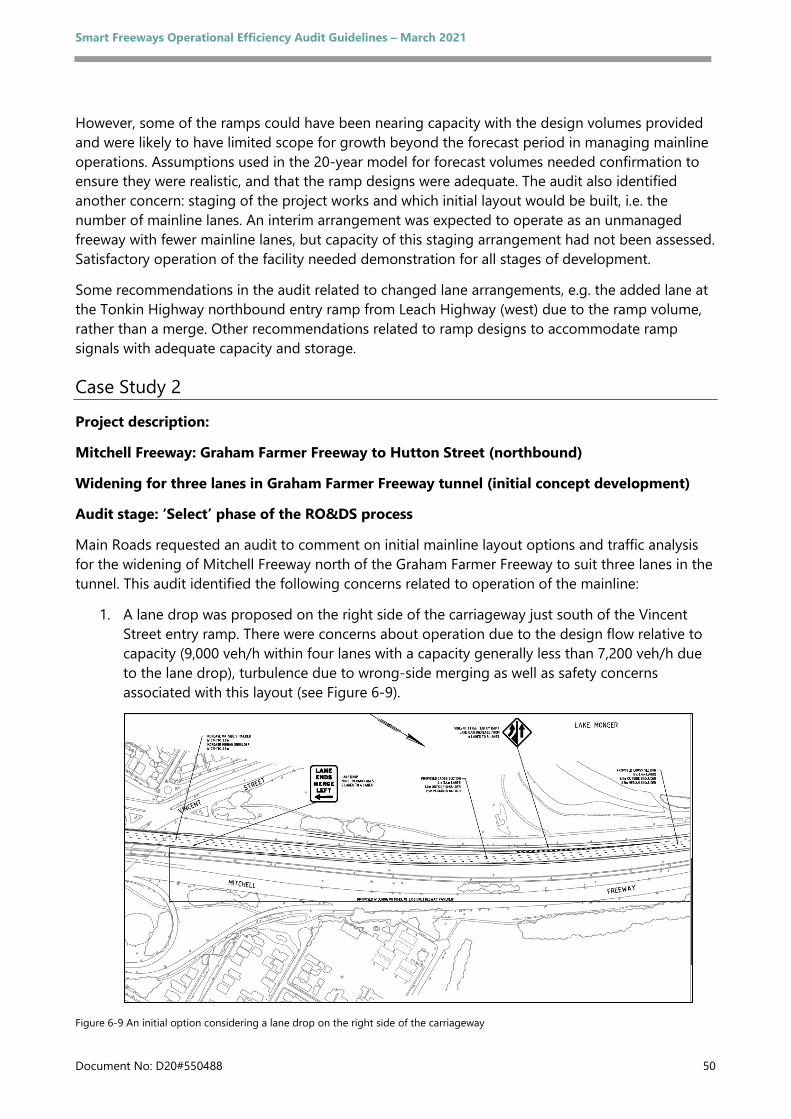
Smart Freeways Operational Efficiency Audit Guidelines – March 2021
Document No: D20#550488 50
However, some of the ramps could have been nearing capacity with the design volumes provided and were likely to have limited scope for growth beyond the forecast period in managing mainline operations. Assumptions used in the 20-year model for forecast volumes needed confirmation to ensure they were realistic, and that the ramp designs were adequate. The audit also identified another concern: staging of the project works and which initial layout would be built, i.e. the number of mainline lanes. An interim arrangement was expected to operate as an unmanaged freeway with fewer mainline lanes, but capacity of this staging arrangement had not been assessed. Satisfactory operation of the facility needed demonstration for all stages of development.
Some recommendations in the audit related to changed lane arrangements, e.g. the added lane at the Tonkin Highway northbound entry ramp from Leach Highway (west) due to the ramp volume, rather than a merge. Other recommendations related to ramp designs to accommodate ramp signals with adequate capacity and storage.
Case Study 2
Project description:
Mitchell Freeway: Graham Farmer Freeway to Hutton Street (northbound)
Widening for three lanes in Graham Farmer Freeway tunnel (initial concept development)
Audit stage: ‘Select’ phase of the RO&DS process
Main Roads requested an audit to comment on initial mainline layout options and traffic analysis for the widening of Mitchell Freeway north of the Graham Farmer Freeway to suit three lanes in the tunnel. This audit identified the following concerns related to operation of the mainline:
1. A lane drop was proposed on the right side of the carriageway just south of the Vincent Street entry ramp. There were concerns about operation due to the design flow relative to capacity (9,000 veh/h within four lanes with a capacity generally less than 7,200 veh/h due to the lane drop), turbulence due to wrong-side merging as well as safety concerns associated with this layout (see Figure 6-9).
Figure 6-9 An initial option considering a lane drop on the right side of the carriageway
Smart Freeways Operational Efficiency Audit Guidelines – March 2021
Document No: D20#550488 51
The report recommendations suggested a modified layout to continue the five lanes across the Vincent Street structure to provide five continuous lanes to Powis Street. Vincent Street would then be retained as a merge rather than an added lane.
2. There was a general concern about using the full value of Smart Freeway (managed) capacity within a partially managed transition zone as there were limited opportunities for ramp signalling of upstream entry ramps, particularly in the short term.
3. With changing volumes and number of lanes along this section of freeway, the design needed to accommodate different arrangements for the lane reductions consistent with the likely capacity drop that can occur with lane-drop merging. Traditional lane drops after the exit ramps were provided at Southport Street and at Powis Street. The audit confirmed that these layouts were appropriate, i.e. within 90 per cent of capacity of the downstream cross-section after the lane reduction. At the Hutton Street exit, the audit assessment confirmed that an exclusive exit lane was appropriate (see Figure 6-10).
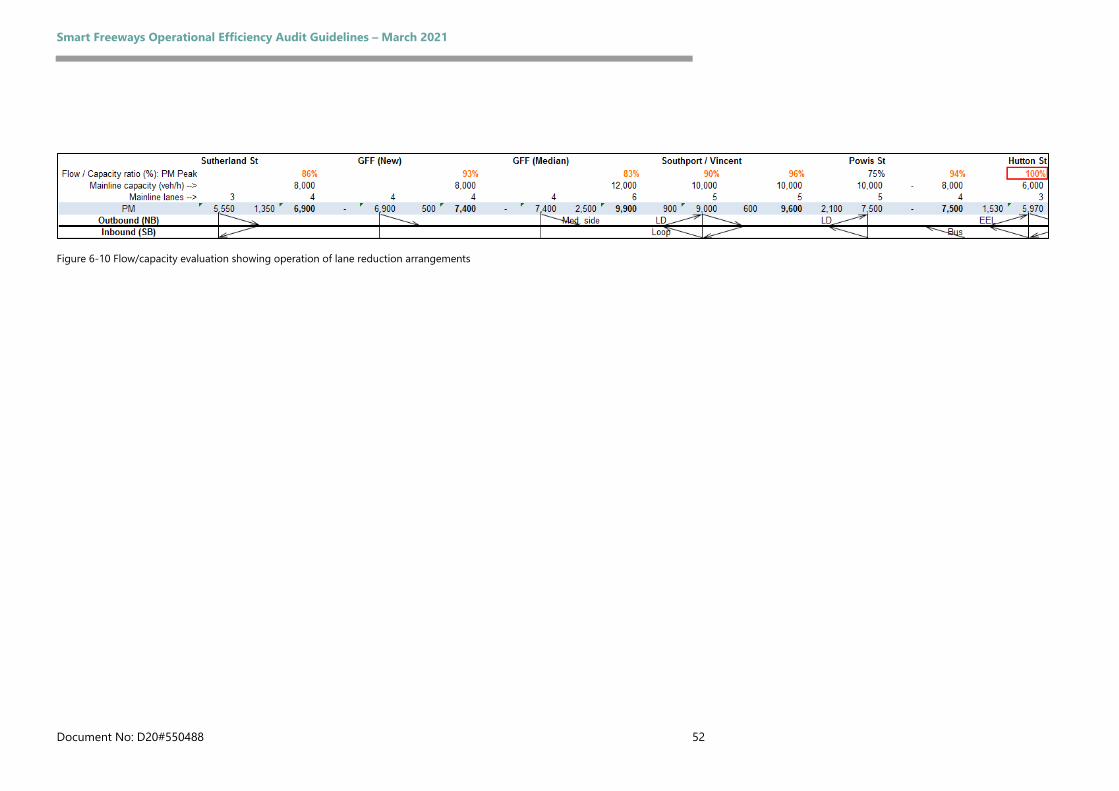
Smart Freeways Operational Efficiency Audit Guidelines – March 2021
Document No: D20#550488 52
Figure 6-10 Flow/capacity evaluation showing operation of lane reduction arrangements
Smart Freeways Operational Efficiency Audit Guidelines – March 2021
Document No: D20#550488 53
7 Entry ramp operation 7.1 Overview
7.1.1 Component description
Coordinated ramp signals (CRS) on entry ramps control traffic access to the freeway in a measured and regulated manner in order to manage the freeway traffic flow and minimise flow breakdown and congestion. In a dynamic coordinated ramp signal (CRS) system, the ramp signalling only operates when required. CRS have the following functionalities:
• To manage mainline traffic occupancy (density)
• To control ramp demands
• To provide improved conditions for merging and downstream weaving
• To provide equity of access when the freeway is under stress.
See Section 6 of Victoria’s Managed Motorway Design Guide and Main Roads’ Supplement (2020) for background information relating to the implications of flow breakdown on the mainline.
Although the causes of congestion may be site specific, the impacts of congestion on traffic flow are generally widespread and may affect a significant length of freeway or even intersecting routes.
Therefore, prevention of flow breakdown requires a focus on the causes of flow breakdown at bottlenecks as well as management of the freeway as a system rather than treatments in isolation. On freeways with heavy traffic or congestion, ramp signalling is generally most effective when combined with improvements that remove bottlenecks and balance capacity along the route.
The principal actions of CRS are:
• to manage headway of entering traffic, i.e. dispersing platoons (bunching) to provide spacing between vehicles into the merge
• to manage the entering flow rate at the ramp merge when the freeway is near capacity, i.e. when the mainline flow becomes unstable
• to ensure the mainline densities are within critical downstream bottleneck capacities by coordinating traffic from several ramps, which will result in the highest values of throughput
• to share the delays between ramps by ensuring equity of access to the freeway when it is operating near, or at, its capacity.
7.1.2 Audit objective
The key objective of this component is to confirm project proposals relating to the entry ramp designs will provide sufficient control over entering traffic to manage efficient mainline operation, and that ramps have appropriate discharge capacity and storage.

Smart Freeways Operational Efficiency Audit Guidelines – March 2021
Document No: D20#550488 54
7.1.3 Audit inputs
Audit inputs for the entry ramp operation component may include:
• a business case (for the purpose of understanding the problem and project objectives, as well as for details such as proposed design year and staging of works)
• a design brief and specification, including functional requirements
• layout plans of freeway mainline, ramps, interchanges and ESB (where applicable), including device layouts, including longitudinal and vertical alignment (concept / preliminary / detailed design depending on the stage of audit)
• entry ramp design traffic volumes (AM and PM peaks) and analyses for ramp discharge capacity and storage supporting the project designer’s proposals for the entry ramp designs. Where a project is to be stage constructed, separate design volume analyses shall be provided for ultimate and staging options
• the project designer’s treatment and proposals for the entry ramp connections to the downstream section of freeway
• ramp signal design drawings
• other assumptions or information used in the determination of the need for ramp signalling and interchange / ramp layout.
The audit checklist for this component is provided in in Appendix A, Checklist 4: Checklist for Entry Ramp Operation.
7.2 Key principles The key principles for design of entry ramps to ensure efficient and safe freeway operation are:
• where ramp signals are warranted along a route, they should generally be provided at all freeway entries to enable the mainline flow to be managed (otherwise analysis should show that the mainline will be satisfactory with the proposed design)
• to provide an adequate number of lanes at the ramp signals stop line for discharge capacity to suit demand flows
• to provide adequate storage (length and number of lanes) for queued vehicles on the ramp. Coordinated ramp signals enable storage areas to be shared to manage a freeway bottleneck and to provide equity of access when the freeway is under stress
• to provide appropriate arrangements and layouts for entry ramp traffic to enter the mainline, e.g. number of lanes, merging or added lanes, etc.
7.3 Entry flows and ramp control
7.3.1 Criteria for providing coordinated ramp signals
The thresholds for provision of CRS apply to a freeway route where the warrant is met at the critical bottleneck for the route, i.e. not at each individual ramp.

Smart Freeways Operational Efficiency Audit Guidelines – March 2021
Document No: D20#550488 55
Some freeway sections will have lower forecast volumes at some midblock sections due to the entry and exit volumes at each interchange. Therefore, although the volumes may be lower at some points along the route, the entry ramps still need to be ramp signalled as part of the CRS system. The CRS may also need to extend some distance upstream, possibly into sections where volumes are significantly lower than the warrant, to ensure entry volumes can be controlled and flow managed at downstream critical bottleneck areas.
Managing mainline freeway flow to prevent flow breakdown requires all entry flows to be managed with ramp signals at times when capacity is likely to be exceeded. In a Smart Freeway environment with two or three lane carriageways, ramp signalling is generally necessary for a sequence of at least six interchanges upstream of a critical bottleneck to provide effective control of the traffic density and flow.
For wider freeways, i.e. four or more lanes and freeways with freeway-to-freeway interchanges, eight to ten coordinated ramps may be required to provide effective control, subject to the entry flows involved. Managing the entry flows at all interchanges also enables balancing of ramp queues and equity of access (waiting time). See Victoria’s MMDG Volume 2: Part 3 for detailed analysis methodology for consideration of mainline control and the number of coordinated ramps required.
Where a scope of work may only include ramp signals at some entry ramps, the auditor should check that the project has provided analysis to demonstrate that the control of flow breakdown and optimisation of the mainline capacity can be achieved with a partially managed system according to the methodology in Victoria’s MMDG.
In other cases, entry ramps upstream of a defined mainline upgrade section may need to be included in the scope of works. The auditor should check that the number of ramp signals provided are adequate to achieve control of flow breakdown and optimisation of the mainline capacity.
7.3.2 Ramp design flows
The determination of realistic design flows is an essential element of entry ramp and ramp signal design. This is necessary to determine the entry ramp size and layout as well as the need for ramp signals, the discharge capacity of the ramp signal designs, and the storage required for queuing vehicles. See Section 5 for guidance about determining and checking of design flows.
7.4 Ramp signal capacity and storage
7.4.1 Capacity at the stop line (ramp discharge)
The number of lanes at the stop line controls the discharge capacity of the entry ramp during times when the ramp signalling is operating. The number of lanes and the average cycle time at which the signals can operate determines the entry flow of traffic. Each ramp needs to be audited relative to the requirements in the Main Roads’ Supplement to the Victoria’s MMDG Volume 2: Part 3. Designs may need to be checked for the AM and PM peaks to ensure the design is appropriate for the worst case, for example a ramp flow may be higher in the direction opposite to the mainline peak where land use generates significant traffic volumes.
Smart Freeways Operational Efficiency Audit Guidelines – March 2021
Document No: D20#550488 56
To provide operational flexibility, the average cycle time used for analysis of the design volume should be higher than the minimum cycle time specified in the guidelines, i.e. generally, the maximum flow (minimum cycle time) cannot be maintained throughout the peak period due to the dynamic nature of the operation. These values are based on real-time data from the dynamic ramp signalling system.
The lanes required at the stop line do not necessarily need to extend for the full length of the ramp. Where applicable, short auxiliary lanes can be provided at the stop line to provide additional discharge and capacity (but generally provide little additional storage so are not generally used for this purpose).
The length of storage in each ramp lane (auxiliary lane or extended storage) can affect ramp operation and hence merge geometry within the ramp, stop line location, choice of ramp layout, particularly for three-lane layouts (see Section 7.5.1), and ramp entry into the mainline are important to check in an audit.
On low flow ramps, for example where only one stop line lane is required for discharge capacity, it is generally desirable to provide two lanes at the stop line so that adequate ramp storage is provided. Using two lanes on low flow ramps may also make best use of the available ramp width to service demands when higher entry rates can be accommodated or when the storage is needed for coordinated operation.
7.4.2 Ramp storage
Design guidelines to determine desirable minimum storage on each ramp between the stop line and the ramp entrance are provided to accommodate a queue of four minutes’ waiting time. Adequate storage is required for operational flexibility in the following situations:
• Limiting vehicle entry to the freeway when the ramp merge or downstream section of freeway is at, or approaching, capacity
• Helping balance queues between adjacent ramps in the coordinated system
• Reducing the likelihood of overflow queues extending onto the arterial road
• Providing short-term variations in traffic demand within the peak period or future change in travel patterns
• Limiting vehicle entry to the freeway during an incident and facilitating recovery after an incident.
Where there is inadequate storage, operational experience shows that traffic queues will generally be problematic. In practice, the ramp signal algorithm operation may be adjusted to avoid queue overflow by increasing the metering rate.
This may help to adjust for low storage at locations where ramp storage is difficult to provide. However, this generally results in inequity of access between coordinated ramps and may also result in excessive flows entering the freeway. This is highly likely to cause flow breakdown at a downstream bottleneck and adversely affect productivity.
Smart Freeways Operational Efficiency Audit Guidelines – March 2021
Document No: D20#550488 57
Alternatively, ramp queues can be allowed to spill over onto the arterial road (generally undesirable) if storage can be provided with minimal impact on the arterial road operations.
7.5 Geometric layout
7.5.1 Ramp layout suitability
Entry ramp layouts and ramp signal designs are generally based on peak hour design flows using existing peak period flows before flow breakdown, with an appropriate growth factor, or based on forecast volumes obtained from a calibrated strategic model. See Section 5 for guidance on determining and checking design flows.
Standards and guidelines for geometry are based on principles for the stop line location and merging based on optimisation of operational safety, maximising ramp storage for queuing vehicles and maximising operational effectiveness to prevent mainline flow breakdown. Design principles are based on providing operational safety under the two operational modes:
• When the ramp signals are on – acceleration from a stationary position at the stop line to a speed that will enable safe merging with the mainline traffic
• When ramp signals are off – merging within the ramp from the number of lanes at the stop line to a lesser number of lanes at the ramp nose prior to entering the mainline, e.g. a two-lane to one-lane merge prior to the ramp nose.
Auditors need to be familiar with the various typical ramp layout drawings in the Main Roads’ Supplement to Victoria’s Managed Motorway Design Guide Volume 2: Part 3, as well as the design principles associated with the operation of the various layouts.
Ramp signal design layouts in the standards relate to two, three and four-lane arrangements and vary according to the number of ramp lanes approaching the signals as well as the ramp entry arrangements entering the mainline (e.g. merge or added lane arrangements). Where an auxiliary lane is provided at the stop line, this lane should be relatively short (desirably 30 metres plus taper) to ensure the lanes are not used when the signals are not operating.
For designs with three or four lanes, an appropriate optimum layout generally needs to be found in relation to balancing the number of stop line lanes, ramp length / storage and the number of traffic lanes at the ramp nose. In marginal situations, the available ramp storage for the entering flow is generally the most significant design issue to consider.
As several entry ramps will be used for managing bottlenecks for a considerable distance downstream from the entry ramp, it is essential that all ramps have adequate storage to enable the ramps to buffer the traffic whilst the downstream bottleneck is being managed. Where a particular ramp has inadequate storage because of local physical constraints, for example, only three minutes’ storage is feasible, the adjacent upstream ramps should provide for compensating storage. Two or three adjacent upstream ramps could each provide storage greater than four minutes.
When a ramp design has inadequate storage, consideration may need to be given to:
• adopting the minimum two-to-one-lane merge distance from the stop line to the ramp nose, i.e. 80 metres rather than the desirable 100 metres
• lengthening the ramp by extending the nose
Smart Freeways Operational Efficiency Audit Guidelines – March 2021
Document No: D20#550488 58
• widening to provide extra lanes, even though they may not be needed for capacity
• changing the layout to move the stop line closer to the ramp nose subject to requirements for the entering flows and mainline downstream, e.g. three-lane ramp merging to one lane at the nose has the stop line a minimum of 160 metres from the nose.
• There may be potential to change this to a three-lane ramp merging to two lanes at the nose where the stop line is 80 metres from the nose, i.e. to achieve an extra 160 metres storage (although downstream implications for extended lengths of auxiliary or added lanes on the mainline would need to be considered as well as potential impacts on weaving associated with a downstream interchange).
As outlined in Section 7.4.1 the lane and storage arrangements can affect ramp merge geometry and choice of the ramp layout. Each ramp needs to be audited relative to the discharge capacity and storage analysis as well as ramp layout (see Section 7.5.1). Designs may need to be checked for the AM and PM peaks to ensure the design is appropriate for the worst case.
Where a design with inadequate storage assumes that ramp queues will overflow onto the arterial road, consideration of the implications needs to be checked in the audit. This may include the provision of adequate storage in turning lanes on the approaching arterial roads and / or changes to traffic signal operation (see Section 10).
7.5.2 Designing for trucks
Ramp signal design for acceleration of trucks, for example rigid body, semi-trailers or B-doubles, is unnecessary. Section 5.5 of the Guide to Road Design Part 4A: Unsignalised and Signalised Intersections (Austroads 2010b) shows that ‘trucks require very long acceleration distances, often to an extent that is not possible to accommodate in practice’.
Although a project may have a component aimed at freight improvement, these benefits will usually be achieved through improved capacity and managing mainline traffic to optimise throughput and travel speeds.
The acceleration and merging standards for traffic leaving ramp signals consider acceleration for cars and accept that there may be a greater speed differential for merging trucks. Where the mainline is depressed, entry ramps are generally on a downgrade, which will assist truck acceleration. However, consideration could be given to the grades and whether the speed differential for trucks relative to general traffic is greater than 30-40 km/h (see Austroads 2010b).
Operation of ramp signals in Australia installed over recent years has demonstrated that the standards operate satisfactorily, including for trucks. However, situations that may warrant increased distances for acceleration include ramps with grades greater than four per cent through the acceleration and merging area, such as after the stop line, and ramps with high truck numbers.
Smart Freeways Operational Efficiency Audit Guidelines – March 2021
Document No: D20#550488 59
7.5.3 Future retrofitting of ramp signals
Where ramp signals are not included in a project for initial installation, consideration should be given to the ramp layout design to facilitate the retrofitting of ramp signals at a later date, as indicated in the Main Roads’ Supplement to Victoria’s MMDG. Design details should include considering:
• ramp width for managing future demands, e.g. two, three or four lanes at the stop line. This may involve checking the ramp width for future two-lane ramp signals or potential for widening to accommodate future three or four-lane ramp signals
• ramp length for required storage (from ramp entrance to physical ramp nose)
• full depth pavement of ramp shoulder for future traffic
• conduits for power and communications along ramps, especially if other conduits are being installed, e.g. for street lighting
• future stop line location and required data detector locations for mainline and ramp counting to suit future ramp signal operational needs (see Section 14)
• position and spacing of stormwater catchpits
• barrier type / placement
• earthworks for widening
• using black asphalt for the ramp shoulder
• positioning of pavement markings and ‘Form 1 Lane’ signs.
7.6 Equipment layout At the RO&DS ‘Develop’ and ‘Deliver’ phases of a project, ramp signal designs at each ramp should be audited for consistency against design standards and guideline drawings for the layout of the ramp as well as the equipment provided, including:
• traffic signals: layout for ramp type, posts / gantry structures as appropriate
• vehicle detectors including (see Section 14)
– stop line (upstream and downstream), mid-ramp and ramp entrance (to suit ramp entry layout)
– locations of access points (AP) / repeater points (RP) if wireless detectors
• electronic signs including provision of RC1 warning and regulatory signs (as illustrated in Figure 7-1), which also operate as ramp closure signs:
– RC2 warning signs (as illustrated in Figure 7-2), if appropriate RC3 arterial road traveller information signs (as illustrated in Figure 7-1 and see Section 11)
– VSL signs, if appropriate (see Section 13)
• static signs
• pavement markings
• other relevant details including:
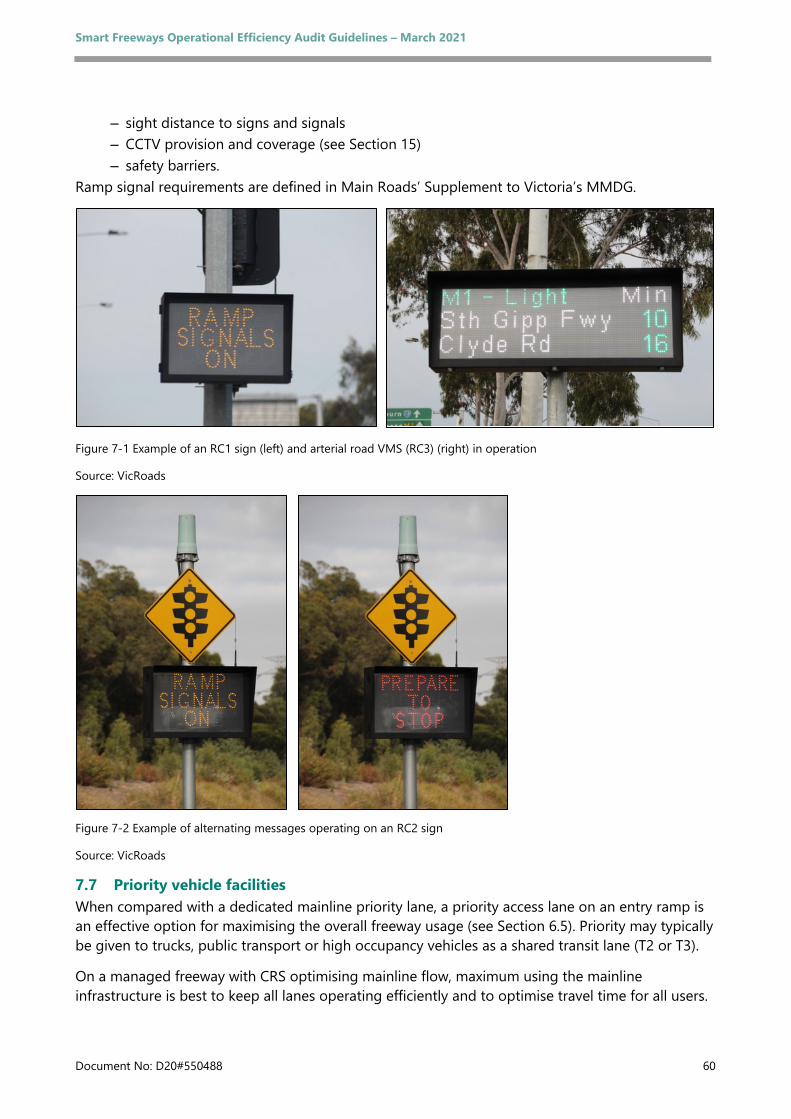
Smart Freeways Operational Efficiency Audit Guidelines – March 2021
Document No: D20#550488 60
– sight distance to signs and signals – CCTV provision and coverage (see Section 15) – safety barriers.
Ramp signal requirements are defined in Main Roads’ Supplement to Victoria’s MMDG.
Figure 7-1 Example of an RC1 sign (left) and arterial road VMS (RC3) (right) in operation
Source: VicRoads
Figure 7-2 Example of alternating messages operating on an RC2 sign
Source: VicRoads
7.7 Priority vehicle facilities When compared with a dedicated mainline priority lane, a priority access lane on an entry ramp is an effective option for maximising the overall freeway usage (see Section 6.5). Priority may typically be given to trucks, public transport or high occupancy vehicles as a shared transit lane (T2 or T3).
On a managed freeway with CRS optimising mainline flow, maximum using the mainline infrastructure is best to keep all lanes operating efficiently and to optimise travel time for all users.
Smart Freeways Operational Efficiency Audit Guidelines – March 2021
Document No: D20#550488 61
In the context of managing freeway flow to minimise flow breakdown, it is desirable to control all entry flows. Therefore, all entry ramp priority access lanes should be controlled as indicated in the Main Roads’ Provision Guidelines (2020), and generally, only provided if there is a strategic need.
Where an entry ramp priority access lane is included in a project design, the auditor should confirm that the proposal is consistent with the Main Roads’ Provision Guidelines (2020) as well as check the justification provided in relation to the performance and service definition component of the audit (see Section 4).
Where detailed designs are available, these should be checked relative to the guideline drawings in the Main Roads’ Supplement (2020) to Victoria’s Managed Motorway Design Guide.
In regard to priority access for emergency vehicles when ramp signals are installed on an entry ramp, access is generally provided by an operator switching off the ramp signals to clear the ramp queue. Generally, no special consideration needs to be given in the design.
Facilities for emergency vehicles and public transport entering the freeway may also need to be considered at entry ramp intersections with the arterial road (see Section 10).
7.8 Safety considerations Safety benefits of entry ramp operation relate to providing safety on the mainline including addressing existing accident problems if the project involves upgrading of an existing route. Minimising and avoiding mainline congestion so that road users do not encounter congestion and stopped, or shock wave-affected traffic, provides significant safety benefits.
Safety-related operation for ramp and ramp signal designs is built into the principles on which the design standards are based, and the guideline drawings have been the subject of a road safety audit. Other site-specific safety-related matters may need to be considered, but are generally handled as part of the project’s road safety audit.
Case study
Project description: Kwinana Freeway Southbound Managed Freeway Pilot Project (concept proposal) south of the Roe Highway interchange
Audit stage: ‘Develop’ phase of the RO&DS process
In the preliminary phase of project development for upgrading of the Kwinana Freeway south of Roe Highway, draft designs were checked relative to standards and guideline plans. The review confirmed various matters, and also identified areas for improvement, including:
• confirming the number of lanes at the stop line is adequate for all sites
• at some locations, the storage on the ramp for queuing vehicles was less than the desirable minimum. Locating the stop line at the minimum distance of 80 metres from the ramp nose, rather than the desirable distance of 100 metres for merging, enabled more storage
• at one entry ramp there was adequate storage. However, the stop line location was adjusted to suit the future ramp nose location for ultimate widening of the freeway. This could be done without compromising the minimum desirable storage

Smart Freeways Operational Efficiency Audit Guidelines – March 2021
Document No: D20#550488 62
• at one entry ramp there was a need to include an RC2 electronic warning sign on the ramp, due to the ramp alignment and insufficient sight distance to the signal lanterns from the ramp entrance
• checking the positions of RC3 arterial road VMS were considered for provision of advanced road user information prior to the turning pocket as well as the location relative to other signage.
Smart Freeways Operational Efficiency Audit Guidelines – March 2021
Document No: D20#550488 63
8 Freeway-to-freeway operation 8.1 Overview
8.1.1 Component description
Freeway-to-freeway ramps are generally high-traffic-flow environments where it is desirable to provide an uninterrupted freeway journey. This should be the operational objective, when possible, based on traffic conditions. As flows entering a Smart Freeway from another freeway contribute to the potential for flow breakdown on the managed freeway, there should generally be ramp signals to manage freeway mainline traffic.
Where there is ramp signalling, it should only operate when needed and at other times, uninterrupted free-flow operation should be standard. In a worst-case situation, not managing all ramps leading to the primary freeway may also result in the queue from one freeway impacting the second freeway as well.
As with normal ramp signalling, the operation of freeway-to-freeway ramp signalling is not aimed at decreasing the hourly flow into the joining freeway system but rather, regulating the arrival flow to avoid flow breakdown. If flow breakdown is prevented, this can increase the average hourly flow into the freeway, and in so doing, increase the productivity of the entire freeway system.
The higher the unmanaged entry flow into a freeway, the greater its likelihood of causing a freeway with heavy traffic to breakdown. Therefore, regulating entry flows from freeway-to-freeway ramps is vital for the freeway system to be effectively managed.
High-volume entry ramps (up to 3,000 veh/h) have been signalled successfully in other Australian jurisdictions such as Melbourne, including freeway-to-freeway ramps. In international jurisdictions there are also many freeway-to-freeway connector ramp signals installed, for example District 7 in California with 28 entry ramps being metered (Failing et al. 2005). The treatment of entry ramps with volumes greater than 3,000 veh/h should be the subject of special analysis and report for consideration under the EDD process.
8.1.2 Audit objective
The key objective of this component is to confirm that the project proposals relating to freeway-to-freeway entry ramps enable sufficient control over entering traffic to manage mainline traffic, and that there is appropriate discharge capacity and storage.
8.1.3 Audit inputs
Audit inputs for freeway-to-freeway operation may include:
• a business case (for the purpose of understanding the problem and project objectives, as well as for details such as proposed design year and staging of works)
• design brief and specification, including functional requirements
• layout plan of freeway mainline and interchanges, including device layouts
Smart Freeways Operational Efficiency Audit Guidelines – March 2021
Document No: D20#550488 64
• design drawings for each entry ramp, including longitudinal and vertical alignment (concept / preliminary / detailed design depending on the stage of audit)
• freeway network plan showing intersecting freeways, ramps etc
• entry ramp design traffic volume analyses for ramp discharge capacity and storage supporting the project designer’s proposals for the freeway-to-freeway entry ramp designs. Where a project is to be stage constructed, separate design volume analyses shall be provided for ultimate and staging options
• the project designer’s treatment and proposals for the entry ramp connections to the downstream section of freeway
• ramp signal design drawings, and
• other assumptions or information used in the determination of the need for ramp signalling and the ramp layout.
The checklist for this audit component is included in Appendix A, Checklist 5: Checklist for Freeway-to-Freeway Operation.
8.2 Key principles The key principles for considering control and design of freeway-to-freeway interchanges to ensure safe and efficient operation are:
• to control and regulate all traffic entering a Smart Freeway, including from a connecting freeway, in order to minimise the potential for flow breakdown and hence optimise capacity
• to control freeway-to-freeway ramps to generally provide the most efficient and effective management of downstream bottlenecks
• to maximise capacity on both the connecting and joining freeway, as a bottleneck on the Smart Freeway if not managed affectively, can form queues that spill back and reduce the capacity on the connecting freeway as well
• to provide adequate capacity and storage at the interchange to manage flows within the freeway mainline capacity (as with standard entry ramp operation)
• to provide early warning and high visibility of ramp signals for high-speed approaches, and
• to provide adequate capacity on exit ramps to manage forecast traffic flows without queuing on the mainline that may cause flow breakdown (as with standard exit ramp operation).
8.3 Entry flows and ramp control While free-flowing interchanges are desirable to keep traffic moving, uncontrolled entry flows from a freeway into an adjoining freeway generally contribute to flow breakdown and congestion if traffic density is not managed. If flow breakdown does occur, this may adversely affect the upstream sections of the freeway being entered, as well as the freeway from which the uncontrolled traffic came.
When flow breakdown occurs, congestion and shock waves can travel upstream for significant distances, e.g. up to 10 km or more. Within these shock wave areas, upstream segments of the freeway cannot reach capacity. These impacts result in lower throughput and speeds for the freeway system.
Smart Freeways Operational Efficiency Audit Guidelines – March 2021
Document No: D20#550488 65
Ramp signalling at freeway-to-freeway ramps should only switch on when required, and at other times, the ramp is free-flowing. Traffic queues at freeway-to-freeway ramps should be managed within the storage length due to the significant safety and productivity implications if queues extend back into the upstream freeway mainline.
The Smart Freeways Provision Guidelines (Main Roads 2020), and Victoria’s MMDG Volume 2: Part 3 (and the Main Roads’ Supplement), inform the design and managing of freeway-to-freeway entry ramps.
In understanding the need for control, reference should be made to the mainline analysis of forecast design volume relative to the Maximum Sustainable Flow Rate (see Section 6 and Victoria’s MMDG). In some cases where freeways join, the mainline flow can be managed by ramp signalling at upstream ramps on both freeways, rather than on the freeway ramp itself. This, however, needs to be confirmed by mainline analysis to determine if downstream flows are within the design capacity.
Smart Freeways are only effective when traffic density is controlled at all points along a route, and particularly at critical bottlenecks. Effective control is placed closest to where the problem occurs. Other factors that should be considered, include:
• whether the freeway-to-freeway ramp merge is at, or just upstream from, a critical bottleneck, in which case it should be controlled to manage that, and
• using unmanaged freeway capacity values for capacity analysis on the freeway section downstream from an uncontrolled ramp (see MMDG Volume 2 Part 3).
8.4 Discharge capacity and geometric layout Freeway-to-freeway ramps may be difficult locations to provide the widening and storage facilities required for ramp signals to manage ramp and freeway traffic. The ramp features affecting the accommodation of ramp signals may include:
• geometry changes
• signals location relative to joining of ramps for left and right-turn movements
• ramp length
• cross-section, and
• structures or fill embankments.
Therefore, design implications associated with ramp signals should be considered during the early project development phases to ensure the geometry can accommodate ramp signalling when required, i.e. either at the time of construction or by retrofitting.
8.4.1 Ramp layout suitability
The design guideline drawings in the Main Roads’ Supplement (2020) to Victoria’s MMDG show two typical locations for ramp signals on freeway-to-freeway ramps where the ramps join for left- and right-turn movements.
Smart Freeways Operational Efficiency Audit Guidelines – March 2021
Document No: D20#550488 66
The location of the ramp signals should be chosen relative to interchange configuration and what is practicable with the following advantages and provision requirements:
• Single ramp signals location provided near the freeway being entered:
– generally, a simpler form of installation – requires adequate width and approach angle for the localised flaring (if necessary) to suit
stop line capacity needs, and – requires adequate distance from the stop line for storage before the joining of left- and
right-turn ramps for merging and queuing. While vehicles arriving from each direction need to merge before the ramp signals during times of low-flow or queueing, with higher flows the queues can extend into both left- and right-turn ramps.
• Separate ramp signals location on the left- and right-turning ramps:
– typically, more difficult to install due to fill, cut or structures, and – enables balancing of queues for vehicles arriving from each direction.
Visibility to the signals and the back of the queue are important considerations. Achieving good visibility and stopping sight distances can be challenging at freeway-to-freeway ramps because of horizontal and vertical geometry.
8.4.2 Storage and capacity analysis
The detailed assessment of design of ramp signal discharge capacity (number of lanes at the stop line) and ramp storage (length and number of storage lanes) is handled in the same way as entry ramps from arterial roads (see Section 7).
8.4.3 Additional design requirements
As drivers may not expect to stop on a freeway-to-freeway ramp, nor expect to encounter a queue of stopped vehicles (although flow breakdown and congestion on a freeway may also affect ramps), it is important to maximise operational safety when there is ramp signalling on freeway-to-freeway connections.
Safety concerns around installing these signals shall be managed according to principles in design guidance. The most appropriate measures include:
• Dynamic advanced warning signs on the freeway (RC3-C) before the exit ramp with the ramp signals. These signs provide a warning message when the ramp signals are operating and may also be used for other traveller information. Because of high traffic approach speeds, these signs are larger than activated signs used on arterial roads.
• VSL that activate with the ramp signals start-up sequence to manage the speed of approaching vehicles and to protect the back of the queue (see Section 13). If there are long lengths of three or four lanes of storage, LUMS signs (at close spacing) may be used for controlling speed as well as lane use, e.g. during an incident.
8.5 Equipment layout Detailed assessment of the design of ramp signal equipment on freeway-to-freeway ramps is handled in a similar way as for entry ramps from arterial roads (see Section 7), although different standards apply (see Main Roads’ Supplement and Victoria’s MMDG).
Smart Freeways Operational Efficiency Audit Guidelines – March 2021
Document No: D20#550488 67
8.6 Priority vehicle facilities The assessment of priority vehicle facilities on freeway-to-freeway ramps is handled in the same way as for entry ramps from arterial roads (see Section 7).
8.7 Exit ramps The operation of an exit ramp leading to an intersecting freeway is important to ensure that queues do not extend back onto the freeway mainline, causing safety problems or turbulence. In some situations, traffic conditions / problems on a downstream intersecting freeway may need to be addressed to avoid downstream problems affecting the managed freeway. The assessment of the design of exit ramps may be similar to issues raised in Section 9.
8.8 Safety considerations Safety concerns for ramp signalling on freeway-to-freeway ramps shall be managed, as traffic movements can operate at significant speeds and drivers may not expect to stop nor expect to encounter a traffic queue. Operational safety is maximised by adopting traffic management devices as outlined in Section 8.4.3. It is essential to also consider sight distances to these devices and the back of the queue.
If freeway-to-freeway ramp signalling is not installed and congestion occurs, it is likely that traffic safety will be worse as flow breakdown on the mainline can result in a six-fold increase in crash rates (Zheng 2012).
Case study
Project description:
Kwinana Freeway Southbound Managed Freeway Pilot Project (concept proposal) south of the Roe Highway interchange
Audit stage: ‘Select’ phase of the RO&DS process
When considering project scope and main problem areas targeted by the Kwinana Freeway Upgrade project, there is a significant matter identified in the audit – the need for ramp signals on the Roe Highway southbound entry ramp. The following extract from the audit report summarises the rationale and importance of controlling this freeway-to-freeway entry ramp:
• The current southbound bottleneck areas along this section of Kwinana Freeway are at the Roe Highway and Berrigan Drive entry ramps. These cause significant congestion, particularly during the PM peak period. The proposed widening to three lanes will alleviate these problem areas.
• When the widening works are in place, traffic problem areas will change so that the main bottleneck area will occur just south of the Beeliar Drive / Armadale Road interchange. Traffic flows indicate that at project completion this bottleneck area will be at capacity, i.e. flow breakdown and congestion will occur on a regular basis unless traffic is adequately controlled. When flow breakdown does occur it would be expected to cause congestion over a significant distance with queuing well back into the newly widened section of freeway. Problems would then worsen as traffic volumes increase over time.
Smart Freeways Operational Efficiency Audit Guidelines – March 2021
Document No: D20#550488 68
• Providing ramp signals for southbound traffic on Kwinana Freeway at Leach Highway, South Street, Berrigan Drive and Beeliar Drive / Armadale Road, as well as on the Roe Highway westbound ramps will provide some control. However, the uncontrolled high volume entry ramp at Roe Highway (likely to be in the order of 1,900 veh/h at project completion) is close to the bottleneck area. This uncontrolled flow will provide significant problems for managing traffic at the bottleneck, despite the other controlled ramps upstream. Although managing entry ramps on Roe Highway will assist in managing the Roe Highway entry flow to the Kwinana Freeway, the number of ramps proposed for ramp signalling provides limited control due to the magnitude of flows involved. Severe metering of a small number of Roe Highway ramps to control southbound movements will also disadvantage traffic intending to travel on Kwinana Freeway to the north.
• The omission of Roe Highway entry ramp signals in the current scope creates a significant risk that congestion will occur and that project objectives will not be met. An uncontrolled Roe Highway entry ramp may also cause problems for the southbound Kwinana Freeway traffic (~600 veh/h) weaving across to leave the freeway at the Berrigan Drive exit ramp. Ramp signalling of the entering Roe Highway traffic will manage vehicle headways and improve the situation for lane changing movements.
Further investigation of this matter, including a select link assignment by Main Roads, identified that providing ramp signals on the Roe Highway entry ramp will result in a significant improvement in the ability to manage the bottleneck areas along this section of Kwinana Freeway (approximately 50 per cent increase in controlled traffic). The select link analysis found that about 24 per cent of the traffic at the bottleneck south of the Beeliar Drive / Armadale Road interchange is from the Roe Highway southbound movement.
All other entry ramps proposed for ramp signalling upstream of the bottleneck on either Kwinana Freeway southbound or Roe Highway westbound, except Leach Highway, have far lower volumes contributing to the bottleneck. (Leach Highway southbound movements contribute about 10 per cent).
The Roe Highway southbound movement is the largest inflow closest to the main bottleneck and therefore signalling of this ramp creates the greatest control in managing demand and minimising flow breakdown in the bottleneck area. Furthermore, a significant percentage of traffic heading south from Roe Highway to Kwinana Freeway originates beyond the Orrong Road / Welshpool Road interchange, where there are no opportunities to control entering traffic. This means that Roe Highway traffic cannot be adequately managed by ramp signalling of the entry ramps entering Roe Highway.
Consequently, in order to control the Roe Highway to Kwinana Freeway southbound bottleneck, as well as other potential bottlenecks downstream, for example the three to two lane merge at the Beeliar Drive / Armadale Road interchange, it is necessary to meter the freeway-to-freeway Roe Highway to Kwinana Freeway southbound ramp.
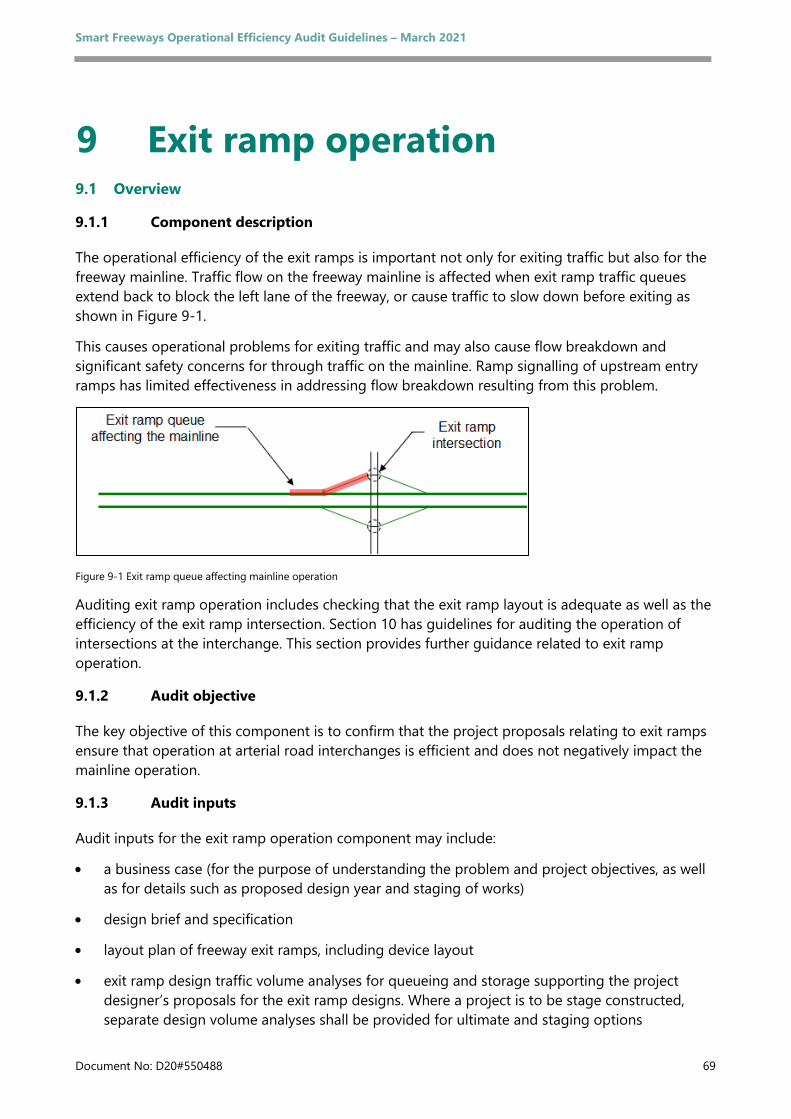
Smart Freeways Operational Efficiency Audit Guidelines – March 2021
Document No: D20#550488 69
9 Exit ramp operation 9.1 Overview
9.1.1 Component description
The operational efficiency of the exit ramps is important not only for exiting traffic but also for the freeway mainline. Traffic flow on the freeway mainline is affected when exit ramp traffic queues extend back to block the left lane of the freeway, or cause traffic to slow down before exiting as shown in Figure 9-1.
This causes operational problems for exiting traffic and may also cause flow breakdown and significant safety concerns for through traffic on the mainline. Ramp signalling of upstream entry ramps has limited effectiveness in addressing flow breakdown resulting from this problem.
Figure 9-1 Exit ramp queue affecting mainline operation
Auditing exit ramp operation includes checking that the exit ramp layout is adequate as well as the efficiency of the exit ramp intersection. Section 10 has guidelines for auditing the operation of intersections at the interchange. This section provides further guidance related to exit ramp operation.
9.1.2 Audit objective
The key objective of this component is to confirm that the project proposals relating to exit ramps ensure that operation at arterial road interchanges is efficient and does not negatively impact the mainline operation.
9.1.3 Audit inputs
Audit inputs for the exit ramp operation component may include:
• a business case (for the purpose of understanding the problem and project objectives, as well as for details such as proposed design year and staging of works)
• design brief and specification
• layout plan of freeway exit ramps, including device layout
• exit ramp design traffic volume analyses for queueing and storage supporting the project designer’s proposals for the exit ramp designs. Where a project is to be stage constructed, separate design volume analyses shall be provided for ultimate and staging options
Smart Freeways Operational Efficiency Audit Guidelines – March 2021
Document No: D20#550488 70
• the treatment proposals for the exit ramp connection to the upstream section of freeway
• traffic capacity analysis of the arterial road interchange intersection, including queue lengths on the freeway exit ramp
• available data on the presence and extent of queues on the mainline e.g. data from any detectors located on the mainline upstream of the exit ramp nose or CCTV images
• design drawings for each interchange, including longitudinal and vertical alignment (concept / preliminary / detailed design depending on the stage of audit), and
• other assumptions or information used in the determination of the need for arterial traffic management improvements and interchange / ramp layout.
The checklist for this audit component is included in Appendix A, Checklist 6: Checklist for Exit Ramp Operation.
9.2 Key principles The key principles for design of exit ramps to ensure efficient and safe freeway operation are:
• to provide adequate capacity on exit ramps to manage forecast traffic flows without excessive queuing that may cause flow breakdown on the mainline
• to provide sufficient length and capacity (including ramp width / number of lanes) on exit ramps to adequately provide for deceleration and storage of exiting traffic, and
• if there is any likelihood of queues extending back to the freeway mainline, provide treatments to monitor and manage this queue length, or to lengthen the ramp to minimise the chance of queues blocking the freeway mainline.
9.3 Capacity and geometric layout The safety and operational efficiency of the mainline can be affected by the performance of exit ramps in the following situations:
• vehicles queuing onto the mainline from the exit ramp
• vehicles slowing down in the through lanes prior to leaving to enter an exit ramp, and
• high exit flows having difficulties accessing the exit ramp due to lane changing.
9.3.1 Exit ramp layout and ramp intersection suitability
In retrofitting existing freeways with Smart Freeway traffic management tools, especially ramp signalling, freeway throughput generally increases as part of a Smart Freeway project. Interchange capacities and exit ramp arrangements shall be checked, and in some cases, capacity may need to be increased to cater for forecast design peak period traffic volumes. For new freeway projects, these aspects of design are important for efficient operation.
Possible causes for exit ramp problems include:
• Inadequate intersection capacity at the arterial road intersection, which creates excessive queuing and delays on the exit ramp. Roundabouts are generally a safer form of intersection, however, traffic signals at the exit ramp intersection enables better control of traffic queues compared to roundabouts or stop / give way signs (see Section 10).
Smart Freeways Operational Efficiency Audit Guidelines – March 2021
Document No: D20#550488 71
• Inadequate ramp capacity to handle the exiting flow, which may be due to:
– a short ramp with insufficient length. The length of each exit ramp should be designed to minimise the chance of a queue from the arterial intersection spilling back to the freeway mainline. Ramp length is also important for deceleration of exiting traffic, and
– a ramp with insufficient width, e.g. a single lane exit ramp where flow requires two exit lanes at the ramp nose.
Where it is not feasible to provide a longer exit ramp to address inadequacies, for example due to a significant upstream design constraint such as a bridge or an entry ramp merge, queue detectors should be provided on an exit ramp if there is any likelihood of queues extending back to the freeway mainline. In this case, operational interfacing with the traffic signals at the exit ramp intersection should be set up to manage this queue length to avoid blocking the freeway mainline.
Other options to provide for queuing include allowing exiting vehicles to use the ESL for exiting or queuing, with provision of static signs (at specified times) or dynamic signing (queue-activated or time-based).
9.3.2 Ramp length and capacity
A summary of desirable design standards for auditing operational efficiency of ramp length and width (number of lanes) include:
• length of right-turn and left-turn lanes to accommodate 95th percentile queues plus length for deceleration (refer to the Main Roads’ Supplement and Victoria’s MMDG
• minimum length to achieve grading requirements and deceleration to negotiate a ramp curve and / or distance to the back of queue (refer to the Guide to Road Design Part 4C: Interchanges (Austroads 2009e)), and
• for high-volume exits, consideration of two-lane exits (see Victoria’s MMDG) to enable vehicles to change lanes and diverge to enter the exit ramp without causing mainline turbulence.
9.3.3 Two-lane exits
Victoria’s MMDG Volume 2 Part 3 (Section 3.7.3) shows that a two-lane exit at the ramp nose is generally required for design volumes greater than 1,500 pc/h.
Two-lane exits enable either:
• an exclusive (auxiliary) exit lane together with a second lane of traffic diverging from the through lane in a similar manner to a single-lane exit (tapered design), typically for exit flows ranging from 1,500 pc/h to 2,700 pc/h, or
• two exclusive exit lanes for higher flows, i.e. typically for exit flows from 2,700 pc/h to 4,000 pc/h.
The layouts should include a significant length of exclusive exit lane to reduce turbulence, allow for lane changing into the second exit lane and to enable the capacity of the two-lane exit to be developed. Subject to the proximity of the preceding interchange, the length of the left exclusive lanes should be in the range of 450 to 800 metres long, plus taper.
Smart Freeways Operational Efficiency Audit Guidelines – March 2021
Document No: D20#550488 72
Care needs to be taken with two-lane exits where queuing on the exit ramp may exceed the ramp length. With two-lane exit arrangements that have an exclusive lane and a shared lane, queuing affects the shared lane and may directly impact the mainline operations, both from safety and capacity perspectives. The ramp length shall be adequate to prevent this operational risk. Alternatively, if the ramp cannot be lengthened, operational interfacing with the traffic signals at the exit ramp intersection should be set up to manage this queue length to avoid blocking the freeway mainline.
9.4 Priority vehicle facilities Where there are priority vehicle facilities at an exit ramp intersection, a dedicated priority vehicle lane on the exit ramp itself may also be required to enable priority vehicles to bypass queues and access the priority lane at the intersection.
9.5 Safety considerations Adequately designed exit ramps are necessary to avoid safety concerns associated with traffic queuing back from the exit ramp onto the freeway mainline. This is hazardous as mainline traffic may be travelling at high speed, and drivers may not expect to encounter a traffic queue or a need to stop. It is essential to also consider sight distances to the exit.
Where there is limited scope to improve ramp layout to minimise queuing on the mainline, other measures should be considered to improve safety as outlined above.
Case study
Project description:
Gateway WA – Perth Airport and Freight Access Project (initial concept design)
Audit stage: ‘Select’ phase of the RO&DS process
Extract from the operational audit report on the Tonkin Highway southbound exits to Leach Highway – east) / airport access and Leach Highway – west (see Figure 9-2).
There is approximately 460 metres between the two proposed exits. There is concern about the length available for lane changing (~ 600 metres) with up to 2,400 veh/h leaving at the second exit in the AM peak. Direction signing may be problematic and drivers may become confused about which exit to take. There may also be further growth in airport traffic expected (2031 volumes are 570 veh/h AM and 640 veh/h PM).
A combined exit from which Leach Highway east, including airport traffic, could then diverge after the mainline exit should be considered. This arrangement is likely to improve safety and reduce turbulence on the mainline in the vicinity of the double exit.
A suggested layout includes:
• Two exclusive lanes exiting the mainline, including an added left-turn auxiliary lane for the combined exiting traffic (2,960 veh/h AM and 2,140 veh/h PM peak), i.e. provide five lanes just prior to the exit.
• Three through lanes for the continuing mainline volume (2,560 veh/h AM and 2,830 veh/h PM peak). The three mainline lanes will provide for future longer-term growth.
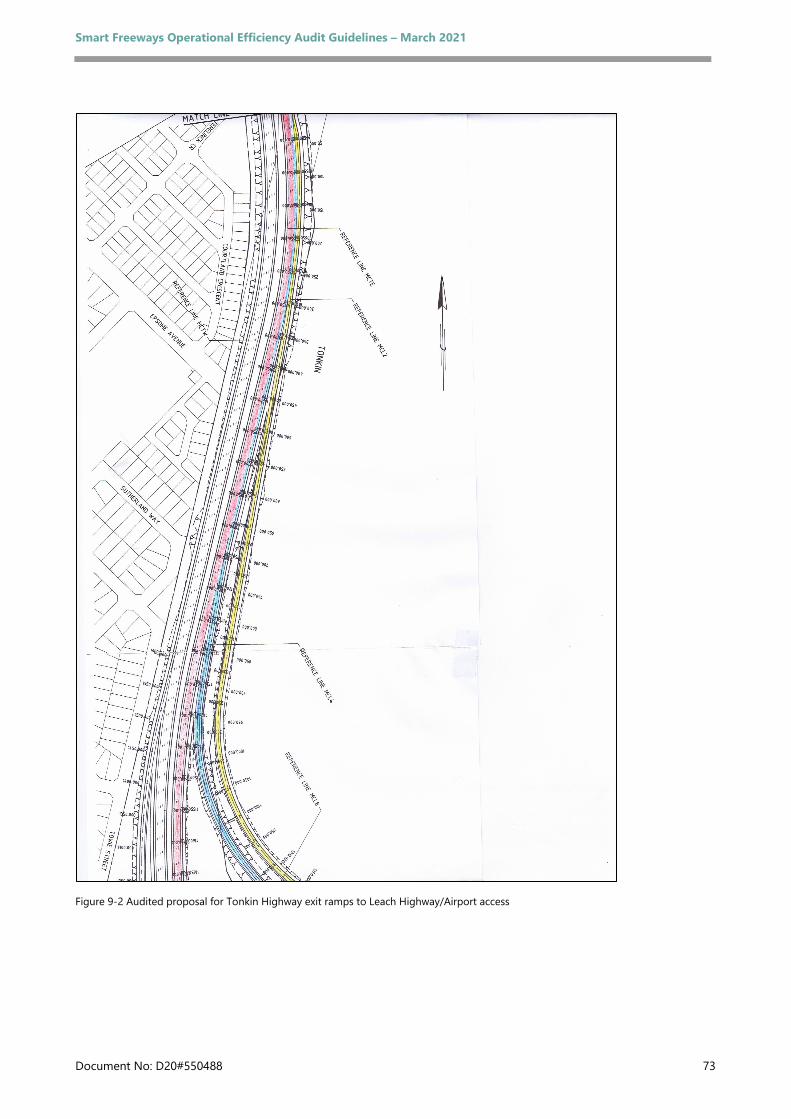
Smart Freeways Operational Efficiency Audit Guidelines – March 2021
Document No: D20#550488 73
Figure 9-2 Audited proposal for Tonkin Highway exit ramps to Leach Highway/Airport access
Smart Freeways Operational Efficiency Audit Guidelines – March 2021
Document No: D20#550488 74
10 Arterial interchange operation 10.1 Overview
10.1.1 Component description
The control and operation of the intersections where freeway entry and exit ramps meet the arterial road system can have a significant impact on the efficient operation of the freeway corridor.
In areas of heavy traffic where the freeway is already, or is proposed to be a Smart Freeway, the interchanges will usually be controlled by traffic signals. This allows for the desired level of traffic control to manage entry and exit ramps. For low-volume interchanges, stop / give way signs or roundabouts may provide satisfactory operations.
Traffic signals in Western Australia are operated through SCATS (Sydney Coordinated Adaptive Traffic System), which provides adaptive timing and coordination of traffic signals. Interfacing between SCATS and the Smart Freeway systems can provide efficiency and safety benefits by avoiding queues on exit ramps spilling back to the freeway mainline, and avoiding the arterial intersections becoming blocked if queues on the freeway entry ramp spill back.
When there is an incident on the freeway resulting in the freeway running very slowly or being completely closed, control of the traffic movements leading onto the freeway can minimise the chances of drivers being trapped, and manage demand so the freeway can recover faster.
10.1.2 Audit objective
They key objective of this component is to confirm that the project proposals for freeway interchanges at arterial roads have appropriate control and capacity to manage traffic entering and leaving the freeway.
10.1.3 Audit inputs
Audit inputs for the arterial interchange operation component may include:
• a business case (for the purpose of understanding the problem and project objectives, as well as for details such as proposed design year and staging of works)
• design brief and specification
• layout plans of arterial interchanges
• interchange design traffic volume capacity analyses, including phasing diagrams (if signals), degree of saturation, average delays and queue lengths, supporting the project designer’s proposals for the interchange layout designs and operation. Where a project is to be stage constructed, separate design volume analyses shall be provided for ultimate and staging options
• traffic analysis of ramp storages provided at each entry and exit ramp for forecast AM and PM peak traffic flows (see Sections 7 and 9)
Smart Freeways Operational Efficiency Audit Guidelines – March 2021
Document No: D20#550488 75
• traffic analysis of the arterial intersections at the freeway terminus (where relevant)
• other assumptions or information used in the determination of the need for arterial traffic management treatments and interchange / ramp layout, and
The checklist for this audit component is included in Appendix A, Checklist 7: Checklist for Arterial Interchange Operation.
10.2 Key principles The key principles for design of arterial interchanges to ensure efficient and safe freeway operation are:
• efficient interchange design to optimise freeway and arterial road network productivity. Design for operation of arterial interchanges should also be managed to minimise any localised adverse impacts on the arterial road network
• to provide sufficient capacity at arterial interchanges to support freeway ramp signals in managing traffic entering and exiting the freeway
• in some cases, to provide additional storage on the arterial road to support freeway operations, as long as it does not interfere with arterial road operations
• to integrate arterial traffic control (SCATS) with the ramp signal control system and to provide operational intervention as required to help manage excessive ramp queues on entry or exit ramps, and
• that priority vehicle facilities should be consistent with those provided on the freeway entry and exit ramps.
10.3 Geometric layout and intersection control
10.3.1 Interchange layout suitability
Subject to the applicable design volumes and capacity analysis, the geometric layout of the arterial interchange may be a conventional diamond interchange, or for high-flow interchanges. High-capacity interchanges, for example a single point interchange that provides greater capacity by enabling concurrent diamond right-turns (see Figure 10-1) may need to be considered.
Interchanges with loop ramps generally have lower capacity and may create difficulties with storage and sight distances to ramp signals.
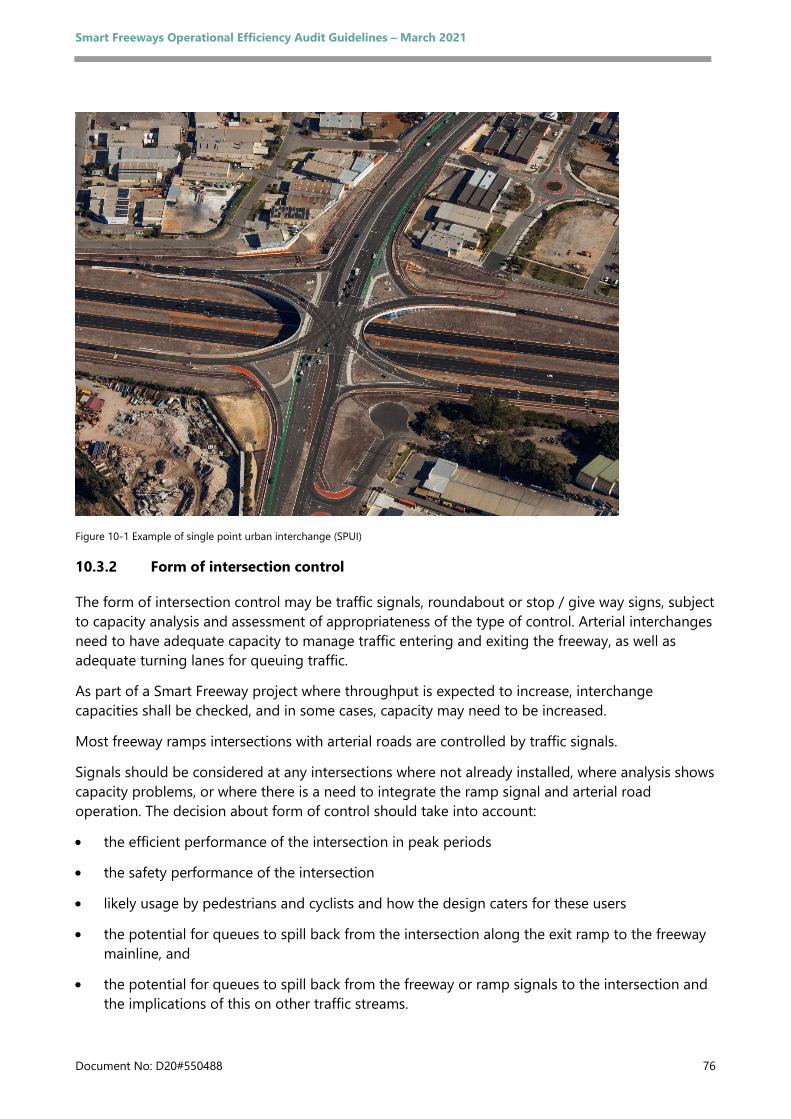
Smart Freeways Operational Efficiency Audit Guidelines – March 2021
Document No: D20#550488 76
Figure 10-1 Example of single point urban interchange (SPUI)
10.3.2 Form of intersection control
The form of intersection control may be traffic signals, roundabout or stop / give way signs, subject to capacity analysis and assessment of appropriateness of the type of control. Arterial interchanges need to have adequate capacity to manage traffic entering and exiting the freeway, as well as adequate turning lanes for queuing traffic.
As part of a Smart Freeway project where throughput is expected to increase, interchange capacities shall be checked, and in some cases, capacity may need to be increased.
Most freeway ramps intersections with arterial roads are controlled by traffic signals.
Signals should be considered at any intersections where not already installed, where analysis shows capacity problems, or where there is a need to integrate the ramp signal and arterial road operation. The decision about form of control should take into account:
• the efficient performance of the intersection in peak periods
• the safety performance of the intersection
• likely usage by pedestrians and cyclists and how the design caters for these users
• the potential for queues to spill back from the intersection along the exit ramp to the freeway mainline, and
• the potential for queues to spill back from the freeway or ramp signals to the intersection and the implications of this on other traffic streams.
Smart Freeways Operational Efficiency Audit Guidelines – March 2021
Document No: D20#550488 77
10.3.3 Entry ramp intersections
The storage (length and number of lanes) of each entry ramp should be designed to minimise the chance of a queue from the ramp signal spilling back and causing a blockage at the arterial intersection (except where overflow storage is formalised on the arterial road). However, where design constraints may limit the required storage, alternative management strategies may be necessary (see Section 7 for auditing of entry ramp design).
Integration of the ramp signal control system and SCATS is available to help manage excessive ramp queues when there is inadequate storage. Operational interventions can be set up to manage such a queue and project design proposals should indicate if this is the case. If necessary, the overflow queue can then be stored in exclusive left or right-turn lanes on the arterial road itself, with provision of additional queue sensors.
Turn lanes leading onto entry ramps should be designed to be long enough to cater for queuing, taking into account the predicted operation of the ramp signalling system. In some cases, as part of design, it may be necessary to modify the geometric layout to provide additional turn-lane capacity so that queues do not obstruct through traffic movements at the intersection.
The left-turn onto an entry ramp is often uncontrolled through a slip lane. For ramps with inadequate storage, signalising the slip lane in order to hold traffic back to make space on the ramp for traffic turning right from the arterial onto the entry ramp should be considered at the design stage.
The signals controlling the turn movements onto the entry ramps should be coordinated with incident management plans. If the freeway ramp is closed, the traffic signals should remain red for the turns onto the entry ramp. At the same time, the RC1 and RC3 traveller information signs (see Sections 7.6 and 11.4.3) should display a message that the freeway ramp is closed, together with no left or right-turn. The geometric design of the entry ramp intersection should avoid any island or median between the right-turn lane and the adjacent through lane, so that drivers have the opportunity to move out of the exclusive turn lane.
10.3.4 Exit ramp intersections
The length of each exit ramp should be designed to minimise the chance of a queue from the arterial intersection spilling back to the freeway mainline (see Section 8 for details of exit ramp design). The designer should have analysed all exit ramp intersections for peak-hour flows to determine the 95th percentile queue lengths.
If a potential queuing problem is identified, it will be necessary to increase storage capacity for the exit ramp movement. For unsignalised intersections, signalisation should be considered. For a roundabout, there is an option of installing queue loops on the exit ramp to activate signalised roundabout metering of conflicting flows to provide priority to the exit ramp.
If the exit ramp intersection is controlled by traffic signals, the exit ramp can have SCATS queue detectors with operational interventions set up to manage this queue length to avoid blocking the freeway mainline. In order to manage these interventions incrementally, there may be a need for more than one set of queue detectors along the ramp.
A preferred option is integration of the ramp signal control system and SCATS using three sets of detectors along the ramp to help manage excessive ramp queues when there is inadequate exit ramp storage (see Victoria’s MMDG).
Smart Freeways Operational Efficiency Audit Guidelines – March 2021
Document No: D20#550488 78
An alternative intervention is to bias the phase split in favour of the phase that services the exit ramp when queues start to form. A harsher intervention is to force the exit ramp phase to run, to avoid the queue spilling back to the mainline on the freeway. Usually, a combination of both types of intervention should be set up.
In the event of the freeway being closed just past the exit ramp, all freeway traffic should be diverted onto the exit ramp. In such a case, the SCATS operators intervene to maximise the phase time of this movement through the arterial interchange. If appropriate, they also modify other signals along the arterial road to accommodate the additional traffic.
Operationally, the traveller information system should also aim to disperse traffic at other upstream interchanges as part of an incident management ‘wide area network dispersion’ system (see Victoria’s MMDG).
10.3.5 Freeway terminus conditions
If the freeway ends by feeding into an arterial road, the capacity of this road is critical to the efficient and safe operation of the freeway.
If the forecast demand is less than the capacity, then no special interventions are needed. This might occur when the freeway transitions to a rural highway on the outskirts of an urban area.
If forecast demand exceeds capacity, for example where the freeway terminates at a controlled access highway in the city centre, the freeway terminus is a potential critical bottleneck location. If design cannot provide the required capacity, the main aim is to manage the resulting queues.
It may be considered unavoidable or desirable to store the queues on the freeway rather than on the arterial network. If so, safety can be improved by dynamically reducing speed limits on the approaches to the freeway terminus, in response to detected queues. LUMS or VSL can be installed for this purpose (see Sections 12 and 13).
10.4 Priority vehicle facilities At some arterial interchanges, there may be a requirement to give priority to certain classes of vehicle. This may be in the form of spatial priority – a separate dedicated lane for the priority vehicles, which may operate full time or part time. Alternatively, there may be a traffic signal priority, where the green phase is stretched as the priority vehicle approaches.
Where the freeway terminates at an arterial road intersection with a capacity deficit, priority lanes may be proposed as a form of a queue jump facility. Generally, the priority lane should not be introduced at the expense of a general traffic lane. Arrangements should be analysed to ensure the intersection degree of saturation and queues meet the targeted performance design standard.
10.5 Safety considerations Adequately designed arterial intersections are important to avoid safety concerns associated with traffic queuing back along the exit ramp onto the freeway mainline. This is hazardous, as mainline traffic may be travelling at high speeds and drivers may not expect to encounter a traffic queue or a need to stop.
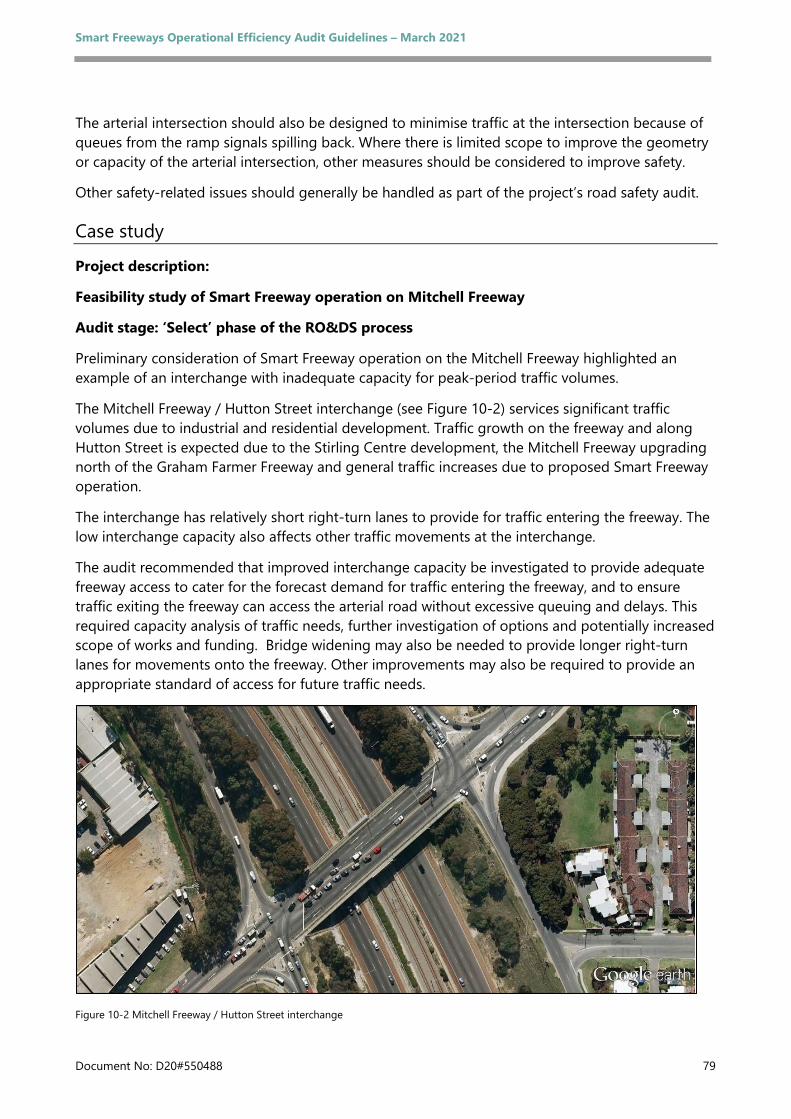
Smart Freeways Operational Efficiency Audit Guidelines – March 2021
Document No: D20#550488 79
The arterial intersection should also be designed to minimise traffic at the intersection because of queues from the ramp signals spilling back. Where there is limited scope to improve the geometry or capacity of the arterial intersection, other measures should be considered to improve safety.
Other safety-related issues should generally be handled as part of the project’s road safety audit.
Case study
Project description:
Feasibility study of Smart Freeway operation on Mitchell Freeway
Audit stage: ‘Select’ phase of the RO&DS process
Preliminary consideration of Smart Freeway operation on the Mitchell Freeway highlighted an example of an interchange with inadequate capacity for peak-period traffic volumes.
The Mitchell Freeway / Hutton Street interchange (see Figure 10-2) services significant traffic volumes due to industrial and residential development. Traffic growth on the freeway and along Hutton Street is expected due to the Stirling Centre development, the Mitchell Freeway upgrading north of the Graham Farmer Freeway and general traffic increases due to proposed Smart Freeway operation.
The interchange has relatively short right-turn lanes to provide for traffic entering the freeway. The low interchange capacity also affects other traffic movements at the interchange.
The audit recommended that improved interchange capacity be investigated to provide adequate freeway access to cater for the forecast demand for traffic entering the freeway, and to ensure traffic exiting the freeway can access the arterial road without excessive queuing and delays. This required capacity analysis of traffic needs, further investigation of options and potentially increased scope of works and funding. Bridge widening may also be needed to provide longer right-turn lanes for movements onto the freeway. Other improvements may also be required to provide an appropriate standard of access for future traffic needs.
Figure 10-2 Mitchell Freeway / Hutton Street interchange
Smart Freeways Operational Efficiency Audit Guidelines – March 2021
Document No: D20#550488 80
11 On-road traveller information 11.1 Overview
11.1.1 Component description
Traveller information provides two levels of important service to road users. Firstly, to give drivers information to help them reach their destinations by aiding trip navigation to unfamiliar locations. Although there is increasing use of satellite navigation systems, basic on-road direction signs remain important to support the satellite navigation messages (e.g. providing road / destination names to be referred to by the navigation systems) and for those who do not have a satellite navigation system.
In the Smart Freeways context, traveller information also serves a second important role by providing drivers with real-time information on changing traffic conditions and helping road operators manage traffic flows.
During unfavourable traffic conditions, drivers can use on-road traveller information to take an alternative route or to let other people know that they will be late. In some cases, the driver may have the option of parking the car and taking public transport, thereby reducing traffic demand to the congested freeway section. Even if a driver takes no action in response to unfavourable conditions, the knowledge of what is happening helps to reduce frustration. To meet this secondary purpose, traveller information needs to be displayed dynamically, alerting drivers to traffic conditions as they change, and proactively advising drivers of events that will affect future traffic conditions.
Real-time traveller information generally consists of travel time, traffic conditions (light, medium, heavy, major delays), traffic incidents, road works and special events. Occasionally, messages can be used to alert drivers to unusual weather conditions, such as a strong crosswinds or water across the road. If available, information can be provided about alternative routes and public transport services. Signs shall not be used for advertising and use for community messages should be minimised in accordance with relevant road authority policies.
Traveller information should be provided for drivers travelling along the freeway, as well as for drivers using the arterial road network and intending to use the freeway for their trip.
On-road traveller information for a freeway usually consists of:
• static directional information relating to travel along the freeway, displayed on advance exit signs, exit signs, lane allocation signs (where required) and occasional reassurance signs
• static directional information on the arterial roads leading to the freeway, displayed on advance direction and intersection direction signs
• real-time travel time or traffic condition information signs along the freeway mainline
• real-time travel time or traffic condition information signs on arterial road approaches to freeway entry ramps and at key decision points where drivers may use an alternative route, and
Smart Freeways Operational Efficiency Audit Guidelines – March 2021
Document No: D20#550488 81
• general real-time messages provided to drivers along the freeway mainline, which can be activated by staff in the Road Network Operations Centre (RNOC).
The real-time travel time / traffic condition messages and general real-time messages are usually displayed on variable message signs (VMS), combining these two functions into one sign. Traveller information through LUMS is covered in Section 12. This document does not cover traveller information provided by radio or pre-trip online systems or any other in-car technologies.
Table 4.3 highlights the relevant ITS services delivered by VMS. This table should be used to identify the associated ITS technologies that are essential or useful for delivery of those services, and that should therefore also be included in the project design and audit scope.
11.1.2 Audit objective
The key objective of this component is to confirm project proposals for on-road traveller information appropriately guide road users about freeway conditions on approach to, and on, the freeway.
11.1.3 Audit inputs
Audit inputs for the on-road traveller information component may include:
• a business case (for the purpose of understanding the problem and project objectives, as well as for details such as proposed design year and staging of works)
• design brief and specification, including functional requirements
• layout plan of freeway mainline, interchanges and ESB (where applicable), including device layout
• design drawings of freeway mainline, ramps and ESB (where applicable), including longitudinal and vertical alignment (concept / preliminary / detailed design depending on the stage of audit)
• signing scheme designs and drawings for all static signs (such as direction signs and other significant static signs) on the freeway and the connecting arterial roads (concept, preliminary or detailed, depending on the stage of audit)
• plans of locations for VMS on the freeway including mainline and entry ramps on the same plans as the direction signs, pavement markings and LUMS, if provided
• plans of locations for real-time traveller information signs on the arterial road approaches to the freeway on the same plans as the interchanges, direction signs and pavement markings
• VMS design drawings showing conformance with Main Roads’ requirements, and
• other assumptions or information used in the determination of the need for traveller information and equipment layout.
While an audit of Smart Freeway functions does not cover static sign messages, the interaction between signs and relative locations are key elements for the audit. In particular for incident management advance warnings, and to identify locations relating to alternate routes.
Smart Freeways Operational Efficiency Audit Guidelines – March 2021
Document No: D20#550488 82
The checklist for this audit component is included in Appendix A, Checklist 8: Checklist for On-Road Traveller Information.
11.2 Key principles The key principles for design and locations of on-road traveller information systems to ensure safe and efficient freeway operation are:
• To prioritise static direction signs in design of on-road traveller information.
• To provide real-time traveller information signs in advance of key decision points on the freeway to assist with driver route choice, particularly during incidents or congestion.
• To provide real-time traveller information signs on the arterial road approaches to all freeway entry ramps as part of the ramp signals designs, and at other locations with sufficient flows.
• To provide real-time traveller information signs in advance of key decision points on the arterial road network where drivers may choose to take a viable alternative route when the freeway is congested.
• To provide mainline real-time traveller information via multipurpose VMS to improve operational flexibility and to minimise whole-of-life operation and maintenance costs.
• All on-road message signs should be designed to be simple, legible and easy to understand according to Main Roads’ Guidelines for Variable Message Signs (2020).
Effective travel time information relies on accurate and reliable traffic data and travel time / traffic condition algorithms (see Section 14).
11.3 Geometric layout Minor civil works may be required to install traveller information signs, for example widening to accommodate mounting infrastructure and / or lateral clearance to traffic lanes.
11.4 Equipment layout
11.4.1 Sign type
The sign types and use may include the following types of VMS as defined in the Smart Freeways Variable Message Signs Guidelines (Main Roads 2020):
• freeway VMS
• tactical VMS (used in association with LUMS)
• freeway-to-freeway VMS, and
• arterial road VMS.
It is generally advisable to use multipurpose VMS rather than VMS with limited functionality. For example, multipurpose freeway VMS with pictogram and text display functions can provide information on travel times, traffic conditions and incident / events.
Use of multipurpose VMS minimises the number of VMS signs deployed and provides enhanced operational flexibility whilst minimising control system complexity and promoting a consistent driver experience. It can also minimise the costs associated with control system development, as well as whole-of-life maintenance costs.
Smart Freeways Operational Efficiency Audit Guidelines – March 2021
Document No: D20#550488 83
Sign size and configuration should be consistent with Main Roads’ requirements and consider legibility and sight distance requirements. Locations of freeway VMS and freeway-to-freeway VMS
Static direction signs have the highest priority in Smart Freeway designs and should be positioned in the design first before considering the positioning of LUMS structures, freeway VMS and freeway-to-freeway VMS. See Main Roads’ Variable Message Signs Guidelines (2020) for guidance on VMS types, displays and locations for signs.
The typical design sequence for positioning of VMS is:
• in relation to static direction signs
• for locations in advance of key decision points (interchanges) for provision of travel time / traffic condition information and to assist with diversions off the freeway during incidents. For example, in advance of significant exit ramps or freeway-to-freeway interchanges which are likely to be used as alternative routes when the freeway is congested or blocked
• for locations in advance of LUMS environments, if part of the project, to advise of traffic management arrangements ahead (lane closures, speed limits, etc) and the reason for those arrangements (incident, congestion, etc), and
• for additional locations on the midblock sections between interchanges as required for incident / event management and communication of travel time and traffic condition information.
Static direction signs should be located along the freeway in accordance with Australian Standards and Main Roads’ supplementary guidelines. While there is some tolerance on the location of advance exit signs, the tolerance on the placement of exit signs is relatively small.
The layout of traveller information signs shall be considered in conjunction with all other forms of on-road signage, including warning signs, information signs and regulatory signs. Static signs, VMS and LUMS / VSL (if provided) need to be placed so that drivers are not overloaded with information at any point along the freeway. The placement of VMS should also avoid sections of the freeway with a critical bottleneck, for example at a tight curve, as driver attention (and possible slowing down) to read the sign can add to the potential for turbulence.
Ideally, LUMS / VSL and static direction signs should not be placed on the same gantry, although there may be some locations where this is unavoidable due to geometric constraints. As the location of VMS is usually more flexible, there is generally less need to co-locate LUMS / VSL and VMS signs, although this also may be necessary in some instances due to geometric constraints (see Section 12.4.2). The co-location of signs is inappropriate as a cost saving measure, particularly if separated locations are feasible.
To minimise driver workload, the viewing distance for signs should, where possible, avoid sections of freeway where other manoeuvres take place such as entry merges, exit merges and mid-block lane drops or lane gains. The location of signs before major decision points, typically 900 to 1,200 metres, is important to provide adequate time for road users to safely read and respond.
Smart Freeways Operational Efficiency Audit Guidelines – March 2021
Document No: D20#550488 84
11.4.2 Locations of arterial road VMS
Arterial road VMS (i.e. RC3 signs, as illustrated in Figure 7-1) should be located on the arterial road approaches to the freeway in accordance with guidelines. Auditors should check that signs are provided for each freeway entry before left and right-turn lanes, unless the turning movement has a low traffic flow (e.g. less than 200 veh/h in the peak period). Entry ramps close to the end of the freeway may also be exempted as data for traveller information may not be available.
Auditors should also check that the signs are located at an appropriate location relative to guidelines (depending on approach speeds, side roads, driveways etc.), and before the start of left- or right-turn tapers to turn onto the entry ramp.
Arterial road sections in the vicinity of a freeway interchange often have many signs, lighting poles, trees, driveways, traffic signals and other road furniture. It is therefore important to position all furniture carefully to ensure clear lines of visibility to the signs and to ensure that the signs do not block other important traffic control devices.
Real-time traveller information signs can also be beneficial in advance of key decision points on the arterial road network that are remote from the freeway interchange, but where drivers may choose to take a viable alternative route when the freeway is heavily congested.
RC1 and RC2 signs should be provided as part of entry ramp signals design as specified in section 7.6 and the Main Roads’ Supplement to the MMDG (2020). These warn road users whether the ramp signals are operating and may also be used to close the freeway entrance.
11.4.3 Mounting structures
The type of sign mounting should be chosen by the designer to meet requirements for visibility. Consideration should also be given to the likely obscuration by high vehicles. Along the freeway, overhead mounting on a gantry or a bridge structure provides the best visibility for road users.
The vertical and horizontal geometry of the road should be taken into account when assessing sign visibility. When mounted on a bridge structure, a sign should be no more than 15 degrees off being square to the line of sight of the approaching drivers.
The posts for signs and gantry structures need to be placed in safe locations. Road safety guidelines require non-frangible posts to be beyond the deflection zone of a safety barrier or outside of the area required for errant vehicles to recover. Particular attention should be given to the location of posts in the vicinity of the nose at a freeway exit.
All overhead signs shall have the required clearance from the under-side of the sign or structure to the road pavement.
11.4.4 Provision in tunnel environments
There may be additional safety-specific requirements for installation of VMS or other types of changeable message signs on approach to and within tunnel environments. For example, to show whether the tunnel is open or closed. Traveller information VMS as described above are generally not provided within tunnels due to space restrictions, however they may be appropriate at entry and exit points.
Smart Freeways Operational Efficiency Audit Guidelines – March 2021
Document No: D20#550488 85
11.5 Safety considerations All on-road traveller information signs should be simple, concise and easy to read. Complex signs can cause drivers to take their eyes off the road for too long or have difficulty understanding the information.
Traveller information can assist the overall safety of the freeway by advising drivers of any unusual conditions and diverting traffic when abnormal delays are expected. Diverting traffic away from a congested freeway can help return traffic to safer free-running more quickly.
Sign supports shall be designed with safety in mind. Non-frangible posts and gantry supports shall be shielded behind a safety barrier or set back outside the area required for errant vehicles to recover. Electrical connections to signs shall be safe if the post is hit by an errant vehicle.
Other safety-related issues should also be considered. These are generally handled as part of the project’s road safety audit.
Case study
Project description: Freeway project based on an audit in another jurisdiction
Audit stage: ‘Develop’ phase of the RO&DS process
A component of the audit included the mainline VMS for providing on-route real-time, changeable advice to road users. The proposed signs were part of incident and event management and supported the operation of a lane use management system for integrated and consistent driver advice.
The audit recommended that the mainline VMS be multi-purpose so that it could be used for travel time and freeway condition information on the default display, as well as for the intended higher priority messages related to incidents. The increased functionality of the multi-purpose VMS would replace a number of other sign types being proposed. Rationalising signs as suggested provided increased functionality whilst reducing installation costs, maintenance sign inventory levels, overall whole-of-life costs and the need for separate system device drivers.
The audit also considered the locations of the proposed mainline VMS. The overall number of VMS and spacing generally between 3,250 and 3,500 metres was considered appropriate and in accordance with guidelines. The audit recommendations related to reviewing the locations of several VMS relative to their distance before major decision-making locations or other signs, are detailed in Table 11.1 and Table 11.2.
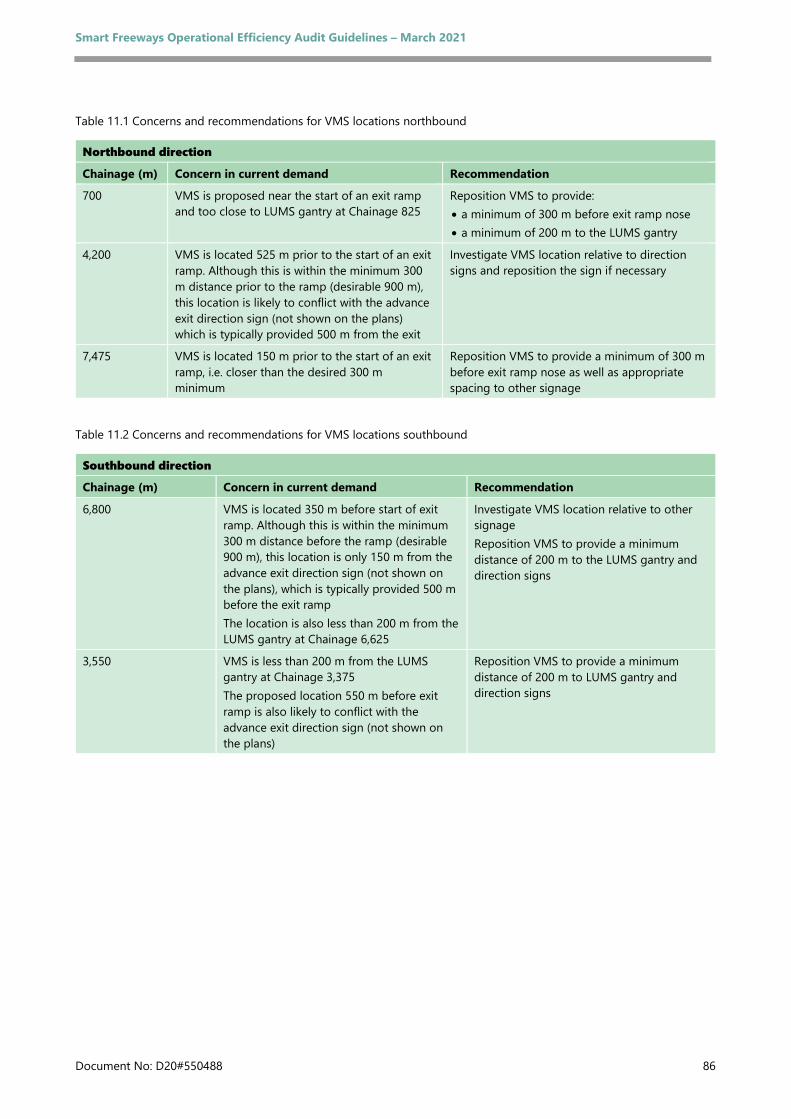
Smart Freeways Operational Efficiency Audit Guidelines – March 2021
Document No: D20#550488 86
Table 11.1 Concerns and recommendations for VMS locations northbound
Table 11.2 Concerns and recommendations for VMS locations southbound
Northbound direction
Chainage (m) Concern in current demand Recommendation
700 VMS is proposed near the start of an exit ramp and too close to LUMS gantry at Chainage 825
Reposition VMS to provide: • a minimum of 300 m before exit ramp nose • a minimum of 200 m to the LUMS gantry
4,200 VMS is located 525 m prior to the start of an exit ramp. Although this is within the minimum 300 m distance prior to the ramp (desirable 900 m), this location is likely to conflict with the advance exit direction sign (not shown on the plans) which is typically provided 500 m from the exit
Investigate VMS location relative to direction signs and reposition the sign if necessary
7,475 VMS is located 150 m prior to the start of an exit ramp, i.e. closer than the desired 300 m minimum
Reposition VMS to provide a minimum of 300 m before exit ramp nose as well as appropriate spacing to other signage
Southbound direction
Chainage (m) Concern in current demand Recommendation
6,800 VMS is located 350 m before start of exit ramp. Although this is within the minimum 300 m distance before the ramp (desirable 900 m), this location is only 150 m from the advance exit direction sign (not shown on the plans), which is typically provided 500 m before the exit ramp The location is also less than 200 m from the LUMS gantry at Chainage 6,625
Investigate VMS location relative to other signage Reposition VMS to provide a minimum distance of 200 m to the LUMS gantry and direction signs
3,550 VMS is less than 200 m from the LUMS gantry at Chainage 3,375 The proposed location 550 m before exit ramp is also likely to conflict with the advance exit direction sign (not shown on the plans)
Reposition VMS to provide a minimum distance of 200 m to LUMS gantry and direction signs
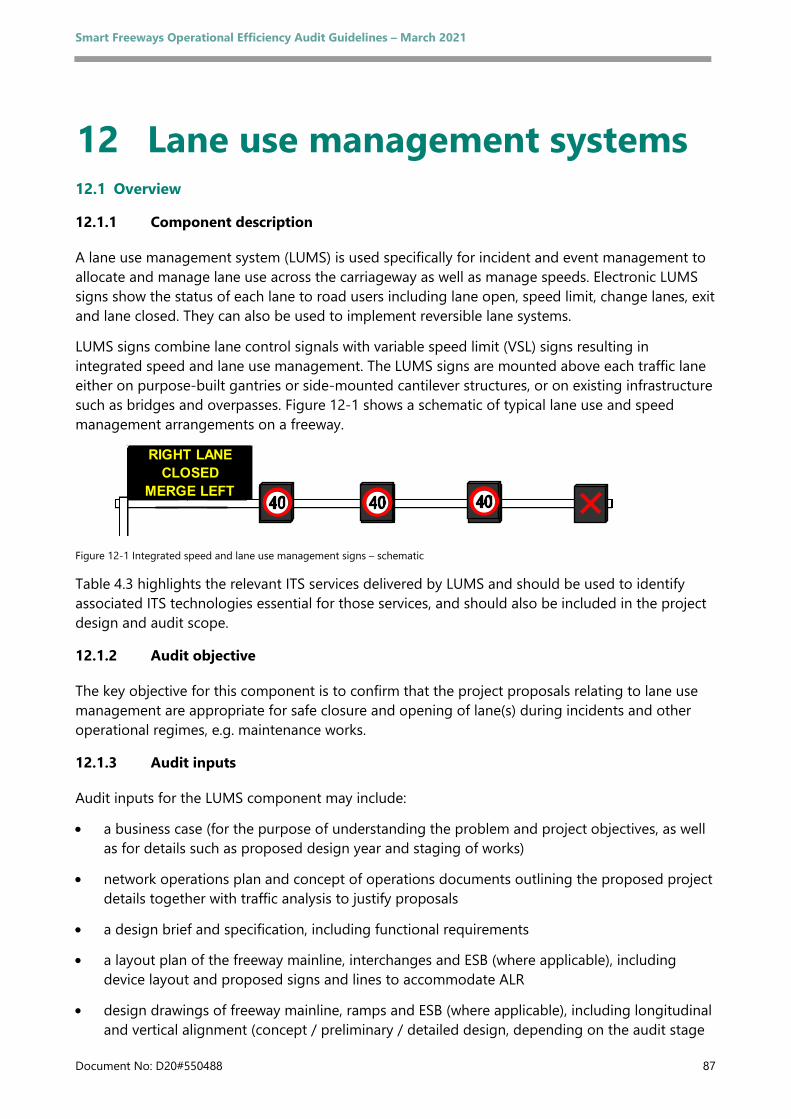
Smart Freeways Operational Efficiency Audit Guidelines – March 2021
Document No: D20#550488 87
12 Lane use management systems 12.1 Overview
12.1.1 Component description
A lane use management system (LUMS) is used specifically for incident and event management to allocate and manage lane use across the carriageway as well as manage speeds. Electronic LUMS signs show the status of each lane to road users including lane open, speed limit, change lanes, exit and lane closed. They can also be used to implement reversible lane systems.
LUMS signs combine lane control signals with variable speed limit (VSL) signs resulting in integrated speed and lane use management. The LUMS signs are mounted above each traffic lane either on purpose-built gantries or side-mounted cantilever structures, or on existing infrastructure such as bridges and overpasses. Figure 12-1 shows a schematic of typical lane use and speed management arrangements on a freeway.
Figure 12-1 Integrated speed and lane use management signs – schematic
Table 4.3 highlights the relevant ITS services delivered by LUMS and should be used to identify associated ITS technologies essential for those services, and should also be included in the project design and audit scope.
12.1.2 Audit objective
The key objective for this component is to confirm that the project proposals relating to lane use management are appropriate for safe closure and opening of lane(s) during incidents and other operational regimes, e.g. maintenance works.
12.1.3 Audit inputs
Audit inputs for the LUMS component may include:
• a business case (for the purpose of understanding the problem and project objectives, as well as for details such as proposed design year and staging of works)
• network operations plan and concept of operations documents outlining the proposed project details together with traffic analysis to justify proposals
• a design brief and specification, including functional requirements
• a layout plan of the freeway mainline, interchanges and ESB (where applicable), including device layout and proposed signs and lines to accommodate ALR
• design drawings of freeway mainline, ramps and ESB (where applicable), including longitudinal and vertical alignment (concept / preliminary / detailed design, depending on the audit stage
RIGHT LANECLOSED
MERGE LEFT
Smart Freeways Operational Efficiency Audit Guidelines – March 2021
Document No: D20#550488 88
• plans of locations for LUMS gantries on the freeway and signs on each gantry, including mainline and entry ramp VSL signs - on the same plans as the direction signs, pavement markings and VMS signs, and
• other assumptions or information used in the determination of the need for LUMS and equipment layout.
The checklist for this audit component is included in Appendix A, Checklist 9: Checklist for LUMS.
12.2 Key principles The key principles for design of LUMS to ensure efficient and safe freeway operation are:
• To provide LUMS on sections of freeway meeting requirements in the Main Roads’ Provision Guidelines (2020) as part of a consistent route treatment to deliver incident and event management and / or support ALR.
• To design the locations of gantries according to Main Roads’ Supplement to Victoria’s design guide.
• To design the operating system to enable operators to safely open and close one or more lanes in sequence together with speed limit adjustment, and to provide integration with VMS messaging.
• For road users to see and understand the information being communicate to them, and be able to respond to the information as required.
12.3 Geometric layout Civil works may be required for implementation of LUMS, such as widening to accommodate LUMS infrastructure and / or lateral clearance to traffic lanes. Where LUMS is used to support operational strategies such as all lane running, civil works such as pavement strengthening, construction of ESBs and widening may be required to bring an existing pavement to a suitable standard for trafficking. See Sections 6.4.10 to 6.4.12 for further detail.
12.4 Equipment layout
12.4.1 Mounting structures
In freeway environments with heavy traffic, LUMS signs should be installed on overhead-mounted structures. This can include a variety of different types of structures, including purpose-built gantry / side-mounted cantilever structures, as well as existing structures such as bridges and overpasses. The structures allow the installation of one sign above each lane, including the ESL if it is to be used, for example, for roadworks or incident management.
When checking the mounting signs and structures, the following should be considered:
• Lane coverage with a sign above each mainline lane, including auxiliary lanes and inclusion of ESL, if appropriate.
• Mounting of LUMS signs over each lane to avoid obscuration by heavy vehicles. Note that signs mounted beside the freeway are inappropriate for this and other reasons.
• Sight distance to signs clear of visibility restrictions, including obscuration by bridges, VMS and direction signs.
Smart Freeways Operational Efficiency Audit Guidelines – March 2021
Document No: D20#550488 89
• Provision of tactical VMS on gantries according to VMS guidelines.
• Horizontal geometry and supporting structure locations, e.g. signs located on tight horizontal curves may suffer from the ‘parallax’ effect when viewed from a distance, giving the impression that the signs apply to different lanes.
• Vertical clearance for high vehicles appropriate for route use.
• Size, legibility and conspicuity of signs.
• Clear visibility within appropriate distances, e.g. if installed too high it will not be legible from short distances, however if installed too low it will not be visible from longer distances.
• Lateral clearance of structure legs, e.g. consider required area for errant vehicles to recover or shielding behind safety barriers.
• Using structures that span one carriageway or both carriageways, considering requirements for each direction of traffic, as well as height of signs with a horizontal girder relative to the freeway crossfall.
• Edges of LUMS signs should be positioned horizontal and vertical.
• The angle of signs relative to carriageway and direction of travel, consider longitudinal offset if using an existing mounting structure that is skewed (see Main Roads’ Supplement to Victoria’s design guide for LUMS).
12.4.2 Locations of LUMS structures
Static direction signs have the highest priority in Smart Freeway designs and should be positioned in the design first before considering the locations of LUMS structures or VMS. The typical design sequence for positioning of LUMS structures is:
• designing the locations of the direction signs
• designing the locations of LUMS within interchanges, and
• designing the locations of LUMS along the midblock sections between interchanges.
LUMS structures should be placed appropriately so that they do not interfere with the effectiveness of static directional signing or other signing for safety purposes, nor contribute to a safety hazard arising from information overload through excessive signing at any one location.
It is desirable to avoid installing static direction signs or VMS on a LUMS structure, due to the additional visual information workload placed on drivers. This should only be considered where there are geometric constraints (see Section 11.4.2) and not for purposes of reducing costs.
At interchanges, LUMS signs should generally be provided within the interchange downstream of an exit ramp to ensure that:
• road users have adequate warning to divert off the freeway in case of an incident downstream
• road users exiting the freeway know which lane is to be used to access the exit ramp, e.g. if a lane is closed due to an incident
• road users are clear about continuing on the freeway and the status of lanes through the interchange.
Smart Freeways Operational Efficiency Audit Guidelines – March 2021
Document No: D20#550488 90
At interchanges, LUMS signs should generally be provided upstream of an entry ramp to ensure that the speed limit shown on the ramp is appropriate for road users entering the mainline. LUMS signs should generally be provided downstream of an entry ramp, generally after the end of the merge, to ensure that entering road users understand the mainline speed and lane arrangements.
In checking requirements for the longitudinal spacing of LUMS, the design should be consistent with Victoria’s design guidelines for LUMS and VSL and the Main Roads’ Supplement.
It is advisable to ensure consistent route treatment along a Smart Freeway. LUMS may therefore need to extend beyond the section where warrants are met to ensure a consistent driver expectation along the route, or to connect with an adjacent system (see Main Roads’ Managed Freeways Provision Guidelines (2020) and Main Roads’ Supplement to Victoria’s guidance on lane use management and variable speed limits).
12.4.3 Additional design requirements
In addition to the specified longitudinal design requirements, the following may need to be considered when assessing the LUMS design:
• Sign face layout design accommodates a range of required displays:
– lane status elements (consider whether used in freeway or tunnel) – speed limit signs, and – displays for priority vehicle lanes (if priority facilities are incorporated).
• Sign display size designed to comply with the range of operating speeds.
• Signs installed above the centre of the lanes.
• Provision for maintenance and co-location of ESBs with gantries to enable maintenance access.
• Protection of equipment from vandalism (particularly if mounted on existing infrastructure).
• Signing for default speed limit when LUMS signs are faulty.
• VSL signs on freeway entry ramps within a LUMS environment.
12.4.4 Provision in tunnel environments
Tunnels represent a constrained road environment with restrictions due to vertical and horizontal alignment. The preferred lane control is providing integrated LUMS signs with VSL above the traffic lanes. This provides a continuous standard of lane control for road users along the route. However, existing tunnels, or tunnels with restricted height may need to use separate lane control signals (LCS) and side-mounted VSL signs.
The desirable spacing of LUMS signs (or VSL and LCS) in tunnels enables drivers to always see a sign / signal array. The spacing is also related to the legibility distance for sign / signal size, which may need to be reduced if there are constraints on vertical clearances.
For shorter tunnels, e.g. less than 500 metres or typical LUMS spacing in tunnels, or if the exit is clearly visible before entering the tunnel, there may be no requirement for LUMS signs or LCS / VSL signs in the tunnel itself but instead at appropriate locations either side. There are currently examples of short tunnels in Australia that are operational and do not have lane control, e.g. Jacana Tunnel (110 metre length) on Melbourne’s Western Ring Road.
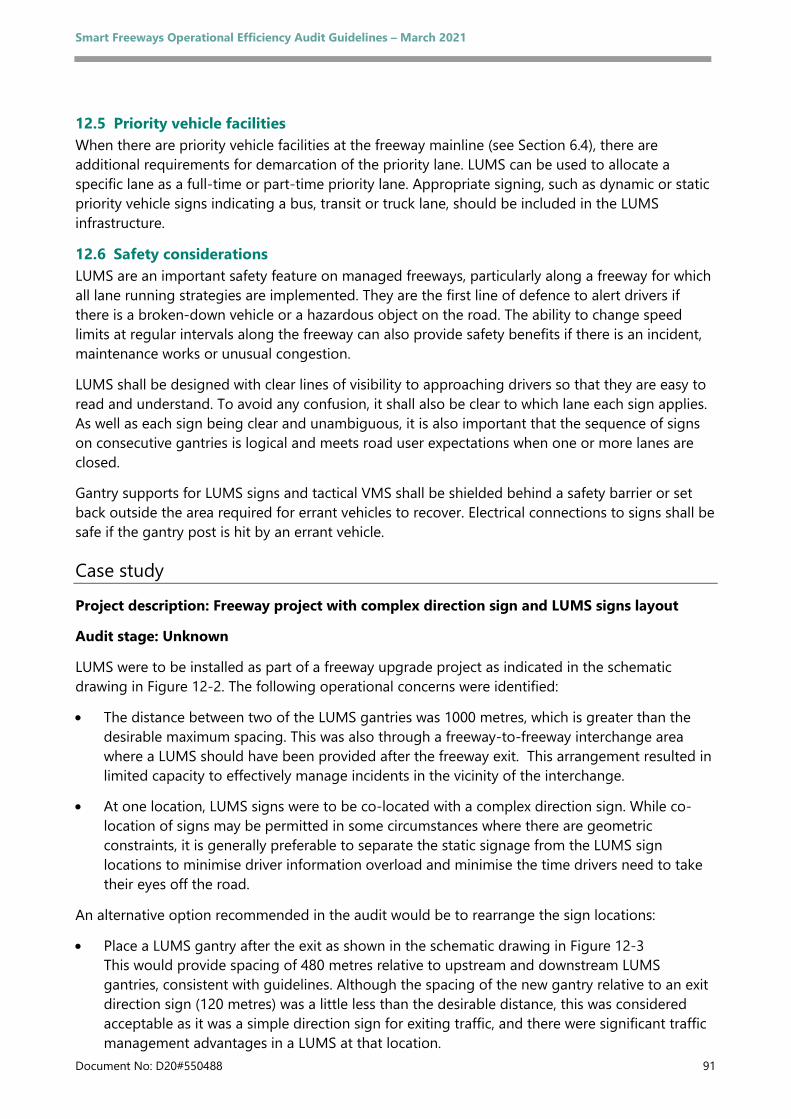
Smart Freeways Operational Efficiency Audit Guidelines – March 2021
Document No: D20#550488 91
12.5 Priority vehicle facilities When there are priority vehicle facilities at the freeway mainline (see Section 6.4), there are additional requirements for demarcation of the priority lane. LUMS can be used to allocate a specific lane as a full-time or part-time priority lane. Appropriate signing, such as dynamic or static priority vehicle signs indicating a bus, transit or truck lane, should be included in the LUMS infrastructure.
12.6 Safety considerations LUMS are an important safety feature on managed freeways, particularly along a freeway for which all lane running strategies are implemented. They are the first line of defence to alert drivers if there is a broken-down vehicle or a hazardous object on the road. The ability to change speed limits at regular intervals along the freeway can also provide safety benefits if there is an incident, maintenance works or unusual congestion.
LUMS shall be designed with clear lines of visibility to approaching drivers so that they are easy to read and understand. To avoid any confusion, it shall also be clear to which lane each sign applies. As well as each sign being clear and unambiguous, it is also important that the sequence of signs on consecutive gantries is logical and meets road user expectations when one or more lanes are closed.
Gantry supports for LUMS signs and tactical VMS shall be shielded behind a safety barrier or set back outside the area required for errant vehicles to recover. Electrical connections to signs shall be safe if the gantry post is hit by an errant vehicle.
Case study
Project description: Freeway project with complex direction sign and LUMS signs layout
Audit stage: Unknown
LUMS were to be installed as part of a freeway upgrade project as indicated in the schematic drawing in Figure 12-2. The following operational concerns were identified:
• The distance between two of the LUMS gantries was 1000 metres, which is greater than the desirable maximum spacing. This was also through a freeway-to-freeway interchange area where a LUMS should have been provided after the freeway exit. This arrangement resulted in limited capacity to effectively manage incidents in the vicinity of the interchange.
• At one location, LUMS signs were to be co-located with a complex direction sign. While co-location of signs may be permitted in some circumstances where there are geometric constraints, it is generally preferable to separate the static signage from the LUMS sign locations to minimise driver information overload and minimise the time drivers need to take their eyes off the road.
An alternative option recommended in the audit would be to rearrange the sign locations:
• Place a LUMS gantry after the exit as shown in the schematic drawing in Figure 12-3 This would provide spacing of 480 metres relative to upstream and downstream LUMS gantries, consistent with guidelines. Although the spacing of the new gantry relative to an exit direction sign (120 metres) was a little less than the desirable distance, this was considered acceptable as it was a simple direction sign for exiting traffic, and there were significant traffic management advantages in a LUMS at that location.

Smart Freeways Operational Efficiency Audit Guidelines – March 2021
Document No: D20#550488 92
• Separate the complex direction sign and the LUMS signs shown at the same location. Slight relocation of one of the LUMS gantries 40 metres closer to the ramp (within the 300 metre minimum) would also improve the design. This rearrangement, as shown in the schematic drawing in Figure 12-3 enables spacing of the direction sign and LUMS to be 245 metres, which is satisfactory, subject to other design constraints.
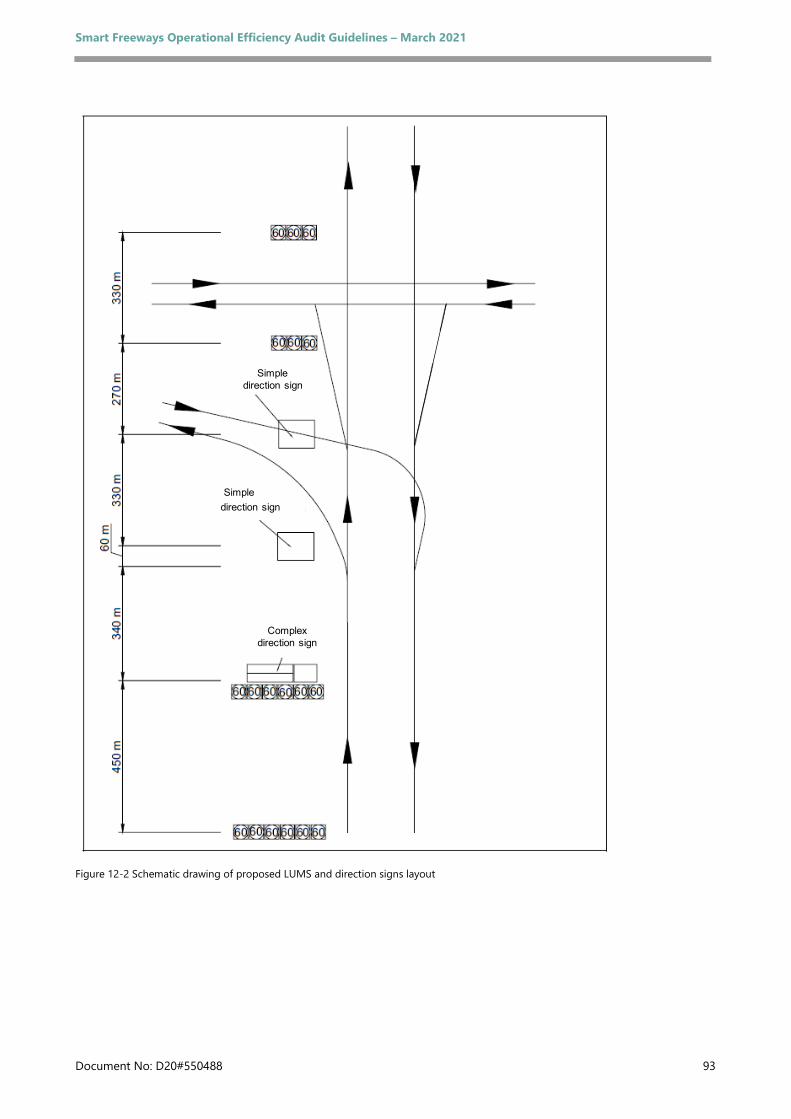
Smart Freeways Operational Efficiency Audit Guidelines – March 2021
Document No: D20#550488 93
Figure 12-2 Schematic drawing of proposed LUMS and direction signs layout
Complexdirection sign
direction signSimple
Simpledirection sign
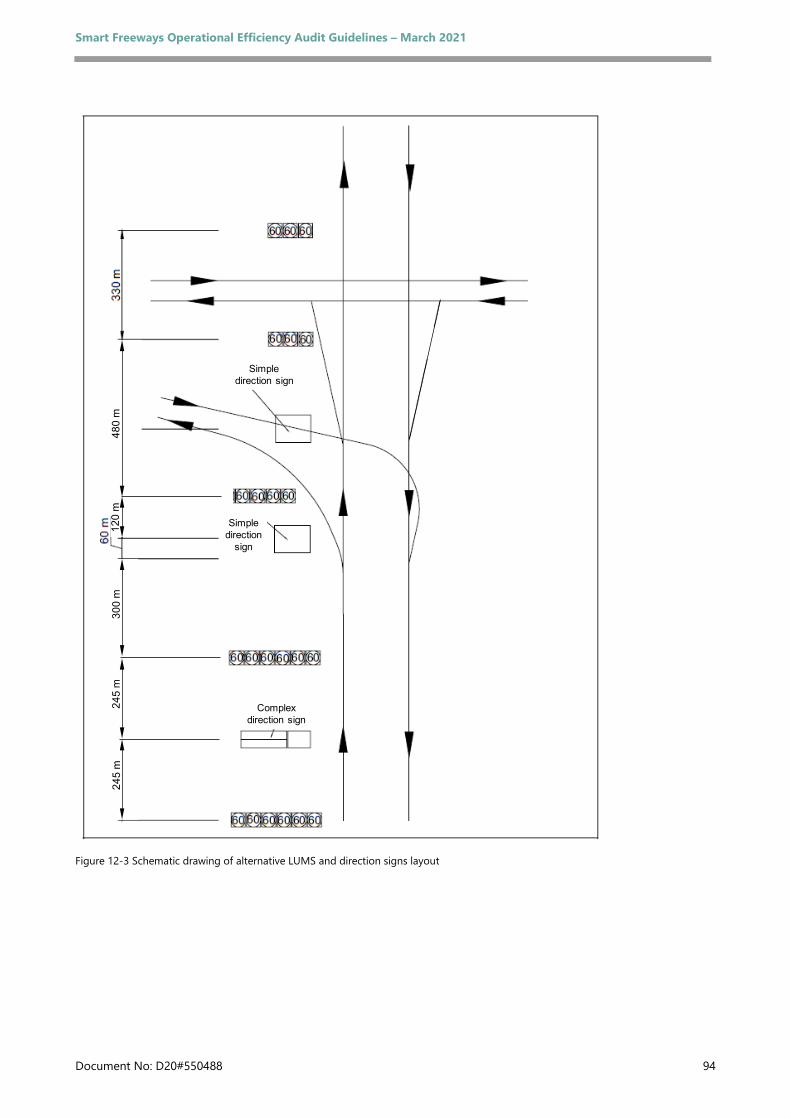
Smart Freeways Operational Efficiency Audit Guidelines – March 2021
Document No: D20#550488 94
Figure 12-3 Schematic drawing of alternative LUMS and direction signs layout
Complexdirection sign
Simpledirection sign
245
m24
5 m
300
m
Simpledirection
sign
120
m48
0 m
Smart Freeways Operational Efficiency Audit Guidelines – March 2021
Document No: D20#550488 95
13 Variable speed limits 13.1 Overview
13.1.1 Component description
Variable speed limits (VSL) are used to improve road safety by displaying appropriate speed limits for varying freeway and traffic conditions on electronic signs along or above the freeway. VSL may also be used in association with CRS to manage traffic flow.
The key applications of VSL are to control vehicle speeds during incidents, events and adverse weather, and to provide queue protection by slowing vehicles in advance of congestion due to high demand or an incident. In a Smart Freeway environment, VSL can also be used to support CRS to sustain maximum operational capacities. VSL can enable higher densities or mainline metering where demand is difficult to manage with ramp signals.
The design of VSL is related to the design of LUMS, as the VSL and LUMS signs are integrated into one system. VSL can also be applied as a stand-alone application.
Table 4.3 highlights the relevant ITS services delivered by VSL. This table should be used to identify the associate ITS technologies that are essential or useful for delivery of those services, and which should also be included in the project design and audit scope.
13.1.2 Audit objective
The key objective of this component is to confirm that project proposals relating to variable speed limits are appropriate for safe and efficient management of traffic speeds during congestion, incidents and events.
13.1.3 Audit inputs
Audit inputs for the VSL component may include:
• a business case (for the purpose of understanding the problem and project objectives, as well as for details such as proposed design year and staging of works)
• a design brief and specification, including functional requirements
• a layout plan of freeway mainline, interchanges and ESB (where applicable), including device layout
• design drawings of freeway mainline, ramps and ESB (where applicable), including longitudinal and vertical alignment (concept / preliminary / detailed design depending on the stage of audit)
• plans of locations for VSL signs on the freeway, including mainline and entry ramp - on the same plans as the direction signs, pavement markings and VMS
• other assumptions or information used in the determination of the need for VSL and equipment layout.
The checklist for this audit component is included in Appendix A, Checklist 10: Checklist for VSL..
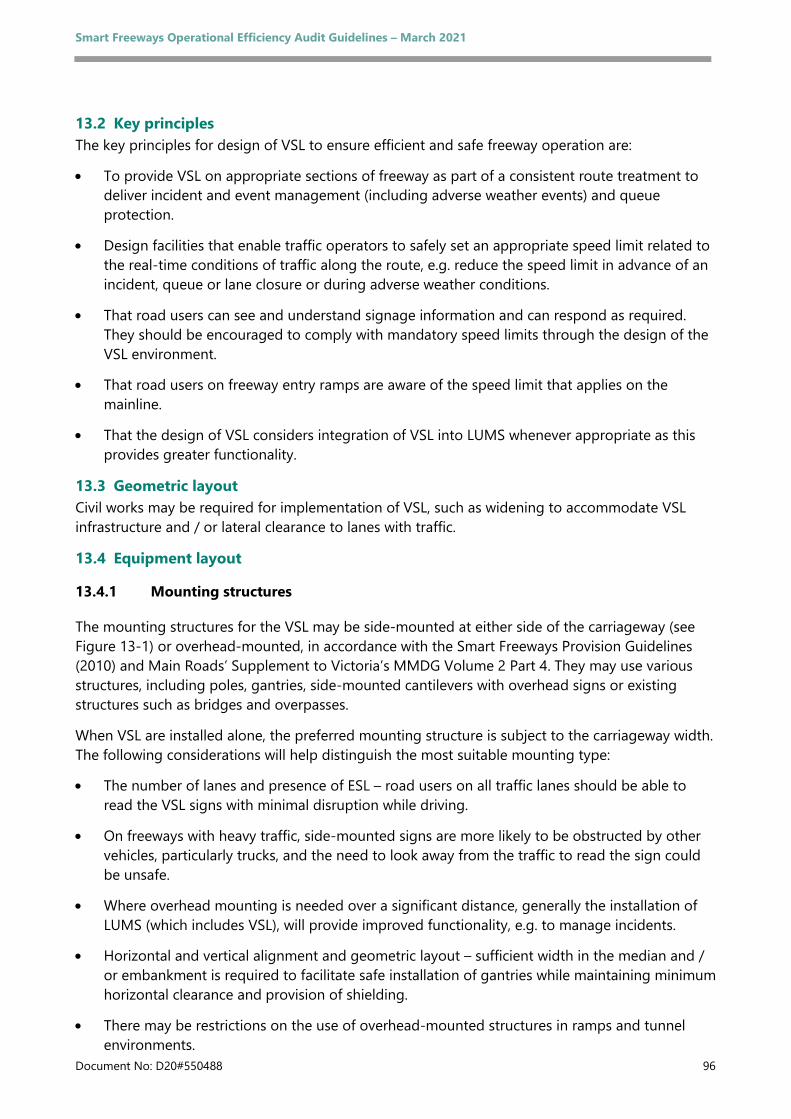
Smart Freeways Operational Efficiency Audit Guidelines – March 2021
Document No: D20#550488 96
13.2 Key principles The key principles for design of VSL to ensure efficient and safe freeway operation are:
• To provide VSL on appropriate sections of freeway as part of a consistent route treatment to deliver incident and event management (including adverse weather events) and queue protection.
• Design facilities that enable traffic operators to safely set an appropriate speed limit related to the real-time conditions of traffic along the route, e.g. reduce the speed limit in advance of an incident, queue or lane closure or during adverse weather conditions.
• That road users can see and understand signage information and can respond as required. They should be encouraged to comply with mandatory speed limits through the design of the VSL environment.
• That road users on freeway entry ramps are aware of the speed limit that applies on the mainline.
• That the design of VSL considers integration of VSL into LUMS whenever appropriate as this provides greater functionality.
13.3 Geometric layout Civil works may be required for implementation of VSL, such as widening to accommodate VSL infrastructure and / or lateral clearance to lanes with traffic.
13.4 Equipment layout
13.4.1 Mounting structures
The mounting structures for the VSL may be side-mounted at either side of the carriageway (see Figure 13-1) or overhead-mounted, in accordance with the Smart Freeways Provision Guidelines (2010) and Main Roads’ Supplement to Victoria’s MMDG Volume 2 Part 4. They may use various structures, including poles, gantries, side-mounted cantilevers with overhead signs or existing structures such as bridges and overpasses.
When VSL are installed alone, the preferred mounting structure is subject to the carriageway width. The following considerations will help distinguish the most suitable mounting type:
• The number of lanes and presence of ESL – road users on all traffic lanes should be able to read the VSL signs with minimal disruption while driving.
• On freeways with heavy traffic, side-mounted signs are more likely to be obstructed by other vehicles, particularly trucks, and the need to look away from the traffic to read the sign could be unsafe.
• Where overhead mounting is needed over a significant distance, generally the installation of LUMS (which includes VSL), will provide improved functionality, e.g. to manage incidents.
• Horizontal and vertical alignment and geometric layout – sufficient width in the median and / or embankment is required to facilitate safe installation of gantries while maintaining minimum horizontal clearance and provision of shielding.
• There may be restrictions on the use of overhead-mounted structures in ramps and tunnel environments.
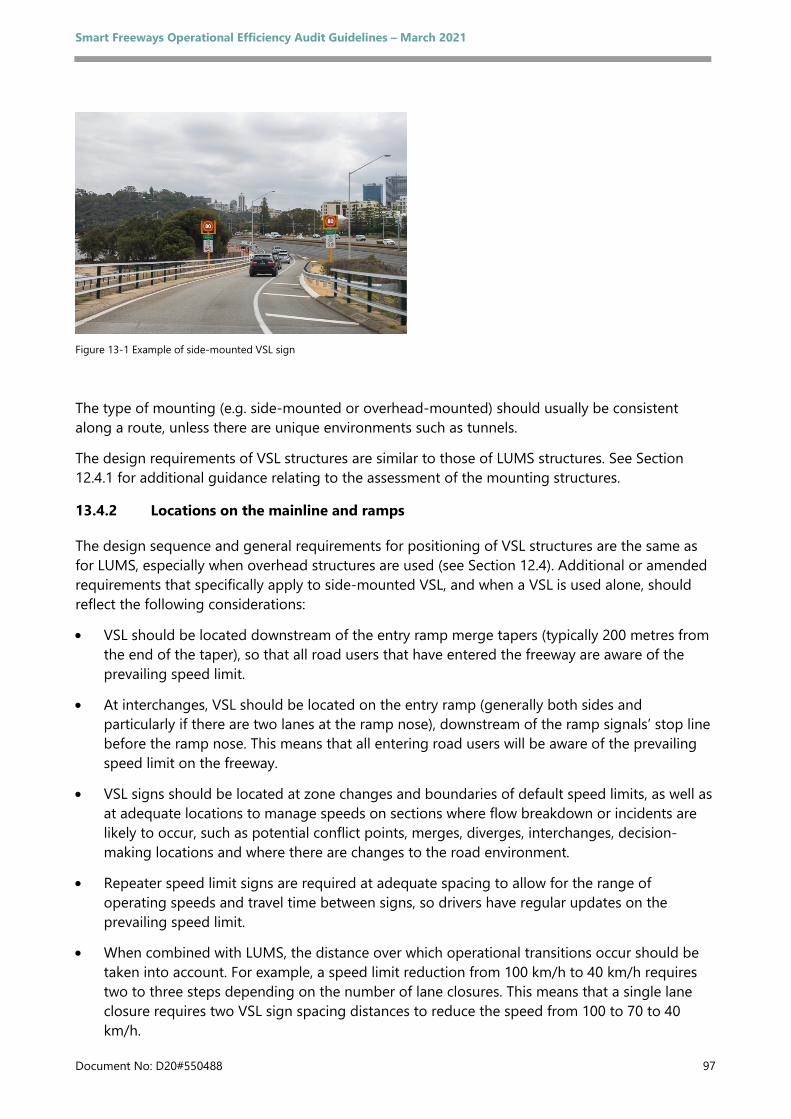
Smart Freeways Operational Efficiency Audit Guidelines – March 2021
Document No: D20#550488 97
Figure 13-1 Example of side-mounted VSL sign
The type of mounting (e.g. side-mounted or overhead-mounted) should usually be consistent along a route, unless there are unique environments such as tunnels.
The design requirements of VSL structures are similar to those of LUMS structures. See Section 12.4.1 for additional guidance relating to the assessment of the mounting structures.
13.4.2 Locations on the mainline and ramps
The design sequence and general requirements for positioning of VSL structures are the same as for LUMS, especially when overhead structures are used (see Section 12.4). Additional or amended requirements that specifically apply to side-mounted VSL, and when a VSL is used alone, should reflect the following considerations:
• VSL should be located downstream of the entry ramp merge tapers (typically 200 metres from the end of the taper), so that all road users that have entered the freeway are aware of the prevailing speed limit.
• At interchanges, VSL should be located on the entry ramp (generally both sides and particularly if there are two lanes at the ramp nose), downstream of the ramp signals’ stop line before the ramp nose. This means that all entering road users will be aware of the prevailing speed limit on the freeway.
• VSL signs should be located at zone changes and boundaries of default speed limits, as well as at adequate locations to manage speeds on sections where flow breakdown or incidents are likely to occur, such as potential conflict points, merges, diverges, interchanges, decision-making locations and where there are changes to the road environment.
• Repeater speed limit signs are required at adequate spacing to allow for the range of operating speeds and travel time between signs, so drivers have regular updates on the prevailing speed limit.
• When combined with LUMS, the distance over which operational transitions occur should be taken into account. For example, a speed limit reduction from 100 km/h to 40 km/h requires two to three steps depending on the number of lane closures. This means that a single lane closure requires two VSL sign spacing distances to reduce the speed from 100 to 70 to 40 km/h.
Smart Freeways Operational Efficiency Audit Guidelines – March 2021
Document No: D20#550488 98
• When combined with LUMS, consideration should be given to implications if there is a sign failure, which means lane or speed reductions have to take place over a much greater distance.
• See Smart Freeways Provision Guidelines (Main Roads 2020) and Main Roads’ Supplement to Victoria’s MMDG Volume 2 Part 4 (2020) for further guidance on appropriate spacing, lane use management, variable speed limits and traveller information. There may be particular constraints that affect spacing at a location, however in general there should be a consistent spacing along the route.
• Traffic entering the freeway should have advance warning of the mainline operating speed limit. VSL signs are recommended at all entry ramps of the freeway, including freeway-to-freeway ramps. VSL signs should be located downstream of the ramp signals on the left or both sides of the carriageway if there are two lanes at the nose.
13.4.3 Additional design requirements
In addition to the points in Section 12.4.3 the following requirements should be considered when reviewing the VSL design:
• The sign layout should comply with Main Roads’ guidelines and the sign size should accommodate the range of speed limits relevant to the section of freeway.
• Static speed limit signs should be placed before the start of a VSL zone, with appropriate spacing for the VSL signs, and at locations where there is a change in the default speed limit. These signs show the default speed limit in case of a sign ‘black out’ or system failure.
• Static speed limit signs should also be placed after the end of the VSL zone, with appropriate spacing suitable for VSL signs, otherwise the last VSL sign continues to apply downstream.
• On exit ramps, appropriate static speed limit signs shall be provided on the approach to the arterial road intersection.
13.4.4 Provision in tunnel environments
It may be necessary to use side-mounted VSL signs in tunnel environments due to height restrictions. Additional considerations are detailed in Section 12.4.4
13.5 Safety considerations VSL are an important safety feature enabling the operators to change speed limits at regular intervals along the freeway if there is an incident, maintenance works, unusual congestion or adverse weather conditions. Lower speeds are important in unusual conditions to improve road user awareness of the situation and to reduce braking distances for any subsequent need for drivers to slow or stop.
VSL signs need to be located with clear lines of visibility for approaching drivers so they are easy to read and understand.
Posts or gantry supports for VSL signs shall be shielded behind a safety barrier or set back outside the area required for errant vehicles to recover. Electrical connections to signs shall be safe if the post is hit by an errant vehicle.
Smart Freeways Operational Efficiency Audit Guidelines – March 2021
Document No: D20#550488 99
Case study
Project description: Freeway upgrade proposal based on a project in another jurisdiction
Audit stage: ‘Select’ phase of the RO&DS process
The freeway upgrade project involved providing an added lane at an entry ramp by using the ESL to form an auxiliary lane, where currently a significant traffic flow entered the freeway causing extensive merging and flow breakdown problems on the mainline.
The auxiliary lane was needed to provide four lanes on the mainline between four interchanges, i.e. until downstream mainline flows reduced to a manageable level for the existing three-lane carriageway.
When the auxiliary lane was operating it was proposed to reduce the speed limit from 100 km/h to 80 km/h with VSL signs. The lower operating speed was considered necessary due to restricted stopping sight distance across the inside of curves and the safety concerns of operating the freeway at 100 km/h without an ESL. Side-mounted VSL signs were proposed for managing vehicle speeds.
An audit of the proposals recommended that the side-mounted VSL signs be replaced with LUMS signs for the following reasons:
• Overhead VSL signs would be more visible to all road users on a four-lane carriageway with heavy traffic, particularly as there was a high proportion of trucks that could obscure visibility of side-mounted signs.
• LUMS would provide improved road user advice and traffic management over a significant distance, and when the auxiliary lane was open to traffic.
• LUMS would provide improved safety and traffic management during incident management or maintenance activities.
Smart Freeways Operational Efficiency Audit Guidelines – March 2021
Document No: D20#550488 100
14 Vehicle detection systems 14.1 Overview
14.1.1 Component description
Collection and analyses of real-time data of the traffic flow characteristics of the road network is the basis for monitoring, control and fine-tuning of the freeway operation. The vehicle detection system (VDS) data is collected by vehicle detectors and includes volume, speed and occupancy (density) on a lane-by-lane basis.
Other traffic data, such as vehicle classifications, can also be collected as required for performance or system evaluations as well as design.
The data collection enables the traffic operator to identify problems and manage the freeway traffic flow. The data is the primary input for the control mechanisms to optimise the mainline traffic flow through CRS dynamic algorithms, operation of VSL signs and LUMS, travel-time and traffic condition calculation algorithms and automated incident detection (AID) systems.
In addition to monitoring and control of the network, the real-time data can also be provided to third parties for incorporation in commercial applications such as satellite navigation systems and online traveller information.
The archived data can also be used for secondary purposes, such as considering historical traffic volumes, priority vehicle facilities, enforcement, asset management, freeway performance monitoring and evaluation for operational performance tuning and strategic reporting.
Table 4.3 highlights ITS services delivered by vehicle detectors. This table should be used to identify the associated ITS technologies that are essential or useful for delivery of those services, and which should also be included in the project design and audit scope.
14.1.2 Audit objective
The key objective of this component is to confirm project proposals for detector locations and traffic data collection for real-time and historical information are appropriate for traffic management and control systems, traveller information, safety, e.g. back of queue protection, and performance evaluation.
14.1.3 Audit inputs
Audit inputs for the traffic data collection component may include:
• a business case (for the purpose of understanding the problem and project objectives, as well as for details such as proposed design year and staging of works)
• a design brief and specification, including functional requirements
• layout plan of freeway mainline, interchanges and ESB (where applicable), including device layout
Smart Freeways Operational Efficiency Audit Guidelines – March 2021
Document No: D20#550488 101
• design drawings of freeway mainline, ramps and ESB (where applicable), including the VDS locations, lane and other pavement markings, LUMS, VSL, VMS, etc., longitudinal and vertical alignment (concept / preliminary / detailed design depending on the stage of audit)
• performance information or specifications for the proposed detectors for CRS operation system requirements and other system requirements such as AID, and
• other assumptions or information used in the determination of the need for traffic data collection and equipment layout.
The checklist for this audit component is included in Appendix A, Checklist 11: Checklist for Vehicle Detection Systems.
14.2 Key principles The backbone of Smart Freeway operations is the real-time collection, analysis and management of accurate data on traffic flow characteristics and network conditions. Smart Freeway requirements for real-time data collection are of a much higher level of accuracy and availability than that available in the past for operations and performance reporting.
The key principles for design of traffic data collection systems to ensure efficient freeway operation are:
• To collect real-time traffic data that is accurate and reliable for all freeways, to assist with network planning and real-time operations.
• To provide complete coverage on Smart Freeways, including mainline, entry ramps and exit ramps, for traffic control and mainline flow optimisation, to prevent flow breakdown with CRS and allow calculation of travel time information. Other data may be needed for incident detection and management, and operation of facilities for priority vehicles.
• To provide facilities at appropriate locations on unmanaged freeways to support network performance monitoring and planning for Smart Freeway operations.
• As far as is feasible, to collect traffic data for the adjacent network required to support operation of the Smart Freeway section, which may include routes outside the project area (e.g. for provision of traveller information).
14.3 Mainline flow optimisation Accurate, reliable real-time traffic data that helps an understanding of how the network is operating is needed to optimise mainline traffic flow through freeway network control and management. Traffic conditions are particularly dynamic at locations where the geometry of the road network changes, such as at interchanges, merge areas, lane drops, steep upgrades or tight curves. Information on the traffic flow characteristics at these locations is used as the primary input for the operation of the Smart Freeway control system. Collected data is used to manage the occupancy so inflow can be adjusted through the CRS.
Early detection of incidents and timely response can significantly reduce the impact on traffic flow. Booz Allen Hamilton (2003) noted that saving one minute of incident time during the peak period can save five minutes of associated congestion. Traffic data that supports early activation of LUMS and VSL can improve the situation even further through protection of the incident location and the back of the queue.
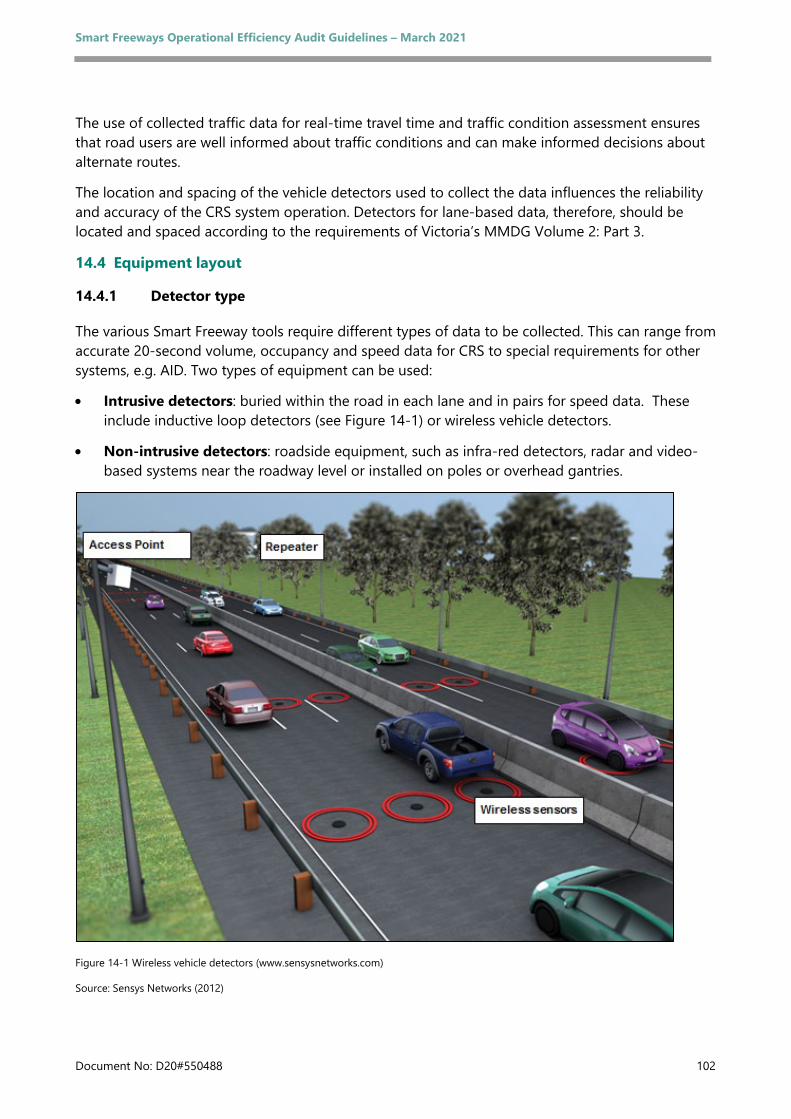
Smart Freeways Operational Efficiency Audit Guidelines – March 2021
Document No: D20#550488 102
The use of collected traffic data for real-time travel time and traffic condition assessment ensures that road users are well informed about traffic conditions and can make informed decisions about alternate routes.
The location and spacing of the vehicle detectors used to collect the data influences the reliability and accuracy of the CRS system operation. Detectors for lane-based data, therefore, should be located and spaced according to the requirements of Victoria’s MMDG Volume 2: Part 3.
14.4 Equipment layout
14.4.1 Detector type
The various Smart Freeway tools require different types of data to be collected. This can range from accurate 20-second volume, occupancy and speed data for CRS to special requirements for other systems, e.g. AID. Two types of equipment can be used:
• Intrusive detectors: buried within the road in each lane and in pairs for speed data. These include inductive loop detectors (see Figure 14-1) or wireless vehicle detectors.
• Non-intrusive detectors: roadside equipment, such as infra-red detectors, radar and video-based systems near the roadway level or installed on poles or overhead gantries.
Figure 14-1 Wireless vehicle detectors (www.sensysnetworks.com)
Source: Sensys Networks (2012)
Smart Freeways Operational Efficiency Audit Guidelines – March 2021
Document No: D20#550488 103
Detector technology with appropriate accuracy and suitability for the system operations is essential. Generally, radar and video-based systems do not provide sufficiently accurate data needed for sophisticated CRS operations.
14.4.2 Locations on mainline and ramps
Correct positioning of vehicle detectors on the mainline as well as on the entry and exit ramps is vital to ensure that the data is available where required, and to best suit the optimisation of traffic flow by the control algorithms. Positioning of the detectors for a project should only be done after the roadway layout and geometry are finalised, such as road widening (if any), entry and exit ramp layouts and nose positions, ends of merges, added lanes, tapers, lane reductions etc.
General requirements for the locations are described in Victoria’s MMDG Volume 2: Part 3, which are appropriate for control algorithms as well as travel time calculations and performance evaluation.
Auditors need to review how appropriate detection arrangements are relative to design guidelines including the mainline, entry ramps and exit ramps, as well as within ESBs to detect vehicles using the bay.
Auditors should consider that for freeways not requiring higher-order Smart Freeway ITS, i.e. when detectors are initially being installed for counting purposes, the VDS locations shall be consistent with future retrofitting and upgrading to CRS operations as indicated in Main Roads’ Provision Guidelines (Main Roads 2020). This includes the mainline and both arterial-to-freeway ramps as well as freeway-to-freeway ramps. Auditors should be aware that where CRS will not be implemented at this stage, entry ramp detectors should be located as close as possible to the future stop line detector location. This may influence the location of the detectors on the adjacent mainline.
Auditors need to review how appropriate detection arrangements are at the entry ramps, in accordance with Victoria’s MMDG Volume 2: Part 3.
Auditors also need to review detector locations on the exit ramps for historical performance evaluation, as well as for system operation to manage queue lengths if there is likely to be an overflow onto the freeway (see Sections 8 and 0). Inadequate capacity of the interchange intersection or exit ramp might cause queues extending back to the freeway mainline.
Where the route only meets guidelines for foundation-level ITS, the location of detectors for counting purposes on the mainline and on the ramps should be considered based on the potential for future use as part of a Smart Freeway.
14.4.3 Additional design requirements
The reliability and accuracy of collected data is critical for operation of a Smart Freeway. The data will drive control system algorithms necessary to ensure the freeway is operating at optimum productivity. Hence, the product selection and maintenance regime shall be of a high standard and meet Main Roads’ device specifications. Correct installation of the infrastructure also influences the accuracy of the vehicle detection, for example, sensors should be positioned in the centre of each lane with correct spacing between pairs, according to installation guidelines.
Smart Freeways Operational Efficiency Audit Guidelines – March 2021
Document No: D20#550488 104
Co-location of assets, for example the vehicle detectors and the LUMS / VSL or VMS infrastructure, is recommended to minimise costs and optimise maintenance activities. By positioning different ITS devices in the proximity of each other, multiple uses of cabinets and power and communication infrastructure can be achieved.
Gantries can also be used to install multiple devices, for example the access points of wireless detectors. When aligning the vehicle detectors with the LUMS / VSL infrastructure, positioning of the detectors just downstream of the gantries should be considered, rather than positioning them upstream. This can help to manage variable speed limits using the VSL signs on the gantry, relative to downstream traffic conditions during the development or reduction of congestion.
The locations of access points AP / repeater points (RP) for wireless detectors should also be considered.
Case study
Project description:
Kwinana Freeway, Roe Highway to Beeliar Drive (concept development)
Third Lane Extension and Intelligent Transport System
Audit stage: ‘Select’ phase of the RO&DS process
In the early stages of investigating the upgrade of a section of Kwinana Freeway south of Roe Highway, preliminary concept plans were developed showing details of vehicle detectors and other ITS devices.
An audit of these concept designs indicated several concerns such as:
• Some detectors could have been better located relative to the end-of-ramp merges. In some instances, the detector location was shown a significant distance downstream of the end of the merging area. Where possible, a location at the end of the merge, typically 330 metres downstream of the nose for a single-lane merge (in accordance with Main Roads’ Supplement (2020) to Victoria’s MMDG Volume 2: Part 3), is more effective for mainline flow management and ramp signal control as it is closer to the merge area where turbulence and capacity drop occurs.
• Detector locations were not provided at some exit ramps (see Figure 14-2). These detectors are important for traffic counting purposes, traffic studies and historical analysis of data as well as consideration of future proposals. Detectors at this location are required as shown in the guidelines for future retro fitting.
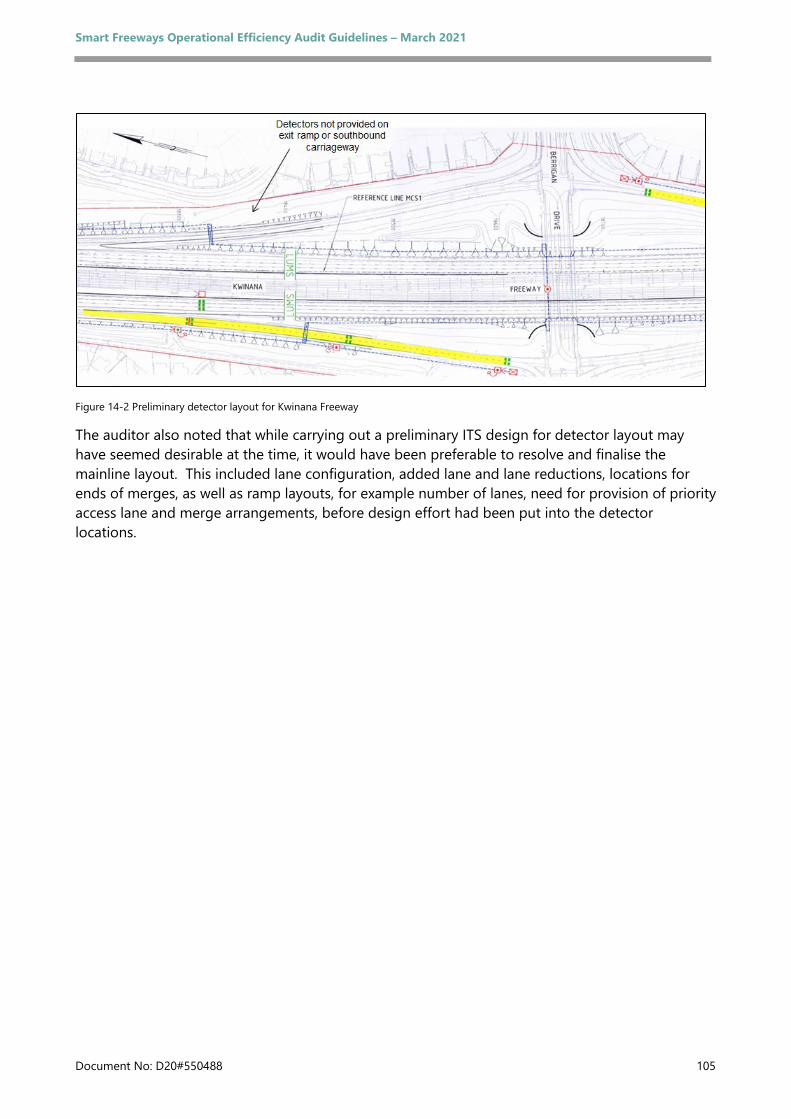
Smart Freeways Operational Efficiency Audit Guidelines – March 2021
Document No: D20#550488 105
Figure 14-2 Preliminary detector layout for Kwinana Freeway
The auditor also noted that while carrying out a preliminary ITS design for detector layout may have seemed desirable at the time, it would have been preferable to resolve and finalise the mainline layout. This included lane configuration, added lane and lane reductions, locations for ends of merges, as well as ramp layouts, for example number of lanes, need for provision of priority access lane and merge arrangements, before design effort had been put into the detector locations.
Smart Freeways Operational Efficiency Audit Guidelines – March 2021
Document No: D20#550488 106
15 CCTV cameras 15.1 Overview
15.1.1 Component description
Closed circuit television (CCTV) cameras with pan, tilt and zoom (PTZ) capability are used for surveillance of the network, particularly for verifying incidents and managing unusual conditions. They provide vision of the real-time traffic conditions and activities on the road network, and primarily assist operators with incident management as well as providing visual support for the traffic data in optimisation activities.
CCTV located on the freeway can also provide the following services:
• monitoring and fine tuning CRS operations
• verifying information displayed on roadside electronic signs, e.g. LUMS and VMS signs, and
• verifying an incident with an AID system, e.g. radar or fixed CCTV cameras in conjunction with a motion detection algorithm.
CCTV on the arterial road network may be necessary to help assess queue lengths and conditions on the approach routes to the freeway for incident management, as well as to support the operation of control systems such as CRS.
The CCTV images are monitored by the traffic operators in the RNOC and may also be shared with external stakeholders for incident and emergency management, for example police, and public transport management, such as the Public Transport Authority (PTA).
Table 4.3 highlights the relevant ITS services supported by CCTV. This table should be used to identify ITS technologies essential or useful for delivery of those services, and which should therefore also be included in the project design and audit scope.
15.1.2 Audit objective
The key objective of this component is to confirm that the project proposals relating to CCTV are appropriate for monitoring traffic and managing incidents.
15.1.3 Audit inputs
Audit inputs for the CCTV component may include:
• a business case (for the purpose of understanding the problem and project objectives, as well as for details such as staging of works)
• a design brief and specification, including functional requirements
• a layout plan of freeway mainline, interchanges and ESB (where applicable), including device layout
Smart Freeways Operational Efficiency Audit Guidelines – March 2021
Document No: D20#550488 107
• CCTV design drawings on layouts of freeway mainline, ramps, VDS and ESB (where applicable), including longitudinal and vertical alignment (concept / preliminary / detailed design depending on the stage of audit), and
• other assumptions or information used in the determination of the need for CCTV and equipment layout.
The checklist for this audit component is included in Appendix A, Checklist 12: Checklist for CCTV Cameras.
15.2 Key principles The key principles for design of CCTV to ensure efficient and safe freeway operation are:
• To provide facilities to monitor traffic and help detect / verify incidents.
• To support incident management decisions, provide real-time visual support for confirming traffic data and control optimisation activities, and to assist network operations planning.
• To provide full and unrestricted coverage of all freeways.
• To provide overlapping coverage at critical locations for optimal management of the Smart Freeway network and to cater for redundancy in the case of equipment failure, (essential for safe operation of ALR, sections with heavy traffic or complex sections of the network).
• To position cameras at interchanges to support CRS operation e.g. provide coverage of the ramp, arterial road approaches and the mainline merge area.
To optimise incident management, additional cameras may also be required on the arterial road network that might affect or be affected by the Smart Freeway operation, together with road sections that are key destinations for traffic on the freeway.
15.3 Equipment layout
15.3.1 Locations on mainline and ramps
The location and spacing of CCTV cameras is dependent on many aspects, including presence of interchanges, topography, road geometry and alignment and the control for which the CCTV is intended.
Auditors should be aware that optimal management of the network for incident management may require full overlapping coverage in some areas of the freeway (see Smart Freeway Provision Guidelines) and the ramps. Overlapping coverage, for example full coverage of all parts of the road by two cameras, as illustrated in Figure 15-1, can increase timeliness of incident detection and enable incident monitoring from multiple directions to allow for camera failure.
Full coverage provides an unobstructed view of the full width of the roadway, including:
• all mainline lanes, including ESL
• all lanes at interchanges, including freeway-to-freeway links
• full length of entry ramps with ramp signals
• at arterial road approaches to entry ramps with ramp signals, particularly the left- and right-turn lanes for ramps with inadequate ramp queue storage
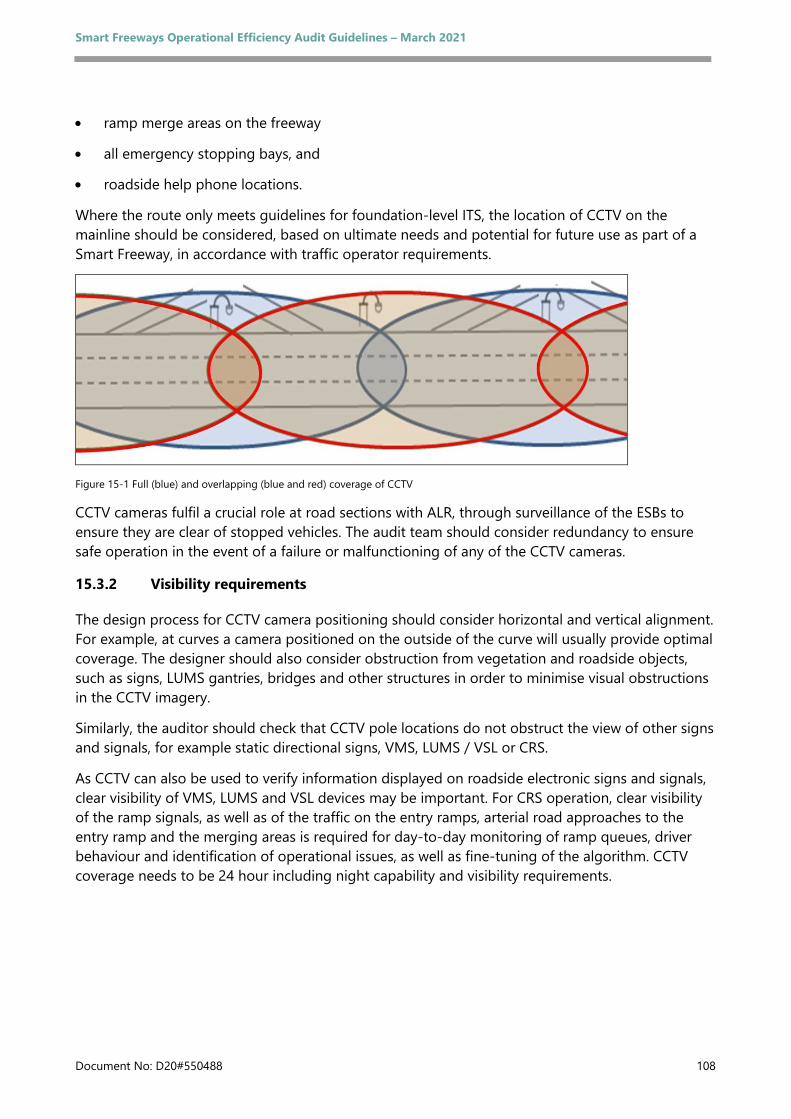
Smart Freeways Operational Efficiency Audit Guidelines – March 2021
Document No: D20#550488 108
• ramp merge areas on the freeway
• all emergency stopping bays, and
• roadside help phone locations.
Where the route only meets guidelines for foundation-level ITS, the location of CCTV on the mainline should be considered, based on ultimate needs and potential for future use as part of a Smart Freeway, in accordance with traffic operator requirements.
Figure 15-1 Full (blue) and overlapping (blue and red) coverage of CCTV
CCTV cameras fulfil a crucial role at road sections with ALR, through surveillance of the ESBs to ensure they are clear of stopped vehicles. The audit team should consider redundancy to ensure safe operation in the event of a failure or malfunctioning of any of the CCTV cameras.
15.3.2 Visibility requirements
The design process for CCTV camera positioning should consider horizontal and vertical alignment. For example, at curves a camera positioned on the outside of the curve will usually provide optimal coverage. The designer should also consider obstruction from vegetation and roadside objects, such as signs, LUMS gantries, bridges and other structures in order to minimise visual obstructions in the CCTV imagery.
Similarly, the auditor should check that CCTV pole locations do not obstruct the view of other signs and signals, for example static directional signs, VMS, LUMS / VSL or CRS.
As CCTV can also be used to verify information displayed on roadside electronic signs and signals, clear visibility of VMS, LUMS and VSL devices may be important. For CRS operation, clear visibility of the ramp signals, as well as of the traffic on the entry ramps, arterial road approaches to the entry ramp and the merging areas is required for day-to-day monitoring of ramp queues, driver behaviour and identification of operational issues, as well as fine-tuning of the algorithm. CCTV coverage needs to be 24 hour including night capability and visibility requirements.
Smart Freeways Operational Efficiency Audit Guidelines – March 2021
Document No: D20#550488 109
15.3.3 Mounting structures
When assessing the mounting structures of CCTV, the following should be considered:
• ensuring a multi-directional view
• providing a secure and stable platform for the cameras
• laterally clearing camera poles from the traffic lanes including the required area for errant vehicles to recover or shielding behind safety barriers
• protecting cameras from vandalism, and
• providing safe access to camera poles and associated roadside equipment by maintenance vehicles and personnel and other maintenance requirements.
15.3.4 Provision in tunnel environments
The auditor should check appropriate locations and positioning in tunnels, which are a constrained road environment with restrictions due to vertical and horizontal alignment and specific safety requirements. Separate in-tunnel CCTV cameras are generally installed with a motion detection algorithm, as part of an AID system. These are usually fixed cameras positioned at short intervals to ensure any stopped or wrong-way vehicle, debris or other obstacle is rapidly detected.
Case study
Project description: Freeway ramp signals and CCTV design
Audit stage: ‘Select’ phase of the RO&DS process
A CCTV camera was proposed to monitor the ramp signalling operation provisions with PTZ cameras to be placed near the ramp signal pole, as shown in Figure 15-2.
The positioning of the CCTV camera near the stop line provides good coverage of the entry ramp and freeway merge area. However, it was unclear from the design if it would also provide the traffic operator with a good view of the arterial road approaches.
It was recommended to have the CCTV camera placed at the interchange near the ramp entrance to improve the coverage of the three areas: arterial road, entry ramp and merge area. CCTV at this location will improve the visibility of the potential queues on the arterial road, which is expected to be a critical operational issue of CRS operation at this short ramp with inadequate storage.
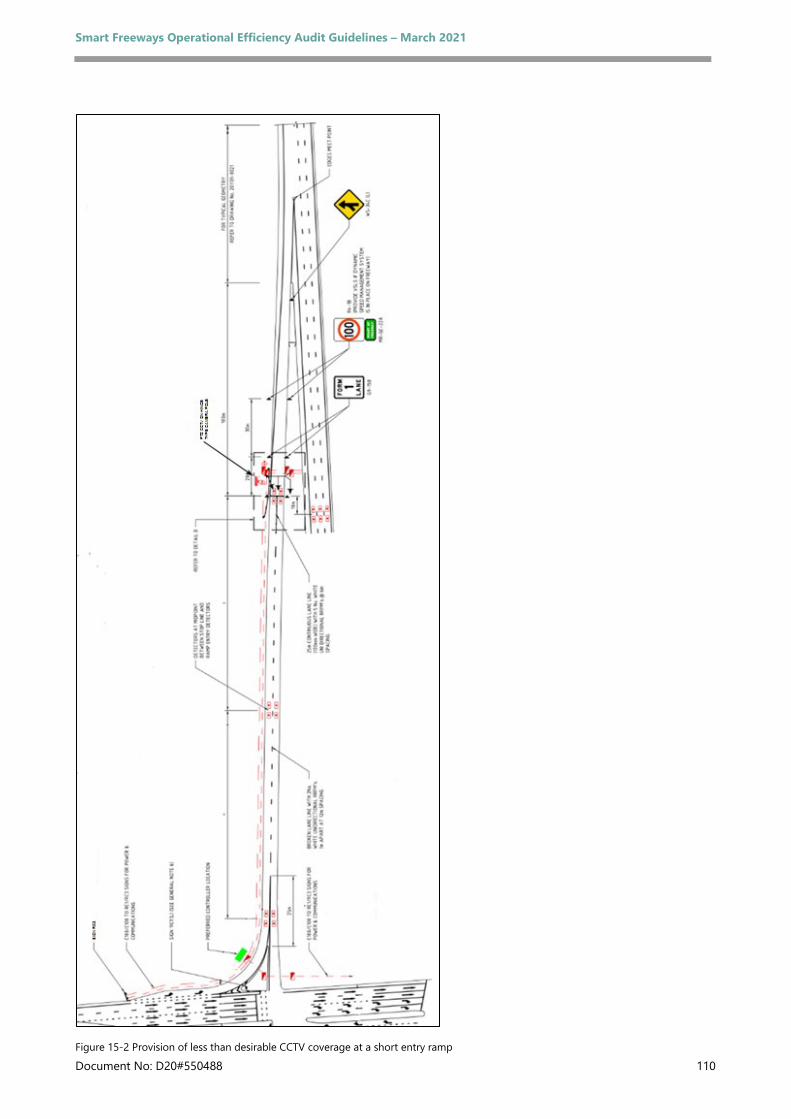
Smart Freeways Operational Efficiency Audit Guidelines – March 2021
Document No: D20#550488 110
Figure 15-2 Provision of less than desirable CCTV coverage at a short entry ramp
Smart Freeways Operational Efficiency Audit Guidelines – March 2021
Document No: D20#550488 111
16 Emergency stopping bays and roadside help phones
16.1 Overview
16.1.1 Component description
Emergency stopping bays (ESB) and roadside help phones facilitate road user safety and security by providing road users with a pull-off area clear of traffic lanes, and a means of communication to Main Roads in the event of a breakdown, crash, or other incident, for which assistance is required. They are provided to reduce the time lag between an incident occurring and the time of receipt of assistance.
ESBs and roadside help phones support incident detection and response and thereby contribute to increased freeway efficiency and safety. For example, help phones mean that the risk of further incidents is reduced through prompt removal of disabled vehicles and other hazards from the carriageway.
When a call is initiated at a roadside help phone site, the phone automatically calls the phone number unique to that site. At Main Roads these calls are identified as priority calls through the Customer Information Centres (CIC), and the location of the phone is automatically displayed on the screen through its ID number and pillar location. The CIC will alert relevant internal stakeholders, including traffic operators, as well as emergency services and towing services as required.
16.1.2 Audit objective
The key objective of this component is to confirm that project proposals relating to ESBs and roadside help phones are appropriate to ensure road user safety and security, and for management of incidents.
16.1.3 Audit inputs
Audit inputs for the ESB and roadside help phones component may include:
• a business case (for the purpose of understanding the problem and project objectives, as well as for details such as staging of works)
• a design brief and specification, including functional requirements
• a layout plan of freeway mainline, interchanges and ESB, including the location (including vertical and longitudinal alignments) of ESBs and roadside help phones, supporting advance and positioning signs as well as signs within the ESB
• other assumptions or information used to determine the need for ESBs and roadside help phones and equipment layout.
The checklist for this audit component is included in Appendix A, Checklist 13: Checklist for Emergency Stopping Bays and Roadside Help Phones.
Smart Freeways Operational Efficiency Audit Guidelines – March 2021
Document No: D20#550488 112
16.2 Key principles Main Roads specifies that new roadside help phones shall only be installed in ESBs with safe pull-off areas for disabled vehicles. All ESBs shall have a roadside help phone.
16.3 Equipment layout
16.3.1 Mainline locations
Roadside help phones shall be provided at all ESBs located according to Main Roads’ Guideline for Emergency Stopping Bays and Roadside Help Phones (Main Roads 2018). Existing roadside help phones shall be reviewed according to these guidelines.
The auditor may need to consider several factors related to the positioning of the ESB and roadside help phones, including:
• Suitable placement between freeway interchanges at spacing consistent with guidelines to provide a reasonable and safe walking distance along the freeway. To the best extent possible, the time drivers are exposed to the potential hazard of high-speed traffic should be minimised.
• Closer spacing, as required on ALR freeway sections compared with ESL sections.
• Sites selected on only the left side of the road, as the location of roadside help phones should not encourage unsafe pedestrian movement across the freeway.
• The roadside help phone position within the ESB, which should be consistent with the Main Roads’ guideline drawing. The layout with safety barriers locates the phone to be shielded and less vulnerable to an out-of-control vehicle.
• Street lighting locations relative to the ESB and roadside help phone.
• Coverage of the area by CCTV.
• Visibility from the traffic lanes, e.g. the help phone should not be obstructed by existing or planned vegetation, signs or structures.
• Locations of advance and position signs leading to and within the ESB.
• Ground topography should be reasonably flat for equipment installation, and buttons and speakers should be at the right height for all users (as per AS1428.2).
See Section 6.4.12 for details on design checks for ESBs.
16.3.2 Provision in tunnel environments
Due to the specialised design of tunnels, the spacing of the roadside help phones in tunnels should meet the tunnel requirements. Because of restrictions in vertical and horizontal alignment and the greater potential hazard for pedestrians, a reduced spacing between the phones is appropriate (e.g. maximum 200 metre spacing). The limited space available means that roadside help phones in tunnels should usually be wall mounted and placed on both sides of the carriageway, so there is no need to cross the road.
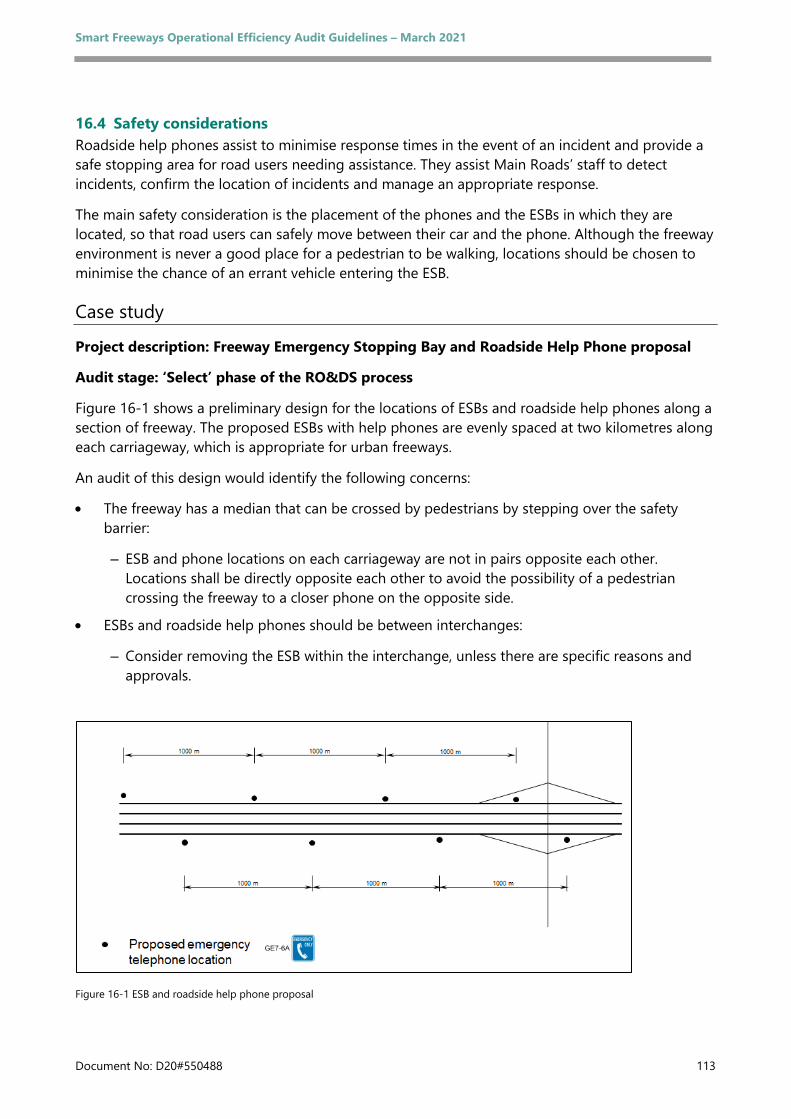
Smart Freeways Operational Efficiency Audit Guidelines – March 2021
Document No: D20#550488 113
16.4 Safety considerations Roadside help phones assist to minimise response times in the event of an incident and provide a safe stopping area for road users needing assistance. They assist Main Roads’ staff to detect incidents, confirm the location of incidents and manage an appropriate response.
The main safety consideration is the placement of the phones and the ESBs in which they are located, so that road users can safely move between their car and the phone. Although the freeway environment is never a good place for a pedestrian to be walking, locations should be chosen to minimise the chance of an errant vehicle entering the ESB.
Case study
Project description: Freeway Emergency Stopping Bay and Roadside Help Phone proposal
Audit stage: ‘Select’ phase of the RO&DS process
Figure 16-1 shows a preliminary design for the locations of ESBs and roadside help phones along a section of freeway. The proposed ESBs with help phones are evenly spaced at two kilometres along each carriageway, which is appropriate for urban freeways.
An audit of this design would identify the following concerns:
• The freeway has a median that can be crossed by pedestrians by stepping over the safety barrier:
– ESB and phone locations on each carriageway are not in pairs opposite each other. Locations shall be directly opposite each other to avoid the possibility of a pedestrian crossing the freeway to a closer phone on the opposite side.
• ESBs and roadside help phones should be between interchanges:
– Consider removing the ESB within the interchange, unless there are specific reasons and approvals.
Figure 16-1 ESB and roadside help phone proposal
Smart Freeways Operational Efficiency Audit Guidelines – March 2021
Document No: D20#550488 114
17 General guidance The following sections provide further background on general guidance that applies to audits of all freeway components that have not already been discussed.
17.1 Planning for operations and maintenance Understanding how the Smart Freeway system will be operated and maintained is critical to ensuring that associated activities on the network, such as incident response services and maintenance works, do not adversely affect road safety, and cause minimal disruption to traffic flows.
In carrying out the audit, awareness of the designer’s intentions for a safe working environment (as per relevant safe work legislation) may also be necessary.
Freeway designers should allow for safe access by incident responders and maintenance workers to all locations on the network. For example, an ESB and appropriately designed gap in the safety barrier will create a safe access point for maintenance vehicles to roadside cabinets. When ALR is in operation and there is no ESL, LUMS should be installed to enable lane closures before an incident to provide access by emergency services.
The co-location of ESB with VDS locations creates a safe area outside of lanes with traffic for maintenance vehicles and workers. The grouping of assets, such as with LUMS gantries may also reduce costs.
Freeway designers should also consider how to minimise disruption to free-flowing traffic during maintenance. For example, if a side-mounted VSL is to be used then cantilever signs with mechanisms that allow the sign display to be manoeuvred over the ESL for maintenance will reduce the need for lane closures.
The audit team can also check for other aspects that may affect operations and maintenance, For example, design to minimise the risk of vandalism that could cause equipment failure and require additional maintenance work.
17.2 Retrofitting Smart Freeways Freeway projects should consider options for staging of works towards an ‘ultimate design’. Where major civil upgrades are planned it may not be necessary to introduce Smart Freeway higher-order ITS tools in the first stage. This is because additional lanes may mean there is sufficient capacity to ensure traffic flows are within the unmanaged freeway design capacity for the short to medium term.
In the longer term, however, as travel demand increases, there will be a time when unmanaged freeway operational capacities are being reached and CRS and other traffic management tools will be needed.

Smart Freeways Operational Efficiency Audit Guidelines – March 2021
Document No: D20#550488 115
Therefore, as a general principle, Main Roads’ policy stipulates that freeways shall be designed for Smart Freeway operation with ramp signalling to ensure longevity in the life of whatever layout is constructed. Even if not required initially, designing for ramp signalling can facilitate retrofitting , as well as provide a facility that can operate satisfactorily when the signalling is installed (see Section 7.5.3). This applies to both geometric and equipment layout aspects of design.
The same principle applies to the design of other freeway components, particularly where they are incorporated in the foundation-level ITS, as defined in the Smart Freeways Provision Guidelines (2020). For example, vehicle detectors should be located at appropriate locations to provide data used in planning and design for CRS operation, as well as during operation once it has been installed (without the need to relocate devices). Also, if ALR is installed at a later stage of the project, geometric layouts should consider future requirements for gantry structures and ESB.
17.3 Technology and systems compatibility Critical to successful operation of Smart Freeways is the design of the technology systems themselves, including how they integrate with other systems on the network.
The audit provides the opportunity to check at a high level whether the equipment technology and system design are consistent or will have any adverse impacts on the central control system and operational efficiency.
The audit, however, should not be considered a comprehensive check on the adequacy of technology or system to meet all the requirements of Main Roads or other government agencies (which may address other issues such as safety, ITS architecture and IT / network security).
Key principles for ensuring the technology and systems will result in safe and efficient operation of the freeway include:
• Choice of technology and system design that meets functionality requirements based on user needs and Main Roads’ guidelines and specifications.
• Choice of technology and system design that delivers a consistent driving experience on freeways.
• Integration with the freeway control system, e.g. roadside devices shall be compatible with the control system (appropriate communication with drivers, etc).
• Adequate communications infrastructure, particularly in terms of availability and reliability.
Smart Freeways Operational Efficiency Audit Guidelines – March 2021
Document No: D20#550488 116
18 References Austroads 2006, Guide to Road Design: Part 2: Design Considerations, AGRD02/06, Austroads, Sydney, NSW
Austroads 2007, Guide to Traffic Management: Part 6: Intersections, Interchanges and Crossings, AGTM06/07, Austroads, Sydney, NSW
Austroads 2008, Guide to Road Safety: Part 3: Speed Limits and Speed Management, AGRS03/08, Austroads, Sydney, NSW
Austroads 2009e, Guide to Road Design: Part 4c: Interchanges, AGRD04C/09, Austroads, Sydney, NSW
Austroads 2009g, Guide to Traffic Management: Part 3: Traffic Studies and Analysis, AGTM03/09, Austroads, Sydney, NSW
Austroads 2009h, Guide to Traffic Management: Part 9: Traffic Operations, AGTM09/09, Austroads, Sydney, NSW
Austroads 2009i, Guide to Traffic Management: Part 10: Traffic Control and Communication Devices, AGTM10/09, Austroads, Sydney, NSW
Austroads 2010a, Guide to Road Design: Part 3: Geometric Design, AGRD03/10, Austroads, Sydney, NSW
Austroads 2010b, Guide to Road Design: Part 4a: Unsignalised and Signalised Intersections, AGRD04A/09, Austroads, Sydney, NSW
Austroads 2010c, Guide to Road Design: Part 6: Roadside Design, Safety and Barriers, AGRD06/10, Austroads, Sydney, NSW
Austroads 2019, Guide to Road Safety Part 6A: Implementing Road Safety Audits, AGRS06A-19, Austroads, Sydney, NSW
Austroads projects related to this report
Austroads 2012-14, Ability to Absorb Information Through Electronic and Static Signs, NT1782, Austroads, Sydney, NSW
Failing, D, Quon, F, Ruano, M & Razavi, A 2005, Ramp Meter Development Plan – District 7 Los Angeles and Ventura Counties, Department of Transportation, California, USA
Federal Highways Administration 2003, Highway Traffic Operations and Freeway Management: State Of The Practice: Final Report, FHWA, Washington, DC, USA
Highways Agency 2006 Design Guide for Roads and Bridges, TD 22/06, Volume 6: Road Geometry, Section 2: Junctions, Highways Agency, London, UK
Institute of Transportation Engineers 2005, Freeway and Interchange: Geometric Design Handbook, by Leisch J, Institute of Transportation Engineers, Washington DC, USA
Main Roads Western Australia 2018, Guideline for Emergency Stopping Bays and Roadside Help Phones document no. D18#329267, Main Roads Western Australia, East Perth, WA
Smart Freeways Operational Efficiency Audit Guidelines – March 2021
Document No: D20#550488 117
Main Roads Western Australia 2020, Smart Freeways Variable Message Signs, Main Roads Western Australia, East Perth, WA
Main Roads Western Australia 2020, Main Roads’ Supplement to Victoria’s Managed Motorways Design Guide Volume 2: Parts 2 and 3, Main Roads Western Australia, East Perth, WA
Main Roads Western Australia 2020, Smart Freeways Policy, Main Roads Western Australia, East Perth, WA
Main Roads Western Australia 2020, Smart Freeways Provision Guidelines, Main Roads Western Australia, East Perth, WA
Main Roads Western Australia 2019, Guidelines for Analysing Freeway Sections: Obtaining Peak Hour Volumes from ROM24 and Adjustment Process, Main Roads Western Australia, East Perth, WA
Main Roads Western Australia 2018, Guideline for Emergency Stopping Bays and Roadside Help Phones, Main Roads Western Australia, East Perth, WA
Main Roads Western Australia 2012h, MRWA Supplement to Austroads Guide To Road Design Part 6, document no. D11#38472, MRWA, East Perth, WA, viewed 14 November 2012
Roess, R 2009, Task 6 Research Memo: Re-Calibration of the 75-Mi/H Speed-Flow Curve and the FFS Prediction Algorithm for HCM 2010, NCHRP 3-92, Transportation Research Board, Washington, DC, USA
Sensys Networks 2012, Freeway Applications, Berkeley, CA, USA, viewed 3 December 2012
Transportation Research Board 2010, Highway Capacity Manual, TRB, Washington, DC, USA
Managed Motorways Design Guide 2019, VicRoads (Victorian Department of Transport), Kew, Vic
VicRoads 2013b, Managed Freeways: Handbook for Lane Use Management, Variable Speed Limits, Traveller Information, VicRoads, Kew, Vic
Zheng, Z 2012, ‘Empirical analysis on relationship between traffic conditions and crash occurrences’, Procedia – Social and Behavioral Sciences, vol 43, pp. 302-312
Australian Standards
AS 1428 Set-2010, Design for Access and Mobility
AS 1742 Set-2010, Manual of Uniform Traffic Control Devices
AS 4852 Set-2009 Variable Message Signs
AS 1743-2001, Road Signs: Specifications
AS 4806 Set-2008, Closed Circuit Television (CCTV)

Smart Freeways Operational Efficiency Audit Guidelines – March 2021
Document No: D20#550488 118
APPENDIX A Audit checklists

Smart Freeways Operational Efficiency Audit Guidelines – March 2021
Document No: D20#550488 119
1 Checklist for Performance and Service Definition
Operational Efficiency Audit Guidelines reference: Section 4
Freeway section: Audit stage: Project: Assessed by: Client: Date:
Item OK
Comments Yes No n/a
Operating objectives
Operating objectives are clearly defined for the project and aligned with Main Roads’ policy objectives for Smart Freeways
Performance targets for project design are clearly defined (mainline, ramps, interchanges)
Performance targets
Performance targets are clearly defined for the project
Selection of Smart Freeway services and traffic management tools
Scope of work is consistent with the desired outcomes
Selection of traffic management tools is informed by functional requirements and user needs
Appropriate traffic management tools are provided relative to warrants in Main Roads’ Smart Freeways Provision Guidelines
Appropriate traffic management tools are provided relative to safety needs
Appropriate traffic management tools are provided to suit the traffic needs for current project and future layout/staging options
Consider requirements for priority vehicle facilities
Selected option will deliver best outcomes for the project
Consider traffic operations at all stages of a project’s implementation
Consider timing for provision of traffic management tools

Smart Freeways Operational Efficiency Audit Guidelines – March 2021
Document No: D20#550488 120
2 Checklist for Traffic Volume Determination
Operational Efficiency Audit Guidelines reference: Section 5
Freeway section: Audit stage: Project: Assessed by: Client: Date:
Item OK
Comments Yes No n/a
Traffic flow determination (based on existing flows)
Existing peak period flows
Forecast peak design flows including appropriate growth factor
Forecast design year, opening date and sensitivity checks are appropriate
Potential for suppressed demand has been accommodated
Traffic flow determination (based on strategic modelling)
Strategic model calibrated for existing volumes
Forecast volumes from strategic model considers unconstrained capacity as well as project constraints
Forecast year appropriate
Forecast strategic model volumes converted to peak design flows, using an appropriate factor, and the flows are realistic
Flow and capacity analysis
Consistency of peak design flows relative to Maximum Sustainable Flow rates and check of traffic mix (% heavy vehicles)
Analysis of ultimate project or staging of ultimate works
appropriate values (veh/h) for maximum sustainable flow rates (design capacity for unmanaged or managed freeway)
Identification of bottleneck areas
Mainline design volume checks
Entry ramp, interchange design volume checks
Entry ramp, interchange flows and percentage trucks for considering priority access
Exit ramp, interchange design volume checks
Exit ramp and interchange flows
Safety analyses
Analysis of incident records (if the project involves upgrading of an existing route)
Analyses of future safety issues

Smart Freeways Operational Efficiency Audit Guidelines – March 2021
Document No: D20#550488 121
3 Checklist for Mainline Operation
Operational Efficiency Audit Guidelines reference: Section 6
Freeway section: Audit stage: Project: Assessed by: Client: Date:
Item OK
Comments Yes No N/A
Capacity and number of lanes
Number of lanes is appropriate relative to flow/capacity relationship
Appropriate maximum sustainable flow rates used in analyses
Capacity adjusted for physical characteristics along the mainline
Identification of critical bottleneck areas
Balanced capacity along the route to suit peak demand flows with appropriate locations for added lanes and lane reductions
Mainline capacity checks
Over-spilling of exit ramp queues into the mainline
Emergence of new downstream bottlenecks after project changes
Impact of project changes on intersecting freeways
Horizontal alignment
Alignment to cater for comfortable free-flow speeds of 100 km/h, where feasible
Capacity implications and potential for critical bottlenecks due to low radii curves
Impact of low radii curves with other road features
Vertical alignment
Capacity implications and potential for critical bottlenecks due to steep grades
Impact of steep grades with other road features
Auxiliary lanes
Need for auxiliary lanes in areas of high weaving and/or closely spaced interchanges
Appropriate capacity value used for auxiliary lanes
Appropriateness of lane reduction layout and capacity implications associated with lane drop or exclusive exit lane layout

Smart Freeways Operational Efficiency Audit Guidelines – March 2021
Document No: D20#550488 122
Item OK
Comments Yes No N/A
Signing and pavement marking layout
Weaving and lane changing areas
Capacity implications associated with weaving and lane changing areas
Appropriateness of layout/consideration of:
• entry/exit locations or layout
• auxiliary lanes
• separate collector-distributor roads
• braided ramps
Lane reductions
Capacity implications associated with lane reductions
Appropriateness of layout:
• location of lane reduction
• type of layout
Entry ramps
Appropriate layout for entry ramp connection into mainline
Lane gains
Appropriateness of lane gain location
Exit ramp traffic impacts on the mainline
Likely impact of exit ramp arrangements (also see Section 8
Lane widths
Appropriateness of lane widths
Capacity implications associated with lower operating speed
Emergency stopping provision
Appropriateness of ESL arrangements
Capacity implications associated with lower operating speed or reduced lateral clearances with ALR
The need for traffic management provisions with ALR (refer to relevant sections) such as:
• lane use management
• surveillance cameras (CCTV)
• lower default speed limit
• variable speed limit system
• emergency stopping bays (ESB)
• number/spacing of ESB (if required)

Smart Freeways Operational Efficiency Audit Guidelines – March 2021
Document No: D20#550488 123
• appropriate lane configuration, pavement marking and signing near interchanges
Item OK
Comments Yes No N/A
• Additional civil requirements for ESL conversion, e.g. upgrade pavement strength and depth, surface and verge treatments etc
Priority vehicle facilities
Capacity implications of priority vehicle facilities
Appropriateness of priority vehicle facilities e.g. lane configurations
Provision of additional static signing/pavement markings for priority lanes
Staged construction and retrofitting
Staged construction of ‘ultimate’ layout
Geometric layout facilitates retrofitting of Smart Freeway systems at a later date
Additional requirements
Location of conduits and pits for power supply, communications and ITS devices
Existing accident problem locations have been addressed (if the project involves upgrading of an existing route)

Smart Freeways Operational Efficiency Audit Guidelines – March 2021
Document No: D20#550488 124
4 Checklist for Entry Ramp Operation
Operational Efficiency Audit Guidelines reference: Section 7
Freeway section: Audit stage: Project: Assessed by: Client: Date:
Item OK
Comments Yes No n/a
Provision of ramp signals
Ramp signals are included in the design as required by Main Roads’ Smart Freeways Provision Guidelines
Route operation as a whole is understood including location of critical bottleneck areas
Ramp signalling is provided at all entries to the mainline for a section where CRS is warranted
Sufficient number of ramp signals are provided in the partially managed transition zone upstream of critical bottlenecks to adequately manage mainline flow
If not part of initial project scope, ramp design / layout facilities retrofitting of ramp signals at a later date
Ramp design flows
Ramp design flows are adequately determined for ramp signal assessment
Ramp signal discharge capacity at the stop line
Number of lanes at the stop line provides adequate discharge capacity at desirable minimum cycle times
Worst case scenario (AM or PM peak) is used in the design
Ramp storage
Ramp storage is adequate relative to desirable minimum storage
Implications if the ramp storage is inadequate and queues may extend beyond the length of the ramp
Worst case scenario (AM or PM peak) is used in the design
Ramp layout suitability
Appropriate and optimum geometry is provided at each entry ramp including:

Smart Freeways Operational Efficiency Audit Guidelines – March 2021
Document No: D20#550488 125
Item OK
Comments Yes No n/a
• chosen layout
• stop line location
• merging distance prior to ramp nose
• acceleration distance to mainline merge
• mainline / entry ramp connection geometry
• other design matters as appropriate
Design for trucks
Is special consideration needed for truck acceleration?
Priority vehicle facilities
Appropriateness of layout for priority access – trucks, high occupancy vehicles (T2 or T3), and buses, where applicable
Metering of priority lane is provided
Layout of signals/devices
Signal lantern location
Signal post/gantry location
Vehicle detectors (see Section 14)
Location of conduits and pits for power supply, communications and ITS devices
Location of ITS roadside cabinet/controller
Layout of signs
Adequate signing is provided, including:
• signs RC1
• signs RC2 (if applicable)
• arterial road VMS RC3
• vehs/green/lane, stop here on red signal
• form 1/2 lane(s)
• speed limit – static or VSL
• truck lane/T2 signs (if applicable)
Pavement markings
Adequate pavement markings are provided, including:
• stop line
• lane lines
• continuity lines
• edge lines
• raised reflective pavement markers
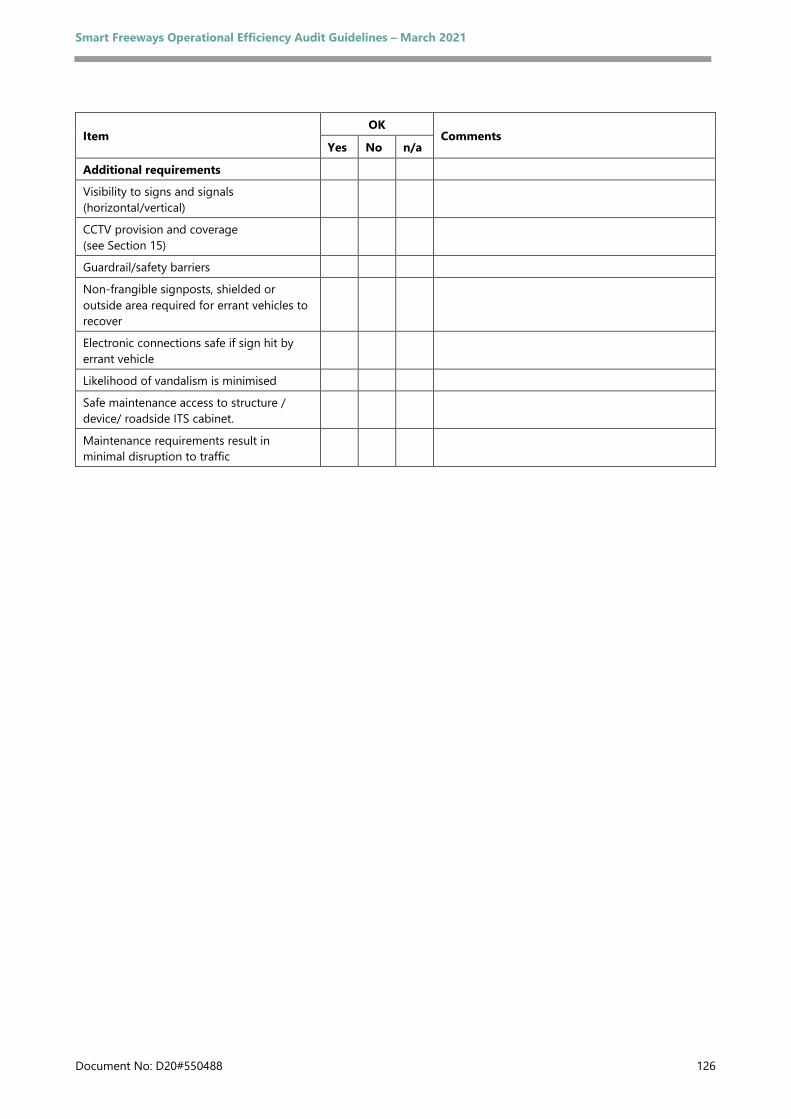
Smart Freeways Operational Efficiency Audit Guidelines – March 2021
Document No: D20#550488 126
Item OK
Comments Yes No n/a
Additional requirements
Visibility to signs and signals (horizontal/vertical)
CCTV provision and coverage (see Section 15)
Guardrail/safety barriers
Non-frangible signposts, shielded or outside area required for errant vehicles to recover
Electronic connections safe if sign hit by errant vehicle
Likelihood of vandalism is minimised
Safe maintenance access to structure / device/ roadside ITS cabinet.
Maintenance requirements result in minimal disruption to traffic

Smart Freeways Operational Efficiency Audit Guidelines – March 2021
Document No: D20#550488 127
5 Checklist for Freeway-to-Freeway Operation
Operational Efficiency Audit Guidelines reference: Section 8
Freeway section: Audit stage: Project: Assessed by: Client: Date:
Item OK
Comments Yes No n/a
Provision of ramp signals
Freeway-to-freeway ramps are controlled with ramp signals
If freeway-to-freeway ramps are not controlled:
• ramp flow to downstream freeway can be adequately managed by controlling upstream ramps from arterial roads
• Unmanaged mainline MSFR is used for downstream analysis
• suitability of layout for later retrofitting of ramp signals (if not part of initial project staging)
Ramp layout suitability
Position of ramp signals (single installation or two signalling locations for left and right-turn movements) is appropriate
Layout of ramp geometry to suit ramp signal design, e.g. auxiliary lanes (length and tapers)
Visibility to signals and expected back of queue
Ramp discharge capacity at the stop line
Number of lanes at the stop line provides adequate discharge capacity at desirable minimum cycle times
Worst case scenario (AM or PM peak) is used in the design
Ramp storage
Ramp storage is adequate relative to desirable minimum storage
Assess implications if the ramp storage is inadequate and queues may extend beyond the length of the ramp, e.g. extend ramp length etc
Worst case scenario (AM or PM peak) is used in the design

Smart Freeways Operational Efficiency Audit Guidelines – March 2021
Document No: D20#550488 128
Item OK
Comments Yes No n/a
Priority vehicle facilities
Appropriateness of layout for priority access - trucks, high occupancy vehicles (T2 or T3), and buses, if applicable
Metering of priority lane is provided
Layout of signals/devices
Signal lantern location
Signal gantry or cantilever support location
Vehicle detectors (see Section 14)
Location of conduits and pits for power supply, communications and ITS devices
Location of ITS roadside cabinet/controller
Layout of signs
Adequate signing is provided, including:
• RC3-C warning sign is provided on freeway prior to exit
• RC2-C warning signs are provided
• vehs/green/lane, stop here on red signal
• form 1/2 lane(s)
• speed limit (static or VSL)
• truck lane/T2 signs (if applicable)
Pavement markings
Adequate pavement markings are provided, including:
• stop line
• lane lines
• continuity lines
• edge lines
• raised reflective pavement markers
Additional requirements
Visibility to signs and signals (horizontal / vertical)
Appropriate traffic management for safety e.g. VSL signs and overhead LUMS signs, if appropriate
CCTV provision and coverage (see Section 15)
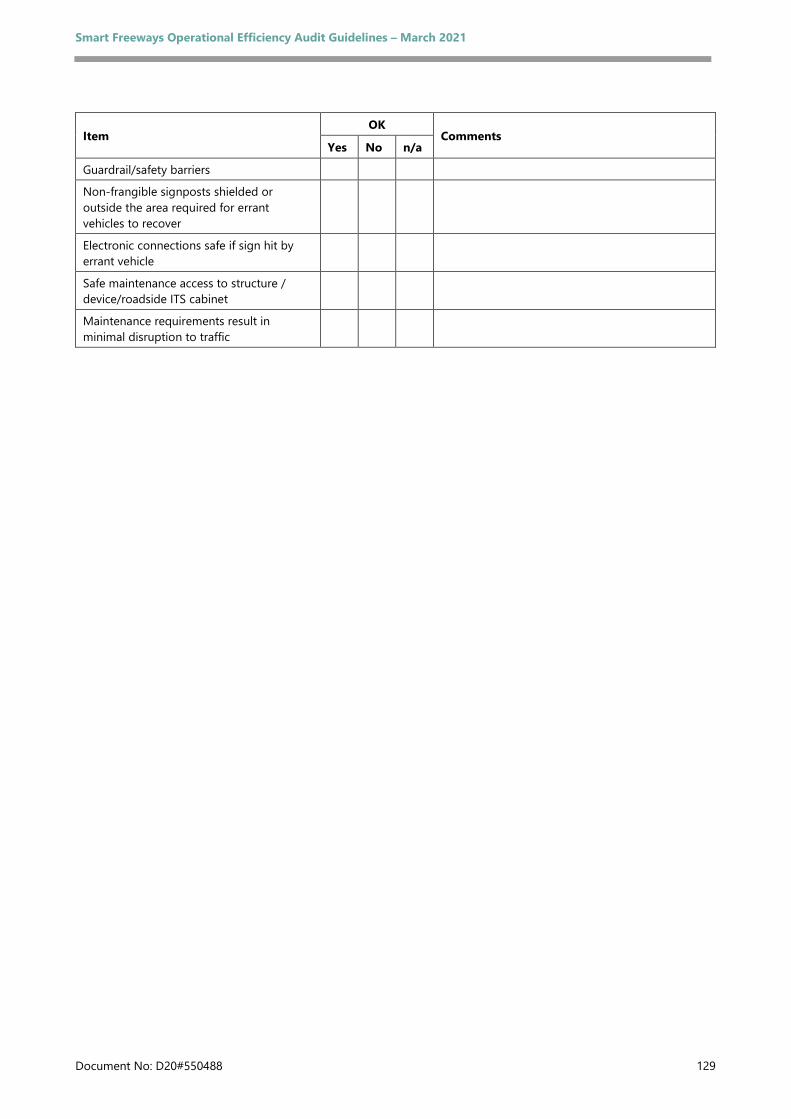
Smart Freeways Operational Efficiency Audit Guidelines – March 2021
Document No: D20#550488 129
Item OK
Comments Yes No n/a
Guardrail/safety barriers
Non-frangible signposts shielded or outside the area required for errant vehicles to recover
Electronic connections safe if sign hit by errant vehicle
Safe maintenance access to structure / device/roadside ITS cabinet
Maintenance requirements result in minimal disruption to traffic

Smart Freeways Operational Efficiency Audit Guidelines – March 2021
Document No: D20#550488 130
6 Checklist for Exit Ramp Operation
Operational Efficiency Audit Guidelines reference: Section 9
Freeway section: Audit stage: Project: Assessed by: Client: Date:
Item OK
Comments Yes No n/a
Exit ramp intersection suitability (also see Section 10)
Appropriate intersection control e.g. signals, roundabout or stop / give way signs
Intersection has adequate capacity to manage forecast design traffic volumes / queues
Exit ramp length and capacity
Adequate ramp length and number of lanes to accommodate 95th percentile queues at the intersection, plus deceleration length
Adequate ramp length relative to deceleration distance to ramp curve or back of queue
Appropriate capacity/number of exit lanes at the ramp nose (e.g. 1 or 2 lanes) to suit forecast exit traffic flow
Two-lane exits
Appropriate exit lane arrangement and length to suit forecast exit traffic flow
Priority vehicles
Priority vehicle lanes provided on ramp, if appropriate, to facilitate access to intersection priority vehicle lane
Additional requirements
Additional measures where mainline queues are predicted e.g. extend ramp length or width, use emergency stopping lane for exiting / queuing traffic, use VSL for queue protection
Where a longer ramp is not feasible, queue detectors provided at upstream end of exit ramp and integrated with interchange signals operation (see Section 14)

Smart Freeways Operational Efficiency Audit Guidelines – March 2021
Document No: D20#550488 131
7 Checklist for Arterial Interchange Operation
Operational Efficiency Audit Guidelines reference: Section 10
Freeway section: Audit stage: Project: Assessed by: Client: Date:
Item OK
Comments Yes No n/a
Interchange layout suitability
Appropriate design of interchange layout
Form of intersection control
Appropriate choice of intersection control: signals, roundabout or stop / give way signs
Intersection has adequate capacity to manage forecast design traffic volumes
Entry ramp intersection
Integration of SCATS operations with CRS for entry ramps with inadequate storage (see Section 14)
SCATS interventions to avoid intersection blockage
Sufficient storage on the arterial road for overflow queues, if necessary
Exit ramp intersection
Location of queue detectors at upstream end of exit ramp (see Section 14)
SCATS interventions with CRS operation to avoid queues spilling back to freeway mainline
SCATS interventions to maximise capacity of the exit ramp in case there is a major diversion onto the ramp
Freeway terminus
If freeway ends at an arterial road, do intersection and arterial roads have adequate capacity
Provision of queue detection and management (see Sections 14 and 15)
Are variable speed limits proposed to manage queues
Priority vehicle facilities
Spatial priority at intersection where appropriate (e.g. priority lanes)
Signal priority at intersection where appropriate

Smart Freeways Operational Efficiency Audit Guidelines – March 2021
Document No: D20#550488 132
8 Checklist for On-Road Traveller Information
Operational Efficiency Audit Guidelines reference: Section 11
Freeway section: Audit stage: Project: Assessed by: Client: Date:
Item OK
Comments Yes No n/a
Provision of on-road traveller information
On-road traveller information included in the design as required by the Main Roads’ Smart Freeways Provision Guidelines
Coverage of freeway and arterial locations
Consistent route treatment
Foundation-level locations will also suit future Smart Freeway operation
Static direction signs
Designed to meet Main Roads’ guidelines
Location of reassurance signs
Location of lane allocation signs
Adequate longitudinal spacing to adjacent LUMS, VSL and VMS
Consistent use of destination names
Mounted to achieve good visibility
Mounted overhead where required
Freeway VMS and freeway-to-freeway VMS
Choice of locations on freeway for travel time / condition information
Choice of locations on freeway for incident, event or traffic dispersion
Appropriate distances in advance of major exits
Appropriate spacings along the route
Appropriate distances in advance of the start of a LUMS environment
Adequate longitudinal spacing to adjacent LUMS, VSL and static directional, regulatory and warning signs
Adequate longitudinal spacing to key decision / manoeuvre points where driver workload is increased
Mounted to achieve good visibility
Adequate sightlines to sign for speed environment and no visibility restrictions (including road geometry)

Smart Freeways Operational Efficiency Audit Guidelines – March 2021
Document No: D20#550488 133
Item OK
Comments Yes No n/a
Adequate VMS display size for operating speeds (e.g. consider legibility of message)
Non-frangible signposts shielded or outside the area required for errant vehicles to recover
Arterial road VMS
Appropriate sign size for speed environment (RC3-A or RC3-B)
Choice of locations on arterial road approaches to freeway entry ramps, with adequate signs for left and right-turn movements
Appropriate number at entries close to a downstream freeway fork to enable separate displays for each downstream freeway
Choice of locations before decision points at arterial road locations remote from the freeway where alternative arterial routes can be chosen
Adequate sightlines to sign for speed environment and good visibility (including road geometry)
No impedance of sightlines to arterial traffic control devices
Additional requirements
Location of conduits and pits for power supply, communications and ITS devices
Location of ITS roadside cabinet/controller
Guardrail/safety barriers
Non-frangible signposts shielded or outside the area required for errant vehicles to recover
Electronic connections safe if sign hit by errant vehicle
Likelihood of vandalism is minimised
Safe maintenance access to structure / device / roadside ITS cabinet.
Maintenance requirements result in minimal disruption to traffic
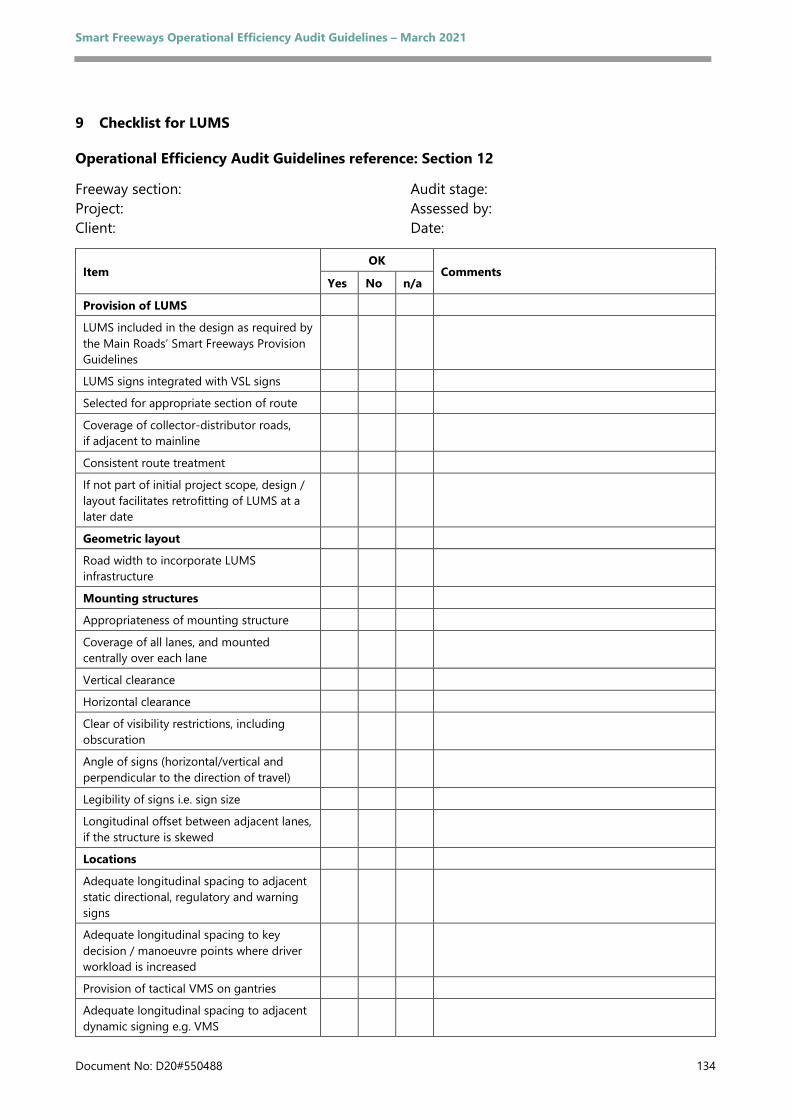
Smart Freeways Operational Efficiency Audit Guidelines – March 2021
Document No: D20#550488 134
9 Checklist for LUMS
Operational Efficiency Audit Guidelines reference: Section 12
Freeway section: Audit stage: Project: Assessed by: Client: Date:
Item OK
Comments Yes No n/a
Provision of LUMS
LUMS included in the design as required by the Main Roads’ Smart Freeways Provision Guidelines
LUMS signs integrated with VSL signs
Selected for appropriate section of route
Coverage of collector-distributor roads, if adjacent to mainline
Consistent route treatment
If not part of initial project scope, design / layout facilitates retrofitting of LUMS at a later date
Geometric layout
Road width to incorporate LUMS infrastructure
Mounting structures
Appropriateness of mounting structure
Coverage of all lanes, and mounted centrally over each lane
Vertical clearance
Horizontal clearance
Clear of visibility restrictions, including obscuration
Angle of signs (horizontal/vertical and perpendicular to the direction of travel)
Legibility of signs i.e. sign size
Longitudinal offset between adjacent lanes, if the structure is skewed
Locations
Adequate longitudinal spacing to adjacent static directional, regulatory and warning signs
Adequate longitudinal spacing to key decision / manoeuvre points where driver workload is increased
Provision of tactical VMS on gantries
Adequate longitudinal spacing to adjacent dynamic signing e.g. VMS

Smart Freeways Operational Efficiency Audit Guidelines – March 2021
Document No: D20#550488 135
Item OK
Comments Yes No n/a
Co-location of signing (LUMS / direction signs or LUMS / VMS) avoided unless geometric constraints exist, including consideration of sign complexity and information overload
Co-location of direction signs / VMS or triple co-location of LUMS / direction signs / VMS avoided
Appropriateness of locations at interchanges, so that road users are aware of lane use ahead including those that are:
• exiting the freeway
• entering the freeway
• continuing through the interchange
Positioning in the event of collector-distributor roads provided adjacent to the mainline
Adequate mid-block spacing to meet guideline requirements and operational transitions and impact of device failures
Average mid-block spacing is consistent
Appropriate use of existing infrastructure (e.g. mounted on bridges)
Priority vehicle facilities
Appropriateness of layout for priority vehicle facilities
Provision of additional static signing/pavement markings for priority lanes
Tunnel environments
Requirement for LUMS spacing, and also considering length of tunnel section
Visibility of LUMS or VSL/LCS inside the tunnel
Adequate LUMS sign or VSL/LCS signal display size for tunnel environments and operating speeds
Additional requirements
Mounted to achieve good visibility
Adequate sightlines to LUS for speed environment and no visibility restrictions (including road geometry)
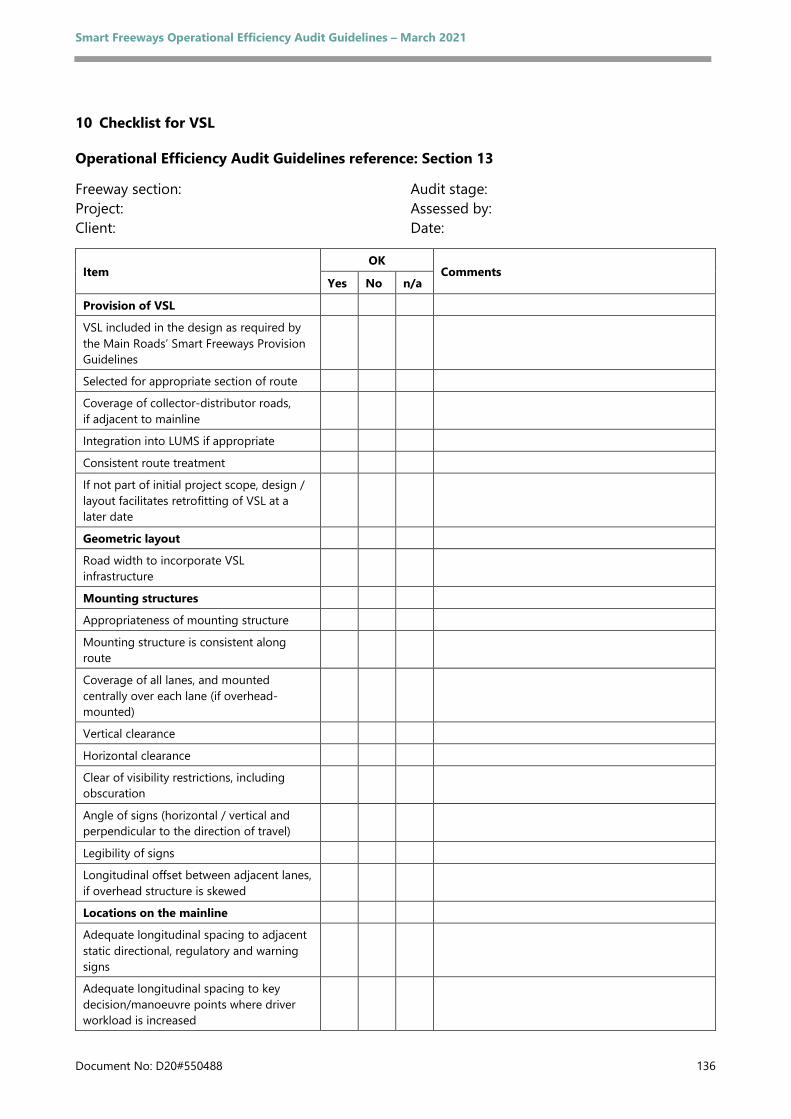
Smart Freeways Operational Efficiency Audit Guidelines – March 2021
Document No: D20#550488 136
10 Checklist for VSL
Operational Efficiency Audit Guidelines reference: Section 13
Freeway section: Audit stage: Project: Assessed by: Client: Date:
Item OK
Comments Yes No n/a
Provision of VSL
VSL included in the design as required by the Main Roads’ Smart Freeways Provision Guidelines
Selected for appropriate section of route
Coverage of collector-distributor roads, if adjacent to mainline
Integration into LUMS if appropriate
Consistent route treatment
If not part of initial project scope, design / layout facilitates retrofitting of VSL at a later date
Geometric layout
Road width to incorporate VSL infrastructure
Mounting structures
Appropriateness of mounting structure
Mounting structure is consistent along route
Coverage of all lanes, and mounted centrally over each lane (if overhead-mounted)
Vertical clearance
Horizontal clearance
Clear of visibility restrictions, including obscuration
Angle of signs (horizontal / vertical and perpendicular to the direction of travel)
Legibility of signs
Longitudinal offset between adjacent lanes, if overhead structure is skewed
Locations on the mainline
Adequate longitudinal spacing to adjacent static directional, regulatory and warning signs
Adequate longitudinal spacing to key decision/manoeuvre points where driver workload is increased

Smart Freeways Operational Efficiency Audit Guidelines – March 2021
Document No: D20#550488 137
Item OK
Comments Yes No n/a
Adequate longitudinal spacing to adjacent dynamic signing e.g. VMS
Co-location of signing avoided where possible
Located downstream of entry ramp merge taper
Speed limit throughout the interchange
Static signage prior to VSL area and default speed limit changes
Adequate mid-block spacing to meet requirements for repeater signs and operational transitions
Average mid-block spacing is consistent
Positioning in the event of collector-distributor roads provided adjacent to the mainline
Appropriate use of existing infrastructure
Locations on ramps
Downstream of ramp signals to advise entering road users of mainline speed limit
Tunnel environments
Requirements for VSL and spacing depending on length of tunnel section
Type of mounting structure e.g. use side-mounted if height restrictions
Adequate VSL signal display size for tunnel environments and operating speeds
Additional requirements
Mounted to achieve good visibility
Adequate sightlines to VSL signs for speed environment and no visibility restrictions (including road geometry)
Sign face layout complies with AS
Vehicle detectors for VSL control algorithms (see Section 14)
Static speed limit signs on exit ramps
Guardrail/safety barriers
Location of conduits and pits for power supply, communications and ITS devices
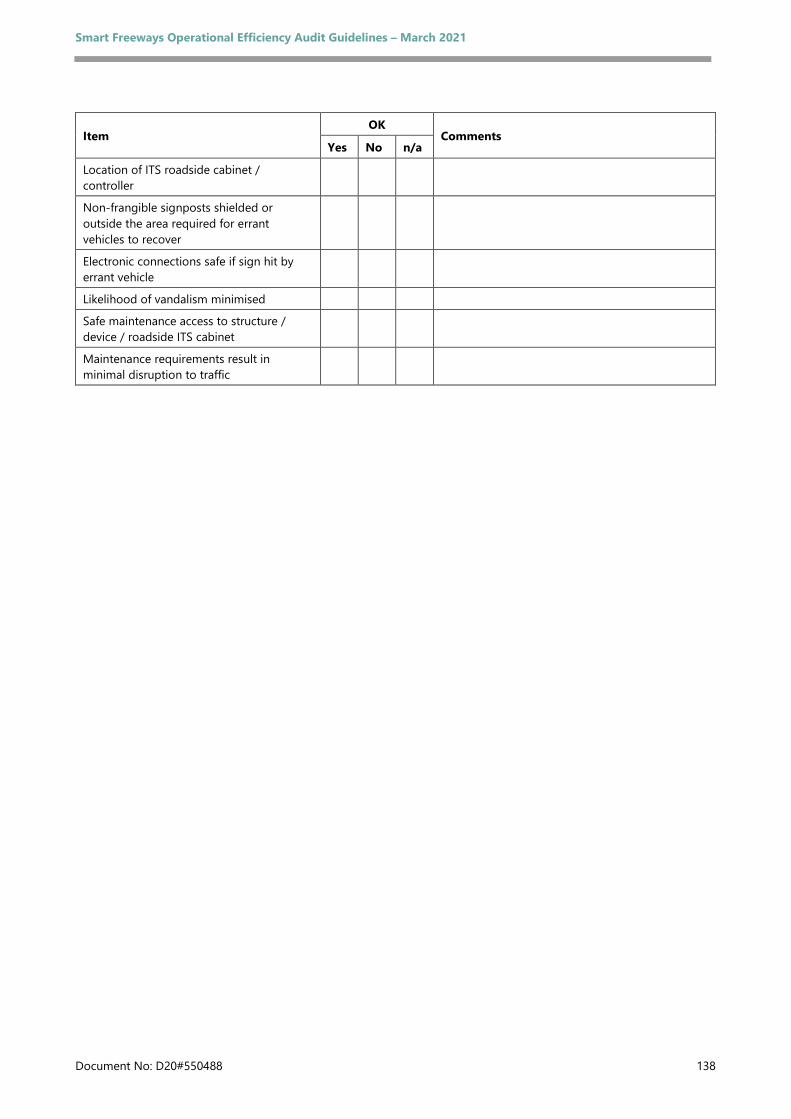
Smart Freeways Operational Efficiency Audit Guidelines – March 2021
Document No: D20#550488 138
Item OK
Comments Yes No n/a
Location of ITS roadside cabinet / controller
Non-frangible signposts shielded or outside the area required for errant vehicles to recover
Electronic connections safe if sign hit by errant vehicle
Likelihood of vandalism minimised
Safe maintenance access to structure / device / roadside ITS cabinet
Maintenance requirements result in minimal disruption to traffic

Smart Freeways Operational Efficiency Audit Guidelines – March 2021
Document No: D20#550488 139
11 Checklist for Vehicle Detection Systems
Operational Efficiency Audit Guidelines reference: Section 14
Freeway section: Audit stage: Project: Assessed by: Client: Date:
Item OK
Comments Yes No n/a
Provision of traffic data collection
Provided for all freeway sections as required by Main Roads’ Smart Freeways Provision Guidelines
Provided on all entry ramps
Provided on all exit ramps
Consider all uses of data for Smart Freeway operation (now or for future planning)
Foundation-level locations will also suit future Smart Freeway operation
Location on mainline
Detailed locations are determined after geometric layout is finalised
End of ramp entry merge area
Upstream of ramp entry nose
Downstream of ramp exit nose
At potential bottleneck locations
Within emergency stopping bays
Appropriate spacing between interchanges for foundation-level of Smart Freeway ITS
Appropriate spacing between interchanges for CRS algorithm and travel time calculations
Location on entry ramps
Detailed locations are determined after geometric layout is finalised
At stop line of CRS (upstream and downstream)
At mid-ramp location
At ramp entrance
Queue overflow detectors on long entry ramp or arterial road (if applicable)
Appropriate locations relative to LUMS/VSL structures
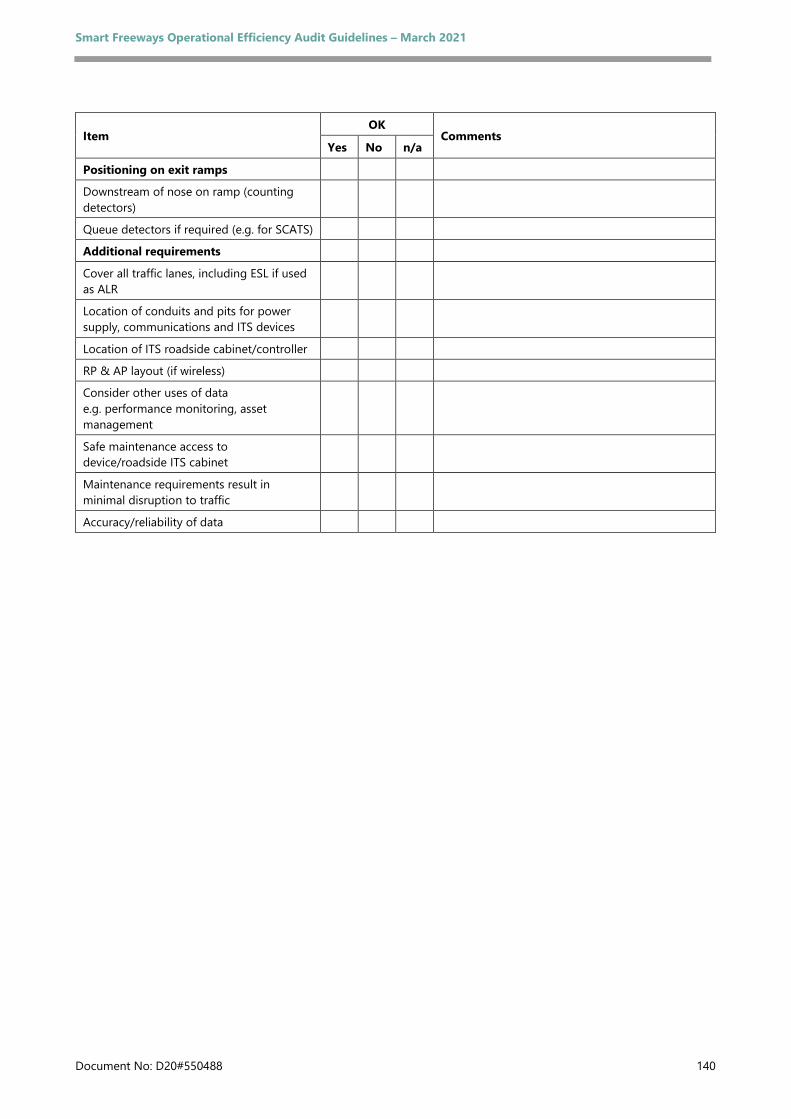
Smart Freeways Operational Efficiency Audit Guidelines – March 2021
Document No: D20#550488 140
Item OK
Comments Yes No n/a
Positioning on exit ramps
Downstream of nose on ramp (counting detectors)
Queue detectors if required (e.g. for SCATS)
Additional requirements
Cover all traffic lanes, including ESL if used as ALR
Location of conduits and pits for power supply, communications and ITS devices
Location of ITS roadside cabinet/controller
RP & AP layout (if wireless)
Consider other uses of data e.g. performance monitoring, asset management
Safe maintenance access to device/roadside ITS cabinet
Maintenance requirements result in minimal disruption to traffic
Accuracy/reliability of data

Smart Freeways Operational Efficiency Audit Guidelines – March 2021
Document No: D20#550488 141
12 Checklist for CCTV Cameras
Operational Efficiency Audit Guidelines reference: Section15
Freeway section: Audit stage: Project: Assessed by: Client: Date:
Item OK
Comments Yes No n/a
Provision of CCTV cameras
Provided for all freeway sections as required by the Main Roads’ Smart Freeways Provision Guidelines
Appropriate locations on the arterial road network to support Smart Freeway operations
Foundation-level locations will also suit future Smart Freeway operation
Locations
Full coverage of all mainline sections, including emergency stopping lanes
Overlapping coverage at appropriate mainline locations on Smart Freeways
Coverage of all interchanges, including freeway-to-freeway ramps
Coverage of full length of entry ramps with CRS, as well as merge areas on mainline
Coverage of arterial intersections on approach to entry ramps with CRS (as required)
Overlapping coverage of freeway sections with ALR
Coverage of ESBs
Visibility requirements
Appropriate positioning at curves and crests
No occlusion from vegetation, signs, bridges and other objects
Clear visibility of roadside electronic signs and signals (as required)
CCTV poles do not obstruct the view for road users of any signs or signals
Mounting requirements
Cameras are installed on secure and stable poles
Camera poles are installed outside the area required for errant vehicles to recover or are shielded with a safety barrier
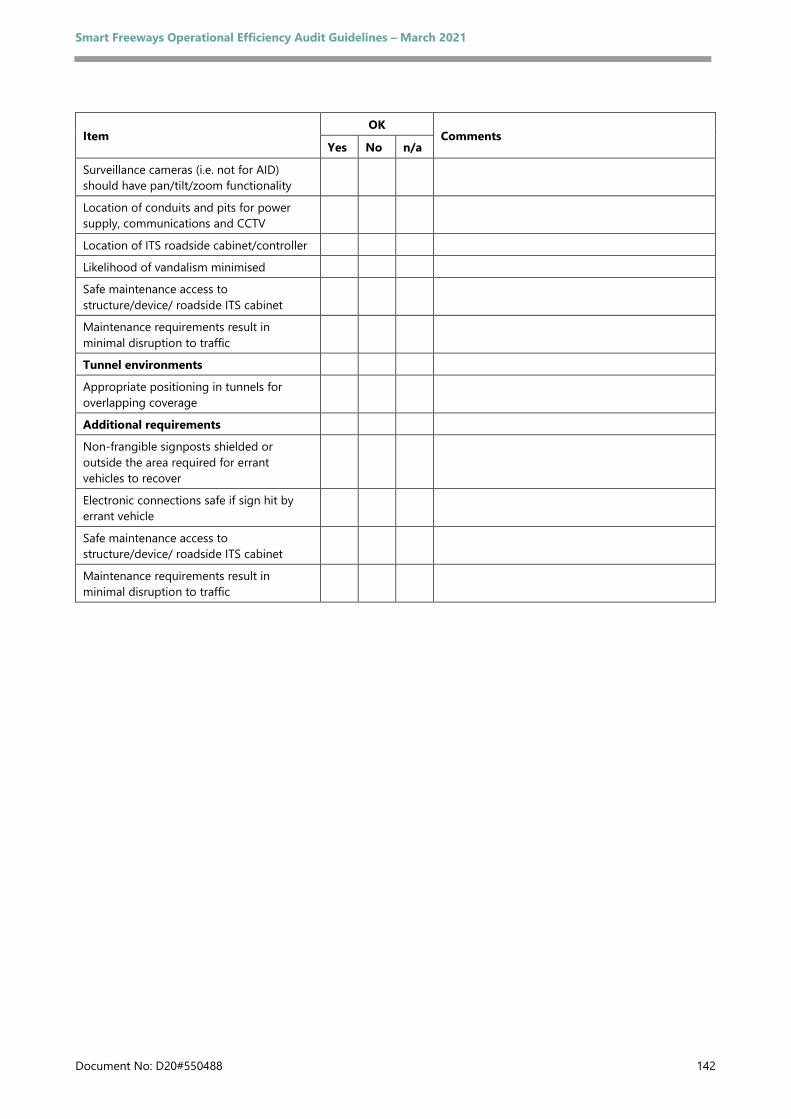
Smart Freeways Operational Efficiency Audit Guidelines – March 2021
Document No: D20#550488 142
Item OK
Comments Yes No n/a
Surveillance cameras (i.e. not for AID) should have pan/tilt/zoom functionality
Location of conduits and pits for power supply, communications and CCTV
Location of ITS roadside cabinet/controller
Likelihood of vandalism minimised
Safe maintenance access to structure/device/ roadside ITS cabinet
Maintenance requirements result in minimal disruption to traffic
Tunnel environments
Appropriate positioning in tunnels for overlapping coverage
Additional requirements
Non-frangible signposts shielded or outside the area required for errant vehicles to recover
Electronic connections safe if sign hit by errant vehicle
Safe maintenance access to structure/device/ roadside ITS cabinet
Maintenance requirements result in minimal disruption to traffic

Smart Freeways Operational Efficiency Audit Guidelines – March 2021
Document No: D20#550488 143
13 Checklist for Emergency Stopping Bays and Roadside Help Phones
Operational Efficiency Audit Guidelines reference: Section 16
Freeway section: Audit stage: Project: Assessed by: Client: Date:
Item OK
Comments Yes No n/a
Provision of ESBs and help phones
Required for freeway sections as required by Main Roads’ guidelines
Consideration of requirements with ALR
Locations
Locations provided between interchanges
Location avoids the need for people to cross the freeway
Width and offset from edge of roadway to provide clearance from traffic
Identifiable both during day- and night-time
Location relative to street lighting
Provision at ESB
Roadside help phones only located at ESBs
Correct provision and positioning of signage
Tunnel environments
Appropriate spacing in tunnels
Wall-mounted phones only
Locations avoid the need for people to cross the carriageway
Additional requirements
Clearly visible from traffic lanes
Correct positioning so user can keep an eye on oncoming traffic
Ground topography reasonably flat, suitable to install equipment and access by all users
Adequate height of buttons and speakers
Location of conduits and pits for power supply, communications and ITS devices
Likelihood of vandalism minimised
Electronic connections safe if sign hit by errant vehicle
Safe maintenance access to structure / device / roadside ITS cabinet
Maintenance requirements result in minimal disruption to traffic

Smart Freeways Operational Efficiency Audit Guidelines – March 2021
Document No: D20#550488 144
APPENDIX B Audit report outline
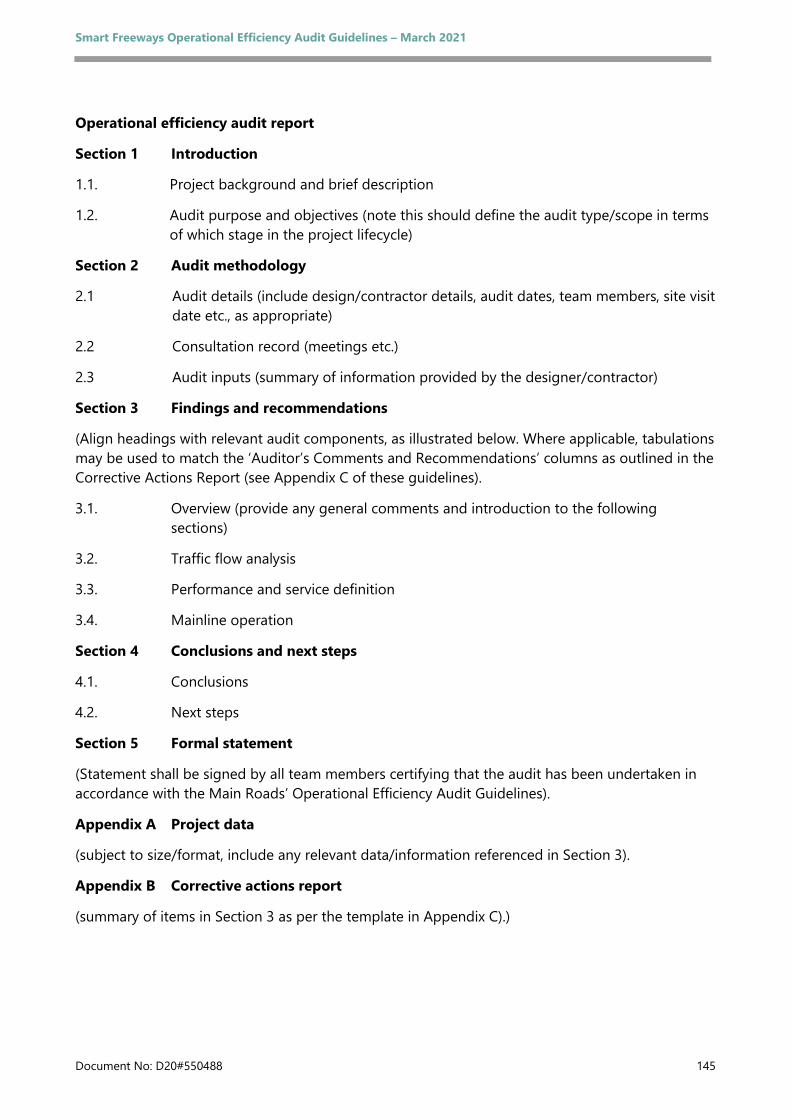
Smart Freeways Operational Efficiency Audit Guidelines – March 2021
Document No: D20#550488 145
Operational efficiency audit report
Section 1 Introduction
1.1. Project background and brief description
1.2. Audit purpose and objectives (note this should define the audit type/scope in terms of which stage in the project lifecycle)
Section 2 Audit methodology
2.1 Audit details (include design/contractor details, audit dates, team members, site visit date etc., as appropriate)
2.2 Consultation record (meetings etc.)
2.3 Audit inputs (summary of information provided by the designer/contractor)
Section 3 Findings and recommendations
(Align headings with relevant audit components, as illustrated below. Where applicable, tabulations may be used to match the ‘Auditor’s Comments and Recommendations’ columns as outlined in the Corrective Actions Report (see Appendix C of these guidelines).
3.1. Overview (provide any general comments and introduction to the following sections)
3.2. Traffic flow analysis
3.3. Performance and service definition
3.4. Mainline operation
Section 4 Conclusions and next steps
4.1. Conclusions
4.2. Next steps
Section 5 Formal statement
(Statement shall be signed by all team members certifying that the audit has been undertaken in accordance with the Main Roads’ Operational Efficiency Audit Guidelines).
Appendix A Project data
(subject to size/format, include any relevant data/information referenced in Section 3).
Appendix B Corrective actions report
(summary of items in Section 3 as per the template in Appendix C).)

Smart Freeways Operational Efficiency Audit Guidelines – March 2021
Document No: D20#550488 146
APPENDIX C Template for corrective actions report
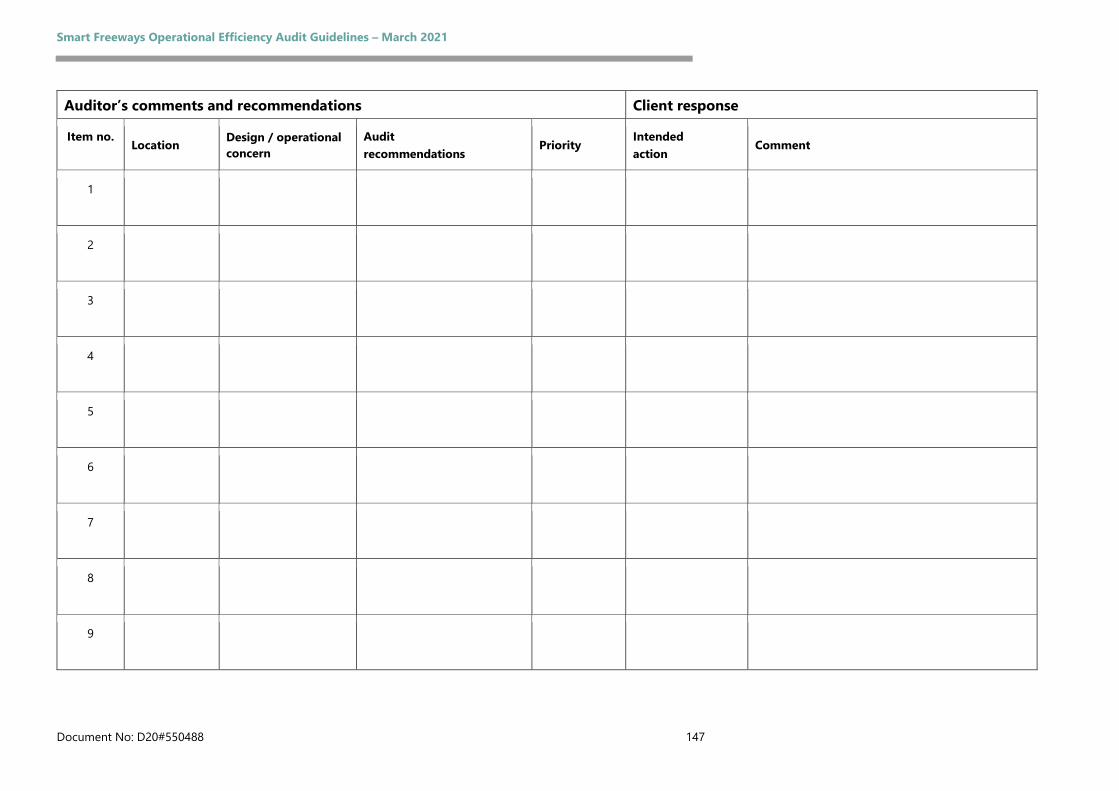
Smart Freeways Operational Efficiency Audit Guidelines – March 2021
Document No: D20#550488 147
Auditor’s comments and recommendations Client response
Item no. Location Design / operational
concern Audit recommendations
Priority Intended action
Comment
1
2
3
4
5
6
7
8
9