Embed Size (px)
Citation preview
SMART CITY TOOL
A Degree's ThesisSubmitted to the Faculty of the
Escola Tècnica d'Enginyeria de Telecomunicació de Barcelona
Universitat Politècnica de Catalunyaby
ANTONI OBIOLS SERRA
In partial fulfilment of the requirements for the degree in
ELECTRONIC SYSTEMS ENGINEERING
Advisor: JORDI FORNÉS
Barcelona, February 2015

Abstract
This project has been developed for the Austrian Institute of Technology (AIT). This institute is working in a project called CITYOPT and financed by the European Union, to improve sustainability by enabling more energy-efficient built environments. CITYOPT will be evaluated in 3 real-world cases in different climate zones: Helsinki, Vienna and Nice Côte d’Azur.
One of the requirements of the Vienna’s case is to know in real-time, the user’s behaviour and patterns. To accomplish this goal, an interface will be created to be able to monitor user’s sensations and feelings about their thermal comfort.
And is in this last part, that this project will give a solution creating a program that will help to store all the parameters needed. This project is not about the conclusions of this parameters, it's only goal is to create the tool that will give all the parameters expected.
2

Resum
Aquest project ha estat desenvolupat a l'Austrian Institute of Technology (AIT). Aquest institut està treballant en un projecte anomenat CITYOPT i finançat per la Unió Europea, per millorar la sostenibilitat, creant edificis que sigui energèticament més eficients. CITYOPT serà evaluat en tres casos reals amb diferents zones climàtiques: Helsinki, Vienna i Nice Côte d’Azur.
Un dels requeriments del cas de Viena és saber en temps real el comportament dels usuaris i els patrons descrits per aquests comportaments. Per complir aquest objectiu, una interfície serà creada per poder monitoritzar les sensacions dels usuaris respecte el seu confort tèrmic.
I és en aquesta última part on aquest projecte donarà la solució, creant el programa necessari per recopilar les dades que es busquen. No és objectiu d'aquest projecte, però, analitzar les dades aconseguides i treure'n conclusions, sinó només crear el programa.
3
Resumen
Este proyecto ha estado desarrollado en el Austrian Institute of Technology (AIT). Este instituto está trabajando en un proyecto llamado CITYOPT y financiado por la Unión Europea, para mejor la sostenibilidad, creando edificios que sean energeticamente más eficientes. CITYOPT será evaluado en tres casos reales en diferentes zonas climáticas: Helsinki, Viena y Nice Côte d’Azur.
Uno de los requerimientos del caso Viena es saber en tiempo real el comportamiento de los usuarios I los patrones descritos por esos comportamientos. Para cumplir el objetivo, una interficie será creada para poder monitorizar las sensaciones de los usuarios respeto su confort térmico.
Y es en esa última parte donde este proyecto dará solución, creando el programa necesario para recopilar los datos requeridos. No es objetivo de éste proyecto analizar los datos conseguidos y sacar conclusiones de ellos. El único objetivo es el de crear el programa.
4
Revision history and approval record
Revision Date Purpose
0 09/02/15 Document creation
1 dd/mm/yyyy Document revision
DOCUMENT DISTRIBUTION LIST
Name e-mail
ANTONI OBIOLS SERRA [email protected]
JORDI FORNÉS [email protected]
NICOLAS PARDO - GARCIA [email protected]
Written by: Reviewed and approved by:
Date 09/02/15 Date
Name ANTONI OBIOLS SERRA Name
Position Project Author Position
5
Table of contents
Abstract.............................................................................................................................2
Resum...............................................................................................................................3
Resumen...........................................................................................................................4
Revision history and approval record.................................................................................5
Table of contents................................................................................................................6
List of Figures....................................................................................................................7
List of Tables:.....................................................................................................................8
Introduction........................................................................................................................9
a.Statement of purpose (objectives)..................................................................................9
b.Requirements and specifications....................................................................................9
c.Methods and procedures, citing if this work is a continuation of another project or it uses applications, algorithms, software or hardware previously developed by other authors.....9
d.Work plan with tasks, milestones and a Gantt diagram.................................................10
e.Description of the deviations from the initial plan and incidences that may have occurred. .........................................................................................................................12
e.1.Topic.......................................................................................................................12
e.2.Topic.......................................................................................................................12
e.3.Topic........................................................................................................................12
f.State of the art of the technology used or applied in this thesis:....................................13
f.1.Topic........................................................................................................................13
f.2.Topic........................................................................................................................13
f.3.Topic.........................................................................................................................13
h.Methodology / project development: ............................................................................14
i.Results...........................................................................................................................22
j.Budget...........................................................................................................................23
k.Environment Impact (Optional).....................................................................................24
l.Conclusions and future development: ...........................................................................25
Bibliography:....................................................................................................................26
6
List of Figures
Each figure in the thesis must be listed in the “List of Figures” and each must be given a page number for its easy location.
Gantt Diagram ................................................................................................................14
1st Application (access users window) .............................................................................18
1st Application (error access window) ..............................................................................18
1st Application (thermal comfort data window) .................................................................19
2nd Application (functionality diagram) .............................................................................23
3rd Application (extract data window) ...............................................................................24
7
List of Tables:
Each table in the thesis must be listed in the “List of Tables” and each must be given a page number for its easy location.
Task (Documentation) .....................................................................................................13
Task (Software) ...............................................................................................................13
Milestones.......................................................................................................................14
Costs...............................................................................................................................26
8
Introduction
An Introduction that clearly states the rationale of the thesis that includes:
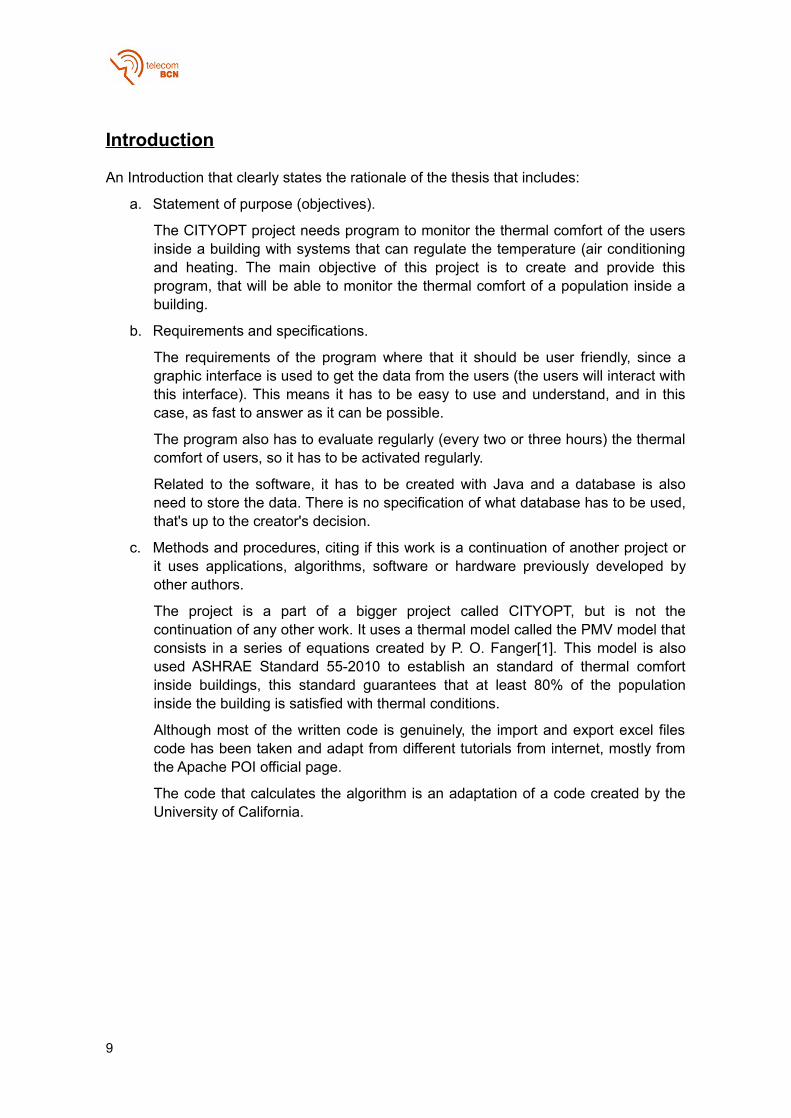
a. Statement of purpose (objectives).
The CITYOPT project needs program to monitor the thermal comfort of the users inside a building with systems that can regulate the temperature (air conditioning and heating. The main objective of this project is to create and provide this program, that will be able to monitor the thermal comfort of a population inside a building.
b. Requirements and specifications.
The requirements of the program where that it should be user friendly, since a graphic interface is used to get the data from the users (the users will interact with this interface). This means it has to be easy to use and understand, and in this case, as fast to answer as it can be possible.
The program also has to evaluate regularly (every two or three hours) the thermal comfort of users, so it has to be activated regularly.
Related to the software, it has to be created with Java and a database is also need to store the data. There is no specification of what database has to be used, that's up to the creator's decision.
c. Methods and procedures, citing if this work is a continuation of another project or it uses applications, algorithms, software or hardware previously developed by other authors.
The project is a part of a bigger project called CITYOPT, but is not the continuation of any other work. It uses a thermal model called the PMV model that consists in a series of equations created by P. O. Fanger[1]. This model is also used ASHRAE Standard 55-2010 to establish an standard of thermal comfort inside buildings, this standard guarantees that at least 80% of the population inside the building is satisfied with thermal conditions.
Although most of the written code is genuinely, the import and export excel files code has been taken and adapt from different tutorials from internet, mostly from the Apache POI official page.
The code that calculates the algorithm is an adaptation of a code created by the University of California.
9
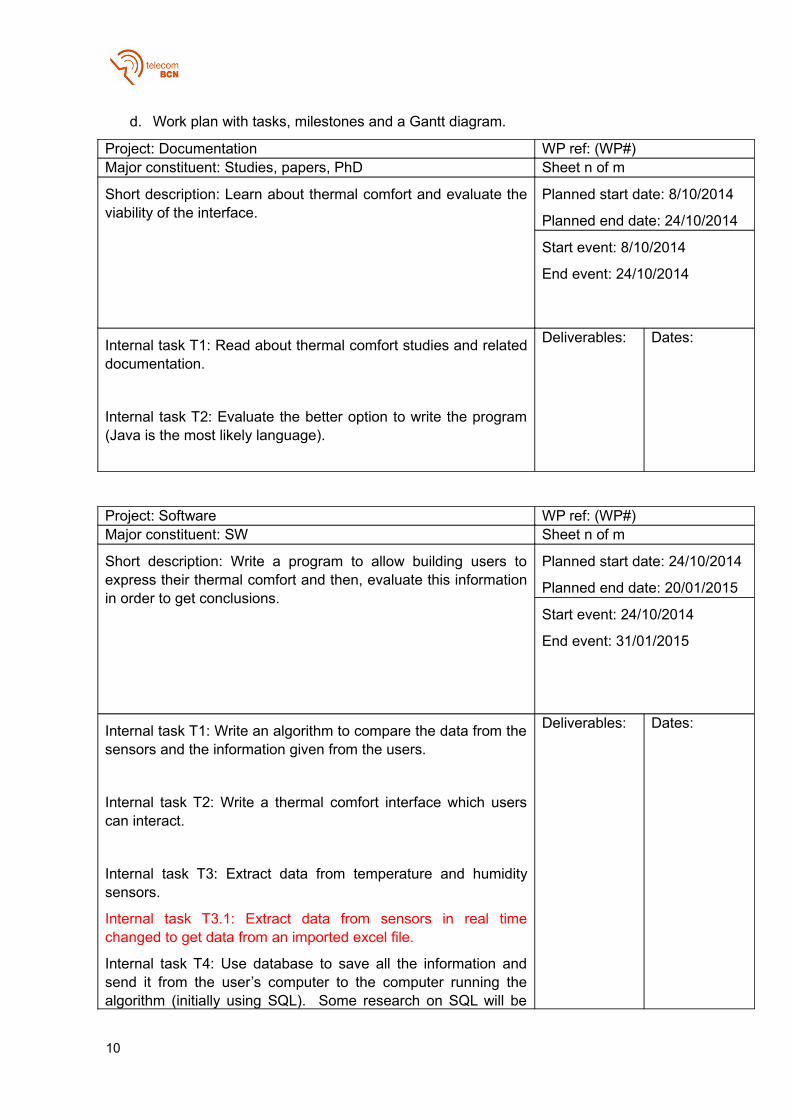
d. Work plan with tasks, milestones and a Gantt diagram.
Project: Documentation WP ref: (WP#)Major constituent: Studies, papers, PhD Sheet n of m
Short description: Learn about thermal comfort and evaluate the viability of the interface.
Planned start date: 8/10/2014
Planned end date: 24/10/2014
Start event: 8/10/2014
End event: 24/10/2014
Internal task T1: Read about thermal comfort studies and related documentation.
Internal task T2: Evaluate the better option to write the program (Java is the most likely language).
Deliverables: Dates:
Project: Software WP ref: (WP#)Major constituent: SW Sheet n of m
Short description: Write a program to allow building users to express their thermal comfort and then, evaluate this information in order to get conclusions.
Planned start date: 24/10/2014
Planned end date: 20/01/2015
Start event: 24/10/2014
End event: 31/01/2015
Internal task T1: Write an algorithm to compare the data from the sensors and the information given from the users.
Internal task T2: Write a thermal comfort interface which users can interact.
Internal task T3: Extract data from temperature and humidity sensors.
Internal task T3.1: Extract data from sensors in real time changed to get data from an imported excel file.
Internal task T4: Use database to save all the information and send it from the user’s computer to the computer running the algorithm (initially using SQL). Some research on SQL will be
Deliverables: Dates:
10
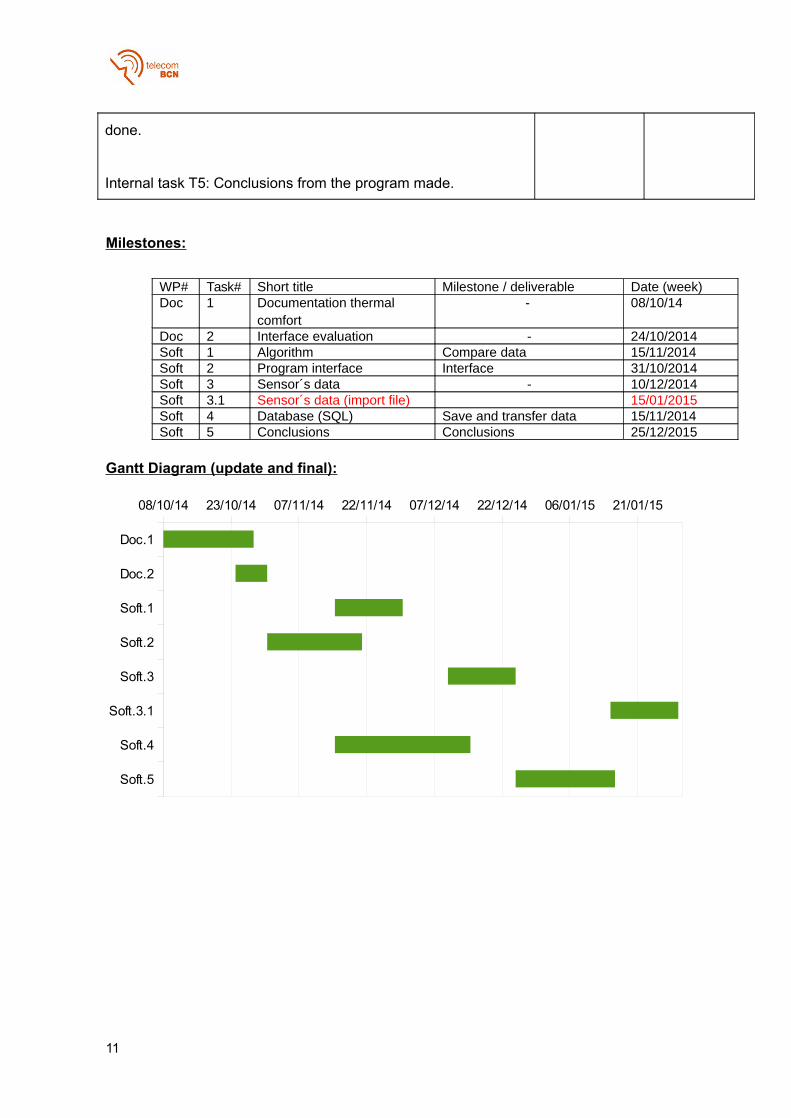
done.
Internal task T5: Conclusions from the program made.
Milestones:
WP# Task# Short title Milestone / deliverable Date (week)Doc 1 Documentation thermal
comfort- 08/10/14
Doc 2 Interface evaluation - 24/10/2014Soft 1 Algorithm Compare data 15/11/2014Soft 2 Program interface Interface 31/10/2014Soft 3 Sensor´s data - 10/12/2014Soft 3.1 Sensor´s data (import file) 15/01/2015Soft 4 Database (SQL) Save and transfer data 15/11/2014Soft 5 Conclusions Conclusions 25/12/2015
Gantt Diagram (update and final):
11
Doc.1
Doc.2
Soft.1
Soft.2
Soft.3
Soft.3.1
Soft.4
Soft.5
08/10/14 23/10/14 07/11/14 22/11/14 07/12/14 22/12/14 06/01/15 21/01/15
e. Description of the deviations from the initial plan and incidences that may have occurred.
e.1. Topic: Although the idea of getting the temperature and the relative humidity from the data sensors was first though to be in real time, and after asking several times how could I get this data, since I had no access to the sensors, in the second week of January I was told that there was nobody in the building that knew how this information could be acquired in such way. So the first idea was discarded.
With the program almost finished, I had to change the acquisition of this data by importing an excel file with the information the algorithm need. This meant to change not only the the way to acquire this data, but also a change the structure of an important part of the program, with the corresponding delay.
e.2. Topic Since I had never worked with databases, the process to understand them and write the code was more difficult than expected. Although Java provides the JDBC driver that makes things easy for the programmer, some of the structures to connect the program with the database and some of the functionalities where more complicated than first investigations had brought me to think.
e.3. Topic
Programming the algorithm also brought a lot of headaches. I had the algorithm but a 4 th
degree equation complicated things a lot. I tried Ferrari's solution, depressing it, and although there are other methods, both of the methods mention had problems because of the imaginary number results the process created.
After some more research, and having found other similar tools than the one I had to created that used this algorithm, I found one created by the University of California[2]. They used an excel file with macros, so I could get inside the macro and after some changes (changing imperial units for international units and some other change in some values), I could adapt the code so that it worked in my program.
12
State of the art of the technology used or applied in this thesis:
f.1 Topic
To program in Java I chose Netbeans[3]. Netbeans is an integrated development environment (IDE) that allows to program in Java, and debug and execute your applications. There are two other IDEs for Java, Eclipse and IntelliJ IDEA, but depending on the site you search information there is always a different IDE that it is the best, but always there is a common opinion, and that is the three IDE's are very good.
I had previously used Netbeans and some colleagues had recommended me this one, and after verifying that it had a huge community and a lot of tutorials that would help me, I chose Netbeans.
Related to Java knowledge, some books[4][5] and tutorials[5] have been of a great help during all the development of the project.
f.2 Topic
Another software I did research in was the database. I had never worked with databases but it was easy to find the one, MySQL[7]. It is open-source and free, it has a huge community behind and also lots of tutorials and example codes to interact with it in Java. And the integration through the JDBC driver (although most databases can connect through this drivers or others) was easy. Also, Netbeans had a tutorial that helped with the MySQL connections and creating the database and the tables necessary.
Apart from that, saying that MySQL is one of the databases most used in the world, which means more support and constant actualisations.
f.3. Topic
Also, some research on the comfort theory and some thermal comfort models was done. Not only the PMV model is used but other models such as the adaptive model and others are also used. The PMV model is the one I was asked to consider because it is thought for closed environments (inside a building) with static conditions (users inside this building tend to be working with the computer inside their offices) and with systems to control the temperature (heating and air conditioning).
Reading some doctoral thesis[8][9], helped me getting a bigger comprehension on the subject and also gave me some ideas on how to proceed and design the program.
13
Methodology / project development:
The whole program will consist in three different applications, they can be used independently from each other but the results depend on the previous one. The first application is the one in charge of getting the information from the users and saving it to a table from the database. The second one acquires the data from the excel file of the sensors and calculates the PMV model and saves it to another table of the database. And the third one acquires all the data from the database and stores it in an excel file to be treated in the future. Let's see how do the three applications work:
1 st application (getting data from the user):
The graphic human interfaces is the only part of the project where the users can interact. This part is basic for the project because is the only way to get the data needed from the users. This interface will appear regularly in the screen of the user, which is quite annoying if you are focused and working with the computer, so one of important things to be aware of when this part of the program is created, is to make it simple, easy and fast to answer. This means that the questions have to be clear and simple, and the responses must be fixed. The user just needs the mouse to answer all the questions, there is no need to type anything, which would be slower and harder not say impossible to quantify. Just select the option you agree with, and click to save and exit the interface.
To create the graphic interface, Java has SWING, where all the graphic objects are already created and can be allocated where you want and need just using the mouse. Basically the programmer designs the graphic interface (what the final user will see and interact with), and only has to write the code of the actions that the different graphic objects do when they are selected, if they need to do some kind of action. The part where the programmer should write the code to create the objects and allocate them is done automatically. This, on the other hand can be a problem if the programmer needs a bigger interaction with the characteristics of the objects, because SWING allows to use this objects but doesn't allow to change its code. In this case, this hasn't been a problem.
In this applications, the user will have to interact with two windows, but there are actually three. Let's see what they are for:
1. The first window ask the user where is his place in the building. The user has to enter the name of his office and his name and click OK. The application connects with a table named user in the database and checks if the name and the office are corrects. If everything is fine, the name and the office are save in a config.properties file so that next time the user uses the application he doesn't has to type it. The window will already appear with the name and office written before. And of course, if everything is fine, this window closes and the second window appears. The office and the name are sent to the next window that once it is closed, will store this information and the other inside the database.
14
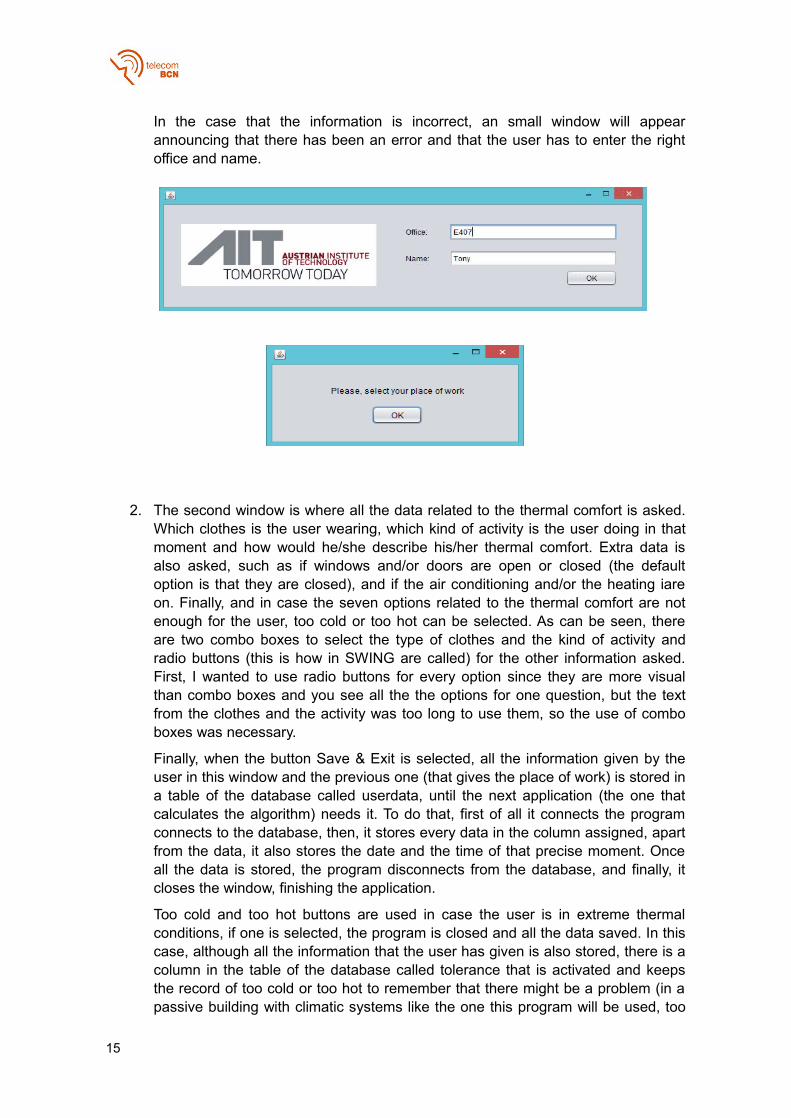
In the case that the information is incorrect, an small window will appear announcing that there has been an error and that the user has to enter the right office and name.
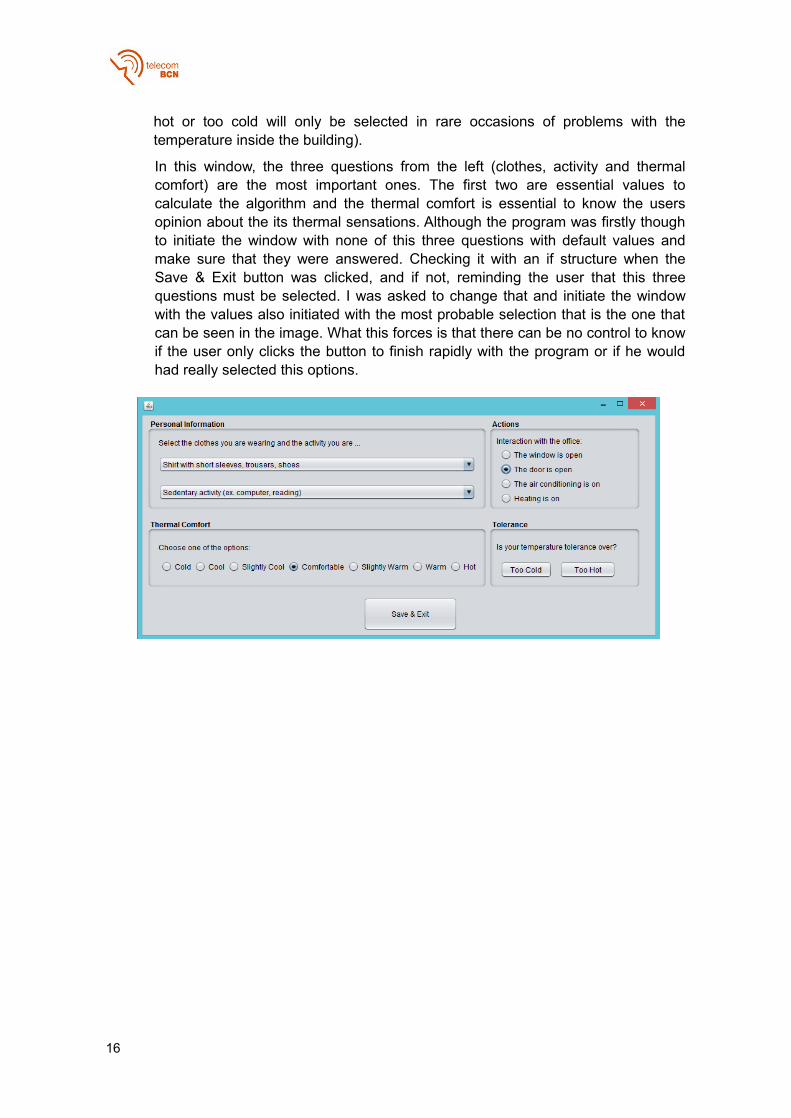
2. The second window is where all the data related to the thermal comfort is asked. Which clothes is the user wearing, which kind of activity is the user doing in that moment and how would he/she describe his/her thermal comfort. Extra data is also asked, such as if windows and/or doors are open or closed (the default option is that they are closed), and if the air conditioning and/or the heating iare on. Finally, and in case the seven options related to the thermal comfort are not enough for the user, too cold or too hot can be selected. As can be seen, there are two combo boxes to select the type of clothes and the kind of activity and radio buttons (this is how in SWING are called) for the other information asked. First, I wanted to use radio buttons for every option since they are more visual than combo boxes and you see all the the options for one question, but the text from the clothes and the activity was too long to use them, so the use of combo boxes was necessary.
Finally, when the button Save & Exit is selected, all the information given by the user in this window and the previous one (that gives the place of work) is stored in a table of the database called userdata, until the next application (the one that calculates the algorithm) needs it. To do that, first of all it connects the program connects to the database, then, it stores every data in the column assigned, apart from the data, it also stores the date and the time of that precise moment. Once all the data is stored, the program disconnects from the database, and finally, it closes the window, finishing the application.
Too cold and too hot buttons are used in case the user is in extreme thermal conditions, if one is selected, the program is closed and all the data saved. In this case, although all the information that the user has given is also stored, there is a column in the table of the database called tolerance that is activated and keeps the record of too cold or too hot to remember that there might be a problem (in a passive building with climatic systems like the one this program will be used, too
15
hot or too cold will only be selected in rare occasions of problems with the temperature inside the building).
In this window, the three questions from the left (clothes, activity and thermal comfort) are the most important ones. The first two are essential values to calculate the algorithm and the thermal comfort is essential to know the users opinion about the its thermal sensations. Although the program was firstly though to initiate the window with none of this three questions with default values and make sure that they were answered. Checking it with an if structure when the Save & Exit button was clicked, and if not, reminding the user that this three questions must be selected. I was asked to change that and initiate the window with the values also initiated with the most probable selection that is the one that can be seen in the image. What this forces is that there can be no control to know if the user only clicks the button to finish rapidly with the program or if he would had really selected this options.
16
2 nd application (getting data from the sensors and calculating the PMV algorithm):
As it is been explained, the user's interface is used to get the information from each individual and then this information is saved inside the datauser table. Once we have this information is time to get the temperature and relative humidity data and to calculate the PMV and PPD. This two values are the indicators to know the grade of satisfaction of the people that has completed the survey through the user''s interface. To do that, another little program has been created. This program has two major objectives which are the ones that will be explained and finally the complete function of the program will be detailed at the end.
Getting the data from the sensors:
The data from the sensors is extracted from an excel file with five columns. The first three columns are information to select the correct temperature and relative humidity, these information is the place of the sensor, the date and the time. With this information we can get a good approach to a kind of real time information. The other two columns are the temperature and the relative humidity.
So idea is simple, locate the sensor in place and time needed and compare it with the place and time provided by the users.
The Apache POI library has been extremely useful to deal with the excel file. It has a lot of functions to write/read different types of files, being excel (.xls) one of those.
Algorithm:
The Predicted Mean Vote (PMV) is the model use to evaluate the thermal comfort. This model is uses the principals of heat balance and data collected inside a controlled climate chamber under steady state conditions.
P. O. Fanger developed the equations to calculate the PMV, which determines the thermal sensation of the user. This equations depend on a lot of variables: clothes, metabolic rate (depends directly from the activity done), air temperature, mean radiant temperature, relative humidity, air speed, atmospheric pressure. In our equations, the air temperature and the mean radiant temperature are the same, the air speed is 0.1 m/s (the typical air speed inside buildings), and the atmospheric pressure is the atmospheric pressure at 571 meters, the altitude of Vienna (although an atmospheric pressure between 0 and 1000 meters doesn't mean practically any change in the PMV value).
So, with the adjustments in the equations made above, the only information we need to calculate the PMV are the air temperature, clothes, metabolic rate, temperature and relative humidity.
Zero is the ideal value, it means the thermal neutrality. And any value between -0,5 and 0,5 represents that the person is inside the thermal comfort zone. A higher value means excessive heat, and a lower value means excessive cold.
An other important and typical information that is asked to the users is their opinion about their thermal comfort an scale with seven options between cold and heat where comfortable is the middle one. Every option has one value assigned, from cold (-3) to heat (3) through comfortable (0).
17
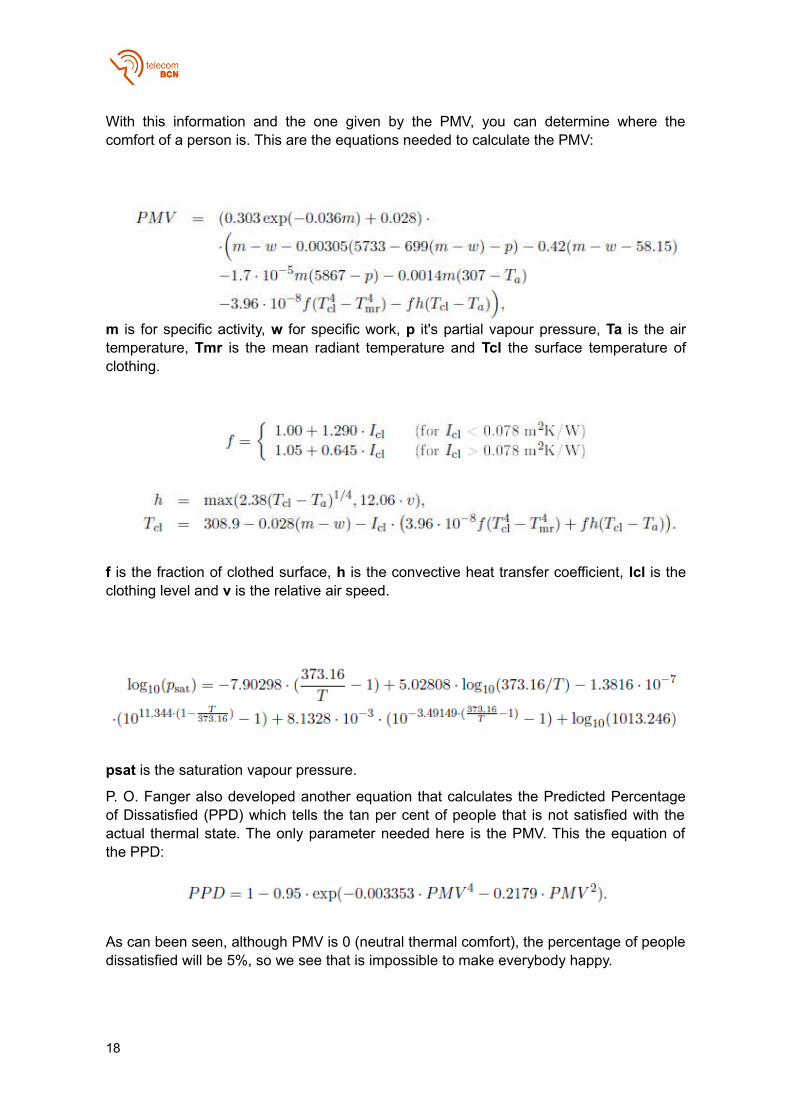
With this information and the one given by the PMV, you can determine where the comfort of a person is. This are the equations needed to calculate the PMV:
m is for specific activity, w for specific work, p it's partial vapour pressure, Ta is the air temperature, Tmr is the mean radiant temperature and Tcl the surface temperature of clothing.
f is the fraction of clothed surface, h is the convective heat transfer coefficient, Icl is the clothing level and v is the relative air speed.
psat is the saturation vapour pressure.
P. O. Fanger also developed another equation that calculates the Predicted Percentage of Dissatisfied (PPD) which tells the tan per cent of people that is not satisfied with the actual thermal state. The only parameter needed here is the PMV. This the equation of the PPD:
As can been seen, although PMV is 0 (neutral thermal comfort), the percentage of people dissatisfied will be 5%, so we see that is impossible to make everybody happy.
18
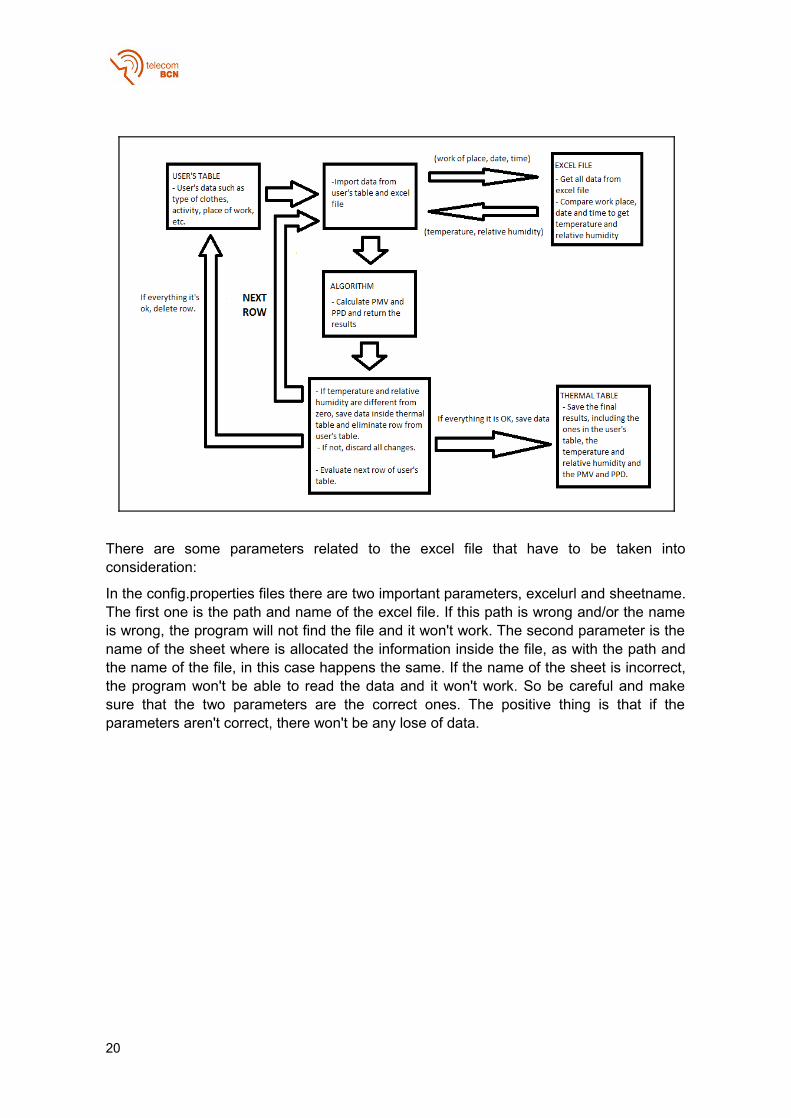
Functionality:
The program has a simple window with two buttons, one that says import and the other one that says close. The close button obviously, closes the window and the program. The button that says import, once clicked, sets in motion the different steps to import the data from the excel file containing the temperature and the relative humidity, calculate the PMV and the PPD and finally save all the important data inside a table of the database called thermal. Let's see it step by step:
1. Once the import button has been selected, the program connects to the user's table of the database where all the information has been saved.
2. It calculates the total rows available in the table and also saves into an array all the id of the different rows. After that, starts getting all the information from the first row and sends it to the algorithm function, initializing the parameters with the values given. Now, the only values needed are the temperature and relative humidity.
3. In the same time, the function to import the information from the sensors is also initialized and all the data saved inside a matrix.
4. Another function is called to compare the work place, the date and the time from the database and the excel file and extract the temperature and the relative humidity, once they are selected, they are sent also to the algorithm.
5. The algorithm calculates the PMV and the PPD (that is given in tan per cent, %).
6. Once all this process have been executed, there can be still a problem, which is that the there was no correspondence between the work place, date and time of the database and the excel file. This is known because the temperature and the relative humidity are 0. If this happens, the data won't be saved inside the thermal table of the database, the results of the PMV and the PPD will be discarded and the data inside the table of the user will remain there.
On the other hand, if everything is correct, all the values will be saved inside the thermal table and will be erased from the user's table.
7. The program will continue this process with the next row from the user's table until it has evaluated all the rows.
In the next image, that can be seen more graphically:
19
There are some parameters related to the excel file that have to be taken into consideration:
In the config.properties files there are two important parameters, excelurl and sheetname. The first one is the path and name of the excel file. If this path is wrong and/or the name is wrong, the program will not find the file and it won't work. The second parameter is the name of the sheet where is allocated the information inside the file, as with the path and the name of the file, in this case happens the same. If the name of the sheet is incorrect, the program won't be able to read the data and it won't work. So be careful and make sure that the two parameters are the correct ones. The positive thing is that if the parameters aren't correct, there won't be any lose of data.
20
3 rd application (extracting data and saving it into an excel file):
Introduction:
Once all parameters are calculated and all the data has been saved inside the thermal table of the database, this last program has been created to select from the table the dates from which we want the information and then saved it inside an excel file so that the data can be manipulated as desired for the person who needs it.
There will be three possible choices, select all the data, select just one day or select a period of time.
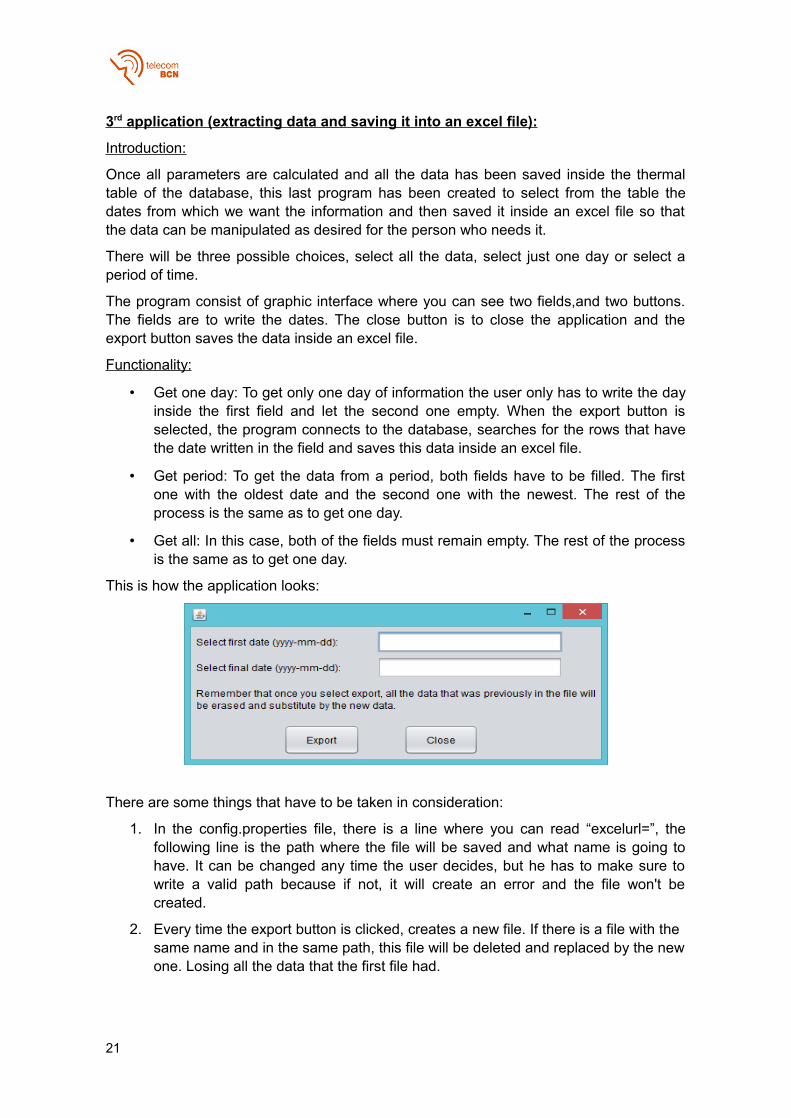
The program consist of graphic interface where you can see two fields,and two buttons. The fields are to write the dates. The close button is to close the application and the export button saves the data inside an excel file.
Functionality:
• Get one day: To get only one day of information the user only has to write the day inside the first field and let the second one empty. When the export button is selected, the program connects to the database, searches for the rows that have the date written in the field and saves this data inside an excel file.
• Get period: To get the data from a period, both fields have to be filled. The first one with the oldest date and the second one with the newest. The rest of the process is the same as to get one day.
• Get all: In this case, both of the fields must remain empty. The rest of the process is the same as to get one day.
This is how the application looks:
There are some things that have to be taken in consideration:
1. In the config.properties file, there is a line where you can read “excelurl=”, the following line is the path where the file will be saved and what name is going to have. It can be changed any time the user decides, but he has to make sure to write a valid path because if not, it will create an error and the file won't be created.
2. Every time the export button is clicked, creates a new file. If there is a file with the same name and in the same path, this file will be deleted and replaced by the new one. Losing all the data that the first file had.
21

Results
Since this project wasn't thought to get results or graphics, but to create a program in Java to deliver parameters needed to evaluate the thermal comfort of the population inside a building, the result can be that the program works as it was expected.
The program is able to get the data needed to calculate the PMV and PPD, and it also gets extra data that the algorithm doesn't need but can be used for further investigation.
Also, all the data is stored in a database. And the data can be saved into an excel file, all the data or only the data related with a period of time.
The PMV and the PPD results have been checked with an online application [10] created by the Berkeley University of California to make sure that calculates this model with the same parameters this program does.
22
Budget
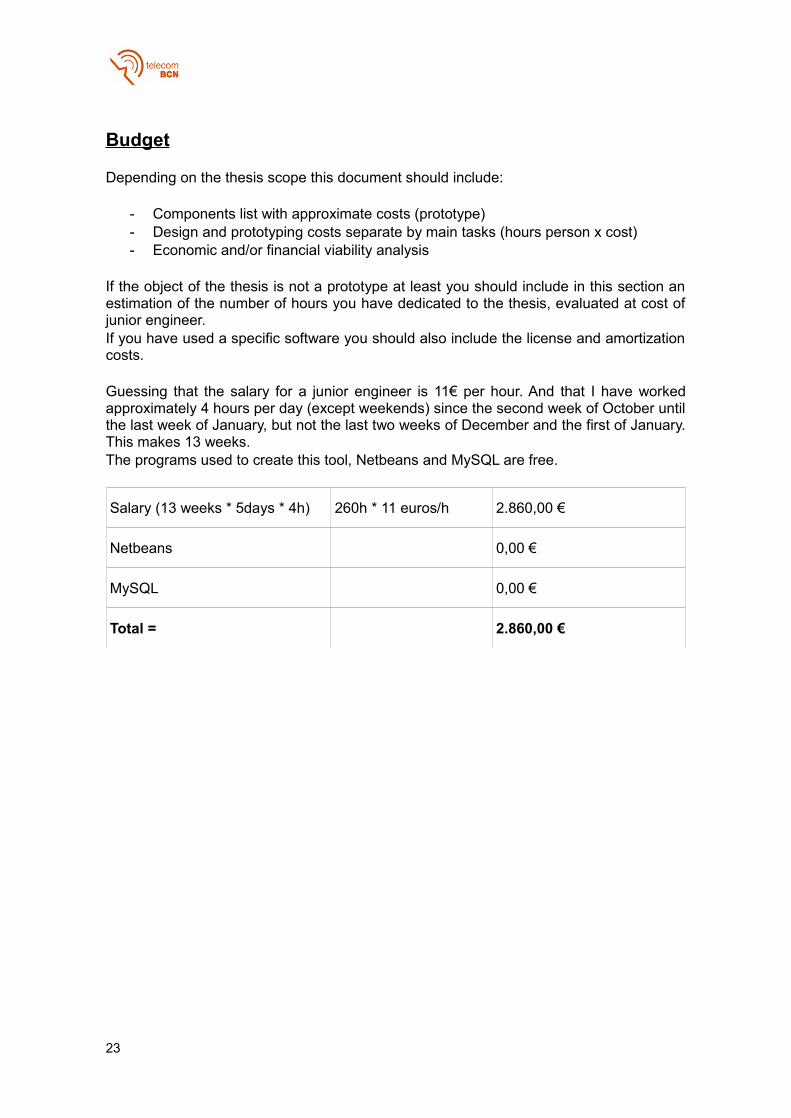
Depending on the thesis scope this document should include:
- Components list with approximate costs (prototype)- Design and prototyping costs separate by main tasks (hours person x cost)- Economic and/or financial viability analysis
If the object of the thesis is not a prototype at least you should include in this section an estimation of the number of hours you have dedicated to the thesis, evaluated at cost of junior engineer.If you have used a specific software you should also include the license and amortization costs.
Guessing that the salary for a junior engineer is 11€ per hour. And that I have worked approximately 4 hours per day (except weekends) since the second week of October until the last week of January, but not the last two weeks of December and the first of January. This makes 13 weeks.The programs used to create this tool, Netbeans and MySQL are free.
Salary (13 weeks * 5days * 4h) 260h * 11 euros/h 2.860,00 €
Netbeans 0,00 €
MySQL 0,00 €
Total = 2.860,00 €
23
Environment Impact (Optional)
The tool created is precisely to create an impact to the environment in a good way. This program will belong to a bigger project (CITYOPT) that it is investigating to improve the electrical efficiency of grids and buildings. Also, using alternative ways to provide energy to the buildings. For example, in the Vienna's case, the evaluation is done in three buildings, the three of them, are supplied by their own energy supply system. Next to this buildings, there is the facilities of Rail Tec Arsenal GmbH (RTA), the chillers they use to operate their climatic tunnel offer a huge potential of waste heat. The main objective is to integrate the buildings, their existing energy supply and storage systems, and the cooling system of RTA’s climatic tunnel into a site-wide energy system that will make use of the waste heat to cover the office buildings’ demand for heating and cooling and reduce RTA’s expenses for cooling.
24
Conclusions and future development:
The program has been created as expected. It allows users to interact with a graphic interface to give their opinion about their thermal comfort. The interfaced used is fast and easy to answer, the access to it with the office and name is faster once it has been used one time because it saves automatically the name and office that has granted the access before. The window to answer the different questions is easy to comprehend and fast to answer, only with the mouse and less than 30 seconds everything can be responded and the application be closed.
The other two applications are also easy the use, for the import application, you only have to make sure that the path where the excel file is in and the name of the sheet are the same than in the config.properties, that can be changed opening it as a text file. And then, you only have to click to the import button and the program takes care of the rest.
And for the third application, you only have to be aware of the place where the file will be stored and to write the dates in the format told.
The program has been created so that the name, path, user and password of the database can be changed so everyone in his house or in this case, in the building there should be no problem to adapt it. It also allows to change the database if this database uses the JDBC driver. For example, the postgreSQL database could work with this program, although it has not been tested.
Another important flexibility is that the access to this application can be modified by modifying the user table, granting access to new users or denying it to other users in case they won't return to this building.
I think that the goal to create a fast and easy application for the users has been achieved, and also, an easy installation of this program has also been developed.
25
Bibliography:
[1] Fanger, P.O. (1972) “Thermal comfort, analysis and applications in environmental engineering” McGraw Hill Book Company, New York.
[2] “Thermal Comfort Spreadsheet with PMV Calcs” [online] Available:
http://ceae.colorado.edu/~brandem/aren3050/tools.html [accessed: 15 December of 2014]
[3] [online] https://netbeans.org/community/index.html [accessed: 10 October of 2014]
[4] Fco.J. Ceballos (2001) “El lenguaje de la programación” Ra-Ma Editorial, Madrid
[5] J. García de Jalón, J.I. Rodriguez, I. Mingo, A. Imaz, A. Brazález, A. Larzabal, J. Calleja, J. García (2000) “Aprenda Java como si estuviera en primero” Tecnun, Universidad de Navarra.
[6] Java tutorials [online] Available:
https://www.caveofprogramming.com/library/index.html [accessed: October and November of 2014]
[7] [online] http://dev.mysql.com/ [accessed: November 2014]
[8] F. Haldi. “Towards a unified model of occupants' behaviour and comfort for building energy simulation” Ph.D. Dissertation, à la faculté environnement naturel, architectural et construit, École Polytechnique Fédérale de Lausanne, Switzerland 2010.
[9] M. Frontczak. “Human comfort and self-estimated performance in relation to indoor environmental parameters and building features” Ph.D. Dissertation, Department of civil engineering, Technical University of Denmark, 2011.
[10] “CBE thermal comfort tool” [online] Available:
http://smap.cbe.berkeley.edu/comforttool [accessed: December of 2014]
26