Embed Size (px)
Citation preview
1SLAA751–September 2017Submit Documentation Feedback
Copyright © 2017, Texas Instruments Incorporated
Smart Amp Tuning Guide
Application ReportSLAA751–September 2017
Smart Amp Tuning Guide
ChuckSmyth
ABSTRACTThe Smart Amp Tuning Guide facilitates the quick implementation of microspeaker tuning using a smartamp device such as the TAS2557 without requiring any audio tuning experience. This guide is intendedfor smart amp applications such as mobile phones, tablets, laptops, and home automation. The quicktuning procedure provides a step-by-step process for rapid tuning for the purposes of speaker matching.Tuning Elements provides a more detailed explanation of audio theory and of the useful audio blocks inthe device.
Contents1 Introduction ................................................................................................................... 22 Quick Tuning Procedure .................................................................................................... 33 System Signal Chain....................................................................................................... 114 Tuning Elements ........................................................................................................... 135 Related Documentation.................................................................................................... 22
List of Figures
1 Flat Protection................................................................................................................ 42 Pink Noise Response Curve Family ...................................................................................... 53 Equalizer Overview .......................................................................................................... 64 Pink Noise Low-Volume Matching......................................................................................... 65 DRC Crossover Filter ....................................................................................................... 76 DRC Crossover Time Constants .......................................................................................... 77 DRC Threshold Control .................................................................................................... 88 Acoustic Pink Noise Response ........................................................................................... 89 Input Power Regions ........................................................................................................ 910 Modeled Excursion from Characterization ............................................................................. 1011 GUI Verification Page ..................................................................................................... 1012 Smart Amp Signal Chain ................................................................................................. 1113 Device Control GUI Tile .................................................................................................. 1214 Input Gain Control ......................................................................................................... 1315 Equalizer and Biquad Control ............................................................................................ 1416 SmartEQ Control and Response ......................................................................................... 1417 DRC Controls ............................................................................................................... 1518 Typical Compression Sequence for Optimal Loudness—DRC Input, No Compression .......................... 1619 Typical Compression Sequence for Optimal Loudness—DRC Output, Compressed............................. 1620 Typical Compression Sequence for Optimal Loudness—DRC Output, Compressed With Makeup Gain ..... 1621 DRC Compression Ratio Curve .......................................................................................... 1722 DRC Time Constant Controls............................................................................................. 1823 DRC Filter Controls ........................................................................................................ 1824 DRC Makeup Gain ......................................................................................................... 1825 Automatic Noise Gate Control ............................................................................................ 19

Introduction www.ti.com
2 SLAA751–September 2017Submit Documentation Feedback
Copyright © 2017, Texas Instruments Incorporated
Smart Amp Tuning Guide
26 Manual Noise Gate Setting ............................................................................................... 1927 Protection Controls......................................................................................................... 2028 Thermal Protection Priority................................................................................................ 2129 PBE Controls................................................................................................................ 21
List of Tables
TrademarksPurePath is a trademark of Texas Instruments.Windows is a registered trademark of Microsoft Corporation.All other trademarks are the property of their respective owners.
1 IntroductionThe task of optimizing the sound pressure level (SPL) and sound quality of a micro-speaker for mass-market, low-power applications can be very challenging. The combination of digital signal processor(DSP), digital-to-analog converter (DAC), and smart amp protection provide the audio engineer with manytools and knobs with which to achieve the best quality sound for the small-form factor speakers popular inportable low-power devices like mobile phones, tablets, laptop computers, and home automation. Micro-speakers are especially limited in maximum SPL and bass response due to the small diaphragm size;however, the smart amp allows the user to tune the speaker to achieve the maximum audio quality from alimited speaker. For professionals in the audio industry, learning from the target audience (customer) as towhat their key audio priorities are is important to make adjustments to their preference. However, thereare some universal qualities and characteristics of a good balanced tuning. Most customers generallywant the same ideal sound: as loud as possible, strong and tight bass response, low distortion, warm andsmooth sound, voice clarity, stereo balance, flat response, and of course, speaker protection. Achieving allof these goals is usually very difficult, so tuning is often a matter of determining the customer’s priorities.Some customers are willing to sacrifice SPL to achieve a flatter, more-balanced response. Somecustomers prioritize SPL at the risk of a narrower tone. A well-designed speaker, combined with the smartamp, typically enables a well-rounded sound which can then be fine-tuned to the customer’s preference.
This application report makes many references to the PurePath™ Console 3 (PPC3) graphical userinterface (GUI) used for both integrated and non-integrated smart amp solutions, such as the TAS2557EVM. This document does not cover proper installation, navigation, and elementary proficiency withPPC3. This application report mainly focuses on the “Tuning and Audio Processing” tile under the devicehome page of the GUI and expands on certain tuning tools in the GUI.
This report does not address speaker characterization. While proper speaker characterization is actuallyquite critical to a good tuning and is integrated into PPC3 and the EVM hardware, this report assumes thespeaker parameters, such as the Re, Bl, Xmax, Tmax, Sd, Thiele-Small model, and temperature modelare measured and loaded correctly into the .ppc3 file before proceeding with the tuning. Perform a fullcharacterization with the combination of PPC3, the smart amp EVM, and the learning board (soldseparately). The user can also import parameters from one .ppc3 file to another or enter them manually ifacquired by other means.
This report also assumes that the speaker normalization is complete. Even though speaker normalizationis not included in the characterization page of the GUI (and is found in the Audio Processing section), theuser should consider this as a required post-characterization step which is critical to any good tuning.Normalization allows the smart amp algorithm to compensate for the inherent high-frequency impedanceresponse caused by the Le of the speaker. The volume of the test signal in the wizard can be left at thedefault value of –12 dB.
This report only address the mono tuning mode and does not address the dual mono mode used in stereoapplications with multiple devices. The user can apply all of the tuning strategy that this report proposes toeach speaker of a stereo application. However, note that stereo applications can benefit from additionaltuning such as phase alignment, ganged dynamic range compression (DRC), or linked smart ampprotection.
www.ti.com Quick Tuning Procedure
3SLAA751–September 2017Submit Documentation Feedback
Copyright © 2017, Texas Instruments Incorporated
Smart Amp Tuning Guide
2 Quick Tuning ProcedureA deep understanding of audio and speaker fundamentals, as well as familiarity with the smart ampdevice, is extremely helpful toward achieving the optimal tuning but takes time and practice to develop.The goal of this application report is to facilitate rapid implementation of quality audio for any speakerusing the smart amp technology, with little audio experience required. This procedure excludes detail onany particular feature to focus on the minimum steps required for any good tuning. This documentprovides details on certain features and functions, which are referenced and located throughout thedocument.• See Section 3 for details on the signal path.• See Section 4 for detail on the tuning blocks and good tuning practices.
This particular section focuses on the common example of reference matching, where the user isattempting to match the acoustic response of the target device to a reference sound source. In somecases the customer has a particular reference device, such as a phone, that has the audio performanceand character that they want to replicate in their product. This reference is a great place to start for tuningbecause it gives the tuner some direction of audio priority as well as some objectivity. In this report, thedevice under tuning refers to the target device and the reference refers to the reference device. Tuning tomatch only one speaker at a time is preferable; so, use left-only or right-only tracks on the referencedevice if possible.
TI highly recommends that the user study the algorithm signal chain before tuning to understand the effectand sequential order of each signal path block on the audio signal. TI also recommends to tune thespeaker in the quietest room available for both measurement and listening purposes.
2.1 Initialize TuningOne very important task is to “neutralize” every step of the signal chain before tuning, so as to start withthe natural speaker response. As a best practice, determine at all times which steps of the signal chainare enabled and which affect the sound. For instance, the user should bypass all equalization (EQ),dynamic range compression (DRC) , and psycho-acoustic bass (PBE), smart amp protection, and inputgain as much as possible at the beginning of any tuning. Bypass any preprocessing of the audiooriginating from the system host as well. When using the in-system tuning tool to tune a product throughUSB, any audio processing from the host processor must be bypassed.
A recurring check that can prevent frustration throughout the process is to ensure that the system gain isset to a known reference value. The soundcard playback volume found in a Windows audio deviceconfiguration (often available as a shortcut key on the keyboard) is responsible for setting the systemvolume in the case of EVM tuning. In the case of a reference device used for comparison, such as amobile phone, the volume buttons on the phone hardware usually control the phone system volume.Ensure that the system audio setting does not have an artificial limit that prevents the device fromachieving the maximum volume. The personal computer (PC) and mobile device scales can often differ instep size, so when comparing two sound sources it is best to simply keep all device system volume at themaximum. Setting the source volumes at the maximum specification allows for the maximum SPL out ofthe smart amp and ensures a fair comparison to a reference source. This practice also accounts for theartifacts of high-volume tuning, such as unwanted distortion and compression.
Quick Tuning Procedure www.ti.com
4 SLAA751–September 2017Submit Documentation Feedback
Copyright © 2017, Texas Instruments Incorporated
Smart Amp Tuning Guide
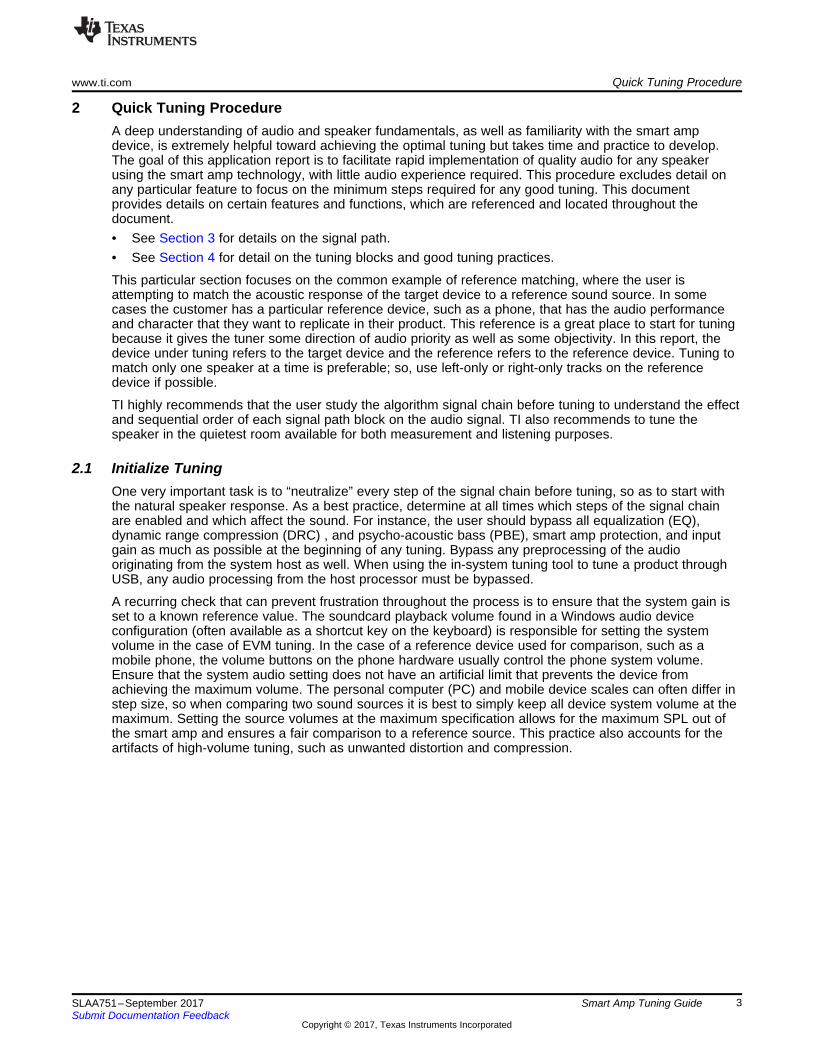
2.2 Flatten ProtectionThe user can only truly bypass the speaker protection section of the algorithm in one of the ROM modesand not in tuning mode. However, the tuning does require tuning mode, where the user cannot bypassexcursion and thermal protection but merely avoid it. The default values for the protection tuning in PPC3are sufficient in most cases. TI recommends a thermal and excursion priority of 1, 1, and 1.
Figure 1 shows an example of a flat protection tuning.
Figure 1. Flat Protection
2.3 Frequency Response MatchingThis subsection addresses how the tuner can use the smart amp tuning elements of input gain, EQ, DRC,PBE, and smart amp to match the pink noise response of a reference sound source. At this point the usermust implement the EVM or prototype device, PPC3 GUI, a microphone, any audio player software, andan audio analysis software tool, such as RoomEQ Wizard.
Use a prepared playlist of reference pink noise audio tracks here starting with 0 dBFS or –6 dBFS anddecreasing to –78 dBFS. Most audio processing software can generate these audio tracks. If thereference device has more than one speaker, the user must utilize a left-only or right-only track to avoidmeasuring the stereo response of the device. Alternatively, ask the TI audio engineer to provide thesefiles. After acquiring these tracks, copy the files to the reference device and open the tracks in an audioplayer on the PC connected to the target device. TI recommends to make a playlist from the noise trackson each device.
2.4 Microphone SetupFor the next step, set up the microphone for mono input and open the audio analysis software to a real-time fast-Fourier transform (FFT) analyzer tool where the input to the FFT data is the microphone data.Arrange the microphone orientation directly toward the speaker port of the reference device with adistance of approximately 10 cm. Play the loudest pink noise track on the reference device and adjust themicrophone gain so that there is no clipping or overdrive on the microphone system input. This level canusually be seen in the sound devices recording window on a Windows® operating system (OS). Note theimportance of retaining the same system volume, microphone distance, and microphone gain for allcomparison testing. The absolute level of the gain or input signal is not important, but it is important tostay consistent. If a microphone audio reference device is available, the microphone can be calibratedusing this, but it is not necessary when only making a device comparison measurement.

www.ti.com Quick Tuning Procedure
5SLAA751–September 2017Submit Documentation Feedback
Copyright © 2017, Texas Instruments Incorporated
Smart Amp Tuning Guide
2.5 Record Reference Device ResponsePlay each noise track on the reference device and record and save the frequency response for each track.These recordings eventually produce a family of curves similar to that in Figure 2. This family of curvesdefine the pink noise response of the reference device and contains a lot of information on the referencesound for use later in the tuning process.
Figure 2. Pink Noise Response Curve Family
2.6 Set Input GainNow point the microphone toward the target device speaker port at the exact same distance and keep thesame gain as before. Play the –48-dB pink noise through the PC audio player, EVM, and target speaker.Use the audio analysis software to overlay the –48-dB pink noise response of the reference device ontothe new target device response. Adjust the input gain of the target device by using the input gain control inPPC3 until the average level of the two plots match as much as possible. This matching does not have tobe accurate. Sometimes, the frequency response shape of the two devices is quite different, which makesmatching the two curves across the frequency difficult. The point of this step is to only match the generalsound level across the entire band, not at all the individual frequency regions.
2.7 Equalizer and SmartEQThe next step is to use the smart amp equalizer to match the shape of the curve across the spectrum asmuch as possible. See Section 4 for details on using the equalizer and SmartEQ. The most commonbiquad to use for adjusting the EQ is the “Equalizer (Bandwidth) or Equalizer (Q Factor)”, which functionsas a band-pass filter where the center frequency, gain, and width can be adjusted. Adjustments to thebass shelf, treble shelf, and low-pass filter can also be useful. Continue to play the –48-dB pink noise onthe target device and overlap the target device response and the reference device response as before.Use the available biquads to match the target response to the reference response as best possible.
Figure 3 shows an overview of the equalizer tool. Figure 4 shows an example of low-volume pink noisematching.

Quick Tuning Procedure www.ti.com
6 SLAA751–September 2017Submit Documentation Feedback
Copyright © 2017, Texas Instruments Incorporated
Smart Amp Tuning Guide
Figure 3. Equalizer Overview
Figure 4. Pink Noise Low-Volume Matching
After completing this step, record the target device response for the –48-dB pink noise as well as –78 dBthrough –24 dB. If the –48-dB target device response matches the reference response, then the remainingplots up to –24 dB are likely to match as well. This occurrence is known as low-volume response, or low-volume tuning, which is not affected by any DRC or speaker protection, but only the input gain and EQ.
www.ti.com Quick Tuning Procedure
7SLAA751–September 2017Submit Documentation Feedback
Copyright © 2017, Texas Instruments Incorporated
Smart Amp Tuning Guide
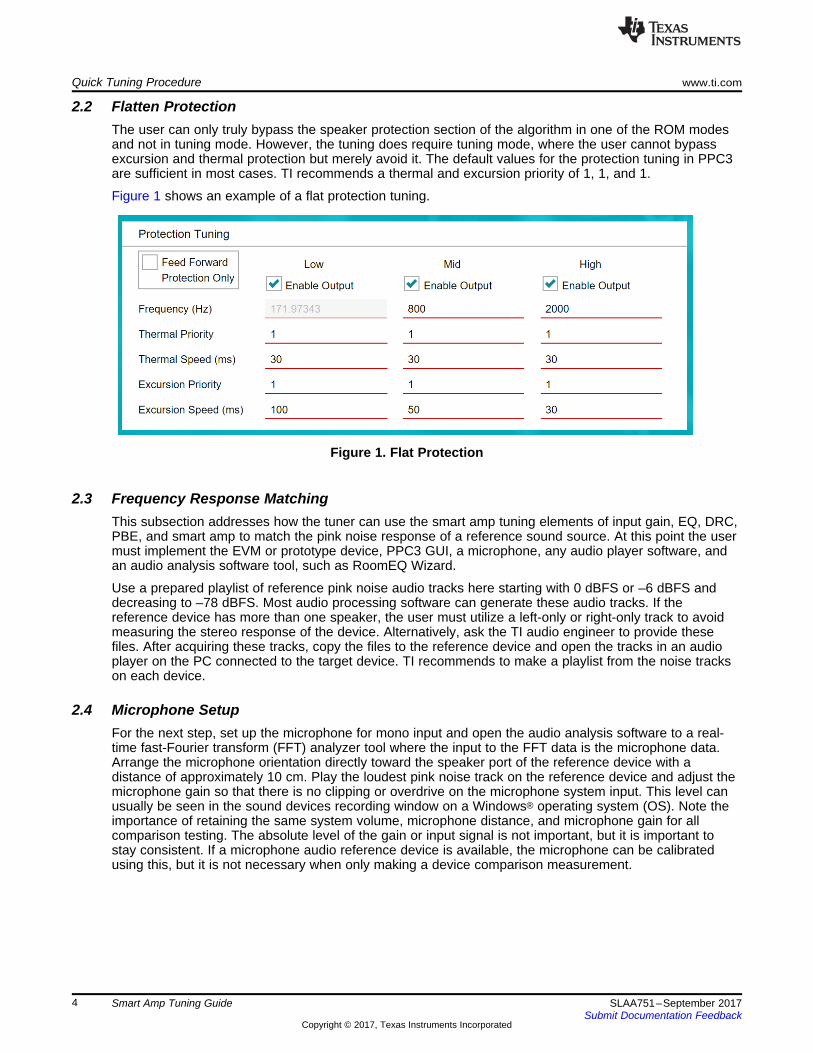
2.8 Dynamic Range Compression (DRC)After completing the low-volume tuning, the next step is to incorporate the DRC for mid- to high-volumetuning. For details regarding the function and purpose of the DRC, see Section 4. On the DRC page, clickthe enable button at the top right to enable the global DRC function. Next, click on the Crossover buttonon the right side to reveal the crossover controls. Set the crossover filter and time constant settings asshown in Figure 5 and Figure 6.
Figure 5. DRC Crossover Filter Figure 6. DRC Crossover Time Constants
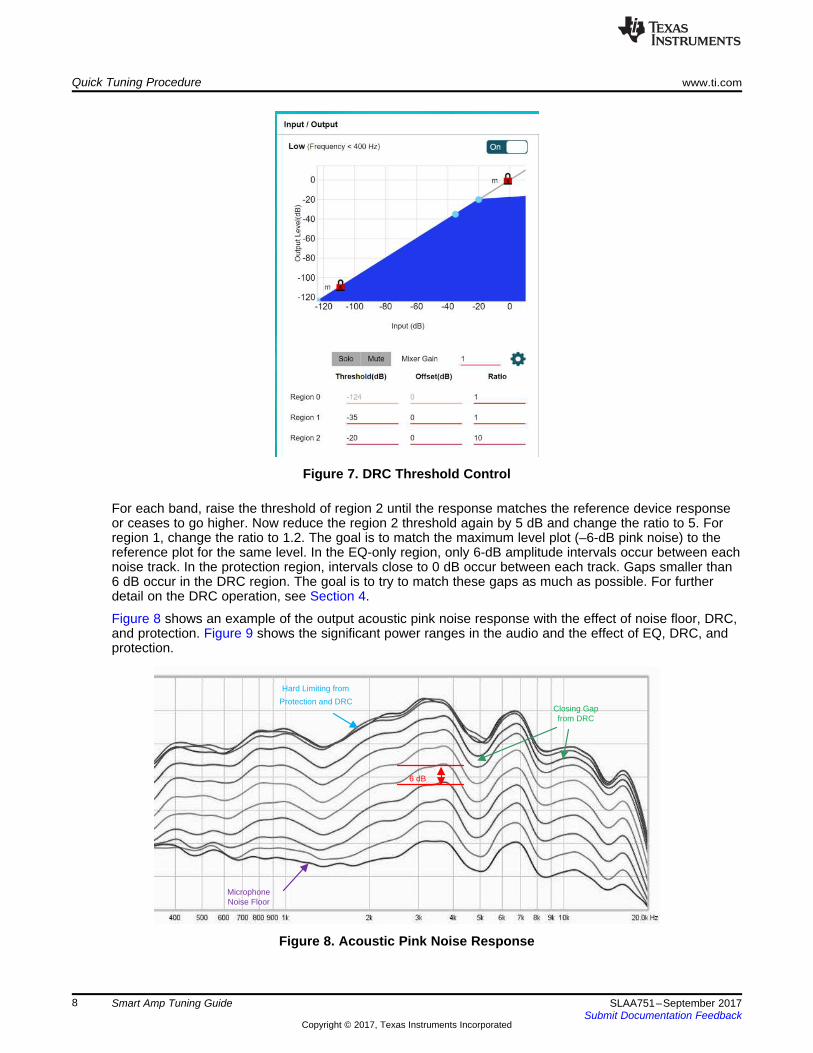
Next, set the compression input and output configuration for each band as shown in Figure 7. Do notchange the mixer gain or offset—this is a very harsh limiter that prevents most of the high-volume signalfrom reaching the protection stage. In fact, this limiter effect can be visible with the pink noise in the audioanalysis software.
6 dB
Hard Limiting from
Protection and DRCClosing Gap from DRC
MicrophoneNoise Floor
Quick Tuning Procedure www.ti.com
8 SLAA751–September 2017Submit Documentation Feedback
Copyright © 2017, Texas Instruments Incorporated
Smart Amp Tuning Guide
Figure 7. DRC Threshold Control
For each band, raise the threshold of region 2 until the response matches the reference device responseor ceases to go higher. Now reduce the region 2 threshold again by 5 dB and change the ratio to 5. Forregion 1, change the ratio to 1.2. The goal is to match the maximum level plot (–6-dB pink noise) to thereference plot for the same level. In the EQ-only region, only 6-dB amplitude intervals occur between eachnoise track. In the protection region, intervals close to 0 dB occur between each track. Gaps smaller than6 dB occur in the DRC region. The goal is to try to match these gaps as much as possible. For furtherdetail on the DRC operation, see Section 4.
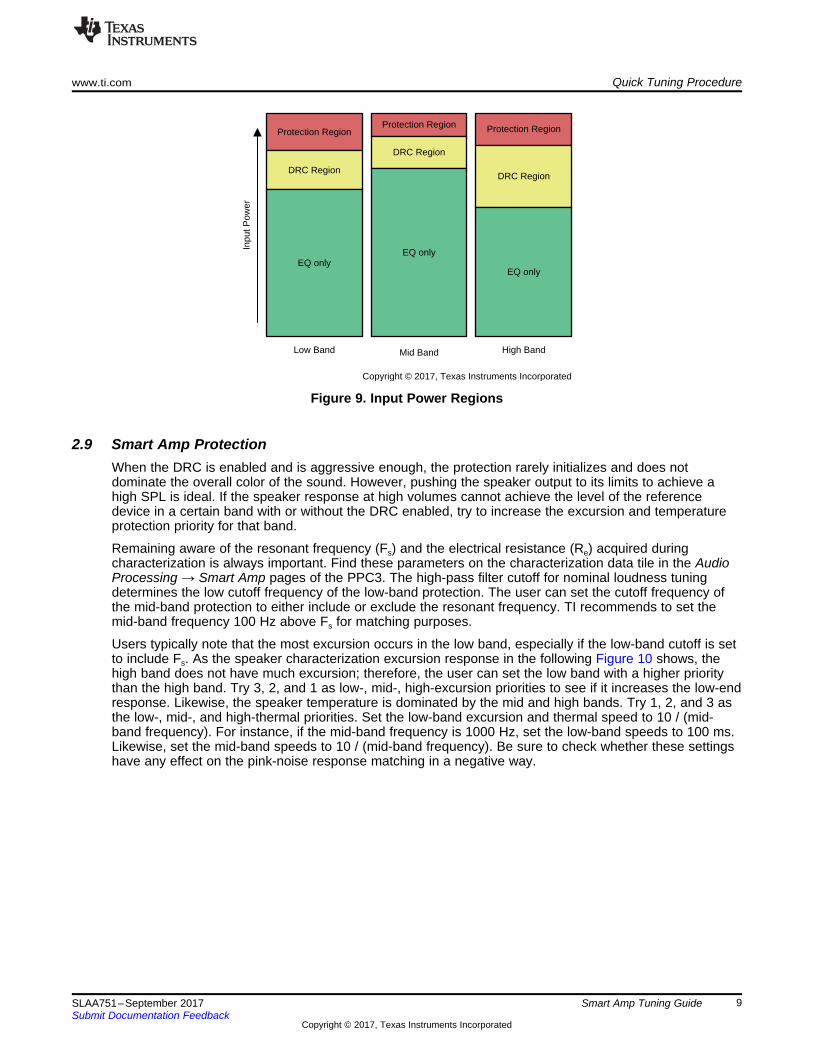
Figure 8 shows an example of the output acoustic pink noise response with the effect of noise floor, DRC,and protection. Figure 9 shows the significant power ranges in the audio and the effect of EQ, DRC, andprotection.
Figure 8. Acoustic Pink Noise Response
Protection Region
DRC Region
EQ only
Protection Region
DRC Region
EQ only
Protection Region
DRC Region
EQ only
Low Band Mid Band High Band
Inpu
t Pow
er
Copyright © 2017, Texas Instruments Incorporated
www.ti.com Quick Tuning Procedure
9SLAA751–September 2017Submit Documentation Feedback
Copyright © 2017, Texas Instruments Incorporated
Smart Amp Tuning Guide
Figure 9. Input Power Regions
2.9 Smart Amp ProtectionWhen the DRC is enabled and is aggressive enough, the protection rarely initializes and does notdominate the overall color of the sound. However, pushing the speaker output to its limits to achieve ahigh SPL is ideal. If the speaker response at high volumes cannot achieve the level of the referencedevice in a certain band with or without the DRC enabled, try to increase the excursion and temperatureprotection priority for that band.
Remaining aware of the resonant frequency (Fs) and the electrical resistance (Re) acquired duringcharacterization is always important. Find these parameters on the characterization data tile in the AudioProcessing → Smart Amp pages of the PPC3. The high-pass filter cutoff for nominal loudness tuningdetermines the low cutoff frequency of the low-band protection. The user can set the cutoff frequency ofthe mid-band protection to either include or exclude the resonant frequency. TI recommends to set themid-band frequency 100 Hz above Fs for matching purposes.
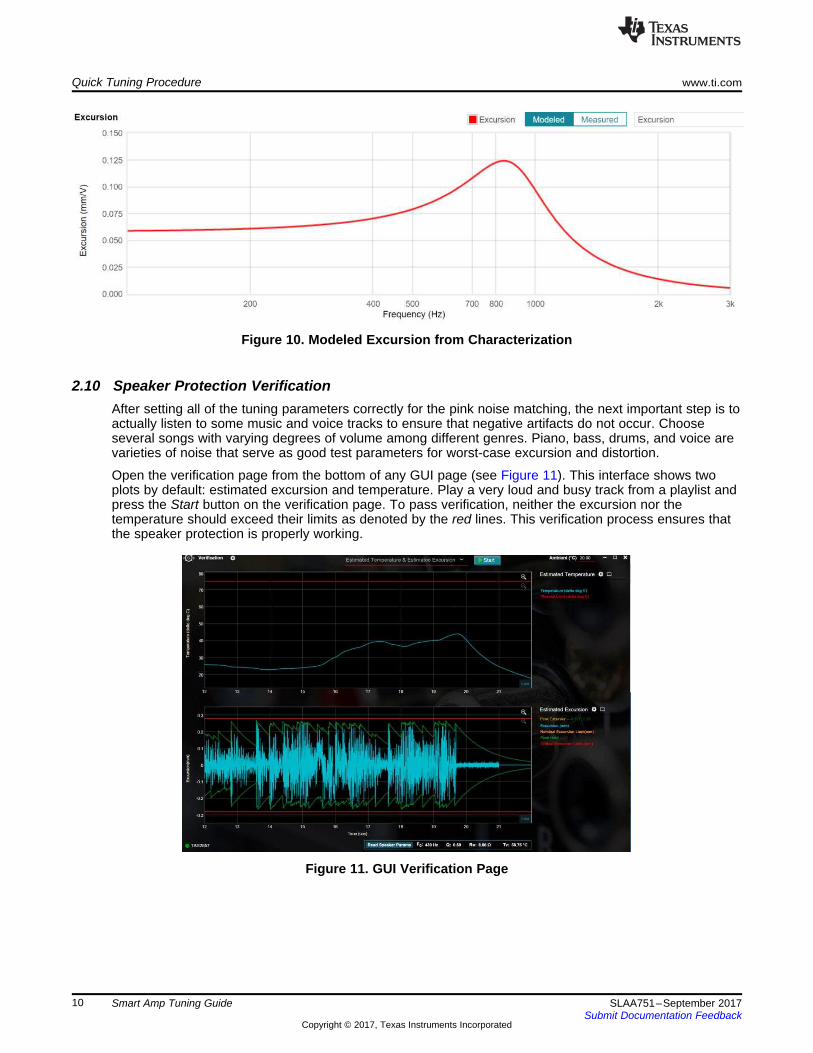
Users typically note that the most excursion occurs in the low band, especially if the low-band cutoff is setto include Fs. As the speaker characterization excursion response in the following Figure 10 shows, thehigh band does not have much excursion; therefore, the user can set the low band with a higher prioritythan the high band. Try 3, 2, and 1 as low-, mid-, high-excursion priorities to see if it increases the low-endresponse. Likewise, the speaker temperature is dominated by the mid and high bands. Try 1, 2, and 3 asthe low-, mid-, and high-thermal priorities. Set the low-band excursion and thermal speed to 10 / (mid-band frequency). For instance, if the mid-band frequency is 1000 Hz, set the low-band speeds to 100 ms.Likewise, set the mid-band speeds to 10 / (mid-band frequency). Be sure to check whether these settingshave any effect on the pink-noise response matching in a negative way.
Quick Tuning Procedure www.ti.com
10 SLAA751–September 2017Submit Documentation Feedback
Copyright © 2017, Texas Instruments Incorporated
Smart Amp Tuning Guide
Figure 10. Modeled Excursion from Characterization
2.10 Speaker Protection VerificationAfter setting all of the tuning parameters correctly for the pink noise matching, the next important step is toactually listen to some music and voice tracks to ensure that negative artifacts do not occur. Chooseseveral songs with varying degrees of volume among different genres. Piano, bass, drums, and voice arevarieties of noise that serve as good test parameters for worst-case excursion and distortion.
Open the verification page from the bottom of any GUI page (see Figure 11). This interface shows twoplots by default: estimated excursion and temperature. Play a very loud and busy track from a playlist andpress the Start button on the verification page. To pass verification, neither the excursion nor thetemperature should exceed their limits as denoted by the red lines. This verification process ensures thatthe speaker protection is properly working.
Figure 11. GUI Verification Page

TAS2557
DSP
Host
Pre-processingI2C
PBE SpeakerSmart Amp Protection
��([FXUVLRQ�3URWHFWLRQ
��7KHUPDO�3URWHFWLRQ
��$QWL-clipper
Input Gain
EQ DRCClass
D
Feedback Path
OUT
VSENSE
www.ti.com System Signal Chain
11SLAA751–September 2017Submit Documentation Feedback
Copyright © 2017, Texas Instruments Incorporated
Smart Amp Tuning Guide
3 System Signal ChainUnderstanding the smart amp signal chain can be very helpful for optimizing sound level and quality whileavoiding distortion or undesirable effects from overdriving the audio signal. This signal flow also facilitatesthe debugging of unwanted artifacts from the tuning. TI generally recommends to tune the speaker in theorder consistent with the signal path. The gain stages in the chain are: host system gain, hostpreprocessing, input gain, EQ, DRC makeup gain, and the class-D gain
Figure 12 shows the audio signal chain through the TAS2557.
Figure 12. Smart Amp Signal Chain
• Host:The host processor provides the I2S to the smart amp input. TI recommends to disable any audiopreprocessing in the host before proceeding to the tuning.
• PBE:The PBE is an optional advanced feature for low-frequency response enhancement. TI recommends totune this last despite its place in the chain. The PBE feeds into the input gain stage.
• Input gain:The input gain is a simple digital gain applied to the post-PBE input signal. This gain stage has adramatic effect on the output volume and sound quality. TI recommends to tune this first, especially forreference device matching, and then adjust this value at the end of tuning to help avoid distortion andover-compression. A value of a 0-dB gain is equivalent to bypassing this stage. The output of this gainstage feeds directly into the EQ.
• EQ:The EQ is an optional block of the chain but the most influential part of speaker tuning. The broadspectrum input gain stage greatly influences the input to the EQ block, which is further limited by theDRC stage. The EQ is used to color and shape the general sound of the speaker output. TIrecommends to tune this immediately after the input gain and with low-volume input signals as to avoidinfluencing the sound with the DRC and protection stages. This block feeds into the DRC stage.
• DRC:The DRC is a highly-recommended (but optional) advanced feature of the smart amp. The Input to theDRC block comes from the output of the EQ block. The output feeds into the smart amp protectionblock.
• Protection and feedback:The protection and feedback is a critical and final stage of the smart-amp-algorithm digital path usedfor speaker protection. This stage controls the final digital gain in three bands based on the input fromthe DRC and from the feedback path. If all other stages are bypassed, this stage continues to protectthe speaker from overexcursion and overtemperature and also colors the output sound based on thepriority settings.
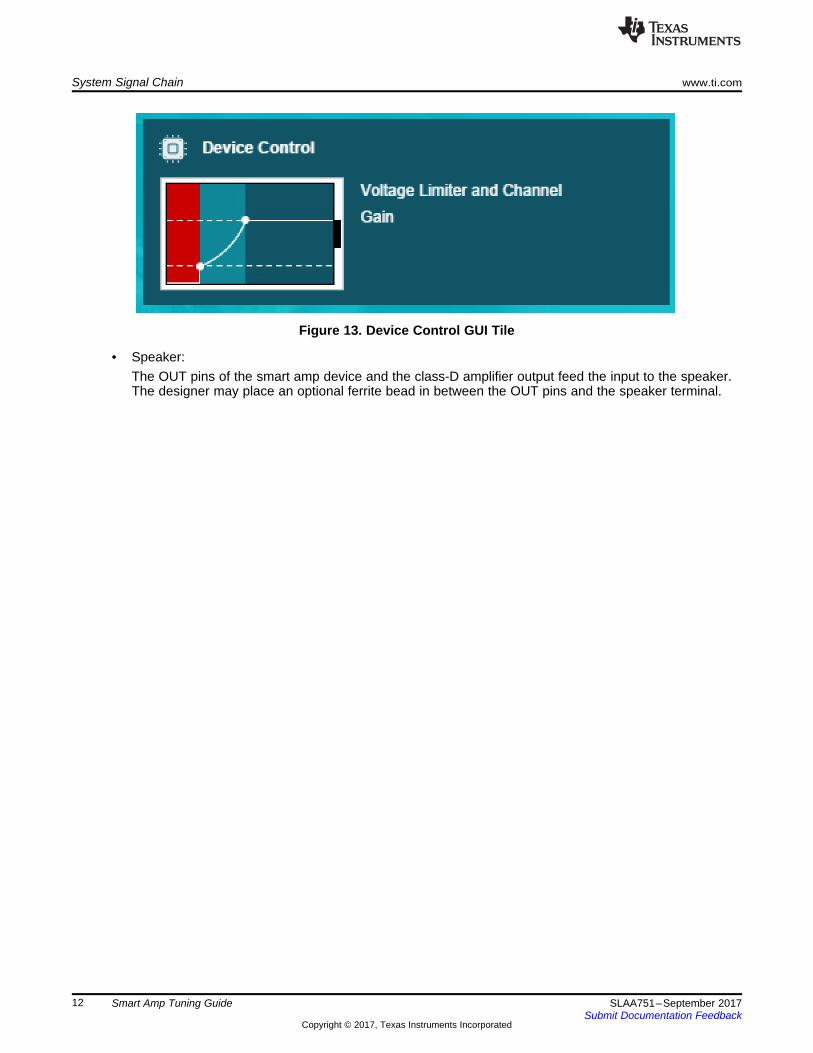
• Class-D:The digital input to the class-D amplifier comes from the output of the DSP, specifically the speakerprotection stage. The analog output of the class-D amplifier feeds to the device pin and then to thespeaker. The designer can control the class-D amplifier parameters, which are listed under the homepage of the GUI, using the “Device Control” tile (see Figure 13). TI does not recommend modifying anyof the default settings found here, including the amplifier gain.
System Signal Chain www.ti.com
12 SLAA751–September 2017Submit Documentation Feedback
Copyright © 2017, Texas Instruments Incorporated
Smart Amp Tuning Guide
Figure 13. Device Control GUI Tile
• Speaker:The OUT pins of the smart amp device and the class-D amplifier output feed the input to the speaker.The designer may place an optional ferrite bead in between the OUT pins and the speaker terminal.

www.ti.com Tuning Elements
13SLAA751–September 2017Submit Documentation Feedback
Copyright © 2017, Texas Instruments Incorporated
Smart Amp Tuning Guide
4 Tuning Elements
4.1 Input GainLocated in the upper-right corner of the Audio Processing page, the input gain is a simple digital gain onthe post-PBE input signal. The ideal setting can vary widely between speakers and is usually subject touser preference. For mobile phone and tablet speakers, the input gain is typically set between +2 dB to+12 dB. Setting the input gain too high can result in a loud but very compressed or distorted sound at theoutput when the input signal is large. Choosing an overly aggressive setting with this gain to achieve ahigh SPL output is common, but this has negative consequences on sound quality. Toggling thesymbol also allows the user to quickly mute or unmute the input signal.
Figure 14. Input Gain Control
4.2 Equalizer and SmartEQ
4.2.1 BiquadsLocated under the Audio Processing page, the biquad stage comprises ten biquad filters which feature anarray of filter options such as first-order or second-order low-pass and high-pass, notch, bass and trebleshelf, and band pass. The configuration options vary by filter type. The most typical filter is the equalizer,where the range can be set as the bandwidth or Q.
Figure 15 shows an example setting for a bandpass filter using the EQ control.
Tuning Elements www.ti.com
14 SLAA751–September 2017Submit Documentation Feedback
Copyright © 2017, Texas Instruments Incorporated
Smart Amp Tuning Guide
Figure 15. Equalizer and Biquad Control
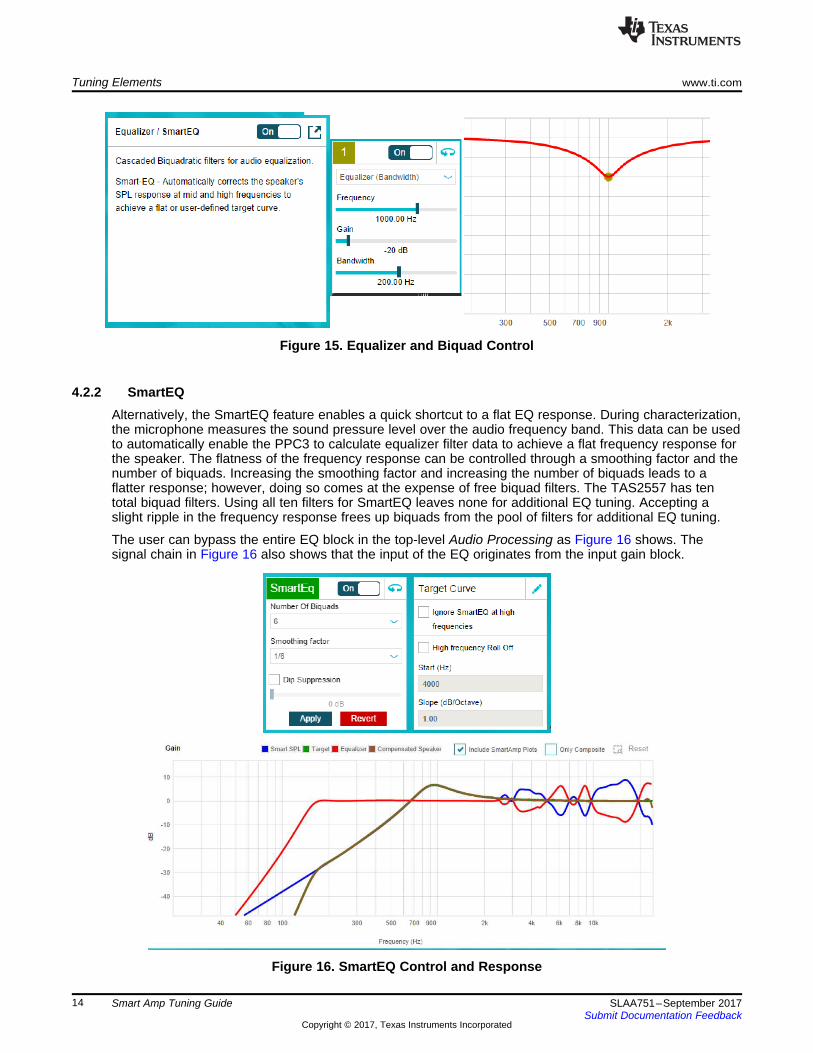
4.2.2 SmartEQAlternatively, the SmartEQ feature enables a quick shortcut to a flat EQ response. During characterization,the microphone measures the sound pressure level over the audio frequency band. This data can be usedto automatically enable the PPC3 to calculate equalizer filter data to achieve a flat frequency response forthe speaker. The flatness of the frequency response can be controlled through a smoothing factor and thenumber of biquads. Increasing the smoothing factor and increasing the number of biquads leads to aflatter response; however, doing so comes at the expense of free biquad filters. The TAS2557 has tentotal biquad filters. Using all ten filters for SmartEQ leaves none for additional EQ tuning. Accepting aslight ripple in the frequency response frees up biquads from the pool of filters for additional EQ tuning.
The user can bypass the entire EQ block in the top-level Audio Processing as Figure 16 shows. Thesignal chain in Figure 16 also shows that the input of the EQ originates from the input gain block.
Figure 16. SmartEQ Control and Response

www.ti.com Tuning Elements
15SLAA751–September 2017Submit Documentation Feedback
Copyright © 2017, Texas Instruments Incorporated
Smart Amp Tuning Guide
4.3 DRCThe smart amp DRC available in the TAS2557 features three distinct bands separated by customizablefirst- or second-order filter crossovers and also enables configuration of typical compressor parameterssuch as threshold, ratio, attack, release, cutoff frequencies for each band, and global makeup gain (seeFigure 17).
Figure 17. DRC Controls
DRC is a very-powerful audio processing tool which is often used in several segments of the audioindustry from professional studio and live environments to small audio electronics. Compression is theprocess of reducing the dynamic range of an audio signal by attenuating the loud signals and amplifyingthe soft signals. Compression can help to make audio sound louder without actually increasing themaximum output level of the signal. Because micro-speakers are subject to an excursion limit, but alsohave a reputation for low SPL output, DRC is a great tool to expand the apparent volume of the speakersound while helping the protection block to limit the output signal level, and therefore, the excursion.
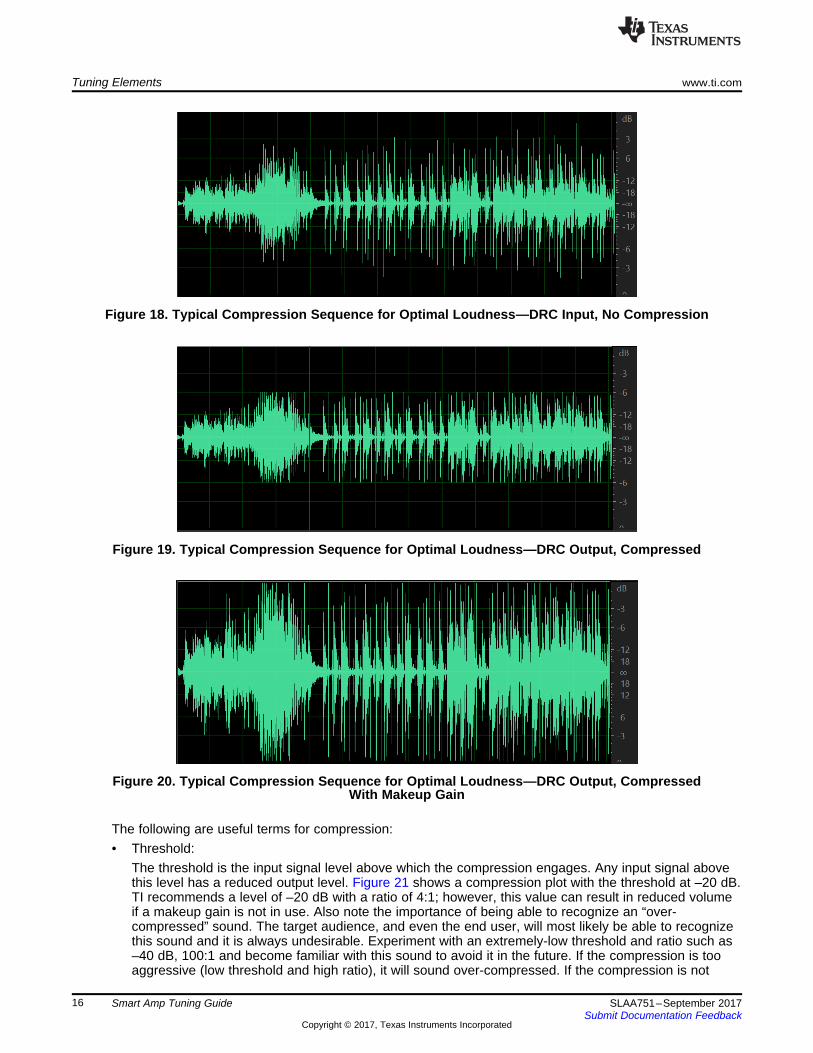
The typical procedure is to reduce the high-volume amplitude of the signal without affecting the low-volume portions of the signal. When these high-volume peaks are reduced, a makeup gain can be addedto then increase the volume of the entire signal. In Figure 18, Figure 19, and Figure 20, signal A is theoriginal, unprocessed audio track which has a few points of peak amplitude that prevent the entire trackfrom being amplified without distortion. When these peaks are amplified past the full-scale value, they canoften result in a distorted sound. Signal B shows the result after using a very harsh compression at –6 dBand, as a result, there is no signal content above –6 dB. Signal C then shows the result when signal B isamplified or normalized after the compression stage. Now the signal is at the maximum amplitude for thehigh-energy (loud) signals, but also the low-energy (quiet) parts of the track are louder than in signal A. Ifthe compression is not too aggressive, the loss of volume in the peaks is negligible and unnoticeable,while the rest of the track sounds noticeably louder.
Tuning Elements www.ti.com
16 SLAA751–September 2017Submit Documentation Feedback
Copyright © 2017, Texas Instruments Incorporated
Smart Amp Tuning Guide
Figure 18. Typical Compression Sequence for Optimal Loudness—DRC Input, No Compression
Figure 19. Typical Compression Sequence for Optimal Loudness—DRC Output, Compressed
Figure 20. Typical Compression Sequence for Optimal Loudness—DRC Output, CompressedWith Makeup Gain
The following are useful terms for compression:• Threshold:
The threshold is the input signal level above which the compression engages. Any input signal abovethis level has a reduced output level. Figure 21 shows a compression plot with the threshold at –20 dB.TI recommends a level of –20 dB with a ratio of 4:1; however, this value can result in reduced volumeif a makeup gain is not in use. Also note the importance of being able to recognize an “over-compressed” sound. The target audience, and even the end user, will most likely be able to recognizethis sound and it is always undesirable. Experiment with an extremely-low threshold and ratio such as–40 dB, 100:1 and become familiar with this sound to avoid it in the future. If the compression is tooaggressive (low threshold and high ratio), it will sound over-compressed. If the compression is not

www.ti.com Tuning Elements
17SLAA751–September 2017Submit Documentation Feedback
Copyright © 2017, Texas Instruments Incorporated
Smart Amp Tuning Guide
aggressive enough (high threshold and low ratio), the output signal will feed into protection region andsound harsh.
• Ratio:This term refers to the ratio of the input signal to output signal above the threshold. Ratio determinesthe amount of compression applied to the signal, which is denoted as input level:output level. A signalregion unaffected by compression has a ratio of 1:1. A typical ratio can be 2:1 to 5:1. A 10:1 ratio orhigher is an extreme case of compression known as a “limiter”. A limiter is useful for maximizing theoutput signal, but is often used after a compressor in the signal chain. The speaker protection region ofthe smart amp acts more like a limiter than a compressor. Therefore, the DRC is useful to control andlimit the dynamics of the signal with more variability and with a softer effect than the protection as toprevent a harsh sound while still maximizing the output level. When the ratio is less than 1, this iscalled “expansion” and this increases the gain of low-volume signals while leaving louder signalsunaffected. The following Figure 21 shows a compression with ratio 2:1 above the threshold. When theinput signal level is at 0 dB (full-scale), the output level is at –10 dB.
Figure 21. DRC Compression Ratio Curve
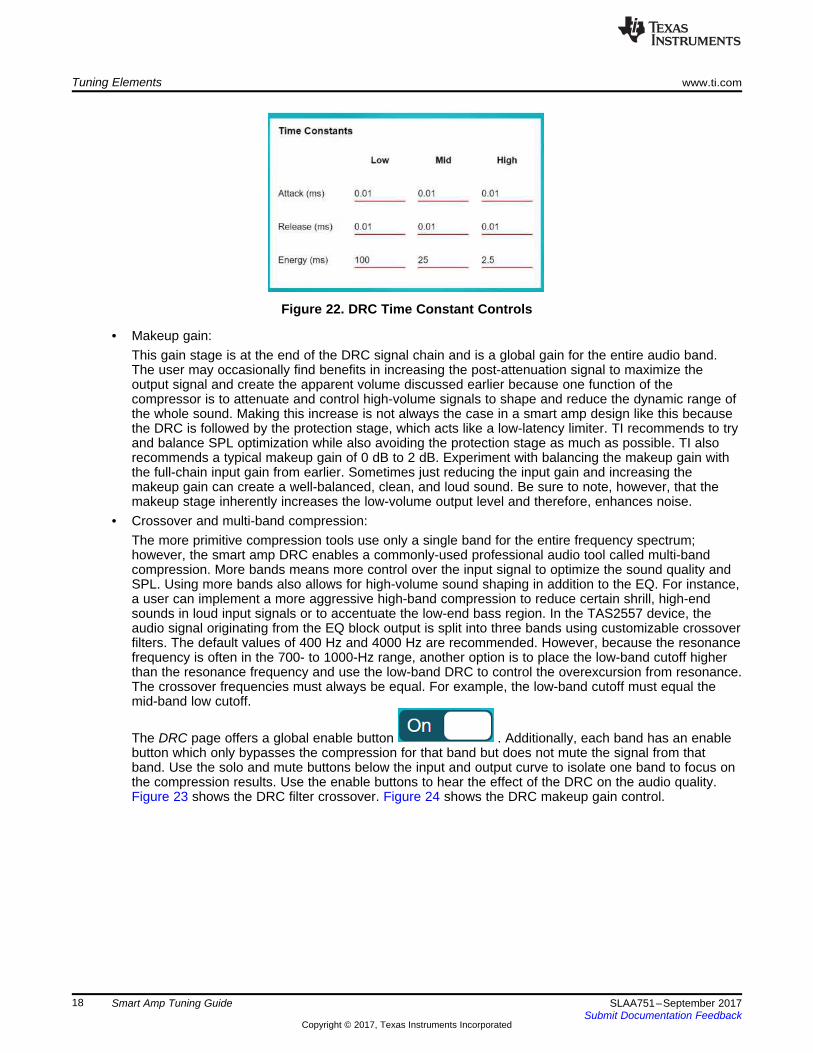
• Attack, release, and energy time constants:These controls introduce a degree of control over how quickly the compressor reacts to the inputsignal. The DRC requires a good estimation of the input signal to function. The DRC is estimated inthree steps. The energy time constant calculates the level of the input signal. Next, the input andoutput relationship is calculated, and finally the DRC control signal is smoothed by the attack andrelease times. The attack time determines the amount of time to reduce the signal gain after the inputsignal level has surpassed the threshold level. When the input signal has fallen back below thethreshold, the release time determines the time to bring the output signal back up to its original gain.The recommended values for time constants in the smart amp DRC are 10 / flow for the energy, whereflow is the low cutoff frequency of the DRC crossover band filter and 0.01 ms for the attack and releasetime (see Figure 22). For example, if the mid-band-crossover low cutoff is 400 Hz, then set the energytime for the mid-band to 25 ms and the attack and release to 0.01 ms. The user can set the energy forthe low-band to 100 ms. The energy time constant, which is not seen in a typical compressor,introduces a delay in the reaction time of the compressor much like attack and release delays. For thisreason, the attack and release times are often not required in this DRC, but are available to addadditional reaction control.
Tuning Elements www.ti.com
18 SLAA751–September 2017Submit Documentation Feedback
Copyright © 2017, Texas Instruments Incorporated
Smart Amp Tuning Guide
Figure 22. DRC Time Constant Controls
• Makeup gain:This gain stage is at the end of the DRC signal chain and is a global gain for the entire audio band.The user may occasionally find benefits in increasing the post-attenuation signal to maximize theoutput signal and create the apparent volume discussed earlier because one function of thecompressor is to attenuate and control high-volume signals to shape and reduce the dynamic range ofthe whole sound. Making this increase is not always the case in a smart amp design like this becausethe DRC is followed by the protection stage, which acts like a low-latency limiter. TI recommends to tryand balance SPL optimization while also avoiding the protection stage as much as possible. TI alsorecommends a typical makeup gain of 0 dB to 2 dB. Experiment with balancing the makeup gain withthe full-chain input gain from earlier. Sometimes just reducing the input gain and increasing themakeup gain can create a well-balanced, clean, and loud sound. Be sure to note, however, that themakeup stage inherently increases the low-volume output level and therefore, enhances noise.
• Crossover and multi-band compression:The more primitive compression tools use only a single band for the entire frequency spectrum;however, the smart amp DRC enables a commonly-used professional audio tool called multi-bandcompression. More bands means more control over the input signal to optimize the sound quality andSPL. Using more bands also allows for high-volume sound shaping in addition to the EQ. For instance,a user can implement a more aggressive high-band compression to reduce certain shrill, high-endsounds in loud input signals or to accentuate the low-end bass region. In the TAS2557 device, theaudio signal originating from the EQ block output is split into three bands using customizable crossoverfilters. The default values of 400 Hz and 4000 Hz are recommended. However, because the resonancefrequency is often in the 700- to 1000-Hz range, another option is to place the low-band cutoff higherthan the resonance frequency and use the low-band DRC to control the overexcursion from resonance.The crossover frequencies must always be equal. For example, the low-band cutoff must equal themid-band low cutoff.
The DRC page offers a global enable button . Additionally, each band has an enablebutton which only bypasses the compression for that band but does not mute the signal from thatband. Use the solo and mute buttons below the input and output curve to isolate one band to focus onthe compression results. Use the enable buttons to hear the effect of the DRC on the audio quality.Figure 23 shows the DRC filter crossover. Figure 24 shows the DRC makeup gain control.

www.ti.com Tuning Elements
19SLAA751–September 2017Submit Documentation Feedback
Copyright © 2017, Texas Instruments Incorporated
Smart Amp Tuning Guide
Figure 23. DRC Filter Controls Figure 24. DRC Makeup Gain
• Ganged DRC:For stereo applications, where the two-speaker responses are identical, TI usually recommends togang the DRC for channels A and B in dual mono mode. This ganged DRC configuration indicates thatwhen the input signal level of either channel reaches the threshold value, both channel gains arereduced simultaneously, which enhances the sensation of stereo sound. In some audio tracks, oneside of the stereo image is much louder due to panning. Without ganging the two channels, the DRConly reduces the loud side and leaves the quiet side unmodified, which can create unwanted artifactsin the stereo image and disorientation in the listener. If the two speakers are not identical and havevery different responses, ganged DRC can also cause negative artifacts in the sound and is usually notrecommended. Find the gang feature at the top-right of the DRC page.
• Noise gate:Another useful feature of the DRC and a common tool in professional audio is the noise gate. Thepurpose of the noise gate is to reduce unwanted, low-volume noise by attenuating any signal below aset noise gate threshold. The gain curve in Figure 26 shows the effective response of the noise gateand also shows another way to implement the noise gate. The noise gate can help to create theeffective sound of a higher-dynamic range by reducing the small-signal response. Experiment with asolo drum track and make an extreme noise gate of a –30-dB threshold and –100-dB attenuation tounderstand the effect of this feature.
Tuning Elements www.ti.com
20 SLAA751–September 2017Submit Documentation Feedback
Copyright © 2017, Texas Instruments Incorporated
Smart Amp Tuning Guide
Figure 25. Automatic Noise Gate Control Figure 26. Manual Noise Gate Setting
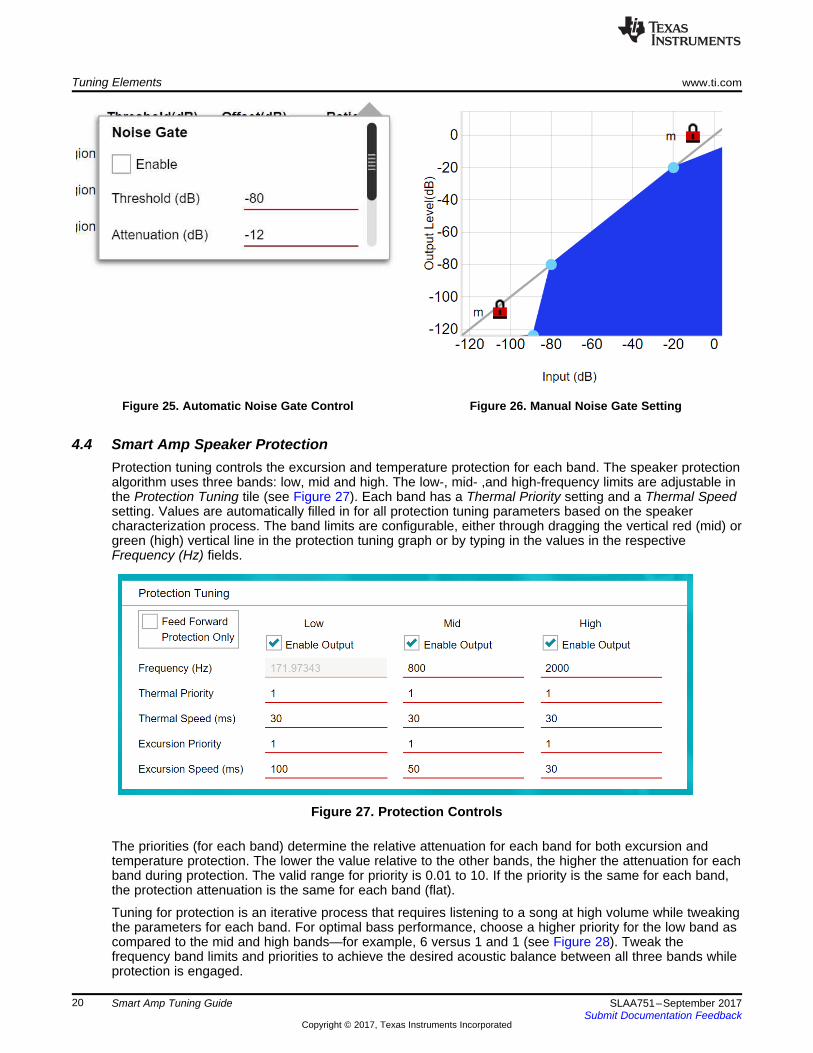
4.4 Smart Amp Speaker ProtectionProtection tuning controls the excursion and temperature protection for each band. The speaker protectionalgorithm uses three bands: low, mid and high. The low-, mid- ,and high-frequency limits are adjustable inthe Protection Tuning tile (see Figure 27). Each band has a Thermal Priority setting and a Thermal Speedsetting. Values are automatically filled in for all protection tuning parameters based on the speakercharacterization process. The band limits are configurable, either through dragging the vertical red (mid) orgreen (high) vertical line in the protection tuning graph or by typing in the values in the respectiveFrequency (Hz) fields.
Figure 27. Protection Controls
The priorities (for each band) determine the relative attenuation for each band for both excursion andtemperature protection. The lower the value relative to the other bands, the higher the attenuation for eachband during protection. The valid range for priority is 0.01 to 10. If the priority is the same for each band,the protection attenuation is the same for each band (flat).
Tuning for protection is an iterative process that requires listening to a song at high volume while tweakingthe parameters for each band. For optimal bass performance, choose a higher priority for the low band ascompared to the mid and high bands—for example, 6 versus 1 and 1 (see Figure 28). Tweak thefrequency band limits and priorities to achieve the desired acoustic balance between all three bands whileprotection is engaged.

www.ti.com Tuning Elements
21SLAA751–September 2017Submit Documentation Feedback
Copyright © 2017, Texas Instruments Incorporated
Smart Amp Tuning Guide
Figure 28. Thermal Protection Priority
The speed values for both thermal and excursion determine the attenuation release speed. Lower valuesdeliver more power to the speaker because the attenuation is released quickly if protection is notnecessary; however, this can lead to pulsating artifacts if another excursion or temperature violation isdetected in fast succession. Choose the shortest value that does not produce audible artifacts.
The user can disable each band check box for debugging persistent sound artifacts (distortion or pulsatingartifacts). For example, if a low-frequency artifact is present, disable the mid and high bands and tweakthe priority and speed settings for the low band until the artifact is removed.
4.5 PBEPsychoacoustic bass is used to enhance the perceived low-end response of the speaker withoutintroducing actual additional excursion at low frequencies where micro-speakers often already have limitedexcursion headroom. The controls for this feature are enable, gain (0-1), and desired center frequency. TIrecommends to balance the cutoff frequency with the gain. For instance, use a cutoff of 200 Hz with a0.25-dB to 0.4-dB gain, or use 400 Hz with a 0.1-dB gain (see Figure 29). When used properly, thisfeature can really add punch and boom to the speaker low-end. Experiment by increasing the gain to 1and the cutoff to 500 Hz to hear the effect. This feature expands the low-end sound, but to an excessivedegree that causes the bass response to sound “messy”. TI recommends choosing a more conservativesetting to avoid this artifact. Also, recall that this feature is placed at the beginning of the signal chain andis affected by all other stages. Find the PBE control in the GUI on the Audio Processing page.
Figure 29. PBE Controls
Related Documentation www.ti.com
22 SLAA751–September 2017Submit Documentation Feedback
Copyright © 2017, Texas Instruments Incorporated
Smart Amp Tuning Guide
5 Related Documentation1. Texas Instruments, TAS2555 5.7-W Class-D Mono Audio Amplifier with Class-H Boost and Speaker
Sense, TAS2555 Data Sheet (SLASE98)2. Texas Instruments, TAS2557 5.7-W Class-D Mono Audio Amplifier with Class-H Boost and Speaker
Sense, TAS2557 Data Sheet (SLASEC2)3. Texas Instruments, TAS2559 5.7-W Class-D Mono Audio Amplifier with Class-H Boost and Speaker
Sense with Stereo Processing, TAS2559 Data Sheet (SLASEE8)4. Texas Instruments, TAS2560 5.6-W Class-D Mono Audio Amplifier with IV Sense,
TAS2560 Data Sheet (SLASE86)
IMPORTANT NOTICE FOR TI DESIGN INFORMATION AND RESOURCES
Texas Instruments Incorporated (‘TI”) technical, application or other design advice, services or information, including, but not limited to,reference designs and materials relating to evaluation modules, (collectively, “TI Resources”) are intended to assist designers who aredeveloping applications that incorporate TI products; by downloading, accessing or using any particular TI Resource in any way, you(individually or, if you are acting on behalf of a company, your company) agree to use it solely for this purpose and subject to the terms ofthis Notice.TI’s provision of TI Resources does not expand or otherwise alter TI’s applicable published warranties or warranty disclaimers for TIproducts, and no additional obligations or liabilities arise from TI providing such TI Resources. TI reserves the right to make corrections,enhancements, improvements and other changes to its TI Resources.You understand and agree that you remain responsible for using your independent analysis, evaluation and judgment in designing yourapplications and that you have full and exclusive responsibility to assure the safety of your applications and compliance of your applications(and of all TI products used in or for your applications) with all applicable regulations, laws and other applicable requirements. Yourepresent that, with respect to your applications, you have all the necessary expertise to create and implement safeguards that (1)anticipate dangerous consequences of failures, (2) monitor failures and their consequences, and (3) lessen the likelihood of failures thatmight cause harm and take appropriate actions. You agree that prior to using or distributing any applications that include TI products, youwill thoroughly test such applications and the functionality of such TI products as used in such applications. TI has not conducted anytesting other than that specifically described in the published documentation for a particular TI Resource.You are authorized to use, copy and modify any individual TI Resource only in connection with the development of applications that includethe TI product(s) identified in such TI Resource. NO OTHER LICENSE, EXPRESS OR IMPLIED, BY ESTOPPEL OR OTHERWISE TOANY OTHER TI INTELLECTUAL PROPERTY RIGHT, AND NO LICENSE TO ANY TECHNOLOGY OR INTELLECTUAL PROPERTYRIGHT OF TI OR ANY THIRD PARTY IS GRANTED HEREIN, including but not limited to any patent right, copyright, mask work right, orother intellectual property right relating to any combination, machine, or process in which TI products or services are used. Informationregarding or referencing third-party products or services does not constitute a license to use such products or services, or a warranty orendorsement thereof. Use of TI Resources may require a license from a third party under the patents or other intellectual property of thethird party, or a license from TI under the patents or other intellectual property of TI.TI RESOURCES ARE PROVIDED “AS IS” AND WITH ALL FAULTS. TI DISCLAIMS ALL OTHER WARRANTIES ORREPRESENTATIONS, EXPRESS OR IMPLIED, REGARDING TI RESOURCES OR USE THEREOF, INCLUDING BUT NOT LIMITED TOACCURACY OR COMPLETENESS, TITLE, ANY EPIDEMIC FAILURE WARRANTY AND ANY IMPLIED WARRANTIES OFMERCHANTABILITY, FITNESS FOR A PARTICULAR PURPOSE, AND NON-INFRINGEMENT OF ANY THIRD PARTY INTELLECTUALPROPERTY RIGHTS.TI SHALL NOT BE LIABLE FOR AND SHALL NOT DEFEND OR INDEMNIFY YOU AGAINST ANY CLAIM, INCLUDING BUT NOTLIMITED TO ANY INFRINGEMENT CLAIM THAT RELATES TO OR IS BASED ON ANY COMBINATION OF PRODUCTS EVEN IFDESCRIBED IN TI RESOURCES OR OTHERWISE. IN NO EVENT SHALL TI BE LIABLE FOR ANY ACTUAL, DIRECT, SPECIAL,COLLATERAL, INDIRECT, PUNITIVE, INCIDENTAL, CONSEQUENTIAL OR EXEMPLARY DAMAGES IN CONNECTION WITH ORARISING OUT OF TI RESOURCES OR USE THEREOF, AND REGARDLESS OF WHETHER TI HAS BEEN ADVISED OF THEPOSSIBILITY OF SUCH DAMAGES.You agree to fully indemnify TI and its representatives against any damages, costs, losses, and/or liabilities arising out of your non-compliance with the terms and provisions of this Notice.This Notice applies to TI Resources. Additional terms apply to the use and purchase of certain types of materials, TI products and services.These include; without limitation, TI’s standard terms for semiconductor products http://www.ti.com/sc/docs/stdterms.htm), evaluationmodules, and samples (http://www.ti.com/sc/docs/sampterms.htm).
Mailing Address: Texas Instruments, Post Office Box 655303, Dallas, Texas 75265Copyright © 2017, Texas Instruments Incorporated


![Grapher Workshop - Samuel Chukwuemeka...Table 1.2 The [Xmin, Xmax] dimensions for a basic friendly window on various graphers Grapher [Xmin, Xmax] TI-80 [–3.1, 3.1] =1 1 1:](https://img.pdfslide.us/doc/110x75/61171f0917223f24b13a6699/grapher-workshop-samuel-chukwuemeka-table-12-the-xmin-xmax-dimensions.jpg)