Embed Size (px)
Citation preview
7
Small Wind Turbine Power Controllers
Dr. Horizon Gitano-Briggs University Science Malaysia
Penang, Malaysia
1. Introduction
One of the greatest challenges associated with wind power is the unpredictable character of the wind. Even at the best wind sites, those with steady reasonably high speed wind, there are variations in speed and direction of the wind which affect the ability of the wind turbine to deliver power. Larger wind turbine systems have complex control systems which automatically track changes in wind direction and speed, and adjust turbine orientation, blade pitch, and generator gearing to maintain the desired electrical output. Small turbine systems are typically much less sophisticated, however they generally still have some form of control to improve their longevity and power production. The main purposes of a controller in a wind energy system are (in order of priority): 1. Prevent damage to the wind turbine 2. Prevent damage to the load 3. Maximize power production We will concern ourselves here with smaller wind turbine systems, figure 1, which we will define somewhat arbitrarily as those systems rated at 10kW or less. Such small systems in the past have been predominantly designed for sturdiness, with robust mechanical controls, and relatively modest overall performance. With advances in microcontrollers, and electronic power switching components, however, the level of sophistication of theses small wind systems has been steadily improving. In this chapter we will investigate the controls associated with small wind turbine systems, culminating in a detailed description of the Peak Power Tracking controller utilizing a microcontroller running an impedance matching DC-DC converter between the turbine and the load. Although the main focus of our discussion is the control of wind turbines, the techniques and components described here also find use in other alternative power systems, such as solar photovoltaic systems, where they can improve the overall system power extraction. Many alternative power systems incorporate several different power sources, such as wind and solar. Such “hybrid” systems have the advantage of greater power availability (periods of low wind are often characterized by clear skies and good solar power, while strong winds are often associated with cloud activity). We will therefore use examples from both solar and wind power systems in the discussion of the relevant techniques.
1.1 Wind turbine systems A wind turbine converts wind power into shaft power to drive an electrical generator or other load (Van Baars & Bongers 1992). In smaller electrical wind power systems the most
Source: Wind Power, Book edited by: S. M. Muyeen, ISBN 978-953-7619-81-7, pp. 558, June 2010, INTECH, Croatia, downloaded from SCIYO.COM
www.intechopen.com
Wind Power
166
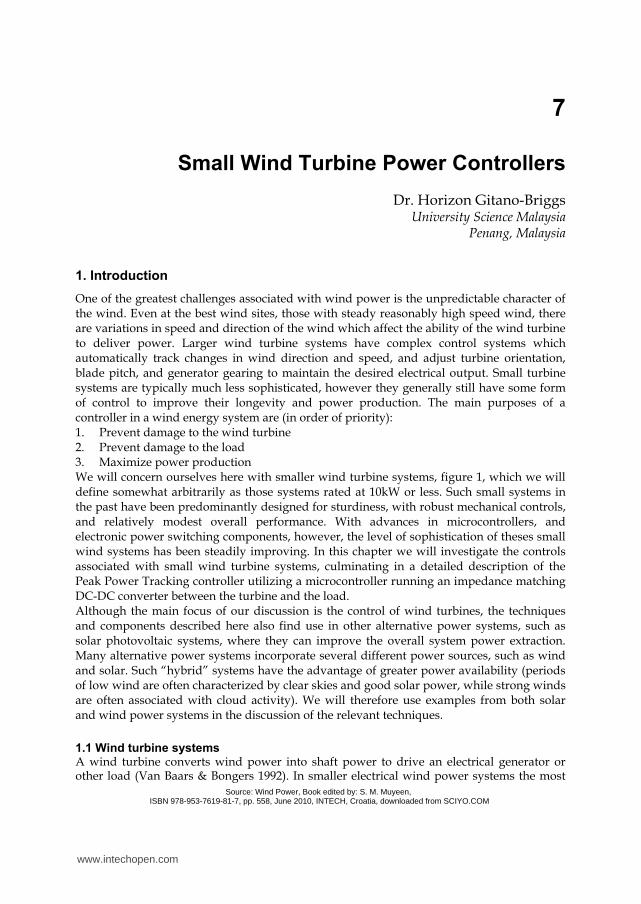
Fig. 1. Schematic diagram of a typical small wind turbine power system.
common configuration is a 3-blade, horizontal axis wind turbine directly driving a 3-phase permanent magnet generator. The output power of a wind turbine is function of wind velocity cubed. It can be described mathematically by (1).
30.5 P windP C AVρ= (1)
where P is the power in Watts, CP is the dimensionless coefficient of performance, ρ is air density (kg/m3), A is rotor swept area (m2), and Vwind is the wind speed (m/s) (Jonson 1985). Generally both swept area and air density are taken as constants while the control of the wind is beyond the scope of this text. Therefore, to maximize the output power of a
0.00
0.05
0.10
0.15
0.20
0.25
0.30
0.35
0.40
0.45
0.50
0 2 4 6 8 10 12TSR
Cp
TSRopt
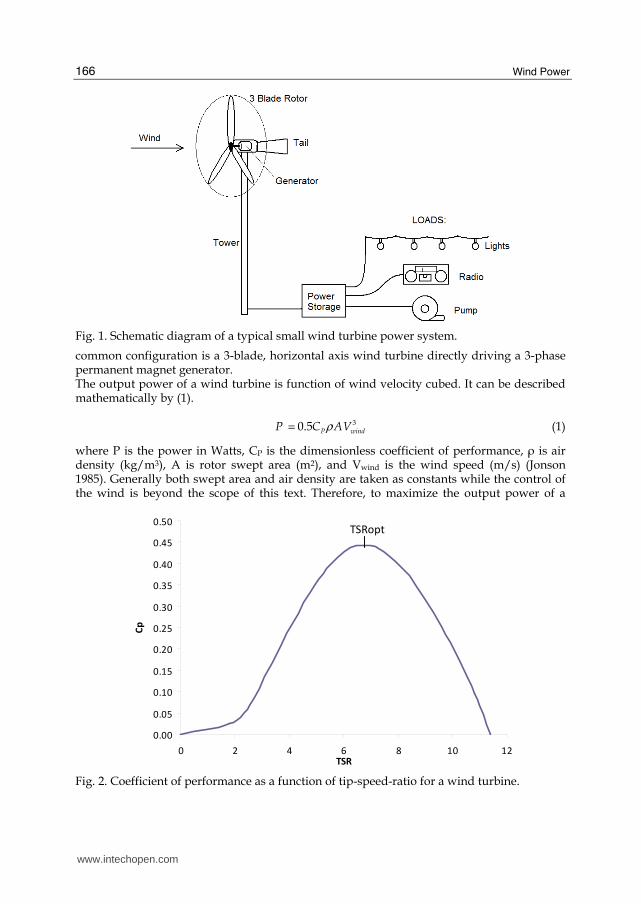
Fig. 2. Coefficient of performance as a function of tip-speed-ratio for a wind turbine.
www.intechopen.com
Small Wind Turbine Power Controllers
167
wind turbine we have to optimize the value of CP. The coefficient of performance is a strong, non- linear function of the “Tip Speed Ratio” as seen in Figure 2. It depends on such factors as the number of blades, and the pitch and shape of the blades. The maximum value CP can attain is theoretically around 57%, however the highest performing turbines generally only attain values in the 40% range, while values in the 30% range are more common. The tip-speed-ratio is the linear speed of the outer extremity of the turbine blade divided by the wind speed. For a turbine of radius R, and rotor speed ωrotor (in radians/sec) the tip-speed-ratio, TSR, is thus:
rotor
wind
RTSR
V
ω= (2)
Where Vwind is the speed of the wind at the turbine hub height. In order to maximize Cp we can vary the load on the turbine to achieve a rotor speed ωopt of:
opt wind
opt
TSR V
Rω = (3)
The optimum tip-speed ratio TSRopt is a constant dependent on turbine blade design for fixed blade turbines. Thus for every wind speed there will be a different rotor speed for maximum power production. The optimum TSR value is around 5 to 7 for most small turbines, meaning that the tip of the turbine blade will have a linear velocity around 6 times the wind speed. Most small wind turbines have 2 or 3 fixed blades rotating about a horizontal axis directly driving a permanent magnet generator. The control system generally consists of a mechanical system for furling the turbine in high winds, and with perhaps a power controller and electrical breaking system. Bergey Windpower’s 10kW Excell turbine is a notable exception, having a mechanical blade pitch control system which adjusts the pitch of the blades as a function of rotor speed (Manwell et al., 2002). Larger turbines commonly have 2 or 3 adjustable pitch blades, and 1 or 2 gear stages between the rotor and the generator. A larger number of blades gives a lower operating speed, and greater starting torque facilitating turbine starting in low speed winds.
0
100
200
300
400
500
600
700
800
0 5 10 15 20 25 30
Po
we
r (W
)
Wind Speed (m/s)
Cut in Speed
Furling Speed
Rated Speed
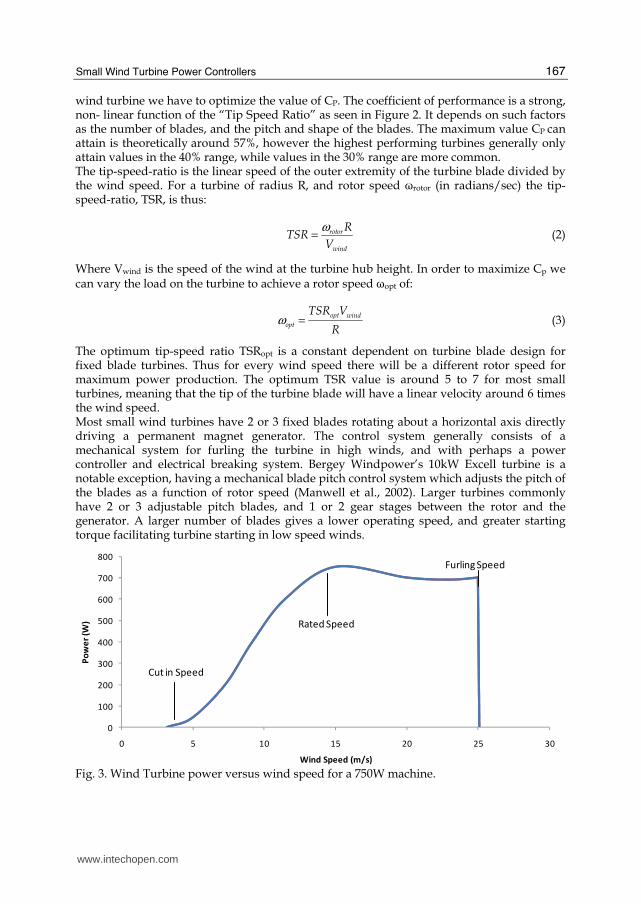
Fig. 3. Wind Turbine power versus wind speed for a 750W machine.
www.intechopen.com
Wind Power
168
Figure 3 shows the power produced from a typical small wind turbine as a function of wind speed. Below the “cut in speed” there is not enough wind power to overcome friction, thus no power is produced. Above the cut-in speed the power increases rapidly to the “rated speed”. Generally the turbine produces its rated power at the rated wind speed, though some manufacturers quote numbers differently. This turbine is rated at 750W in a 15 m/s wind. The system has been optimized for operation around 15 m/s, and though the wind power continues to increase above this point, the turbine power drops off slightly as the blades begin stalling. The turbine has a maximum operating speed (furling speed) of 25 m/s, above which it is stopped to avoid damage to the machine. Several mechanisms are used to stop turbine rotation including rotation of the turbine out of the wind, either vertically (tilt) or horizontally (yaw), frictional breaks, electrical breaking and blade pitch adjustments to cause the blades to stall, i.e. furl. Most small machines use a mechanical system to rotate the turbine out of the wind and may use electrical breaking, while larger machines furl the blades and have frictional breaks as well. A comparison of large and small wind turbine configurations is given in figure 4. While there is a wide range of variation among both groups, and overlap between them, these illustrate the general trends. LARGE TURBINES SMALL TURBINES Power Rating (kW) >100kW 10kW or less Power Utilization Grid Batteries or small load (ie. Pump) Gearing 2-stage or CVT Direct drive or 1 stage fixed Generator Synchronous AC Permanent magnet AC Design Point High Power production Low Cost/Maintenance Blades Variable Pitch Typically fixed pitch Yaw Control Motorized Control Free – Tail vane Breaking Pitch, Frictional Tilt, Electrical
Fig. 4. Typical characteristics of large and small wind turbine systems
2. Load – source matching
In power systems a power source drives a load. A common concept in power transmission is that of “impedance matching” or load – source matching. The overall system will be most efficient when the power source matches the characteristics of the load. In the case of grossly divergent load – source characteristics an impedance matching intermediary, such as a gear box for example, may be used. A classic example of this is the mechanical power drive system of internal combustion engine vehicles. Internal combustion engines tend to operate at a few thousand revolutions per minute (rpm), while the wheels of a typical vehicle are spinning several hundred rpm. To improve the overall vehicle performance a transmission with an overall gearing ratio of around 10 couples the engine to the wheels, allowing the engine to operate at higher speeds, and lower torques while delivering the lower speeds and higher torques required at the wheels. Gearing systems are often used in larger turbines to match the low speeds and high torques of the turbine to the higher speeds, and lower torques of the generator. In small wind turbine systems we will be making use of another electrical impedance matching device: the DC-DC converter.
2.1 DC-DC converters
DC-DC converters are essentially the direct current equivalent of transformers in alternating current circuits. They can convert electrical power from one voltage and current level to
www.intechopen.com
Small Wind Turbine Power Controllers
169
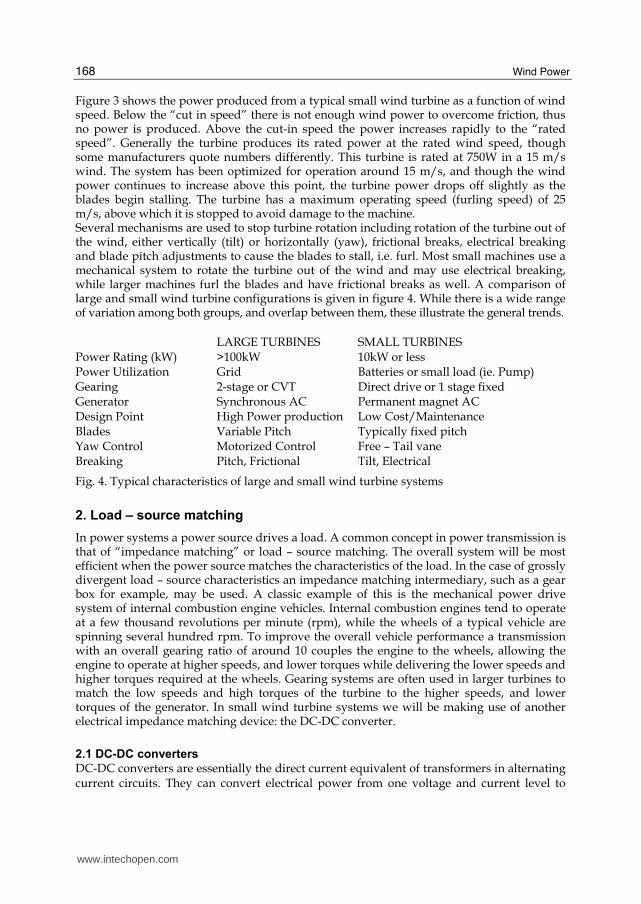
another, while of course obeying the conservation of energy: as voltage is increased current must necessarily be decreased. Transformers take in alternating currents, and convert them to changing magnetic fields in a primary winding. A magnetically linked secondary winding converts the magnetic flux back into an alternating current. The secondary winding voltage can be either greater or less than the primary winding, figure 5, depending on the relative number of turns of wire in the coils. The output voltage is proportional to the input voltage times the ratio of the number of turns in the input (N1) to the output (N2), thus Vout = Vin x (N2/N1). The currents follow the inverse relationship, i.e. Iout = Iin x (N1/N2). Smaller transformers tend to be less efficient, around 85%, while well designed high power transformers may have efficiencies as high as 98% (Calwell & Reeder, 2002).
Fig. 5. AC and DC voltage/current converters
A DC-DC converter in which the output voltage is greater than the input voltage is usually referred to as a “boost” converter. In a boost converter the output current will always be less than the input current. If the output current is greater than the input current (and thus the output voltage is lower than the input) the converter is referred to as a “buck” converter. A boost converter is the DC equivalent of a step-up transformer in AC circuits, and the buck is analogous to the step down transformer. In the past DC-DC conversion was performed using a motor-generator device, or by first converting to AC, using a transformer to step the voltage up/down, then rectifying. With advances in the power and speed of power switching devices such as power FETs and IGBTs, DC-DC converters have become smaller, less expensive and more efficient. Higher frequency operation of the switching device allows the use of smaller inductors, reducing the size, weight and cost of these components. Today peak efficiencies of DC-DC converters are around 85 to 95%. These improvements have allowed DC-DC converters greater application in a variety of fields, including alternative energies where both boost and buck converters are common components.
2.2 DC-DC internal structure
A DC-DC buck, or step down, converter is essentially a Pulse Width Modulated (PWM) connection between the source and load (Agrawal 2001). A transistor or similar switching element is placed between the supply voltage and the load and cycles on/off at a high frequency. When the transistor is “on” current will flow from the source to the load. When the transistor is turned off current stops flowing. Various inductive and capacitive
www.intechopen.com
Wind Power
170
components can be placed in the circuit to smooth out the current flow. If the transistor is in the on state most of the time, the voltage output voltage is close to the source voltage. As the duty cycle, or on time divided by cycle period, decreases, so to does the output voltage. Thus as the relative width of the “on” pulse feeding the transistor is increased, the output increases. For a maximum output the transistor will be left on (ie. 100% duty cycle). In a boost DC-DC converter a transistor is intermittently connecting the input voltage to an inductor, grounded at the opposite end. When the transistor is on current will flow into the inductor towards ground. Once the transistor is switched off the current decrease in the inductor will induce a high voltage on the open end of the inductor. This voltage can be fed through a diode into a capacitor, charging it to a voltage higher than the original input voltage. This boosted voltage can then be used to drive a higher voltage load. Both the frequency, duty cycle can be varied to adjust the output voltage of a boost converter.
3. DC-DC boost converter in alternative energy systems
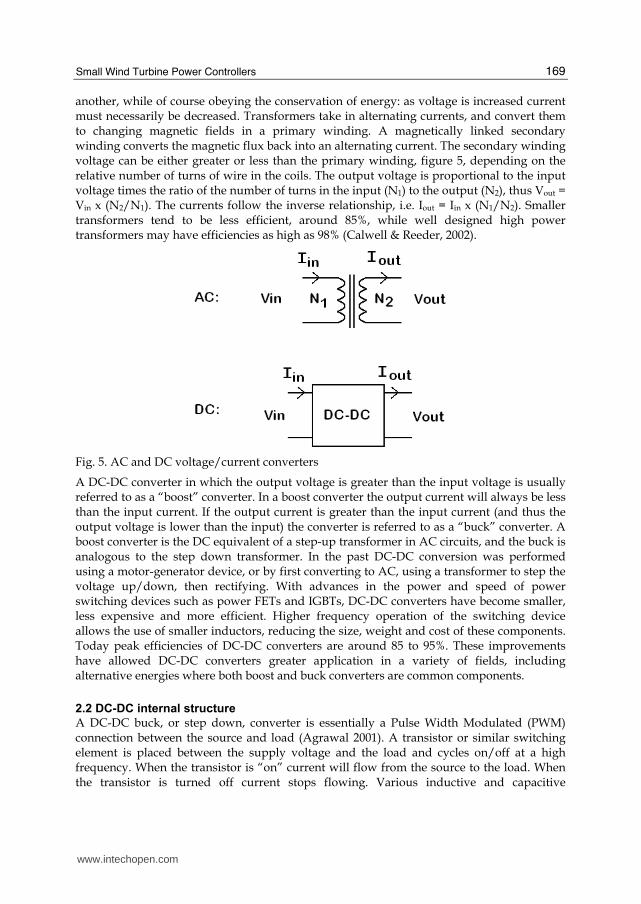
The use of a simple boost converter can greatly enhance the power capture from alternative energy systems in several ways: 1) they can boost low voltages up to levels capable of charging batteries or running higher voltage loads, 2) they can impedance match sources and loads, and 3) they can be adaptively adjusted to provide peak-power extraction from variable power sources such as wind turbines. One of the simplest applications of a DC-DC converter in an alternate energy system is a boost converter used to power loads when the supply voltage is below the required load voltage. For example, if we have a small photovoltaic power system with a maximum panel voltage of 16V charging batteries at 12V, the system will only extract power when the panel voltage is above the battery charging voltage Vb. The solar panel will only produce the full 16V in full, nearly normal sunlight. This will limit power production to only a few hours a day when the panel voltage exceeds Vb, as shown in figure 6. Even in partial sun or when the sun is not exactly normal to the panel, it can still produce power, but at a lower voltage.
Fig. 6. Power production from a solar panel connected to a battery of voltage Vb.
If a boost DC-DC converter is placed between the solar panel and the batteries, the panel’s voltage can be pumped up to charge the batteries even when the panel voltage is less than
www.intechopen.com
Small Wind Turbine Power Controllers
171
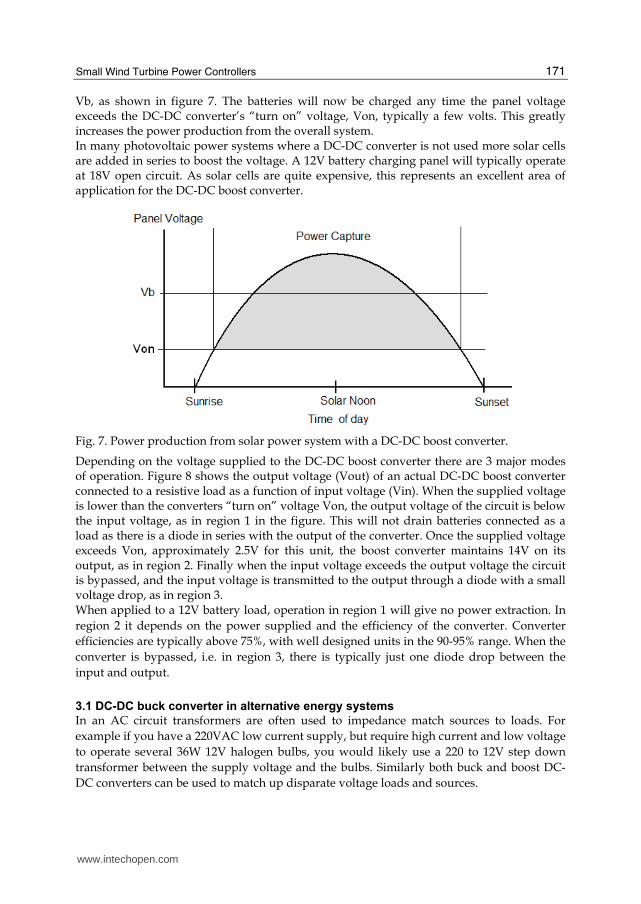
Vb, as shown in figure 7. The batteries will now be charged any time the panel voltage exceeds the DC-DC converter’s “turn on” voltage, Von, typically a few volts. This greatly increases the power production from the overall system. In many photovoltaic power systems where a DC-DC converter is not used more solar cells are added in series to boost the voltage. A 12V battery charging panel will typically operate at 18V open circuit. As solar cells are quite expensive, this represents an excellent area of application for the DC-DC boost converter.
Fig. 7. Power production from solar power system with a DC-DC boost converter.
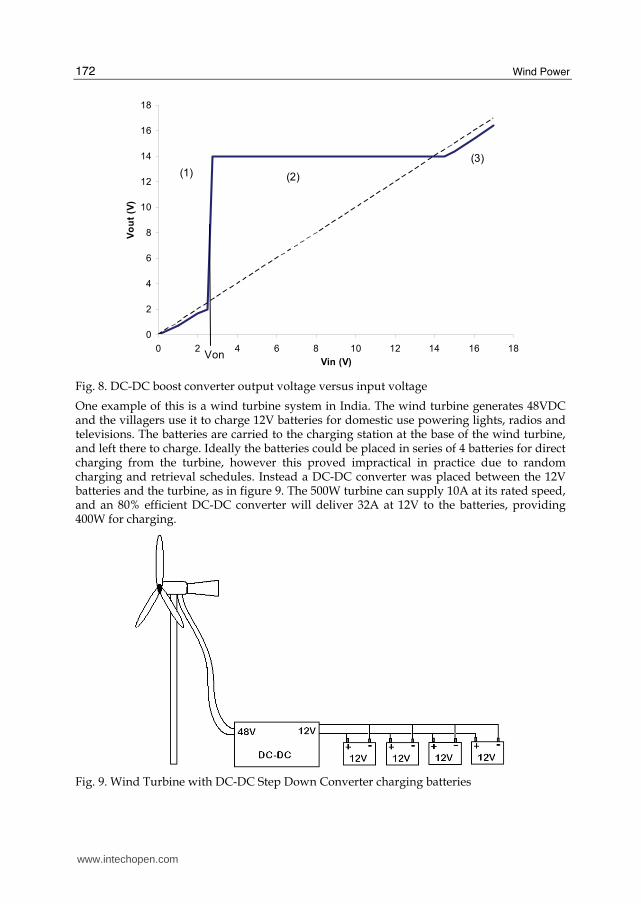
Depending on the voltage supplied to the DC-DC boost converter there are 3 major modes of operation. Figure 8 shows the output voltage (Vout) of an actual DC-DC boost converter connected to a resistive load as a function of input voltage (Vin). When the supplied voltage is lower than the converters “turn on” voltage Von, the output voltage of the circuit is below the input voltage, as in region 1 in the figure. This will not drain batteries connected as a load as there is a diode in series with the output of the converter. Once the supplied voltage exceeds Von, approximately 2.5V for this unit, the boost converter maintains 14V on its output, as in region 2. Finally when the input voltage exceeds the output voltage the circuit is bypassed, and the input voltage is transmitted to the output through a diode with a small voltage drop, as in region 3. When applied to a 12V battery load, operation in region 1 will give no power extraction. In
region 2 it depends on the power supplied and the efficiency of the converter. Converter
efficiencies are typically above 75%, with well designed units in the 90-95% range. When the
converter is bypassed, i.e. in region 3, there is typically just one diode drop between the
input and output.
3.1 DC-DC buck converter in alternative energy systems
In an AC circuit transformers are often used to impedance match sources to loads. For
example if you have a 220VAC low current supply, but require high current and low voltage
to operate several 36W 12V halogen bulbs, you would likely use a 220 to 12V step down
transformer between the supply voltage and the bulbs. Similarly both buck and boost DC-
DC converters can be used to match up disparate voltage loads and sources.
www.intechopen.com
Wind Power
172
0
2
4
6
8
10
12
14
16
18
0 2 4 6 8 10 12 14 16 18
Vin (V)
Vo
ut
(V)
Von
(1)
(3)
(2)
Fig. 8. DC-DC boost converter output voltage versus input voltage
One example of this is a wind turbine system in India. The wind turbine generates 48VDC and the villagers use it to charge 12V batteries for domestic use powering lights, radios and televisions. The batteries are carried to the charging station at the base of the wind turbine, and left there to charge. Ideally the batteries could be placed in series of 4 batteries for direct charging from the turbine, however this proved impractical in practice due to random charging and retrieval schedules. Instead a DC-DC converter was placed between the 12V batteries and the turbine, as in figure 9. The 500W turbine can supply 10A at its rated speed, and an 80% efficient DC-DC converter will deliver 32A at 12V to the batteries, providing 400W for charging.
Fig. 9. Wind Turbine with DC-DC Step Down Converter charging batteries
www.intechopen.com
Small Wind Turbine Power Controllers
173
If, alternatively, the 12V batteries were directly connected to the turbine in parallel, the
current draw from the batteries would be more than the turbine could supply, slowing the
turbine, reducing its power output, and likely stalling the turbine, giving essentially no
power production.
The DC-DC system has another advantage over the “4 batteries in series” system in that it
can extract power and charge the batteries even if the turbine voltage is below 48V, as in the
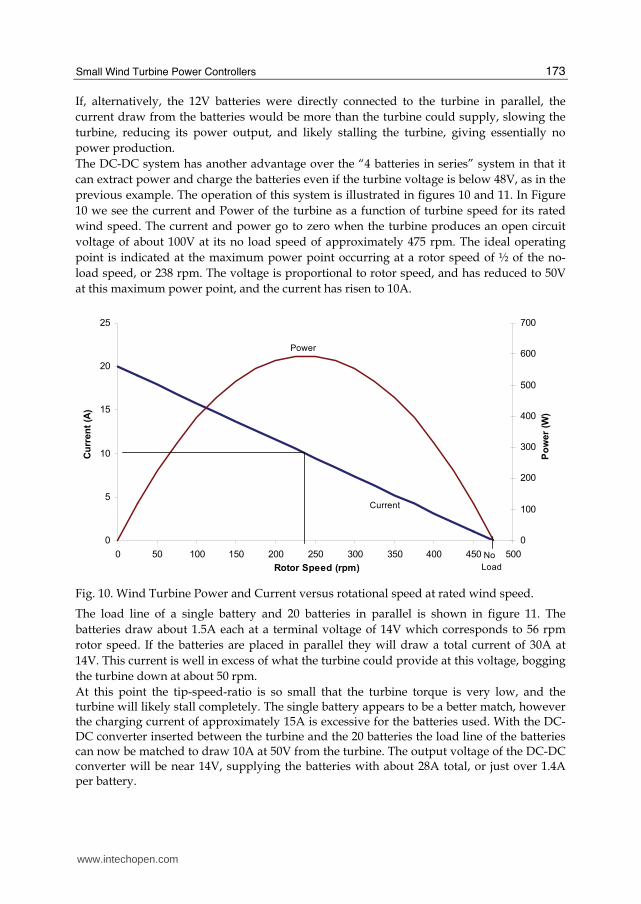
previous example. The operation of this system is illustrated in figures 10 and 11. In Figure
10 we see the current and Power of the turbine as a function of turbine speed for its rated
wind speed. The current and power go to zero when the turbine produces an open circuit
voltage of about 100V at its no load speed of approximately 475 rpm. The ideal operating
point is indicated at the maximum power point occurring at a rotor speed of ½ of the no-
load speed, or 238 rpm. The voltage is proportional to rotor speed, and has reduced to 50V
at this maximum power point, and the current has risen to 10A.
0
5
10
15
20
25
0 50 100 150 200 250 300 350 400 450 500
Rotor Speed (rpm)
Cu
rren
t (A
)
0
100
200
300
400
500
600
700
Po
wer
(W)
Power
Current
No
Load
Fig. 10. Wind Turbine Power and Current versus rotational speed at rated wind speed.
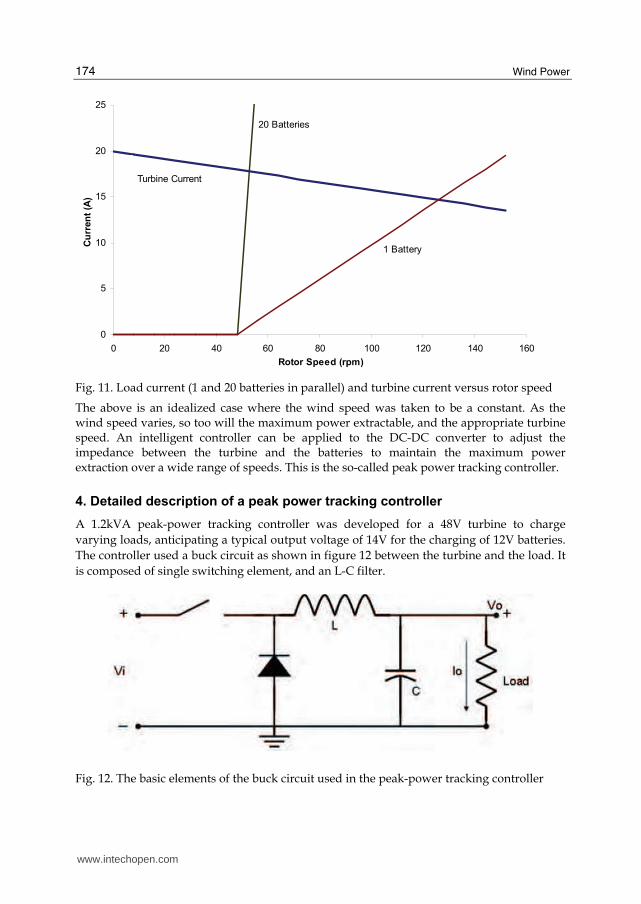
The load line of a single battery and 20 batteries in parallel is shown in figure 11. The
batteries draw about 1.5A each at a terminal voltage of 14V which corresponds to 56 rpm
rotor speed. If the batteries are placed in parallel they will draw a total current of 30A at
14V. This current is well in excess of what the turbine could provide at this voltage, bogging
the turbine down at about 50 rpm.
At this point the tip-speed-ratio is so small that the turbine torque is very low, and the turbine will likely stall completely. The single battery appears to be a better match, however the charging current of approximately 15A is excessive for the batteries used. With the DC-DC converter inserted between the turbine and the 20 batteries the load line of the batteries can now be matched to draw 10A at 50V from the turbine. The output voltage of the DC-DC converter will be near 14V, supplying the batteries with about 28A total, or just over 1.4A per battery.
www.intechopen.com
Wind Power
174
0
5
10
15
20
25
0 20 40 60 80 100 120 140 160
Rotor Speed (rpm)
Cu
rren
t (A
)
1 Battery
Turbine Current
20 Batteries
Fig. 11. Load current (1 and 20 batteries in parallel) and turbine current versus rotor speed
The above is an idealized case where the wind speed was taken to be a constant. As the wind speed varies, so too will the maximum power extractable, and the appropriate turbine speed. An intelligent controller can be applied to the DC-DC converter to adjust the impedance between the turbine and the batteries to maintain the maximum power extraction over a wide range of speeds. This is the so-called peak power tracking controller.
4. Detailed description of a peak power tracking controller
A 1.2kVA peak-power tracking controller was developed for a 48V turbine to charge
varying loads, anticipating a typical output voltage of 14V for the charging of 12V batteries.
The controller used a buck circuit as shown in figure 12 between the turbine and the load. It
is composed of single switching element, and an L-C filter.
Fig. 12. The basic elements of the buck circuit used in the peak-power tracking controller
www.intechopen.com
Small Wind Turbine Power Controllers
175
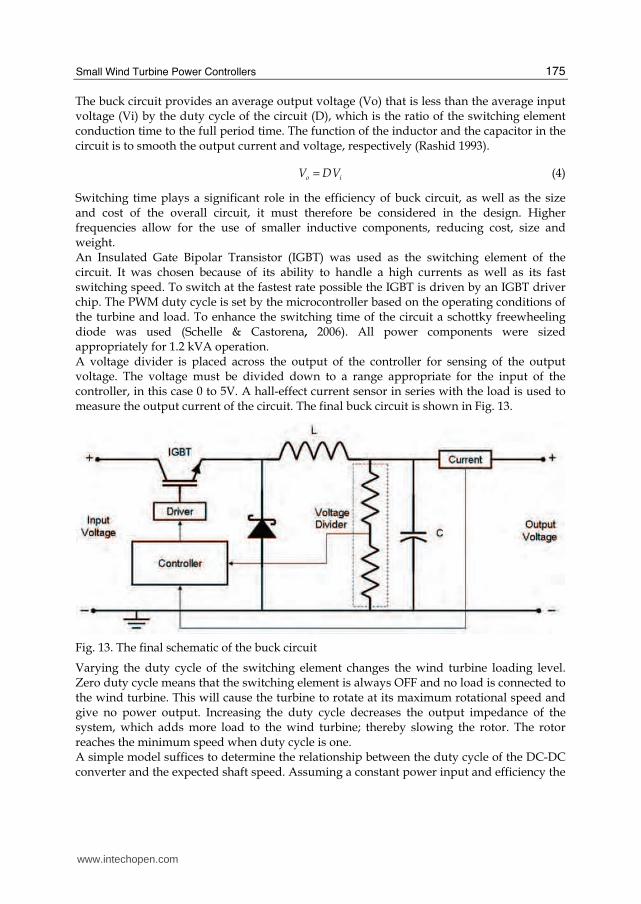
The buck circuit provides an average output voltage (Vo) that is less than the average input voltage (Vi) by the duty cycle of the circuit (D), which is the ratio of the switching element conduction time to the full period time. The function of the inductor and the capacitor in the circuit is to smooth the output current and voltage, respectively (Rashid 1993).
o iV DV= (4)
Switching time plays a significant role in the efficiency of buck circuit, as well as the size and cost of the overall circuit, it must therefore be considered in the design. Higher frequencies allow for the use of smaller inductive components, reducing cost, size and weight. An Insulated Gate Bipolar Transistor (IGBT) was used as the switching element of the circuit. It was chosen because of its ability to handle a high currents as well as its fast switching speed. To switch at the fastest rate possible the IGBT is driven by an IGBT driver chip. The PWM duty cycle is set by the microcontroller based on the operating conditions of the turbine and load. To enhance the switching time of the circuit a schottky freewheeling diode was used (Schelle & Castorena, 2006). All power components were sized appropriately for 1.2 kVA operation. A voltage divider is placed across the output of the controller for sensing of the output voltage. The voltage must be divided down to a range appropriate for the input of the controller, in this case 0 to 5V. A hall-effect current sensor in series with the load is used to measure the output current of the circuit. The final buck circuit is shown in Fig. 13.
Fig. 13. The final schematic of the buck circuit
Varying the duty cycle of the switching element changes the wind turbine loading level. Zero duty cycle means that the switching element is always OFF and no load is connected to the wind turbine. This will cause the turbine to rotate at its maximum rotational speed and give no power output. Increasing the duty cycle decreases the output impedance of the system, which adds more load to the wind turbine; thereby slowing the rotor. The rotor reaches the minimum speed when duty cycle is one. A simple model suffices to determine the relationship between the duty cycle of the DC-DC converter and the expected shaft speed. Assuming a constant power input and efficiency the
www.intechopen.com
Wind Power
176
output electrical power I²R should also be constant. The resistance is essentially an average between the connected load resistance R weighed by the switch ‘on’ time and an infinite resistance weighed by the switch ‘off’ time, thus the effective average resistance is R/D where D is the duty cycle. For a Permanent Magnet (PM) DC generator such as ours, the relationship between the generator current and rotor speed is linear decreasing from the stall current Istall at rotor speed ω = 0, to zero current at the unloaded speed ωNL. Mathematically we would write:
stall stall
NL
I I Iω
ω
⎛ ⎞= − ⎜ ⎟⎝ ⎠ (5)
Knowing that I² times the effective resistance R/D is constant allows us to write:
2
2 1stall
NL
RI C
D
ω
ω
⎛ ⎞− =⎜ ⎟⎝ ⎠ (6)
Where C is a constant. Rearranging to solve for the rotor speed ω we have:
0.5
2NL NL
stall
CD
I Rω ω ω
⎛ ⎞= − ⎜ ⎟⎝ ⎠ (7)
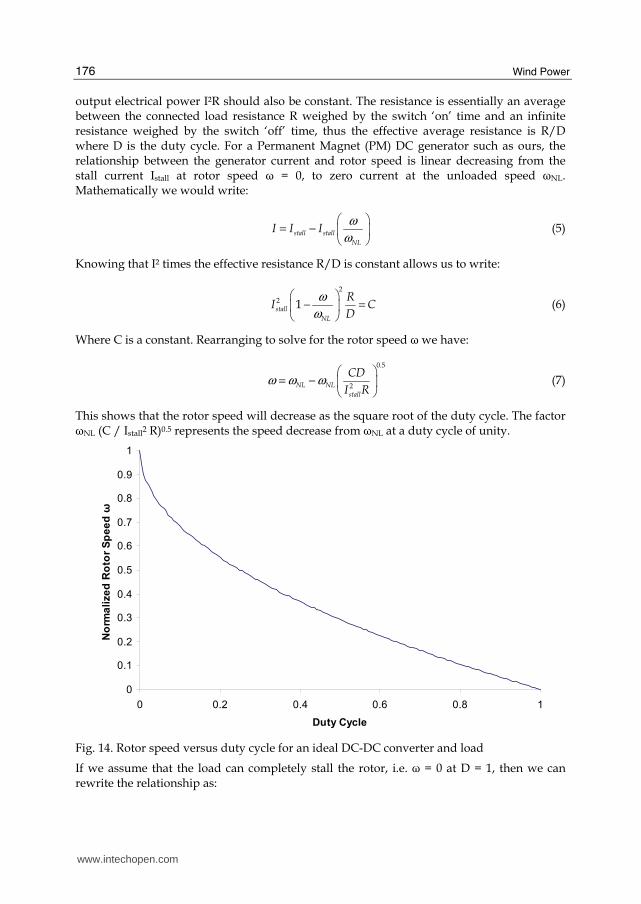
This shows that the rotor speed will decrease as the square root of the duty cycle. The factor ωNL (C / Istall2 R)0.5 represents the speed decrease from ωNL at a duty cycle of unity.
0
0.1
0.2
0.3
0.4
0.5
0.6
0.7
0.8
0.9
1
0 0.2 0.4 0.6 0.8 1
Duty Cycle
No
rma
lize
d R
oto
r S
pe
ed
ω
Fig. 14. Rotor speed versus duty cycle for an ideal DC-DC converter and load
If we assume that the load can completely stall the rotor, i.e. ω = 0 at D = 1, then we can rewrite the relationship as:
www.intechopen.com
Small Wind Turbine Power Controllers
177
( )0.51NL Dω ω= − (8)
This relationship is shown graphically in Fig. 14 where rotor speed has been normalized, i.e. ωNL=1.
4.1 Breaking system
Some environmental conditions, for instance hurricanes, include very high wind speeds. This may result in turbine runaway and destruction of the wind turbine. Additionally, it may be necessary to periodically stop the wind turbine spinning, if there is a mechanical or electrical fault or even during periodic maintenance. Thus some kind of braking system for the wind turbine is required. Many turbines include a mechanical braking design (i.e. furling or tilting the axis of the turbine away from incoming wind). Alternatively, frictional beaks may be incorporated into the wind turbine. The disadvantage of such system is the short life expectancy and additional system cost and complexity of these systems (Rajambal et al., 2005). Another option is to use electrical braking. Under high wind conditions heavy dump loads
may be connected directly to the generator to slow the turbine enough causing the blades to
“stall” aerodynamically. Once stalled, the torque produced by the turbine is greatly
reduced, and it will spin at a very slow speed or stop.
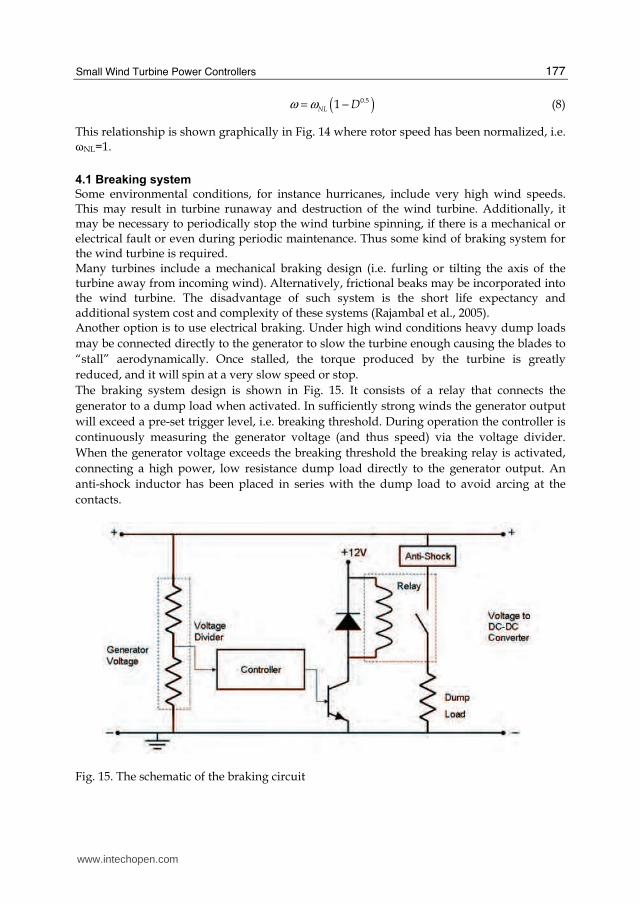
The braking system design is shown in Fig. 15. It consists of a relay that connects the
generator to a dump load when activated. In sufficiently strong winds the generator output
will exceed a pre-set trigger level, i.e. breaking threshold. During operation the controller is
continuously measuring the generator voltage (and thus speed) via the voltage divider.
When the generator voltage exceeds the breaking threshold the breaking relay is activated,
connecting a high power, low resistance dump load directly to the generator output. An
anti-shock inductor has been placed in series with the dump load to avoid arcing at the
contacts.
Fig. 15. The schematic of the braking circuit
www.intechopen.com
Wind Power
178
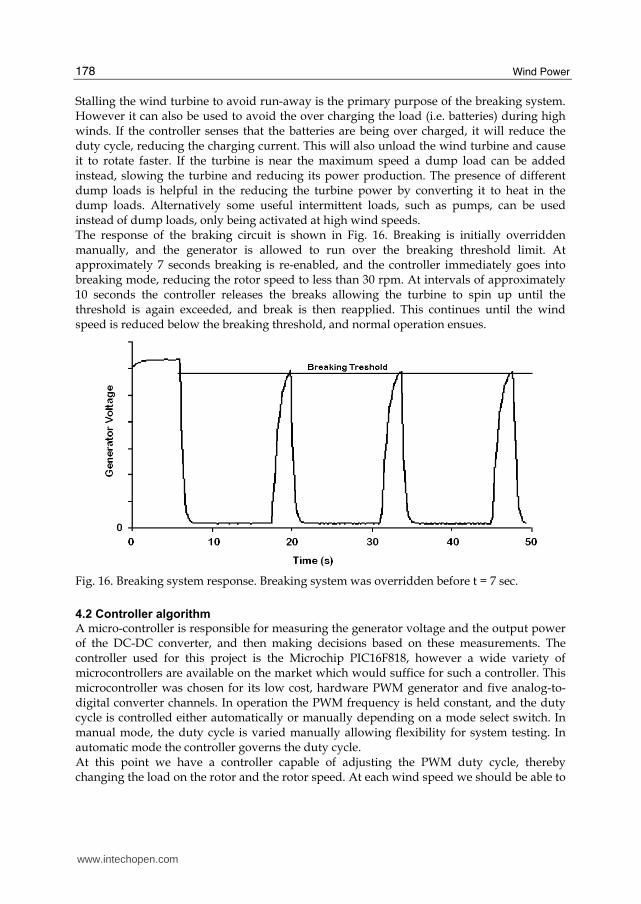
Stalling the wind turbine to avoid run-away is the primary purpose of the breaking system. However it can also be used to avoid the over charging the load (i.e. batteries) during high winds. If the controller senses that the batteries are being over charged, it will reduce the duty cycle, reducing the charging current. This will also unload the wind turbine and cause it to rotate faster. If the turbine is near the maximum speed a dump load can be added instead, slowing the turbine and reducing its power production. The presence of different dump loads is helpful in the reducing the turbine power by converting it to heat in the dump loads. Alternatively some useful intermittent loads, such as pumps, can be used instead of dump loads, only being activated at high wind speeds. The response of the braking circuit is shown in Fig. 16. Breaking is initially overridden manually, and the generator is allowed to run over the breaking threshold limit. At approximately 7 seconds breaking is re-enabled, and the controller immediately goes into breaking mode, reducing the rotor speed to less than 30 rpm. At intervals of approximately 10 seconds the controller releases the breaks allowing the turbine to spin up until the threshold is again exceeded, and break is then reapplied. This continues until the wind speed is reduced below the breaking threshold, and normal operation ensues.
Fig. 16. Breaking system response. Breaking system was overridden before t = 7 sec.
4.2 Controller algorithm
A micro-controller is responsible for measuring the generator voltage and the output power of the DC-DC converter, and then making decisions based on these measurements. The controller used for this project is the Microchip PIC16F818, however a wide variety of microcontrollers are available on the market which would suffice for such a controller. This microcontroller was chosen for its low cost, hardware PWM generator and five analog-to-digital converter channels. In operation the PWM frequency is held constant, and the duty cycle is controlled either automatically or manually depending on a mode select switch. In manual mode, the duty cycle is varied manually allowing flexibility for system testing. In automatic mode the controller governs the duty cycle. At this point we have a controller capable of adjusting the PWM duty cycle, thereby changing the load on the rotor and the rotor speed. At each wind speed we should be able to
www.intechopen.com
Small Wind Turbine Power Controllers
179
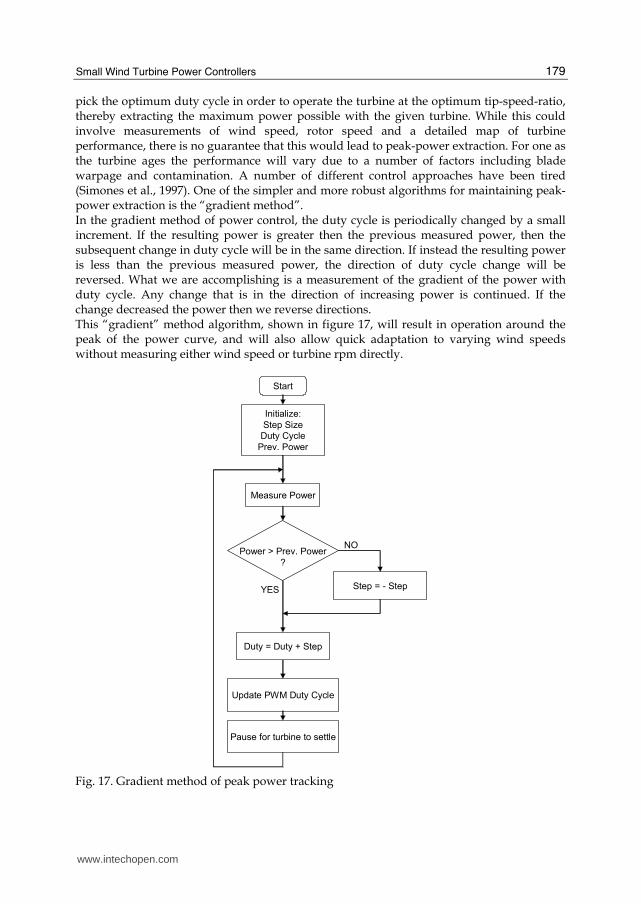
pick the optimum duty cycle in order to operate the turbine at the optimum tip-speed-ratio, thereby extracting the maximum power possible with the given turbine. While this could involve measurements of wind speed, rotor speed and a detailed map of turbine performance, there is no guarantee that this would lead to peak-power extraction. For one as the turbine ages the performance will vary due to a number of factors including blade warpage and contamination. A number of different control approaches have been tired (Simones et al., 1997). One of the simpler and more robust algorithms for maintaining peak-power extraction is the “gradient method”. In the gradient method of power control, the duty cycle is periodically changed by a small increment. If the resulting power is greater then the previous measured power, then the subsequent change in duty cycle will be in the same direction. If instead the resulting power is less than the previous measured power, the direction of duty cycle change will be reversed. What we are accomplishing is a measurement of the gradient of the power with duty cycle. Any change that is in the direction of increasing power is continued. If the change decreased the power then we reverse directions. This “gradient” method algorithm, shown in figure 17, will result in operation around the peak of the power curve, and will also allow quick adaptation to varying wind speeds without measuring either wind speed or turbine rpm directly.
Start
Initialize:
Step Size
Duty Cycle
Prev. Power
Power > Prev. Power
?
Measure Power
Update PWM Duty Cycle
Pause for turbine to settle
Duty = Duty + Step
Step = - Step
NO
YES
Fig. 17. Gradient method of peak power tracking
www.intechopen.com
Wind Power
180
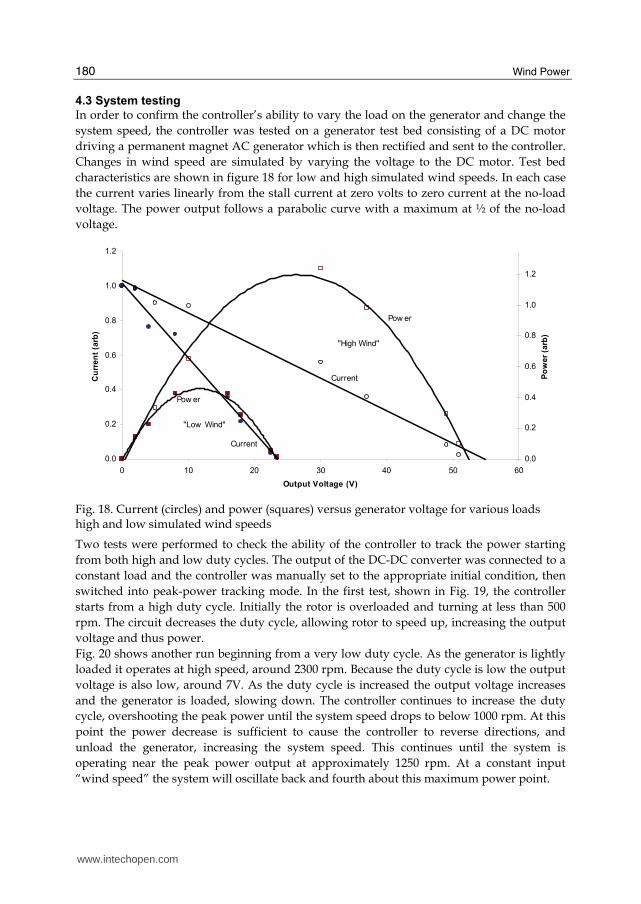
4.3 System testing
In order to confirm the controller’s ability to vary the load on the generator and change the
system speed, the controller was tested on a generator test bed consisting of a DC motor
driving a permanent magnet AC generator which is then rectified and sent to the controller.
Changes in wind speed are simulated by varying the voltage to the DC motor. Test bed
characteristics are shown in figure 18 for low and high simulated wind speeds. In each case
the current varies linearly from the stall current at zero volts to zero current at the no-load
voltage. The power output follows a parabolic curve with a maximum at ½ of the no-load
voltage.
0.0
0.2
0.4
0.6
0.8
1.0
1.2
0 10 20 30 40 50 60
Output Voltage (V)
Cu
rren
t (a
rb)
0.0
0.2
0.4
0.6
0.8
1.0
1.2
Po
wer
(arb
)
"High Wind"
"Low Wind"
Pow er
Pow er
Current
Current
Fig. 18. Current (circles) and power (squares) versus generator voltage for various loads high and low simulated wind speeds
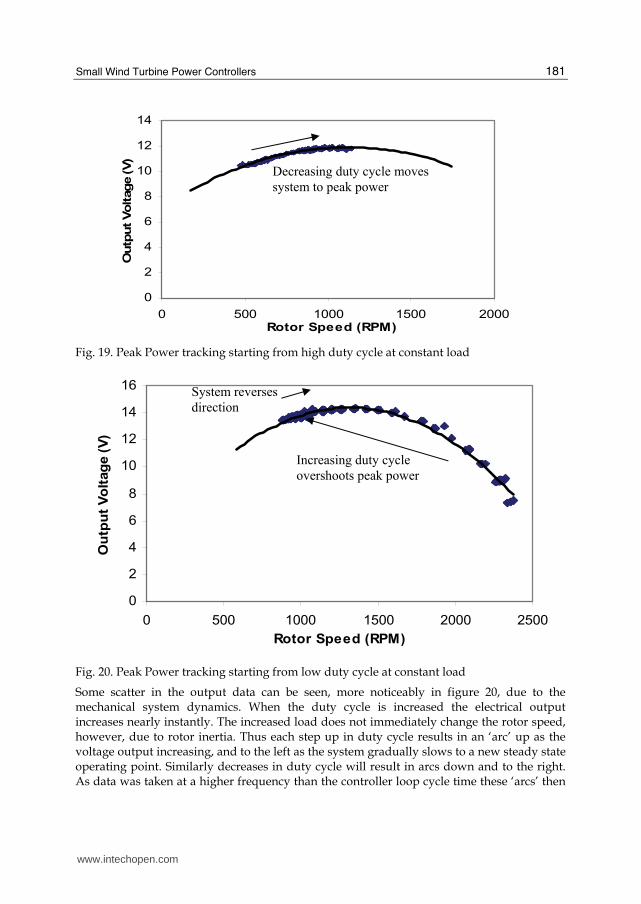
Two tests were performed to check the ability of the controller to track the power starting
from both high and low duty cycles. The output of the DC-DC converter was connected to a
constant load and the controller was manually set to the appropriate initial condition, then
switched into peak-power tracking mode. In the first test, shown in Fig. 19, the controller
starts from a high duty cycle. Initially the rotor is overloaded and turning at less than 500
rpm. The circuit decreases the duty cycle, allowing rotor to speed up, increasing the output
voltage and thus power.
Fig. 20 shows another run beginning from a very low duty cycle. As the generator is lightly
loaded it operates at high speed, around 2300 rpm. Because the duty cycle is low the output
voltage is also low, around 7V. As the duty cycle is increased the output voltage increases
and the generator is loaded, slowing down. The controller continues to increase the duty
cycle, overshooting the peak power until the system speed drops to below 1000 rpm. At this
point the power decrease is sufficient to cause the controller to reverse directions, and
unload the generator, increasing the system speed. This continues until the system is
operating near the peak power output at approximately 1250 rpm. At a constant input
“wind speed” the system will oscillate back and fourth about this maximum power point.
www.intechopen.com
Small Wind Turbine Power Controllers
181
0
2
4
6
8
10
12
14
0 500 1000 1500 2000Rotor Speed (RPM)
Outp
ut Voltage (V)
Fig. 19. Peak Power tracking starting from high duty cycle at constant load
0
2
4
6
8
10
12
14
16
0 500 1000 1500 2000 2500
Rotor Speed (RPM)
Ou
tpu
t V
olt
ag
e (
V)
Fig. 20. Peak Power tracking starting from low duty cycle at constant load
Some scatter in the output data can be seen, more noticeably in figure 20, due to the mechanical system dynamics. When the duty cycle is increased the electrical output increases nearly instantly. The increased load does not immediately change the rotor speed, however, due to rotor inertia. Thus each step up in duty cycle results in an ‘arc’ up as the voltage output increasing, and to the left as the system gradually slows to a new steady state operating point. Similarly decreases in duty cycle will result in arcs down and to the right. As data was taken at a higher frequency than the controller loop cycle time these ‘arcs’ then
Increasing duty cycle
overshoots peak power
System reverses
direction
Decreasing duty cycle moves
system to peak power
www.intechopen.com
Wind Power
182
deviate from the actual steady-state operating curve. It is important to give the system time to settle into a new steady state operating point before another measurement is taken, least the controller confuse these temporary deviations with actual power increases or decreases. The actual minimum settling time will depend on rotor speed and inertia and is on the order of several seconds for a 1.2kVA system.
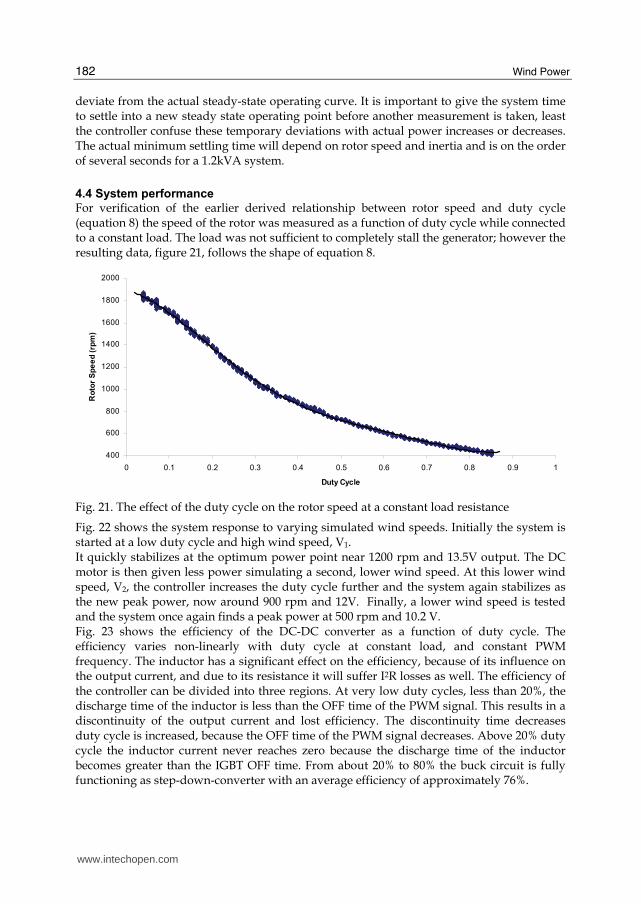
4.4 System performance
For verification of the earlier derived relationship between rotor speed and duty cycle (equation 8) the speed of the rotor was measured as a function of duty cycle while connected to a constant load. The load was not sufficient to completely stall the generator; however the resulting data, figure 21, follows the shape of equation 8.
400
600
800
1000
1200
1400
1600
1800
2000
0 0.1 0.2 0.3 0.4 0.5 0.6 0.7 0.8 0.9 1
Duty Cycle
Ro
tor
Sp
ee
d (
rpm
)
Fig. 21. The effect of the duty cycle on the rotor speed at a constant load resistance
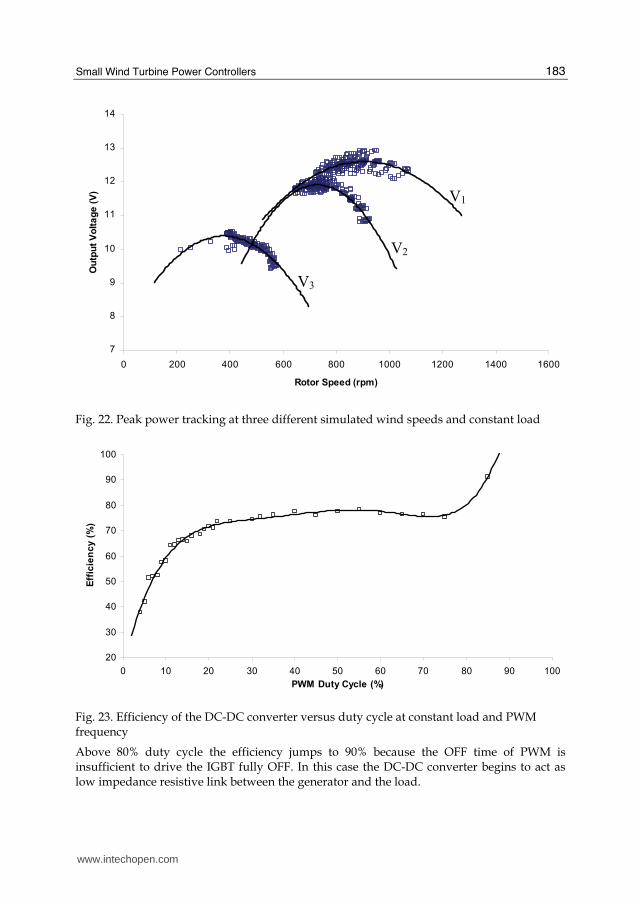
Fig. 22 shows the system response to varying simulated wind speeds. Initially the system is started at a low duty cycle and high wind speed, V1. It quickly stabilizes at the optimum power point near 1200 rpm and 13.5V output. The DC motor is then given less power simulating a second, lower wind speed. At this lower wind speed, V2, the controller increases the duty cycle further and the system again stabilizes as the new peak power, now around 900 rpm and 12V. Finally, a lower wind speed is tested and the system once again finds a peak power at 500 rpm and 10.2 V. Fig. 23 shows the efficiency of the DC-DC converter as a function of duty cycle. The efficiency varies non-linearly with duty cycle at constant load, and constant PWM frequency. The inductor has a significant effect on the efficiency, because of its influence on the output current, and due to its resistance it will suffer I2R losses as well. The efficiency of the controller can be divided into three regions. At very low duty cycles, less than 20%, the discharge time of the inductor is less than the OFF time of the PWM signal. This results in a discontinuity of the output current and lost efficiency. The discontinuity time decreases duty cycle is increased, because the OFF time of the PWM signal decreases. Above 20% duty cycle the inductor current never reaches zero because the discharge time of the inductor becomes greater than the IGBT OFF time. From about 20% to 80% the buck circuit is fully functioning as step-down-converter with an average efficiency of approximately 76%.
www.intechopen.com
Small Wind Turbine Power Controllers
183
7
8
9
10
11
12
13
14
0 200 400 600 800 1000 1200 1400 1600
Rotor Speed (rpm)
Ou
tpu
t V
olt
ag
e (
V)
Fig. 22. Peak power tracking at three different simulated wind speeds and constant load
20
30
40
50
60
70
80
90
100
0 10 20 30 40 50 60 70 80 90 100
PWM Duty Cycle (%)
Eff
icie
nc
y (
%)
Fig. 23. Efficiency of the DC-DC converter versus duty cycle at constant load and PWM frequency
Above 80% duty cycle the efficiency jumps to 90% because the OFF time of PWM is insufficient to drive the IGBT fully OFF. In this case the DC-DC converter begins to act as low impedance resistive link between the generator and the load.
V1
V2
V3
www.intechopen.com
Wind Power
184
5. Peak power tracking controller modelling and economics
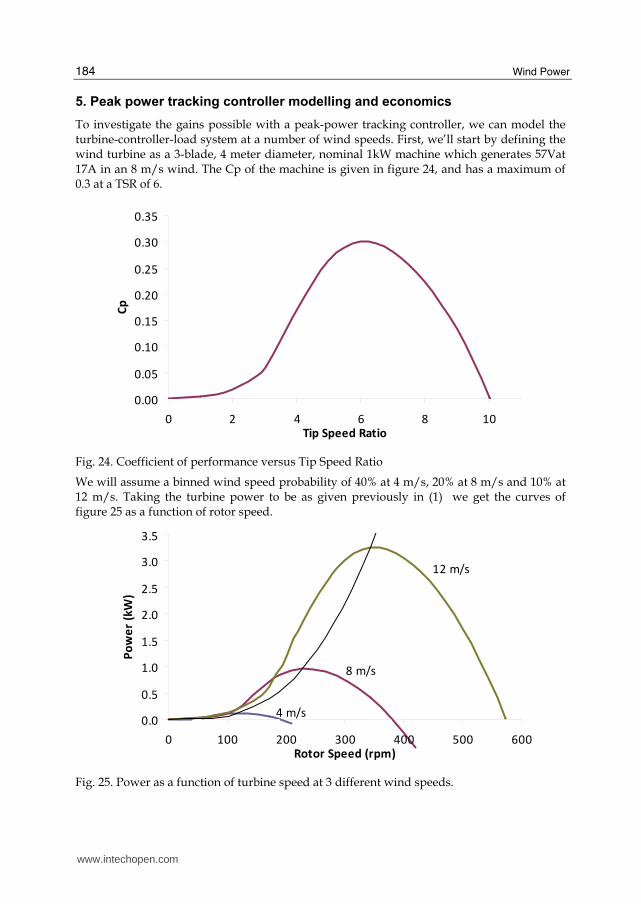
To investigate the gains possible with a peak-power tracking controller, we can model the turbine-controller-load system at a number of wind speeds. First, we’ll start by defining the wind turbine as a 3-blade, 4 meter diameter, nominal 1kW machine which generates 57Vat 17A in an 8 m/s wind. The Cp of the machine is given in figure 24, and has a maximum of 0.3 at a TSR of 6.
0.00
0.05
0.10
0.15
0.20
0.25
0.30
0.35
0 2 4 6 8 10Tip Speed Ratio
Cp
Fig. 24. Coefficient of performance versus Tip Speed Ratio
We will assume a binned wind speed probability of 40% at 4 m/s, 20% at 8 m/s and 10% at 12 m/s. Taking the turbine power to be as given previously in (1) we get the curves of figure 25 as a function of rotor speed.
0.0
0.5
1.0
1.5
2.0
2.5
3.0
3.5
0 100 200 300 400 500 600Rotor Speed (rpm)
Po
we
r (k
W)
12 m/s
8 m/s
4 m/s
Fig. 25. Power as a function of turbine speed at 3 different wind speeds.
www.intechopen.com
Small Wind Turbine Power Controllers
185
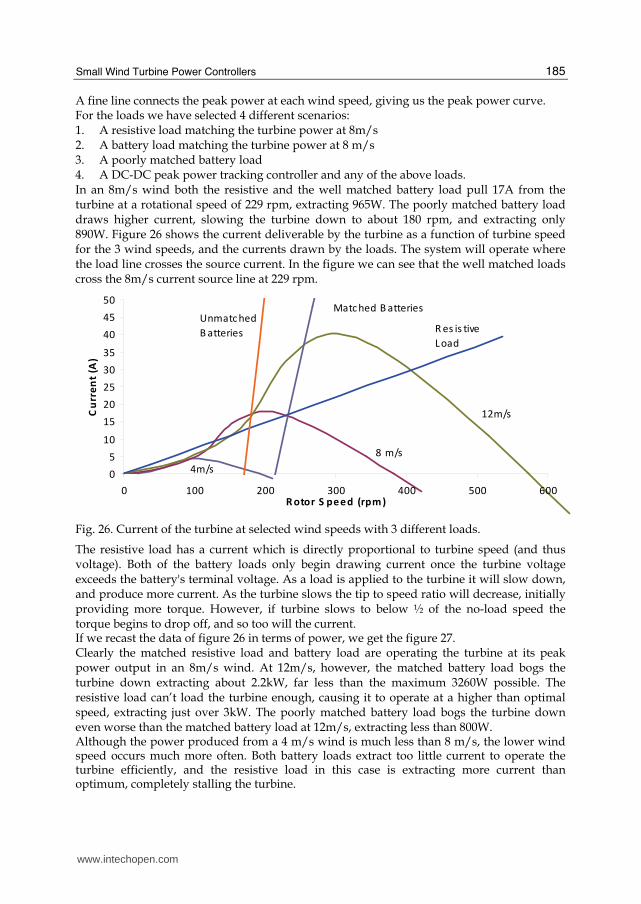
A fine line connects the peak power at each wind speed, giving us the peak power curve. For the loads we have selected 4 different scenarios: 1. A resistive load matching the turbine power at 8m/s 2. A battery load matching the turbine power at 8 m/s 3. A poorly matched battery load 4. A DC-DC peak power tracking controller and any of the above loads. In an 8m/s wind both the resistive and the well matched battery load pull 17A from the turbine at a rotational speed of 229 rpm, extracting 965W. The poorly matched battery load draws higher current, slowing the turbine down to about 180 rpm, and extracting only 890W. Figure 26 shows the current deliverable by the turbine as a function of turbine speed for the 3 wind speeds, and the currents drawn by the loads. The system will operate where the load line crosses the source current. In the figure we can see that the well matched loads cross the 8m/s current source line at 229 rpm.
0
5
10
15
20
25
30
35
40
45
50
0 100 200 300 400 500 600R otor S peed (rpm)
Cu
rre
nt
(A)
12m/s
8 m/s
R es is tive
L oad
Matc hed B atteriesUnmatc hed
B atteries
4m/s
Fig. 26. Current of the turbine at selected wind speeds with 3 different loads.
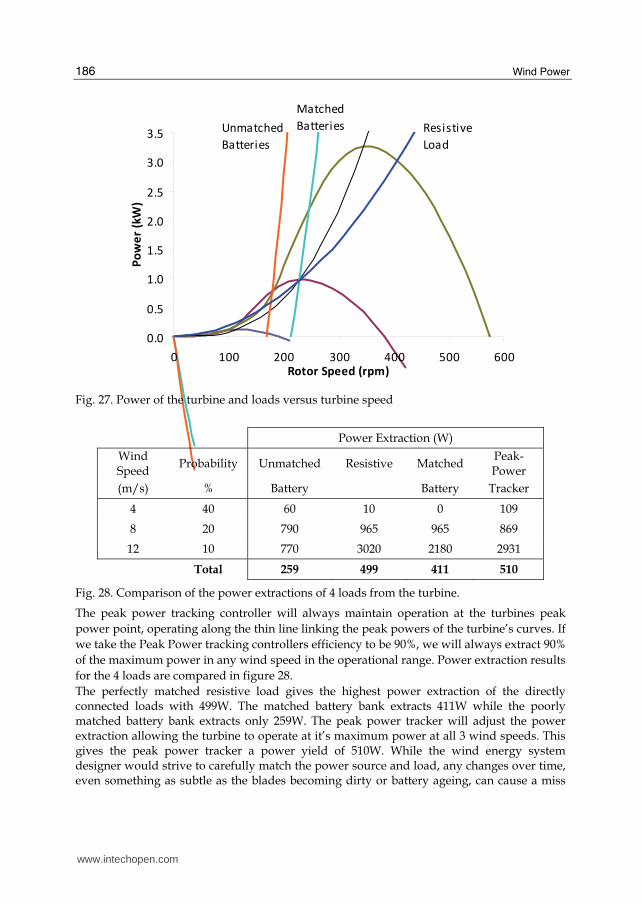
The resistive load has a current which is directly proportional to turbine speed (and thus voltage). Both of the battery loads only begin drawing current once the turbine voltage exceeds the battery's terminal voltage. As a load is applied to the turbine it will slow down, and produce more current. As the turbine slows the tip to speed ratio will decrease, initially providing more torque. However, if turbine slows to below ½ of the no-load speed the torque begins to drop off, and so too will the current. If we recast the data of figure 26 in terms of power, we get the figure 27. Clearly the matched resistive load and battery load are operating the turbine at its peak power output in an 8m/s wind. At 12m/s, however, the matched battery load bogs the turbine down extracting about 2.2kW, far less than the maximum 3260W possible. The resistive load can’t load the turbine enough, causing it to operate at a higher than optimal speed, extracting just over 3kW. The poorly matched battery load bogs the turbine down even worse than the matched battery load at 12m/s, extracting less than 800W. Although the power produced from a 4 m/s wind is much less than 8 m/s, the lower wind speed occurs much more often. Both battery loads extract too little current to operate the turbine efficiently, and the resistive load in this case is extracting more current than optimum, completely stalling the turbine.
www.intechopen.com
Wind Power
186
0.0
0.5
1.0
1.5
2.0
2.5
3.0
3.5
0 100 200 300 400 500 600Rotor Speed (rpm)
Po
we
r (k
W)
Resistive
Load
Unmatched
Batteries
Matched
Batteries
Fig. 27. Power of the turbine and loads versus turbine speed
Power Extraction (W)
Wind Speed
Probability Unmatched Resistive Matched Peak-Power
(m/s) % Battery Battery Tracker
4 40 60 10 0 109
8 20 790 965 965 869
12 10 770 3020 2180 2931
Total 259 499 411 510
Fig. 28. Comparison of the power extractions of 4 loads from the turbine.
The peak power tracking controller will always maintain operation at the turbines peak
power point, operating along the thin line linking the peak powers of the turbine’s curves. If
we take the Peak Power tracking controllers efficiency to be 90%, we will always extract 90%
of the maximum power in any wind speed in the operational range. Power extraction results
for the 4 loads are compared in figure 28.
The perfectly matched resistive load gives the highest power extraction of the directly connected loads with 499W. The matched battery bank extracts 411W while the poorly matched battery bank extracts only 259W. The peak power tracker will adjust the power extraction allowing the turbine to operate at it’s maximum power at all 3 wind speeds. This gives the peak power tracker a power yield of 510W. While the wind energy system designer would strive to carefully match the power source and load, any changes over time, even something as subtle as the blades becoming dirty or battery ageing, can cause a miss
www.intechopen.com
Small Wind Turbine Power Controllers
187
match between the turbine and load. Thus the mismatched battery case is a more common scenario than one might initially suspect. One of the important aspects this highlights is that most loads even if carefully matched to a turbine’s output at a given wind speed are likely to be poorly matched for other wind speeds. Additionally the Peak-power tracking controller can allow the turbine to operate at its maximum efficiency over a wide range of wind speeds and loads. Despite less than unity efficiency peak power trackers can extract more power than “straight through” systems. The turbine described in the above section will likely cost several thousand dollars to buy and erect. Taking 10,000$ as the assembled turbines cost, and assuming a lifetime of 10 years if we couple it to the well matched battery load we would produce a total of 10 x 356 x 24 x 411/1000 or about 31,100 kWh of energy, for a unit energy cost of 28.5 cents per kWh. Using the peak power tracker we would have produced 43,600 kWh. Taking the cost of the controller to be 250$, using it would give a unit energy cost of 23.5 cents per kWh making it the most economical system overall. Perhaps a more realistic comparison would be with the poorly matched system which only generated 22,100 kWh for a unit energy cost of 45.2 cents per kWh. In this case use of the peak-power controller would almost double the energy production.
6. Conclusions
Almost all wind energy systems require a controller to prevent damage to the turbine and the load. With advances in power electronics and microcontrollers, inexpensive yet sophisticated power controllers can be produced which are also capable of enhancing the power extraction of the overall system. These controllers may use DC-DC converters to boost the voltage of a given power source up to a higher voltage to match the requirement of a load, such as in the case of the solar panel or wind turbine operating below the charging voltage of a battery pack. A DC-DC converter, either buck or boost, may also be used in impedance matching a power source to a given load with an improvement in the overall system efficiency. With modern microcontrollers and high-frequency power switching devices a peak-power tracking controller can be developed which includes many functions such as load over charging protection, load prioritization, and turbine breaking. Such a peak-power tracking controller can greatly enhance the overall power production of a wind turbine system, and may cost a small fraction of the price of the turbine. With reasonable care the wind power system can be modelled and the cost/benefit ratio of a controller can be determined. In many applications the additional cost of a sophisticated controller is justified by the increased power yield of the system.
7. Ongoing work
With increasing costs of primary fuel sources and the recent explosion of inexpensive small wind turbines from China, small wind power systems are bound to become more common. As the price of electronic power components comes down, and the sophistication of small microcontrollers increases, powerful and inexpensive “intelligent” controllers can help protect investments in alternative energy systems and extract more power from existing equipment. We are continuing long-term field testing of controllers to verify their overall performance and power extraction improvements.
www.intechopen.com

Wind Power
188
Additional work in this area will consist of overall system optimization and balancing, including battery voltage and storage capacities, power transmission and conversion, not just from the power sources, but also at the end-use points.
8. References
Agrawal J. P. (2001). Power Electronic Systems Theory and Design, Prentice Hall, Upper Saddle
River, New Jersey 2001.
Calwell C. & Reeder T. (2002). Power Supplies: A Hidden Opportunity for Energy Savings NRDC
Gitano H.; Taib S. & Khdeir M. (2008). Design and Testing of a Low Cost Peak-Power
Tracking controller for a Fixed Blade 1.2 kVA Wind turbine. Electrical Power Quality
and Utilisation, Vol.14, No. 1, July 2008, pg. 95-101, ISSN 1234-6799
Johnson G. (1985). Wind Energy Systems, ISBN 0-13-957754-8
Manwell J. F.; McGowan, J. G. & Rogers, A. L. (2002). Wind Energy Explained: Theory Design
and Application, pg. 321-367, ISBN, J. Wiley and Sons
Patel M. R. (2006). Wind and Solar Power Systems Design and Optimization, pg. 68-108, ISBN,
Taylor and Frances Group
Rajambal K. ; Umamaheswari B. & Chellamuthu C. (2005). Electrical Braking of Large Wind
Turbines. [Online]. Available: http://www.sciencedirect.com
Rashid M. H. (1993). Power Electronics Circuits, Devices, and Applications, Prentice hall, Upper
Saddle river, New Jersey 1993
Schelle D. & Castorena J. (2006). Buck-Converter Design Demystified. Maximum Integrated
Products, Sunnyvale, Cliff. [Online]. Available: http://www.powerelectronics.com
Simones M. ; Bose B. K. ; & Spiegel R. J. (1997). Fuzzy Logic Based Intelligent Control of a
Variable Speed Cage Machine Wind Generation System, IEEE Trans. on Power
Electronics, vol. 3, pp. 87-95, Jan. 1997
Van Baars G. E. & Bongers P. M. M. (1992). "Wind turbine control design and
implementation based on experimental models" in Proc. 1992 Decision and Control
Conf., pp. 2454-2459.
www.intechopen.com

Wind PowerEdited by S M Muyeen
ISBN 978-953-7619-81-7Hard cover, 558 pagesPublisher InTechPublished online 01, June, 2010Published in print edition June, 2010
InTech EuropeUniversity Campus STeP Ri Slavka Krautzeka 83/A 51000 Rijeka, Croatia Phone: +385 (51) 770 447 Fax: +385 (51) 686 166www.intechopen.com
InTech ChinaUnit 405, Office Block, Hotel Equatorial Shanghai No.65, Yan An Road (West), Shanghai, 200040, China
Phone: +86-21-62489820 Fax: +86-21-62489821
This book is the result of inspirations and contributions from many researchers of different fields. A wide verityof research results are merged together to make this book useful for students and researchers who will takecontribution for further development of the existing technology. I hope you will enjoy the book, so that my effortto bringing it together for you will be successful. In my capacity, as the Editor of this book, I would like to thanksand appreciate the chapter authors, who ensured the quality of the material as well as submitting their bestworks. Most of the results presented in to the book have already been published on international journals andappreciated in many international conferences.
How to referenceIn order to correctly reference this scholarly work, feel free to copy and paste the following:
Horizon Gitano-Briggs (2010). Small Wind Turbine Power Controllers, Wind Power, S M Muyeen (Ed.), ISBN:978-953-7619-81-7, InTech, Available from: http://www.intechopen.com/books/wind-power/small-wind-turbine-power-controllers

© 2010 The Author(s). Licensee IntechOpen. This chapter is distributedunder the terms of the Creative Commons Attribution-NonCommercial-ShareAlike-3.0 License, which permits use, distribution and reproduction fornon-commercial purposes, provided the original is properly cited andderivative works building on this content are distributed under the samelicense.