Embed Size (px)
Citation preview

Helping Local Entrepreneurs to InvestHelping Local Entrepreneurs to InvestHelping Local Entrepreneurs to InvestHelping Local Entrepreneurs to InvestHelping Local Entrepreneurs to InvestBy Hervé ConanEdited by Charles T. Andrews and Almud Weitz
SmallPipedWaterNetworks
ADB S E
R
I E
S
S E
R
I E
S
S E
R
I E
S
S E
R
I E
S
S E
R
I E
S
1313131313


Helping Local Entrepreneurs to InvestHelping Local Entrepreneurs to InvestHelping Local Entrepreneurs to InvestHelping Local Entrepreneurs to InvestHelping Local Entrepreneurs to Invest
SmallPipedWaterNetworks
© Asian Development Bank
All rights reserved
The findings, interpretations, and conclusions expressed in this documentdo not necessarily represent the views of the Asian Development Bank (ADB)or the views of its member governments. ADB does not guarantee theaccuracy of the data included in this publication and accepts no responsibilityfor any consequences of their use.
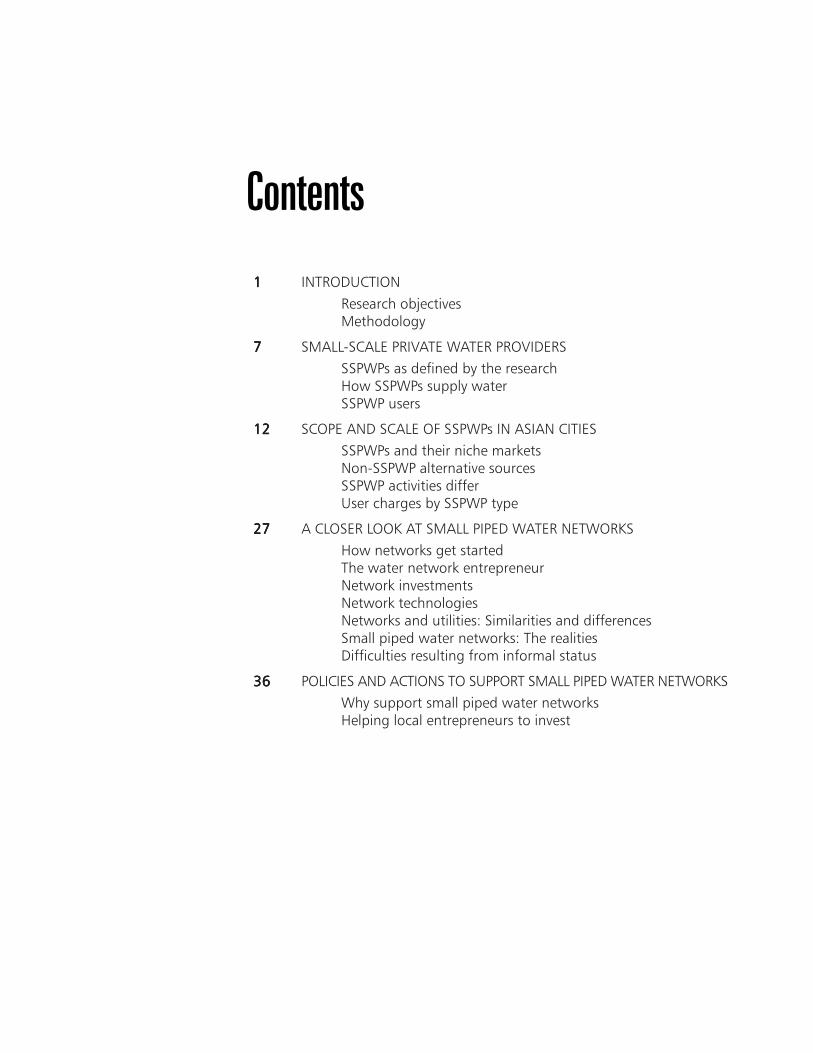
AbbreviationsAbbreviationsAbbreviationsAbbreviationsAbbreviations
ADB Asian Development BankDCC Dhaka City CorporationDWASA Dhaka Water Supply and Sanitation AuthorityGDP gross domestic productHC house connectionHCMC Ho Chi Minh CityHH householdhr hourkm2 square kilometerl literm3 cubic meterMCWD Metro Cebu Water DistrictMDG Millennium Development GoalNGO nongovernment organizationNRW nonrevenue waterO&M operation and maintenancePVC poly vinyl chlorideRETA regional technical assistanceSSPWP small-scale private water providerWHO World Health OrganizationWSP Water and Sanitation Program (World Bank)WTP willingness to payWSS water supply and sanitationWU water utilityWWF World Water Forum
Note: $ values in this publication are local currency equivalents in US dollars.
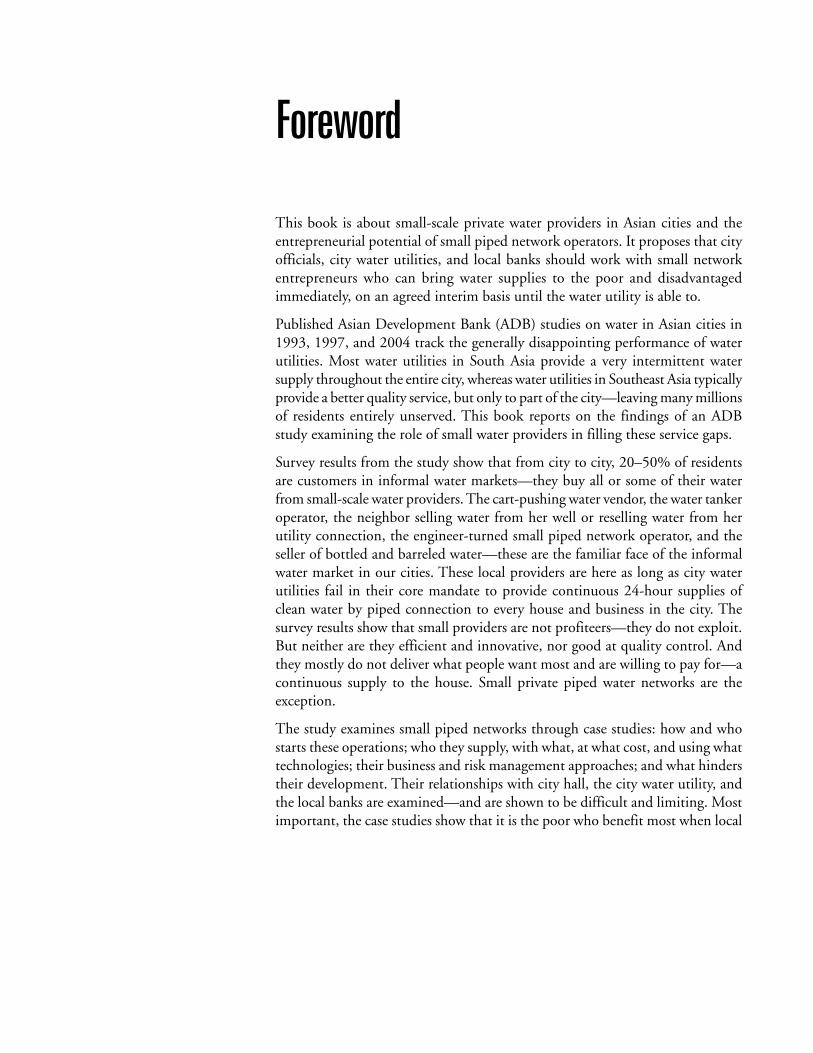
11111 INTRODUCTIONResearch objectivesMethodology
77777 SMALL-SCALE PRIVATE WATER PROVIDERSSSPWPs as defined by the researchHow SSPWPs supply waterSSPWP users
1212121212 SCOPE AND SCALE OF SSPWPs IN ASIAN CITIESSSPWPs and their niche marketsNon-SSPWP alternative sourcesSSPWP activities differUser charges by SSPWP type
2727272727 A CLOSER LOOK AT SMALL PIPED WATER NETWORKSHow networks get startedThe water network entrepreneurNetwork investmentsNetwork technologiesNetworks and utilities: Similarities and differencesSmall piped water networks: The realitiesDifficulties resulting from informal status
3636363636 POLICIES AND ACTIONS TO SUPPORT SMALL PIPED WATER NETWORKSWhy support small piped water networksHelping local entrepreneurs to invest
Contents
Foreword
This book is about small-scale private water providers in Asian cities and theentrepreneurial potential of small piped network operators. It proposes that cityofficials, city water utilities, and local banks should work with small networkentrepreneurs who can bring water supplies to the poor and disadvantagedimmediately, on an agreed interim basis until the water utility is able to.
Published Asian Development Bank (ADB) studies on water in Asian cities in1993, 1997, and 2004 track the generally disappointing performance of waterutilities. Most water utilities in South Asia provide a very intermittent watersupply throughout the entire city, whereas water utilities in Southeast Asia typicallyprovide a better quality service, but only to part of the city—leaving many millionsof residents entirely unserved. This book reports on the findings of an ADBstudy examining the role of small water providers in filling these service gaps.
Survey results from the study show that from city to city, 20–50% of residentsare customers in informal water markets—they buy all or some of their waterfrom small-scale water providers. The cart-pushing water vendor, the water tankeroperator, the neighbor selling water from her well or reselling water from herutility connection, the engineer-turned small piped network operator, and theseller of bottled and barreled water—these are the familiar face of the informalwater market in our cities. These local providers are here as long as city waterutilities fail in their core mandate to provide continuous 24-hour supplies ofclean water by piped connection to every house and business in the city. Thesurvey results show that small providers are not profiteers—they do not exploit.But neither are they efficient and innovative, nor good at quality control. Andthey mostly do not deliver what people want most and are willing to pay for—acontinuous supply to the house. Small private piped water networks are theexception.
The study examines small piped networks through case studies: how and whostarts these operations; who they supply, with what, at what cost, and using whattechnologies; their business and risk management approaches; and what hinderstheir development. Their relationships with city hall, the city water utility, andthe local banks are examined—and are shown to be difficult and limiting. Mostimportant, the case studies show that it is the poor who benefit most when local

entrepreneurs invest risk capital and build and operate piped networks in unservedurban slums and low-income neighborhoods that have been failed by the citywater utility.
The study finds strongly in favor of small piped networks, as short- and medium-term providers until the city water utility can expand services to the area.
The book offers practical recommendations to city governments and utilities forgetting local water network entrepreneurs to invest. Small piped networks shouldbe included in city development strategies, utilities should work with localentrepreneurs, small networks should be “formalized” with licensing and exitstrategies and takeout agreements, minimum standards should recognize riskand pay-back requirements, enabling legal and contractual conditions should becreated, and small operators should be integrated into the water supply chain tothe extent possible. ADB will join with two or three cities to test and refine theserecommendations during 2005–2006.
Jan P. M. van HeeswijkDirector GeneralRegional and SustainableDevelopment Department

Acknowledgments
The Asian Development Bank wishes to thank the small-scale water providerswho furnished information to make this publication possible, including PhucDoan and Hiep An companies of Ho Chi Minh City (Viet Nam); FernandoMiñoza and Virgie Zafra of Cebu and Inpart Engineering of Manila (Philippines);the tankers’ association of Kathmandu Valley (Nepal); the pushcart waterdistributors of Delhi (India); and the independent water bottlers of Shanghai(People’s Republic of China).
We are grateful for the support of local consultants in the surveyed cities whocollected information and prepared reports on their local informal water markets.
We give special thanks to former ADB staff Maria Paniagua, who initiated anddefined this study, and to Marc Vezina for his guidance on approach andmethodology.
Charles T. AndrewsPrincipal Water Supply andSanitation SpecialistAgriculture and Natural Resourcesand Social Sectors Division

Small Piped Water Networks: Helping Local Entrepreneurs to Invest
1
Small Piped Water Networks:Helping Local Entrepreneurs
to InvestBackgroundIntroduction This publication presents findings and recommendations from field research
funded by the Asian Development Bank (ADB). Researching small-scaleprivate water providers (SSPWPs) was part of a wider study on “Water in
Asian Cities”.1 The SSPWP research investigated and analyzed the role of smallproviders in eight Asian cities, namely Cebu (Philippines), Delhi (India), Dhaka(Bangladesh), Ho Chi Minh City or HCMC (Viet Nam), Jakarta (Indonesia),Kathmandu (Nepal), Shanghai (People’s Republic of China), and Ulaanbaatar(Mongolia).2 Additionally, one SSPWP in Manila (Philippines) was studied.
Research objectivesThe objectives of the SSPWP research were to (i) provide an overview of urbanwater suppliers beyond formal water utilities, (ii) increase the knowledge aboutthe type of services provided by SSPWPs, (iii) define the profile of the mostsignificant SSPWPs, and (iv) assess the main constraints and potential forSSPWPs.
MethodologyUnder the supervision of ADB and a consultant team coordinator, a team ofeight local consultants conducted field surveys on the scope and scale of SSPWPsin the eight selected cities.
The study started in mid-August 2002 and field surveys were finished in earlyJanuary 2003. The field surveys included a household survey to define the waterprofile of each city. The surveys considered not just SSPWPs but all water services,including utilities, traditional water points, and other water providers set up bycommunity organizations, nongovernment organizations (NGOs), and privateoperators. Case studies were also undertaken to get in-depth information onspecific services provided by selected SSPWPs.
1 The main study collected and analyzed data on the performance of water utilities in 18 Asian cities (Chengdu, Colombo,Delhi, Dhaka, Ho Chi Minh City, Hong Kong, Jakarta, Karachi, Kathmandu, Kuala Lumpur, Manila, Osaka, PhnomPenh, Seoul, Shanghai, Tashkent, Ulaanbaatar, and Vientiane). ADB published the findings in Water in Asian Cities:Utilities’ Performance and Civil Society Views. The views of civil society were also collected and synthesized, and areappended to the publication..
2 The studies were funded under Regional Technical Assistance 6031: Promoting Effective Water Management Policiesand Practices, 26 April 2002.
Introduction
2
Cebu Delhi Dhaka HCMC Jakarta Kathmandu Shanghai Ulaanbaatar Region SEA South Asia South Asia GMS SEA South Asia East Asia Central Asia Country Philippines India Bangladesh Viet Nam Indonesia Nepal PRC Mongolia Population (in million)
0.655 13.8 10.5 5.3 8.35 1 13 0.74
Growth rate (%) 1.6 3.8 4.2 1.3 2.4 6 < 0 4.5 Surface area (km²) 326 1,483 360 2,095 660 100 6,340 3,450 Population density (p/km2)
9.26 9,300 95.3 2,520 12,620 17.57 2,050 13.3
Average GDP ($/y/cap.)
400 810 630 720 366 573 2,000 440
Two workshops were organized. The first, held in Bangkok in September 2002,developed a common methodology and concept to facilitate comparison betweencities and defined the surveys to develop the city water profiles. The second, heldin Manila in November 2003, presented the data of the city water profile surveysconducted in each city and discussed the main objectives of the selected casestudies.
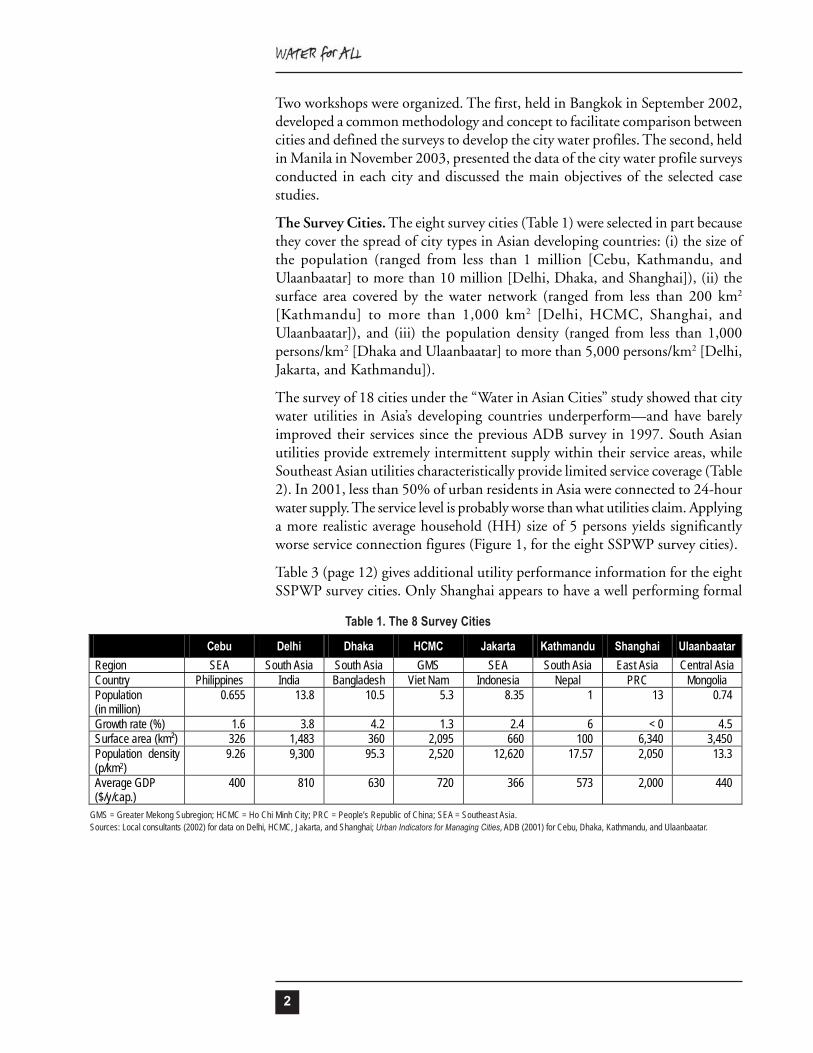
The Survey Cities. The eight survey cities (Table 1) were selected in part becausethey cover the spread of city types in Asian developing countries: (i) the size ofthe population (ranged from less than 1 million [Cebu, Kathmandu, andUlaanbaatar] to more than 10 million [Delhi, Dhaka, and Shanghai]), (ii) thesurface area covered by the water network (ranged from less than 200 km2
[Kathmandu] to more than 1,000 km2 [Delhi, HCMC, Shanghai, andUlaanbaatar]), and (iii) the population density (ranged from less than 1,000persons/km2 [Dhaka and Ulaanbaatar] to more than 5,000 persons/km2 [Delhi,Jakarta, and Kathmandu]).
The survey of 18 cities under the “Water in Asian Cities” study showed that citywater utilities in Asia’s developing countries underperform—and have barelyimproved their services since the previous ADB survey in 1997. South Asianutilities provide extremely intermittent supply within their service areas, whileSoutheast Asian utilities characteristically provide limited service coverage (Table2). In 2001, less than 50% of urban residents in Asia were connected to 24-hourwater supply. The service level is probably worse than what utilities claim. Applyinga more realistic average household (HH) size of 5 persons yields significantlyworse service connection figures (Figure 1, for the eight SSPWP survey cities).
Table 3 (page 12) gives additional utility performance information for the eightSSPWP survey cities. Only Shanghai appears to have a well performing formal
Table 1. The 8 Survey Cities
GMS = Greater Mekong Subregion; HCMC = Ho Chi Minh City; PRC = People’s Republic of China; SEA = Southeast Asia.Sources: Local consultants (2002) for data on Delhi, HCMC, Jakarta, and Shanghai; Urban Indicators for Managing Cities, ADB (2001) for Cebu, Dhaka, Kathmandu, and Ulaanbaatar.

Small Piped Water Networks: Helping Local Entrepreneurs to Invest
3
Figure 1. Percentage of Households Connected to Water Utility Network
HCMC = Ho Chi Minh City.Source: ADB. Water in Asian Cities (RETA 6031).
020406080
100
CebuDe lhi
DhakaHCMC
Jakarta
Ka thmandu
Shangha i
U laanbaa tar
% o
f hou
seho
lds
Table 2. Coverage and Water Availability in 18 Asian Cities (2001)
a Percentage of connections served with 24-hour continuous supply.b This does not include about 151,860 people served by 2,531 public taps in tenement gardens.Source: National GDP. World Bank website. Water Services: Water in Asian Cities.
Country National GDP ($/capita) City Coverage
(%) Supply Continuitya
(%) Central and East Asia Japan 33,550 Osaka 100 100 People’s Republic of China 960 Shanghai 100 100 People’s Republic of China 960 Chengdu 83 100 People’s Republic of China 24,750 Hong Kong 100 100 Uzbekistan 460 Tashkent 99 100 Southeast Asia Malaysia 3,540 Kuala Lumpur 100 100 Republic of Korea 9,930 Seoul 100 100 Philippines 1,020 Manila 58 88 Indonesia 710 Jakarta 51 92 Mekong Region Viet Nam 430 Ho Chi Minh City 84 75 Lao People’s Democratic Republic 310 Vientiane 63 50
Cambodia 280 Phnom Penh 84 100 South Asia Sri Lanka 840 Colombo 69b 60 Pakistan 410 Karachi 58 0 India 440 Delhi 69 1 Bangladesh 360 Dhaka 72 0 Nepal 230 Kathmandu 83 0

4
Tabl
e 3. L
evel
of S
ervic
e Pro
vided
by W
ater
Util
ities
in th
e 8 S
elect
ed C
ities
HCMC
= H
o Ch
i Minh
City
, HH
= ho
useh
old.
a The
situ
ation
in U
laanb
aata
r is q
uite
uniqu
e wi
th co
llecti
ve m
eter
s for
buil
dings
in th
e cit
y and
stan
dpipe
s in
low-in
come
fring
e ar
eas.
b Bas
ed o
n loc
al co
nsult
ants’
not
es (2
002)
; see
Table
2.
c Fro
m As
ian W
ater
Sup
plies
: Rea
ching
the U
rban
Poo
r, App
endix
1: C
ity W
ater
Pro
files a
nd S
umma
ry F
inding
s. AD
B an
d Int
erna
tiona
l Wat
er A
ssoc
iation
. 200
3 (ex
cept
for
Cebu
case
stud
ies).
d Tra
dition
al te
nt d
wellin
g of
Mon
golia
n no
mads
.So
urce
: ADB
. 200
3. W
ater
in A
sian
Citie
s: Ut
ilities
’ Per
form
ance
and
Civi
l Soc
iety V
iews (
exce
pt C
ebu,
% o
f HH
conn
ectio
ns, a
nd a
s not
ed).
Ce
bu
Delh
i Dh
aka
HCMC
Ja
karta
Ka
thm
andu
Sh
angh
ai Ul
aanb
aata
ra
Popu
lation
b 72
0,000
13
,800,0
00
10,50
0,000
5,3
00,00
0 8,3
50,00
0 1,0
00,00
0 13
,000,0
00
740,0
00
Name
of w
ater u
tility
Metro
Ceb
u Wate
r Di
strict
(MCW
D)
Delhi
Jal B
oard
(D
JB)
Dhak
a Wate
r Su
pply
and
Sewe
rage
Au
thority
(DW
ASA)
Ho C
hi Mi
nh W
ater
Supp
ly Co
mpan
y
Pam
Lyon
naise
Ja
ya
& Th
ames
Pam
Ja
ya
Nepa
l Wate
r Su
pply
Corp
orati
on(N
WSC
) --
Wate
r Utili
ty Co
mpan
y of
Ulaa
nbaa
tar C
ity
(USA
G)
Statu
s Go
vern
ment
Corp
orati
on
Gove
rnme
nt Co
mpan
y Go
vern
ment
Corp
orati
on
Prov
incial
Co
mpan
y Pr
ivate
Com
panie
s Go
vern
ment
Corp
orati
on
Munic
ipal: 2
Di
strict
: 39
Town
: 152
St
ate E
nterp
rise
Nonr
even
ue w
ater (
%)
n/a
53%
40
38
51
37
16
36
Staff
per 1
,000 c
onne
ction
s n/a
20
11
3.5
5.3
15
5.7
82
3
% of
surfa
ce w
ater
Low
83%
2
58
100
62
70
0
% of
HHs
that
have
acce
ss
to pip
ed sy
stem
n/a
69%
72
84
51
83
10
0 49
% of
HH
conn
ectio
n
35%
65%
10
57
54
71
10
0 53
No. o
f con
necti
ons
51
,730
1,3
75,00
0 18
5,000
33
0,000
61
0,000
12
3,000
3,0
00,00
0 1,4
00
Wate
r ava
ilabil
ity (h
ours)
18–2
4
2–4
16
24
18
2–4
24
21
% of
HHs
with
24-h
servi
ce
n/a
1%
0%
75
92
0 10
0 48
Socia
l tariff
($)c
0.24
0.03
0.06–
0.08
0.11
0.04
0.08
0.12
0.19 d
ownto
wn
0.5 in
gerd a
rea
Aver
age c
onne
ction
fee
($)
100
2 29
53
9–
38
20
83
450

Small Piped Water Networks: Helping Local Entrepreneurs to Invest
5
water market. Interestingly, this is achieved with a metro total of 193 separatewater utilities. The case of Jakarta shows how difficult it will be to pull backwater supply (let alone sanitation) service deficits in low-income cities (Box 1).
Household Survey. To better appreciate the scope and scale of SSPWPs in Asiancities, a common customers’ survey was implemented by national consultants ineach of the eight selected cities. Around 500 households in each city (exceptShanghai3) were selected randomly for the sample to represent the different watersupply situations present at city scale, within and beyond the area covered by thewater utility. The different water supply situations are defined by services providedboth by the city water utility and traditional water points. In areas served by thewater utility, the main services provided are household connections, standpipes,and tanker services. In areas not served, the main existing services are wells (openand tube wells) where groundwater sources are available.
Representative areas for the survey were selected for each situation, and the sizeof the sample in each selected area was defined according to the percentage ofpopulation living in such areas. Box 2 (next page) shows the approach forKathmandu.
The survey questionnaire was developed by the project team and adapted by thelocal consultants to take into account the specificities of their water situation.Due to the limited size of the sample compared with the population living in theeight cities (0.7–14 million), the results are not statistically representative, butprovide an estimate of the scope and scale of SSPWPs.
3 No household survey was carried out in Shanghai where the whole population is connected to pipe systems managedby water utilities. The field survey in Shanghai instead focused on remote and migrant living areas to check possibleinvolvement of SSPWPs. However, no SSPWPs were found.
Based on data provided by the Jakarta Water SupplyRegulatory Body for the Water in Asian Cities study (ADB 2003),there are 602,000 individual connections serving a population ofaround 4,580,000 in metro Jakarta (yielding an unlikely 7.6persons/connection). Metro Jakarta’s population is around 10million.
With a yearly population growth of around 2.5% and aprogram to connect each year around 50,000 new customers(10% more than achieved annually during the last 5 years), thepercentage of people who will not have an individual connectionin 2015 will be 31% compared with 54% in 2002.
In real terms, this means that around 4.3 million metro Jakartaresidents in 2015 will still be without water connection comparedwith 5.4 million today.
Box 1. Jakarta: More than 4 Million PeopleStill Without House Connection in 2015
202530354045505560
2002 20152,000,000 2,500,000 3,000,000 3,500,000 4,000,000 4,500,000 5,000,000 5,500,000 6,000,000
% of population without house connection
No. of people without house connection
% o
f pop
ulat
ion
No.
of p
eopl
e

6
Box 2. Survey Structure for Kathmandu
TRIBHUW AN A IRPORT
Pa sh u p a tinath
BUD HANATH
M AHARAJGU NJ
TRIBHUW AN
K A T H M A N D U M E T R O P O L I T A N C I T YBAN ESW OR
SW AYAM BHU NATH
N AGARJUN BAN
U NIVERSITY
KA
NTI
RAJ
PATH
BASBARIGAGABU
N EPALTAR
RAN IBAN
BAL AJU
N AYABAJARHARIGAU
C ABAHIL
TRIPU RESW AR
RABI BHAW AN
KOPUN DOLTHAPATHALI
M IN BHAW AN
THANAGAU
L AL ITPUR
HOSPITAL
JAU LAKHEL
OKHTHANKHU M ALTAR
D HAPAKHEL
GOTHATAR
VOC ATIONALTRAIN IN G CENTRE
KOTESW AR
BARAL GAU
N AIKAP
KAL AN KITHAN
(P. BHANJYANG)
16
29
3
4
26
5
7
8
9
34
10
32
3331
11
30
17
15
132019
18 282726
25 24
2221
23
12
14
35
2 110
22
162120 18 11
6
1219
5
13
4
1514
39
8
7
1
17
5
KATHMANDU & LALITPUR MUNICIPALITY
ICHHANGU
D HAPASI
L A L I T P U R S U B M E T R O P O L I T A N
Kat
hman
du C
ore
Kat
hman
du C
entra
l
Kat
hman
du N
orth
Kat
hman
du W
est
Kat
hman
du E
ast
15
10
3
4
21
6
9
7
8
Lal
itpur
Ext
ensi
on
Lal
itpur
Ext
ensi
on
Lalitpur Extension
CoreLalitpur
8
C I T Y
Kathmandu and Lalitpur have 57 wards distributed in 8 mainareas.
For the survey, 15 wards were selected to represent thedifferent city areas:
(a) Kathmandu Metropolitan Corporation (12):- Kathmandu Core, 3- Kathmandu Central, 2- Kathmandu North, 2- Kathmandu West, 2- Kathmandu East, 3
(b) Lalitpur Sub Metropolitan Corporation (3):- Lalitpur Core, 1- Lalitpur North, 1- Lalitpur South, 1
The selected wards cover around 70,000 people. A total of540 households (HHs) were surveyed.
Methodology followed to select HHs to be surveyed:1. Enumerator approached the selected ward office.2. With the support of ward officials, enumerator selected
five different categories of areas covered by the utility.3. Enumerator selected in each of these areas the required
numbers of HHs belonging to four income categories andexecuted the survey.
Due to the very low percentage of HHs surveyed (4% of theselected wards and around 0.3% of total population), 15 focusgroups were organized (one in each selected ward) tocomplement the information collected through interviews.
Source: Local consultant.
Small Piped Water Networks: Helping Local Entrepreneurs to Invest
7
Small-scale private water providers (SSPWPs) are independent smallcompanies, cooperatives, or individuals that supply water to users. They areindependent to the extent that they are self-employed entrepreneurs or
artisans. Most work without formal recognition from local authorities and arenot subcontracted by the main water utility. Unlike in formalized private-publiccontracts, the small independent operator enters a market freely, takes risks, andinvests without the benefit of any agreement with the public.
The rise of SSPWPs reflects the inability of water utilities to adequately providefor the water and sanitation needs of city dwellers (Table 4). In developingcountries, water utilities have rarely achieved universal 24-hour piped water andsanitation services.4 Millions of people, especially the poor, remain underservedor not served at all because of
• poor and inadequate WSS policies at national and local government levels;• poor water utilities governance, resulting in inefficient investment and
operations frequently rooted in corruption;• low and irrational tariffs that benefit the nonpoor and disadvantage the
poor; and• legal and other institutional impediments to serving the poor, especially
lack of land tenure.
Small-ScalePrivate Water
Providers
Although mandated to serve poor households, water utilities often do not havethe know-how to do so. Also, their service levels are often not tailored to demandbut are based on technical standards that increase service costs beyond the capacityof low-income families. Moreover, their payment systems are not well adapted tothe conditions and constraints of the poor such as irregular income and smallconsumption capacity.
4 An insightful and frank discussion of why city water utilities underperform in Asia can be found in Asian Water Supplies:Reaching the Urban Poor by Arthur C. McIntosh, Manila, ADB 2003.
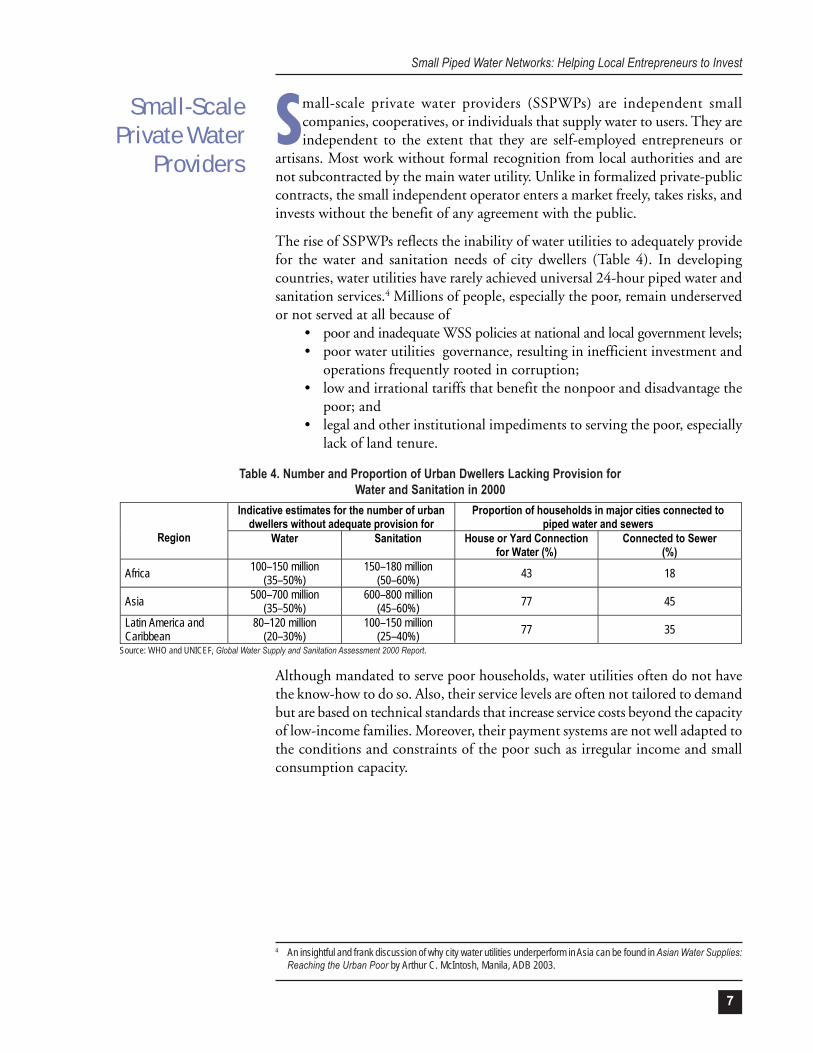
Indicative estimates for the number of urban dwellers without adequate provision for
Proportion of households in major cities connected to piped water and sewers
Region Water Sanitation House or Yard Connection for Water (%)
Connected to Sewer (%)
Africa 100–150 million (35–50%)
150–180 million (50–60%) 43 18
Asia 500–700 million (35–50%)
600–800 million (45–60%) 77 45
Latin America and Caribbean
80–120 million (20–30%)
100–150 million (25–40%) 77 35
Table 4. Number and Proportion of Urban Dwellers Lacking Provision forWater and Sanitation in 2000
Source: WHO and UNICEF, Global Water Supply and Sanitation Assessment 2000 Report.

8
International experience shows that SSPWPs, in comparison with water utilities,can be more dynamic in filling the gap between supply and demand and havemore incentives to grow and expand their services (Box 3). Be they vendors,tanker truck operators, or managers of small-scale distribution networks, SSPWPsprovide a competitive and appropriate service to households that have no accessto utility connection.5 This is evident in Africa, Asia, and Latin America whereSSPWPs serve large urban populations. (See Paraguay example, Box 4.)
Profit orientation strengthens SSPWPs. Sustained and motivated by profits,SSPWPs may be longer lasting and more expansionary than cooperatives, NGOs,and other not-for-profit providers.
5 Findings of this research have been summarized in the following papers: Competition in Water and Sanitation:TheRole of Small Scale Entrepreneurs (Tova, Maria Solo, Private Sector Viewpoint, Note No. 165, December, 1998, TheWorld Bank); Independent Water and Sanitation Providers in African Cities: Full Report of a Ten-Country Study (BernardCollignon and Marc Vezina, 2000).
An estimated one third of the water connections made in the past 20 years in Asuncion andCiudad del Este have been provided by aguateros. (A typical aguateria system supplies a cluster ofhouses and consists of a well, a pump house, and heavy polyethylene hosing. The system is relativelyinexpensive and simple to install.) There are 350–600 independent aguaterias currently operating.Theyserve about half a million persons and represent an investment of some $30 million, at roughly $250/household.
Development is completely private. The aguatero makes the full investment and assumes allthe risks. The customer must pay a connection fee, which is in fact the aguatero’s principal incomefor amortizing the investment. The installations’ precarious nature and legal insecurity in the mediumterm means that the investment must have a short payback, generally within 3 years.Source: Torayno, Fernando.Small Scale Water Providers in Paraguay. Water and Sanitation Program, The WorldBank, Working Paper Series, January 1999.
Box 4. Small-Scale Water Providers in Paraguay
The operational efficiency of small private operators compares well with that of large utilities. Astudy of Haiti and four West African countries reported virtually no water losses among the privateoperators. It further showed the private firms to have an employee-client ratio of 1:500, one that anyutility company would envy. The study in Guatemala compared two private operators of aqueductand sanitation systems with the state water company. The study found that the investment costs ofthe two private operators per new customer were lower than the state utility’s—20% and 60%,respectively. The private firms’ operating costs were also lower, 72% and 77%, and administrativecosts again lower, 92% and 95%, respectively.Source: Tova, Maria Solo. December 1998. Competition in Water and Sanitation: The Role of Small ScaleEntrepreneurs. Private Sector Viewpoint Note No. 165. The World Bank.
Box 3. Competition in Water and Sanitation:Efficient Small-Scale Suppliers

Small Piped Water Networks: Helping Local Entrepreneurs to Invest
9
SSPWPs as defined by the researchFor the purpose of the SSPWP research, the project team defined “small-scaleprivate water provider” as having all of the following characteristics:
Small in scale. The provider’s infrastructure or installation is not city-wide andcovers only a single neighborhood or a part of it. The business has a staff of lessthan 100 and is, more often than not, owner-managed.
Independent. The provider does not receive any public subsidies or supportfrom NGOs.
Private. Capital investment comes from private sources. Providing water is themain livelihood of the people behind the venture. The business is not driven byexternal investors.
According to this characterization, community organizations and NGOs thatrely on volunteer work and receive financial aid from charities, other NGOs,and donor agencies are not considered SSPWPs.
How SSPWPs supply waterSSPWPs provide water by any of the following means: (i) having customers collectwater from the provider’s source, (ii) transporting water to customers’ homes, (iii)piping water to customers’ homes, and (iv) treating and selling water in bottles orbarrels.
Having customers collect water from the provider’s source. Customers areneighbors who collect water from the provider’s dug well, hand pump, or waterutility connection. Generally this enterprise requires only a small investment.Income from this is commensurately small and supplements other householdincome.
Transporting water to customers’ homes. From a point source, vendors transportwater by vehicle, ranging from a small pushcart to a large tanker truck. Customersprovide their own storage or containers. Carters can deliver relatively smallvolumes (20–200 liters) while trucks can distribute several cubic meters at atime. The required investment varies: from a few dollars for a cart to $10,000 for atanker truck.
Piping water to customers’ homes. Operators of such systems (also called“pioneers”) build and run small piped networks with individual connections tocustomers’ homes. The operators either produce the water themselves or buy itin bulk from the water utility. If customers cannot afford a piped connection,the operators can also supply water by hose. Small network operators invest largeamounts ($5,000–100,000) for fixed installations. Quality of service is high andmatches the expectations of urban users.
Treating and selling water in bottles or barrels. Operators sell potable bottledor barreled water in shops and markets and can also deliver directly to customers’homes. Such operators account for only a small quantity of water supplied to

10
users. Investment in this type of operation may range from $5,000 to $100,000,depending on the quality of raw water and the technology used to treat it.
SSPWP usersFor the purpose of the research, a user is considered to be served by an SSPWP ifhe or she hires or pays for SSPWP services on a regular basis at least during thedry season when other sources (utility or natural) cannot fill the daily waterneeds.
Many surveys have shown that water users, including low-income users, willreadily pay for
Convenience. Users do not have to travel long distances or waste time queuingfor water.Reliability. They are assured of continuous (uninterrupted) service or, if notcontinuous, on a regular basis (same time every day); this facilitateshousekeeping.Quantity. They are assured of enough water to cover their needs for dailyhouse chores.Quality. They are assured of “safe” drinking water and “clean” water forcooking, dishwashing, bathing, and laundry.Affordability. According to surveys, low-income families are willing to spendaround 3–5% of their income on water; they also prefer to pay in smallamounts (daily or every few days) and pay connection fees by installment.
Different types of SSPWPs satisfy these demand characteristics to varying degrees(Figure 2). Surveys further show that poorly served households prefer a houseconnection as their first choice, a private well as their second choice if conditionsallow, and a shared connection or community-based model as their third choicedepending on the type of management involved.6 These preferences usually exceedthe service available to them (Box 5).
In Cebu (Philippines), residents living in areas not served by the water utilityand who get water from vendors or standpipes stated in a survey7 their criteriafor satisfaction: accessibility (> 80%), quality (78%), and affordability (55%).This shows that even among the poor, the top criteria is not affordability but acompromise between accessibility and quality.
6 Survey in Phialat (Lao People’s Democratic Republic), AsiaUrbs Project, BURGEAP, 2001.7 The survey was undertaken by V. Verdeil in 2001 as part of a research thesis, Local Water Markets: Practices and
Territory of the Water Supply in Metro Cebu, March 2003.

Small Piped Water Networks: Helping Local Entrepreneurs to Invest
11
A field survey carried out during October–December 2001 covered about 2,900 households inrural areas with different water availability situations (high and low water table, coastal area, arsenicissues, etc.). Whatever the water and socioeconomic situations, there is a strong demand for pipedwater. Willingness to pay (WTP) is around taka (Tk)50 ($0.9)/month for public standpipes comparedwith Tk90 ($1.5)/month for domestic connections. For the initial capital cost the ratio is around thesame with a WTP of $16 for standpipe and $30 for domestic connection.
The estimated mean WTP of all households taken together exceeds the actual operation andmaintenance (O&M) costs of supplying piped water. Even the WTP of poor households is on averagemore than the O&M cost of piped water supply, both for public standpipes and domestic connection.Source: The World Bank’s Water and Sanitation Program, South Asia Region, Field Note, December 2002.
Box 5. Willingness to Pay for Safe Drinking Waterin Rural Bangladesh
Figure 2. Demand-Response Characteristics of SSPWP Types
Note: Representations in this Figure were prepared by the study team.
TYPE OF SERVICE Pushcart CRITERIA RESPONSE
Quantity Low volume per service (maximum = 200 liters)
Quality Depends on water source. Generally water quality deteriorates during transportation.
Reliability and Convenience
Service is provided at home, generally on request. 0
0.5
1Quantity
Quality
Affordability
Reliability
Affordability
Retail water is generally expensive, but actual amounts paid are low due to low quantity served at each time.
Standpipe
Quantity
People who fetch water from a point source or standpipe consume less water than those with a house connection (20–30 l/p/d compared to 50 l/p/d)
Quality Water from tap is usually safe. Contamination occurs during transport to house.
Reliability and Convenience
Point source can be located at some distance from home. Standpipes are not open all the time (8–12 hours/day) and users may have to queue. Area around tap is often muddy.
0
0.5
1Quantity
Quality
Affordability
Reliability
Affordability
Though cost of having a standpipe attendant inflates the volumetric cost of water, amounts paid remain low due to low volumes.
House Connection
Quantity Users consume as much water as they want if service is reliable.
Quality Quality will depend on the source and effectiveness of treatment.
Reliability/ Convenience
Service design ranges from 24 hours continuous to intermittent (but regular, depending on reliability of electricity supply).
0
0.5
1Quantity
Quality
Affordability
Reliability
Affordability
Connection fees range from $15 to $100. Tariffs are generally lower for people connected to a piped system than for those not connected.

12
Around 20% of residents in the selected cities (except Shanghai) regularlyget their water from SSPWPs either to (i) supplement unreliable water utilityservices or groundwater sources during the dry season, or (ii) cover all their
water needs.
Figure 3 shows how water utilities in the survey cities respond to the demandcharacteristics introduced in Figure 2. These significant differences in demand-response characteristics have resulted in a spread of SSPWP opportunities andresponses in the eight survey cities.
Scope and Scaleof SSPWPs in
Asian Cities
Figure 3. Demand-Response Characteristics of UtilitiesCITY
Delhi (similar for Dhaka and Kathmandu) CRITERIA RESPONSE
Quantity Low volume partly due to limited water resources.
Quality Water quality is variable due to intermittent supply.
Reliability and convenience
Only 1% of the population has access to 24-hour service and 70% of households get water for less than 4 hours per day regardless of their income level.
0
0.5
1Quantity
Quality
Affordability
Reliability
Affordability Water tariff is very low: $0.03/m3 and $2 for connection.
Ho Chi Minh City (similar for Jakarta and Cebu)
Quantity Households connected to network generally get the expected quantity of water.
Quality The water quality generally seems good but is at risk due to high levels of leakage
Reliability and convenience
Around 75% of customers have 24-hour water supply.
0
0.5
1Quantity
Quality
Affordability
Reliability
Affordability Water tariff: $0.11/m3 Average connection fee: $53
Shanghai
Quantity Households connected to network get the expected quantity of water.
Quality Water quality is generally good. Reliability and convenience
100% of customers have 24-hour water supply. 0
0.5
1Quantity
Quality
Affordability
Reliability
Affordability Water tariff: $0.12/m3 Average connection fee: $83, but has been cancelled recently.
Note: Ulaanbaatar was not included as its situation differs substantially from the other cities—all houses and apartmentsare connected to the network, and informal settlements are served by water kiosks (standpipe).
Table 5. Various Water Situations in the 8 Survey CitiesWater
Situation Cities Utility Coverage
Reliability of Service
Alternative Sources
Income vs. Service Cost Niche Market for SSPWP
1 Shanghai High High Low High No niche market except for bottled water
Delhi Medium Low High High Dhaka Medium Low High Medium 2
Kathmandu Medium Low High High
Competitive market to supplement the low service provided by water utility (WU)
Cebu Low High Medium Low Ho Chi Minh
City Low High Medium Low 3
Jakarta Low High Medium Low
Supplementary market for low- income HHs in areas served by WU Big market opportunities in areas not served by WU
4 Ulaanbaatar Low Low Low Low Low market opportunities in ger areas due to low accessibility to water resources
Small Piped Water Networks: Helping Local Entrepreneurs to Invest
13
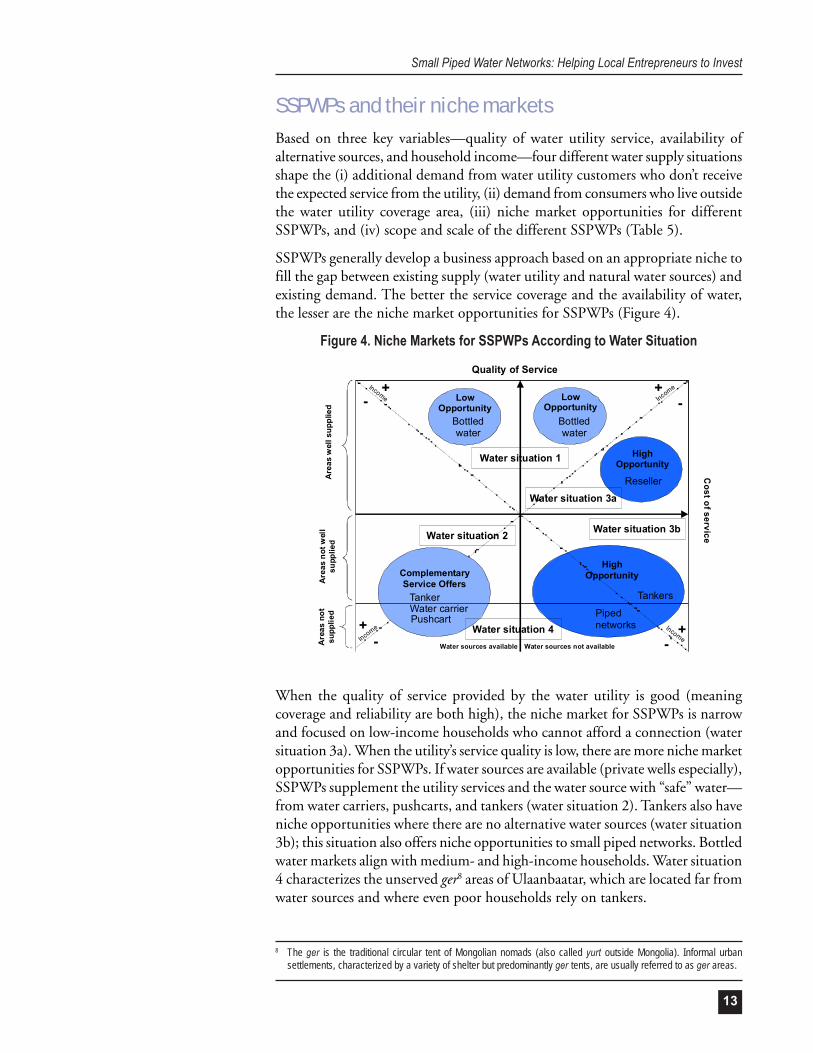
SSPWPs and their niche marketsBased on three key variables—quality of water utility service, availability ofalternative sources, and household income—four different water supply situationsshape the (i) additional demand from water utility customers who don’t receivethe expected service from the utility, (ii) demand from consumers who live outsidethe water utility coverage area, (iii) niche market opportunities for differentSSPWPs, and (iv) scope and scale of the different SSPWPs (Table 5).
SSPWPs generally develop a business approach based on an appropriate niche tofill the gap between existing supply (water utility and natural water sources) andexisting demand. The better the service coverage and the availability of water,the lesser are the niche market opportunities for SSPWPs (Figure 4).
When the quality of service provided by the water utility is good (meaningcoverage and reliability are both high), the niche market for SSPWPs is narrowand focused on low-income households who cannot afford a connection (watersituation 3a). When the utility’s service quality is low, there are more niche marketopportunities for SSPWPs. If water sources are available (private wells especially),SSPWPs supplement the utility services and the water source with “safe” water—from water carriers, pushcarts, and tankers (water situation 2). Tankers also haveniche opportunities where there are no alternative water sources (water situation3b); this situation also offers niche opportunities to small piped networks. Bottledwater markets align with medium- and high-income households. Water situation4 characterizes the unserved ger8 areas of Ulaanbaatar, which are located far fromwater sources and where even poor households rely on tankers.
8 The ger is the traditional circular tent of Mongolian nomads (also called yurt outside Mongolia). Informal urbansettlements, characterized by a variety of shelter but predominantly ger tents, are usually referred to as ger areas.
Figure 4. Niche Markets for SSPWPs According to Water Situation
Costofservice
Quality of Service
Are
asw
ells
uppl
ied
Are
asno
twel
lsu
pplie
dA
reas
not
supp
lied
Water sources available Water sources not available
IncomeIncome+
+ +
+
Income Income
--
--
LowOpportunity
LowOpportunity
Bottledwater
Water situation 3b
PushcartWater carrierTanker
ComplementaryService Offers
HighOpportunity
HighOpportunity
Bottledwater
Reseller
Pipednetworks
Tankers
Water situation 4
Water situation 2
Water situation 3a
Water situation 1
14
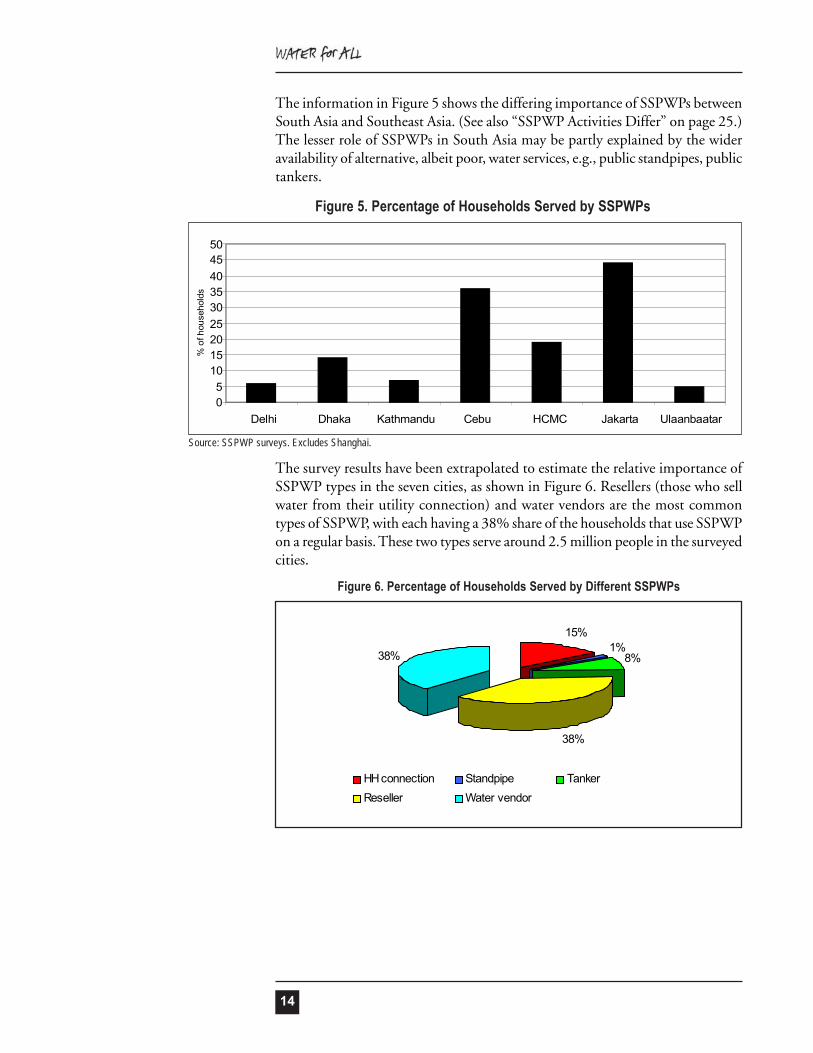
The information in Figure 5 shows the differing importance of SSPWPs betweenSouth Asia and Southeast Asia. (See also “SSPWP Activities Differ” on page 25.)The lesser role of SSPWPs in South Asia may be partly explained by the wideravailability of alternative, albeit poor, water services, e.g., public standpipes, publictankers.
15%1%
8%
38%
38%
HH connection Standpipe TankerReseller Water vendor
Figure 6. Percentage of Households Served by Different SSPWPs
The survey results have been extrapolated to estimate the relative importance ofSSPWP types in the seven cities, as shown in Figure 6. Resellers (those who sellwater from their utility connection) and water vendors are the most commontypes of SSPWP, with each having a 38% share of the households that use SSPWPon a regular basis. These two types serve around 2.5 million people in the surveyedcities.
Figure 5. Percentage of Households Served by SSPWPs
Source: SSPWP surveys. Excludes Shanghai.
05
101520253035404550
Delhi Dhaka Kathmandu Cebu HCMC Jakarta Ulaanbaatar
% o
f hou
seho
lds
Small Piped Water Networks: Helping Local Entrepreneurs to Invest
15
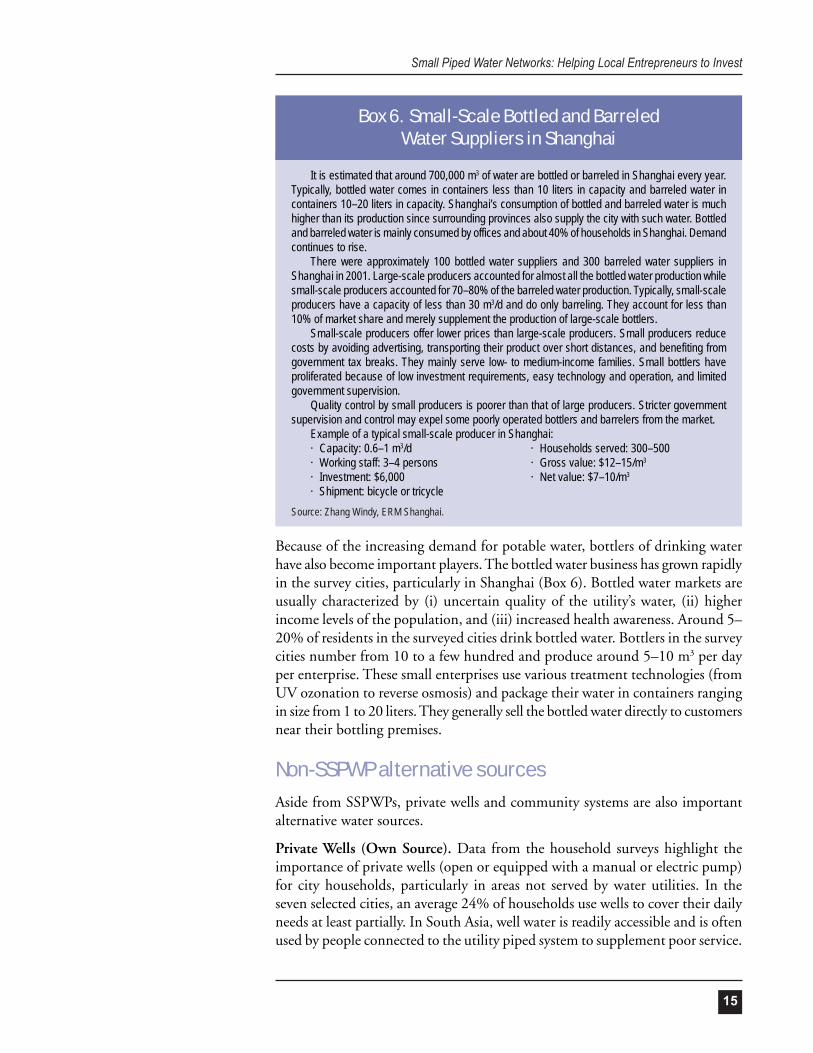
Because of the increasing demand for potable water, bottlers of drinking waterhave also become important players. The bottled water business has grown rapidlyin the survey cities, particularly in Shanghai (Box 6). Bottled water markets areusually characterized by (i) uncertain quality of the utility’s water, (ii) higherincome levels of the population, and (iii) increased health awareness. Around 5–20% of residents in the surveyed cities drink bottled water. Bottlers in the surveycities number from 10 to a few hundred and produce around 5–10 m3 per dayper enterprise. These small enterprises use various treatment technologies (fromUV ozonation to reverse osmosis) and package their water in containers rangingin size from 1 to 20 liters. They generally sell the bottled water directly to customersnear their bottling premises.
Non-SSPWP alternative sourcesAside from SSPWPs, private wells and community systems are also importantalternative water sources.
Private Wells (Own Source). Data from the household surveys highlight theimportance of private wells (open or equipped with a manual or electric pump)for city households, particularly in areas not served by water utilities. In theseven selected cities, an average 24% of households use wells to cover their dailyneeds at least partially. In South Asia, well water is readily accessible and is oftenused by people connected to the utility piped system to supplement poor service.
It is estimated that around 700,000 m3 of water are bottled or barreled in Shanghai every year.Typically, bottled water comes in containers less than 10 liters in capacity and barreled water incontainers 10–20 liters in capacity. Shanghai’s consumption of bottled and barreled water is muchhigher than its production since surrounding provinces also supply the city with such water. Bottledand barreled water is mainly consumed by offices and about 40% of households in Shanghai. Demandcontinues to rise.
There were approximately 100 bottled water suppliers and 300 barreled water suppliers inShanghai in 2001. Large-scale producers accounted for almost all the bottled water production whilesmall-scale producers accounted for 70–80% of the barreled water production. Typically, small-scaleproducers have a capacity of less than 30 m3/d and do only barreling. They account for less than10% of market share and merely supplement the production of large-scale bottlers.
Small-scale producers offer lower prices than large-scale producers. Small producers reducecosts by avoiding advertising, transporting their product over short distances, and benefiting fromgovernment tax breaks. They mainly serve low- to medium-income families. Small bottlers haveproliferated because of low investment requirements, easy technology and operation, and limitedgovernment supervision.
Quality control by small producers is poorer than that of large producers. Stricter governmentsupervision and control may expel some poorly operated bottlers and barrelers from the market.
Example of a typical small-scale producer in Shanghai:· Capacity: 0.6–1 m3/d · Households served: 300–500· Working staff: 3–4 persons · Gross value: $12–15/m3
· Investment: $6,000 · Net value: $7–10/m3
· Shipment: bicycle or tricycleSource: Zhang Windy, ERM Shanghai.
Box 6. Small-Scale Bottled and BarreledWater Suppliers in Shanghai

16
In Southeast Asia, wells are used mainly by people living in areas not served bywater utilities.
Community Systems. People in the survey cities also get their water fromcommunity systems: 55% of Dhaka residents access systems developed by NGOsand communities, 15% of Cebu’s population get their water from systems builtby community organizations, and 22% of Kathmandu’s inhabitants fetch waterfrom traditional stone spouts.
In Dhaka, NGOs have developed water supply projects aimed at providing betterservice in low-income informal settlements which make up around 30% ofDhaka’s population. These settlements fall under the jurisdiction of the DhakaWater Supply and Sewerage Authority (DWASA) which has a strict policy onwater connections: it only provides connections to applicants on presentation ofa “holding number” confirming landownership. Since most slum dwellers aresquatters on government land, they cannot fulfill this requirement and are forcedto rely mainly on illegal connections established by those who control slumhousing. The NGO initiative involved negotiating with the Dhaka CityCorporation (DCC) to obtain permission for road cutting and situating waterpoints on DCC land. Under the project design, NGOs are the formal customersof the water utility and generally implement extensions from the main pipe systemto the slum areas where they provide water through specific water points.9 Theresponsibility for running the services is delegated to a community associationwho has to pay the DWASA water bills and reimburse the NGOs the cost ofsetting up the water points (around $750 each). The water tariff to cover chargesis around $0.46/m3, while the official DWASA rate is $0.13/m3. So far, NGOshave helped set up some 150 water points serving 17,500 families, or 110,000people. For low-income areas too far for the DWSA network to reach, NGOshave implemented boreholes equipped with hand pumps.
In Kathmandu, the traditional urban water supply system of dhunge dharas is theprimary alternative to the municipal piped supply. The spouts provide an essentialsource of water for the city’s middle- and low-income residents. The existence ofthis readily accessible public supply alters the dynamics of a water-scarce city,changing it from an environment of drastic inequality to one of varied access forall. Depending on where they live in the city, people spend up to 45 minuteswalking to the nearest dhunge dharas, often waiting in line for 6 or more hours.Water for the most part is free but the community may charge small fees for thespouts’ maintenance and improvement. However, the lack of effective institutionsand resources to undertake this threatens the spouts’ sustainability.
9 Comprising a 3 m3 underground tank with two suction hand pumps on top, and with separate bathing and washingplatforms.

Small Piped Water Networks: Helping Local Entrepreneurs to Invest
17
SSPWP activities differThere are marked differences in the level of SSPWP activity between South Asiaand Southeast Asia, as well as between cities and among neighborhoods adequatelyserved and underserved/unserved by water utilities.
Between South Asia and Southeast Asia. In South Asia SSPWPs play a relativelyminor role (5–15%). In Delhi, Dhaka, and Kathmandu, SSPWPs co-existalongside utilities which provide irregular water at low pressure. They also haveto compete with alternative sources like utility standpipes and tankers (Delhi),open wells, tube wells with hand pumps, and community standpipes (Dhaka),or traditional stone waterspouts (Kathmandu).
People in these cities develop coping strategies between the different alternativesand diversify their water sources, shifting between suppliers depending on thetime of year, cost, reliability, and water quality and quantity to fill their dailyneeds. Table 6 and Figure 7 show the coping strategies in Kathmandu.
Table 6. Water Dynamics in KathmanduSource Available Household
Income NWSC Tanker Private Well Community Well Dhunge Dharaa
High X X X Rare Rare
High middle X X X Rare Rare
Middle X X X Rare X
Low middle X X X X X
Low X Rare X X
a Public waterspout.Source: Yarror Moench, 2001–ISET/NWCF.
Figure 7. Water Supplies Used in Dry Season in Kathmandu
0
10
20
30
40
50
60
70
80
NWSC HHconnection
NWSCstandpipe
NWSC tanker Neighbors'connection
Private tanker Communitysystem
Well
% o
f hou
seho
lds
HH = household, NWSC = Nepal Water Supply Corporation.Source: Household survey under ADB SSPWP study, K. K. Jha, October 2002.
18
Unlike in South Asia, SSPWPs are vitally important in Southeast Asia, serving20–45% of city populations. In Cebu, Ho Chi Minh City, and Jakarta, SSPWPsserve two niche markets: (i) areas where utility coverage is lower than 50%, and(ii) communities where low-income families do not connect to the water utilitydue to perceived high connection fees or monthly billing schedules not suited totheir daily income structure.
A household in a Southeast Asian city will use fewer coping options than acounterpart in South Asia. This is because water supply from utilities in SoutheastAsia is relatively more reliable and there are fewer standpipes. But the problem inSoutheast Asian cities is that millions have no access at all to water utilities.
SSPWPs in Ulaanbaatar only play a minor role even in ger areas where the utilityonly provides standpipes and not house connections. This is mostly due to thedifficult access to water sources and the very cold climate, which poses technicaland management challenges for piped systems.
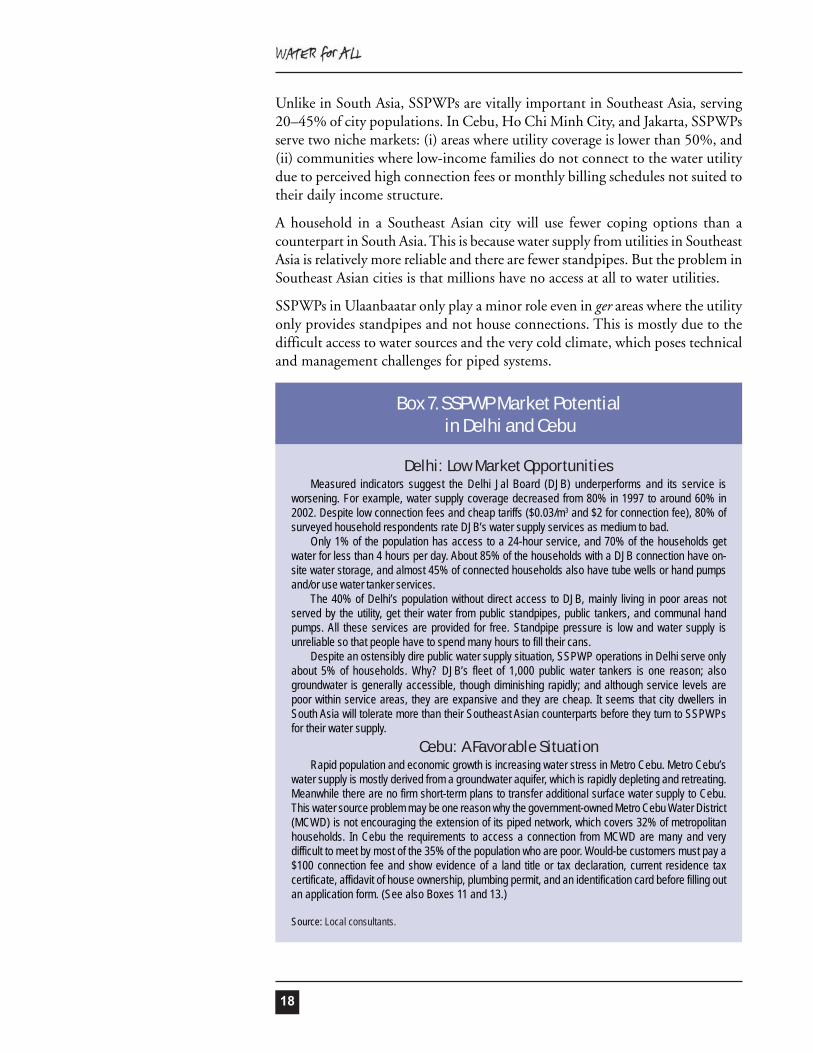
Delhi: Low Market OpportunitiesMeasured indicators suggest the Delhi Jal Board (DJB) underperforms and its service is
worsening. For example, water supply coverage decreased from 80% in 1997 to around 60% in2002. Despite low connection fees and cheap tariffs ($0.03/m3 and $2 for connection fee), 80% ofsurveyed household respondents rate DJB’s water supply services as medium to bad.
Only 1% of the population has access to a 24-hour service, and 70% of the households getwater for less than 4 hours per day. About 85% of the households with a DJB connection have on-site water storage, and almost 45% of connected households also have tube wells or hand pumpsand/or use water tanker services.
The 40% of Delhi’s population without direct access to DJB, mainly living in poor areas notserved by the utility, get their water from public standpipes, public tankers, and communal handpumps. All these services are provided for free. Standpipe pressure is low and water supply isunreliable so that people have to spend many hours to fill their cans.
Despite an ostensibly dire public water supply situation, SSPWP operations in Delhi serve onlyabout 5% of households. Why? DJB’s fleet of 1,000 public water tankers is one reason; alsogroundwater is generally accessible, though diminishing rapidly; and although service levels arepoor within service areas, they are expansive and they are cheap. It seems that city dwellers inSouth Asia will tolerate more than their Southeast Asian counterparts before they turn to SSPWPsfor their water supply.
Cebu: A Favorable SituationRapid population and economic growth is increasing water stress in Metro Cebu. Metro Cebu’s
water supply is mostly derived from a groundwater aquifer, which is rapidly depleting and retreating.Meanwhile there are no firm short-term plans to transfer additional surface water supply to Cebu.This water source problem may be one reason why the government-owned Metro Cebu Water District(MCWD) is not encouraging the extension of its piped network, which covers 32% of metropolitanhouseholds. In Cebu the requirements to access a connection from MCWD are many and verydifficult to meet by most of the 35% of the population who are poor. Would-be customers must pay a$100 connection fee and show evidence of a land title or tax declaration, current residence taxcertificate, affidavit of house ownership, plumbing permit, and an identification card before filling outan application form. (See also Boxes 11 and 13.)
Source: Local consultants.
Box 7. SSPWP Market Potential in Delhi and Cebu

Small Piped Water Networks: Helping Local Entrepreneurs to Invest
19
SSPWPs seek and serve niche markets, as illustrated earlier in Figure 4. Whereutility service is good and cheap or where there are alternative water sources, theniche market for SSPWPs is small. The scope for SSPWP involvement becomesgreater when the utility’s service is poor or relatively expensive in an environmentwith limited alternative sources. The different water situations in Delhi and Cebuhave a strong impact on SSPWP market share (Box 7).
Figure 9. SSPWP Services in the Survey Cities (within and outside utility service areas)
HH = household, HCMC = Ho Chi Minh CityNote: Total SSPWP market shares vary from city to city, e.g., 36% in Cebu,6% in Delhi, and 3% in Ulaanbaatar.
Between Cities and Among Neighborhoods. The type and scope of services alsodiffer between and within cities in the same region (Figure 8). Based on thehousehold surveys, a distinction can be made between (i) services provided withinareas served by water utilities and (ii) services provided outside these areas. Thedistinction contributes at least partially to the different patterns of SSPWP servicesin the survey cities (Figure 9).
HH connection Standpipe TankerReseller Water vendor
0
20
40
60
80
100
Dehli
Dhaka
Kathman
duCeb
uHCMC
Jaka
rta
Ulaanba
atarSh
are
ofSS
PWP
Mar
ket
%
Figure 8. Different Water Sources Used at City Level
0
20
40
60
80
100
Delhi
Dhaka
Kathman
duCeb
uHCMC
Jaka
rta
Ulaanb
aatar
Shangh
ai
Water Utility Own Source Others SSPWP
% o
f HH
s us
ing
serv
ice
HCMC = Ho Chi Minh City
20
Within areas served by water utilities, the scope of the SSPWPs varies with thelevel of utility services. In South Asia, where utility service areas are large butservices are unreliable, water vendors and tankers are the main private providersbut they compete with alternative sources that are often free. Users opt for quickaccess to additional water to supplement the unreliable utility services.
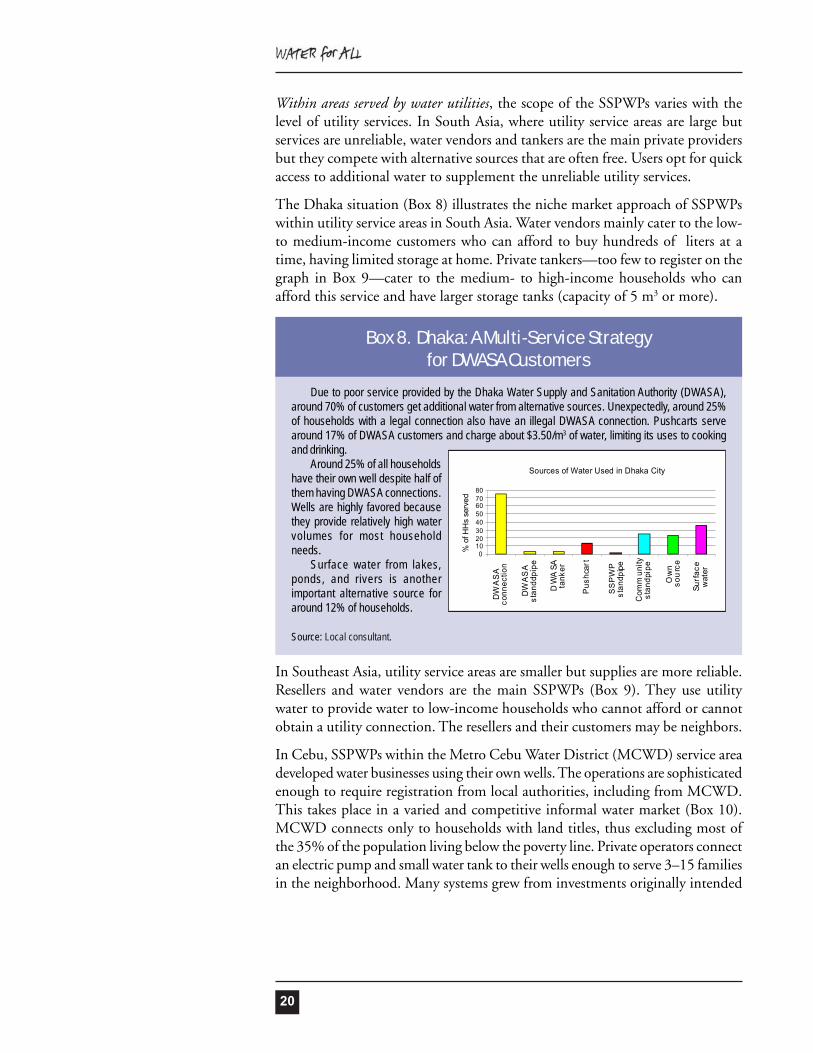
The Dhaka situation (Box 8) illustrates the niche market approach of SSPWPswithin utility service areas in South Asia. Water vendors mainly cater to the low-to medium-income customers who can afford to buy hundreds of liters at atime, having limited storage at home. Private tankers—too few to register on thegraph in Box 9—cater to the medium- to high-income households who canafford this service and have larger storage tanks (capacity of 5 m3 or more).
In Southeast Asia, utility service areas are smaller but supplies are more reliable.Resellers and water vendors are the main SSPWPs (Box 9). They use utilitywater to provide water to low-income households who cannot afford or cannotobtain a utility connection. The resellers and their customers may be neighbors.
In Cebu, SSPWPs within the Metro Cebu Water District (MCWD) service areadeveloped water businesses using their own wells. The operations are sophisticatedenough to require registration from local authorities, including from MCWD.This takes place in a varied and competitive informal water market (Box 10).MCWD connects only to households with land titles, thus excluding most ofthe 35% of the population living below the poverty line. Private operators connectan electric pump and small water tank to their wells enough to serve 3–15 familiesin the neighborhood. Many systems grew from investments originally intended
Due to poor service provided by the Dhaka Water Supply and Sanitation Authority (DWASA),around 70% of customers get additional water from alternative sources. Unexpectedly, around 25%of households with a legal connection also have an illegal DWASA connection. Pushcarts servearound 17% of DWASA customers and charge about $3.50/m3 of water, limiting its uses to cookingand drinking.
Around 25% of all householdshave their own well despite half ofthem having DWASA connections.Wells are highly favored becausethey provide relatively high watervolumes for most householdneeds.
Surface water from lakes,ponds, and rivers is anotherimportant alternative source foraround 12% of households.
Source: Local consultant.
Box 8. Dhaka: A Multi-Service Strategyfor DWASA Customers
Sources of Water Used in Dhaka City
01020304050607080
DW
AS
Aco
nnec
tion
DW
AS
Ast
andd
pipe
DW
ASA
tank
er
Pus
hcar
t
stan
dpip
e
Com
mun
ityst
andp
ipe
Ow
nso
urc
e
Surf
ace
wat
er
SS
PW
P
% o
f HH
s se
rved

Small Piped Water Networks: Helping Local Entrepreneurs to Invest
21
Around 12% of urban residents get their water from resellers. Customers are predominantlymedium low-income households (70%) who either cannot afford the connection fee or do not haveaccess to the piped system.
Resellers serve 3–5 neighbors through a secondary meter (locally made at $5–10). They arebilled according to the quantity of water used.The average quantity of water bought by the reseller’scustomers is around half the average consumption of utility customers (17.5 m3/month comparedwith 36 m3/month). The water tariff paid to the resellers is between $0.13 and $0.5/m3. Averaging$0.25/m3, this is around twice the utility’s social tariff of $0.11/m3. Ho Chi Minh Water Supply Company(HCMWSC) has developed the following block tariff system based on consumption per capita:
Consumption/month/capita Tariff/m3
< 4 m3 $0.114–6 m3 $0.176–10 m3 $0.21> 10 m3 $0.27
The utility’s block tariff system affects the reseller’s tariff, depending on the quantity of waterresold. With an average consumption of 36 m3 and 5 persons/household for those connected toHCMWSC, the consumption per capita is around 7.2 m3/month at a monthly unit tariff of $0.21/m3. Ifthis customer resells water to 3 neighbors who have a monthly consumption of around 17 m3, thetotal monthly consumption is 87 m3 corresponding to 17 m3/capita/month. Thus, the water tariff is$0.27/m3. Even with a small margin of a few cents per cubic meter, the water tariff for resellers’customers will be three times more than the social tariff.
Source: Local consultant.
Box 9. Resellers in Ho Chi Minh City
Barangay Labangon, a community of 5,500 households, is located in an areaserved by the Metro Cebu Water District (MCWD). Because of connection constraints(household too far from pipe, land title issues, etc.), many private and communitysystems have been developed and compete against each other. Households in thebarangay can freely choose from among various types of water sources: householdconnection, standpipe (private or communal), and reseller.
• 4 SSPWPs provide household connectionsservicing from 3–16 households each;
• 14 SSPWPs each serve 5–30 householdsthrough private taps;
• 21 resellers each serve 3–30 householdsthrough taps; and
• 4 communal standpipes each serve between35–45 households.
Altogether they serve around 20% of thehouseholds in the barangay.
Box 10. Merry Mix of Water Suppliers and Sources for Cebu Community
Source: Survey by University of San Carlos (Cebu), December 2002.

22
to improve only the well owner’s water supply. Generally, the operator does notcharge a connection fee. Customers pay for plumbing services, water meter, andgalvanized iron piping from their house to the operator’s house. The averagetotal cost of the materials is approximately $60. Customers pay their bills weeklyor monthly.
Outside areas served by water utilities, tankers and water vendors are the mostcommon private providers. Tankers serve mainly high-income households(example in Kathmandu, Box 11). In South Asia, water vendors get their waterfrom free sources (standpipes, traditional waterspouts, or tube wells). In SoutheastAsia, many water vendors get their water from standpipes managed by waterutilities and pay for the water they fetch. Tankers generally get their water froma natural water source (spring or river).
The field surveys revealed the emergence of local private entrepreneurs developingsmall piped networks outside utility service areas. SSPWPs build and finance thenetworks themselves and provide direct connections to households. They aremost active in Cebu (Box 12), Delhi, Dhaka and Ho Chi Minh City, and serveapproximately 750,000–1 million people in the survey cities. The approaches ofthese private operators are different in each city and are summarized in Table 7.
Municipal supply has increasingly struggled to meet the water needs of this city. Becauseresidents have become accustomed to house connection, private tankers have moved in to providedoor-to-door water delivery especially when supply from the water utility is low. The tankers mainlyserve institutions and high-income households due to their relatively high-priced water ($1.30/m3
compared with $0.08/m3 from the piped system) and the need for large capacity storage on the partof customers. Their clientele is broken down as follows: industries (33%), residences (24%), mineralwater plants (13%), hotels/restaurants (11%), hospitals and schools (10%), and offices (9%).
There are at present 35 private tanker operators with 65 tanker trucks doing business in theKathmandu valley. They supply around 775,000 m3/year, representing a $1 million turnover at about10% profit. Medium- and low-income households with little storage capacity are served by smallertankers (5 m3). All tanker operators came from the transport sector. As tankers, none of them isregistered with the government and thus not subject to price or quality regulations. The leadingcompanies among them have organized themselves into a tankers’ association and establishedwater quality standards for the private market but some customers still doubt the quality of theirwater because of their poor hygiene practices.Source: Kishore Kumar Jha (Multidisciplinary Consultants Ltd.).
Box 11. Kathmandu: Private Tankers ServeIndustries and High-Income Households

Small Piped Water Networks: Helping Local Entrepreneurs to Invest
23
Fernando Miñoza, an engineer and entrepreneur with diverse local business interests, developeda small-scale water system in Barangay Barayan. The system started to operate in July 2002.
The owner built the system in response to requests from his employees and their immediateneighbors to provide water to their households. The design of the distribution network and technicalstandards are similar to those implemented by the Metro Cebu Water District (MCWD) in low-incomeareas. A 15-m high water reservoir with a capacity of 20 m3 serves 24 hrs/day water through a maindistribution line (a 2-inch, 400-m long galvanized iron pipe). This line is equipped with a series of 1-inch stub-outs to which 1/2-inch metered pipelines are connected. Mr. Minoza obtained the necessarypermits from the barangay (community), a business permit from the city, and a license from theNational Water Resources Board.
In the beginning, the operator encountered problems with some lot owners who refused to granthim right-of-way for the distribution pipes. However, the users themselves managed to convince thelot owners to allow the installation of pipelines at no cost on condition that these be installedunderground or only in designated areas.
The owner invested $6,000 to set up the system, inclusive of a water tank. Seventy customerswere using the system after a few months. Now, three sitios in Bacayan are served by this system.
Responding to demand, Mr Minoza plans to build another reservoir at Upper Bacayan, and, inthe near future, build another system in Pulangbato, a barangay approximately 3 kilometers fromBacayan that is not within the coverage area of MCWD.
The water tariff is $0.75/m3, and the customer is responsible for making the house connection.The customer can either purchase the needed materials (e.g., pipe, meter) from any hardware store,or from the hardware store owned by the operator himself. On average, the total cost of materials isestimated to be $60. The operator does not require any legal or administrative documentation.
Four part-time caretakers oversee the day-to-day operation of the system each servicingapproximately 17 clients. The operator believes that, at the moment, the current setup is adequate.
Monthly bills are sent to households who are required to make their payments at the office of theoperator, which is located nearby. Those who cannot settle their accounts on time are given a 2-month grace period, after which they are disconnected. But this has never happened.
Randomly-selected consumers, who were asked to comment on the services provided by theoperator, all expressed satisfaction. They said that before the system was in place, they had toqueue to fetch water from nearby public wells, which was inconvenient and time-consuming.
Customers perceived the operator’s tariff to be higher than that of the utility but said that this issomething that they would have to live with in the absence of an efficient and adequate water supplysystem. Nevertheless, they said that they hoped the operator would make an effort to make thewater safe and palatable.Source: Survey done under the direction of Fiscalino Amadora Nolasco, University of San Carlos (Cebu), 2002.
Box 12. Cebu Piped Network Operator FillsUrban Villagers’ Water Needs
Table 7. Main Characteristics of Small Piped NetworksCity Status Water Source Level of Service
Provided Water
Quality Average No.
of HHs Served
Approx. No. of Networks in the City
Cebu Legal Groundwater - HH connection 24 hrs/day - Hose connection 3–4
days/week
Untreated 75–100 5
Delhi Illegal Groundwater - HH connection 1–1.5 hrs/day
Untreated 50–700 > 100
Dhaka Illegal DWASA (illegal connection)
- Standpipe (99%) - HH connection (1%)
Untreated 9,000 1
Ho Chi Minh City
Legal Groundwater - HH connection 24 hrs/day
Treated 100–500 > 20
DWASA = Dhaka Water Supply and Sanitation Authority, HH = household

24
The study’s surveys show a correlation between SSPWP niche operations andthe city or neighborhood’s utility service and water sources. In areas where thecost of services provided by the water utility is affordable and/or alternative sourcesare readily available, water vendors and tanker trucks are not present. Relativelywell-off households buy bottled water even when the distribution networkprovides adequate coverage at a reasonable price. In cities where the cost of utilityservice is high and alternative water sources are not readily available, water vendors,resellers, and piped system operators compete with or supplement the water utility.Figure 10 slots the eight survey cities into the model introduced in Figure 4.
Figure 10. SSPWP Niche Markets in the 8 Cities
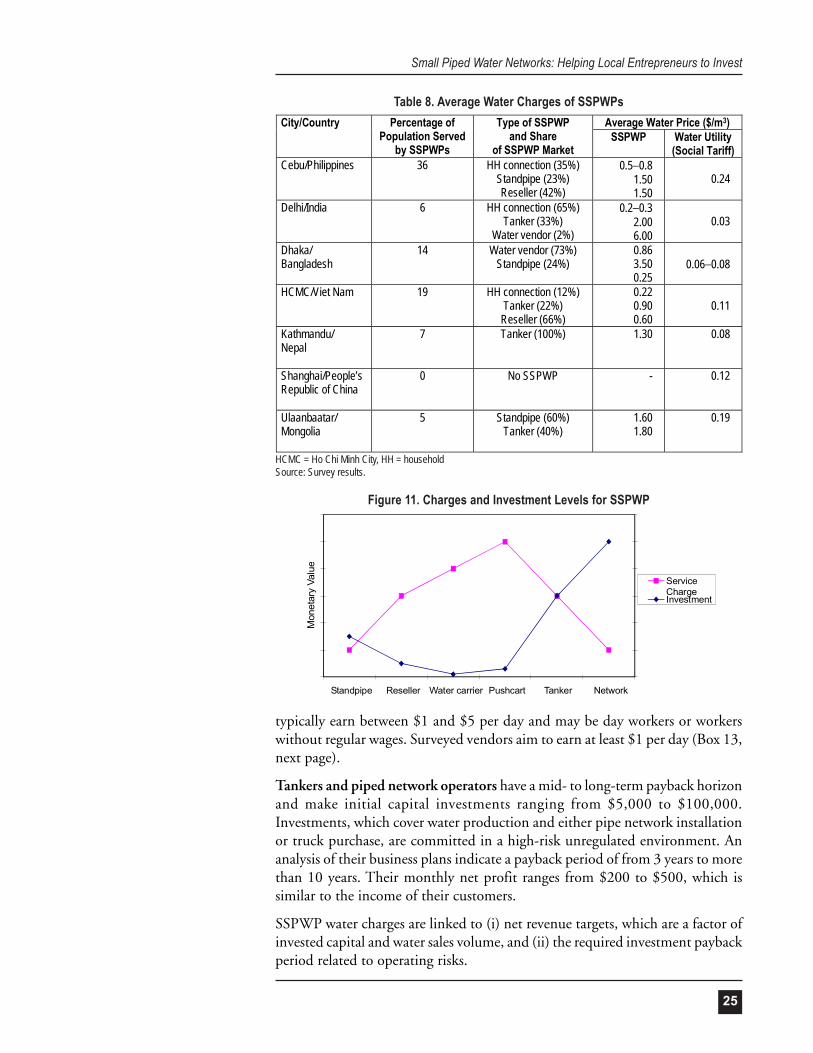
User charges by SSPWP typeSSPWP water user charges vary widely in the survey cities. However, surveyresults show that this does not indicate profiteering or exploitation on the part ofthe SSPWPs. SSPWP charges are typically higher than the social tariffs chargedby the water utility, which is to be expected given that utilities subsidize theirsocial tariffs with revenues from customers paying higher block tariffs (Table 8).Vendors (pushcart or water carrier) and tankers generally charge the most, duepartly to the small volume of water supplied. SSPWPs who have a more efficientratio of investment to volume of water sold charge less (Figure 11). Piped networkoperators, who have the highest level of investment, also supply the highestvolumes of water.
Vendors and resellers operate with short-term investment horizons, hence theirinvestments are small (< $150) and their payback periods short (< 3 months),which is based on daily payments from low-income customers. Their customers
HCMCJakarta
Cebu
DelhiKathmandu
Dhaka
Costofservice
Quality of ServiceAr
eas
wel
lsup
plie
dAr
eas
notw
ell
supp
lied
Are
asno
tsu
pplie
d
Water sources available Water sources not available
IncomeIncome+
+ +
+
Income Income
--
--
Shanghai
Ulaan-baatar
Bottled water
Water vendorsResellers
Piped networks
TankersWater vendors
HCMC = Ho Chi Minh City
Small Piped Water Networks: Helping Local Entrepreneurs to Invest
25
typically earn between $1 and $5 per day and may be day workers or workerswithout regular wages. Surveyed vendors aim to earn at least $1 per day (Box 13,next page).
Tankers and piped network operators have a mid- to long-term payback horizonand make initial capital investments ranging from $5,000 to $100,000.Investments, which cover water production and either pipe network installationor truck purchase, are committed in a high-risk unregulated environment. Ananalysis of their business plans indicate a payback period of from 3 years to morethan 10 years. Their monthly net profit ranges from $200 to $500, which issimilar to the income of their customers.
SSPWP water charges are linked to (i) net revenue targets, which are a factor ofinvested capital and water sales volume, and (ii) the required investment paybackperiod related to operating risks.
Table 8. Average Water Charges of SSPWPsAverage Water Price ($/m3) City/Country Percentage of
Population Served by SSPWPs
Type of SSPWP and Share
of SSPWP Market SSPWP Water Utility
(Social Tariff) Cebu/Philippines 36 HH connection (35%)
Standpipe (23%) Reseller (42%)
0.5–0.8 1.50 1.50
0.24
Delhi/India 6 HH connection (65%) Tanker (33%)
Water vendor (2%)
0.2–0.3 2.00 6.00
0.03
Dhaka/ Bangladesh
14 Water vendor (73%) Standpipe (24%)
0.86 3.50 0.25
0.06–0.08
HCMC/Viet Nam 19 HH connection (12%) Tanker (22%) Reseller (66%)
0.22 0.90 0.60
0.11
Kathmandu/ Nepal
7 Tanker (100%) 1.30 0.08
Shanghai/People’s Republic of China
0 No SSPWP - 0.12
Ulaanbaatar/ Mongolia
5 Standpipe (60%) Tanker (40%)
1.60 1.80
0.19
HCMC = Ho Chi Minh City, HH = householdSource: Survey results.
Standpipe Reseller Water carrier Pushcart Tanker Network
ServiceChargeInvestment
Mon
etar
y Va
lue
Figure 11. Charges and Investment Levels for SSPWP

26
Network operators offer a better service at a lower price than vendors and resellers,but at a higher price than utilities. SSPWP (all types) water supply charges rangefrom $0.2 to $3.5/m3 whereas water charges of small piped networks in thesurvey cities range from $0.2 to $0.8/m3. SSPWPs’ charges in Ho Chi MinhCity (Figure 12) are significantly lower than in other cities.
(Box 14)with table info
A pushcart operation is generally a family business engaging three to four family members.Since the water pressure at the standpipe is generally high only at night, one member from eachprovider’s family works all through the night to fill water, and in the morning another takes over.Other family members transport water to the client households. Water is also filled during the daybut filling is slow due to low water pressure. Pushcarts charge $5–6 equivalent per cubic meter. Onthe face of it, this is expensive water compared with the “free” water from the public standpipe. Butonly small quantities of water are involved—1–2 m3 per day per pushcart—and participants in thefamily pushcart business may earn only $1–3 for each 10-hour plus working day.
Box 13. Operational Details of Pushcart Providers in Delhi
Figure 12. Average SSPWP Water Charges in Ho Chi Minh City
0.5
0.6
0.9
0.220.11
00.10.20.30.40.50.60.70.80.9
1
Pushcart Reseller Tanker Network Water Utility
Wat
er ta
riff (
in $
/m)3
a 4 hours in the morning and 4 hours in the evening.b Depends on the transport distance.c These are generally family enterprises engaging at least three members of a family.Source: Usha Raghupathi, National Institute of Urban Affairs.
1st Provider 2nd Provider 3rd Provider Area Okhla Vihar Batlahouse Ext. A.F. Enclave Size of settlement (no. of HHs) 800–1,000 1,500– 2,000 2,000–2,500 Age of settlement 18 years 15 years 18 years Provider living in the locality or not No, living nearby Yes Yes Since when providing service Last 10 years Last 2 years Last 6 years No. of clients (HHs) 40 30 50–60 Source of water Standpipe Standpipe Standpipe Hours of water availability at source/day 8 hoursa 8 hoursa 10 hours Provider's hours of work/day 12–14 hours 8–10 hours 12–14 hours Quantity of water delivered/day 1,600 to 1,800 liters 1,200 to 1,500 liters About 2,000 liters Chargesb (for 25–40-liter can) $ 0.17–20/day $ 0.12 to 0.17/day $ 0.12 to 0.2/day Type of vehicle used Tricycle Tricycle Tricycle Investment $30 $30 $30 Source of funds Own funds Loan Own funds
Average monthly earnings $ 200–300c (< $100/pers) $100–200 $200–300

Small Piped Water Networks: Helping Local Entrepreneurs to Invest
27
Households seek out water supplies that match price and service levelpreferences. Theoretically, piped supplies from the city water utility shouldoffer the best fit: except that many Asian water utilities fail in their core
business—they do not offer a good quality piped supply, especially to the poor,at any price. Small privately operated piped networks fill the gap created by thefailure of city water utilities. Entrepreneurs who own and operate piped networksmimic the water utility business in terms of cost and quality of service. Theyoffer a household connection with similar or more hours of service provided bythe utility.
These operators have proven to be efficient, effective and responsive. They areefficient in managing their operations, indicated for example by extremely littlenon-revenue water. As “locals” they tend to reach low-income families whereasutilities can’t or won’t. The poor and disadvantaged perceive a lower risk in dealingwith the private operator’s local “line manager” than with the utility’sadministrator. Small network operators are more sensitive than utilities are tothe faint demand signals coming from low-income households. And theseoperators are quick acting entrepreneurs. They quickly apply their own resourcesto a business opportunity, including in low-income neighborhoods.
Network operators are the focus of the case studies in this publication becausefield surveys highlighted their emerging significance and potential to benefit thepoor. Small network operators invest more and conduct business markedlydifferent from vendors and resellers. Table 9 summarizes the water market situationsfor network operators in Delhi, Dhaka, Ho Chi Minh City, Cebu, and Metro Manila.Table 10 (next page) summarizes their operational characteristics.
A Closer Look atSmall Piped
Water Networks
How networks get startedSmall network businesses start either as neighborhood self-help schemes or ascommercial businesses.
Neighborhood self-help. A household improves its own on-site supply (usuallyby installing a well pump or pumped tube well) and is approached by neighborsto “share” some of the water with them, either by hose or piped connection
Table 9. Water Market Situations for Small Network Operators Legal
Status Status with
Local Authorities Water Source Area Served No. of
Networks Average No.
of HHs Served Delhi Illegal None Groundwater Unauthorized colonies > 100 50–700 Dhaka Illegal None Water from utility
network (illegally)
Slum area 1 9,000
Cebu Legal Yes (taxes) Groundwater Low-income areas within or outside the utility supply area
> 10 15–100
Ho Chi Minh City
Legal Yes (taxes) Groundwater Urban and peri-urban areas
> 20 100–500
Manila Illegal Yes (taxes) Groundwater or from water utility
Low-income areas (slums)
? Inpart Engineering 35,000

28
(Delhi, Cebu). The water source owner agrees, initially in order to preserve socialharmony. Eventually, supplier-customer transactions are structured on a cost-sharing basis that may factor in a small profit for the supplier. Neighbors interestedin getting service pay all the connection costs. Consumed water is paid for eitherat a set price (Delhi, Cebu) or a metered price (Cebu). Depending on watervolume available from the source, financial capacity of the owner, and his or herstanding with the local authority, the network is usually limited to a fewcustomers—15–20 as in Cebu (Box 14), and 50 as in Delhi.
Commercial business. An entrepreneur develops a water distribution networkin an assessed market area. The water source is usually a pumped dug well ortube well. From the outset, the operator offers neighbors connections based on aschedule of connection costs, water price, payment method—either a set paymentor payment by volume—and billing periods (Dhaka, Cebu, Ho Chi Minh City,Manila). The size of networks and the number of their customers vary considerably(from 50 in Cebu to several thousands in Manila). The operator takes apredominantly commercial approach, including maximizing market share andachieving a reasonable level of profitability.
Table 10. Main Characteristics of Service Provided
In 1999, Virgie Zafra installed a standpipe at her home for personal use. Soon her immediateneighbors were asking to fetch water from her pipe which eventually made her decide to sell water.After getting clearance from the barangay, authorization from the water utility, and a business permitfrom the City, she started selling water from a tap to approximately 20 households at about $1.6/m3.Virgie spent $2,000 to set up her system, inclusive of a water tank (< 2m3). She was able to raise theinvestment money partly from the earnings of her husband, an overseas contract worker.
But the business did cost Virgie her home privacy each time customers came to fetch waterfrom the pipe. In 2001, she decided to offer household connections instead. Soon she was servicing16 household connections. Virgie does not charge her customers a connection fee, only the cost ofplumbing services and materials such as iron pipes and water meter. On average, total cost ofmaterials was about $60 and water tariff was $0.5/m3 in 2002. Her system distributes an estimated 7 m3
per day (200 m3/month) and earns a monthly gross profit of about $26 before debt amortization.Virgie herself sees to the system’s day-to-day operation. She relies on a neighbor, an experienced
plumber, when technical problems arise. She does the collection herself, on a pre-agreed date.
Box 14. Example of a Cebu Provider:from Standpipe to Household Connections
City Level of Service
Hours of Service Water Quality Connection Fee Water Tariff Billing
Delhi House connection
1–2 hrs/day Groundwater No treatment
$30–40 $0.27/m3 Fixed tariff on a monthly basis
Dhaka House connection
$17 $0.86/m3 Metered volume on a monthly basis
Dhaka Standpipe
4 hrs/day(2 hrs morning and 2 hrs evening)
Water from utility network
Volume served Cebu House
connection 24 hrs/day Groundwater
No treatment $60 $0.5–0.8/m3 Metered volume on a monthly
basis Cebu Hose
connection Few hours every 2 days
Groundwater Not safe
$10 $1.0–1.5/m3 Volume (served by caretaker) on a weekly basis
Ho Chi Minh City
House connection
24 hrs/day Groundwater treatment unit
$30 $0.22/m3 Metered volume on a monthly basis
House connection
24 hrs/day $30 $0.7/m3 Metered volume on a daily basis
Manila
Delivery by hose
On request
Groundwater or from utility network 0 $1.3/m3 Volume served
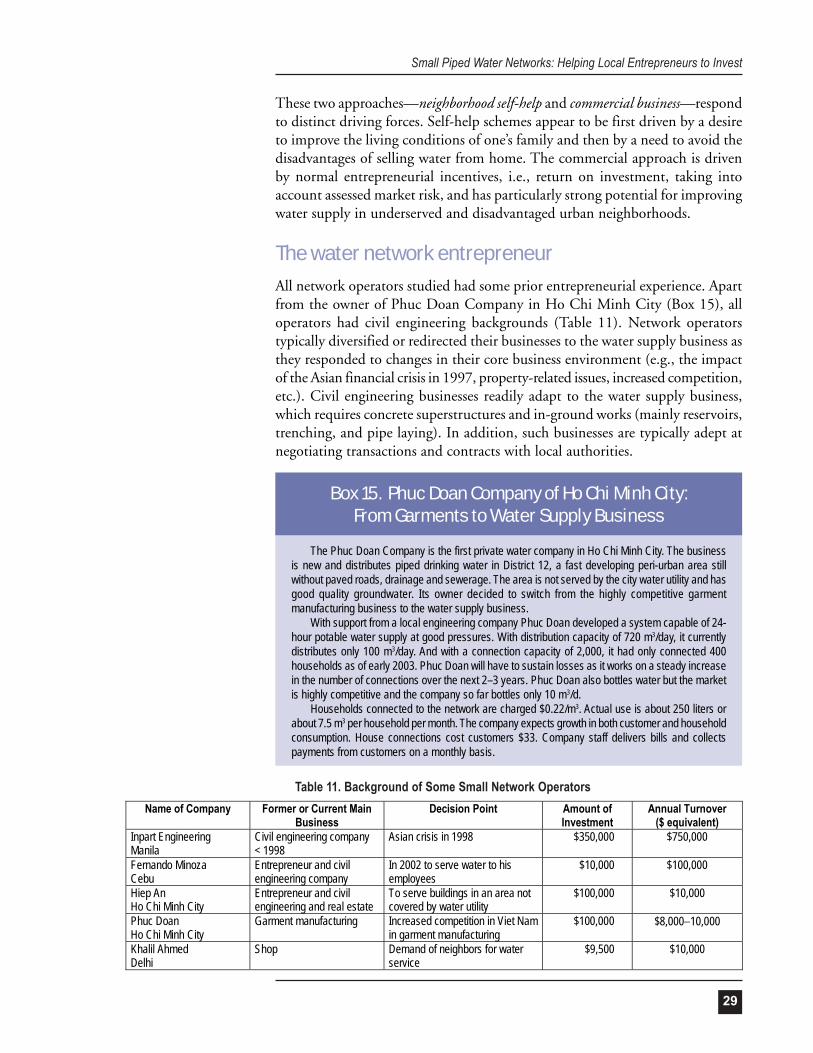
Small Piped Water Networks: Helping Local Entrepreneurs to Invest
29
These two approaches—neighborhood self-help and commercial business—respondto distinct driving forces. Self-help schemes appear to be first driven by a desireto improve the living conditions of one’s family and then by a need to avoid thedisadvantages of selling water from home. The commercial approach is drivenby normal entrepreneurial incentives, i.e., return on investment, taking intoaccount assessed market risk, and has particularly strong potential for improvingwater supply in underserved and disadvantaged urban neighborhoods.
The water network entrepreneurAll network operators studied had some prior entrepreneurial experience. Apartfrom the owner of Phuc Doan Company in Ho Chi Minh City (Box 15), alloperators had civil engineering backgrounds (Table 11). Network operatorstypically diversified or redirected their businesses to the water supply business asthey responded to changes in their core business environment (e.g., the impactof the Asian financial crisis in 1997, property-related issues, increased competition,etc.). Civil engineering businesses readily adapt to the water supply business,which requires concrete superstructures and in-ground works (mainly reservoirs,trenching, and pipe laying). In addition, such businesses are typically adept atnegotiating transactions and contracts with local authorities.
The Phuc Doan Company is the first private water company in Ho Chi Minh City. The businessis new and distributes piped drinking water in District 12, a fast developing peri-urban area stillwithout paved roads, drainage and sewerage. The area is not served by the city water utility and hasgood quality groundwater. Its owner decided to switch from the highly competitive garmentmanufacturing business to the water supply business.
With support from a local engineering company Phuc Doan developed a system capable of 24-hour potable water supply at good pressures. With distribution capacity of 720 m3/day, it currentlydistributes only 100 m3/day. And with a connection capacity of 2,000, it had only connected 400households as of early 2003. Phuc Doan will have to sustain losses as it works on a steady increasein the number of connections over the next 2–3 years. Phuc Doan also bottles water but the marketis highly competitive and the company so far bottles only 10 m3/d.
Households connected to the network are charged $0.22/m3. Actual use is about 250 liters orabout 7.5 m3 per household per month. The company expects growth in both customer and householdconsumption. House connections cost customers $33. Company staff delivers bills and collectspayments from customers on a monthly basis.
Box 15. Phuc Doan Company of Ho Chi Minh City:From Garments to Water Supply Business
Table 11. Background of Some Small Network OperatorsName of Company Former or Current Main
Business Decision Point Amount of
Investment Annual Turnover
($ equivalent) Inpart Engineering Manila
Civil engineering company < 1998
Asian crisis in 1998 $350,000 $750,000
Fernando Minoza Cebu
Entrepreneur and civil engineering company
In 2002 to serve water to his employees
$10,000 $100,000
Hiep An Ho Chi Minh City
Entrepreneur and civil engineering and real estate
To serve buildings in an area not covered by water utility
$100,000 $10,000
Phuc Doan Ho Chi Minh City
Garment manufacturing Increased competition in Viet Nam in garment manufacturing
$100,000 $8,000–10,000
Khalil Ahmed Delhi
Shop Demand of neighbors for water service
$9,500 $10,000

30
All surveyed investors said they expected to recover their investments (in theareas not served by the water utility) because they are able to take market shareaway from water vendors. They further said that they were attracted by themonopoly-like conditions of their new businesses unlike the conditions in thehighly competitive construction industry. They added that although they expectedto make only modest profits in the water business, it offered certainty and stability.
Network investmentsThe steady growth in network investments reflects a strong business model basedon matching level of service with demand and willingness to pay. Much of networkoperators’ investment is in house connections. In Metro Manila, InpartEngineering invested $350,000 over a period of 5 years in low-income areas.Inpart delivers water to approximately 125,000 persons through pipedconnections (40%) or through hose connections to house storage tanks (60%).In Ho Chi Minh City, the Hiep An and Phuc Doan companies have invested$80,000 each to produce and treat water that is distributed to 400 householdsvia individual house connections. Small networks each serve fewer than 100households in Cebu and 50–700 households each in Delhi. The small networkin Dhaka serves only 100 households through individual house connections;only 1% of the population is served by SSPWPs as other consumers get waterfrom standpipes.
The small network operators’ investment capital comes either from their ownequity or loans from friends and family (Box 16). It is significant to note thatnone of the small operators studied had availed of a bank loan. Bank finance isdifficult for them to access because (i) banks won’t lend to nonlegal and informalbusinesses, (ii) banks are skeptical about businesses selling water to poorhouseholds, and (iii) water supply systems are not regarded by banks as valuablecollateral. Even with more than 25,000 customers served in Manila and goodcommercial indicators (rate of payment, in particular), Inpart Engineering hasfailed to convince a single commercial bank that selling water in disadvantageddistricts is a bankable enterprise. In the absence of reasonably priced medium-term bank financing, small operators borrow from nonbank lenders at short-term and usurious rates (5–10% per month).
Inpart Engineering’s owner borrows money from relatives at 5–15% interest per month to raise$50,000–100,000 to implement a typical piped water supply system in low-income areas. For aninvestment of around $100,000 (around $30–40 per household), Inpart Engineering sells around30,000 m3 of water monthly, serving over 3,000 households. The cost of finance is a major componentof the water price and greatly impacts profitability.
To illustrate: if, at a given water tariff, a scheme’s gross profit would be 13% of turnover if it werefinanced by a 15% per annum bank loan (including amortization over 5 years), that same schemewould be loss-making if it were financed by a 10% per month interest loan even without amortization.
Box 16. Impact of Interest Rate on Business Profit:Example of Inpart Engineering in Manila

Small Piped Water Networks: Helping Local Entrepreneurs to Invest
31
Network technologiesTo reduce investment and operational costs per connection, small networks uselow-cost technologies that suit their customer base. The case studies highlightedlow-cost innovation, not technical innovation. While network operators use thecity utility as their technical model, they usually (i) use cheaper materials (flexiblepolyethylene, glued PVC instead of cast iron, and commercially available meters),(ii) reduce connection security levels (no antireturn valves and visible meter box),and (iii) simplify pipe laying (shallower trenches, or pipes on the ground oralong the walls of houses). They also reduce nontechnical water losses, especiallyillegal connections.
Networks and utilities: Similarities and differencesDespite similarities with utilities, different commercial philosophies underpinsmall network businesses. Because they operate in areas close to where they ortheir relatives live, small operators do not require guarantees or land deeds. Thiscan be an extremely important differentiation particularly in a city like Cebuwhere the water utility requires many legal documents from prospectivecustomers.10 Network connection fees are typically lower than utilities’: 40%lower in Dhaka ($17 vs. $29) and Cebu ($60 vs. $100) and 400% lower inManila ($30 vs. $124). This is so because they only cover the bare cost of theconnection, generally around $30. In comparison, utility connection costs aretypically higher and pricing policy may also include a profit element in theconnection fee, resulting in fees from $60 to $100. The Delhi Jal Board fullysubsidizes its connection fees and is a lone exception among the survey cities.
Billing System. Most start-up small piped networks adapt the utility model forservice level and billing (Table 12). In time, however, their billing arrangementsbecome more flexible than utilities’. Network operators tailor their billing systems totheir customers’ income characteristics. For example, Inpart Engineering, whichsupplies mostly slum and low-income areas, collects fees daily through a large networkof aguadors (water carters). Small operators in Cebu collect weekly or monthly. Fewsmall operators (Ho Chi Minh City and Delhi) follow the water utility practice ofbilling and collecting monthly. Small operators do not have clear disconnection policies
10 Land title or tax declaration, plumbing permit, residence tax certificate, applicants identification card, and affidavit ofhouse ownership.
Table 12. Comparing Service and Billing Approaches of Utilities and Small NetworksLevel of Service Provided
by Water Utility Level of Service Provided
by Small Operators
City Hours of Service Billing Hours of Service Billing
Delhi Low 2–4 hrs/day
Fixed tariff Low 1–2 hrs/day
Fixed tariff
Kathmandu (nearby the city)
Low 2–4 hrs/day
Fixed tariff Low 1–2 hrs/day
Fixed tariff
Ho Chi Minh City High 24 hrs/day
Meter High 18–24 hrs/day
Meter
Cebu High 18–24 hrs/day
Meter High 24 hrs/day
Meter

32
and disconnect customers only as a last resort. Delinquencies nonetheless are lowbecause of the agreeable billing and collection scheme.
Risk management. While small operators lack the formal accounting systemsand practices used by well-run businesses to limit financial and commercial risks,they make up for it by employing clever operational strategies and tactics such as:
Intermediaries to reduce nonrevenue water (NRW). Small operators usuallylimit water losses by passing on the risks of technical and nontechnical lossesto an intermediary. At the same time, the intermediaries’ day-to-day presenceon the ground allows the network to be constantly supervised. InpartEngineering is organized in such a way that all risks of losses are passed on toaguadors whose meters are situated at the head of the network (Figure 13).The “primary network” between the reservoir and the aguador is allocatedto him or her and, by installing the meter as close as possible to the reservoir,the aguador controls his or her at-ground connection to the district beingserved.
Assurances to reduce political risk. Small operators require some kind of“authorization” from local authorities to develop their schemes. Apart fromthe required formal approval from the municipality and the utility as inCebu, small network operators usually depend on close relationships withneighborhood municipal officials and political patrons to obtain the necessaryenvironment of “tolerance” for their operation. This is essential if they are tobe allowed to operate within the water utility’s exclusive service area.Transaction costs associated with maintaining this “tolerance” are added tothe price of water sold. Small operators usually, but not always, avoid dealingdirectly with utilities who view them as illegal competitors and not potentialpartners.
Legality and level of service. The study shows that the legal environment foroperating small networks influences the level of service offered to customers.This is illustrated in Table 13 comparing Delhi and Ho Chi Minh City. Operatingunder a legal environment, Ho Chi Minh City’s small piped networks haveinstallations technically similar to those of donor-funded small-town piped systemsor water utility systems (e.g., having their own water treatment and using buriedPVC-piped networks with draining/purging capability); they also employ localengineers experienced in low-cost water treatment. In contrast, operators in Delhi
Figue 13. Inpart Engineering Operational Set-up
A
B
C
D EF
Inpart responsibility Aguador responsibility Customer
responsibility
C. Inpart reservoirA. Water utility pipe network B. Connection on WU pipe D. Meter
E. Distribution pipe from reservoir to house of aguador F. Distribution pipe from aguador to client’s house

Small Piped Water Networks: Helping Local Entrepreneurs to Invest
33
only drill a borehole and distribute untreated water in galvanized iron pipes laidon the surface; households then make their own (unmetered) connections.
Small piped water networks: The realitiesThe study results show up several surprising realities about small networkoperators. Among these: (i) they are rarely innovative, and (ii) they do not makeexcessive profits.
Network operators are streetwise, but they are rarely inventive. Small networkoperators are regarded by some to be more innovative than city water utilities.Small operators do offer an appropriate level of service in low-income areas basedon low-cost technology. They can effectively calibrate their commercial responsesbecause they know their customers well. But when it comes to technicalinnovation, the study shows that only one small operator, in Viet Nam, hadintroduced a genuinely innovative low-cost water treatment technology, yet thiswas probably developed not by the operator but by local research institutes. Asthe study indicates, SSPWPs tend to imitate service and technological approachesused by water utilities. Although not particularly inventive, SSPWPs strive tokeep installation costs down as a response to (i) risky business environments, (ii)limited own capital, (iii) limited debt finance available, and (iv) limited technicalskills. Small operators are savvy managers who handle risks well.
Water network operators do not profiteer. During water shortages and in theabsence of effective regulation, water vending can appear to be profiteering.Remove these distortions, however, and SSPWPs strive to reduce costs and prices.The tariff charged by small network operators (in all survey cities) is higher thanthe water utility’s social tariff (Table 14) because SSPWPs cannot cross-subsidizefrom nonpoor and commercial customers to poor customers since nearly allsmall network customers are low-income earners.
Table 14: Tariffs of Utilities and Small Network OperatorsCity Social Tariff
Charged by Utility Tariff Charged
by Small Operators Comments
Delhi $0.62/month $4.2/month Flat tariff Social tariff is highly subsidized
Dhaka $0.6–$0.8/month $0.86/m3 Monthly flat tariff for around 10 m3 Cebu $0.24/m3 $0.5–0.8/m3 HCMC $0.11/m3 $0.22/m3 Manila
MWCI: $0.33/m3 MWSI: $0.52/m3
$0.7/m3
High tariff charged by Inpart Engineering is due in particular to daily recovery system, which implies high percentage on sales for aguadors (20%)
HCMC = Ho Chi Minh City, MWCI = Manila Water Company, Inc., MWSI = Manila Water Supply, Inc.
Table 13. Legal Environment and Small Networks
Delhi Ho Chi Minh City
Illegal environment Legal environment Service: 1–1.5 hrs/day Service: 24 hrs/day No meter Meter No treatment of water Treatment of water Investment: $10/household connected Investment: $80–100/household connected Tariff: $0.28/m3 Tariff: $0.22/m3

34
The real-life profile of the small network operator working in low-incomeneighborhoods does not fit the image of a profiteering businessperson. The smalloperators encountered during the study spoke highly of their social role in servingareas not reached by utilities. Due to the risky legal conditions, however, theysaid it was necessary for them to structure their pricing to achieve shorter (2–3year) payback periods. Small water networks’ pricing also reflects smaller volumewater sales and the absence of external subsidies and soft loans. Significantly,small operators that do have some formal legal status are typically able to complywith requisite technical and quality standards.
Information from the research is insufficient to construct financial operatingmodels for small network operators. However, the case studies indicate grossoperating profits of 20–50% of turnover, excluding undisclosed “taxes” andfinancing costs. The highest profit margins are in Delhi (50% for all the threestudied networks) where the business and legal risks are high. Fully authorizedsmall network operators in Manila and Cebu show gross profits from 20% (InpartEngineering, Manila) to 25–30% in Cebu. Net returns to small operators aresimilar to mid-range incomes in their cities, which are around $200 per month.
Small network operators care about their water quality. Water quality at sourceis monitored in Cebu, Delhi, Ho Chi Minh City, and Manila. While they donot have treatment facilities, network operators in Cebu regularly disinfect theirelevated tanks and other important equipment. They also advise their customersas to the potability of their water. Ho Chi Minh City network operators take alonger term business view: they allocate about 30% of their total system investmentfor treatment facilities to fully treat their tube-well water. Many small operatorsdo care about the quality of their water but do not give this the highest prioritysince customers give higher preference to reliability and convenience of service.
Difficulties resulting from informal statusAdministrative, legal, financial, and trading conditions in city water supplymarkets frequently disadvantage small water networks and other SSPWPs.
Small water network operators are severely hampered by their informal status.Without formal recognition and licensing by local authorities and the city waterutility, small networks operate on a commercially precarious footing. This hasthe effect of inflating business costs and hence water charges. The risk ofexpropriation forces operators to shorten payback period. Their informal statusincreases financing costs. Without formal licensing and regulation, small operatorsmust pass on to consumers the cost of bribes and other petty corruption.

Small Piped Water Networks: Helping Local Entrepreneurs to Invest
35
The low-cost technology of some small water network operators compromisesthe level and long-term sustainability of their services. Depending on perceivedwillingness to pay, unauthorized small operators use low-cost technology andequipment to shorten payback periods. Aside from compromising their services,this also limits their operations to established urban areas where they can get aquick payback on their investment by catering to a larger established market.They cannot achieve the same fast payback from urban fringe locations becausethe customer base takes time to build. Therefore, they require risk-reducing officialrecognition and licensing (Table 15).
The high bulk water charges of the city water utilities penalize small networkbusinesses. Without special negotiated rates, a small network business is chargedthe rate of a commercial/industrial customer despite its purpose to supply low-income communities (Box 17). Special negotiated rates that entitle the smalloperator to a lower tier block tariff are rare. Higher bulk water costs are passedon to low-income customers.
Table 15. Network Payback Periods Under Different Conditions
Without Water Treatment With Water Treatment
Established Urban < 3 years 3–7 years
Urban Fringe 3–7 years 7–10 years
Inpart Engineering sources its water from theManila Water Company, Inc. (MWCI) through a bulksupply arrangement brokered by its client barangay(community). The bulk tariff paid by Inpart is overthree times the social tariff charged to householdsby MWCI: $0.38/m3 equivalent compared with $0.12/m3 equivalent.
If the bulk meter rate charged to Inpart were$0.12/m3, it would effectively reduce the final priceto consumers by a little more than half—from $0.68to $0.30/m3. This assumes that the current negotiatedrevenue margins to Inpart, the barangay, and theaguadors would be retained. Even if reduced overallpricing lessened the volumetric margins remitted toInpart, MWCI, the barangay, and the aquadors,higher consumption resulting from lower prices mightrestore aggregate remittances.
Box 17: Impact of Bulk Supply Costs:Example of Inpart Engineering in Manila
0.13 0.08
0.070.04
0.38
0.12
0.1
0.06
0
0.1
0.2
0.3
0.4
0.5
0.6
0.7
0.8
Current Possible
$
InpartUtilityBarangayAguador
0.13 0.08
0.070.04
0.38
0.12
0.1
0.06
0
0.1
0.2
0.3
0.4
0.5
0.6
0.7
0.8
Current Possible
$
InpartUtilityBarangayAguador
InpartUtilityBarangayAguador

36
Policy recommendations from this study relate only to small private watersupply piped networks, which are more efficient than other types of SSPWPsand which are the only form of SSPWP able to give underserved households
what they want most and are willing to pay for—a direct house connection to areliable supply of clean water.
Why support small piped water networksThe right goal: universal 24-hour coverage. Every city in Asia can achieveuniversal 24-hour piped water supply within the timeframe of the MillenniumDevelopment Goals (MDGs)—2015. Achievements in unlikely cities such asPhnom Penh (Cambodia), Male (Maldives), Makassar (Indonesia), and Bangkok(Thailand) show how possible this is—for every city in Asia. Simple financialmodeling shows that every major city in Asia could be self-financing its city-wide water supply systems within 5 years. Every city can afford to have everyhouse connected by pipe or hose to a continuously available supply of cleanwater. Low-income and poor households want to be connected and are willingto pay for the service.
Millions would have to wait 5–10 years to get connected. Water utility servicebacklogs are so severe in many cities that even with sound policies and leadershipmillions of families would for many years be struggling to cope with paying 20–30 times more for water than those with a connection, with getting only 20–30liters per day, and with the daily threat of disease from unsafe water. Small privatewater networks could connect most of the disadvantaged and at-risk millionsalmost immediately and supply them with clean water while they remain on theutility’s waiting list.
Millions might never get connected. Inevitably, many cities will remain badlymanaged and water supply backlogs might actually increase. Only small privatewater networks will get connections to the millions of disadvantaged and at-riskfamilies in these cities.
Protecting utility markets and public revenues. Small piped water supplyentrepreneurs can increase water utility profitability, work to guarantee the monopolyrights of utilities and concessionaires, contribute to city hall revenues, and be votecatchers for local politicians—if they are included in water market partnerships.Their role has to be defined, formalized, and monitored. Key to this will in mostcases be to accept that small entrepreneurs are filling a gap on an interim basis.
Getting entrepreneurs to investFive constraints work against small water network entrepreneurs and put at riskmillions of families in Asian cities: (i) investments in small water networks arenot included in city development; (ii) laws and regulations outlaw or marginalizesmall water network entrepreneurs; (iii) city water utilities and concessionairesexclude small entrepreneurs, or ignore them; (iv) water utilities and concessionaireshave unfavorable bulk water pricing policies for small entrepreneurs; and (v)commercial banks won’t lend for water supply investments. Political will and
Policies andActions to
Support SmallPiped Water
Networks
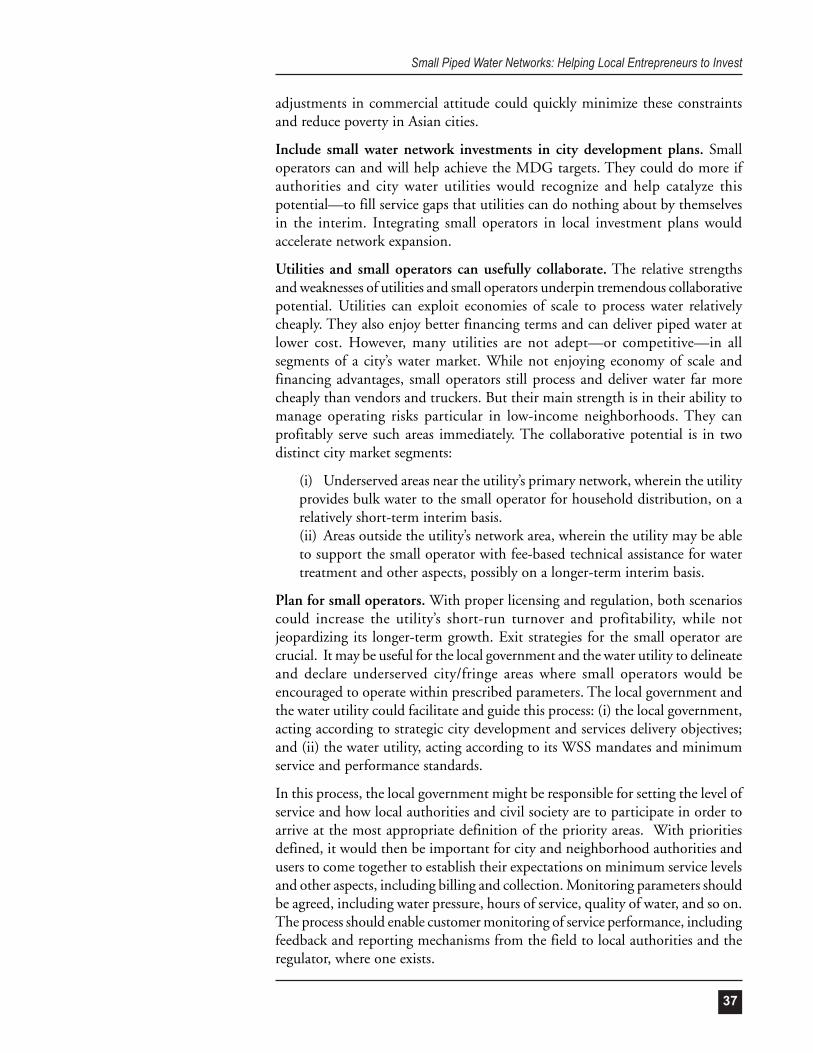
Small Piped Water Networks: Helping Local Entrepreneurs to Invest
37
adjustments in commercial attitude could quickly minimize these constraintsand reduce poverty in Asian cities.
Include small water network investments in city development plans. Smalloperators can and will help achieve the MDG targets. They could do more ifauthorities and city water utilities would recognize and help catalyze thispotential—to fill service gaps that utilities can do nothing about by themselvesin the interim. Integrating small operators in local investment plans wouldaccelerate network expansion.
Utilities and small operators can usefully collaborate. The relative strengthsand weaknesses of utilities and small operators underpin tremendous collaborativepotential. Utilities can exploit economies of scale to process water relativelycheaply. They also enjoy better financing terms and can deliver piped water atlower cost. However, many utilities are not adept—or competitive—in allsegments of a city’s water market. While not enjoying economy of scale andfinancing advantages, small operators still process and deliver water far morecheaply than vendors and truckers. But their main strength is in their ability tomanage operating risks particular in low-income neighborhoods. They canprofitably serve such areas immediately. The collaborative potential is in twodistinct city market segments:
(i) Underserved areas near the utility’s primary network, wherein the utilityprovides bulk water to the small operator for household distribution, on arelatively short-term interim basis.(ii) Areas outside the utility’s network area, wherein the utility may be ableto support the small operator with fee-based technical assistance for watertreatment and other aspects, possibly on a longer-term interim basis.
Plan for small operators. With proper licensing and regulation, both scenarioscould increase the utility’s short-run turnover and profitability, while notjeopardizing its longer-term growth. Exit strategies for the small operator arecrucial. It may be useful for the local government and the water utility to delineateand declare underserved city/fringe areas where small operators would beencouraged to operate within prescribed parameters. The local government andthe water utility could facilitate and guide this process: (i) the local government,acting according to strategic city development and services delivery objectives;and (ii) the water utility, acting according to its WSS mandates and minimumservice and performance standards.
In this process, the local government might be responsible for setting the level ofservice and how local authorities and civil society are to participate in order toarrive at the most appropriate definition of the priority areas. With prioritiesdefined, it would then be important for city and neighborhood authorities andusers to come together to establish their expectations on minimum service levelsand other aspects, including billing and collection. Monitoring parameters shouldbe agreed, including water pressure, hours of service, quality of water, and so on.The process should enable customer monitoring of service performance, includingfeedback and reporting mechanisms from the field to local authorities and theregulator, where one exists.

38
Retain appropriate technical standards. As stated, small operators typically uselow-cost technical options in order to limit their exposure and to be able toadapt to demand. It was also noted that in more secure markets, such as inHCMC, small operators apply technical standards close to those used by thewater utility, and they follow business plans with longer payback periods (3–10years, depending on the context). Whatever the legal and regulatory context,small operators compete on the strength of their ability to adapt to local demandcharacteristics; in formalizing small network operations it would becounterproductive to prescribe overly demanding and rigid standards. Standardsshould encourage local entrepreneurs and reflect their financial constraints andthe willingness to pay of their low-income customers, for instance:
(i) in informal neighborhoods within the existing service area of the utilitybut still not connected, lower cost technical standards should apply, inparticular avoiding trenching (flexible piping along lanes, walls, etc.); and(ii) in neighborhoods outside the utility service area but likely to be connectedin the medium term, technical standards should be close to those of theutility in order to facilitate the network eventually being taken over by theutility.
In this second case there may need to be a take-out agreement or some otherkind of financial support from the utility or local government in order for thesmall operator investment to be viable at an affordable water price to residents.Project financing support could be considered for small operators, since it couldleverage local private capital and be structured to include “output-based”incentives.11
Enable legal and contractual environment. Small operator-friendly laws,regulations, and concession contracts can be tremendously important forcatalyzing local capital and innovation to help serve the poor. The Municipalityof Ho Chi Minh City recognizes that local network operators can contribute tomeeting coverage targets. It developed a legal framework to “socialize investments”and engage local firms wishing to develop small-scale water networks in Ho ChiMinh City (Box 18).
For concession contracts with small private operators, it would be beneficial to
(i) avoid a rigid definition of monopolistic rights and build in the possibilityof working through a third party operator;(ii) for regulatory purposes, households connected to a small network withinthe concession area could be “counted” as being served by the concessionaire,thereby encouraging bulk supply-distribution collaboration; and(iii) avoid a “subrogation” clause whereby the concessionaire is held responsiblefor the quality of water sold on by local distributors and resellers.
11 “Output-based,” as distinct from “inputs.” Output-based indicators might include, for example, connections made,water consumed and accounted for, etc.

Small Piped Water Networks: Helping Local Entrepreneurs to Invest
39
Formally engage small network operators. Study results point to the possibilityof local government and utilities engaging local private water network operatorsto deliver water at prices that are not inflated by unfavorable legal and businessconditions, including
(i) Direct contracting. The city government contracts a local private operatorto produce and distribute drinking water in a selected area. Special attentionwould be required for water management issues particularly relating togroundwater abstraction. The operator bears all production (pumping andtreatment) and distribution costs.(ii) Subdelegation. The city utility sells water in bulk to a local network ownerand operator. The bulk supply pricing could reflect the savings accrued tothe utility by foregone capital investment and O&M costs. Presuming afinancially rational tariff regime exists for the utility, the bulk supply rate tothe small operator could be less than the lowest block tariff to individualcustomers.
Ho Chi Minh City faces two main challenges for improving its water supplies:1. Inadequate water sources due to rapid population and economic growth since 1990 (developed
source capacity is about 30% less than theoretical demand). The shortage is worsened by technicallosses increasing from 20% to 30% in recent years; and
2. Rapid expansion of the city with large peri-urban and fringe rural areas not served.Despite major investment programs, including the acquisition of new water production units, the
Ho Chi Minh City Water Supply Company is “running after demand.” Over 55% of the city’s residentsare not served by the utility. Forecasting that many residents would remain unserved for the next 5–10 years and taking notice of the role of small piped network operators, the Municipality decided inDecember 2001 to develop a legal framework to involve small-scale water providers in helping theCity reach its Master Plan target of providing access to clean water to 90% of the population by2005.
In 2002 the Municipality and the utility prepared a regulation to “socialize” investments in safewater supply, which was proclaimed by the People’s Committee in August 2003. This regulationaims to facilitate investment by local private companies to (i) increase water production, (ii) improvethe level of service in areas not served by the water utility, and (iii) rehabilitate the pipe network inareas where water leakage is high. Local authorities (from the Department of Public Works,Department of Planning and Investments, and the People’s Committee of Districts) identify the areasfor the socialization program while the water utility sets the technical specifications.
The regulation defines the (i) types of investment possible, (ii) procedure in shortlisting prospectiveinvestors, (iii) rights and responsibilities of investors, and (iv) handover process at the end of thesubdelegation contract (2 x 5 years or when the area is reached by the utility network). Private pipednetwork operators have to comply with the technical standards set by the utility.
The regulation is designed to bring the utility and small network operators together. For instance,it requires the utility to give technical, administrative, and materials procurement support. TheMunicipality, meanwhile, will give the small network operators tax exempt status.
In 2002, the Hiep An Company, a private company based in District 8, entered into a pilot projectwith the utility for the utility to sell it 700 m3 of safe water daily. The company invested around$100,000 and serves safe water to around 100 households in District 8. It is currently studying toinvest another $100,000 in another district to serve a commercial center and around 200 households.
Box 18. Legal Framework to Involve SSPWPsin Ho Chi Minh City

40
Some basic principles should guide processes for selecting small network operatorsfor such arrangements. Processes should encourage prospective operators whohave strengths in dealing with local conditions and challenges, especially ininformal settlements. It is also important to match operations scale with thefinancial capability of operators. Tendering processes should not disadvantageoperators who may already have invested in an area. It might sometimes bebetter to screen and approve proposed systems rather than to tender them,considering technical (past experience, recognized entrepreneurial ability, etc.),financial (investment capacity, etc.), and social (references from recognized localor moral authorities, etc.) criteria. The approval process may be more or lesssophisticated depending on the nature of the proposal. Whatever the selectionprocess, it should be transparent and independently regulated.
To encourage small local entrepreneurs who may only be able to operate in oneneighborhood at a time, the city government or utility could prepare a list ofpreferred small network service areas that local entrepreneurs could selectivelyregister their interest in. Existing conditions and service standard parameterswould be described for each service area. All this would result from an inclusiveand participatory strategic planning program.
Any executed contract or license issued to build and operate a small piped networkshould include at least the following:
(i) Time-bound coverage and service level targets;(ii) Water supply pricing and adjustment formula;(iii) Concession period and exit/takeout undertakings;(iv) Performance monitoring requirements and criteria, and regulation
arrangements; and(v) Termination clauses.

Small Piped Water Networks: Helping Local Entrepreneurs to Invest
41
Asian Development Bank (ADB). 2003. Water in Asian Cities: Utilities’ Performanceand Civil Society Views.
Baker, B. and S. Tremolet. 2000. Regulating Quality Standards to Improve Access forthe Poor. Private Sector Viewpoint Note No. 219. Washington, DC: Water andSanitation Program (WSP), The World Bank.
Brook, Cowen P. 1997. Getting the Private Sector Involved in Water – What to Do inthe Poorest of Countries? Private Sector Viewpoint Note No. 102.
Brocklehurst, C. 2001. Durban Metro: Private Sector Partnership to Serve the Poor.Case Study. Washington, DC: WSP, The World Bank.
Brocklehurst, C. and B. Evans. 2001. Serving Poor Consumers in South Asian Cities:Private Sector Participation in Water and Sanitation. Overview Paper. Washington,DC, WSP, The World Bank.
Camdessus, M. 2003. Financing Water for All. Report of the World Panel on FinancingWater Infrastructure. Washington, DC: The World Bank.
Collignon, Bernard. 1999. The Potential and the Limits of Private Water Providers:Independent Sellers in Francophone Africa. Case Study. Washington, DC: WSP, TheWorld Bank.
Collignon, Bernard and Marc Vezina. 2000. Independent Water and SanitationProviders in African Cities. Summary of a 10-Country Study. Washington, DC: WSP,The World Bank.
Evans, B. and C. Brocklehurst. 2003. New Design for Water and Sanitation Transactions:Making Private Sector Participation Work for the Poor. Washington, DC: WSP andPPIAF, The World Bank.
Foster, V. 2001. Lower Costs with Higher Benefit: Water and Sewerage Services for LowIncome Households. Field Note. Washington, DC: WSP, The World Bank.
Guttierez, E., B. Calaguas, J. Green and V. Roaf. 2003. Does PSP Benefit the Poor?The Synthesis Report. Water Aid.
Guttierez, E. 2001. A Survey of the Theoretical Issues on Private Sector Participation inWater and Sanitation. Framework document. Water Aid.
Komives, K. and Prokopy L. Stalker. 2000. Cost Recovery in Partnership: Results,Attitudes, Lessons and Strategies. Research and Surveys Series. BPD Water andSanitation Cluster.
McIntosh, A. C. 2003. Asian Water Supplies: Reaching the Urban Poor. ADB andInternational Water Association.
Mian, M. N. H. 2002. DWASA Initiative on Piped Water Provision for the UrbanSlum Dwellers. Water Aid.
Powell, S. and M. Starks. 2000. Does Reform of Energy Sector Networks Improve Accessfor the Poor? Private Sector Viewpoint Note No. 209. Washington, DC: The WorldBank.
Programme Solidarité Eau. 1999. Water Supply and Sanitation in Peri Urban Areasand Small Centers.
References
42
Provencher, L., et al. 1998. Alternative Solutions for Water Supply and Sanitation inAreas with Limited Financial Resources. Lyonnaise des Eaux.
Rokeya, A. 2002. Water and Sanitation Initiative for Urban Poor. Water Aid.
—————. 2003. DSK: A Model for Securing Access to Water for the Urban Poor.Fieldwork report. Water Aid.
Silva G., N. Tynan, and Y. Yilmaz. 1998. Private Participation in the Water andSewerage Sector—Recent Trends. Private Sector Viewpoint Note No. 147. Washington,DC: The World Bank.
Tova, Maria Solo. 1998. Competition in Water and Sanitation: The Role of Small ScaleEntrepreneurs. Private Sector Viewpoint Note No. 165. December. Washington, DC:WSP, The World Bank.
Troyano, F. 1999. Small Scale Water Providers in Paraguay. Case Study. Washington,DC: WSP, The World Bank.
Van den Berg, C. 2002. Working Across Boundaries to Serve the Poor Sustainably.2002 WSP-EAP Regional Conference.
Verdeil, V. 2003. Local Water Markets: Practices and Territory of the Water Supply inMetro Cebu. Research Thesis.
—————. 2002. Vietnam: Evolving Management Models for Small Towns WaterSupply in a Transitional Economy. Washington, DC: WSP, The World Bank.
—————. 2000. Water Concessions: Who Wins, Who Loses and What to Do AboutIt. Private Sector Viewpoint Note No. 217. Washington, DC: The World Bank.
Water and Sanitation Services South Africa. 1997. Alternative Solutions to ProvideWater and Sanitation Facilities to Disadvantaged Communities. Final Report ProjectFF6/DTR.
Water Aid and WSP. 2000. The Water Supply and Sanitation Situation of the UrbanPoor in the Kathmandu Valley.
Webb, M. and Ehrhardt. 1998. Improving Water Services through Competition. PrivateSector Viewpoint Note No. 164. Washington, DC: The World Bank.
Zerah, M. H. 2001. The Buenos Aires Concession: The Private Sector Serving the Poor.WSP Case Study. Washington, DC: The World Bank.
Weitz, A and R. Franceys. 2002. Beyond Boundaries: Extending Services to theUrban Poor. Manila: ADB.
World Bank, WSP. 1999. Water Vending: Improving Water Services through SmallScale Private Providers in Chennai (Madras). Field Note.
—————. Water Services: Water in Asian Cities. The World Bank website.

Small Piped Water Networks: Helping Local Entrepreneurs to Invest
43

44
Small Piped WSmall Piped WSmall Piped WSmall Piped WSmall Piped Water Networksater Networksater Networksater Networksater NetworksHelping Local Entrepreneurs to InvestThis book is about small-scale private water providers in Asian cities and the entrepreneurialpotential of small piped network operators. It proposes that city officials, city water utilities,and local banks work closely with small network entrepreneurs to bring water supplies to thepoor and disadvantaged.
ADB “ADB “ADB “ADB “ADB “WWWWWater for All” Seriesater for All” Seriesater for All” Seriesater for All” Seriesater for All” Series 1. Water and Poverty
Fighting Poverty through Water ManagementBy John Soussan
2. Poverty and Water SecurityUnderstanding How Water Affects the PoorBy John Soussan and Wouter Linklaen Arriëns
3. The Water and Poverty InitiativeWhat We Can Learn and What We Must DoBy Dirk Frans and John SoussanAn Overview of International Case StudiesPrepared for the 3rd World Water Forum, Kyoto, Japan, 16–23 March 2003
4. Water and Poverty: The ThemesA Collection of Thematic PapersPrepared for the 3rd World Water Forum, Kyoto, Japan, 16–23 March 2003
5. Water and Poverty: The RealitiesExperiences from the FieldPrepared for the 3rd World Water Forum, Kyoto, Japan, 16–23 March 2003
6. Water for the Poor: Partnerships for Action—A Strategy PaperHow to Bring Water to the Rural Poor
7. Water and Poverty in the 3rd World Water ForumBy John SoussanKyoto, Japan, 16–23 March 2003
8. Bringing Water to the PoorSelected ADB Case Studies
9. The Impact of Water on the PoorSummary of an Impact Evaluation Study of Selected ADB Water Supply and Sanitation ProjectsADB Operations Evaluation Department
10. Water in Asian CitiesUtilities’ Performance and Civil Society ViewsEdited by Charles T. Andrews and Cesar E.Yñiguez
11. Floods and the PoorReducing the Vulnerabiliy of the Poor to the Negative Impacts of FloodsBy Ian B. Fox
12. Past Experience and Future ChallengesCooperation in Shared Water Resources in Central AsiaPapers Presented at an ADB Regional Workshop in Almaty, Kazakhstan, 26–28 September 2002
13. Small Piped Water NetworksHelping Local Entrepreneurs to InvestBy Hervé ConanEdited by Charles T. Andrews and Almud Weitz
S E
R I
E S
S E
R I
E S
S E
R I
E S
S E
R I
E S
S E
R I
E S
1313131313
This publication was produced by the ADB Water Awareness Program.For more information about ADB’s work in the water sector and its“Water for All” policy, please visit us at www.adb.org.water.
ISBN: 971-561-543-0Publication Stock No. 080104Printed in the Philippines
9 7 9 9 7 1 5 6 1 5 4 3 2
ISBN 971561543-0