Embed Size (px)
Citation preview
SMALL TOURISM ENTERPRISE PLANNING SIMULATOR (STEPS)Managing complexity in tourism enterprise planning G. Michael McGrath, Henk Meijerink and Pramod Sharma
Managing Complexity in Tourism Enterprise Planning Technical Reports The technical report series present data and its analysis, meta-studies and conceptual studies, and are considered to be of value to industry, government and researchers. Unlike the Sustainable Tourism Cooperative Research Centre’s Monograph series, these reports have not been subjected to an external peer review process. As such, the scientific accuracy and merit of the research reported here is the responsibility of the authors, who should be contacted for clarification of any content. Author contact details are at the back of this report. National Library of Australia Cataloguing in Publication Data McGrath, G. Michael. Small Tourism Enterprise Planning Simulator (STEPS): managing complexity in tourism enterprise planning. Bibliography. ISBN 9781920965358. 1. Tourism - Planning - Computer simulation - Evaluation. 2. Tourism - Planning. 3. Tourism - Management. I. Meijerink, Henk. II. Sharma, Pramod Chandra. III. Cooperative Research Centre for Sustainable Tourism. IV. Title. 338.4791 Copyright © CRC for Sustainable Tourism Pty Ltd 2008 All rights reserved. Apart from fair dealing for the purposes of study, research, criticism or review as permitted under the Copyright Act, no part of this book may be reproduced by any process without written permission from the publisher. All enquiries should be directed to the STCRC [[email protected].] Acknowledgements The Sustainable Tourism Cooperative Research Centre, established and supported under the Australian Government’s Cooperative Research Centre’s Program, funded this research. First published in Australia in 2008 by CRC for Sustainable Tourism Pty Ltd. Printed in Australia (Gold Coast, Queensland). Cover designed by Sin Design.
ii
SMALL TOURISM ENTERPRISE PLANNING SIMULATOR (STEPS) CONTENTS SUMMARY ____________________________________________________________________v Chapter 1 _____________________________________________________1INTRODUCTIONBackground _____________________________________________________________________1 SMTEs and Business Planning ______________________________________________________1 System Dynamics ________________________________________________________________2 STEPS: What it Can Do – and Can’t!_________________________________________________5 Chapter 2 _____________________________________________________6METHODOLOGYPhase 1: Literature Review and High-Level Conceptual Design ____________________________6 Phase 2: Requirements Refinement___________________________________________________6 Phase 3: Prototype Development ____________________________________________________6 Phase 4: Online Implementation (ongoing and future work) _______________________________6 Chapter 3 __________________________________7STEPS ARCHITECTURE AND USAGEDesign Overview_________________________________________________________________7 STEPS Usage __________________________________________________________________11
Scenario 1: Basic Usage 11 Scenario 2: Advanced Usage 11
Chapter 4 __________________________________13SYSTEM DYNAMICS ARCHETYPESSD Archetypes: Background_______________________________________________________13 The Fixes that Fail System Archetype _______________________________________________13 The Shifting the Burden System Archetype ___________________________________________14 The Limits to Growth System Archetype _____________________________________________15 The Niagara Effect System Archetype _______________________________________________16 Archetype Invocation ____________________________________________________________17 Chapter 5 SYSTEM VALIDATION ______________________________________________19Issues in SD Model Validation _____________________________________________________19 Desk Checking _________________________________________________________________19 Chapter 6 CONCLUSION_______________________________________________________22 APPENDIX A: MAIN STOCK-FLOW MODEL DIAGRAMS _________________________23 APPENDIX B: OPERATING INSTRUCTIONS_____________________________________28 REFERENCES ________________________________________________________________32 AUTHORS ____________________________________________________________________35
iii
Managing Complexity in Tourism Enterprise Planning List of Figures Figure 1: Example of a SD model - stock-flow form _______________________________________________3 Figure 2: CLD example - unintended consequences of a well-meaning action ___________________________4 Figure 3: STEPS design - functional decomposition _______________________________________________7 Figure 4: Enterprise Capability component - top-level CLD _________________________________________8 Figure 5: Setting region attractiveness - direct interaction through the SD control panel____________________9 Figure 6: STEPS control panel _______________________________________________________________10 Figure 7: STEPS - sample output (enterprise profitability versus year) ________________________________11 Figure 8: STEPS - example of a risk analysis assessment __________________________________________12 Figure 9: Typical outputs from running the STEPS fixes that fail archetype example_____________________14 Figure 10: Fixes that fail archetype - unintended consequences of staff training _________________________14 Figure 11: A typical output from the shifting the burden archetype example____________________________15 Figure 12: Shifting the burden archetype - an over-reliance on marketing______________________________15 Figure 13: Sample output from the STEPS limits to growth archetype example _________________________16 Figure 14: Limits to growth archetype - HR quality limits the impact of marketing initiatives ______________16 Figure 15: Output from the Niagara effect archetype example simulation ______________________________17 Figure 16: The Niagara effect archetype - the point of no return! ____________________________________17 Figure 17: STEPS Control Panel table for accessing system archetypes _______________________________18 Figure 18: Typical output from a 40-run desk-checking trial (Rural region type) ________________________20 Figure 19: Average TIS scores for AvRevPerRNO validation _______________________________________21 List of Tables Table 1: TIS results for AvRevPerRNO_________________________________________________________20
iv
SMALL TOURISM ENTERPRISE PLANNING SIMULATOR (STEPS) SUMMARY
In a recent study conducted for the Australian Sustainable Tourism Cooperative Research Centre (STCRC), improved business planning was identified as one of the most pressing needs of Small-to-Medium Tourism Enterprise (SMTE) operators (McGrath 2005). A further significant problem confronting these businesses was coping with rapid change: including technological change, major changes in the external business environment, and changes that are having substantial impacts at every point of the tourism supply chain (and at every level – from international to regional and local levels).
As a result of these findings, the STCRC provided funding and support for a follow-up research project aimed at producing a Small Tourism Enterprise Planning Simulator (STEPS). Distinguishing features of STEPS are:
• Extensive use is made of system dynamics (SD) modelling technologies and tools (for capturing and simulating key aspects of change).
• The enterprise simulator sits inside a destination-level simulator. In this way, STEPS addresses a major problem associated with the multitude of generic, low-cost business planning tools available – namely, they fail to take into account tourism-specific, contextual factors.
• STEPS operates at different levels of granularity. At the very fine-grained level, actual data is used to establish relationships and to instantiate model variables. At the more coarse-grained levels, a restricted set of destination archetypes is induced and users assign values to variables through an ‘impressionistic’ (or fuzzy) process.
• Artificial intelligence tools (such as rule-based deductive inference, case-based reasoning and fuzzy logic) are used to complement the base SD technology employed.
In this report an account of the development, potential usage and validation of STEPS is presented. The report begins with a discussion of the motivation and rationale underpinning the research project, plus a brief introduction to the SD conceptual modelling approach employed. The research methodology, which was based essentially on a classic information systems development prototyping approach (see e.g. Boehm 1988) is then introduced and this is followed by an overview of the STEPS architecture and an introduction to ways in which the system might be employed to advantage. As much as anything, STEPS has been designed as a learning aid and Chapter 4 details how tutorial features, based around the idea of system archetypes (Maani & Cavana 2000), have been integrated into the application. The report concludes with a discussion on system validation.
Research Objectives Briefly, the aim of this project was to produce a business planning aid (STEPS), suitable for use by SMTE operators. The focus of our work was on accommodation enterprises and the broad objective (of what is, essentially, only the initial stage of an ongoing project) was to produce a pre-production prototype.
It is important to distinguish between what the system can and cannot do. STEPS may be viewed as a generic tourism enterprise model sitting inside a destination-level model. By constructing the model within the Powersim SD modelling and simulation tool, the tourism enterprise operator may evaluate the impacts of different levels of investment in marketing, human resource development etc. within a tourism destination context. It must be emphasised that STEPS is intended to complement, rather than replace, more traditional business planning tools and approaches (see e.g. Baker 2000). That is, it does not provide detailed advice on aspects such as raising finance, construction issues and market identification and quantification. It does, however, provide guidance, on how the multitude of factors that work with and against each other in tourism (see e.g. Ritchie & Crouch 2003) might interact to produce unforeseen consequences. This, we believe, is one of the major contributions of our research.
Methodology The research approach was based around the following four phases. Phase 1: Literature Review and High-Level Conceptual Design The SD and tourism literature bases were reviewed, with a focus on business planning in general, the management of SMTEs and applications of SD in the T&H domain. Based largely on this review, a very high-level STEPS design was produced. Phase 2: Requirements Refinement The high-level design produced out of Phase 1 was translated into a ‘rough’ Powersim prototype. This prototype was then demonstrated to a sample of key industry stakeholders (including an Industry Reference Group) and researchers. The system requirements were then refined based on feedback from this process.
v
Managing Complexity in Tourism Enterprise Planning Phase 3: Prototype Development The rough prototype produced in Phase 2 was developed as STEPS V1.0 and implemented as a stand-alone, fully-functioning demonstration system in CD-ROM form. This phase also involved initial system validation via desk checking. The aim here was to ensure that outputs produced by the system were reasonably ‘sensible’ (particularly profitability projections). Phase 4: Online Implementation (ongoing and future work) The system will be translated into an online version and (probably) implemented within Decipher. The intention is to customize the initial implementation for a limited number of the more popular tourism regions and only one or two product types (which will certainly include accommodation enterprises). Further validation will take place during this phase (i.e. field testing). Key Outputs The principal output was the STEPS SD model and associated business planning simulator. The usual approach in developing an SD model is to: i) specify the problem domain as a causal-loop diagram (CLD); and, then, ii) implement it in the slightly more complex stock-flow syntax employed by special-purpose software packages such as iThink, Vensim and Powersim.
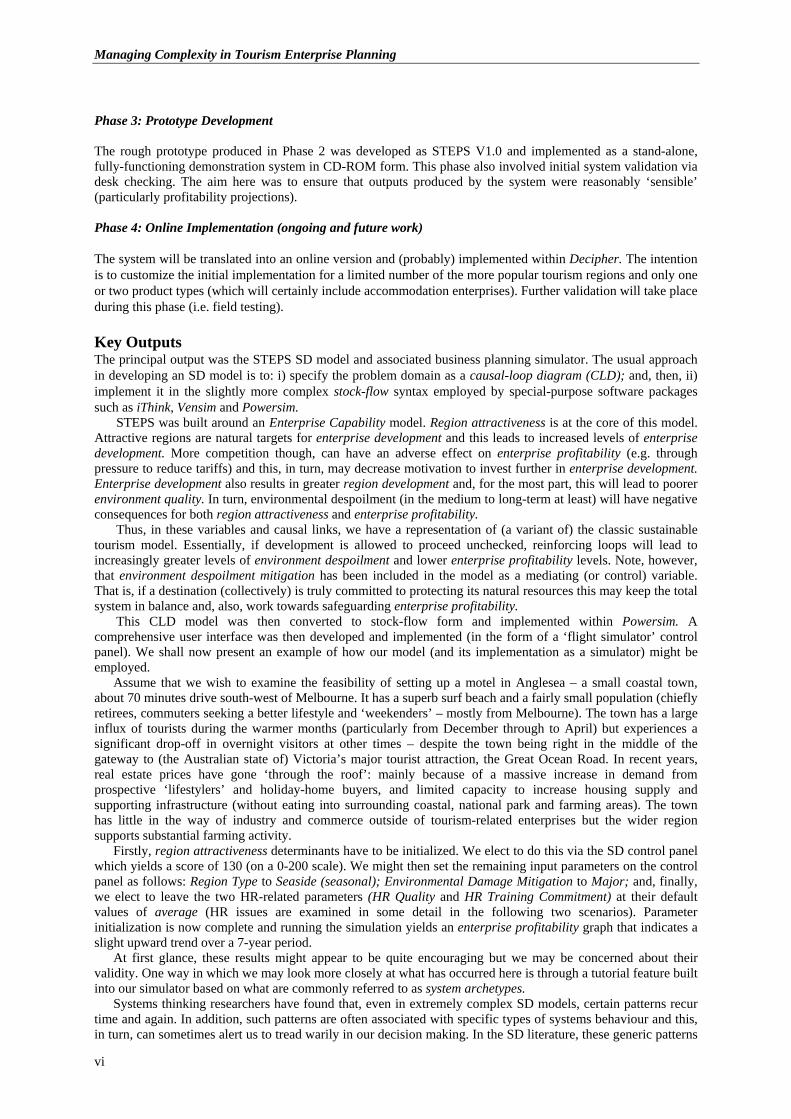
STEPS was built around an Enterprise Capability model. Region attractiveness is at the core of this model. Attractive regions are natural targets for enterprise development and this leads to increased levels of enterprise development. More competition though, can have an adverse effect on enterprise profitability (e.g. through pressure to reduce tariffs) and this, in turn, may decrease motivation to invest further in enterprise development. Enterprise development also results in greater region development and, for the most part, this will lead to poorer environment quality. In turn, environmental despoilment (in the medium to long-term at least) will have negative consequences for both region attractiveness and enterprise profitability.
Thus, in these variables and causal links, we have a representation of (a variant of) the classic sustainable tourism model. Essentially, if development is allowed to proceed unchecked, reinforcing loops will lead to increasingly greater levels of environment despoilment and lower enterprise profitability levels. Note, however, that environment despoilment mitigation has been included in the model as a mediating (or control) variable. That is, if a destination (collectively) is truly committed to protecting its natural resources this may keep the total system in balance and, also, work towards safeguarding enterprise profitability.
This CLD model was then converted to stock-flow form and implemented within Powersim. A comprehensive user interface was then developed and implemented (in the form of a ‘flight simulator’ control panel). We shall now present an example of how our model (and its implementation as a simulator) might be employed.
Assume that we wish to examine the feasibility of setting up a motel in Anglesea – a small coastal town, about 70 minutes drive south-west of Melbourne. It has a superb surf beach and a fairly small population (chiefly retirees, commuters seeking a better lifestyle and ‘weekenders’ – mostly from Melbourne). The town has a large influx of tourists during the warmer months (particularly from December through to April) but experiences a significant drop-off in overnight visitors at other times – despite the town being right in the middle of the gateway to (the Australian state of) Victoria’s major tourist attraction, the Great Ocean Road. In recent years, real estate prices have gone ‘through the roof’: mainly because of a massive increase in demand from prospective ‘lifestylers’ and holiday-home buyers, and limited capacity to increase housing supply and supporting infrastructure (without eating into surrounding coastal, national park and farming areas). The town has little in the way of industry and commerce outside of tourism-related enterprises but the wider region supports substantial farming activity.
Firstly, region attractiveness determinants have to be initialized. We elect to do this via the SD control panel which yields a score of 130 (on a 0-200 scale). We might then set the remaining input parameters on the control panel as follows: Region Type to Seaside (seasonal); Environmental Damage Mitigation to Major; and, finally, we elect to leave the two HR-related parameters (HR Quality and HR Training Commitment) at their default values of average (HR issues are examined in some detail in the following two scenarios). Parameter initialization is now complete and running the simulation yields an enterprise profitability graph that indicates a slight upward trend over a 7-year period.
At first glance, these results might appear to be quite encouraging but we may be concerned about their validity. One way in which we may look more closely at what has occurred here is through a tutorial feature built into our simulator based on what are commonly referred to as system archetypes.
Systems thinking researchers have found that, even in extremely complex SD models, certain patterns recur time and again. In addition, such patterns are often associated with specific types of systems behaviour and this, in turn, can sometimes alert us to tread warily in our decision making. In the SD literature, these generic patterns
vi
SMALL TOURISM ENTERPRISE PLANNING SIMULATOR (STEPS) are referred to as system archetypes (Bellinger 1999; Maani & Cavana 2000) and a thorough understanding of these improves our ability to both: i) understand how systems work; and, perhaps more importantly, to: ii) comprehend and interpret the consequences of our decisions. There are eight generally-acknowledged basic SD archetypes, first identified by the ‘System Dynamics Group’ at MIT. The STEPS model contains a number of these classic archetypes and we now investigate one of these further.
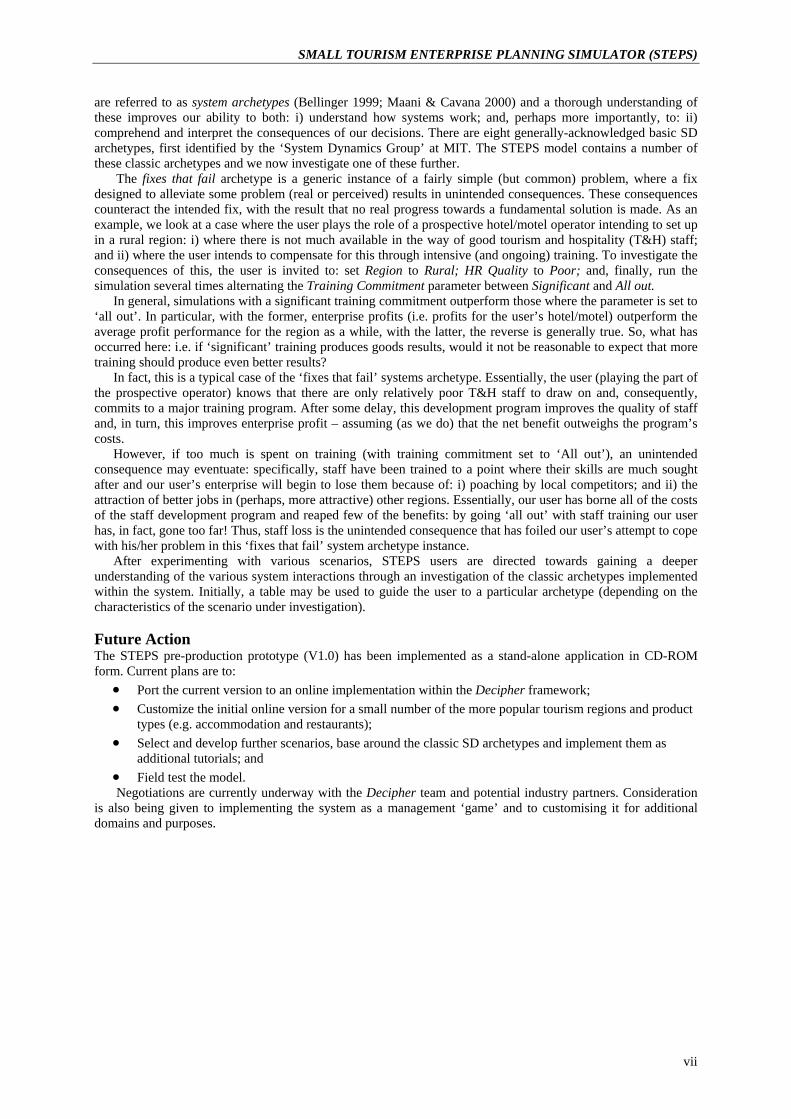
The fixes that fail archetype is a generic instance of a fairly simple (but common) problem, where a fix designed to alleviate some problem (real or perceived) results in unintended consequences. These consequences counteract the intended fix, with the result that no real progress towards a fundamental solution is made. As an example, we look at a case where the user plays the role of a prospective hotel/motel operator intending to set up in a rural region: i) where there is not much available in the way of good tourism and hospitality (T&H) staff; and ii) where the user intends to compensate for this through intensive (and ongoing) training. To investigate the consequences of this, the user is invited to: set Region to Rural; HR Quality to Poor; and, finally, run the simulation several times alternating the Training Commitment parameter between Significant and All out.
In general, simulations with a significant training commitment outperform those where the parameter is set to ‘all out’. In particular, with the former, enterprise profits (i.e. profits for the user’s hotel/motel) outperform the average profit performance for the region as a while, with the latter, the reverse is generally true. So, what has occurred here: i.e. if ‘significant’ training produces goods results, would it not be reasonable to expect that more training should produce even better results?
In fact, this is a typical case of the ‘fixes that fail’ systems archetype. Essentially, the user (playing the part of the prospective operator) knows that there are only relatively poor T&H staff to draw on and, consequently, commits to a major training program. After some delay, this development program improves the quality of staff and, in turn, this improves enterprise profit – assuming (as we do) that the net benefit outweighs the program’s costs.
However, if too much is spent on training (with training commitment set to ‘All out’), an unintended consequence may eventuate: specifically, staff have been trained to a point where their skills are much sought after and our user’s enterprise will begin to lose them because of: i) poaching by local competitors; and ii) the attraction of better jobs in (perhaps, more attractive) other regions. Essentially, our user has borne all of the costs of the staff development program and reaped few of the benefits: by going ‘all out’ with staff training our user has, in fact, gone too far! Thus, staff loss is the unintended consequence that has foiled our user’s attempt to cope with his/her problem in this ‘fixes that fail’ system archetype instance.
After experimenting with various scenarios, STEPS users are directed towards gaining a deeper understanding of the various system interactions through an investigation of the classic archetypes implemented within the system. Initially, a table may be used to guide the user to a particular archetype (depending on the characteristics of the scenario under investigation).
Future Action The STEPS pre-production prototype (V1.0) has been implemented as a stand-alone application in CD-ROM form. Current plans are to:
• Port the current version to an online implementation within the Decipher framework; • Customize the initial online version for a small number of the more popular tourism regions and product
types (e.g. accommodation and restaurants); • Select and develop further scenarios, base around the classic SD archetypes and implement them as
additional tutorials; and • Field test the model. Negotiations are currently underway with the Decipher team and potential industry partners. Consideration
is also being given to implementing the system as a management ‘game’ and to customising it for additional domains and purposes.
vii

Managing Complexity in Tourism Enterprise Planning
viii
SMALL TOURISM ENTERPRISE PLANNING SIMULATOR (STEPS)
Chapter 1
INTRODUCTION
Background A number of tourism researchers have noted that there is a demand among prospective (and current) small-to-medium tourism enterprise (SMTE) operators for improved business planning tools (see e.g. Baker 2000; Mistilis et al. 2004; Bergin-Seers et al. 2005). Moreover, there would seem to be a place for online, automated tools: whether as an adjunct to traditional sources of advice or as stand-alone products. Low-cost, generic business planning software products are inadequate because they fail to take into account contextual factors important to the tourism industry. There are, however, some impressive, recently-developed destination planning support tools and these are tourism-specific – examples being the ‘Tourism Futures Simulator’ of Walker et al. (1999) and the ‘Hotel Value Chain Profitability’ model of Georgantzas (2003).
A feature of both these tourism planning and policy-making tools is that they are based upon system dynamics (SD) concepts, tools and techniques. SD has been around for over 40 years (see Forrester 1961, for what is generally regarded as the seminal and most influential piece of work in the field), but has enjoyed something of a resurgence recently. To some extent, this is due to an increasing recognition (among researchers from many fields) that SD is especially suitable for capturing, modelling and analysing: i) so-called ‘messy’ problems; and ii) key aspects of ‘change’.
Messy problems have been defined by Vennix (1996, pp. 9-41) as being characterised by complexity, uncertainty, recursive dependencies, inter-related sub-problems, selective perception, self-interest and, related to this, key stakeholders working from different views of the essential nature of the problem. A glance through any tourism/hospitality text should quickly convince the reader that these attributes all apply to the tourism domain: both at the destination level (see e.g. Ritchie & Crouch 2003) and at the enterprise level (see Baker 2000).
Change too is characteristic of the tourism industry. Indeed, in a recent study (McGrath 2005), one of the most significant problems facing the Australian tourism industry was identified as rapid change: including technological change, major changes in the external business environment, and changes that are having substantial impacts at every point of the tourism supply chain (and at every level – from international to regional and local levels). The situation was summed up by one study participant as follows: ‘Not only are we shooting in the dark – we are shooting at a moving target’ (McGrath & More 2005, p. 4). Here, our interviewee was expressing a degree of dissatisfaction with: first, adequate data not being available to facilitate effective strategic planning; and, second, the fact that the tourism industry is moving so quickly that, even where accurate data is accessible in a timely manner, it is often outdated and relatively useless in much too short a timeframe. However, the quote would seem to apply equally to many other problems currently confronted by the industry. In recognition of the above, the Australian Sustainable Tourism Cooperative Research Centre (STCRC) recently provided funding and support for a research project aimed at producing a Small Tourism Enterprise Planning Simulator (STEPS). In this technical report, we discuss the development of STEPS, its architecture, usage, validation and plans for its deployment.
SMTEs and Business Planning The Australian tourism industry employs approximately 5.9% of the total workforce, accounts for 5.9% of GDP and contributes 11.2% of total exports (Tourism Australia 2004, p. 22). There is some argument concerning the accuracy of these figures but the recent establishment of a ‘Tourism Satellite Account’ (Smith 2004) by the Australian Bureau of Statistics (ABS) means that tourism’s contribution to the Australian economy is measured according to guidelines and methods established by the World Tourism Organization (WTO). This ensures that, at the very least, local tourism statistics are derived consistently with the closest thing to a generally-accepted set of standards the international tourism industry has and that international comparisons may be made with a fair degree of confidence.
In excess of 90% of Australian tourism businesses are SMTEs (Sharma et al. 2000, p. 3) and it has long been recognised that SMTE operators have to deal with myriad problems. For example, in a recent paper dealing with the local tourism industry’s response to an Australian state government’s ‘come online’ initiative, Morrison and King (2002, p. 111) divided SMTE firms into Techno-whizzos, Early adopters, Wait-and-sees and Wilderness operators. Members of the Wilderness group were described as generally aged 45+, with no computer or interest in them, they felt they were too old to learn more and they viewed the internet as a waste of time. They also had a dislike of officialdom/bureaucracy and were reluctant to participate in regional activities and networks.
1
Managing Complexity in Tourism Enterprise Planning Somewhat depressingly, it was estimated that 60% of the SMTE sample were in the Wilderness category (with another 20% in the Wait-and-see group).
More generally, Gammack et al. (2004, pp. x –xi) analysed SMTEs in the Asia-Pacific region and nominated the following factors as significant inhibitors to enterprise development:
• a lack of a trained and professional workforce; • a lack of entrepreneurial skills among operators; • low entry barriers – impacting on service quality, growth and business viability; • lending arrangement and taxation regimes not conducive to SMTEs; • conforming to (and supporting) sustainable regional infrastructure requirements; • inconsistent and bureaucratic local authorities; • a lack of government recognition of the value of tourism; • a failure to recognise the potential benefits of industry clusters and collaboration; • industry fragmentation and a proliferation of membership organisations; • a lack of technology (generally) and eCommerce (specifically) skills; • relatively poor eReadiness and eCommerce uptake; and • scattered, poorly-integrated and difficult-to-locate business research information. A number of these factors might be classified under the broader heading of a ‘lack of strategic focus’ and this
has long been recognised as a problem among SMTE operators (see e.g. Sharma et al. 2000a; Morrison & King 2002; Mistilis et al. 2004). This lack of attention to planning and strategy is evident in the Morrison and King (op. cit.) analysis presented above and, more recently, Mistilis et al. (2004) identified the lack of a strategic focus as the main impediment to the uptake of online technologies among Sydney hotel operators. Nevertheless, there are indications that things might be changing for the better and, during another Australian study conducted by the author (McGrath 2005), one State Tourism Authority (STA) representative asserted that:
‘Not a day goes by when we are not approached by at least a couple of prospective operators looking for help with their business planning. --------- You can look at business planning as, maybe, a 14-16 step process. We talk to them [prospective operators] at Step 1, and the next time they hear from us is after they are established. Then, we are asking them for information! We need to do more for them.’
Thus, at least some SMTE operators are looking to improve their business planning and, given the high rate of enterprise attrition in this sector (Baker 2000; English 1995), some attempts have been made to provide the necessary support. For example, the Decipher tourism data warehouse (Carson & Richards 2004) provides business planning support through its website, Tourism Victoria is planning to implement an online business planning product and the STCRC has recently released a business planning ‘toolkit’ for property owners considering ‘Farm and Country Tourism’ ventures (Fausnaugh et al. 2004). STEPS is intended to complement these products (the current intention being to eventually implement it within Decipher).
A quick search using Google (and the keywords, ‘business planning software’) returned just under 100 million matches. Even allowing for the fact that many of these are dead-ends, a brief perusal of a number of returned sites revealed a number of potentially useful business planning software aids. Thus, there is most definitely no shortage of generic business planning software. In addition, adding the word ‘tourism’ to the search string led to a few sites that (on the surface) do seem to have something to offer the prospective SMTE operator (see e.g. the ‘Tourism Business Development Toolbox’ at http://www.uwex.edu/ces/cced/tourism/).
Nevertheless (while admitting that our analysis was less than comprehensive), few of these online, tourism-related, business planning websites appear to be well-grounded in the holistic (or systemic) view of the ‘sustainable tourism system’. This view is considered by some (e.g. Gammack et al. 2004, p. 1) to have its roots in the work of Brundtland (1987) and its many manifestations include the Mill and Morrison (2002) model (focusing on a ‘chicken-and-egg’ like relationship between consumer travel decisions and destination marketing), the ‘triple bottom line’ concept (Elkington 1999; Adams et al. 2004) (encompassing the natural, economic and cultural/social environments), and the ‘competitive destination’ model of Ritchie and Crouch (2003). The WTO (1998) defines a sustainable tourism destination as a region where:
‘---- tourism development meets the needs of present tourists and host regions while protecting and enhancing opportunities for the future. It is envisaged as leading to management of all resources in such a way that economic, social and aesthetic needs can be fulfilled while maintaining cultural integrity, essential ecological processes, biological diversity and life support systems.’
System Dynamics The holistic view of a tourism destination seems to be now almost universally accepted among researchers and policy makers (if not industry practitioners) and, given this, it is perhaps a little surprising that greater advantage has not been taken of methods, tools and techniques commonly employed in SD (or ‘systems thinking’) research and implementation to assist in the development of better business practices amongst SMTEs. SD has its origins in the work of Forrester (1961) and, more recently, has enjoyed something of a resurgence – largely due to Peter
2
SMALL TOURISM ENTERPRISE PLANNING SIMULATOR (STEPS) Senge’s (1990) very influential work on ‘the learning organisation’, and to the development and release of easy-to-use, powerful, SD-based software modelling and simulation tools (such as iThink, Vensim and Powersim). Recent examples of where SD has been used to good effect in tourism include the ‘Tourism Futures Simulator’ of Walker et al. (1999), the hotel value chain modelling work of Georgantzas (2003), the tourism multipliers model of Loutif et al. (2000), and the information architecture modelling work of McGrath and More (2005).
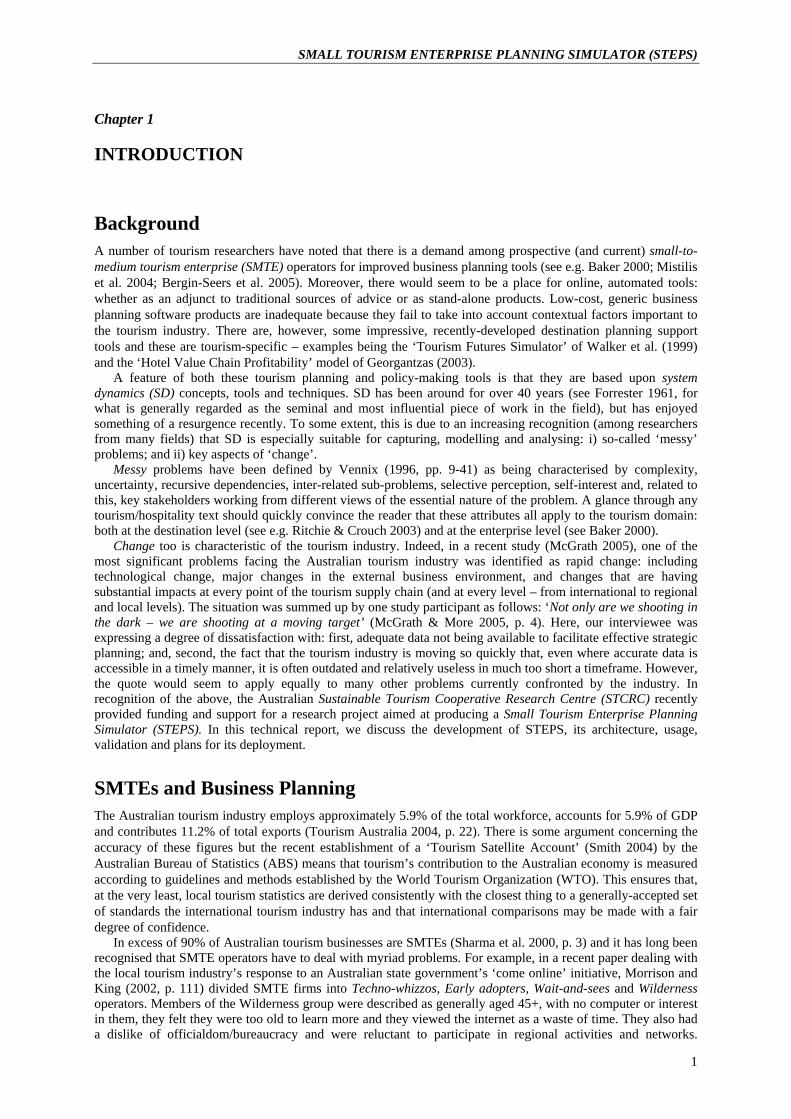
Within Powersim, models are developed in what is referred to as stock-flow format and a simple model is presented in Figure 1.
Region Attractiveness
RAVarn
EnterpriseDevelopmentEDVarn
IofRAonED
IofEDonRD
Region Development
RDVarn
Environment Quality
EQVarn
IofRDonEQ
EnterpriseCompetitionECVarn
IofRDonEC
IofEQonRA
IofEConED
Figure 1: Example of a SD model - stock-flow form
The basic building blocks of SD models are stocks (represented as rectangles), flows (represented as arrows
with circular flow regulators attached) and converters (represented as circles). In our model, examples of stocks are Region Attractiveness, Enterprise Development and Region Development. There is a level associated with each stock, which can be an actual value or a value bounded by some artificial scale. Region Attractiveness (and, indeed, all stocks in our example) is measured on a 0-200 scale and we have set the system up so that, when the value of every stock level is at 100, the system is in equilibrium. Stock levels vary with flows, which may be inflows, outflows or bidirectional. For example, RDVarn (Region Development Variation) is a bidirectional flow such that:
Region Developmentt = f(Region Developmentt-1, RDVarnt).
That is, in our model, the region development level at time, t, is a function of the region development level at time, t-1, and the region development variation at time, t. These equations are the foundation of Powersim’s formidable simulation capabilities. The third of our basic constructs, converters, serve a utilitarian role: they hold values for constants, calculate mathematical relationships and serve as repositories for graphical functions. In general, they convert inputs into outputs (hence, the name, ‘converter’).
Earlier (see the introductory section), we noted that many issues and problems associated with tourism fall into a class of organisational problems defined by Vennix (1996, pp. 13-41) as ‘messy’ and that problems of this type are characterised by complexity, uncertainty, interrelated sub-problems, recursive dependencies and multiple interpretations of the problem’s essence. He then makes the claim that among the key factors that impede our ability to resolve messy problems are: 1) limitations on our cognitive powers; 2) a tendency to grossly oversimplify or circumscribe complex problems; and 3) an inability to comprehend multiple, related feedback loops. Finally, he argues that a SD approach has the potential to overcome many of these problems and, furthermore, that (collaborative) development of a model may foster consensus, perhaps leading to increased acceptance of whatever decision is eventually taken. A considerable body of research has focused on
3
Managing Complexity in Tourism Enterprise Planning understanding, and improving, benefits that can accrue during group model building using system dynamic modelling tools (see e.g. Vennix 1996; Morecroft 1994; de Geus 1994; Anderson, Richardson & Vennix 1997; and Richmond 1997). If used judiciously, group modelling with SD tools can assist in mastering the learning problems listed above, as well as addressing the different viewpoints and beliefs which participants from various functional areas bring with them to any learning or decision making exercise.
Although the model presented in Figure 1 is a substantially simplified version of that actually developed during our research, the complexity of the problem domain is clearly evident. This applies particularly to the feedback loops. For example: region attractiveness has an impact on enterprise development, enterprise development has an impact on region development, region development has an impact on the quality of the environment and the environment, in turn, has an impact on region attractiveness (thus leading us back to our starting point). Another feedback loop is: Enterprise Development -> Region Development -> Enterprise Competition -> Enterprise Development. That is, an increase in enterprise development will (generally) result in an increase in region development which, in turn, might be expected to increase enterprise competition within the region. Finally, the increased enterprise competition may well lead to a decrease in enterprise development. This is an example of what the SD community refer to as a balancing loop: i.e. enterprise competition acts as an inhibitor to unrestricted growth within the region. Another example of a growth inhibitor is environment quality.
Thus, our model contains a number of feedback loops. Vennix (op. cit.), however, claims that many people are unable, at best, to understand the dynamics of a single feedback loop. Once multiple feedback loops are involved, even people who are experienced at interpreting feedback are unable to ascertain the behaviour of a system without resorting to a computer simulation (Dangerfield & Roberts 1995; Anderson et al. 1997). During our research, we were able to adjust specific variables and observe the impact on other variables, over time, (through graphs automatically generated by Powersim’s risk analysis software). This considerably assisted our end-users in improving their understanding of the complex, dynamic relationships present in the system. Vennix (op. cit.) has argued that an advantage of involving decision makers from various areas in group modelling exercises is that they begin to understand that their actions not only affect their own areas and interests but may have major impacts on other stakeholders as well. This, in turn, may result in improved collaboration within the model development exercise itself.
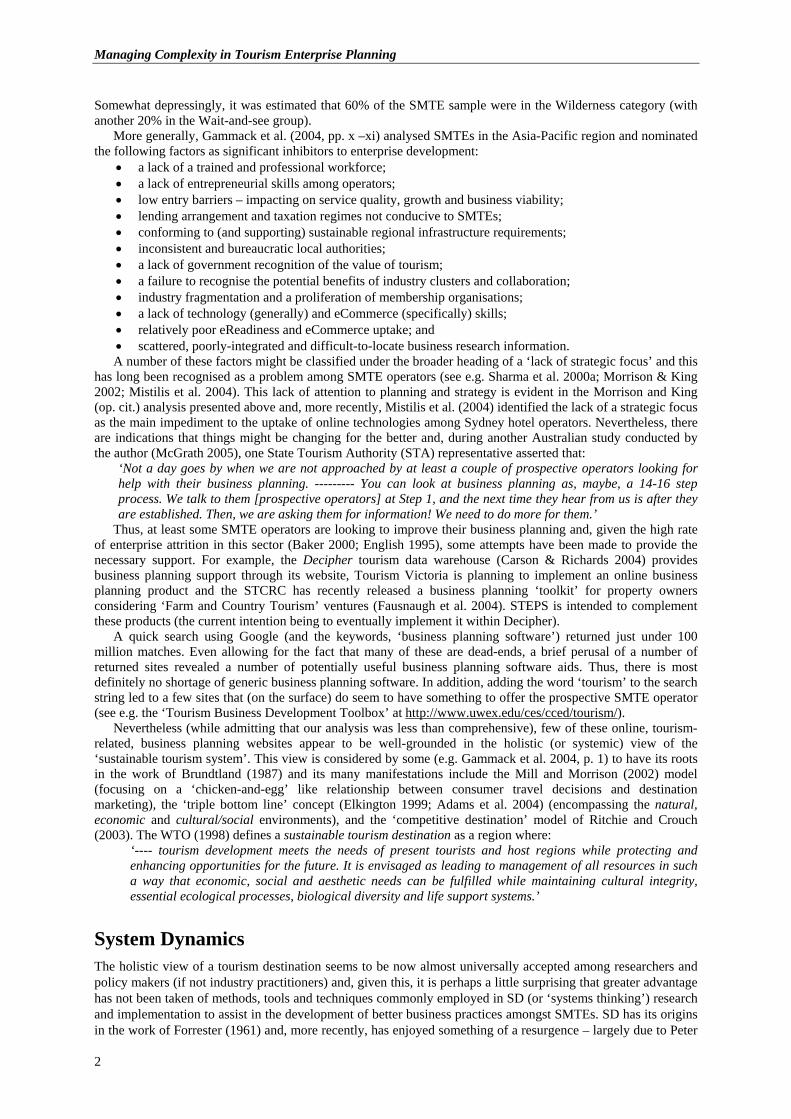
Figure 2: CLD example - unintended consequences of a well-meaning action
Stock-flow models, however, are not all that suitable for collaborative model development, where end-users
have significant input. In their most basic form though, SD models are represented as causal loop diagrams (CLDs). A feature of CLDs is that they are both powerful and simple, relying as they do on just one fundamental construct: two variables, connected by an arrow, indicating a causal relationship. An example is presented in Figure 2, illustrating the ‘tragedy of the commons’ archetype (Roberts et al. 1983), exemplified by the situation where, with cattle grazing on common land, incentives for individuals to increase herd size lead to overgrazing, eventual famine and loss of livelihood (short-term benefits leading to long-term disaster).
The illustration presented in Figure 2 is taken from an actual case (WTO 1998) concerning sub-Saharan African nomads who had survived sustainably in steady state for thousands of years. A well-meaning injection of aid in the 1950s resulted in a short-term lifespan and standard-of-living increase (mainly through new medicines and greater resource usage brought about by digging deeper wells). This, however, threw the system out of
4
SMALL TOURISM ENTERPRISE PLANNING SIMULATOR (STEPS) balance, leading to a longer-term agricultural and cattle grazing resource decrease, desertification, stock losses, eventual famine and an increase in deaths.
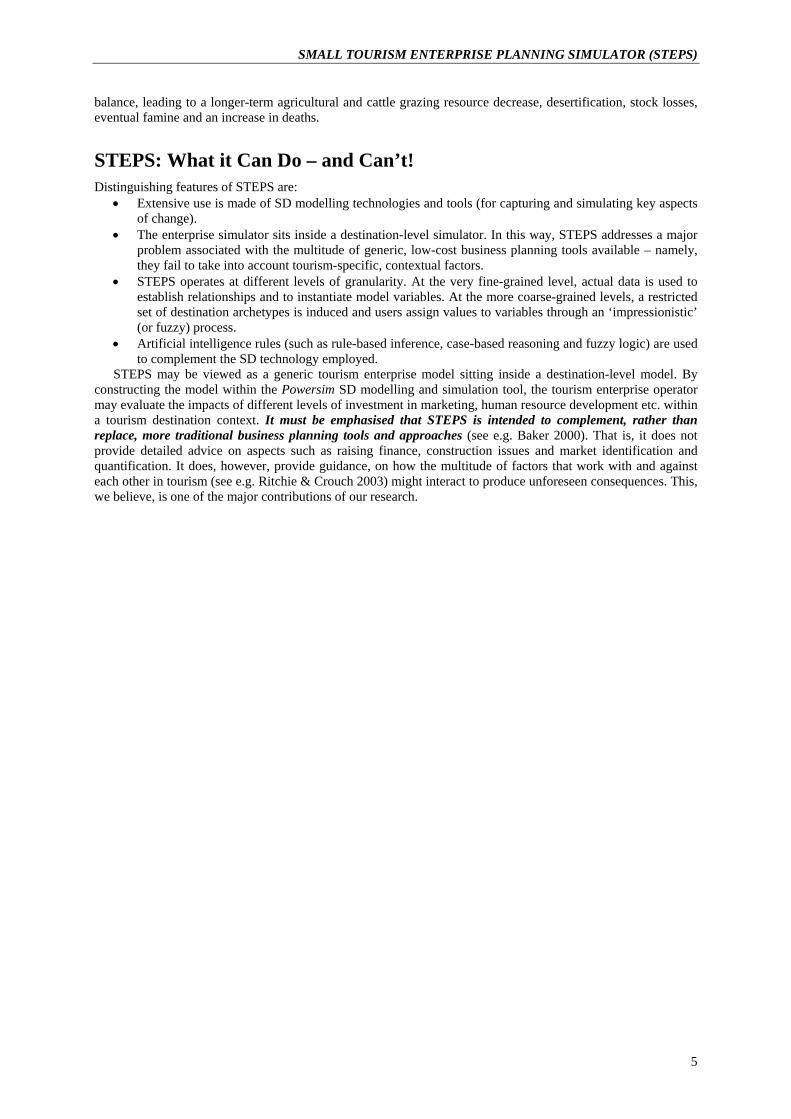
STEPS: What it Can Do – and Can’t! Distinguishing features of STEPS are:
• Extensive use is made of SD modelling technologies and tools (for capturing and simulating key aspects of change).
• The enterprise simulator sits inside a destination-level simulator. In this way, STEPS addresses a major problem associated with the multitude of generic, low-cost business planning tools available – namely, they fail to take into account tourism-specific, contextual factors.
• STEPS operates at different levels of granularity. At the very fine-grained level, actual data is used to establish relationships and to instantiate model variables. At the more coarse-grained levels, a restricted set of destination archetypes is induced and users assign values to variables through an ‘impressionistic’ (or fuzzy) process.
• Artificial intelligence rules (such as rule-based inference, case-based reasoning and fuzzy logic) are used to complement the SD technology employed.
STEPS may be viewed as a generic tourism enterprise model sitting inside a destination-level model. By constructing the model within the Powersim SD modelling and simulation tool, the tourism enterprise operator may evaluate the impacts of different levels of investment in marketing, human resource development etc. within a tourism destination context. It must be emphasised that STEPS is intended to complement, rather than replace, more traditional business planning tools and approaches (see e.g. Baker 2000). That is, it does not provide detailed advice on aspects such as raising finance, construction issues and market identification and quantification. It does, however, provide guidance, on how the multitude of factors that work with and against each other in tourism (see e.g. Ritchie & Crouch 2003) might interact to produce unforeseen consequences. This, we believe, is one of the major contributions of our research.
5
Managing Complexity in Tourism Enterprise Planning
Chapter 2
METHODOLOGY
The starting premise for this research was that: i) an information system built primarily upon system dynamics principles, tools and techniques, may be used to formally model the operations of tourism enterprises within the wider tourism system; and ii) that such a system may be useful to the owners and operators of these enterprises in their business planning.
Current taxonomies of information systems research methods (e.g. Galliers 1991; Neuman 1994) clearly distinguish between basic and applied research. The former is concerned with theory building and knowledge advancement. Burstein (2002) has argued that, to some extent, this kind of research can only be conducted once a field of study has reached a certain level of maturity and all relevant parameters have been specified to a point where they may be clearly represented as one or more theories. Alternatively, applied research targets a specific problem, one example of which is concerned with the implementation and processing of an information system. One aim of this type of research is to enable practitioners to be better informed about their domain of operation and perform their work more efficiently and effectively.
The above has been the cause of considerable debate. However, over the years a degree of consensus does appear to have been reached concerning the notion of an information system (in itself) as the core of a research design and, certainly, as the model of a theory to be tested (see e.g. Nunamaker & Chen 1990; Parker et al. 1994; and Burstein 2002). In particular, there appears to be a fair degree of agreement that an information system may play the role of the essential entity linking technological, social and organisational research. Moreover, Parker et al. (1994) argue that this may only be realised through the actual development and implementation of the relevant system. This is the essence of the research approach adopted in this project: i.e. the STEPS system itself is a model of the tourism enterprise within its wider system and its accuracy and completeness may be validated by the extent to which its predictions (simulation outputs) correspond with reality (and the degree to which practitioners find the model useful).
The research approach was based around the following four phases.
Phase 1: Literature Review and High-Level Conceptual Design The SD and tourism literature bases were reviewed, with a focus on business planning in general, the management of SMTEs and applications of SD in the T&H domain. Based largely on this review, a very high-level STEPS design was produced.
Phase 2: Requirements Refinement The high-level design produced out of Phase 1 was translated into a ‘rough’ Powersim prototype. This prototype was then demonstrated to a sample of key industry stakeholders (including the Industry Reference Group) and researchers. The system requirements were then refined based on feedback from this process.
Phase 3: Prototype Development The rough prototype produced in Phase 2 was developed as STEPS V1.0 and implemented as a stand-alone, fully-functioning demonstration system in CD-ROM form. This phase also involved initial system validation via desk checking. The aim here was to ensure that outputs produced by the system were reasonably ‘sensible’ (particularly profitability projections).
Phase 4: Online Implementation (ongoing and future work) The system will be translated into an online version and (probably) implemented within Decipher. The intention is to customise the initial implementation for a limited number of the more popular tourism regions and only one or two product types (which will certainly include accommodation enterprises). Further validation will take place during this phase (i.e. field testing).
6
SMALL TOURISM ENTERPRISE PLANNING SIMULATOR (STEPS)
Chapter 3
STEPS ARCHITECTURE AND USAGE
Design Overview As noted previously, during the previous ten years or so a number of excellent SD simulation software packages have been developed. As with almost any software tool, each of the leading tools has their ‘disciples’ but, in our view, each of these tools has their strengths and weaknesses and tool selection often boils down to a matter of individual preference (and, oftentimes, familiarity with a previously used product). With this particular application, we opted to employ the Powersim development studio (Powersim 2003) – mainly because it has excellent functional decomposition facilities (and, as time goes by, we believe our model will need to be broken down to more precise levels of detail).
Enterprise Profitability
Enterprise Capability
Destination Performance
Region Attractiveness
Runtime Environment
Resources
Processes
Human Resources
Other Resources
External Resources
Product/Service Development
Marketing and Sales
Product/Service Delivery
Expert System
National Performance
Regional Performance
Region Type 1
Region Type 2..
Region Type 8
Input
Output
Simulation Control
Risk Analysis
Figure 3: STEPS design - functional decomposition
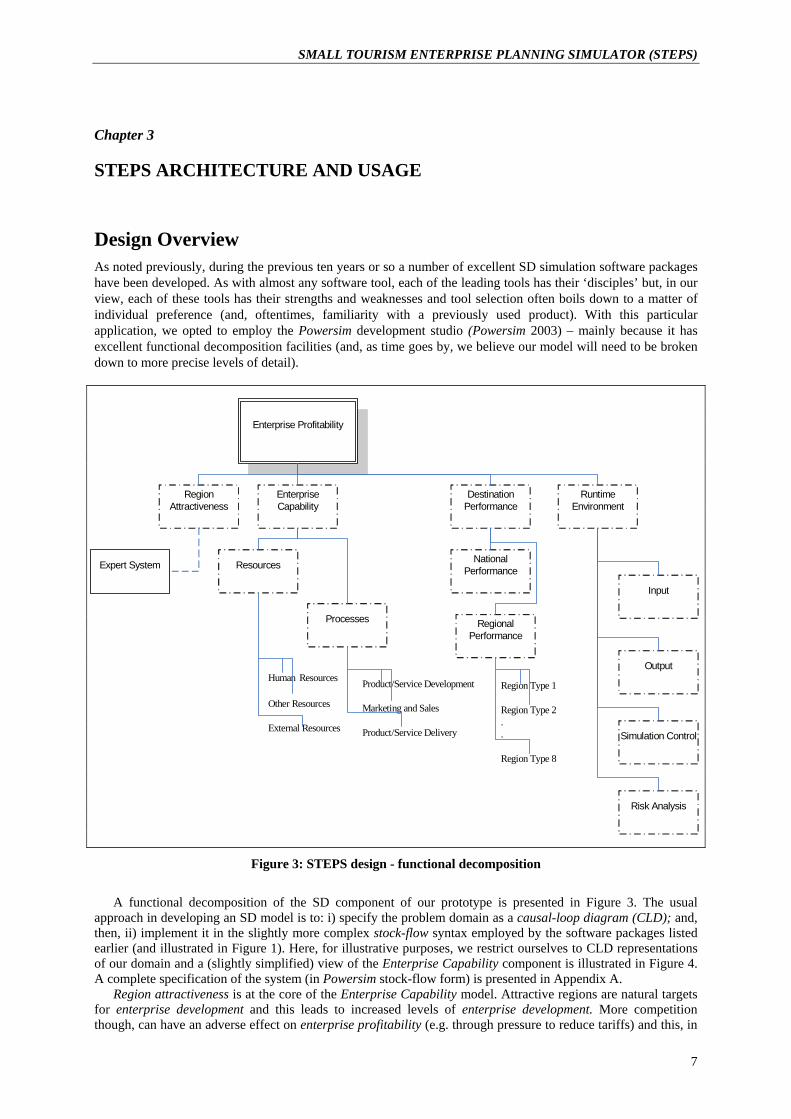
A functional decomposition of the SD component of our prototype is presented in Figure 3. The usual
approach in developing an SD model is to: i) specify the problem domain as a causal-loop diagram (CLD); and, then, ii) implement it in the slightly more complex stock-flow syntax employed by the software packages listed earlier (and illustrated in Figure 1). Here, for illustrative purposes, we restrict ourselves to CLD representations of our domain and a (slightly simplified) view of the Enterprise Capability component is illustrated in Figure 4. A complete specification of the system (in Powersim stock-flow form) is presented in Appendix A.
Region attractiveness is at the core of the Enterprise Capability model. Attractive regions are natural targets for enterprise development and this leads to increased levels of enterprise development. More competition though, can have an adverse effect on enterprise profitability (e.g. through pressure to reduce tariffs) and this, in
7
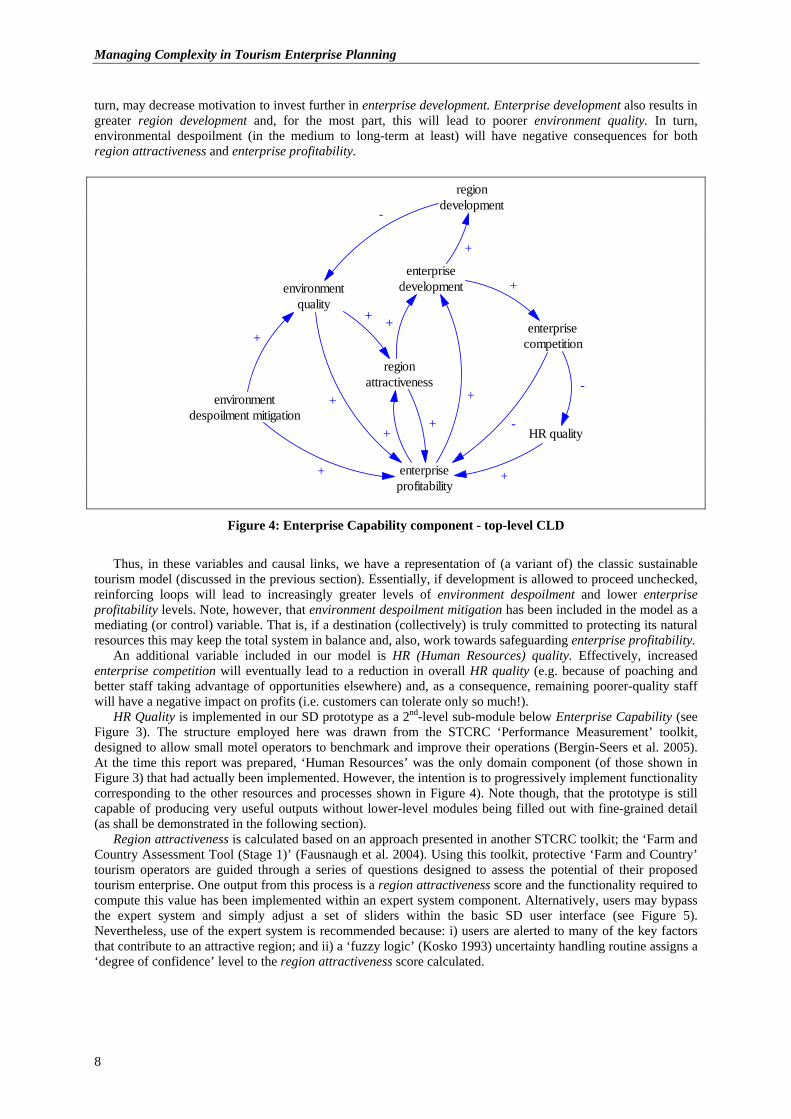
Managing Complexity in Tourism Enterprise Planning turn, may decrease motivation to invest further in enterprise development. Enterprise development also results in greater region development and, for the most part, this will lead to poorer environment quality. In turn, environmental despoilment (in the medium to long-term at least) will have negative consequences for both region attractiveness and enterprise profitability.
Figure 4: Enterprise Capability component - top-level CLD
Thus, in these variables and causal links, we have a representation of (a variant of) the classic sustainable
tourism model (discussed in the previous section). Essentially, if development is allowed to proceed unchecked, reinforcing loops will lead to increasingly greater levels of environment despoilment and lower enterprise profitability levels. Note, however, that environment despoilment mitigation has been included in the model as a mediating (or control) variable. That is, if a destination (collectively) is truly committed to protecting its natural resources this may keep the total system in balance and, also, work towards safeguarding enterprise profitability.
An additional variable included in our model is HR (Human Resources) quality. Effectively, increased enterprise competition will eventually lead to a reduction in overall HR quality (e.g. because of poaching and better staff taking advantage of opportunities elsewhere) and, as a consequence, remaining poorer-quality staff will have a negative impact on profits (i.e. customers can tolerate only so much!).
HR Quality is implemented in our SD prototype as a 2nd-level sub-module below Enterprise Capability (see Figure 3). The structure employed here was drawn from the STCRC ‘Performance Measurement’ toolkit, designed to allow small motel operators to benchmark and improve their operations (Bergin-Seers et al. 2005). At the time this report was prepared, ‘Human Resources’ was the only domain component (of those shown in Figure 3) that had actually been implemented. However, the intention is to progressively implement functionality corresponding to the other resources and processes shown in Figure 4). Note though, that the prototype is still capable of producing very useful outputs without lower-level modules being filled out with fine-grained detail (as shall be demonstrated in the following section).
Region attractiveness is calculated based on an approach presented in another STCRC toolkit; the ‘Farm and Country Assessment Tool (Stage 1)’ (Fausnaugh et al. 2004). Using this toolkit, protective ‘Farm and Country’ tourism operators are guided through a series of questions designed to assess the potential of their proposed tourism enterprise. One output from this process is a region attractiveness score and the functionality required to compute this value has been implemented within an expert system component. Alternatively, users may bypass the expert system and simply adjust a set of sliders within the basic SD user interface (see Figure 5). Nevertheless, use of the expert system is recommended because: i) users are alerted to many of the key factors that contribute to an attractive region; and ii) a ‘fuzzy logic’ (Kosko 1993) uncertainty handling routine assigns a ‘degree of confidence’ level to the region attractiveness score calculated.
regionattrac eness
enterprisevelopment
regiondevelopment
enterprisecompetition
HR quality
terpriserofitability
environmentquality
environmentdespoilment mitigation
de
tiv
enp
+
+
+
-
-
+
+
++
-
+
+
+
+
8
SMALL TOURISM ENTERPRISE PLANNING SIMULATOR (STEPS)
9
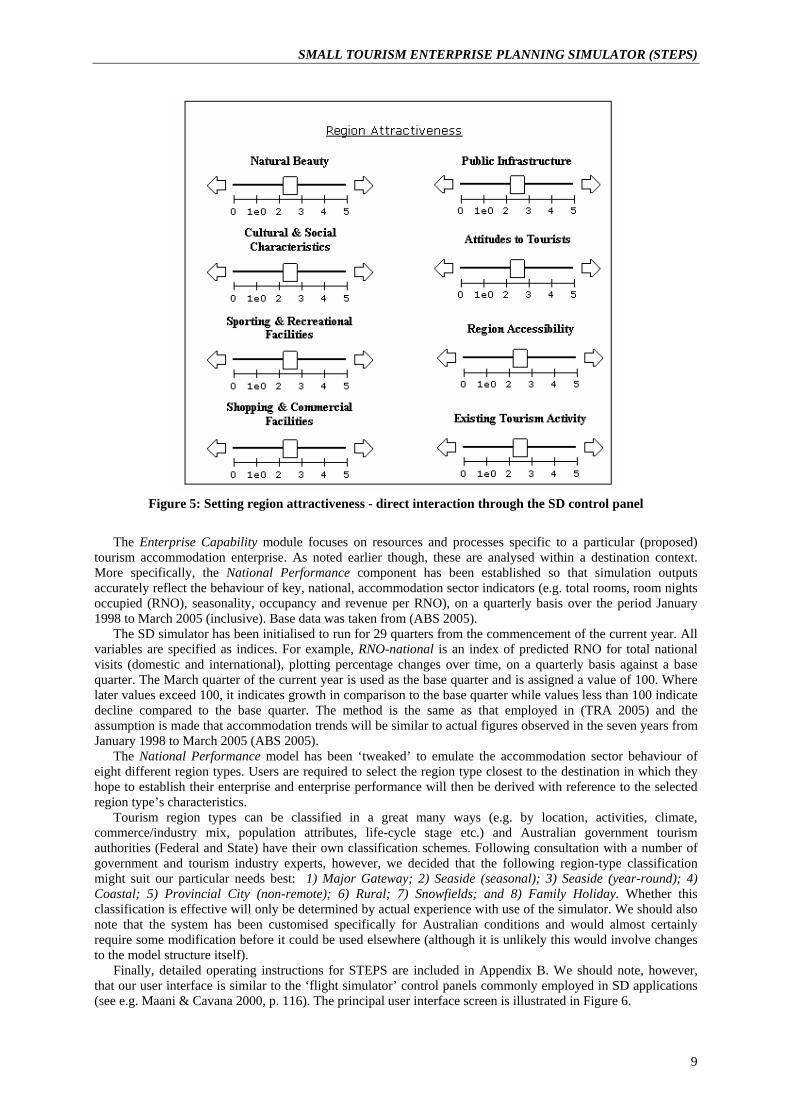
Figure 5: Setting region attractiveness - direct interaction through the SD control panel
The Enterprise Capability module focuses on resources and processes specific to a particular (proposed)
tourism accommodation enterprise. As noted earlier though, these are analysed within a destination context. More specifically, the National Performance component has been established so that simulation outputs accurately reflect the behaviour of key, national, accommodation sector indicators (e.g. total rooms, room nights occupied (RNO), seasonality, occupancy and revenue per RNO), on a quarterly basis over the period January 1998 to March 2005 (inclusive). Base data was taken from (ABS 2005).
The SD simulator has been initialised to run for 29 quarters from the commencement of the current year. All variables are specified as indices. For example, RNO-national is an index of predicted RNO for total national visits (domestic and international), plotting percentage changes over time, on a quarterly basis against a base quarter. The March quarter of the current year is used as the base quarter and is assigned a value of 100. Where later values exceed 100, it indicates growth in comparison to the base quarter while values less than 100 indicate decline compared to the base quarter. The method is the same as that employed in (TRA 2005) and the assumption is made that accommodation trends will be similar to actual figures observed in the seven years from January 1998 to March 2005 (ABS 2005).
The National Performance model has been ‘tweaked’ to emulate the accommodation sector behaviour of eight different region types. Users are required to select the region type closest to the destination in which they hope to establish their enterprise and enterprise performance will then be derived with reference to the selected region type’s characteristics.
Tourism region types can be classified in a great many ways (e.g. by location, activities, climate, commerce/industry mix, population attributes, life-cycle stage etc.) and Australian government tourism authorities (Federal and State) have their own classification schemes. Following consultation with a number of government and tourism industry experts, however, we decided that the following region-type classification might suit our particular needs best: 1) Major Gateway; 2) Seaside (seasonal); 3) Seaside (year-round); 4) Coastal; 5) Provincial City (non-remote); 6) Rural; 7) Snowfields; and 8) Family Holiday. Whether this classification is effective will only be determined by actual experience with use of the simulator. We should also note that the system has been customised specifically for Australian conditions and would almost certainly require some modification before it could be used elsewhere (although it is unlikely this would involve changes to the model structure itself).
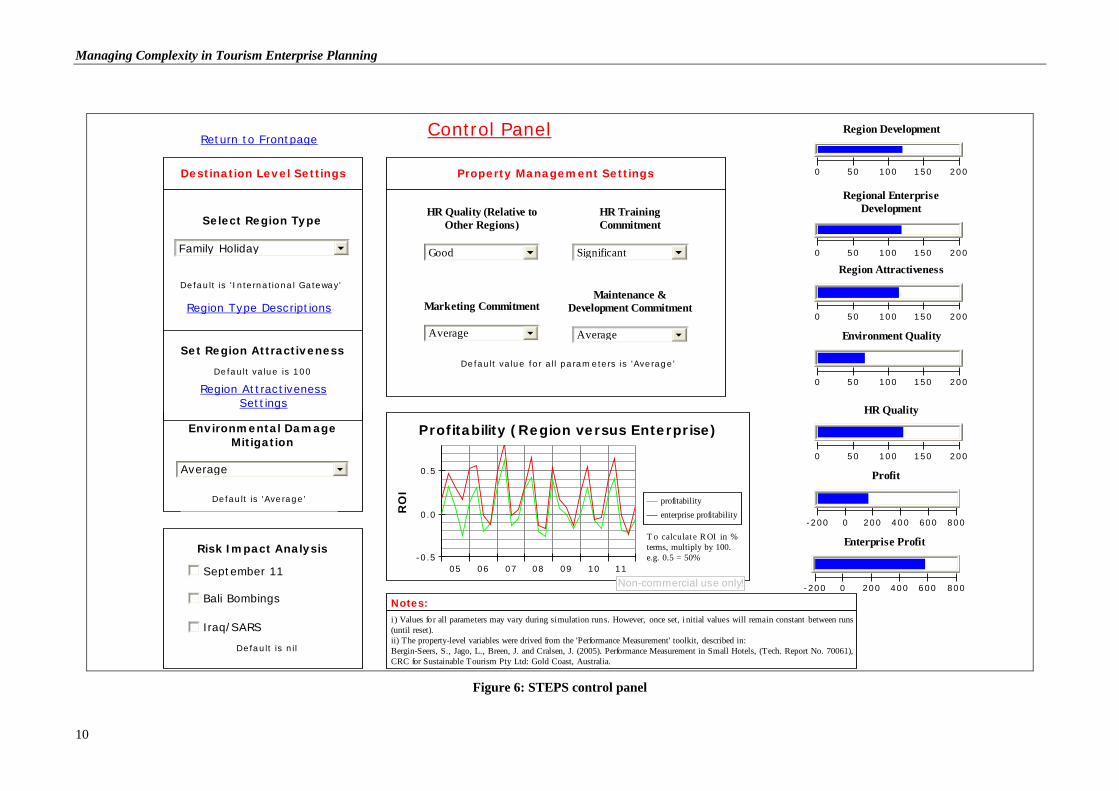
Finally, detailed operating instructions for STEPS are included in Appendix B. We should note, however, that our user interface is similar to the ‘flight simulator’ control panels commonly employed in SD applications (see e.g. Maani & Cavana 2000, p. 116). The principal user interface screen is illustrated in Figure 6.
Managing Complexity in Tourism Enterprise Planning
Select Region Type
6Family Holiday
Environmental DamageMitigation
6Average
HR Quality (Relative toOther Regions)
6Good
HR TrainingCommitment
6Significant
Marketing Commitment
6Average
Maintenance &Development Commitment
6Average
Region Development
0 50 100 150 200
Regional EnterpriseDevelopment
0 50 100 150 200
Region Attractiveness
0 50 100 150 200
Environment Quality
0 50 100 150 200
Profitability (Region versus Enterprise)
05 06 07 08 09 10 11-0.5
0.0
0.5
profitabilityenterprise profitabilityR
OI
Non-commercial use only!
HR Quality
0 50 100 150 200
Profit
-200 0 200 400 600 800
Enterprise Profit
-200 0 200 400 600 800
Default is 'International Gateway'
Set Region Attractiveness
Default value is 100
Default is 'Average'
Control Panel
Property Management SettingsDestination Level Settings
Default value for all parameters is 'Average'
i ) Values for all parameters may vary during simulation runs. However, once set, i nitial values will remain constant between runs(until reset).ii) The property-level variables were drived from the 'Performance Measurement' toolkit, described in:Bergin-Seers, S., Jago, L., Breen, J. and Cralsen, J. (2005). Performance Measurement in Small Hotels, (Tech. Report No. 70061),CRC for Sustainable Tourism Pty Ltd: Gold Coast, Australia.
Notes:
T o calculat e R OI in %terms, multiply by 100.e.g. 0.5 = 50%
Bali Bombings
September 11
Iraq/SARS
Risk Impact Analysis
Default is nil
Region Type Descriptions
Region AttractivenessSettings
Return to Frontpage
Figure 6: STEPS control panel
10
SMALL TOURISM ENTERPRISE PLANNING SIMULATOR (STEPS) STEPS Usage Scenario 1: Basic Usage Assume that we wish to examine the feasibility of setting up a motel in Anglesea – a small coastal town, about 70 minutes drive south-west of Melbourne. It has a superb surf beach and a fairly small population (chiefly retirees, commuters seeking a better lifestyle and ‘weekenders’ – mostly from Melbourne). The town has a large influx of tourists during the warmer months (particularly from December through to April) but experiences a significant drop-off in overnight visitors at other times – despite the town being right in the middle of the gateway to (the Australian state of) Victoria’s major tourist attraction, the Great Ocean Road. In recent years, real estate prices have gone ‘through the roof’: mainly because of a massive increase in demand from prospective ‘lifestylers’ and holiday-home buyers, and limited capacity to increase housing supply and supporting infrastructure (without eating into surrounding coastal, national park and farming areas). The town has little in the way of industry and commerce outside of tourism-related enterprises but the wider region supports substantial farming activity.
Firstly, region attractiveness determinants have to be initialised. We elect to do this via the SD control panel (see Figure 5) which yields a score of 130 (on a 0-200 scale). This relatively-good score is largely the result of the assignment of maximum (or close to maximum) values for Natural Beauty, Sports & Recreational Facilities, Existing Tourism Activity and Public Infrastructure. These, however, are partly balanced by the assignment of comparatively-weak values to Cultural & Social Characteristics, Shopping & Commercial Facilities and Attitudes to Tourists.
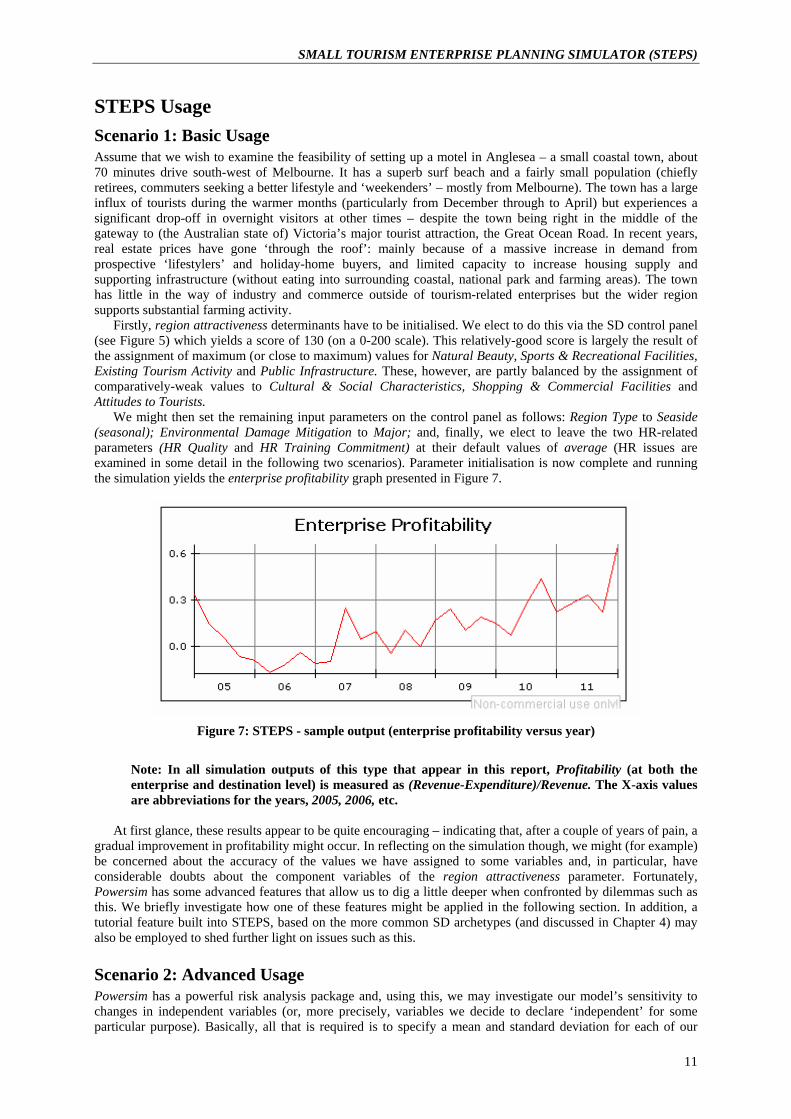
We might then set the remaining input parameters on the control panel as follows: Region Type to Seaside (seasonal); Environmental Damage Mitigation to Major; and, finally, we elect to leave the two HR-related parameters (HR Quality and HR Training Commitment) at their default values of average (HR issues are examined in some detail in the following two scenarios). Parameter initialisation is now complete and running the simulation yields the enterprise profitability graph presented in Figure 7.
Figure 7: STEPS - sample output (enterprise profitability versus year)
Note: In all simulation outputs of this type that appear in this report, Profitability (at both the enterprise and destination level) is measured as (Revenue-Expenditure)/Revenue. The X-axis values are abbreviations for the years, 2005, 2006, etc.
At first glance, these results appear to be quite encouraging – indicating that, after a couple of years of pain, a
gradual improvement in profitability might occur. In reflecting on the simulation though, we might (for example) be concerned about the accuracy of the values we have assigned to some variables and, in particular, have considerable doubts about the component variables of the region attractiveness parameter. Fortunately, Powersim has some advanced features that allow us to dig a little deeper when confronted by dilemmas such as this. We briefly investigate how one of these features might be applied in the following section. In addition, a tutorial feature built into STEPS, based on the more common SD archetypes (and discussed in Chapter 4) may also be employed to shed further light on issues such as this.
Scenario 2: Advanced Usage Powersim has a powerful risk analysis package and, using this, we may investigate our model’s sensitivity to changes in independent variables (or, more precisely, variables we decide to declare ‘independent’ for some particular purpose). Basically, all that is required is to specify a mean and standard deviation for each of our
11
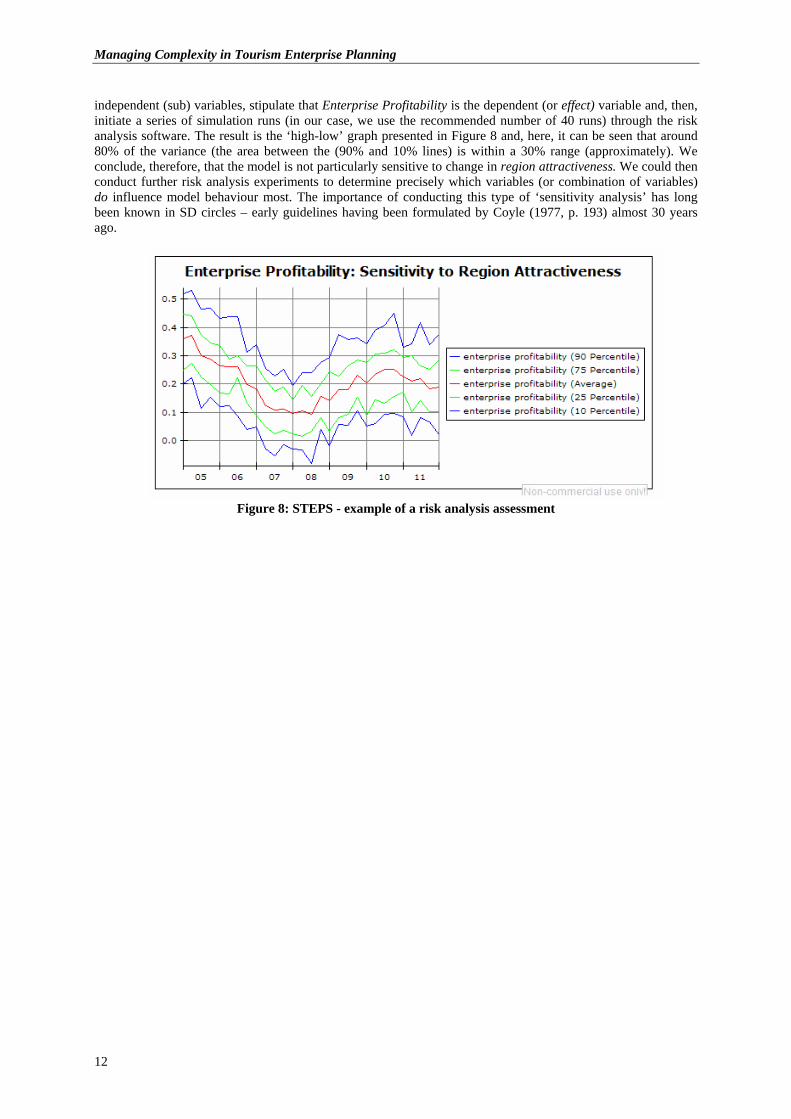
Managing Complexity in Tourism Enterprise Planning independent (sub) variables, stipulate that Enterprise Profitability is the dependent (or effect) variable and, then, initiate a series of simulation runs (in our case, we use the recommended number of 40 runs) through the risk analysis software. The result is the ‘high-low’ graph presented in Figure 8 and, here, it can be seen that around 80% of the variance (the area between the (90% and 10% lines) is within a 30% range (approximately). We conclude, therefore, that the model is not particularly sensitive to change in region attractiveness. We could then conduct further risk analysis experiments to determine precisely which variables (or combination of variables) do influence model behaviour most. The importance of conducting this type of ‘sensitivity analysis’ has long been known in SD circles – early guidelines having been formulated by Coyle (1977, p. 193) almost 30 years ago.
Figure 8: STEPS - example of a risk analysis assessment
12
SMALL TOURISM ENTERPRISE PLANNING SIMULATOR (STEPS)
Chapter 4
SYSTEM DYNAMICS ARCHETYPES
SD Archetypes: Background Model presented to this point have been specified at a fairly high level. Already though, a degree of complexity is apparent and this illustrates one of the benefits of SD modelling as claimed by its proponents: specifically, the approach can counter our tendency to over-simplify complex problems and issues into simple cause-effect relationships we can readily understand within the limits of our cognitive powers (Vennix 1996). Of course, this is true of many conceptual modelling approaches and each of these has their own strengths and weaknesses. SD, however, is particularly well-suited to domains where feedback loops and time are significant (Richardson & Pugh 1981) and both of these feature prominently in tourism models (see e.g. Ritchie & Crouch 2003, pp. 60-78).
A further strength of SD models is that, in basic CLD form, they are comprised of combinations of only one, simple construct (a causal connection between two variables), meaning that key stakeholders and end-users may readily contribute to modelling sessions. As noted earlier, CLD models are generally implemented in the stock-flow form favoured by the more popular SD software packages. This increases complexity but it also enables the specification of critical concepts such as delays, queues, events and major environmental perturbations (e.g. the impacts of SARS or the recent, dramatic increase in global oil prices).
At the same time, the more variables a problem has, the more difficult it is to solve. In fact, problem difficulty tends to increase exponentially with the number of variables. Thus, (seemingly) simple systems can rapidly become very complex – and, even, the gentle introductory examples presented to date should leave little doubt that, in tourism, we are dealing with a very complex system.
Nevertheless, systems thinking researchers have found that, even in extremely complex SD models, certain patterns recur time and again. In addition, such patterns are often associated with specific types of systems behaviour and this, in turn, can sometimes alert us to tread warily in our decision making. In the SD literature, these generic patterns are referred to as system archetypes (Bellinger 1999; Maani & Cavana 2000) and a thorough understanding of these improves our ability to both: i) understand how systems work; and, perhaps more importantly, to: ii) comprehend and interpret the consequences of our decisions. There are eight generally-acknowledged basic SD archetypes, first identified by the ‘System Dynamics Group’ at MIT. The STEPS model contains a number of these classic archetypes and we investigate four of these further in the remainder of this section.
The Fixes that Fail System Archetype The fixes that fail archetype is a generic instance of a fairly simple (but common) problem, where a fix designed to alleviate some problem (real or perceived) results in unintended consequences. These consequences counteract the intended fix, with the result that no real progress towards a fundamental solution is made.
In this example, we look at a case where the user plays the role of a prospective hotel/motel operator intending to set up in a rural region: i) where there is not much available in the way of good tourism and hospitality (T&H) staff; and ii) where the user intends to compensate for this through intensive (and ongoing) training. To investigate the consequences of this, the user is invited to: set Region to Rural; HR Quality to Poor; and, finally, run the simulation several times alternating the Training Commitment parameter between Significant and All out. Typical results of this exercise are illustrated in Figure 9.
13
Managing Complexity in Tourism Enterprise Planning
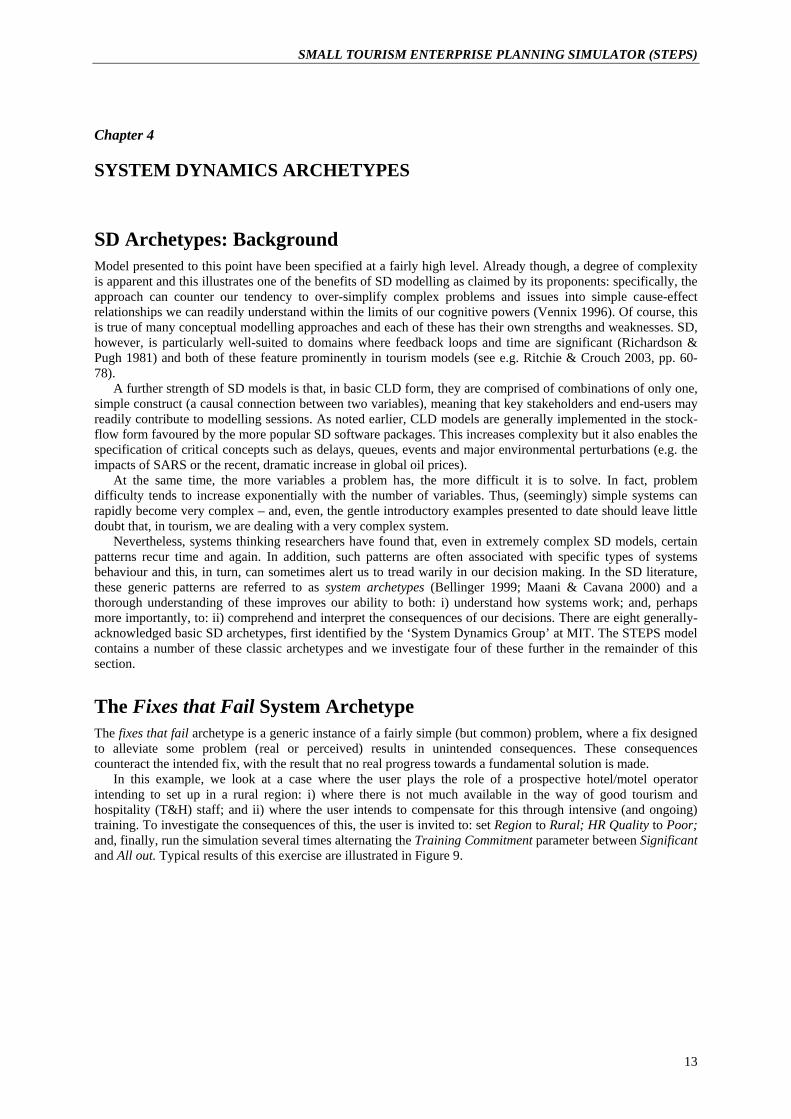
Figure 9: Typical outputs from running the STEPS fixes that fail archetype example
In general, simulations with a significant training commitment outperform those where the parameter is set to
‘all out’. In particular, with the former, enterprise profits (i.e. profits for the user’s hotel/motel) outperform the average profit performance for the region as a while, with the latter, the reverse is generally true. So, what has occurred here: i.e. if ‘significant’ training produces goods results, would it not be reasonable to expect that more training should produce even better results?
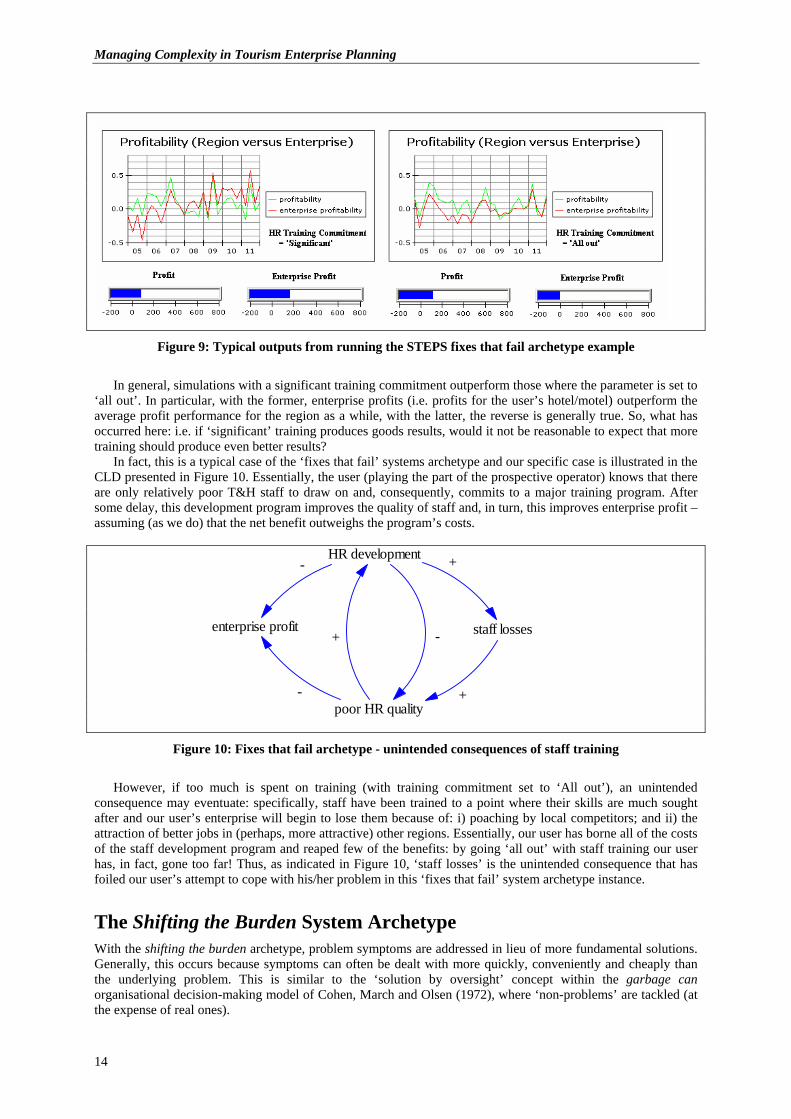
In fact, this is a typical case of the ‘fixes that fail’ systems archetype and our specific case is illustrated in the CLD presented in Figure 10. Essentially, the user (playing the part of the prospective operator) knows that there are only relatively poor T&H staff to draw on and, consequently, commits to a major training program. After some delay, this development program improves the quality of staff and, in turn, this improves enterprise profit – assuming (as we do) that the net benefit outweighs the program’s costs.
poor HR quality
HR development
staff lossesenterprise profit+ -
+
+
-
-
Figure 10: Fixes that fail archetype - unintended consequences of staff training
However, if too much is spent on training (with training commitment set to ‘All out’), an unintended
consequence may eventuate: specifically, staff have been trained to a point where their skills are much sought after and our user’s enterprise will begin to lose them because of: i) poaching by local competitors; and ii) the attraction of better jobs in (perhaps, more attractive) other regions. Essentially, our user has borne all of the costs of the staff development program and reaped few of the benefits: by going ‘all out’ with staff training our user has, in fact, gone too far! Thus, as indicated in Figure 10, ‘staff losses’ is the unintended consequence that has foiled our user’s attempt to cope with his/her problem in this ‘fixes that fail’ system archetype instance.
The Shifting the Burden System Archetype With the shifting the burden archetype, problem symptoms are addressed in lieu of more fundamental solutions. Generally, this occurs because symptoms can often be dealt with more quickly, conveniently and cheaply than the underlying problem. This is similar to the ‘solution by oversight’ concept within the garbage can organisational decision-making model of Cohen, March and Olsen (1972), where ‘non-problems’ are tackled (at the expense of real ones).
14
SMALL TOURISM ENTERPRISE PLANNING SIMULATOR (STEPS)
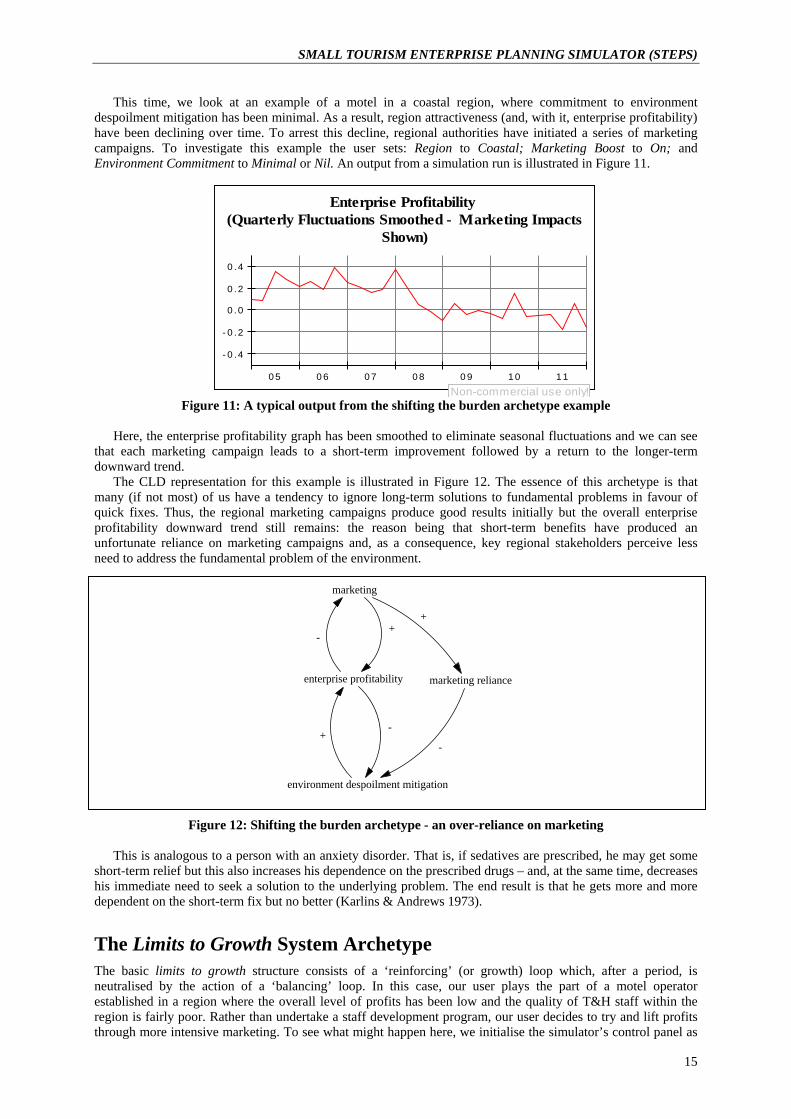
This time, we look at an example of a motel in a coastal region, where commitment to environment despoilment mitigation has been minimal. As a result, region attractiveness (and, with it, enterprise profitability) have been declining over time. To arrest this decline, regional authorities have initiated a series of marketing campaigns. To investigate this example the user sets: Region to Coastal; Marketing Boost to On; and Environment Commitment to Minimal or Nil. An output from a simulation run is illustrated in Figure 11.
Enterprise Profitability (Quarterly Fluctuations Smoothed - Marketing Impacts
Shown)
05 06 07 08 09 10 11
-0.4
-0.2
0.0
0.2
0.4
Non-commercial use only! Figure 11: A typical output from the shifting the burden archetype example
Here, the enterprise profitability graph has been smoothed to eliminate seasonal fluctuations and we can see
that each marketing campaign leads to a short-term improvement followed by a return to the longer-term downward trend.
The CLD representation for this example is illustrated in Figure 12. The essence of this archetype is that many (if not most) of us have a tendency to ignore long-term solutions to fundamental problems in favour of quick fixes. Thus, the regional marketing campaigns produce good results initially but the overall enterprise profitability downward trend still remains: the reason being that short-term benefits have produced an unfortunate reliance on marketing campaigns and, as a consequence, key regional stakeholders perceive less need to address the fundamental problem of the environment.
Figure 12: Shifting the burden archetype - an over-reliance on marketing
his is analogous to a person with an anxiety disorder. That is, if sedatives are prescribed, he may get some
sho
The Limits to Growth System Archetype g’ (or growth) loop which, after a period, is
enterprise profitability
marketing
environment despoilment mitigation
marketing reliance
+-
-+
+
-
Trt-term relief but this also increases his dependence on the prescribed drugs – and, at the same time, decreases
his immediate need to seek a solution to the underlying problem. The end result is that he gets more and more dependent on the short-term fix but no better (Karlins & Andrews 1973).
The basic limits to growth structure consists of a ‘reinforcinneutralised by the action of a ‘balancing’ loop. In this case, our user plays the part of a motel operator established in a region where the overall level of profits has been low and the quality of T&H staff within the region is fairly poor. Rather than undertake a staff development program, our user decides to try and lift profits through more intensive marketing. To see what might happen here, we initialise the simulator’s control panel as
15
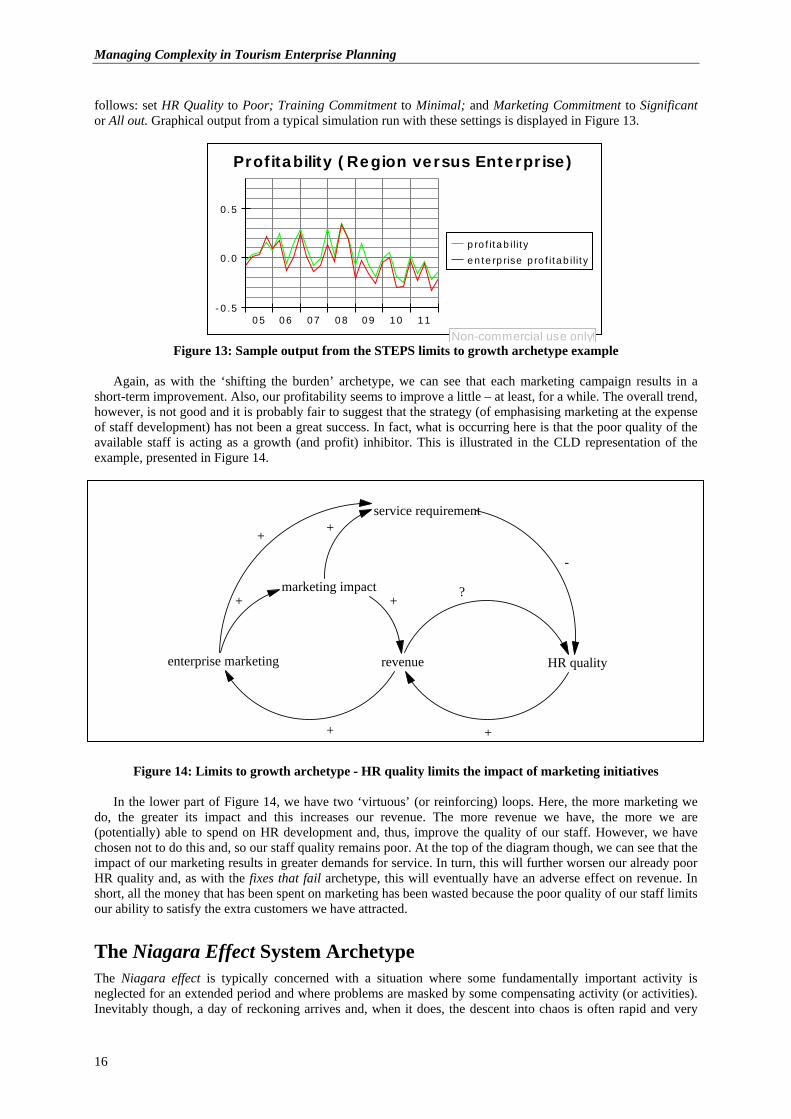
Managing Complexity in Tourism Enterprise Planning follows: set HR Quality to Poor; Training Commitment to Minimal; and Marketing Commitment to Significant or All out. Graphical output from a typical simulation run with these settings is displayed in Figure 13.
Profitability (Region versus Enterprise)
05 06 07 08 09 10 11-0.5
0.0
0.5
profitability
enterprise profitability
Non-commercial use only! Figure 13: Sample output from the STEPS limits to growth archetype exam e
gain, as with the ‘shifting the burden’ archetype, we can see that each marketing campaign results in a
sho
Figure 14: Limits to growth archetype - HR quality limits the impact of marketing initiatives
the lower part of Figure 14, we have two ‘virtuous’ (or reinforcing) loops. Here, the more marketing we
do,
where some fundamentally important activity is
pl
Art-term improvement. Also, our profitability seems to improve a little – at least, for a while. The overall trend,
however, is not good and it is probably fair to suggest that the strategy (of emphasising marketing at the expense of staff development) has not been a great success. In fact, what is occurring here is that the poor quality of the available staff is acting as a growth (and profit) inhibitor. This is illustrated in the CLD representation of the example, presented in Figure 14.
enterprise marketing
marketing impact
HR qualityrevenue
service requirement
+ +
+
+
-
?
+
+
In the greater its impact and this increases our revenue. The more revenue we have, the more we are
(potentially) able to spend on HR development and, thus, improve the quality of our staff. However, we have chosen not to do this and, so our staff quality remains poor. At the top of the diagram though, we can see that the impact of our marketing results in greater demands for service. In turn, this will further worsen our already poor HR quality and, as with the fixes that fail archetype, this will eventually have an adverse effect on revenue. In short, all the money that has been spent on marketing has been wasted because the poor quality of our staff limits our ability to satisfy the extra customers we have attracted.
The Niagara Effect System Archetype The Niagara effect is typically concerned with a situationneglected for an extended period and where problems are masked by some compensating activity (or activities). Inevitably though, a day of reckoning arrives and, when it does, the descent into chaos is often rapid and very
16
SMALL TOURISM ENTERPRISE PLANNING SIMULATOR (STEPS) painful. By this time, the underlying problems may be so bad that recovery is impossible. Stakeholders may be left wondering how things have degenerated so quickly.
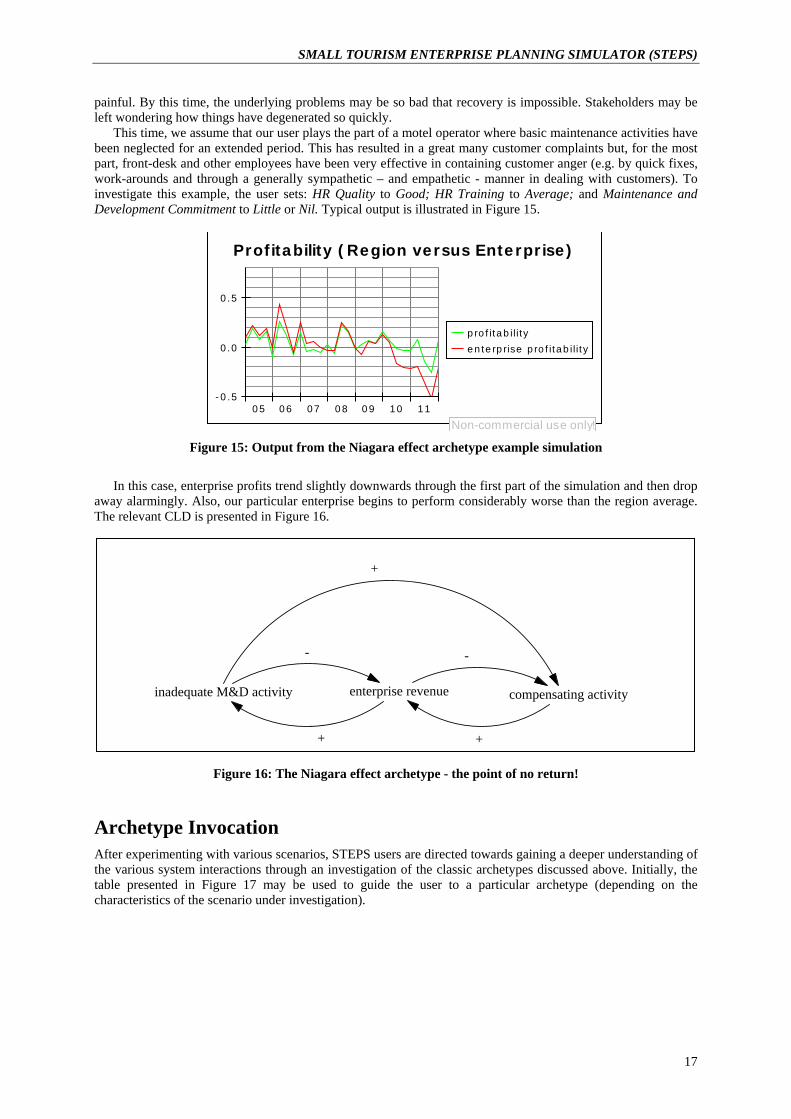
This time, we assume that our user plays the part of a motel operator where basic maintenance activities have been neglected for an extended period. This has resulted in a great many customer complaints but, for the most part, front-desk and other employees have been very effective in containing customer anger (e.g. by quick fixes, work-arounds and through a generally sympathetic – and empathetic - manner in dealing with customers). To investigate this example, the user sets: HR Quality to Good; HR Training to Average; and Maintenance and Development Commitment to Little or Nil. Typical output is illustrated in Figure 15.
Profitability (Region versus Enterprise)
05 06 07 08 09 10 11-0.5
0.0
0.5
profitability
enterprise profitability
Non-commercial use only! Figure 15: Output from the Niagara effect archetype example simulation
In this case, enterprise profits trend slightly downwards through the first part of the simulation and then drop
away alarmingly. Also, our particular enterprise begins to perform considerably worse than the region average. The relevant CLD is presented in Figure 16.
Figure 16: The Niagara effect archetype - the point of no return!
enarios, STEPS users are directed towards gaining a deeper understanding of
inadequate M&D activity enterprise revenue compensating activity
+
- -
+ +
Archetype Invocation After experimenting with various scthe various system interactions through an investigation of the classic archetypes discussed above. Initially, the table presented in Figure 17 may be used to guide the user to a particular archetype (depending on the characteristics of the scenario under investigation).
17

Managing Complexity in Tourism Enterprise Planning
Figure 17: STEPS Control Panel table for accessing system archetypes
SA1, ---, SA4 are hyperlinks which take the user to tutorials dealing with what is, essentially, the same
material presented in the four earlier sections of this chapter. However, each of these tutorials is imparted to the user as a multimedia presentation (currently constructed using Powerpoint’s animation capabilities, clipart and the TextAloud speech synthesis software package).
18
SMALL TOURISM ENTERPRISE PLANNING SIMULATOR (STEPS)
Chapter 5
SYSTEM VALIDATION
Issues in SD Model Validation To a large extent, learning (as exemplified by the SD archetypes presented in the previous section) was probably the primary inspiration for our research. This applies particularly to highlighting the importance of the ‘triple bottom line’ concept (Adams et al. 2004), where interactions within and between the environmental, social and economic tourism subsystems can, ultimately, have a major impact on enterprise profitability. Nevertheless, the fact that our simulator is capable of producing graphs of projected Enterprise Profitability, HR Quality, Regional Enterprise Competition, Region Attractiveness, Environment Quality and more is intended to act as the trigger that might prompt our targeted users to interact with the model in the first place. Thus, it seems essential that our principal outputs should be ‘sensible’ – to the extent that we must be able to convince the average user that our projections are reasonable. Consequently, the model and its implementation as STEPS must be validated and this is being accomplished via a 2-stage approach involving desk checking and field testing. Field testing is due to commence later in 2006. In this paper, we report briefly on the desk checking phase of our model validation.
SD models are notoriously difficult to validate (Richardson & Pugh 1981). As noted by Forrester and Senge (1980, pp. 209-210), there is no single test which might be employed to validate a SD model but, rather, confidence in the model accumulates gradually as it passes more tests and as new points of correspondence between the model and empirical reality are identified.
Essentially, the aim of validation is to ‘show that there is nothing in the model that is not in the real system and nothing significant in the real system that is not in the model’ (Maani & Cavana 2000, p. 69). An excellent example of how much of this can be accomplished through desk checking has been provided by Georgantzas (2003) where statistical measures, such as coefficient of determination and Theil’s Inequality Statistics (TIS) (Theil 1966), were employed to compare the predictive results of a SD model focused on various key measures of the performance of Cyprus hotels against actual data (over a 40 year period).
The basis of Theil’s approach is that the mean square error (MSE) is divided into three components: i) bias (Um); ii) unequal variation (Us); and iii) unequal co-variation (Uc). The sum of all three components equals one and, briefly, a large Um indicates a potentially serious systemic error and, to a somewhat lesser extent, this applies to Us as well. If Uc is large though, most of the error is unsystematic and, as noted by Sterman (2000, p. 877): ‘a model should not be faulted for failing to match the random component of the data’.
Desk Checking Desk checking was conducted over a 2-month period during mid-2006. The process employed was both simple and iterative, involving the following steps: i) model variables, considered to be of potential interest to users and for which actual historical data was readily available in the public domain (see e.g. ABS 2005), were identified; ii) a sequence of simulation runs (40 in each trial) was carried out for each dependent variable (identified in i) above) and relevant combinations of independent variables; iii) outputs from these trials (averaged over the 40 runs, and for each quarterly time point and independent variable combination) were compared with actual data using the TIS approach discussed above); iv) the model was ‘tweaked’ to obtain a more accurate match between simulation outputs and reality; and v) each trial was terminated once an ‘acceptable’ result was attained.
A trial (a sequence of 40 simulation runs for a particular combination of independent variables) was considered acceptable if the unequal co-variation component of the TIS output exceeded two-thirds of the total variance. Mainly because good Australian accommodation data was readily available, the validation period covered the 29 quarters between January 1998 and end-March 2005 (inclusive). Key dependent variables investigated included occupancy, revenue, revenue per room-night occupied (RevPerRNO), average revenue per room-night available (AvRevPerRNA), (average) region profitability and enterprise profitability. At the very least, simulated data was generated for each of our eight region types. In addition, for some dependent variables (particularly those at the enterprise level) various combinations of ‘sensitive’ model parameter values (e.g. marketing commitment levels) were tested. Finally, 40 simulation runs were required for each trial because the STEPS model is stochastic – in the sense that a significant element of chance has been built into the model at sensitive points.
This latter point is illustrated in Figure 18, which contains the results of one of our trials – generated using Powersim’s ‘risk analysis’ software package. Essentially, this (high-low) graph indicates that (in the particular
19
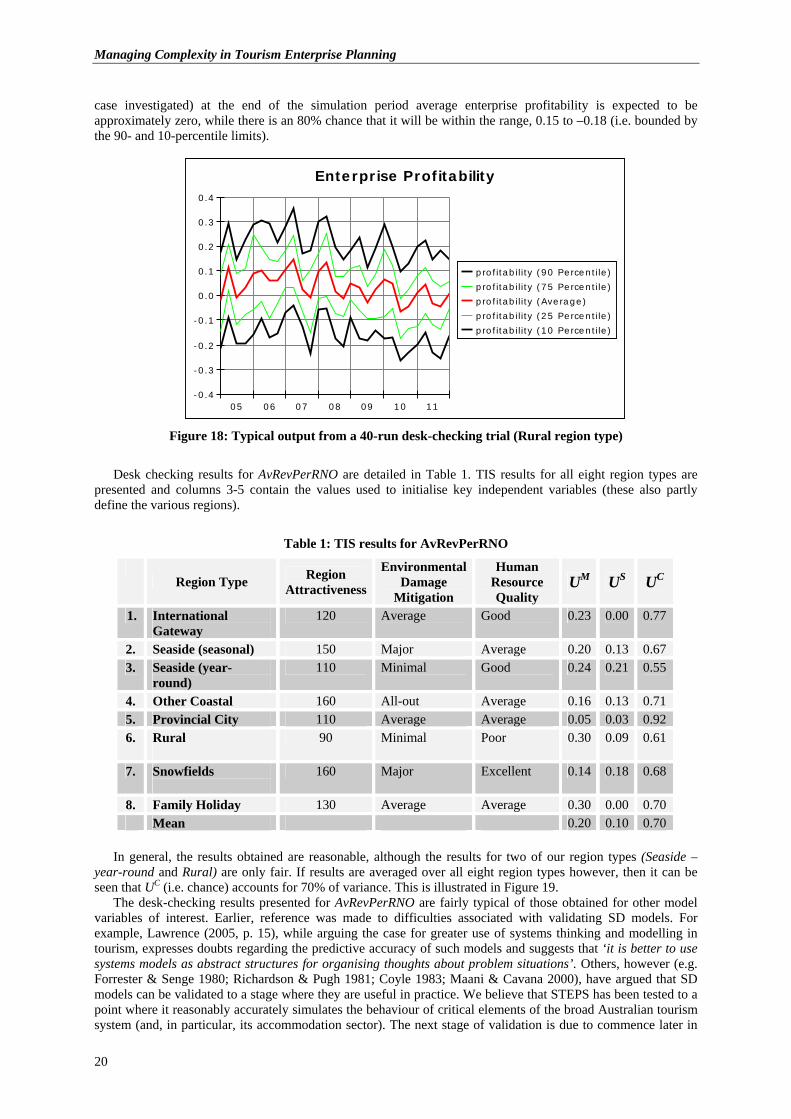
Managing Complexity in Tourism Enterprise Planning case investigated) at the end of the simulation period average enterprise profitability is expected to be approximately zero, while there is an 80% chance that it will be within the range, 0.15 to –0.18 (i.e. bounded by the 90- and 10-percentile limits).
Enterprise Profitability
05 06 07 08 09 10 11-0.4
-0.3
-0.2
-0.1
0.0
0.1
0.2
0.3
0.4
profitability (90 Percentile)
profitability (75 Percentile)
profitability (Average)
profitability (25 Percentile)
profitability (10 Percentile)
Figure 18: Typical output from a 40-run desk-checking trial (Rural region type)
Desk checking results for AvRevPerRNO are detailed in Table 1. TIS results for all eight region types are
presented and columns 3-5 contain the values used to initialise key independent variables (these also partly define the various regions).
Table 1: TIS results for AvRevPerRNO
Region Type Region
Attractiveness
Environmental Damage
Mitigation
Human Resource Quality
UM US UC
1. International Gateway
120 Average Good 0.23 0.00 0.77
2. Seaside (seasonal) 150 Major Average 0.20 0.13 0.67 3. Seaside (year-
round) 110 Minimal Good 0.24 0.21 0.55
4. Other Coastal 160 All-out Average 0.16 0.13 0.71 5. Provincial City 110 Average Average 0.05 0.03 0.92 6. Rural
90 Minimal Poor 0.30 0.09 0.61
7. Snowfields
160 Major Excellent 0.14 0.18 0.68
8. Family Holiday 130 Average Average 0.30 0.00 0.70 Mean 0.20 0.10 0.70
In general, the results obtained are reasonable, although the results for two of our region types (Seaside –
year-round and Rural) are only fair. If results are averaged over all eight region types however, then it can be seen that UC (i.e. chance) accounts for 70% of variance. This is illustrated in Figure 19.
The desk-checking results presented for AvRevPerRNO are fairly typical of those obtained for other model variables of interest. Earlier, reference was made to difficulties associated with validating SD models. For example, Lawrence (2005, p. 15), while arguing the case for greater use of systems thinking and modelling in tourism, expresses doubts regarding the predictive accuracy of such models and suggests that ‘it is better to use systems models as abstract structures for organising thoughts about problem situations’. Others, however (e.g. Forrester & Senge 1980; Richardson & Pugh 1981; Coyle 1983; Maani & Cavana 2000), have argued that SD models can be validated to a stage where they are useful in practice. We believe that STEPS has been tested to a point where it reasonably accurately simulates the behaviour of critical elements of the broad Australian tourism system (and, in particular, its accommodation sector). The next stage of validation is due to commence later in
20
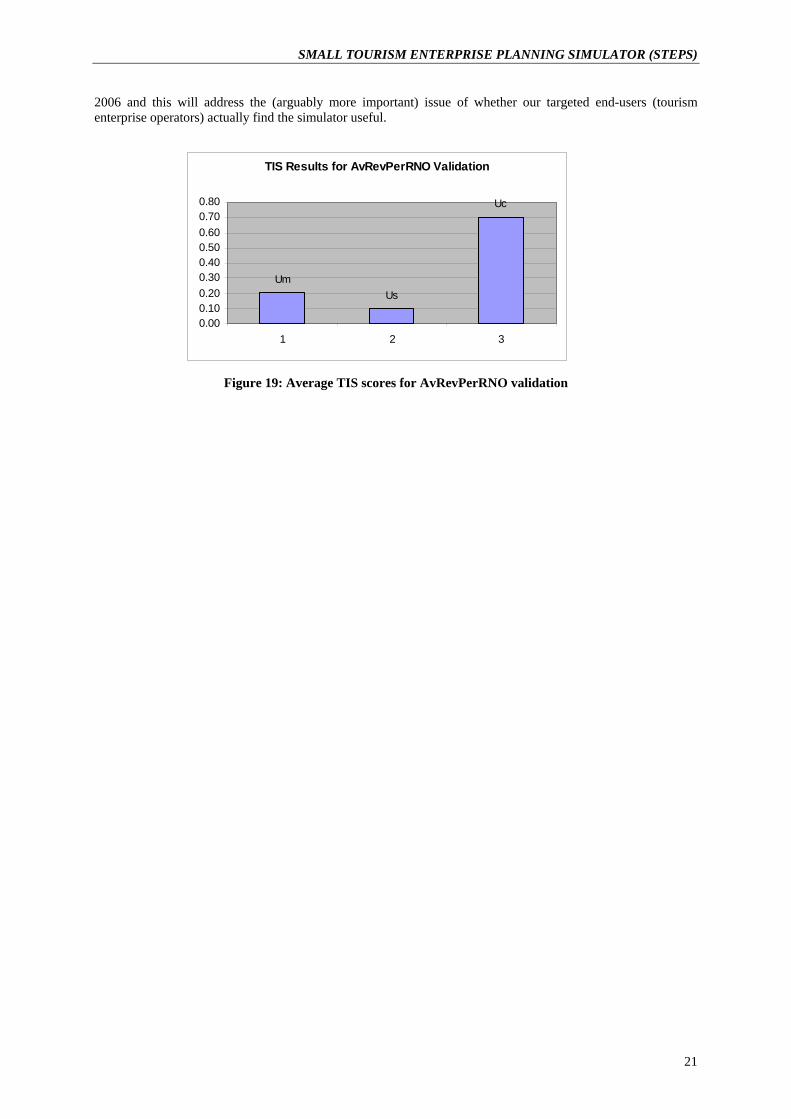
SMALL TOURISM ENTERPRISE PLANNING SIMULATOR (STEPS) 2006 and this will address the (arguably more important) issue of whether our targeted end-users (tourism enterprise operators) actually find the simulator useful.
TIS Results for AvRevPerRNO Validation
Uc
UsUm
0.000.100.200.300.400.500.600.700.80
1 2 3
Figure 19: Average TIS scores for AvRevPerRNO validation
21

Managing Complexity in Tourism Enterprise Planning
Chapter 6
CONCLUSION
We have detailed the development and use of a tourism enterprise planning simulator (STEPS) based largely upon SD constructs and tools. The motivation for our work and particular approach was: i) the need for improved access to useful business planning tools among SMTE operators; and ii) the fact that SD copes well with domains that are rapidly-changing and, in addition, can be classified as ‘messy’ (Vennix 1996, 9-41).
Few would argue that the tourism landscape is evolving at an express (indeed, some might say terrifying) pace and issues that need to be considered when developing tourism enterprises are certainly messy. For example, Buhalis (2000) nominates the number of different stakeholders, stakeholder relationships and goals, contradictions between these goals, and difficulties in maintaining an acceptable and sustainable balance between the interests of stakeholders, natural resources and development activity as major problems that must be confronted in destination marketing and management – and tourism enterprises cannot be established in isolation from destination-level considerations. Thus, it is absolutely imperative that prospective owner/operators of SMTEs have a thorough understanding of these complexities. STEPS and, especially its system archetypes, are designed to enhance this understanding and learning.
22
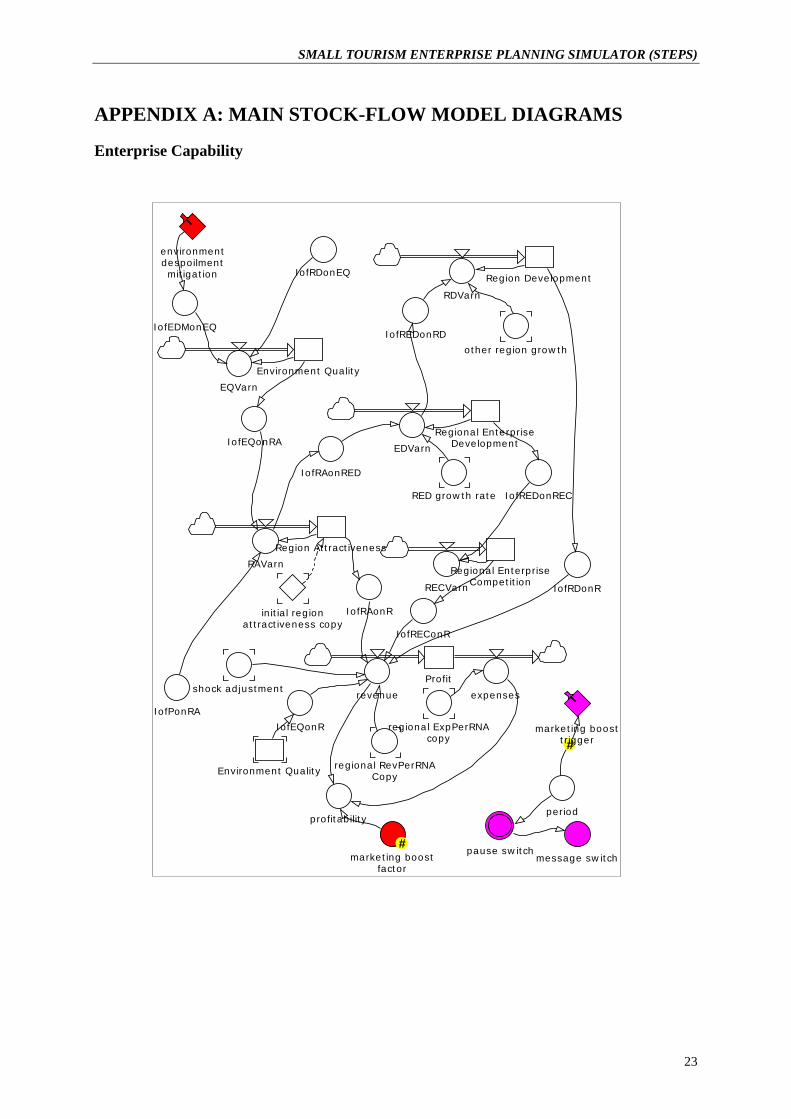
SMALL TOURISM ENTERPRISE PLANNING SIMULATOR (STEPS)
APPENDIX A: MAIN STOCK-FLOW MODEL DIAGRAMS
Enterprise Capability
#
#
Region Attractiveness
RAVarn
Profit
revenue expenses
regional RevPerRNACopy
profitability
Regional EnterpriseDevelopmentEDVarn
IofRAonRED
RED growth rate
Region Development
RDVarn
IofREDonRD
other region growth
Environment Quality
EQVarn
IofRDonEQ
environmentdespoilmentmitigation
IofEDMonEQ
IofEQonRA
IofRAonR
IofPonRA
Regional EnterpriseCompetitionRECVarn
IofREDonREC
IofREConR
IofRDonR
initial regionattractiveness copy
marketing boosttrigger
period
regional ExpPerRNAcopy
Environment Quality
IofEQonR
marketing boostfactor
shock adjustment
pause switchmessage switch
23
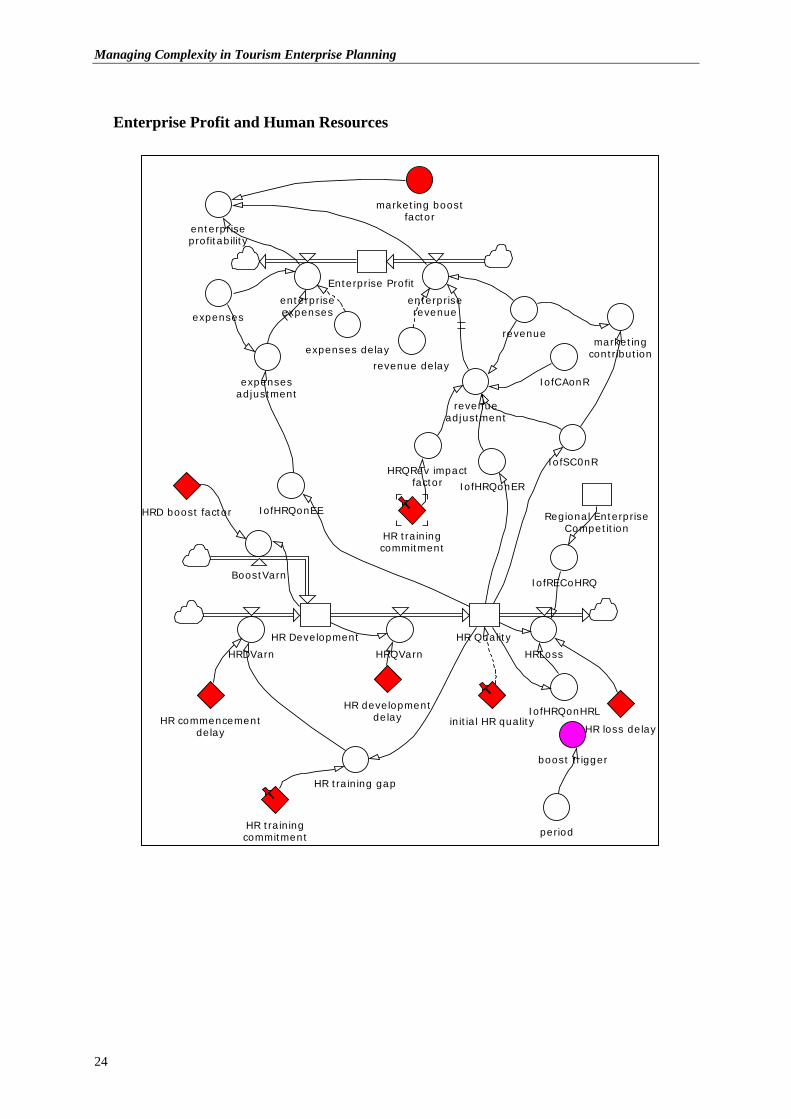
Managing Complexity in Tourism Enterprise Planning
Enterprise Profit and Human Resources
Regional EnterpriseCompetition
HR Development HR Quality
HRDVarn HRQVarn HRLoss
IofRECoHRQ
HR loss delay
HR developmentdelayHR commencement
delay
HR trainingcommitment
initial HR qualityIofHRQonHRL
HR training gap
revenue
expenses
Enterprise Profit
enterpriserevenue
enterpriseexpenses
IofHRQonER
IofHRQonEE
revenue delay
expenses delay
enterpriseprofitability
BoostVarn
HRD boost factor
boost trigger
period
expensesadjustment
revenueadjustment
marketing boostfactor
IofSC0nR
marketingcontribution
IofCAonR
HRQRev impactfactor
HR trainingcommitment
24
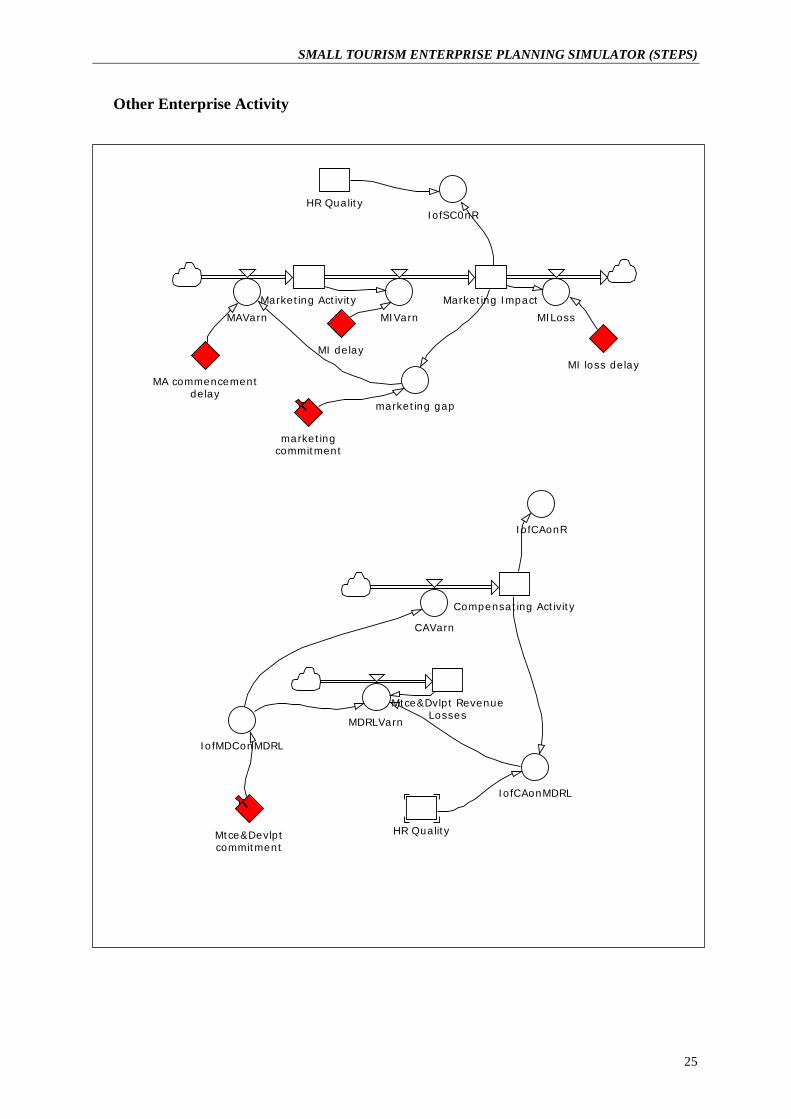
SMALL TOURISM ENTERPRISE PLANNING SIMULATOR (STEPS)
Other Enterprise Activity
Marketing Activity Marketing Impact
MIVarnMAVarn MILoss
marketingcommitment
Mtce&Devlptcommitment
marketing gap
MA commencementdelay
MI delayMI loss delay
IofSC0nRHR Quality
Mtce&Dvlpt RevenueLosses
MDRLVarn
IofMDConMDRL
Compensating Activity
CAVarn
IofCAonR
IofCAonMDRL
HR Quality
25
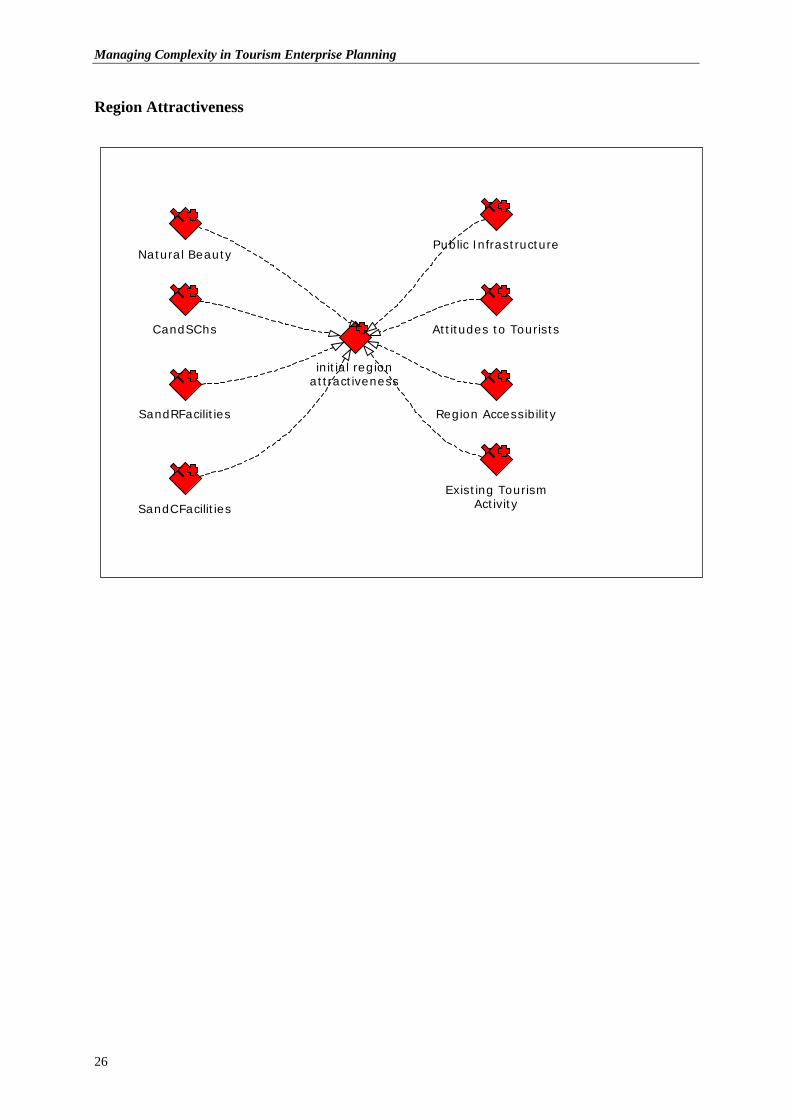
Managing Complexity in Tourism Enterprise Planning Region Attractiveness
Natural Beauty
CandSChs
SandRFacilities
SandCFacilities
initial regionattractiveness
Public Infrastructure
Attitudes to Tourists
Region Accessibility
Existing TourismActivity
26
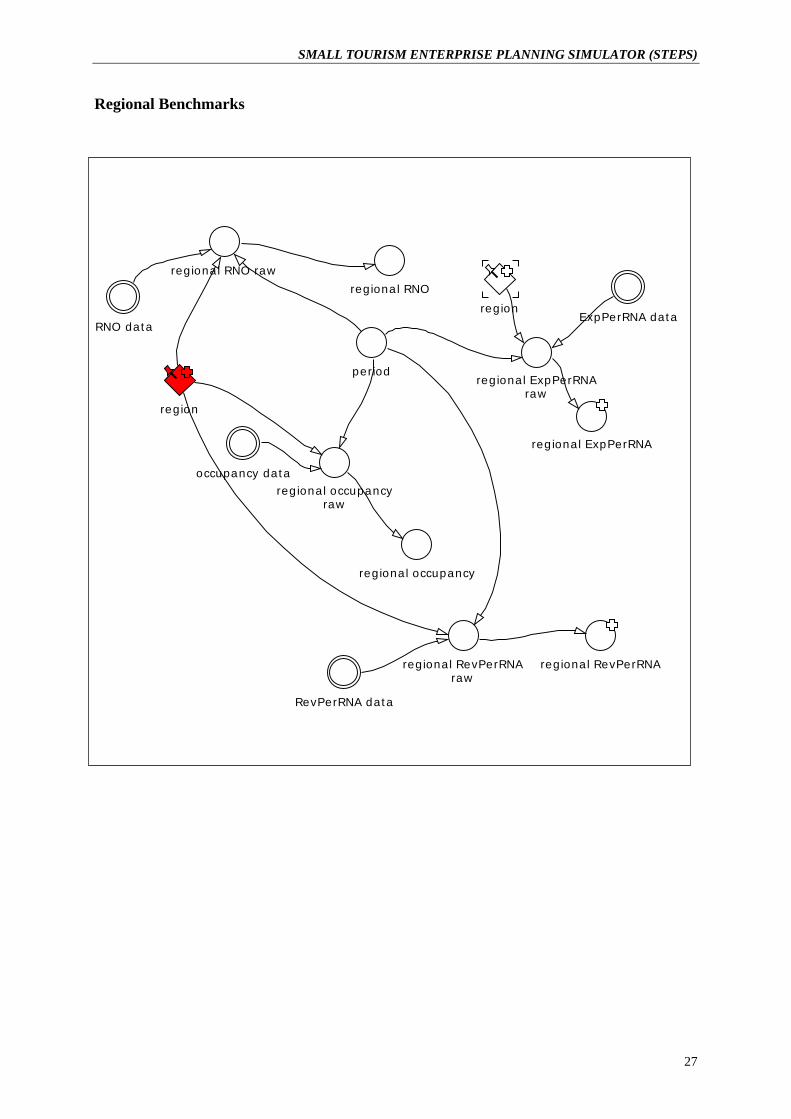
SMALL TOURISM ENTERPRISE PLANNING SIMULATOR (STEPS) Regional Benchmarks
RNO data
region
regional RNO raw
period
occupancy dataregional occupancy
raw
regional RevPerRNAraw
RevPerRNA data
regional RNO
regional occupancy
regional RevPerRNA
regionExpPerRNA data
regional ExpPerRNAraw
regional ExpPerRNA
27
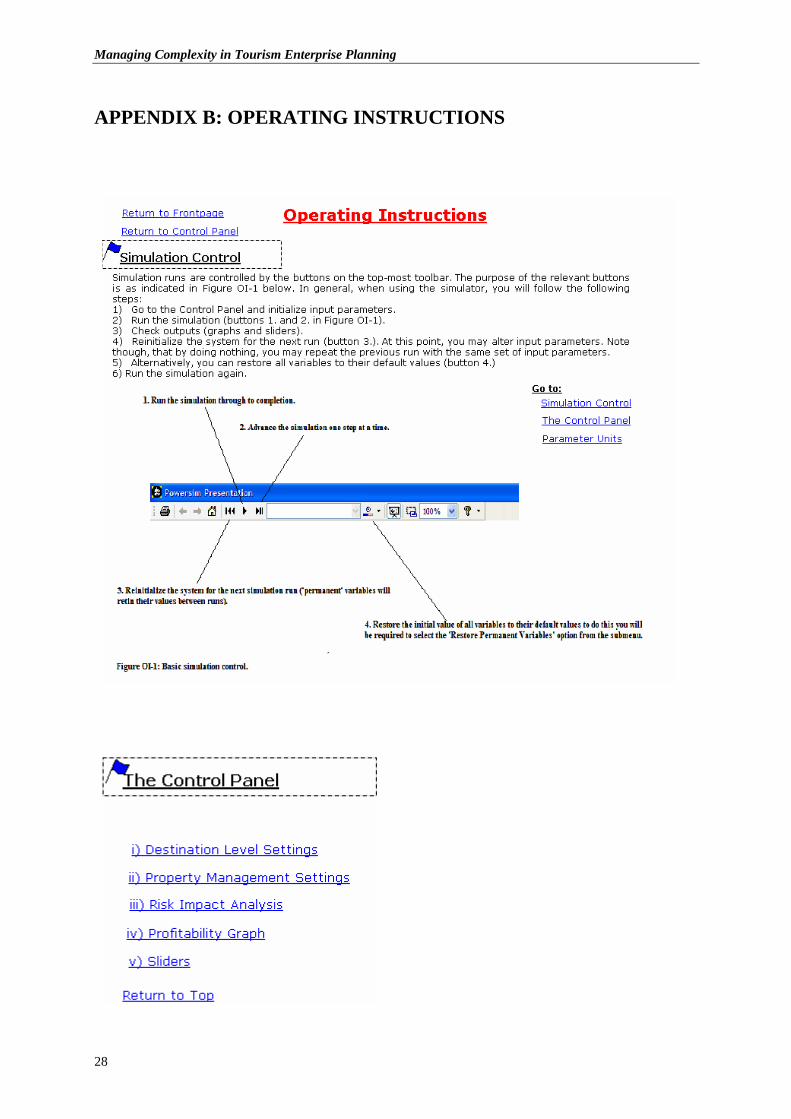
Managing Complexity in Tourism Enterprise Planning
APPENDIX B: OPERATING INSTRUCTIONS
28
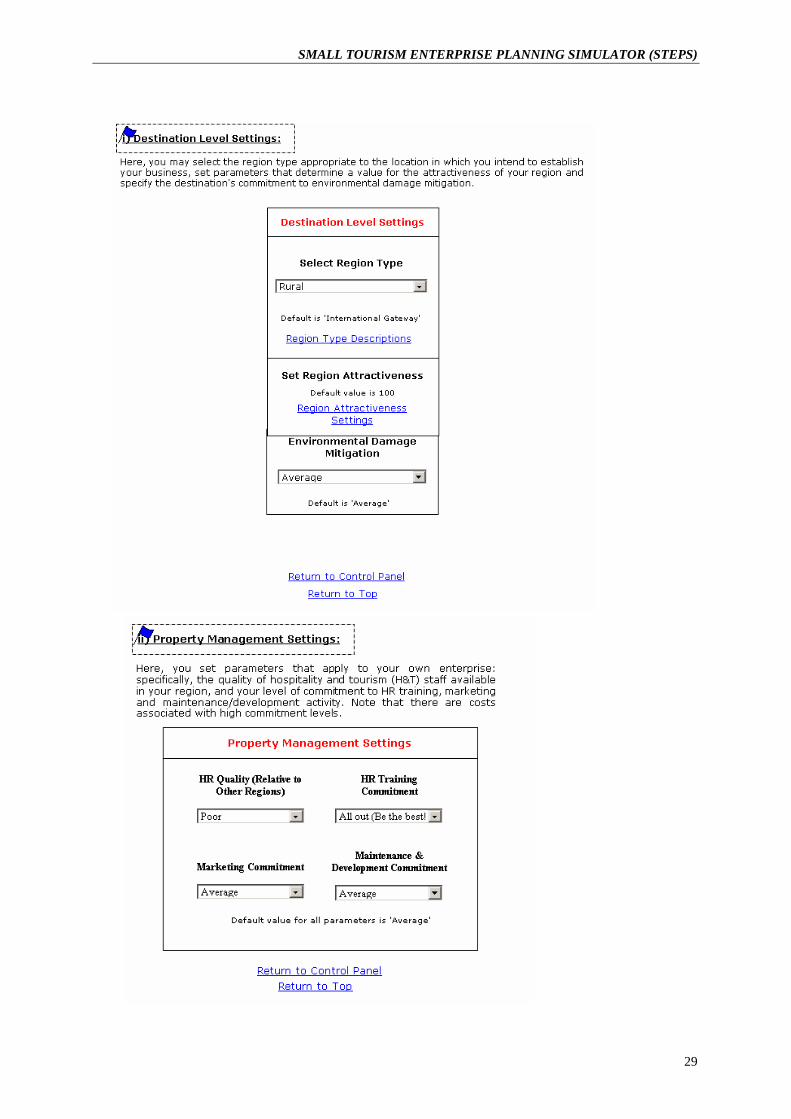
SMALL TOURISM ENTERPRISE PLANNING SIMULATOR (STEPS)
29
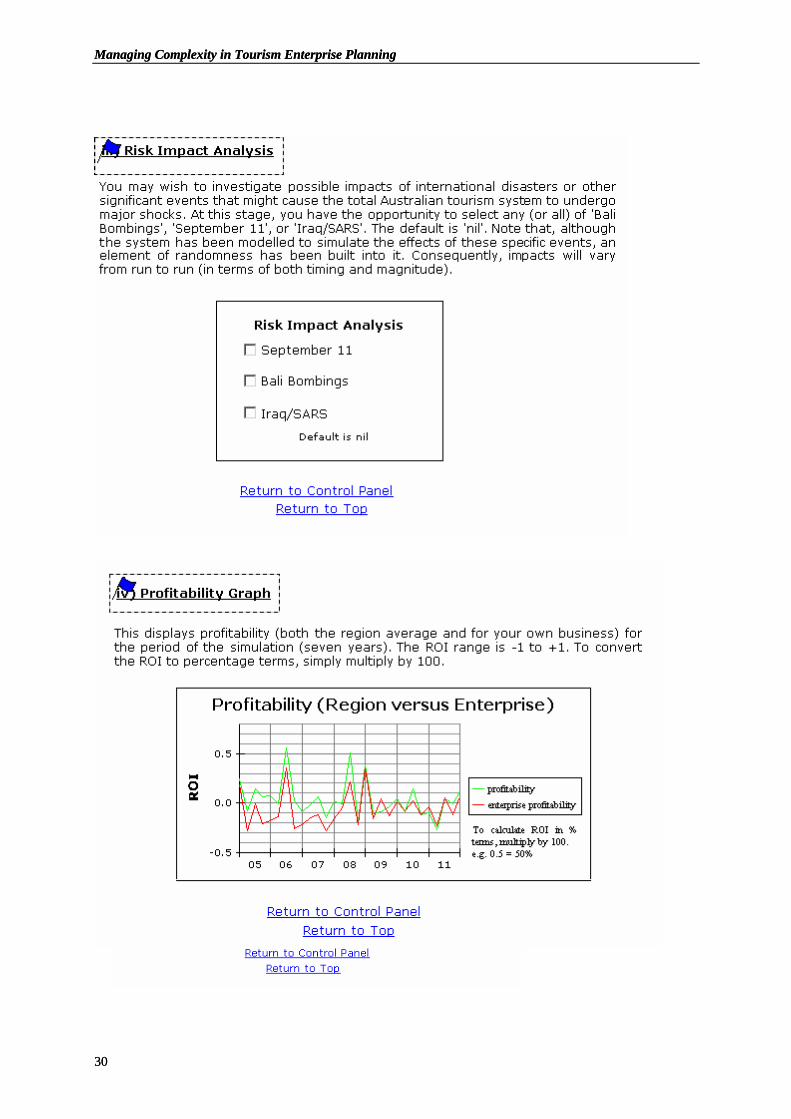
Managing Complexity in Tourism Enterprise Planning
30
Managing Complexity in Tourism Enterprise Planning
30

SMALL TOURISM ENTERPRISE PLANNING SIMULATOR (STEPS)
31
Managing Complexity in Tourism Enterprise Planning REFERENCES Australian Bureau of Statistics (2005). Tourist Accommodation, Australia: Time Series, Report No. 8635.0,
March 2005. Canberra, ACT: Australian Bureau of Statistics.
Adams, C., Frost, G. & Webber, W. (2004) ‘Triple Bottom Line: A Review of the Literature’ in: A. Henriques & J. Richardson (Eds.), The Triple Bottom Line: Does it All Add Up. Earthscan, London, UK. pp. 17-25.
Andersen, D.F., Richardson, G.P. & Vennix, J.A.C. (1997) ‘Group Model Building: Adding More Science to the Craft’, System Dynamics Review, 13(2): 187-201.
Baker, K. (2000) Project Evaluation and Feasibility Analysis for Hospitality Operations, Hospitality Press, Melbourne.
Bellinger, G. (1999) The Way of Systems, viewed 29/5/06, www.outsights.com/systems/theWay/theWay.htm
Bergin-Seers, S., Jago, L., Breen, J. & Carlsen, J. (2005) Performance Measurement in Small Hotels (Tech. Rep. Project No. 70061), CRC for Sustainable Tourism Pty Ltd, Gold Coast, Australia.
Boehm, B. (1988) ‘A Spiral Model of Software Development and Enhancement’, IEEE Computer, 21(5): 61-72.
Buhalis, D. (2000) ‘Marketing the Competitive Destination of the Future’, Tourism Management, 21(1): 97-116.
Burstein, F. (2002) ‘Systems Development in Information Systems’, in: Research Methods for Students, Academics and Professionals (2nd edn). Centre for Information Studies, Charles Sturt University, Wagga Wagga, New South Wales, Australia. pp. 147-158.
Butler, R. (1980) ‘The Concept of a Tourism Area Cycle of Evolution: Implications for Resources’, Canadian Geographer, 24(1): 5-12.
Brundtland, G.H. (1987) Our Common Future Federal Office for Spatial Development, Berne, viewed 1 December 2005, http://www.are.admin.ch/are/en/nachhaltig/international_uno/unterseite02330/
Carson, D. & Richards, F. (2004) ‘Delivering Technological Innovation in Tourism: Considerations in the Implementation of Decipher’ in: A.J. Frew & P. O’Connor (Eds). Information and Communication Technologies in Tourism 2004. Springer, Vienna. pp. 1-11.
Cohen, M.D., March, J.G. & Olsen, J.P. (1972) ‘A Garbage Can Model of Organizational Choice’, Administrative Science Quarterly, 17(1): 1-25.
Coyle, R.G. (1977) Management System Dynamics, Wiley: Chichester, UK.
Coyle, R.G. (1983) ‘The Technical Elements of the System Dynamics Approach’, European Journal of Operational Research, 14: 359-370.
Dangerfield, B. & Roberts, C. (1995) ‘Projecting Dynamic Behavior in the Absence of a Model: An Experiment’, System Dynamics Review, 11(2): 157-172.
de Geus, A.P. (1994) Modeling to Predict or to Learn? Modeling for Learning Organizations, Productivity Press: Oregon.
English, J. (1995) Small Business Financial Management in Australia, Allen and Unwin: London.
Fausnaugh, C., Waight, P., Higginbottom, K. & Northrope, C. (2004) Farm & Country Tourism – On Your Property: Stage 1 Assessment Tool, available via the Australian STCRC website: http://www.crctourism.com.au
Forrester, J.W. (1961), Industrial Dynamics, MIT Press, Cambridge, MA.
Forrester, J.W. & Senge, P.M. (1980) ‘Tests for Building Confidence in System Dynamics Models’, TIMS Studies in the Management Sciences, 14: 209-228.
Galliers, R. (1991) ‘Choosing Appropriate Information Systems Research Approaches: A Revised Taxonomy’ in: Information Systems Research: Contemporary Approaches and Emerging Traditions, North Holland: New York, pp. 327-345.
Gammack, J., Amaya Molinar, C., Chu, K. & Chanpayom, B. (2004) Development Needs of Small to Medium Size Tourism Businesses, Asia Pacific Economic Cooperation Secretariat (APEC), Toowong, Queensland, Australia.
Georgantzas, N.C. (2003) ‘Tourism Dynamics: Cyprus’ Hotel Value Chain and Profitability’, System Dynamics Review, 19(3): 175-212.
32
SMALL TOURISM ENTERPRISE PLANNING SIMULATOR (STEPS) Karlins, M. & Andrews, L.M. (1973) Biofeedback: Turning on the Power of Your Mind, Warner Paperback
Library, New York.
Kosko, B. (1993) Fuzzy Thinking: The New Science of Fuzzy Logic, Hyperion, New York.
Lawrence, M. (2005) ‘The System Matters: Systems Thinking and the Study of Regional Tourism Destinations’ in: D. Carson & J. Macbeth (Eds.). Regional Tourism Cases: Innovation in Regional Tourism. CRC for Sustainable Tourism, Griffith University, Queensland, Australia.
Loutif, M., Moscardini, A.O. & Lawler, K. (2000) ‘Using System Dynamics to Analyse the Economic Impact of Tourism Multipliers’ in: P.I. Davidsen, D.N. Ford & A.N. Mashayeekhi (Eds.). Proceedings of the 18th International Conference of the System Dynamics Society. System Dynamics Society, Albany, New York. pp. 132-232.
McGrath, G.M. (2005) ‘Information Needs Within the Australian Tourism Industry: A Scoping Study’ in: P. O’Connor & A.J. Frew (Eds.). Proceedings of the Hospitality Information Technology Association Conference (HITA 05), Los Angeles, 19-20 June, pp. 47-78.
McGrath, G.M. & More, E. (2005) ‘An Extended Tourism Information Architecture: Capturing and Modelling Change’ in: A.J. Frew (Ed.). Proceedings of the 12th International Conference on Information Technology in Travel and Tourism. Innsbruck, Austria, 26-28 January, pp. 1-12.
Maani, K.E. & Cavana, R.Y. (2000) Systems Thinking and Modelling: Understanding Change and Complexity, Prentice-Hall, Auckland, New Zealand.
Mill, R.C. & Morrison, A.M. (2002) The Tourism System, 4th edn, Kendall/Hunt Publishing, Dubuque, Iowa.
Mistilis, N., Presbury, R. & Agnes, P. (2004) ‘The Strategic Use of Information Technology in Marketing and Distribution – A Preliminary Investigation of Sydney Hotels’, The Journal of Hospitality and Tourism Management, 11(1): 42-55.
Morecroft, J.D.W. (1994) ‘Executive Knowledge, Models and Learning’, Modeling for Learning Organizations. Productivity Press: Oregon, pp. 3-28.
Morrison, A.J. & King, B.E.M. (2002) Small Tourism Businesses and E-Commerce: Victorian Tourism Online. Tourism and Hospitality Research, 4(2): 104-115.
Neuman, W. (1994) Social Research Methods: Qualitative and Quantitative Approaches, 2nd edn, Allyn and Bacon: Needham Heights, MA.
Nunamaker, J. & Chen, C. (1990) ‘Systems Development in Information Systems Research’. Proceedings of the 23rd Hawaii International Conference on System Sciences, IEEE, Los Alomitos, California, pp. 631-639.
Parker, C., Wafula, E., Swatman, P.M.C. & Swatman, P.A. (1994) ‘Information Systems Research Methods’. Proceedings of the 5th Australasian Conference on Information Systems, 27-29 September, Monash University, Melbourne, Australia, pp. 197-208.
Powersim (2003) Powersim Studio 2003: Reference Manual, Powersim Software AS, Bergen, Norway.
Richardson, G.P. & Pugh, A.L. (1981) Introduction to System Dynamics Modeling, Productivity Press, Oregon.
Richmond, B. (1997) ‘The Strategic Forum: Aligning Objectives, Strategy and Process’, System Dynamics Review, 13(2): 131-148.
Ritchie, J.R.B. & Crouch, G.I. (2003) The Competitive Destination, CABI Publishing, Cambridge, MA.
Roberts, N.H., Andersen, D.F., Deal, R.M., Garet, M.S. & Shaffer, W.A. (1983) Introduction to Computer Simulation, Addison-Wesley, Reading, MA.
Senge, P.M. (1990) The Fifth Discipline: The Art and Practice of the Learning Organization, Random House, Milsons Point, New South Wales.
Sharma, P., Carson, D. & DeLacy, T. (2000) ‘National Online Tourism Policy Initiatives for Australia’, Journal of Travel Research, 39(2): 157-162.
Sharma, P., Carson, D. & DeLacy, T. (2000a) ‘Developing a Business Information Data Warehouse for the Australian Tourism Industry – A Strategic Response’, Information and Communication Technologies in Tourism 2000, Springer, Vienna, pp. 147-156.
Smith, S.L.J. (2004) ‘The Measurement of Global Tourism: Old Debates, New Consensus, and Continuing Challenges’ in: A.A. Lew, C.M. Hall & A.M. Williams (Eds.). A Companion to Tourism. Blackwell, Malden, MA, pp. 25-35.
33

Managing Complexity in Tourism Enterprise Planning Sterman, J.D. (1980) Business Dynamics: Systems Thinking and Modeling for a Complex World, Irwin McGraw-
Hill, Boston, MA.
Theil, H. (1966) Applied Economic Forecasting, North-Holland, New York.
Tourism Australia (2004) Australia’s Tourism Facts and Figures: At a Glance, Australian Government, Department of Industry, Tourism and Resources, Canberra, Australian Capital Territory.
Tourism Research Australia (2005) Domestic Overnight Travel: Recent Trends and Challenges, Tourism Research Australia, Canberra, Australian Capital Territory.
Vennix, J.A.M. (1996) Group Model Building: Facilitating Team Learning Using System Dynamics, Wiley, Chichester, UK.
Walker, P.A., Greiner, R., McDonald, D. & Lyne, V. (1999) ‘The Tourism Futures Simulator: A Systems Thinking Approach’, Environmental Modelling and Software, 14: 59-67.
World Tourism Organization (1998) Guide for Local Authorities in Developing Sustainable Tourism, World Tourism Organization, Madrid.
34
SMALL TOURISM ENTERPRISE PLANNING SIMULATOR (STEPS)
AUTHORS Prof G. Michael McGrath Mike McGrath is Professor of Information Systems and Director of the E-Commerce Research Unit at Victoria University. He has researched and published widely in the fields of computing science and information systems and, in particular, the ‘ICT in Tourism’ domain. In other research, he has investigated issues related to information systems interoperability and potential applications of the ‘Semantic Web’ in the tourism industry. Email: [email protected] Henk Meijerink Henk Meijerink is IT Consultant on a number of STCRC projects. A systems architect with extensive ICT experience in the telecommunications and tourism domains, Henk co-produced the NIAATI (National Information Architecture for the Australian Tourism Industry) and has developed several IT solutions for the STCRC leveraging state-of-the-art technology components including OWL/RDF, .NET, web services, system dynamics, fuzzy logic, etc. Dr Pramod Sharma Pramod was a Senior Lecturer, GIS Program Coordinator, School of Geography, Planning & Architecture, The University of Queensland, and a Board Member – International Federation for Information Technology in Tourism (IFITT Australia). Research interests include: applications of Geographical Information Systems (GIS) (LBS, in particular), knowledge management in tourism industry; technology transfer; development of information and communications technology applications in tourism and the use of information technology in the management of SMEs.
35

I n d u s t r y Pa r t n e r s u n I v e r s I t y Pa r t n e r s s P I n - O F F C O M P a n I e s
CrC for sustainable tourism Pty Ltd aBn 53 077 407 286Gold Coast CampusGriffith university Qldaustralia 4222
telephone: +61 7 5552 8172Facsimile: +61 7 5552 8171Chairman: Stephen GreggChief Executive: Ian KeanDirector of Research: Prof. David Simmons
Website: www.crctourism.com.au Bookshop: www.crctourism.com.au/bookshop email: [email protected]
COMMERCIALISE
RESEARCH And
dEVELOPMEnT
EdUCATIOn And
TRAInInG
UTILISE
COLLABORATION
CO
MM
UN
I CA
T I O N
I NN
OV
AT
IO
N
• Travel and tourism business• Academic researchers• Government regulators and policy makers
• New products, services and technologies• Uptake of research findings by business, government and academe• Improved business productivity• Industry-ready post-graduate students• Public good benefits for tourism destinations
The Sustainable Tourism Cooperative Research Centre
(STCRC) is established under the Australian Government’s
Cooperative Research Centres Program. STCRC is the
world’s leading scientific institution delivering research to
support the sustainability of travel and tourism – one of
the world’s largest and fastest growing industries.
Introduction
The STCRC has grown to be the largest, dedicated tourism
research organisation in the world, with $187 million
invested in tourism research programs, commercialisation
and education since 1997.
The STCRC was established in July 2003 under the
Commonwealth Government’s CRC program and is an
extension of the previous Tourism CRC, which operated
from 1997 to 2003.
Role and responsibilities
The Commonwealth CRC program aims to turn research
outcomes into successful new products, services and
technologies. This enables Australian industries to be more
efficient, productive and competitive.
The program emphasises collaboration between businesses
and researchers to maximise the benefits of research
through utilisation, commercialisation and technology
transfer.
An education component focuses on producing graduates
with skills relevant to industry needs.
STCRC’s objectives are to enhance:
• the contribution of long-term scientific
and technological research and innovation
to Australia’s sustainable economic and social
development;
• thetransferofresearchoutputsintooutcomesof
economic, environmental or social benefit to Australia;
• thevalueofgraduateresearcherstoAustralia;
• collaborationamongresearchers,betweenresearchers
and industry or other users; and efficiency in the use of
intellectual and other research outcomes.