Embed Size (px)
Citation preview

Small-scale technology certificates
Data modelling for 2019 to 2021
Final Report to the Clean Energy Regulator
January 2019
Green Energy Markets
Suite 2 Ground Floor 109 Burwood Rd Hawthorn VIC 3122
T: 03 9805 0777 F: 03 9815 1066 [email protected]
www.greenmarkets.com.au

STC Modelling 2019-21 Draft Report
Green Energy Markets 2
Blank page

STC Modelling 2019-21 Draft Report
Green Energy Markets 3
Table of Contents
Executive Summary ......................................................................................................... 5 1. Project Scope ............................................................................................................... 7 2. Methodology and Assumptions .................................................................................... 8 3. STC Market Overview and Industry Interviews .......................................................... 11 4. Estimating STC Creation for 2017 installations ......................................................... 13 5. Solar PV and Solar Water Heater - Market Review ................................................... 18 6. Solar PV Projections – New Residential .................................................................... 21 7. Solar PV Projections – Non-residential (Commercial) ............................................... 28 8. Solar PV Projections – Upgrades .............................................................................. 31 9. SWH and Air Sourced Heat Pump Projections .......................................................... 31 10.Other small generating units ..................................................................................... 35 11.Resources ................................................................................................................. 36
Attachments Attachment 1. Summary of Results Attachment 2. Financial Attractiveness for Residential PV Market Attachment 3. Residential PV Systems by State Attachment 4. Certificate Creation for Residential PV Market Attachment 5. Non-residential PV Installations Attachment 6. PV System Upgrades Attachment 7. SWH Systems – New Buildings Attachment 8. SWH Systems – Replacement Market Attachment 9. Solar PV by Segment Attachment 10. SWH by Segment Attachment 11. Delay in Creation of Certificates
Disclaimer The data, analysis and assessments included in this report are based on the best information available at the date of publication and the information is believed to be accurate at the time of writing. Green Energy Markets does not in any way guarantee the accuracy of any information or data contained in this report and accepts no responsibility for any loss, injury or inconvenience sustained by any users of this report or in relation to any information or data contained in this report.
STC Modelling 2019-21 Draft Report
Green Energy Markets 4
Blank page

STC Modelling 2019-21 Draft Report
Green Energy Markets 5
Executive Summary
The Clean Energy Regulator (CER) has engaged Green Energy Markets Pty Ltd (GEM)
to provide an estimate of the Small-scale technology certificates (STCs) likely to be
created during the 2019 calendar year, and for the 2020 and 2021 calendar years.
In developing our projections for small generating units (SGUs) and solar water heater
(SWH) we utilised our existing models and databases. We have also made extensive
use of the registry data provided by the CER and interviewed a range of solar industry
participants.
We have segmented the solar market into the following sub-markets to more accurately
forecast the level of installations:
• SGU PV – New Residential market
• SGU PV – Upgrade Residential market
• SGU PV – Non-residential (commercial market)
• SGU PV – Upgrade Non-residential market
• SWH – New building market
• SWH - Replacement or existing dwelling market
The following factors have been influential in the development of our estimates of the
level of future solar installations:
• Wholesale power prices are expected to remain high in 2019 in the eastern states
and are not expected to decline until 2020. This means that solar PV will remain a
attractive financial proposition for consumers through 2019 and we expect a decline
from 2020 onwards as financial returns reduce.
• The Victorian Solar Program which contributes up to $2225 to the cost of a
residential PV system will see a surge in the level of solar PV installations in Victoria
over the forecast period;
• The average system size for new residential installations is expected to continue
increase, but at a more modest rate as we begin approaching the typical network
connection constraint of 6.5 kW (5 kW on a basis);
• The number of non-residential (commercial size) PV system installations is
expected to continue to increase through 2019 and then we expect a slight
reduction in 2020 and 2021 as system paybacks increase due to falls in the
wholesale electricity price; and
• The number of SWH systems installed in new homes is expected to decline over
the forecast period in line with declines in the expected rate of new home
commencements. This will be more than offset by an increase in the replacement
market largely through the new rebate of $1000 for residential solar hot water
systems in Victoria which will see an increase in Victorian SWH installations in 2019
and beyond.
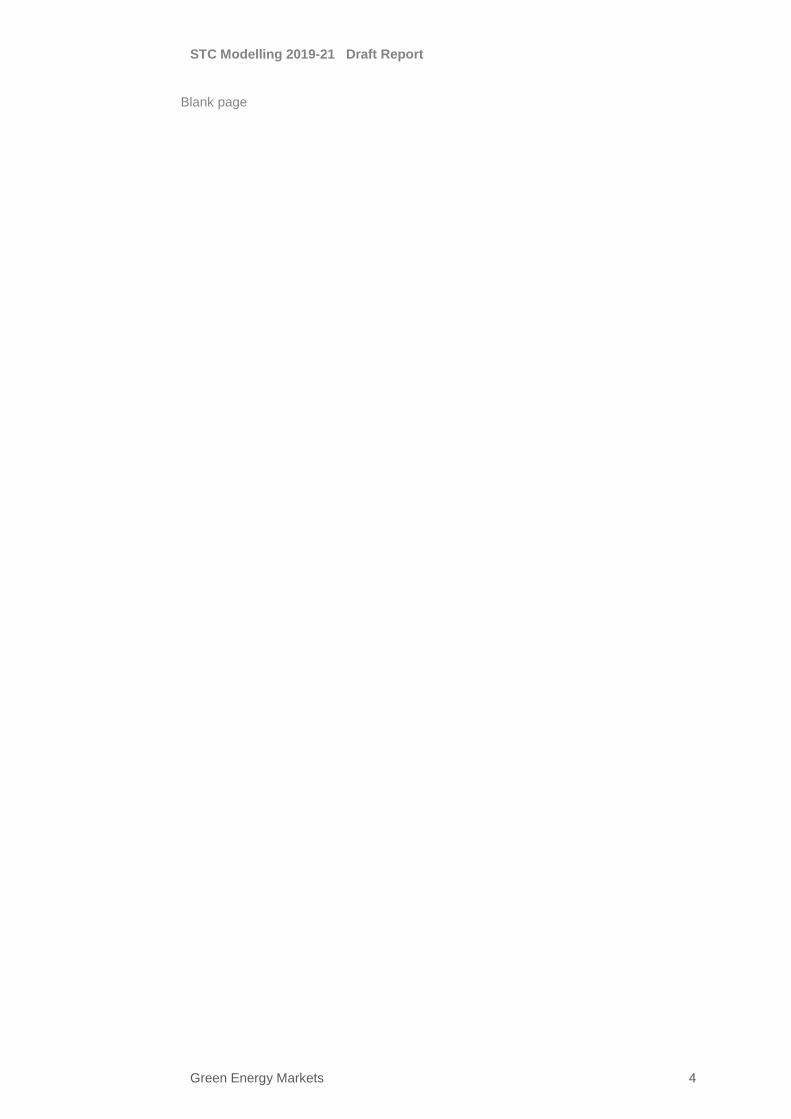
We estimate that 1626 MW of solar PV was installed in 2018 which is 45% increase on
2017 levels. We expect that the level of 2019 installations will increase further (by 19%),
supported by strong growth in the residential market. The capacity installed in new
residential market is expected to grow strongly due to the impact of the Victorian Solar
Program. As wholesale electricity prices fall further from 2020 onwards, together with
reduced contribution from STCs we expect that solar PV capacity installed will fall from
2020 onwards.
STC Modelling 2019-21 Draft Report
Green Energy Markets 6
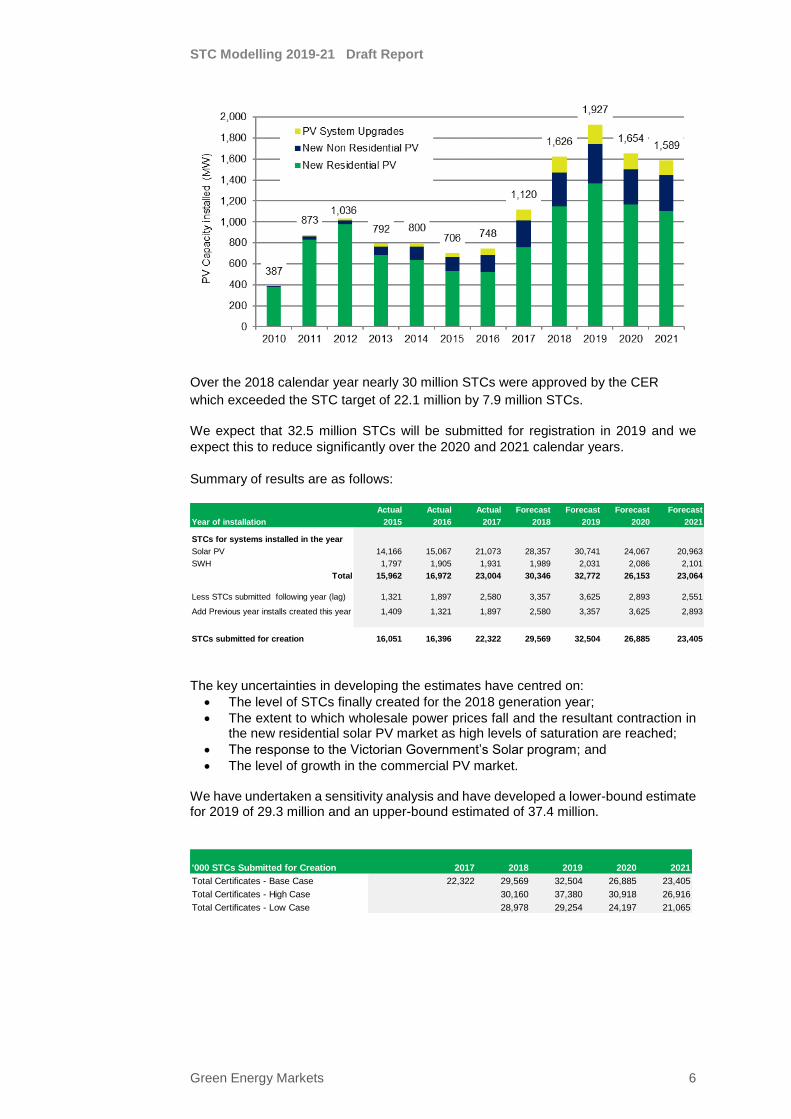
Over the 2018 calendar year nearly 30 million STCs were approved by the CER
which exceeded the STC target of 22.1 million by 7.9 million STCs.
We expect that 32.5 million STCs will be submitted for registration in 2019 and we
expect this to reduce significantly over the 2020 and 2021 calendar years.
Summary of results are as follows:
The key uncertainties in developing the estimates have centred on:
• The level of STCs finally created for the 2018 generation year;
• The extent to which wholesale power prices fall and the resultant contraction in the new residential solar PV market as high levels of saturation are reached;
• The response to the Victorian Government’s Solar program; and
• The level of growth in the commercial PV market. We have undertaken a sensitivity analysis and have developed a lower-bound estimate for 2019 of 29.3 million and an upper-bound estimated of 37.4 million.
Actual Actual Actual Forecast Forecast Forecast Forecast
Year of installation 2015 2016 2017 2018 2019 2020 2021
STCs for systems installed in the year
Solar PV 14,166 15,067 21,073 28,357 30,741 24,067 20,963
SWH 1,797 1,905 1,931 1,989 2,031 2,086 2,101
Total 15,962 16,972 23,004 30,346 32,772 26,153 23,064
Less STCs submitted following year (lag) 1,321 1,897 2,580 3,357 3,625 2,893 2,551
Add Previous year installs created this year 1,409 1,321 1,897 2,580 3,357 3,625 2,893
STCs submitted for creation 16,051 16,396 22,322 29,569 32,504 26,885 23,405
'000 STCs Submitted for Creation 2017 2018 2019 2020 2021
Total Certificates - Base Case 22,322 29,569 32,504 26,885 23,405
Total Certificates - High Case 30,160 37,380 30,918 26,916
Total Certificates - Low Case 28,978 29,254 24,197 21,065
STC Modelling 2019-21 Draft Report
Green Energy Markets 7
1. Project Scope
The Clean Energy Regulator (CER) has engaged Green Energy Markets Pty Ltd (GEM)
to provide an estimate of Small-scale technology certificates (STCs) likely to be created
during the 2019 calendar year and for the 2020 and 2021 calendar years.
The details and outputs of the report will influence and inform the Regulator in facilitating any update on the binding and non-binding STP estimates in the Regulations. Data input into the model to estimate the number of Small-scale Technology
Certificates (STCs) must generally include, but is not limited to:
• eligible system STC creation for previous years showing the historical trend in small-scale technology uptake using data to be provided by the CER;
• certificates remaining in the Registry from the previous compliance period. Delayed STC creation from installations in previous years may be relevant;
• STC price modelling (although STC price may be included as an input to the modelling exercise);
• estimates of any over or under-hang of STCs in 2018 from the previous compliance year;
• State and Commonwealth incentive schemes and any expected changes to these schemes over the timeframe i.e. impact of potential change to state policies around Feed-in tariffs;
• State based renewable energy targets and schemes (emerging or operating). In the case of Victoria it is assumed that the Solar Scheme will support 720,000 new installations over 10 years (72,000 solar PV and SWH systems per annum);
• relevant historical legislative changes to the eligibility rules and criteria for Solar Hot Water and Small Generation Units;
• existing, and potential changes to, building codes and regulations including energy efficiency measures which impact the uptake of various technologies;
• change in cost of STC eligible systems due to new technological and manufacturing improvements and changes in the cost of system components;
• global financial conditions, such as changes in currency values, and changes to cost of raw materials;
• changes in financial (e.g. due to Clean Energy Finance Corporation loans, power purchase agreements) and technological (e.g. battery storage) innovation;
• changes to electricity prices, network regulatory reform;
• trends in residential and non-residential buildings, including ABS Building Approvals data (8731.0) and building industry projections;
• changes in the size (kilowatts) and output of photovoltaic systems;
• impacts of phasing out of deeming arrangements under the Renewable Energy Target; and
• any other relevant factor the CER or GEM deems appropriate.
STC Modelling 2019-21 Draft Report
Green Energy Markets 8
2. Methodology and Assumptions
In undertaking this project for the CER we have gone through the following steps:
• Review of current STC creation;
• Interviews with a range of Solar industry participants;
• Estimate likely level of solar installations in 2018 and estimate of the level of
STC surplus at the end of 2018;
• Forecast the level of solar installations and STCs to be created for 2019, 2020
and 2021.
In estimating the level of STC creation for 2018 we have relied on historical creation
figures provided by the CER for the period to 1 January 2019. We have then considered
historical creation patterns and lags to estimate the total expected level of creation for
systems installed in 2018. We have then cross referenced this with recent weekly
creation patterns moderated by feedback received from industry interviews.
For the 2019 to 2021 period, GEM has broadly utilised the same methodology as we
have in previous reports for the CER. We have developed forward estimates separately
for each of the small-scale technologies that are able to produce STCs. Modelling
approaches have been tailored to the specific market attributes of each technology and
market segment.
In determining the level of STCs to be created we have initially forecast the likely
number of SGU and SWH installations in each of the forecast years and then estimated
the resulting level of certificates. We then make adjustments for the lag in certificate
creation to arrive at the number of STCs to be submitted to the CER for approval in any
given year.
We have relied on data provided by the CER on eligible systems that have been
installed and created certificates. A system is determined as valid if the number of
certificates created less the number of certificates failed at audit is greater than zero.
Modelling solar PV certificates
The demand for of solar PV systems in Australia continues to be driven the financial
attractiveness of solar as represented by reducing exposure to high energy prices.
There are a range of other factors that will also impact on the demand for solar PV
including the level of up-front cost, industry marketing, expanded media coverage,
environmental awareness and government incentives such as feed-in tariffs.
Our modelling for solar PV STCs is split into four segments, with each treated differently
due to different drivers and attributes:
• New Residential systems;
• Residential Upgrade systems, this will also include replacement systems to 31
January 2018 after which time they will not be eligible;
• New Non Residential systems;
• Non Residential Upgrade systems

STC Modelling 2019-21 Draft Report
Green Energy Markets 9
Modelling new residential PV system installations
Modelling for these systems is based on inputs to our payback model, with the resultant
payback period feeding into projected demand for each state. As penetration levels
have risen across all states we have refined our modelling approach for this sector by
also considering the level of new homes built. Based on these estimates, the solar zone
rating and the average system sizes, STC creation is forecast.
Payback period is modelled using Green Energy Markets payback model. Explicit
assumptions used in the model include:
• Installed system cost;
• The value of STCs and any other rebate;
• Avoidable electricity cost for self-consumption in each state;
• Value of exported electricity in each state including relevant state feed-in tariff
rates; and
• Level of exported electricity.
System prices are based on industry forecasts of equipment prices, installation costs
and exchange rates (AUD/USD exchange rate of 0.72 assumed). Changes in the cost
of raw materials will be implied in the above.
Modelling non-residential (commercial) PV systems
The number of commercial or non-residential systems being installed is increasing and
is also becoming a more important part of the market as saturation levels for residential
PV increases. We develop a historical picture of these systems based on the data
provided and then assess the financial attractiveness by state based on average
system paybacks.
Modelling upgrades, expansions and replacements of residential and non-
residential PV systems
This market sector is increasing albeit from a low base. Many customers have small 1
kW systems that received the $8,000 PV Rebate and are considering expanding their
systems in response to higher power prices and lower panel prices. While this market
sector is still very small we expect it to continue to grow and become a much more
important feature of the industry in future years as saturation in the residential market
increases. As a result, we separately assess these segments to determine its relative
size and importance.
Modelling solar water heating certificates
Water heater systems are essential appliances and subject to state regulations
increasingly limiting choice in some applications. As such, water heater system choices
are based on different factors which include: the existing system type (if being
replaced); the relevant state regulations; the type of premises; access to reticulated
gas, and also net system up-front costs (after taking incentives into account).
Operational costs, such as changes in future electricity and gas prices are also factored
into the attractiveness of SWH.
The solar water heater (SWH) market has two sub-markets which are each subject to
different incentives and regulations – these are the new building market (residential),
and the replacement market (for existing water heaters in residences). The commercial
market which had been important in previous years, is not significant and is not
separately analysed.

STC Modelling 2019-21 Draft Report
Green Energy Markets 10
SWH systems in each state and each sub-market are separately modelled. Major inputs
into this analysis include new building forecasts, system replacement rates and market
shares for each water heater technology by year.
The model considers relative market shares together with the following factors:
• State regulations for new/replacement systems;
• Access to reticulated gas;
• STC price;
• System prices (prior to incentives);
• Other state and federal government incentives (if any); and
• Economic factors.
SWH system installation forecasts will be combined with average certificate per
systems (based on the most recent data) to estimate total certificate creation in each
state and each submarket.
Market Participant Interviews
As part of the data modelling exercise we interviewed a range of solar market
participants for their views of the solar PV and SWH market over the coming three
years. The views of these businesses assisted in the development and refinement of
our assumptions.

STC Modelling 2019-21 Draft Report
Green Energy Markets 11
3. STC Market Overview and Industry Interviews
The level of STCs submitted for creation in 2018 has well exceeded the STC target
and at the end of December 2018 was 36% above the STC Target (refer to Figure
3.1). A strong seasonal element remains with creation in 2018 surging from mid-
October as it had in the previous year.
Figure 3.1 STC spot price and weekly STCs submitted for registration
As the level of creation continued to exceed the target the STC price started to fall
from the $39 level achieved after the April 2018 quarter surrender. The ACCC’s
recommendation to wind up the SRES scheme was released in June and the
adverse market sentiment resulted in a drop in the STC price to below $34. The
price subsequently improved after the Government stated that it would not pre-
maturely close the scheme.
The continued oversupply of STCs over the last two years has meant that the Clearing House has not come into play and has remained in surplus (Figure 3.2).
Figure 3.2 STC Clearing House Surplus / (Deficit)
STC Modelling 2019-21 Draft Report
Green Energy Markets 12
Solar industry participant interviews
As part of the review process we interviewed a cross section of solar market participants (including some of the largest participants in each market sector) to obtain their views on the current level of solar installations and expected activity over the coming years. Some key observations that have informed our assessment and assumptions used in the modelling are set out below:
• There are concerns that the growth in 2018 has led to capacity constraints, particularly securing batteries from some suppliers and challenges in securing accredited installers. This situation is perhaps more acute in Victoria following the increase in demand due to the Victorian Solar Program. One of the impacts of this is likely to see an increase in installation costs until additional trained installers come through the system;
• Consumer interest in residential and commercial sectors remains strong off the back of higher power prices and improved financial attractiveness. Interestingly environmental concerns are now starting to appear as a customer motivator to consider solar (this could well be due to concerns regarding higher temperatures and drought);
• With increased saturation the cost of generating leads in some states is starting to increase noticeably. There are still considerable opportunities in the commercial sector, however sales take longer to close;
• While there has been considerable customer interest in batteries, the overall level of battery sales has not grown as much as some participants expected (approximately 20,000 battery installations expected in 2019);
• Panel prices were lower than expected in 2018 however growing global demand will see some increase in pricing in 2019; and
• Continued trend to larger system sizes, though starting to level out a bit as approaching 6.5 kW (5kW on an AC basis). Connection process can be much more complicated and costly for systems above this size.

STC Modelling 2019-21 Draft Report
Green Energy Markets 13
4. Estimating STC creation for 2018 installations
Registered Agents and their customers have 12 months from the date of installation of
a small-scale system to create the certificates. This means that we will only know at the
end of 31 December 2019 what the number of certificates created from the installation
of solar systems in 2018 will be.
We have analysed the level of STCs that have been submitted for creation on a weekly
basis by year of installation for the key market sectors. Figures 4.1 and 4.2 show the
lag in creation for new residential and new non-residential solar PV installations. The
lag in creation for all market sectors are summarised in Attachment 11.
Figure 4.1 Weekly STC Creation – new residential PV systems by install year
Figure 4.2 Weekly STC Creation – new non-resid. PV systems by install year
On analysis by market segment (Table 4.1) it is quite apparent that delays in creation
are significantly higher for non-residential PV systems and for SWH systems in new
buildings. To determine the level of STCs that are still to be created at the end of
December 2018 for systems installed in 2018 we have used the same proportion that
applied in 2017.

STC Modelling 2019-21 Draft Report
Green Energy Markets 14
Table 4.1 Proportion of Valid STCs still to be created in following year (as a
proportion of STCs created to end December)
A summary of total STC creation by market segment and the delays in creation is
included as Attachment 11.
Estimating STC surplus for 2018
We estimate that a total of 30.0 million STCs will be approved for registration in 2018
(refer to Attachment 1). This means that there will be a surplus of approximately 7.9
million STCs (as at 31 December 2018) that will be eligible to meet the 2018 STC
Target of 22.1 million (surrendered by 14 February 2019).
Installation Year 2016 2017 2018
New Residential PV 8.6% 9.3% 9.3%
New Non-Residential PV 19.7% 20.2% 20.2%
Upgrade PV 11.6% 14.8% 14.8%
New Building SWH 32.5% 27.3% 27.3%
Replacement SWH 9.6% 9.0% 9.0%
Following Year Creation as % of STCs
created to end Dec

STC Modelling 2019-21 Draft Report
Green Energy Markets 15
5. Solar PV and SWH - Market Review
The number of solar PV systems installed continued to increase in 2018 as concern
over rising power prices and the improved economics for solar systems due to high
wholesale power prices led to increase in demand (Figure 5.1).
Figure 5.1 Number of Solar PV installations claiming Certificates by Segment
The total installed capacity is expected to be 1626 MW in 2018 a 45% increase on 2017
levels (Figure 5.2).
Figure 5.2 Solar PV installed capacity claiming Certificates by Segment
The number of non-residential systems has continued to increase and is expected to
reach 367 MW in 2018 and account for 23% of capacity installed for the year.
Interestingly the non-residential market share fell slightly from 24% in 2017.
The overall average size of PV systems has continued to increase and reached 7.06
kW per system in 2018 (Figure 5.3). The increase in average system size has been
driven by the significant increase in the number of non-residential systems, and also by

STC Modelling 2019-21 Draft Report
Green Energy Markets 16
the improved financial returns from larger residential systems. The average system size
for residential installations (including upgrades) continued to increase significantly in
2018 reaching 5.92 kW per system.
Figure 5.3 Average size of system installations (Australia as a whole)
All major states have seen a significant increase in the installed capacity over the 2017 and 2018 period (Figure 5.4). Victoria has seen the largest percentage increase in 2018 (79%) largely due to the commencement of the roll-out of the Solar rebate program in September 2018. Figure 5.4 New Residential PV system capacity (MW) installed for key states
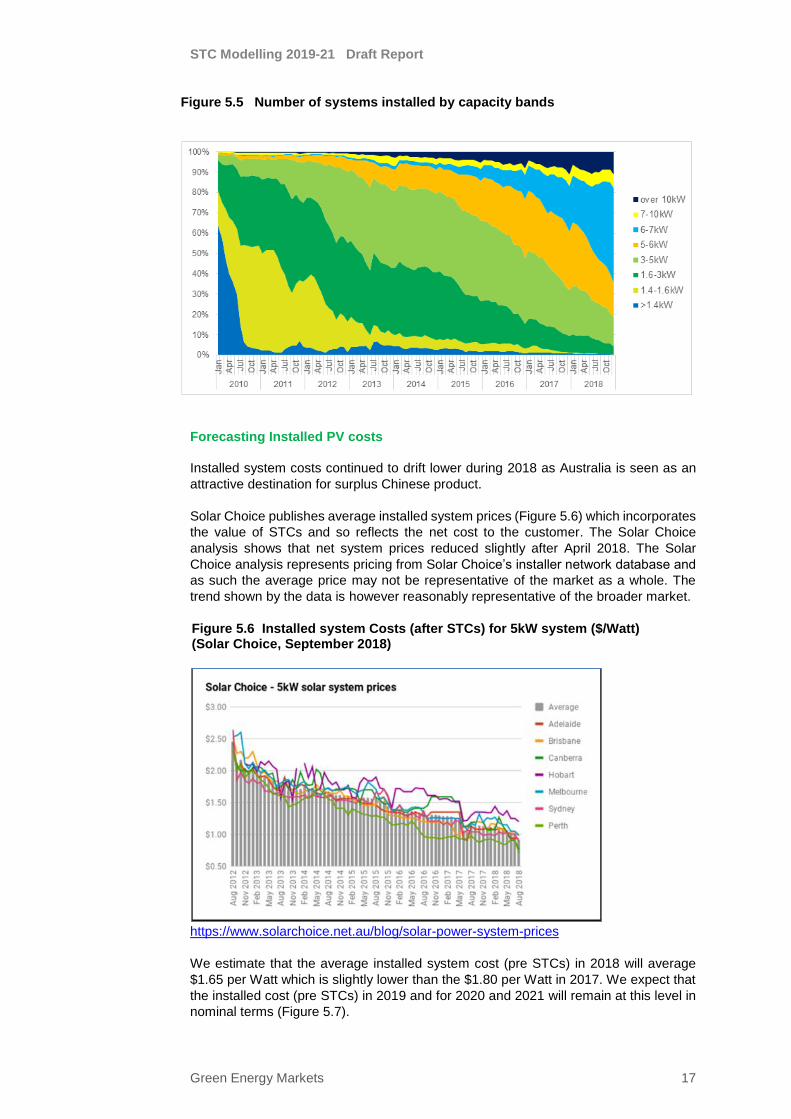
The changing nature of Australia’s solar PV market with the move to larger system sizes can best be shown graphically (Figure 5.5). Very few solar PV systems were installed in 2018 at less than 5 kW in capacity. The most popular size of solar PV system is now in the 6 to 7kW bracket which reflects the typical 5kW (AC) connection constraints (DC capacity can be up to 30% higher).
STC Modelling 2019-21 Draft Report
Green Energy Markets 17
Figure 5.5 Number of systems installed by capacity bands
Forecasting Installed PV costs
Installed system costs continued to drift lower during 2018 as Australia is seen as an
attractive destination for surplus Chinese product.
Solar Choice publishes average installed system prices (Figure 5.6) which incorporates
the value of STCs and so reflects the net cost to the customer. The Solar Choice
analysis shows that net system prices reduced slightly after April 2018. The Solar
Choice analysis represents pricing from Solar Choice’s installer network database and
as such the average price may not be representative of the market as a whole. The
trend shown by the data is however reasonably representative of the broader market.
Figure 5.6 Installed system Costs (after STCs) for 5kW system ($/Watt) (Solar Choice, September 2018)
https://www.solarchoice.net.au/blog/solar-power-system-prices
We estimate that the average installed system cost (pre STCs) in 2018 will average
$1.65 per Watt which is slightly lower than the $1.80 per Watt in 2017. We expect that
the installed cost (pre STCs) in 2019 and for 2020 and 2021 will remain at this level in
nominal terms (Figure 5.7).

STC Modelling 2019-21 Draft Report
Green Energy Markets 18
STCs will continue to play an important role in making solar PV attractive to customers
even as the years of deeming reduce. The net STC price (after creation fees) averaged
$36.53 in 2018 and is expected to remain at this level in 2019 and then increase to
$38.53 in 2020 and 2021 as the STC target is adjusted for the surplus of STCs.
Figure 5.7 Forecast Installed system costs for 5 kW system ($/Watt)
STCs accounted for nearly 40% of the total cost of the system in 2018 and this is
expected to drop to 36.7% in 2019 and then continue to fall as the number of years
deeming reduces.
SWH Market
The SWH market can usefully be segmented into the new building and replacement
markets (Figure 5.8). The new building market has been relatively stable broadly
moving in line with the level of new home building. The replacement market on the other
hand has proved to be very volatile and has been historically driven by the level of
rebates for the replacement of electric resistance water heaters.
Figure 5.8 SWH Systems installed and creating certificates by market segment
The SWH market overall has been growing at very modest levels over the last four
years and increased by 2.3% in 2018.
Installations of SHW systems across all main states (with the exception of Victoria)
have been fairly flat over the last three years (Figure 5.9).

STC Modelling 2019-21 Draft Report
Green Energy Markets 19
Figure 5.9 SWH Systems installed in NSW, Qld, SA, Vic and WA
Victoria continues to be the largest market for SWH. The strong Victorian market
reflects the support provided by the Victorian Energy Upgrade (VEU) Scheme for
replacing electric water heaters with SWH (replacement market) and strong growth in
SWH installs in new homes due to building regulations and strong growth in residential
building activity.
There have been several interesting developments over the last few years in the SWH
market which are worth watching as they may have ramifications in future years. These
are the increase in the number of Air Sourced Heat Pumps (Figure 5.10) that are being
installed and the growing proportion of SWH installations replacing existing SWH
systems (Figure 5.11).
Figure 5.10 Type of SWH being installed

STC Modelling 2019-21 Draft Report
Green Energy Markets 20
Figure 5.11 SWH Replacement market – system being replaced

STC Modelling 2019-21 Draft Report
Green Energy Markets 21
6. Solar PV Projections – New Residential
The new residential PV market remains the most significant segment and is expected
to account for 71% of PV capacity installed in 2019 under the SRES.
Systems are generally sold into this market on the basis of financial attractiveness ie.
the time it take to payback the initial investment. Our projections for the residential
sector for the 2019, 2020 and 2021 calendar years have been made on a state basis
and are principally derived from our payback model. Changes in payback determine
the expected demand for PV systems and we assess this against saturation levels in
each state based on the proportion of eligible owner-occupied households. Future
demand is also impacted by our assessment of relative market competitiveness,
industry promotion and response to heightened media concern for higher power prices.
We also separately account for the number of PV systems likely to be installed on
relatively new homes. Once we have forecast the level of expected installation we
project the average system size by state to arrive at the expected level of certificate
creation.
Forecasting payback periods
We have adopted a simple payback approach to represent the relative financial
attractiveness of PV to consumers in each state. The system payback is derived by
dividing the installed cost of the system (less the value of STCs) by the value of
electricity produced in the year of installation.
Explicit assumptions used in the model include:
• STC price averaging $36.53 (after creation costs) for 2018. We have assumed
a price of $36.53 for 2019 which reflects the value that STCs are currently
traded in the forward market. STC prices are expected to increase to $38.53 in
2020 and 2021 as the STC surplus gets factored into future STC targets;
• Electricity import replacement prices reflect AEMC’s latest projections
(December 2018 Report) and are adjusted for standing charges utilising AEMC
demand estimates. We have adjusted wholesale prices for 2020 and 2021 to
reflect changes in forward wholesale prices of electricity in line with the forward
market through ASX Energy (refer to Figure 6.1). Prices are expected to reduce
significantly over the 2020 to 2021 period;
• For payback modelling purposes we use a generic average system size for
each state and is assumed to be generally 5.5 kW other than in Queensland
and SA where we assume 6.0 kW. We have also assumed that the average
system size in Tasmania reduces to 5.0 kW from 2020 as power prices fall and
attractiveness reduces;
• Electricity exports are determined by state and are linked to the average
system size and the average consumption levels in each state. Export levels
range from 60% in the NT to 75% in most other states;
• Total installed cost of solar PV is assumed to be $1.65 per Watt in 2019 and
remain at this level in nominal terms for 2019 through to 2021.
The installed cost and the contribution that STCs make is shown graphically in Figure
5.7 and Attachment 2.

STC Modelling 2019-21 Draft Report
Green Energy Markets 22
Figure 6.1 ASX , Base electricity futures price for 2019 to 2022
Average assumed electricity consumption by state is based from the AEMC report and
is reproduced in Table 6.1 below:
Table 6.1 Annual electricity consumption by state (AEMC)
Jurisdiction
Annual consumption
(kWh)
Queensland 5,240
NSW 4,215
ACT 7,151
Victoria 3,865
Tasmania 7,908
NT 6,613
South Australia 5,000
WA 5,196
The wholesale electricity price is expected to reduce from 2020 according to the
AEMC’s December 2017 Electricity Price trends report. This is also illustrated by the
prices at which ASX futures are currently trading (Figure 6.1) where 2021 prices are 2
to 3 cents/kWh lower than 2019 levels. The avoidable electricity price in all key NEM
states reduces from 2019 as the wholesale price falls and standing charges continue
to increase (refer to Figure 6.2).
Figure 6.2 Avoidable electricity price (variable cents per kWh component)
The value of exported electricity in the NEM states is also expected to reduce
considerably over the next few years, predominantly as the wholesale price falls. The
value of exported electricity assumed for key states in summarised in Figure 6.3.

STC Modelling 2019-21 Draft Report
Green Energy Markets 23
Figure 6.3 Value of exported electricity for key states (cents per kWh)
Average system paybacks dropped dramatically in most NEM states during 2018 due
to high wholesale prices and lower system costs. Paybacks for systems installed in
2019 are expected to be comparable to 2018 levels, other than for Victoria which is
discussed separately. System paybacks are then expected to increase significantly
from 2020 (Figure 6.4) as the wholesale power prices fall and directly impact the value
of electricity produced by solar PV. Reductions in the contribution from STCs also
adversely impacts system paybacks.
Figure 6.4 Simple Payback for typical residential PV system
Demand for solar PV
Solar PV is a discretionary purchase for most households so financial attractiveness
will be the key determinant of the underlying demand. Like other discretionary
purchases uptake will also be significantly impacted by the level of sales, marketing
and promotion activity. In addition, concerns regarding the future economic outlook
and the impact that any economic and budget contraction will have on discretionary
household expenditure will constrain the near-term outlook for solar PV. Offsetting this
to some extent is the emergence of financing solutions that result in the customer not
having to outlay any cash upfront for a system.
Demand curves have been developed on a state basis based on historical residential
system installations. Demand curves are represented as a proportion of owner

STC Modelling 2019-21 Draft Report
Green Energy Markets 24
occupied relevant dwellings. We have recalibrated our dwelling database utilising the
detailed data made available by the ABS from the 2016 census.
Based on ABS data there were 5.1 million occupied detached and semi-detached
dwellings in Australia in 2016 (refer to Table 6.2).
Table 6.2 Detached and semi-detached dwellings by state (source: ABS, 2016 Census)
Demand curves have been further refined to account for the level of marketing and
promotion activity, and the relative attractiveness of the state (that is not picked up
through the factors incorporated in the payback model) and covers factors such as state
economic conditions, relevant level of retirees and income levels.
The demand curves are then further scaled based on the level of saturation in each
state. We have used an average of 2015 and 2016 years as a base for calibrating our
demand curves. Over the three years to 2021 the cumulative PV systems installed in
each state grows considerably with very high saturation rates achieved in Queensland
and South Australia, reaching over 60% by 2020.
New residential demand for solar PV in Victoria has been treated differently from other
states due to state governments solar program which will support 720,000 solar PV,
SWH and battery systems over 10 years. The program provides eligible households a
rebate of up 50% of the cost of a solar PV system installed before 30 June 2019, up to
a maximum rebate of $2225. The Government has announced that after 30 June 2019
it will pay the full up-front cost of the system with the household able to pay off half the
cost via an interest free loan (https://www.premier.vic.gov.au/applications-now-open-
for-half-price-solar-panel-rebates/).
The Victorian Government initially announced that the package would support 650,000
residential solar PV systems over 10 years, equivalent to 65,000 systems each year. It
is not clear how the government will ration the available rebates and for the purpose of
our modelling we have assumed that the program supports 65,000 solar PV systems
each year and 7,000 SWH systems each year.
We do not believe that the Victorian Government will have trouble in securing
customers for the program and note that the number of solar residential PV systems
installed in Victoria since the program started in September has seen a surge in
installations (Figure 6.5). It is important to remember that many of the systems installed
in the last quarter of 2018 will not have submitted applications for STC creation. To be
able to meet the 65,000 notional annual target will require that 5400 solar PV systems
be installed per month. The months of October and November in 2018 will clearly
exceed this once all STCs are submitted for creation.
StateSum of 2006
Dwellings
Sum of 2011
dwellings
Sum of 2016
dwellings
ACT 70,982 82,867 96,547
NSW 1,400,462 1,464,706 1,505,461
NT 23,525 24,633 28,476
QLD 856,368 925,049 970,731
SA 394,030 410,767 425,461
TAS 126,111 132,554 134,991
VIC 1,201,789 1,278,158 1,358,214
WA 469,699 517,903 579,335
Total 4,542,966 4,836,637 5,099,216
STC Modelling 2019-21 Draft Report
Green Energy Markets 25
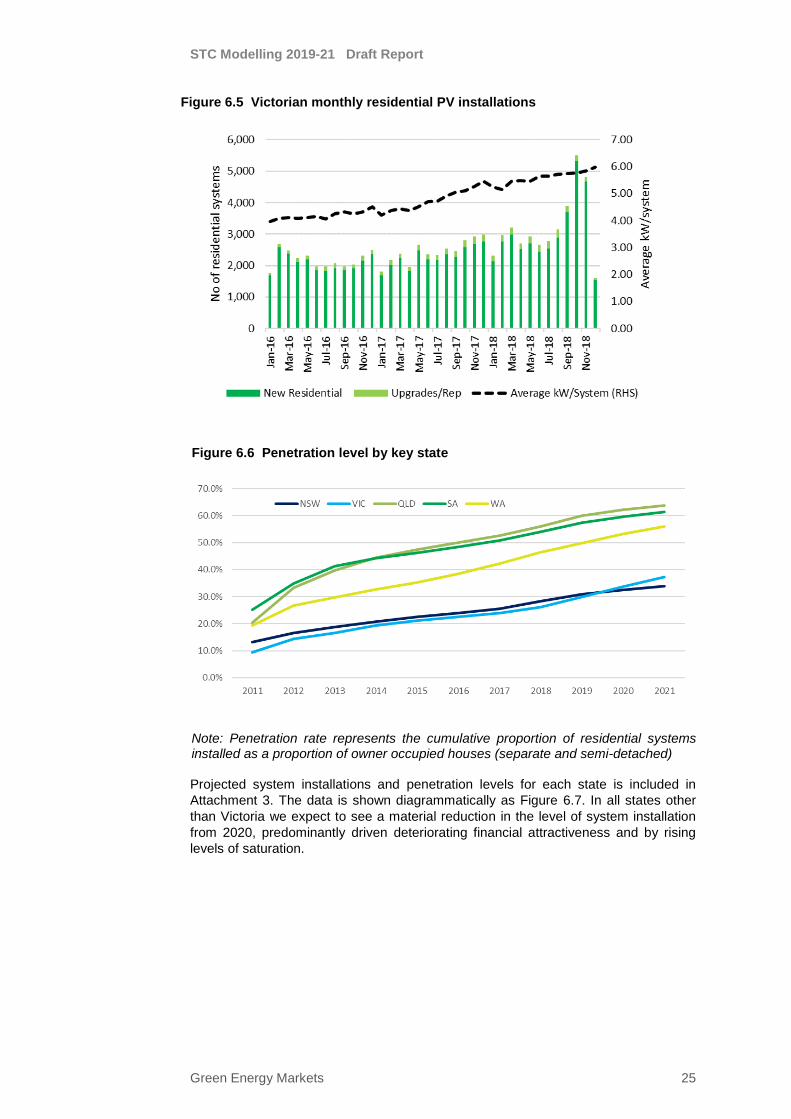
Figure 6.5 Victorian monthly residential PV installations
Figure 6.6 Penetration level by key state
Note: Penetration rate represents the cumulative proportion of residential systems installed as a proportion of owner occupied houses (separate and semi-detached)
Projected system installations and penetration levels for each state is included in
Attachment 3. The data is shown diagrammatically as Figure 6.7. In all states other
than Victoria we expect to see a material reduction in the level of system installation
from 2020, predominantly driven deteriorating financial attractiveness and by rising
levels of saturation.

STC Modelling 2019-21 Draft Report
Green Energy Markets 26
Figure 6.7 Residential PV systems installed by state
Determining the level of certificate creation
The average new residential system size installed has continued to increase reaching
5.88 kW per system in 2018 (refer to Attachment 4 for details). All states have seen an
increase in system size (refer to Figure 6.8).
Figure 6.8 Average system size installed for NSW, Qld, SA, Vic and WA
We forecast that the average system size will continue to increase, but at a slower rate
than experienced over the last few years. Improved panel performance will result in
increased generation capacity for a given area however as the value of exported
electricity decreases there will be less incentive to opt for bigger systems. In Tasmania
we expect that average system sizes will actually decrease as smaller systems with
less power exported will be more financially attractive.
The total number of systems installed and associated certificates created for new
residential systems is detailed in Attachment 4 and summarised in Table 6.3.
STC Modelling 2019-21 Draft Report
Green Energy Markets 27
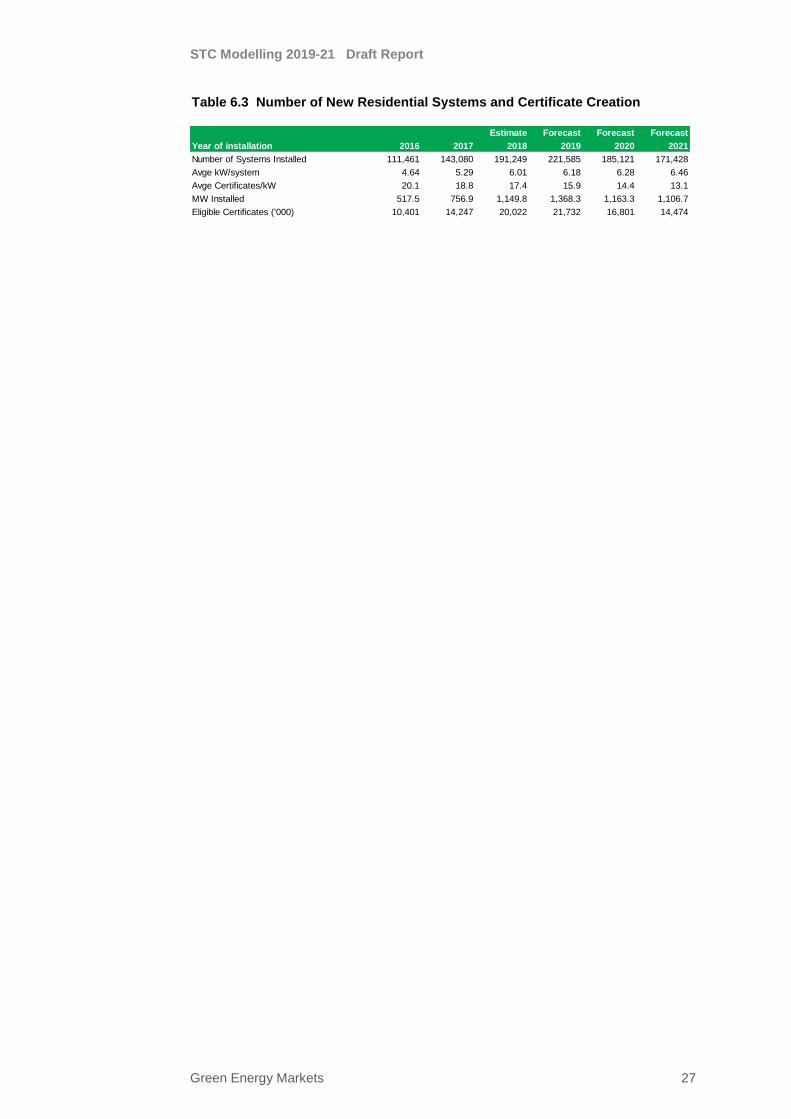
Table 6.3 Number of New Residential Systems and Certificate Creation
Estimate Forecast Forecast Forecast
Year of installation 2016 2017 2018 2019 2020 2021
Number of Systems Installed 111,461 143,080 191,249 221,585 185,121 171,428
Avge kW/system 4.64 5.29 6.01 6.18 6.28 6.46
Avge Certificates/kW 20.1 18.8 17.4 15.9 14.4 13.1
MW Installed 517.5 756.9 1,149.8 1,368.3 1,163.3 1,106.7
Eligible Certificates ('000) 10,401 14,247 20,022 21,732 16,801 14,474

STC Modelling 2019-21 Draft Report
Green Energy Markets 28
7. Solar PV Projections – Non-residential (Commercial)
We have in the past generally segmented the commercial market into those systems
where the installed capacity of the system is greater than 10 kW. This had been a proxy
for commercial systems. While in some ways it is an arbitrary delineation, it had
generally reflected industry convention. As we identified in Section 2 of this report, the
CER has been collecting data on the type of premises that the system was installed
since mid-2014. We have used the CER’s delineation from 2015 when a full years data
was available. For systems installed prior to 2015 we have continued to use systems
greater than 10 kW as a proxy for non-residential systems.
Potential Demand
By the end of 2018 we estimate there will have been nearly 55,000 commercial sized
systems installed across Australia. This is still only a relatively small proportion of
potential sites and there remains considerable scope for this sector to continue to
expand.
It is difficult to obtain data on the potential size of the market as we need to consider:
• Those businesses that own their own facilities, or at least have considerable
time remaining on their lease;
• Business sites that have appropriate roof space available to accommodate a
large number of solar panels; and
• Business sites that consume a reasonable amount of electricity so that not too
much of the electricity produced is exported.
Data is not available by state that represents the above characteristics and we have
developed a proxy to assist in assessing market prospects and growth over time. The
ABS publishes data on the number of registered businesses (ABS No of businesses
816501) by number of employees and the Energy Supply Association of Australia
(ESAA) publishes data by state on the number of business connections (Electricity Gas
Australia – 2014 Report). This information is summarised by state in Table 7.1.
Table 7.1 Number of Businesses and Electricity Connections (2013)
According to the ESAA there were 1.2 million business connections in Australia in 2013.
The ABS estimates that 39% of businesses employ more than one person and we have
scaled the ESAA connection data by this ratio to arrive at a proxy for the number of
potential sites. Many of these sites will not be suitable for PV due to being rented or not
having sufficient roof space.
We have analysed the proportion of businesses that have installed solar by state and
this is summarised in Figure 7.1. Queensland and WA had achieved nearly 15% market
penetration by 2018. Victoria and NSW have quite a bit lower penetration rate at around
10% with South Australia having nearly 20%.
NSW VIC QLD SA WA TAS NT ACT Total
Business Connections (ESAA) 371,874 319,840 221,300 98,783 128,942 44,777 15,104 15,495 1,216,115
Total Businesses (ABS) 688,766 538,767 414,423 143,300 215,938 37,529 14,244 25,298 2,078,265
Businesses >1 employee (ABS) 282,421 210,315 159,015 50,604 81,425 15,100 5,691 10,729 815,300
Proportion >1employee 41.0% 39.0% 38.4% 35.3% 37.7% 40.2% 40.0% 42.4% 39.2%

STC Modelling 2019-21 Draft Report
Green Energy Markets 29
Figure 7.1 Estimated Proportion of Business Sites with Solar PV (larger states)
The availability of roof space and owning the site are key requirements for solar PV to
be considered by a business customer. It would appear that sites that are outside of
the major metropolitan areas of capital cities are more likely to have these
characteristics and therefore more likely to be attractive for solar PV. Postcode analysis
that we have undertaken indicates that nearly 50% of non-residential installations occur
outside major urban areas, which is twice the proportion of residential dwellings.
Financial attractiveness
Most business sites consume less than 160 MWh of electricity per annum and pay
electricity tariffs that are broadly similar to residential customers. To the extent that
these businesses can mainly offset their on-site power use (and avoid exporting
significant levels of power) then an investment in PV can be quite attractive. The simple
payback for a commercial system of average size (20 kW) is shown diagrammatically
in Figure 7.2.
Assumptions used in the payback analysis are consistent with the assumptions used
for residential systems only with a lower export proportion (20% of power is assumed
to be exported) and the value of the electricity exported is assumed to be zero (other
than in Victoria where systems less than 100kW are eligible for a feed-in tariff).
The increase in the wholesale price of electricity for south eastern Australian states over the last few years has generally resulted in an improvement in the payback period to 2018 (Table 7.1). However as wholesale prices are forecast to reduce which combined with a reduction in the contribution of STCs will see an increase in payback periods to 2021.

STC Modelling 2019-21 Draft Report
Green Energy Markets 30
Figure 7.2 Simple payback for a 20 kW Solar PV System
In assessing the potential market for solar PV, a relative attractive investment may not
get implemented as high up-front cost activities such as PV suffer a number of barriers,
these include:
• The split incentive: most small-to-medium businesses lease their premises.
Payback may take longer than the lease term, and the building owner does not
pay the electricity bill;
• Businesses’ preference to invest in their own operations rather than in non-
core activities;
• The frequency of non-working periods (eg weekends) for such businesses,
which leads to power export and a consequent reduction in attractiveness; and
• Electricity represents a relatively small proportion of a business’s costs and as
such gets little attention from business owners.
The level of commercial PV installations (in MW terms) is expected to have increased
by 32% in 2018. We forecast a continued increase but at a lower rate of growth than
experienced in the past. We assume that the capacity installed increases by 18% in
2019 and then falls in 2020 and 2021 as system paybacks deteriorate due to lower
avoidable power prices.
For the forecast period, we have assumed that the average system size in each state
for 2018 period applies.
The total number of systems installed, and associated certificates created for the non-
residential PV market is detailed in Attachment 5 and summarised in Table 7.2.
Table 7.2 Commercial System Installations and Certificates (all states)
Estimate Forecast Forecast Forecast
Year of installation 2016 2017 2018 2019 2020 2021
Number of Systems Installed 8,338 11,584 15,243 17,961 16,105 16,018
Avge kW/system 20.13 22.03 21.06 21.06 21.09 21.09
Avge Certificates/kW 20.2 18.7 17.4 16.1 14.8 13.4
MW Installed 167.9 255.2 321.1 378.2 339.7 337.8
Eligible Certificates ('000) 3,388 4,785 5,601 6,087 5,017 4,536
STC Modelling 2019-21 Draft Report
Green Energy Markets 31
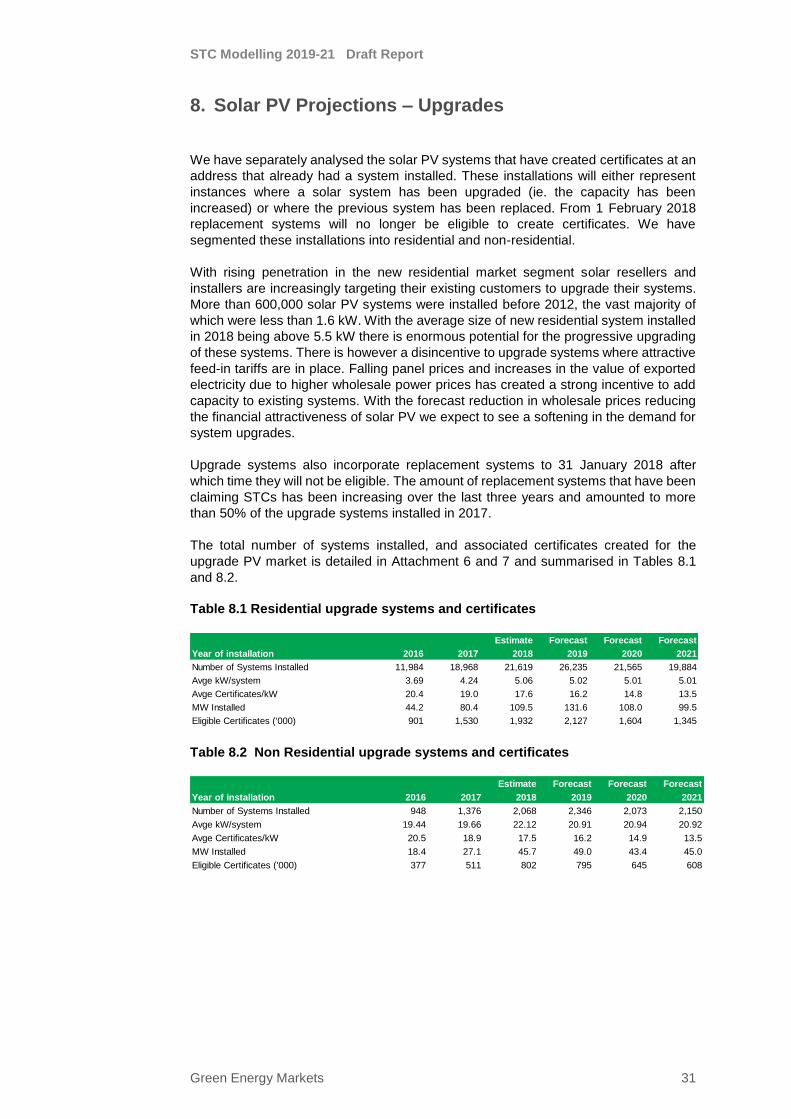
8. Solar PV Projections – Upgrades
We have separately analysed the solar PV systems that have created certificates at an
address that already had a system installed. These installations will either represent
instances where a solar system has been upgraded (ie. the capacity has been
increased) or where the previous system has been replaced. From 1 February 2018
replacement systems will no longer be eligible to create certificates. We have
segmented these installations into residential and non-residential.
With rising penetration in the new residential market segment solar resellers and
installers are increasingly targeting their existing customers to upgrade their systems.
More than 600,000 solar PV systems were installed before 2012, the vast majority of
which were less than 1.6 kW. With the average size of new residential system installed
in 2018 being above 5.5 kW there is enormous potential for the progressive upgrading
of these systems. There is however a disincentive to upgrade systems where attractive
feed-in tariffs are in place. Falling panel prices and increases in the value of exported
electricity due to higher wholesale power prices has created a strong incentive to add
capacity to existing systems. With the forecast reduction in wholesale prices reducing
the financial attractiveness of solar PV we expect to see a softening in the demand for
system upgrades.
Upgrade systems also incorporate replacement systems to 31 January 2018 after
which time they will not be eligible. The amount of replacement systems that have been
claiming STCs has been increasing over the last three years and amounted to more
than 50% of the upgrade systems installed in 2017.
The total number of systems installed, and associated certificates created for the
upgrade PV market is detailed in Attachment 6 and 7 and summarised in Tables 8.1
and 8.2.
Table 8.1 Residential upgrade systems and certificates
Table 8.2 Non Residential upgrade systems and certificates
Estimate Forecast Forecast Forecast
Year of installation 2016 2017 2018 2019 2020 2021
Number of Systems Installed 11,984 18,968 21,619 26,235 21,565 19,884
Avge kW/system 3.69 4.24 5.06 5.02 5.01 5.01
Avge Certificates/kW 20.4 19.0 17.6 16.2 14.8 13.5
MW Installed 44.2 80.4 109.5 131.6 108.0 99.5
Eligible Certificates ('000) 901 1,530 1,932 2,127 1,604 1,345
Estimate Forecast Forecast Forecast
Year of installation 2016 2017 2018 2019 2020 2021
Number of Systems Installed 948 1,376 2,068 2,346 2,073 2,150
Avge kW/system 19.44 19.66 22.12 20.91 20.94 20.92
Avge Certificates/kW 20.5 18.9 17.5 16.2 14.9 13.5
MW Installed 18.4 27.1 45.7 49.0 43.4 45.0
Eligible Certificates ('000) 377 511 802 795 645 608

STC Modelling 2019-21 Draft Report
Green Energy Markets 32
9. SWH and Air Sourced Heat Pump Projections
Overview
We estimate that nearly 65,600 SWH systems will be installed and create certificates
in 2018 which will amount to 2.0 million STCs. The most important drivers have been
the level of new home building and policy support measures such as building
regulations and energy efficiency schemes.
New building market
The number of systems installed by state in the new building market has been
reasonably stable on a year to year basis across nearly all states (refer to Figure 5.1
and Attachment 10). This is in sharp contrast to the replacement market.
The primary drivers behind purchase behaviour in this segment include:
• The number of new dwellings
• Building regulations
• The availability of gas to the new development
• Other factors — such as builder influence, environmental performance and
industry marketing, as well as capital and operating costs
SWH sales data, sourced from Industry, suggests that the number of SWH systems
that create certificates is between 10 to 15% lower than the total number of systems
sold. This is not a new trend, and we see no reason for this to change. The SWH
systems that do not create certificates are generally thought to be the result of
difficulties that home builders/renovators face when faced with the prospect of creating
certificates. The difficulties arise from the confusion and uncertainty as to who has the
right to create the certificates. Specifically, when the future owner of the home/building
may not own the system at the time it was installed. This means that using SWH
systems creating certificates will understate the real level of SWH installations in new
homes by 20 to 25%.
Using the data provided by the CER we have isolated the SWH systems installed in
new buildings and analysed historic trends. We use this analysis as the basis for
forecasting SWH installations for the new-build submarket.
The level of new home starts is forecast to fall in NSW and Victoria, with other states
generally expected to increase (Table 9.1).
Table 9.1 Master Builders Association (MBA) – New Home starts
We have used the MBA forecast of new home starts as a guide and have adjusted
these rates for other market factors. The number of SWH systems installed in new
buildings is expected to be relatively flat over the forecast period.
NSW VIC QLD SA WA TAS NT ACT Total
2013 8.5% 2.6% 4.1% 13.6% 10.7% 3.8% 3.6% -6.8% 6.3%
2014 15.5% 7.6% 11.3% 8.4% 10.9% 25.4% 2.8% -9.6% 10.6%
2015 11.2% 9.9% 7.1% -3.9% -10.7% 9.9% 0.5% -18.5% 3.9%
2016 6.7% 5.1% 0.9% -1.5% -22.0% -13.9% -8.2% -16.4% -1.4%
2017 -3.6% -0.5% -0.7% -1.5% -13.4% -7.7% -13.8% -3.6% -3.4%
2018 -11.7% -5.0% -2.6% -1.3% -4.5% 2.2% -3.2% 1.4% -5.6%
2019 -5.4% -3.8% 2.4% 1.5% 0.9% 3.3% 5.4% 14.4% -1.5%
2020 2.2% -0.3% 5.8% 2.5% 6.3% 2.0% 7.3% 7.8% 2.9%
2021 -1.0% -3.0% -2.0% -3.0% 2.0% -4.4% 4.3% -0.5% -1.6%

STC Modelling 2019-21 Draft Report
Green Energy Markets 33
The level of SWH systems creating certificates is summarised in Figure 9.1. Victoria
which has the most progressive new building regulations remains the leading state for
this segment.
Figure 9.1 SWH Systems installed claiming certificates for New Homes by state
Replacement submarket
At the time of replacement, most hot water systems are replaced with the same or
similar type of system. The dynamics of the replacement market, which are often
dictated by a rush to replace a broken or failed water heater, mean there is little time
and/or financial liquidity to make thoroughly researched decisions. Thus, historically,
the majority of water heater replacements have been on a ‘like-for-like’ basis.
There have been a range of state-based schemes, incentives and/or regulations,
particularly for the replacement of electric resistance water heaters (EWH).
The only material rebates that are currently available are in Victoria through the
Victorian Energy Upgrade (VEU) which includes SWH as an eligible activity and the
Governments new Solar Program. Under the VEU, a EWH system replaced by a SWH
system can generate between 30 to 50 Victorian Energy Efficiency Certificates
(VEECs). VEECs provide an added financial incentive of $400 to $1200 that helps drive
extra SWH system installations in Victoria. Under the Solar Program a $1000 rebate
will be available on the installation of a SWH.
We expect the replacement market for SWH to be relatively flat over the forecast period
other than in Victoria where the new solar program is expected to result in strong growth
in installations over the next three years.

STC Modelling 2019-21 Draft Report
Green Energy Markets 34
Figure 9.2 Replacement SWH Systems installed claiming certificates by state
Certificates created from the installation of water heater systems
We have assumed that the average certificates per system (on a state basis) for the
2019 to 2021 forecast period will be similar to the average levels achieved over the
2017 to 2018 period.
Table 9.4 Certificate creation from SWH
Estimate Forecast Forecast Forecast
Year of installation 2016 2017 2018 2019 2020 2021
New Buildings
Number of Systems Installed 34,182 35,352 36,333 35,994 37,055 36,764
Avge Certificates/System 30.3 30.0 30.1 30.1 30.1 30.1
Eligible Certificates ('000) 1,035 1,061 1,095 1,083 1,115 1,107
Replacement
Number of Systems Installed 27,836 28,774 29,256 31,216 31,949 32,714
Avge Certificates/System 31.2 30.2 30.6 30.4 30.4 30.4
Eligible Certificates ('000) 870 870 894 948 970 994
Total
Number of Systems Installed 62,018 64,126 65,588 67,211 69,004 69,477
Avge Certificates/System 31 30 30 30 30 30
Eligible Certificates ('000) 1,905 1,931 1,989 2,031 2,086 2,101

STC Modelling 2019-21 Draft Report
Green Energy Markets 35
10. Other small generating units
Wind and Hydro SGUs remain an extremely small part of STC creation. We do not expect certificate creation will be material over the forecast period for these fuel sources and as a result we have excluded them from this analysis.

STC Modelling 2019-21 Draft Report
Green Energy Markets 36
11. Resources
Resources utilised in our modelling have included:
• Clean Energy Regulator data
• ABS 2016 Census data and other publications including:
o 81650 Counts of Australian Businesses
o 8752.0 Building Activity;
o 41300 State and Territory Data;
o 3236 Household and Family Projections;
o 3101.0 Australian Demographic Statistics
o 4602.0 Environmental Issues (for water heater system and gas usage
data)
• GEM solar water heater and solar PV installation models
• GEM solar PV payback model
• Australian PV Institute
• State and territory government information on feed-in tariffs, SWH rebates and
other programs such as the Victorian Energy Efficiency Target
• PV industry analyst module and inverter price forecasts
• Master Builder Association Housing Forecasts
• ESAA, Electricity Gas Australia 2014
• Australian Energy Market Commission, Residential Electricity Price Trends
report, December 2017 and December 2018


![[Aviation] Modelling Manuals 01 - Basic Aviation Modeling [Osprey Modelling Manuals] [scale model.pdf](https://img.pdfslide.us/doc/110x75/563db9b8550346aa9a9f47bb/aviation-modelling-manuals-01-basic-aviation-modeling-osprey-modelling.jpg)