Embed Size (px)
Citation preview

Small-Scale Farming, Forest Based-Activities and Deforestation in the Tridom Transboundary Sentinel Landscape - Congo Basin
(Work in progress)
Jonas NGOUHOUO POUFOUN [email protected] (INRA/LEF, BETA) Sabine CHAUPAIN-GUILLOT (BETA), Eric KERE NAZINDIGOUBA (INRA CESER)
Dénis Jean SONWA (CIFOR), Louis VERCHOT (CIFOR)
First Annual FLARE Network Conference: November 27th – 30th, 2015, Paris

Deforestation, Livelihood and GHGs emission
• Tropical deforestation : 2,200 to 6,600 MtCO2e
• Tackling tropical deforestation: core to any effortagainst climate change (Bellassen et al, 2008;Pachauri et al, 2008; Ray et al 2013)
• World wide : Agriculture proximately drives 80%of deforestation : 10 to 12% of anthropogenicGHGs emmissions (Verchot, 2014).
• In tropical Africa: Small-scale subsistenceactivities are among main drivers; subsistanceagriculture drives 35% of deforestation(Angelsen, 1995; Hosonuma et al, 2012; Verchotet al, 2014 ).
07/12/2015 Jonas Ngouhouo 2
(Paul Raffaele)
Mongabay
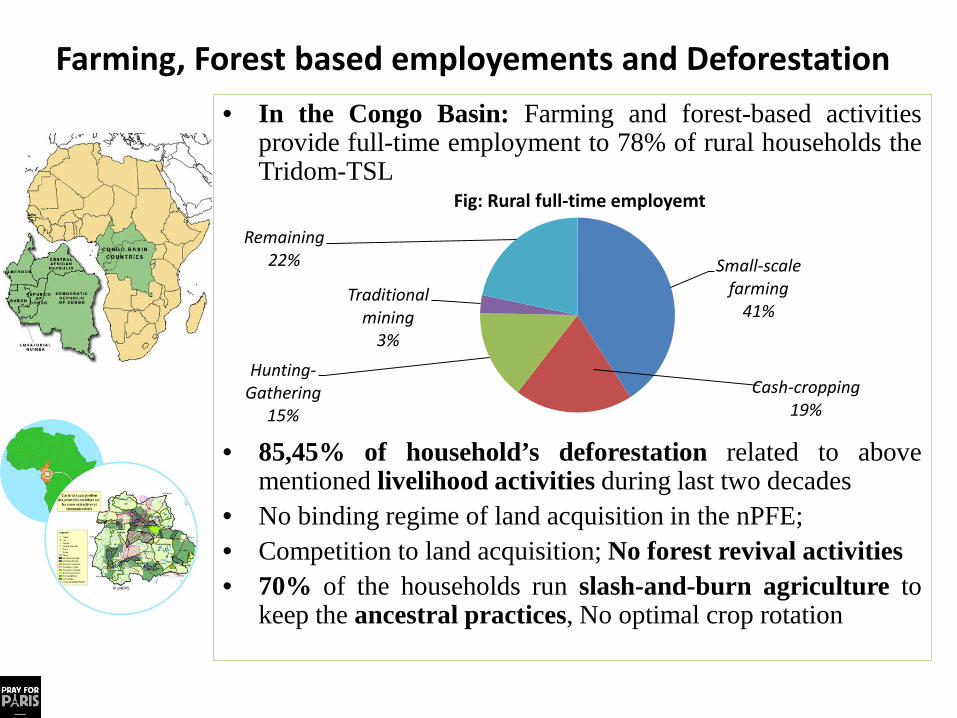
• In the Congo Basin: Farming and forest-based activitiesprovide full-time employment to 78% of rural households theTridom-TSL
• 85,45% of household’s deforestation related to abovementioned livelihood activities during last two decades
• No binding regime of land acquisition in the nPFE;• Competition to land acquisition; No forest revival activities• 70% of the households run slash-and-burn agriculture to
keep the ancestral practices, No optimal crop rotation
Small-scale farming
41%
Cash-cropping 19%
Hunting-Gathering
15%
Traditional mining
3%
Remaining22%
Fig: Rural full-time employemt
Farming, Forest based employements and Deforestation

• Decline crop yields ; $2.4billion to $5 billion production loss acrossthe Congo Basin (Ernst et al 2010).
Fig: Poor cashcrop and agriculture yields in the Tridom-TSL (t/ha)
COP 13, Cop 16 : Non-carbon benefits (NCBs) of REDD+
REDD+ "pro-poor" approach : sustainable livelihood and development
National Key NCBs of Central African countries : diversified and sustainable agriculture, sustainable livestock, sustainable fuelwoodand improved stoves ;
Sustainable livelihood among the NCB of REDD+
0.338 0.2360.5
1.22
00.20.40.60.8
11.21.4
Maximum yieldof 75% of thehouseholds
Tridom-TSLAverage yield
Averageperformance
limited- means
Potential yield
3.59 3.09
16.520
05
10152025
Maximum yieldof 75% of thehouseholds
Tridom-TSLAverage yield
Averageperformance
limited- means
Potential yield
Cocoa yield Banana yield

• Filling the knowledge gap regarding households livelihoodstrategies : a pre-requirement to reducing ecological footprinting.
• An increasing need of understanding the variability of householdsdeforestation at various level as well as its spatial distribution toidentify crictical and priority areas where to start enhancing theaforesaid NCBs.
• What are the proximate and the underlying causes of householdsdeforestation in the Trodom-TSL?
• How much do local people livelihood strategies and otherunderlying factors contribute to small scale deforestation?
Research Questions

• Empirical evidence : causes of tropical deforestation at national, regional, and global scales using macro-level data in developping countries (Geist and Lambin, 2002; Hosonuma and al, 2012 ; Wolfersberger et al, 2015) .
• Forest role in increasing livelihood, reducing poverty (Sunderland et al, 2005).• Few research : linking livelihood production and deforestation at household’s
level in tropical Africa.• Very poor micro-level of data and econometric studies in the Congo Basin.
(Gbetkom, 2009; Hosonuma and al, 2012; Babigumira et al, 2014)
Contribution • Sentinel Landscape pioneering studies (Contribution to building long-run reliable
socioeconomic dataset related to landscape resilience; Unique Dataset)• Address appropriately the drivers of small-scale deforestation in the Congo
Basin (households activity portfolio as potential drivers)• Applying Spatial Durbing Econometrics to the Tridom-TSL analysis.
Litterature review and Contribution
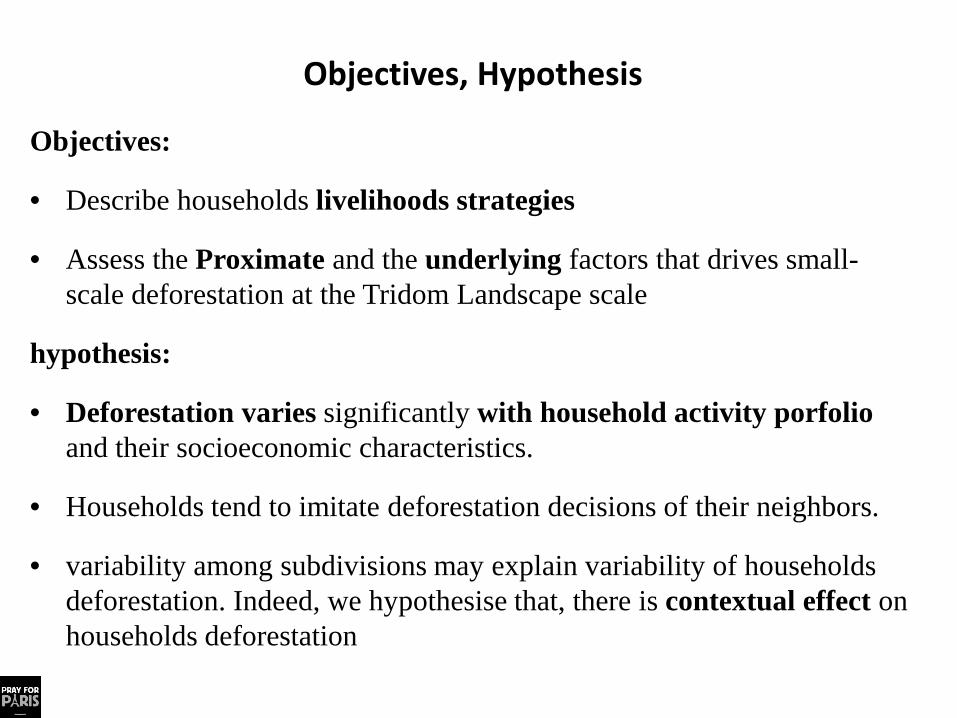
Objectives:
• Describe households livelihoods strategies
• Assess the Proximate and the underlying factors that drives small-scale deforestation at the Tridom Landscape scale
hypothesis:
• Deforestation varies significantly with household activity porfolioand their socioeconomic characteristics.
• Households tend to imitate deforestation decisions of their neighbors.
• variability among subdivisions may explain variability of householdsdeforestation. Indeed, we hypothesise that, there is contextual effect on households deforestation
Objectives, Hypothesis

• STUDY AREA 191.541 km2, (7.5% CBF) 2/3 of 40,000km2 livable inter-zone One of The 12 CBFP priority landscapes 10 protected areas 3 objectives 1-7 inh./ km² , migration Economic stakes, 26 administrative units
• SURVEY Face-to-face questionnaires Random and Stratified Sample (1035 /
65140) December 2013 and July 2014 14 investigators in Cameroon and Gabon 6 training sessions and essay 8 GPS
07/12/2015 Jonas Ngouhouo 8
Study Area, Sampling and Survey

07/12/2015 Jonas Ngouhouo 9
Multilevel Mixed-Effect Models
Testing for Subdivision Effect on households deforestation variability(Kreft & Leeuw, 2002; Hox & Kyle, 2011)
𝑫𝑫𝑫𝑫𝑫𝑫𝑫𝑫𝑫𝑫𝑫𝑫𝑫𝑫𝑫𝒊𝒊𝒊𝒊= 𝒂𝒂 + 𝒃𝒃𝟏𝟏(𝒙𝒙𝒊𝒊𝒊𝒊 − 𝒙𝒙∗𝒊𝒊) + 𝒃𝒃𝟏𝟏(𝒙𝒙∗𝒊𝒊 − 𝒙𝒙∗∗) + 𝜺𝜺𝒊𝒊𝒊𝒊
Spatial Durbin Model to test for spatial spillover effects (Lesage , 2008)
Testing for Relation between deforestion in a subdivision and the neighboring subdivisions
Testing for Neighboring peer effect on households deforestation.
𝑫𝑫𝑫𝑫𝑫𝑫𝑫𝑫𝑫𝑫𝑫𝑫𝑫𝑫𝑫𝑫 = 𝜹𝜹𝜹𝜹𝑫𝑫𝑫𝑫𝑫𝑫𝑫𝑫𝑫𝑫𝑫𝑫𝑫𝑫𝑫𝑫 + 𝜶𝜶𝜶𝜶𝑵𝑵 + 𝑿𝑿𝑿𝑿 + 𝜹𝜹𝑿𝑿𝑾𝑾 + 𝝁𝝁
𝜹𝜹 = strength of spatial dependance
Multilevel and Spatial Econometric Procedures

10.92
48.50
16.23
75.7
22.71
1.64
- 50 100
Forest Based Activities
Agriculture/Cashcrop and forest
Agriculture and Cash crop and…
Portfolio of ativities
Single activities Share
none_activ2
10.92 35.27
13.24 16.23
2.42 13.82
3.00 3.48
1.64
- 10 20 30 40
Forest Based ActivitiesAgriculture and forest
Cashcrop and ForestAgriculture, Cashcrop and Forest
Traditional Good MiningNon Timber Forest Product
Small-scale AgricultureCashcrop
none_activ2
Port
folio
of
ativ
ities
783
Sing
leac
tiviti
es
252
No ne
Descriptive statistiques
Variable Mean Std. Dev. Min MaxDeforest 4,485 5,299 - 56,25 Gender 0,765 0,424 - 1,00
Ag 48,417 14,612 16,00 90,00
Ages_thr 213,324 247,142 0,22 1 719,56
Hsize 6,443 4,017 - 20,00
Total_Value1 6,774 13,284 - 258,05
Autocons_S~e 0,266 0,203 - 1,00
Stay_Vlge 26,877 20,749 - 90,00
Traditional Good Mining 0,025 0,156 - 1,00
Small-scale Agriculture 0,031 0,173 - 1,00 Non Timber Forest Product 0,130 0,337 - 1,00
Cashcrop 0,036 0,186 - 1,00
Forest Based Activities 0,110 0,312 - 1,00
Agriculture and forest 0,350 0,477 - 1,00
Cashcrop and Forest 0,135 0,342 - 1,00 Agriculture, Cashcrop and Forest 0,166 0,373 - 1,00
Households Strategies: Portfolio of Activities
Variables description
9.76
20.12
40.84
2.59
15.14
3.09
8.47
0
5
10
15
20
25
30
35
40
45
Main Activities Percent (%)

Results: Descriptive statistiques
Forest Based Activities Cashcrop AgricultureNon Timber Forest Product HuntingGnetum africanum Sus scrofa (sgl) cocoa bananaRicinodendron heudeloti Hystrixcristata (P. E.) rubber casavaIrvingia gabonensis Antilopinae safout maizepalmnut Cephalophus spp orange peanutmushroom lepus_spp kolanut pineaplehazelnuts Cercocebus spp (S) palmoil cocoyamGarcinia kola Xerus erythropus (R. P.) palmnut vegetableColacuminata Potamochoerus mangoes cucumberbark manis_spp (Pgl) yam tmtoesDacryodes edulis Leopardus tigrinus (C. T.) avocado okraCalamus(rotin) Varanus niloticus et serpent sweet potatoraphiaspp Bunaeopsis aurantiaca (Ch) beansFirewood Nandinia (civette) eggplantTrichoscypha (ndong) loxodonta africana (deplls)
Afrostyraxlepidophyllus bird

Results : Descriptive statistiques
Deforestation segmentation

Descriptive statistiques : Multiple Correspondances analysis
Mvilla
Dja et Lobo
Boumba et Ngoko
Haut nyong
Mvoung
ZadieLope
Ivindo
Woleu
Haut-ntem
OkanoFemale
Male
rural
urban
No education
-Education
No group
Group
CE0 Elephantconflict
Cash crop
Fmu_foad
Gold mining
Hunt gath
Administrative activitiesOther activities
Smal farm
age < 30
30 ≤ age < 35
35 ≤ age < 45
45 ≤ age < 55
55 ≤ age < 65
65 ≤ age < 75
age ≥ 75
Household size < 3
3 ≤ Householdsize < 5
5 ≤ householdsize < 7
7 ≤ householdsize < 9
9 ≤ householdsize < 11
Householdsize ≥ 11
Stay village < 5
10 ≤ stay village < 20
10 ≤ stayvillage < 20
20 ≤ stay village < 30
30 ≤ stay village < 40
40 ≤ stay village < 50
Stay village ≥ 50
Distance < 5
5 ≤ distance < 10
10 ≤ distance < 20 20 ≤ distance < 30
30 ≤ distance < 40
40 ≤ distance < 60
Distance ≥ 60
No agricultural income
Agriculturalincome < 50 000
RA2RA3
RA4
400 000 ≤ agriculturalincome < 800 000
RA6No
deforestationdeforest. < 1
1 ≤ deforest. < 2
2 ≤ deforest. < 4
4 ≤ deforest. < 6
6 ≤ deforest. < 10deforest. > 10
segment 1
segment 2
segment 3
segment 4
segment 5
segment 6
segment 7
segment 8
segment 9segment 10
-2
-1
0
1
2
-1.5 -1 -0.5 0 0.5 1 1.5 2 2.5
axis 2 (3.7 %)
axis 1 (4.7 %)
Sum (1,2 ) = 8.4 %Treshold = 0.12

Results : Mixed-effects ML regression
1 Level 2 Levels
Coef S.E. Coef S.E.
FIXED EFFECTS
Intercept 4,48 0,16 4,375 0,417
RANDOM-EFFECTS
Subdivision level
Var (cons) 3,79 1,26
var(Residual) 28,05 1,2 24,44 1,10
Log livelihood -3098.30 -3053,64
Number Subdivisions 26
Nombre d'individus 1004 1004
LR test vs. linear regression 89,33
Table Variance component model for households deforestation
1. Variance Component Multilevel Model
Model with Subdivision effect VS Model without village effectDeforestation ij = β0 + eij
The overall mean deforestation :4,37 ha per household
Between-subdivision variance (level 2) var(_cons) �σu02 = 3,79
Within-Subdivision variance (level 1) : var(Residual) �σe2 = 24,44
VPC =�σu02
�σu02 + �σe2
= 13,43%
13,43% of households deforestation can be attributed to difference between villages
LR test ∶ 2(log L1 − log L2) = 89,33 >= chibar2 = 0.0001The multilevel model with village effect is valid

Ordinary Least Square Spatial Durbin ModelVariable Coef. Std. Err. Coef. Std. Err.Constant 0,231 0,686 0,013 0,663 Gender 0,803 *** 0,253 0,317 * 0,193 Ag 0,015 * 0,008 0,017 *** 0,007 Ages_thr - 0,001 ** 0,001 - 0,000 0,000 Hsize 0,222 *** 0,046 0,149 *** 0,023 Total_Value 0,042 * 0,024 0,042 *** 0,015 Autocons_Share - 1,604 *** 0,564 - 0,154 0,425 Stay_Vlge 0,035 *** 0,008 0,017 *** 0,005 P2_gold_based_profile2 - 3,039 *** 0,978 - 1,668 * 0,881 P3_agric_only2 1,162 * 0,642 0,992 ** 0,466 P4_ntfp_only2 - 0,692 * 0,371 - 1,038 *** 0,250 P5_cashc_only2 7,565 *** 1,631 4,762 *** 0,605 P6_forest_b_act2 - 1,570 *** 0,300 - 1,165 *** 0,259 P8_cashc_forest2 2,702 *** 0,544 2,316 *** 0,304 P9_agri_cashc_forest2 3,593 *** 0,448 2,889 *** 0,290 W-Gender - - 0,481 ** 0,297 W-Ag - - - 0,005 0,010 W-Hsize - - 0,013 0,035 W-Total_Value - - 0,006 0,015 W-P5_cashc_only2 - - - 0,928 0,825 W-P6_forest_b_act2 - - - 0,303 0,409 W-P8_cashc_forest2 - - - 0,266 0,453 W-P9_agri_cashc_forest2 - - 0,596 0,398 rho - - 0,049 * 0,025 Number of obs 1004 1004
Results : Spatial Durbin Model
Direct effect Indirect effect Total effectCoef. Std. Err. Coef. Std. Err. Coef. Std. Err.
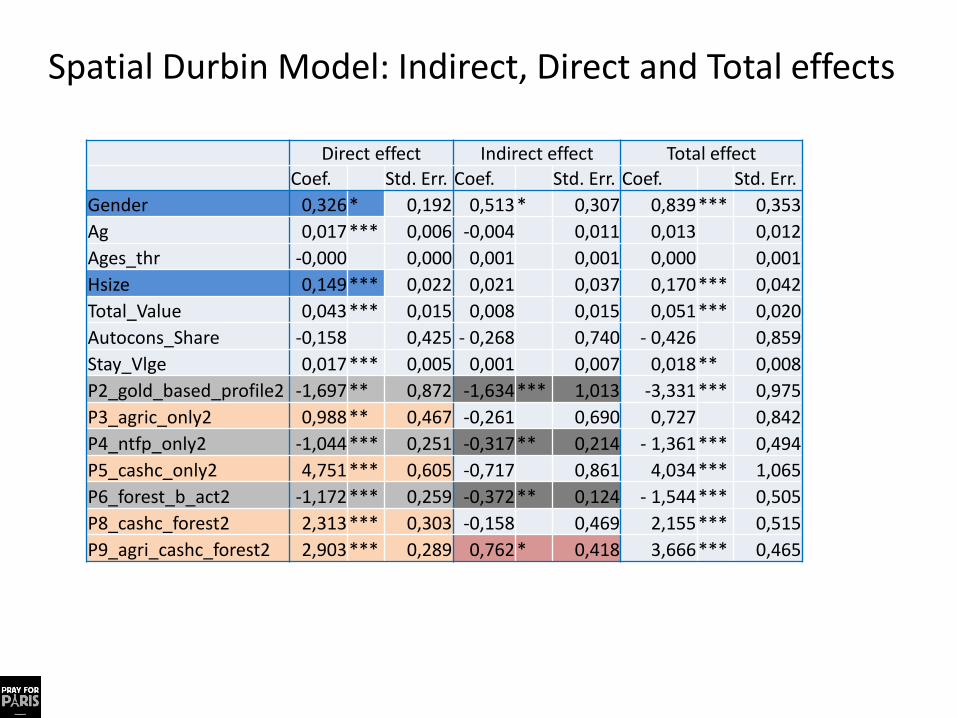
Gender 0,326* 0,192 0,513* 0,307 0,839 *** 0,353 Ag 0,017*** 0,006 -0,004 0,011 0,013 0,012 Ages_thr -0,000 0,000 0,001 0,001 0,000 0,001 Hsize 0,149*** 0,022 0,021 0,037 0,170 *** 0,042 Total_Value 0,043*** 0,015 0,008 0,015 0,051 *** 0,020 Autocons_Share -0,158 0,425 - 0,268 0,740 - 0,426 0,859 Stay_Vlge 0,017*** 0,005 0,001 0,007 0,018 ** 0,008 P2_gold_based_profile2 -1,697** 0,872 -1,634*** 1,013 -3,331 *** 0,975 P3_agric_only2 0,988** 0,467 -0,261 0,690 0,727 0,842 P4_ntfp_only2 -1,044*** 0,251 -0,317** 0,214 - 1,361 *** 0,494 P5_cashc_only2 4,751*** 0,605 -0,717 0,861 4,034 *** 1,065 P6_forest_b_act2 -1,172*** 0,259 -0,372** 0,124 - 1,544 *** 0,505 P8_cashc_forest2 2,313*** 0,303 -0,158 0,469 2,155 *** 0,515 P9_agri_cashc_forest2 2,903*** 0,289 0,762* 0,418 3,666 *** 0,465
Spatial Durbin Model: Indirect, Direct and Total effects

Key Results
• Gender: Households headed by women deforest in mean 0.33 ha less thanhouseholds headed by men
• An incremental change of the household’s size, the head of the household’sage, the seniority in the village increase households deforestation by 0,15 ha; 0,017 ha and 0,17ha respectivelly
• An additional Households doing Cocoa/Rubber as single activity, « cashcrop-forest » and « Agriculture cashcrop-forest » increase household deforestationby 4,7ha; 2,3ha and 2,9 ha respectivelly
• An additional Households running forest-based activities reduces householddeforestation by 1,7ha
• Evidence of spatial dependance of a subdivision deforestation on the neighboring subdivision
• Evidence of Neighboring peer effect on households deforestation (Forest Based activities, Traditional Gold Mining, Agricuture-Cashsrop association)

12/7/2015 18
Thank you for your attention


![Mahatma Gandhi Kashi Vidyapith, Varanasi Department of ...Revised)__13.pdf · [4] Unit – 3 Aristotle: Refutation of Plato’s Idealism, Form and Matter, Causality, Universal and](https://img.pdfslide.us/doc/110x75/5eb5d680b8f988699b05c922/mahatma-gandhi-kashi-vidyapith-varanasi-department-of-revised13pdf-4.jpg)