Embed Size (px)
Citation preview
1
Dorothy J. Phillips, Mark Caparella, Zoubair El Fallah, and Uwe D. Neue
Table of Contents
Small Particle Columns .........................1-7
Sample Dilution IncreasesSensitivity and Resolution....................8-11
Electrophoretic Mobilities..................12-19
Literature Corner..............................20-21
The Choice is Yours ..............................21
What’s New........................................22
How to Reach us ..................................22
Application Notes...............................23-26
EPA Method 604: PhenolsRapid Analysis on Symmetry®
3.5µm Column
Editor: Uwe Neue
ISSN # 1084-0540
AbstractThe customer need for fast and efficient
separations on complex samples such
as pharmaceuticals and biologicals led
Waters to develop fast, efficient, and
reproducible Symmetry® 3.5 µm
columns. Separations using 3.5 µm
columns are 30 to 50 % faster at equal
plate-count compared to 5 µm columns.
For many analytical methods, switching
to Symmetry® 3.5 µm columns can save
time and reduce costs.
Separation methodologies using
Symmetry® 5 µm columns are easily
modified to accommodate Symmetry®
3.5 µm columns because efficiency,
resolution and sensitivity remain the
same. It is shown that Symmetry®
3.5 µm columns have column lifetimes
comparable to Symmetry® 5 µm
columns and are more stable than other
3 and 3.5 µm columns.
IntroductionHigh-performance liquid chromatogra-
phy (HPLC) columns packed with 3 µm
packing materials were first commercial
ised in the early 1980s (1, 2, 3). Until
recently, however, HPLC system com-
patibility and column lifetime issues
have precluded the widespread use
of the 3 µm columns. Relative to the
traditional 5 µm analytical packing
materials, the 3 µm required a shorter
column to compensate for increased
backpressure. The smaller column
volume of the shorter columns resulted
in an increase of the influence of
extra column effects, which negated
the separation efficiency improvements
expected from the smaller particle size.
Volume VIIssue 2, 1996
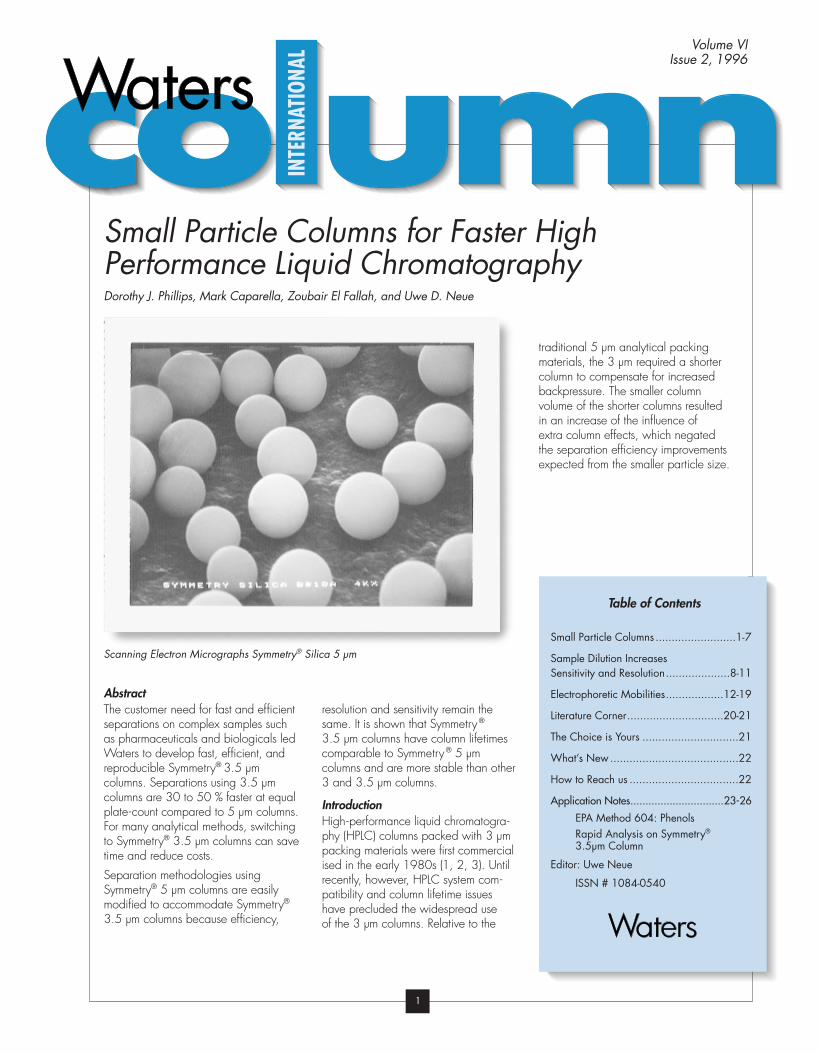
Scanning Electron Micrographs Symmetry® Silica 5 µm
Small Particle Columns for Faster HighPerformance Liquid Chromatography

2
The extra column effects were a direct
result of the HPLC system’s incompati-
bility with small column volumes.
Columns made with 3 µm packing
materials also had shorter lifetimes due
to plugging of the frits. The smaller pore
diameter frits are more prone to plug-
ging by particulates that are either pre-
sent in the sample or arise from abrasion
of system seals.
This paper compares the separation
efficiency of the Symmetry® 3.5 µm
column (4.6 x 100 mm) with the
Symmetry® 5 µm column
(3.9 x 150 mm and 4.6 x 150 mm).
Chromatographic data on several phar-
maceutical compounds show the speed
advantage of the Symmetry® 3.5 µm
column for fast chromatography. Column
lifetimes for Symmetry® columns are
compared with Merck Supersher® 100
RP-18 and Zorbax® SB C18 column.
ExperimentalSulphanilamide, sulphadiazine,
sulphathiazole, sulphamerazine,
sulphamethazine, succinylsulphathia-
zole, beclomethasone, paclitaxel
(taxol), and tamoxifen were from
Sigma Chemical Corporation
(St. Louis, MO). Testosterone propionate,
testosterone benzoate and testosterone
acetate were from U.S. Pharmacopeia
Reference Standards (Rockville, MD).
Butalbital and butabarbital were from
Alltech (Deerfield, IL). Rabbit serum was
from Equitech-Bio (Ingram, TX). Buffers
and mobile phases were made with
reagent grade chemicals and HPLC
grade solvents. Mobile phases were
filtered and degassed.
Symmetry® C18 and C8 columns
(3.9 x 150 mm – 5µm; 4.6 x 150 mm
– 5µm; 4.6 x 100 mm – 3.5 µm)
and Symmetry Sentry™ guard columns
were from Waters (Milford, MA).
Merck Superspher 100 RP-18
(4 mm x 125 mm) was purchased from
EM Separations (Gibbstown, NJ)
Zorbax SB C18 (4.6 x 75 mm, 3.5 µm)
was obtained from MacMod (Chadds
Ford, PA).
HPLC SystemsThe HPLC system used in this study con-
sisted of either a Waters 625 or a 616
LC System, 717plus Autosampler and
the 996 Photodiode Array Detector.
Stability studies with biological samples
were done on the Waters
Figure 1: Plate Count N versus Flow Rate for 5 µm and 3.5 µm Columns
600E Multisolvent Delivery System,
715 Ultra WISP Sample Processor and
490 Programmable Multiwavelength
detector. Control and results manage-
ment were provided by the Millennium®
2010 Chromatography Manager.
The components of the HPLC system for
column lifetime studies with the standard
sulpha drug mixture consisted of a
Waters Model 712 WISP,™590
Programmable Solvent Delivery Module,
and 441 Fixed Wavelength UV/Visible
detector. The Waters 845
Chromatography Data and Control
Station with Expert-Ease™ v.3.0 was
used for system control and data
acquisition.
Stability StudiesStability studies with sulpha drugs and
rabbit serum were done with precolumn
filters between the pumps and the injec-
tors. The temperature was controlled at
25 °C on each HPLC system using a
EuroMark™ Spark Holland Mistral®
Column Thermostat.
The column stability study using 10 µL
of the sulpha drug mixture (10 to
39 mg/mL) was injected on a
Symmetry® C8 Sentry guard column
(3.9 x 20 mm, 5 µm) in line with a
Symmetry® C8 column (4.6 x 100 mm,
3.5 µm). The mobile phase was water/
methanol/ glacial acetic acid 79:20:1
and was recycled during the course
of the experiment. The flow rate was
1.5 mL/min and the detection wave-
length was 254 nm.
Rabbit serum was deproteinated by
mixing two parts acetonitrile to one part
serum. The sample was then centrifuged
at 1500 g for 5 minutes and spiked
with 5 µg/mL of butalbital and
5 µg/mL of butabarbital. The mobile
phase was 0.1 M potassium phos-
phate, pH 6.9/ acetonitrile/ water,
20:30:50 v/v. In this study, the mobile
phase was not recycled. The injection
volume was 15 µL and the mobile
phase flow rate was 1.4 mL/min
(1.25 mL/min for the Superspher
column). The detection wavelength
was 214 nm.
Results and DiscussionEfficiency TheoryThe objective of the Symmetry® 3.5 µm
column is to offer fast separations with-
out sacrificing chromatographic resolu-
tion. Resolution is a function of: the
selectivity, α, which is a measure of the
relative retention of two components in
a mixture, the capacity factor, k, which
is a measure of how well the analyte is
retained and the efficiency, N,
expressed in theoretical plates. Equation
1 shows the dependence of resolution
on α, k and N.
Rs = 1/4 N 1/2 (α-1) [k/(k+1)]
(Equation 1)
The same efficiency can be obtained in
different ways, one can either use long
columns with larger particles or short
N
0
2000
4000
6000
8000
10000
12000
14000
16000
18000
0 1 2 3 4 5
F [mL/min]
150 mm 3.5 µm
150 mm 5 µm
100 mm 3.5 µm
75 mm 3.5 µm
3
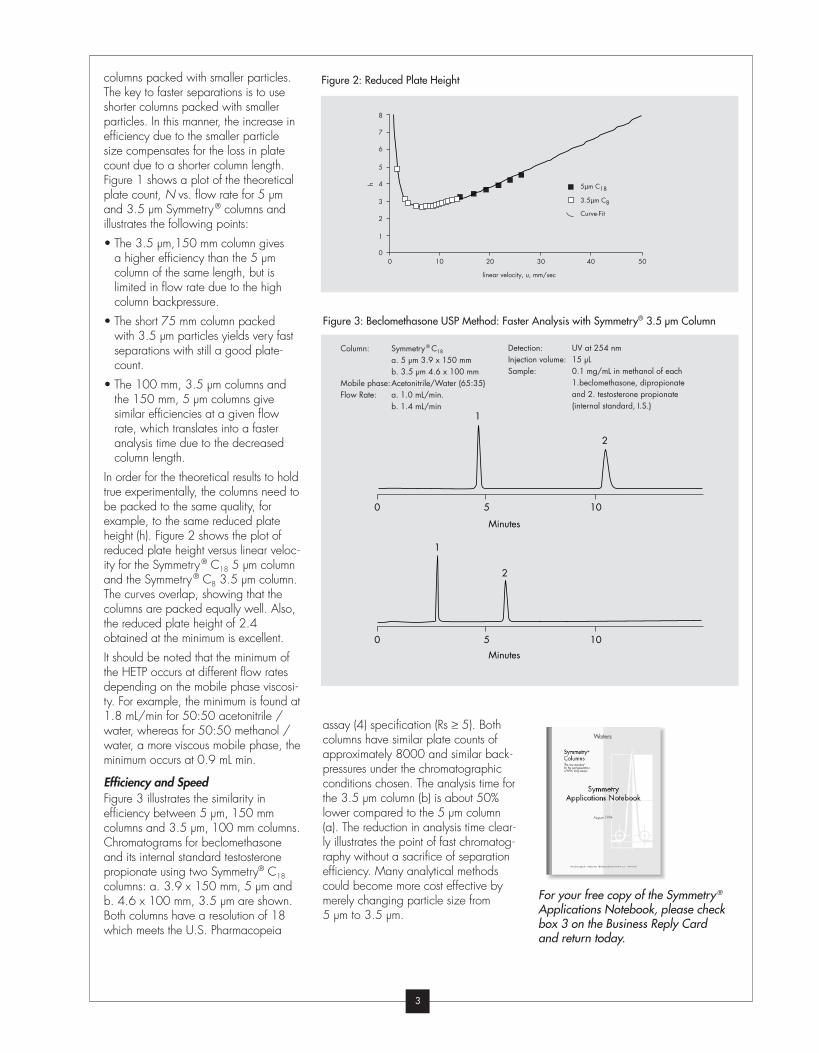
columns packed with smaller particles.
The key to faster separations is to use
shorter columns packed with smaller
particles. In this manner, the increase in
efficiency due to the smaller particle
size compensates for the loss in plate
count due to a shorter column length.
Figure 1 shows a plot of the theoretical
plate count, N vs. flow rate for 5 µm
and 3.5 µm Symmetry® columns and
illustrates the following points:
• The 3.5 µm,150 mm column gives
a higher efficiency than the 5 µm
column of the same length, but is
limited in flow rate due to the high
column backpressure.
• The short 75 mm column packed
with 3.5 µm particles yields very fast
separations with still a good plate-
count.
• The 100 mm, 3.5 µm columns and
the 150 mm, 5 µm columns give
similar efficiencies at a given flow
rate, which translates into a faster
analysis time due to the decreased
column length.
In order for the theoretical results to hold
true experimentally, the columns need to
be packed to the same quality, for
example, to the same reduced plate
height (h). Figure 2 shows the plot of
reduced plate height versus linear veloc-
ity for the Symmetry® C18 5 µm column
and the Symmetry® C8 3.5 µm column.
The curves overlap, showing that the
columns are packed equally well. Also,
the reduced plate height of 2.4
obtained at the minimum is excellent.
It should be noted that the minimum of
the HETP occurs at different flow rates
depending on the mobile phase viscosi-
ty. For example, the minimum is found at
1.8 mL/min for 50:50 acetonitrile /
water, whereas for 50:50 methanol /
water, a more viscous mobile phase, the
minimum occurs at 0.9 mL min.
Efficiency and SpeedFigure 3 illustrates the similarity in
efficiency between 5 µm, 150 mm
columns and 3.5 µm, 100 mm columns.
Chromatograms for beclomethasone
and its internal standard testosterone
propionate using two Symmetry® C18
columns: a. 3.9 x 150 mm, 5 µm and
b. 4.6 x 100 mm, 3.5 µm are shown.
Both columns have a resolution of 18
which meets the U.S. Pharmacopeia
Figure 3: Beclomethasone USP Method: Faster Analysis with Symmetry® 3.5 µm Column
assay (4) specification (Rs ≥ 5). Both
columns have similar plate counts of
approximately 8000 and similar back-
pressures under the chromatographic
conditions chosen. The analysis time for
the 3.5 µm column (b) is about 50%
lower compared to the 5 µm column
(a). The reduction in analysis time clear-
ly illustrates the point of fast chromatog-
raphy without a sacrifice of separation
efficiency. Many analytical methods
could become more cost effective by
merely changing particle size from
5 µm to 3.5 µm.
1
2
1
0 5 10
0 5Minutes
Minutes
10
2
For your free copy of the Symmetry®
Applications Notebook, please checkbox 3 on the Business Reply Cardand return today.
1000
1
2
3
4
5
6
7
8
20
linear velocity, u, mm/sec
30 40 50
h 5µm C18
3.5µm C8
Curve-Fit
Figure 2: Reduced Plate Height
Column: Symmetry ® C18
a. 5 µm 3.9 x 150 mmb. 3.5 µm 4.6 x 100 mm
Mobile phase:Acetonitrile/Water (65:35)Flow Rate: a. 1.0 mL/min.
b. 1.4 mL/min
Detection: UV at 254 nmInjection volume: 15 µLSample: 0.1 mg/mL in methanol of each
1.beclomethasone, dipropionate and 2. testosterone propionate (internal standard, I.S.)

4
Figure 4: Tamoxifen: Comparison of Symmetry® 5 µm versus 3.5 µm Columns
Figure 5: Comparison of Taxol Impurities Profile on Symmetry® 3.5 µm and 5 µm Columns
b: Symmetry C18 3.5 µm (4.6 x 100mm)
a: Symmetry C18 5 µm (3.9 x 150mm)
1
2
1
2
0.004
0.002
0.000
0.004
0.002
0.000
10.00 20.00
10.00 20.00
Minutes
Minutes
AU
AU
a: 5 µm 3.9 x 150 mm
b: 5 µm 3.9 x 150 mm
0 5 10
0
.01
.01
0
15 20
0 5 10 15 20
AU
AU
Minutes
Minutes
4 6
9
4 69
Performance equivalence between
3.5 µm and 5 µm packing is further
illustrated in Figures 4 and 5 where
impurity profiles of pharmaceutical com-
pounds are shown. Figure 4 and Figure
5 show the assays of tamoxifen and
taxol, respectively, on a Symmetry® C18
(3.9 x 150 mm, 3.5 µm) column and
a Symmetry® C18 (4.6 x 100, 5 µm)
column. In Figure 4, both columns
resolve the impurity peaks. However,
the 3.5 µm column separation is
markedly faster. Also, a calculation of
the plate counts for the impurity peaks
actually shows a slight improvement in
efficiency for the shorter 3.5 µm
column.
Essentially the same observations were
made with the taxol assay (Figure 5).
The shorter 3.5 µm column gave a
much shorter analysis time combined
with a slight improvement in plate count
and resolution. A plate count of 8900
was measured for the taxol peak on the
100 mm, 3.5 µm column, while a plate
count of 7100 was obtained on the
150 mm, 5 µm column. This is an
added benefit, since this increased
resolution provides an additional buffer
against column deterioration.
The 3.5 µm columns can be operated
at even faster flow rates to further
reduce analysis times. Figure 6 shows
the separation of testosterone at 1.4
mL/min and 2.8 mL/min. The separa-
tion efficiency at 2.8 mL/min is still
6800 plates (compared to 7500 plates
at the lower flow rate) and the run time
is reduced by half. This is possible due
to the use of acetonitrile as the organic
modifier in the mobile phase.
Acetonitrile-water mixtures have a much
lower viscosity than methanol-water
mixtures, resulting in a much reduced
backpressure. For still faster analysis or
to accommodate highly aqueous mobile
phases within normal pressure limits,
the 3.5 µm packing is also available in
75 mm columns.
Mobile Phase: 50 mM potassium phosphate, pH 3/acetonitrile 60:40
Flow Rates a. 0.7 mL/minb. 1.05 mL/min
Detector: UV at 240 nmSample: 4 µL of 5 mg/mL
Columns: Symmetry® C8
Mobile Phase: 20 mM ammonium acetate, pH 5/acetonitrile/methanol 50:40:10
Flow Rates a. 1.0 mL/minb. 1.4 mL/min
Detector: UV at 230 nmSample: taxol at 100 µg/mLInjection Volume: 25 µl injected
5
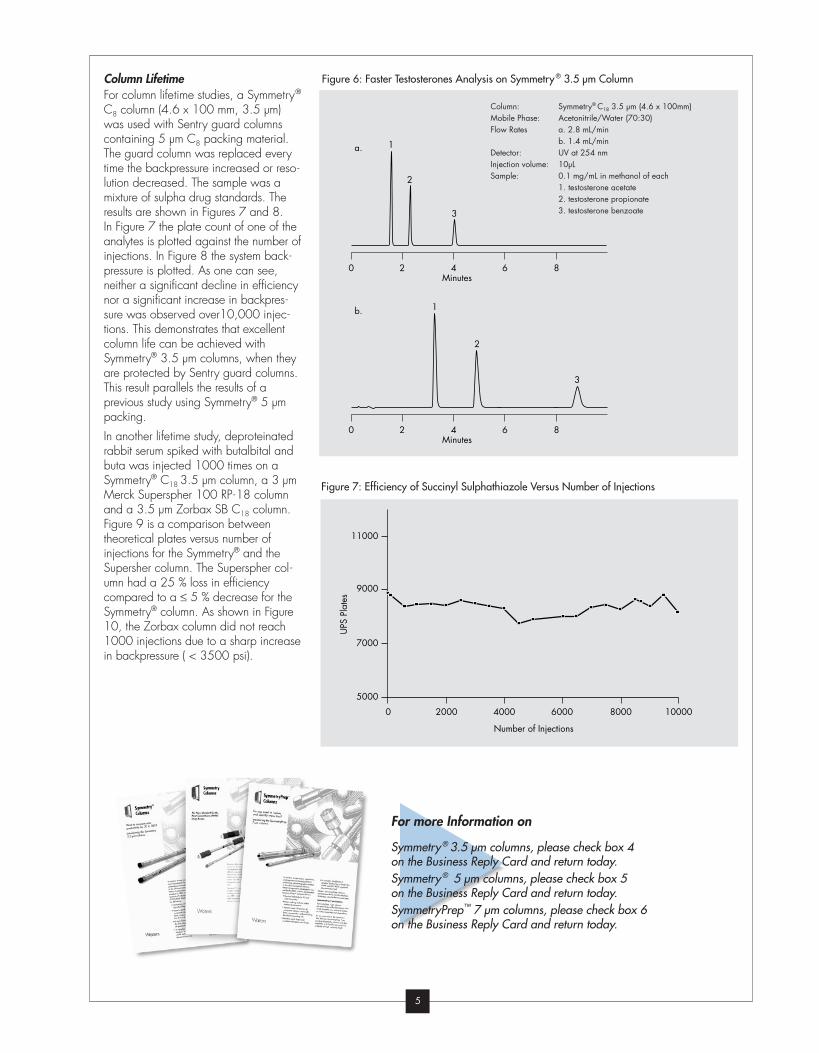
Figure 6: Faster Testosterones Analysis on Symmetry® 3.5 µm ColumnColumn LifetimeFor column lifetime studies, a Symmetry®
C8 column (4.6 x 100 mm, 3.5 µm)
was used with Sentry guard columns
containing 5 µm C8 packing material.
The guard column was replaced every
time the backpressure increased or reso-
lution decreased. The sample was a
mixture of sulpha drug standards. The
results are shown in Figures 7 and 8.
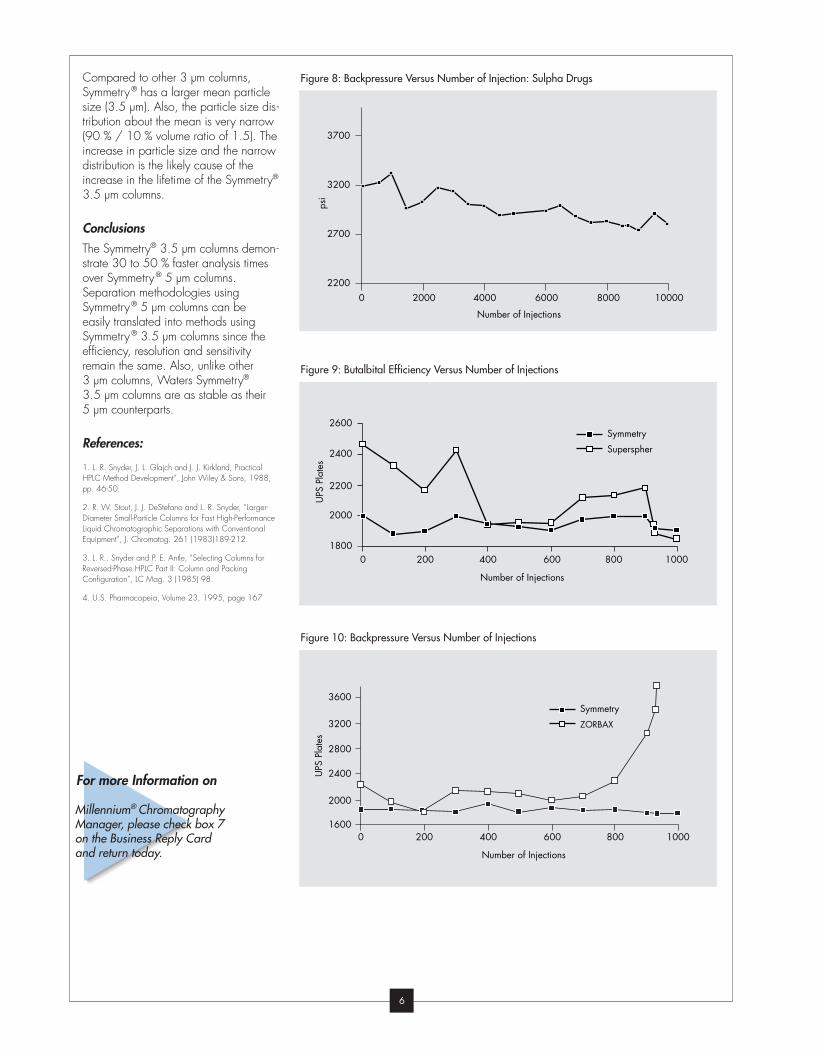
In Figure 7 the plate count of one of the
analytes is plotted against the number of
injections. In Figure 8 the system back-
pressure is plotted. As one can see,
neither a significant decline in efficiency
nor a significant increase in backpres-
sure was observed over10,000 injec-
tions. This demonstrates that excellent
column life can be achieved with
Symmetry® 3.5 µm columns, when they
are protected by Sentry guard columns.
This result parallels the results of a
previous study using Symmetry® 5 µm
packing.
In another lifetime study, deproteinated
rabbit serum spiked with butalbital and
buta was injected 1000 times on a
Symmetry® C18 3.5 µm column, a 3 µm
Merck Superspher 100 RP-18 column
and a 3.5 µm Zorbax SB C18 column.
Figure 9 is a comparison between
theoretical plates versus number of
injections for the Symmetry® and the
Supersher column. The Superspher col-
umn had a 25 % loss in efficiency
compared to a ≤ 5 % decrease for the
Symmetry® column. As shown in Figure
10, the Zorbax column did not reach
1000 injections due to a sharp increase
in backpressure ( < 3500 psi).
Figure 7: Efficiency of Succinyl Sulphathiazole Versus Number of Injections
1
2
3
1
2
3
0 2 4 6 8Minutes
0 2 4 6 8Minutes
a.
b.
11000
9000
7000
5000
20000 4000 6000 8000 10000
Number of Injections
UPS
Pla
tes
Column: Symmetry® C18 3.5 µm (4.6 x 100mm)Mobile Phase: Acetonitrile/Water (70:30)Flow Rates a. 2.8 mL/min
b. 1.4 mL/minDetector: UV at 254 nmInjection volume: 10µLSample: 0.1 mg/mL in methanol of each
1. testosterone acetate2. testosterone propionate3. testosterone benzoate
For more Information on
Symmetry® 3.5 µm columns, please check box 4 on the Business Reply Card and return today.Symmetry® 5 µm columns, please check box 5 on the Business Reply Card and return today.SymmetryPrep™ 7 µm columns, please check box 6 on the Business Reply Card and return today.
6
Compared to other 3 µm columns,
Symmetry® has a larger mean particle
size (3.5 µm). Also, the particle size dis-
tribution about the mean is very narrow
(90 % / 10 % volume ratio of 1.5). The
increase in particle size and the narrow
distribution is the likely cause of the
increase in the lifetime of the Symmetry®
3.5 µm columns.
ConclusionsThe Symmetry® 3.5 µm columns demon-
strate 30 to 50 % faster analysis times
over Symmetry® 5 µm columns.
Separation methodologies using
Symmetry® 5 µm columns can be
easily translated into methods using
Symmetry® 3.5 µm columns since the
efficiency, resolution and sensitivity
remain the same. Also, unlike other
3 µm columns, Waters Symmetry®
3.5 µm columns are as stable as their
5 µm counterparts.
References:
1. L. R. Snyder, J. L. Glajch and J. J. Kirkland, PracticalHPLC Method Development”, John Wiley & Sons, 1988,pp. 46-50.
2. R. W. Stout, J. J. DeStefano and L. R. Snyder, “Larger-Diameter Small-Particle Columns for Fast High-PerformanceLiquid Chromatographic Separations with ConventionalEquipment”, J. Chromatog. 261 (1983)189-212.
3. L. R.. Snyder and P. E. Antle, “Selecting Columns forReversed-Phase HPLC Part II: Column and PackingConfiguration”, LC Mag. 3 (1985) 98.
4. U.S. Pharmacopeia, Volume 23, 1995, page 167
Figure 9: Butalbital Efficiency Versus Number of Injections
Figure 10: Backpressure Versus Number of Injections
2600
2400
2200
2000
18000 200 400 600 800 1000
Number of Injections
UPS
Pla
tes
Symmetry
Superspher
3600
3200
2800
2400
2000
16000 200 400 600 800 1000
Number of Injections
UPS
Pla
tes
Symmetry
ZORBAX
Figure 8: Backpressure Versus Number of Injection: Sulpha Drugs
3700
3200
2700
220020000 4000 6000 8000 10000
Number of Injectionsps
i
For more Information on
Millennium® ChromatographyManager, please check box 7on the Business Reply Cardand return today.

7
Dimension 1.0 mm x 150 mm 2.1 mm x 50 mm 4.6 mm x 50 mm 4.6 mm x 75 mm 4.6 mm x 100 mm 4.6 mm x 150 mmC8 WAT248059 WAT200650 WAT200625 WAT066224 WAT066220 WAT200632
C18 WAT248072 WAT200624 WAT200620 WAT066200 WAT066204 WAT200630
Dimension 2.1 mm x 150 mm 3.0 mm x 150 mm 3.9 mm x 150 mm 4.6 mm x 150 mm 4.6 mm x 250 mmC8 WAT056955 WAT054230 WAT046970 WAT045995 WAT054270
C18 WAT056975 WAT054200 WAT046980 WAT045905 WAT054275
Dimension 3.9 mm x 150 mm 4.6 mm x 150 mm 4.6 mm x 250 mmC8 WAT054440 WAT054442 WAT054444
C18 WAT054452 WAT054454 WAT054456
Dimension 3.0mm x 150 mm 3.9 mm x 150 mm 4.6 mm x 150 mm 4.6 mm x 250 mmC8 WAT054434 WAT046955 WAT054435 WAT054438
C18 WAT054446 WAT047210 WAT054448 WAT054450
Dimension 3.9 mm x 50 mm 3.9 mm x 150 mm 4.6 mm x 150 mm 4.6 mm x 250 mmC8 WAT054240 WAT054235 WAT054255 WAT054245
C18 WAT054220 WAT054205 WAT054210 WAT054215
Ordering Information
Symmetry® Analytical Steel Columns
Symmetry® Steel Cartridge Columns (All cartridge columns require reusable endfittings.)
Symmetry® C8 5 µm 2/pkg 3.9 mm x 20 mm WAT054250
Symmetry® C18 5 µm 2/pkg 3.9 mm x 20 mm WAT054225
Integrated Guard Holder
(for Waters steel cartridge columns** only) WAT046905
Universal Guard Holder (for any HPLC column) WAT046910
Sentry™ Guard Columns* and Guard Holders
Symmetry® Validation Kit (three steel columns or steel cartridges from 3 different batches of packing materials)
Particle Size Quantity Dimensions Part No.
End Connector Kit (includes 2 sets of reusable endfittings, 2 C-Clips and Kalrez o-rings) WAT037525
Part No.
* Sentry guard columns can be used with either the steel cartridge columns but require the appropriate guard holder.
** For Waters 3.9 mm x 50 mm cartridge column, you must use the Universal Guard Holder.
For more Information onSymmetry® columns, pleaserefer to box numbers 4, 5,6, on the Business ReplyCard. To receive informationsimply check the appropriatebox number.
Symmetry 5 µm Columns
Symmetry 5 µm Cartridge Columns
Symmetry 5 µm Columns
Symmetry 5 µm Cartridge Columns
Symmetry 3.5 µm Columns
Dimension 4.6 mm x 75 mm 4.6 mm x 100 mmC8 WAT066260 WAT066265
C18 WAT066210 WAT066215
Symmetry 3.5 µm Cartridge Columns

8
Introduction and OverviewMarginal or insufficient sensitivity is
not uncommon in chromatographic
analysis. It may be encountered in the
analysis of the metabolic fate of a drug
or in the investigation of environmental
pollutants. In this paper we look at a
specific set of circumstances where low
sensitivity can be improved through a
simple operation.
The principle that we employed is the
use of the analytical column as an
enrichment column. Sample enrichment
permits a significant increase in the
injection volume which results in a pro-
portional increase in sensitivity. A very
specific example is used to demonstrate
the principle. But the general principle
is useful in many other circumstances
as well.
In this example, the analytical method
is an isocratic reversed-phase method.
The sample is subjected to a solid
phase extraction step prior to chromato-
graphic analysis for sample cleanup
and enrichment. A typical instance is
a metabolite assay from a biological
matrix like serum or urine. In this case,
the solid-phase extraction step fre-
quently is a reversed-phase method as
well, using a Waters Sep-Pak® cartridge
with the same or similar chemistry as
the analytical column. In a commonly
followed procedure, the reversed-phase
Sep-Pak cartridge is first conditioned
and the sample is then loaded onto the
cartridge. Then the adsorbed sample is
washed with a polar eluent, typically
water or buffer containing a small
amount of organic solvent.
Subsequently, the sample is eluted from
the solid-phase extraction cartridge with
an organic solvent such as methanol.
The methanol extract is then evaporated
to dryness, and the sample is redis-
solved in mobile phase for HPLC analy-
sis. This sequence of steps usually results
in an enrichment of the sample as well
as a partial sample clean-up.
Sample Dilution Increases Sensitivity and ResolutionUwe D. Neue and Ed Serowik
A significant disadvantage of this proce-
dure is the fact that a fairly broad spec-
trum of hydrophobicity lies between the
sample washing step and the elution
step. Sample constituents with a larger
hydrophobicity than the metabolites are
eluted from the Sep-Pak cartridge
together with the analytes. They are
retained on the analytical column more
strongly than the analytes of interest.
Consequently, they will appear either
late in the analytical chromatogram,
resulting in excessively long analysis
times, or they may even interfere with
subsequent analyses. The latter case
would necessitate a washing step after
each chromatogram, which together
with the accompanying reequilibration
of the column significantly increases
the run time for an assay and reduces
productivity.
A better approach is an elution proce-
dure, in which a solvent is used that is
just strong enough to elute the metabo-
lites efficiently, but leaves compounds
of higher hydrophobicity on the Sep-Pak
cartridge. If the bonded-phase used for
sample preparation is the same as or
similar to the bonded phase in the ana-
lytical column, a good elution solvent
would be the chromatographic mobile
phase with the amount of organic modi-
fier increased by about 20 %. Therefore,
if the mobile phase for the analytical
column is 30 % methanol / 70 % buffer,
the elution solvent for the Sep-Pak
cartridge should be 50 % methanol /
50 % buffer.
However, using mixtures of organic sol-
vent and water or buffer as the elution
solvent has one major disadvantage: it
is very difficult and time-consuming to
evaporate aqueous mixtures to dryness
for reconstitution of the sample. If on
the other hand, the sample is injected
without this step, there is, a limitation
amount that can be injected onto the
column without loss of resolution. To
solve this dilemma, the method of
simply diluting the sample with water or
buffer, and injecting a larger sample
volume was employed. To use a dilution
step to increase sensitivity is counterintu-
itive, but the increased sample volume
that can be injected overcompensates
for the dilution.
ExperimentalWe used ethyl- and propylparaben at
a concentration of 0.2 µg/mL as our
model system. The column used was a
Symmetry® C18 5 µm 3.9 mm x
150 mm column. The mobile phase
consisted of 35 % acetonitrile and 65 %
water, resulting in an elution time of
about 5 minutes for ethylparaben and
about 10 minutes for propylparaben.
The sample was dissolved in 55 % ace-
tonitrile, 45 % water to mimic the elution
conditions from a C18 Sep-Pak cartridge
needed for a quick and complete elu-
tion of the analytes. For the enrichment
experiments, the sample was diluted
with water in ratios of 1:1, 2:1, 4:1,
5:1, 6:1, 7:1, 11:1, and 15:1. The
amount injected was varied in propor-
tion to the dilution such that a constant
mass of sample was injected.
DiscussionIn order to maximise sensitivity under
fixed mobile phase conditions, we
would like to inject the largest mass of
sample onto the column that is possible.
Ideally, the entire sample should be
injected (although there may be cases
where one chooses to retain a portion
of the sample for repeat analysis). The
factor that limits how much can be
injected is the loss of resolution due to
volume overload. Sometimes, we have
enough sample available that this limit is
encountered using a column with a stan-
dard diameter. However, in most cases
the sample amount is limited, and a col-
umn with a smaller diameter should be
considered.
An increase in injection volume leads to
a broadening of the peak and to a loss
in resolution. Let us first consider the
9
case in which the sample is dissolved in
mobile phase. Table 1 shows the injec-
tion volume as a function of the retention
factor k for different column dimensions
that result in either a 5 % or 10 % loss
in resolution.
If we are willing to accept about 10 %
loss in resolution between peaks, we
can inject about 50 % of the peak-vol-
ume on the column. If we are willing to
accept only a 5 % loss in resolution, we
are still able to inject about 33 % of the
peak-volume on the column. Therefore,
typical tolerable injection volumes for a
3.9 mm x 150 mm, 5 µm column
would be between 40 and 160 µL,
depending on the retention factor of the
sample and the resolution requirement.
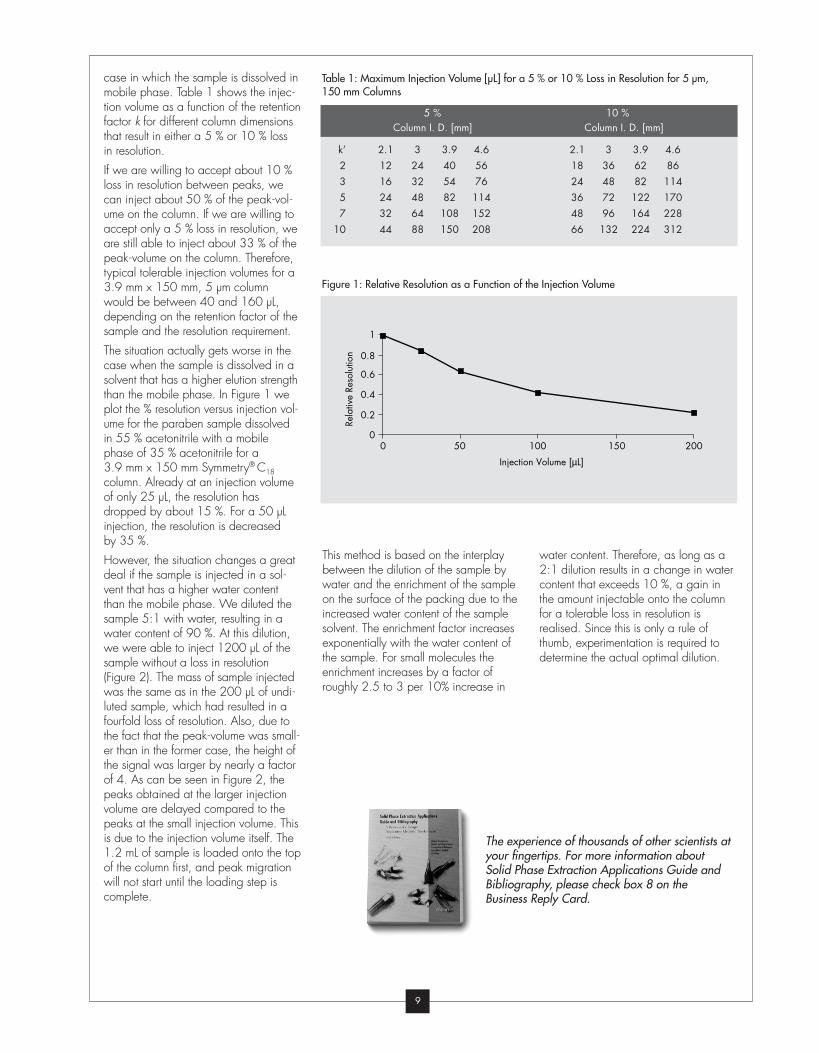
The situation actually gets worse in the
case when the sample is dissolved in a
solvent that has a higher elution strength
than the mobile phase. In Figure 1 we
plot the % resolution versus injection vol-
ume for the paraben sample dissolved
in 55 % acetonitrile with a mobile
phase of 35 % acetonitrile for a
3.9 mm x 150 mm Symmetry® C18
column. Already at an injection volume
of only 25 µL, the resolution has
dropped by about 15 %. For a 50 µL
injection, the resolution is decreased
by 35 %.
However, the situation changes a great
deal if the sample is injected in a sol-
vent that has a higher water content
than the mobile phase. We diluted the
sample 5:1 with water, resulting in a
water content of 90 %. At this dilution,
we were able to inject 1200 µL of the
sample without a loss in resolution
(Figure 2). The mass of sample injected
was the same as in the 200 µL of undi-
luted sample, which had resulted in a
fourfold loss of resolution. Also, due to
the fact that the peak-volume was small-
er than in the former case, the height of
the signal was larger by nearly a factor
of 4. As can be seen in Figure 2, the
peaks obtained at the larger injection
volume are delayed compared to the
peaks at the small injection volume. This
is due to the injection volume itself. The
1.2 mL of sample is loaded onto the top
of the column first, and peak migration
will not start until the loading step is
complete.
k’ 2.1 3 3.9 4.6 2.1 3 3.9 4.62 12 24 40 56 18 36 62 863 16 32 54 76 24 48 82 1145 24 48 82 114 36 72 122 1707 32 64 108 152 48 96 164 228
10 44 88 150 208 66 132 224 312
Table 1: Maximum Injection Volume [µL] for a 5 % or 10 % Loss in Resolution for 5 µm, 150 mm Columns
5 % 10 %Column I. D. [mm] Column I. D. [mm]
Figure 1: Relative Resolution as a Function of the Injection Volume
The experience of thousands of other scientists atyour fingertips. For more information about Solid Phase Extraction Applications Guide andBibliography, please check box 8 on the Business Reply Card.
1
0.8
0.6
0.4
0.2
00 50
Injection Volume [µL]
100 150 200
Rela
tive
Reso
lutio
n
This method is based on the interplay
between the dilution of the sample by
water and the enrichment of the sample
on the surface of the packing due to the
increased water content of the sample
solvent. The enrichment factor increases
exponentially with the water content of
the sample. For small molecules the
enrichment increases by a factor of
roughly 2.5 to 3 per 10% increase in
water content. Therefore, as long as a
2:1 dilution results in a change in water
content that exceeds 10 %, a gain in
the amount injectable onto the column
for a tolerable loss in resolution is
realised. Since this is only a rule of
thumb, experimentation is required to
determine the actual optimal dilution.

10
Figure 2: Overlay of a 200 µL Injection of the Original Sample and a 1200 µL Injection afterDilution
Figure 3: Resolution versus Injected Amount for Different Dilutions
Figure 3 shows the results of some dilu-
tion experiments. Resolution is plotted
against the amount of sample injected.
In order to inject a constant amount of
sample, the injection volume was
increased in proportion to the dilution.
For example, while a 40 ng injection
corresponded to 200 µL of undiluted
sample, it corresponded to 1600 µL of
1:7 diluted sample. One can see that
for the 40 ng injection, a dilution of
about 1:5 to 1:6 gave optimal results,
while for the 20 ng sample any dilution
between 1:2 and 1:7 gave equivalent
results.
There is an optimal dilution factor that
maximises the amount of sample that
can be injected without peak distortion.
It can be modeled mathematically, if the
relationship of the retention factor with
solvent composition is known. However,
one can assume some typical values
and use this model as a guide. In our
model, we assumed that the sample has
been eluted from the Sep-Pak cartridge
using an eluent that contains 20 % more
organic solvent than the mobile phase.
We then calculated the optimal dilution
factor as a function of the mobile phase
composition. The enrichment factor is
the ratio of the sample volume that can
be injected after dilution compared to
the sample volume that can be injected
if the sample is dissolved in mobile
phase. Table 2 shows the results of the
calculation for different mobile phase
compositions. The lower values are
more typical when methanol is used as
organic modifier. The higher values are
more typical for acetonitrile. It is clear
that the dilution method works best for
mobile phases containing large amounts
of organic solvents.
00
20
40
60
80
100
%
4 6 8 10Minutes
14
12
10
8
6
4
2
00 5 10 15 20
Amount [ng]
25 30 35 40
No Dilution1:1 Dilution1:2 Dilution1:5 Dilution1:6 Dilution1:7 Dilution
Reso
lutio
n
Waters Applications Notes
1.5 AU
02
1
2 3
4
5
6
7
8
9
10
11
12
46
810 12 14 16 18 20
Abs
orba
nce
230
nm
Minutes
Rapid Polyolefin Additive Separation Using Nova-Pak ® C18
Objective:The objective of this application note is to
demonstrate the utility of reversed-phase
HPLC for large scale purifica-tions of DMT
protected synthetic oligonucleotides.Details:Synthetic oligonucleotides are success-fully
used in a wide variety of applica-tions
ranging from use as hybridization probes to
utilization as primers for DNA sequencing
and the polymerase chain reaction* (PCR).
Most recently, studies have shown the
effectiveness of using standard (i.e. phosphodiester, P=0) or phosphole back-
bone modified (i.e. phosphoro-thioated,
P=S) oligonucleotides to selectively inhibit
the production of targeted proteins within
cells. As such, “antisense and related
technology investigations” require milligram
to multigram amounts of purified synthetic
DNA. Reversed-phase HPLC provides a
rapid and cost effective technique for the
isolation of either phosphodiester or phosphorothioated full length
oligonucleotide products for these applications.
Column: Bondapak® HC18 HA (8 x 100mm
Radial-Pak™ cartridge)Eluent A: 100mM ammonium acetate, pH
7.2/methanol (95:5, v/v)
Eluent B: Methanal/Milli-Q® water (95:5, v/v)
Sample: Phosphorothioated 21 mer (DMT
protected)Injection: 12 mLs, containing 624 O.D.260nm
units (21 mgs) of oligonucleotide
in 70% A and 30% B, injected into
Milligram quantities of DMT protected synthetic oligonucleotides can be rapidly purified from undesired synthesis reaction by-products using Bondapak
HC18 HA reversed-phase material in an 8 x 100mm Radial-Pak 0
10
20
1
2
3
4
56
78
9
10
1112
13
14
15
16
17 18
30
Minutes
140
1 = AMQ2 = Asp3 = Ser4 = Glu5 = Gly6 = His
7 = NH38 = Arg9 = Thr10 = Ala11 = Pro12 = Tyr
13 = Val14 = Met15 = Lys16 = IIe17 = Leu18 = Phe
Fluo
resc
ence
Res
pons
em
V
Analysis of Hydrolyzed Bovine Serum Albumin Using Waters
AccQ•Tag™ Method for Amino Acid Analysis
Objective:The objective of this application note is to
demonstrate the utility of reversed-phase
HPLC for large scale purifica-tions of DMT
protected synthetic oligonucleotides.Details:Synthetic oligonucleotides are success-fully
used in a wide variety of applica-tions
ranging from use as hybridization probes to
utilization as primers for DNA sequencing
and the polymerase chain reaction* (PCR).
Most recently, studies have shown the
effectiveness of using standard (i.e. phosphodiester, P=0) or phosphole back-
bone modified (i.e. phosphoro-thioated,
P=S) oligonucleotides to selectively inhibit
the production of targeted proteins within
cells. As such, “antisense and related
technology investigations” require milligram
to multigram amounts of purified synthetic
DNA. Reversed-phase HPLC provides a
rapid and cost effective technique for the
isolation of either phosphodiester or phosphorothioated full length
oligonucleotide products for these applications.
Column: Bondapak® HC18 HA (8 x 100mm
Radial-Pak™ cartridge)Eluent A: 100mM ammonium acetate, pH
7.2/methanol (95:5, v/v)
Eluent B: Methanal/Milli-Q® water (95:5, v/v)
Sample: Phosphorothioated 21 mer (DMT
protected)Injection: 12 mLs, containing 624 O.D.260nm
units (21 mgs) of oligonucleotide
in 70% A and 30% B, injected into
Milligram quantities of DMT protected synthetic oligonucleotides can be rapidly purified from undesired synthesis reaction by-products using Bondapak
HC18 HA reversed-phase material in an 8 x 100mm Radial-Pak cartridge. This same packing is available in a variety of column dimension for gram scale
purifications as required for antisense therapeutic investigations.
Moffat, A.S. 1988 (Nov/Dec). “Researchers Pursue
Anti-Sense Technology In Quest for Novel Drugs and Agriproducts”,
Genetic Engineering News. Vol 8. Pages 1 and 7.
Klauser. A. 1990 . “Antisense Start-Ups Surveyed”,
Bio/Technology. Vol 8. Pages 303 - 304.
Detritylated failuresand protecting groups
DMT blocked failures
Abs
orba
nce,
300
nm
DMT blocked full length product
2.4
0
05
1015
2025
3035
40
Minutes
HPLC Purification of Phosphorothioated DNA for
Antisense Therapeutic InvestigationsObjective:
The objective of this application note is to
demonstrate the utility of reversed-phase
HPLC for large scale purifica-tions of DMT
protected synthetic oligonucleotides.Details:Synthetic oligonucleotides are success-fully
used in a wide variety of applica-tions
ranging from use as hybridization probes to
utilization as primers for DNA sequencing
and the polymerase chain reaction* (PCR).
Most recently, studies have shown the
effectiveness of using standard (i.e. phosphodiester, P=0) or phosphole back-
bone modified (i.e. phosphoro-thioated,
P=S) oligonucleotides to selectively inhibit
the production of targeted proteins within
cells. As such, “antisense and related
technology investigations” require milligram
to multigram amounts of purified synthetic
DNA. Reversed-phase HPLC provides a
rapid and cost effective technique for the
isolation of either phosphodiester or phosphorothioated full length
oligonucleotide products for these applications.
Column: Bondapak® HC18 HA (8 x 100mm
Radial-Pak™ cartridge)Eluent A: 100mM ammonium acetate, pH
7.2/methanol (95:5, v/v)
Eluent B: Methanal/Milli-Q® water (95:5, v/v)
Sample: Phosphorothioated 21 mer (DMT
protected)Injection: 12 mLs, containing 624 O.D.260nm
units (21 mgs) of oligonucleotide
in 70% A and 30% B, injected into
Milligram quantities of DMT protected synthetic oligonucleotides can be rapidly purified from undesired synthesis reaction by-products using Bondapak
HC18 HA reversed-phase material in an 8 x 100mm Radial-Pak cartridge. This same packing is available in a variety of column dimension for gram scale
purifications as required for antisense therapeutic investigations.
Moffat, A.S. 1988 (Nov/Dec). “Researchers Pursue
Anti-Sense Technology In Quest for Novel Drugs and Agriproducts”,
Genetic Engineering News. Vol 8. Pages 1 and 7.
Klauser. A. 1990 . “Antisense Start-Ups Surveyed”,
Bio/Technology. Vol 8. Pages 303 - 304.
W a t e r s
A P P L I C A T I O N SN O T E S
For your free Application Note File Folder,please check box 9 on the Business ReplyCard and return today.
Column: Symmetry® C8 3.9 x 150 mmMobile Phase: 35% Acetonitrile
65% H2OFlow: 1.0 ml/min
11
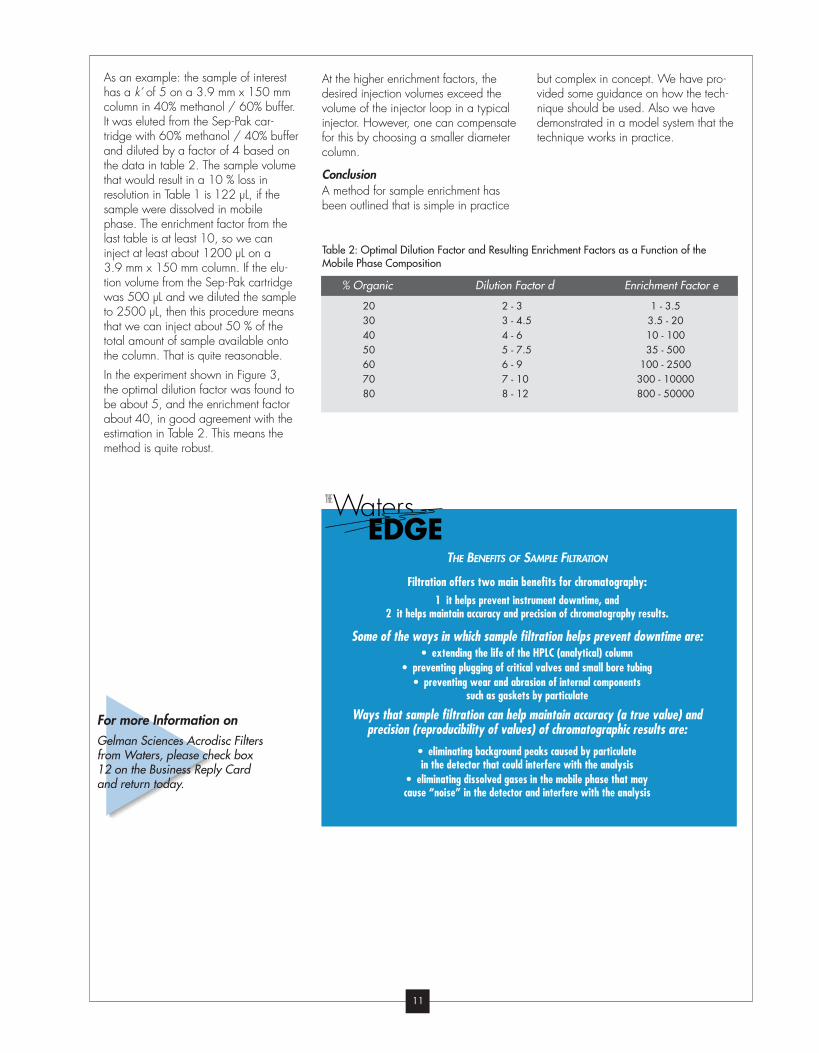
Table 2: Optimal Dilution Factor and Resulting Enrichment Factors as a Function of theMobile Phase Composition
20 2 - 3 1 - 3.530 3 - 4.5 3.5 - 2040 4 - 6 10 - 10050 5 - 7.5 35 - 50060 6 - 9 100 - 250070 7 - 10 300 - 1000080 8 - 12 800 - 50000
% Organic Dilution Factor d Enrichment Factor e
As an example: the sample of interest
has a k’ of 5 on a 3.9 mm x 150 mm
column in 40% methanol / 60% buffer.
It was eluted from the Sep-Pak car-
tridge with 60% methanol / 40% buffer
and diluted by a factor of 4 based on
the data in table 2. The sample volume
that would result in a 10 % loss in
resolution in Table 1 is 122 µL, if the
sample were dissolved in mobile
phase. The enrichment factor from the
last table is at least 10, so we can
inject at least about 1200 µL on a
3.9 mm x 150 mm column. If the elu-
tion volume from the Sep-Pak cartridge
was 500 µL and we diluted the sample
to 2500 µL, then this procedure means
that we can inject about 50 % of the
total amount of sample available onto
the column. That is quite reasonable.
In the experiment shown in Figure 3,
the optimal dilution factor was found to
be about 5, and the enrichment factor
about 40, in good agreement with the
estimation in Table 2. This means the
method is quite robust.
THE BENEFITS OF SAMPLE FILTRATION
Filtration offers two main benefits for chromatography: 1 it helps prevent instrument downtime, and
2 it helps maintain accuracy and precision of chromatography results.
Some of the ways in which sample filtration helps prevent downtime are:• extending the life of the HPLC (analytical) column
• preventing plugging of critical valves and small bore tubing• preventing wear and abrasion of internal components
such as gaskets by particulate
Ways that sample filtration can help maintain accuracy (a true value) and precision (reproducibility of values) of chromatographic results are:
• eliminating background peaks caused by particulate in the detector that could interfere with the analysis
• eliminating dissolved gases in the mobile phase that may cause “noise” in the detector and interfere with the analysis
At the higher enrichment factors, the
desired injection volumes exceed the
volume of the injector loop in a typical
injector. However, one can compensate
for this by choosing a smaller diameter
column.
ConclusionA method for sample enrichment has
been outlined that is simple in practice
but complex in concept. We have pro-
vided some guidance on how the tech-
nique should be used. Also we have
demonstrated in a model system that the
technique works in practice.
For more Information onGelman Sciences Acrodisc Filtersfrom Waters, please check box12 on the Business Reply Cardand return today.
12
A Resolution Equation for EKC Based onElectrophoretic Mobilities
AbstractA resolution equation for EKC was
developed starting from the resolution
equation for electrophoresis. The equa-
tion was used to predict the influence of
the migration window and partitioning
on resolution in EKC. It is theoretically
shown that the migration window can
have a dramatic effect on resolution in
EKC. Using a novel chiral surfactant,
the influence of the migration window
and partitioning on the separation of
benzoin enantiomers was experimental-
ly determined. The results obtained
agreed with predictions based on the
equation. The ability to obtain very high
resolution values by migration window
manipulation was demonstrated for the
separation of N-methylpseudoephedrine
enantiomers (α=1.3). Specifically, the
resolution was 2.4 under conditions of
robust EOF, but increased to 11 using
conditions of low EOF.
IntroductionElectrokinetic chromatography (EKC),
invented by Terabe, is a subset of capil-
lary electrophoresis (CE) (1). In EKC,
analytes partition between the bulk
aqueous CE phase and an additive.
The most powerful technique of EKC
is the use of micelles (MEKC). Resolution
of two analytes is achieved in EKC by
one or both of the following mecha-
nisms:
1) differences in their mobilities in the
bulk aqueous phase (capillary zone
electrophoresis), and/or
2) differences in their partitioning
between the bulk aqueous phase
and the additive, with the further
requirement that the mobility of the
analyte-additive complex is different
from the mobility of the analyte in
the bulk aqueous phase.
The second mechanism results in a
migration window in EKC. For instance,
MEKC is usually performed with sodium
dodecyl sulphate (SDS) micelles. SDS
micelles are anionic and have an
Jeffrey R. Mazzeo, Michael E. Swartz and Edward R. Groverreprinted with permission from Anal. Chem., Vol. 67 (1995), pp. 2966-2972
electrophoretic mobility towards the
anode. Uncoated fused silica capillaries
are typically used in MEKC, and a bulk
electroosmotic flow toward the cathode
is produced at pH > 2.0. Above pH
6.0, the electroosmotic velocity is usual-
ly faster than the electrophoretic velocity
of the SDS micelles, causing the micelles
to have a net movement toward the
cathode. This situation leads to a migra-
tion window, which for neutral analytes,
is defined by the electroosmotic flow
marker (no partitioning) and the micelle
marker (complete partitioning). All neu-
tral analytes must migrate between
these two boundaries.
The existence of a migration window
leads to an additional term in the resolu-
tion equation for MEKC compared to
the standard resolution equation for
chromatography. As developed by
Terabe (1), the resolution equation for
neutral analytes in MEKC is:
[1]
where N is the theoretical plate count,
α is the selectivity term, k1 and k2 are
the capacity factors for the two ana-
lytes, t0 is the electroosmotic flow time,
and tmc is the micelle marker time.
Capacity factors of neutral compounds
are calculated using the following
equation (1):
[2]
where tr is the observed migration time
of the analyte.
The resolution and capacity factor
equations for MEKC were derived for
neutral analytes under conditions where
the micelles and the bulk aqueous
phase move toward the same electrode
(1). Charged analytes which do not
interact with the micelles will not migrate
at the electroosmotic flow time. Several
researchers have proposed alternative
equations for calculating capacity fac-
tors and resolution of charged analytes
(2-3). We proposed that taq be substi-
tuted for t0 in the resolution and capaci-
ty factor equations, taq being defined as
the time in the aqueous phase (3).
k = t r − t 0
t 0 1− t rtmc
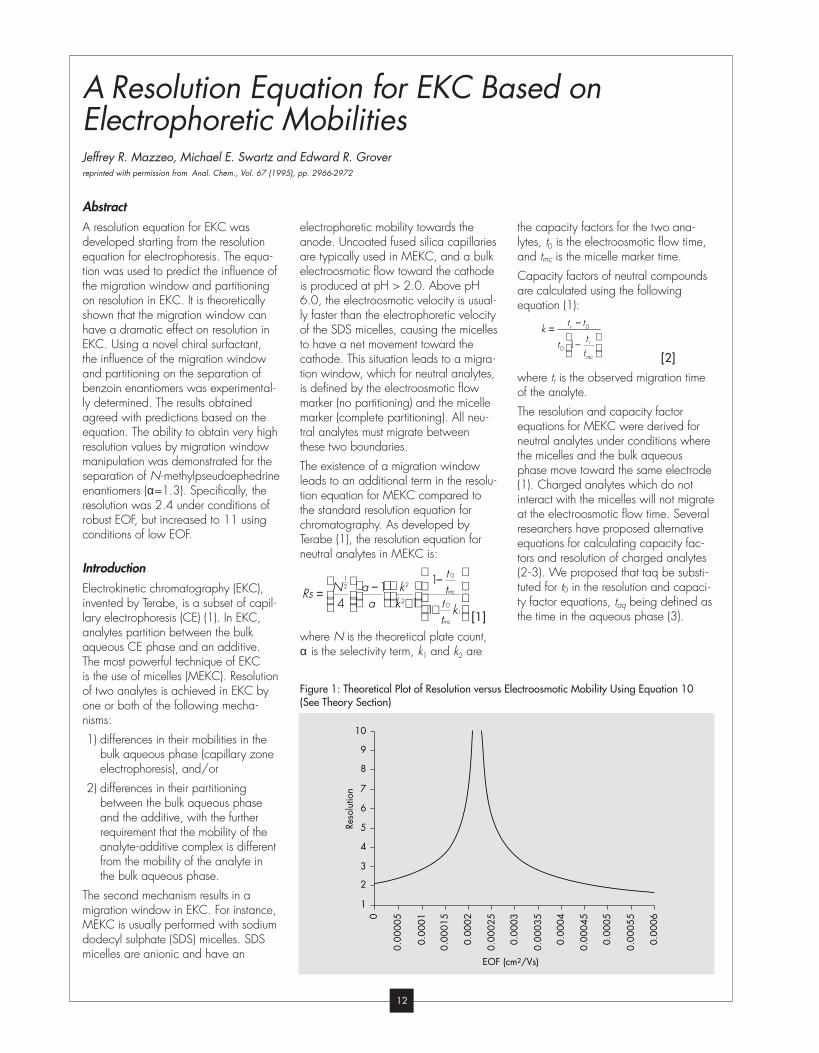
Figure 1: Theoretical Plot of Resolution versus Electroosmotic Mobility Using Equation 10 (See Theory Section)
10
9
8
7
6
5
4
3
2
1
0
0.00
005
0.00
015
0.00
025
0.00
035
0.00
045
0.00
055
0.00
02
0.00
03
0.00
04
0.00
05
0.00
06
0.00
01
EOF (cm2/Vs)
Reso
lutio
n
Rs = N1
2
4
a − 1
a
k2
k2+1
1− t 0
tmc
1+ t 0
tmc
k1

13
The taq value of a charged analyte will
be a function of the electroosmotic
mobility, its own electrophoretic mobility,
and its interaction, if any, with non-
micellised surfactant. The value of taq
can be determined by measuring the
analyte’s electrophoretic mobility in the
MEKC buffer without micelles, adding
it to the electroosmotic mobility in the
MEKC buffer with micelles, and convert-
ing the resulting mobility to a migration
time. Analyte interaction with free sur-
factant molecules is assumed to be
negligible.
It is possible for the micelles and the
aqueous phase to have net mobilities
toward opposite electrodes. This situa-
tion occurs when the electrophoretic
velocity of the anionic micelles toward
the anode is greater than the electroos-
motic velocity toward the cathode (4).
In this case, an unpartitioned neutral
analyte will migrate toward the cath-
ode, while a completely partitioned
analyte will migrate toward the anode
(4). Depending on its partitioning value,
a neutral analyte can migrate toward
the cathode with a migration time from
taq to infinity, or toward the anode with
a migration time from tmc to infinity. The
resolution and capacity factor equations
are written with migration times, so the
practice has been to use negative val-
ues for the migration times when migra-
tion is toward the anode (4).
Consequently, negative resolution values
can also be obtained. A negative reso-
lution value indicates that the more high-
ly retained analyte migrates faster (5).
The migration window or elution range
is defined as t0/tmc, so the case where
the net micelle movement is toward the
anode has been referred to as a nega-
tive migration window.
We are interested in determining the
influence of the migration window and
partitioning on resolution in EKC, espe-
cially with negative migration windows.
Therefore, we have derived a resolution
equation which is applicable to all forms
of EKC. This paper shows the derivation
of this equation. Using the equation,
the influence of the migration window
and partitioning on resolution were
predicted. The predictions were then
verified experimentally.
TheoryThe resolution equation for two analytes
in electrophoresis is defined as (6):
[3]
where N is the average theoretical
plate count, and µapp is the apparent
mobility. Assuming that diffusion is the
only cause of band broadening, the
average plate count for two analytes in
CE is given by (7):
[4]
where V is the applied voltage, l is the
capillary length from injection to detec-
tion, D is the diffusion coefficient, and Lis the total capillary length.
For two analytes partitioning between
the aqueous phase and some additive
(micelles, cyclodextrins, etc.), apparent
mobilities can be calculated:
µapp,1 = x1(µadditive) + (1-x1)(µfs,1) [5]
µapp,2 = x2(µadditive) + (1-x2)(µfs,2) [6]
where x is the fraction of time the
analyte associates with the additive,
µadditive is the mobility of the analyte-
additive complex, and µfs is the mobility
of the analyte in the aqueous phase.
The mobilities of the analyte-additive
complexes for the two analytes are
assumed to be the same in order to
simplify the resulting equations.
The apparent mobilites are determined
from the electrophoretic and electroos-
motic mobilities:
µadditive = µadditive,ep + µos [7]
µfs = µfs,ep + µos [8]
0.0004
µ1
µ2
0.0003
0.0002
0.0001
0.00
005
0.00
01
0.00
015
0.00
02
0.00
025
0.00
03
0.00
035
0.00
04
0.00
045
0.00
05
0.00
06
0.00
0550
0
–0.0001
–0.0002
–0.0003
EOF (cm2/Vs)
mob
ility
(cm
2 /Vs
)
Figure 2: A. Plot of Analyte Mobilites versus Electroosmotic Mobility Using Equations 5,6,7, and 8
EOF (cm2/Vs)
350000
300000
250000
200000
150000
100000
50000
0
0.00
004
0.00
008
0.00
012
0.00
016
0.00
020.
0002
40.
0002
80.
0003
20.
0003
60.
0004
0.00
044
0.00
048
0.00
052
0.00
056
0.00
060
Ave
rage
Pla
te C
ount
Figure 2: B. Plot of Average Theoretical Plates versus Electroosmotic Mobility Using Equations 4
N =
1
2µapp,1 + µapp,2( )Vl
2DL
Rs = N1
2
4
µapp , 1 − µapp , 2
1
2µapp , 1 + µapp , 2( )
14
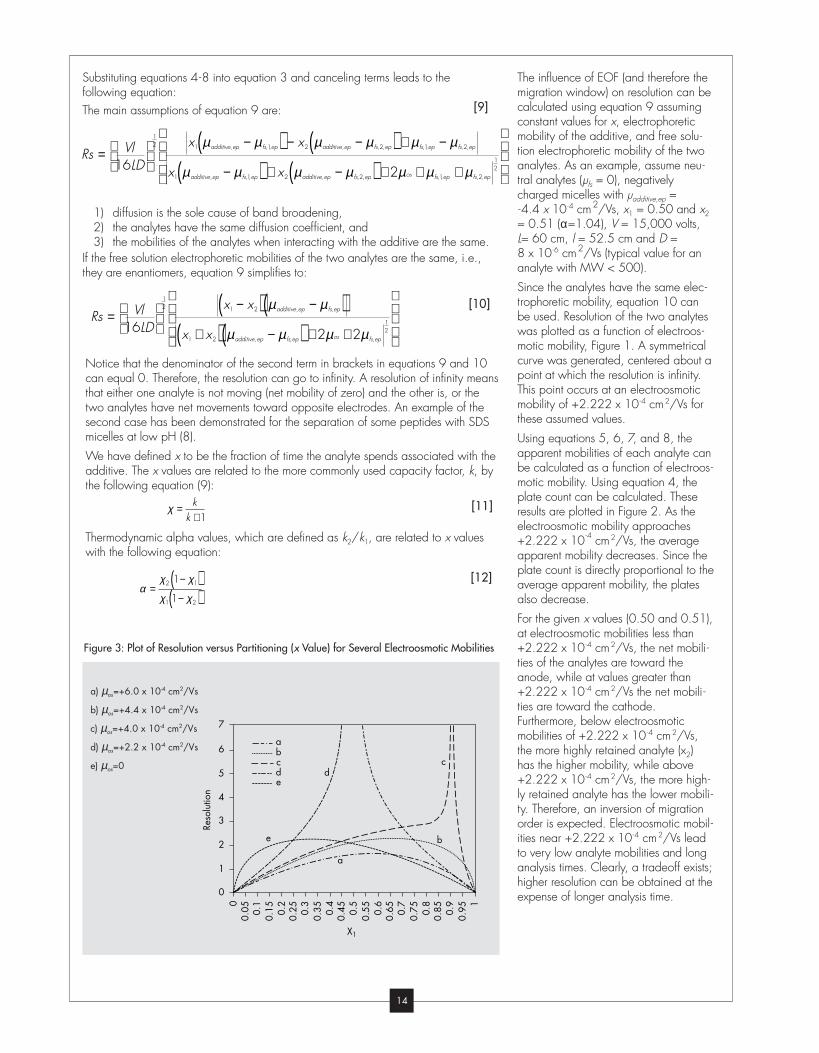
Substituting equations 4-8 into equation 3 and canceling terms leads to the
following equation:
The main assumptions of equation 9 are:
1) diffusion is the sole cause of band broadening,
2) the analytes have the same diffusion coefficient, and
3) the mobilities of the analytes when interacting with the additive are the same.
If the free solution electrophoretic mobilities of the two analytes are the same, i.e.,
they are enantiomers, equation 9 simplifies to:
Notice that the denominator of the second term in brackets in equations 9 and 10
can equal 0. Therefore, the resolution can go to infinity. A resolution of infinity means
that either one analyte is not moving (net mobility of zero) and the other is, or the
two analytes have net movements toward opposite electrodes. An example of the
second case has been demonstrated for the separation of some peptides with SDS
micelles at low pH (8).
We have defined x to be the fraction of time the analyte spends associated with the
additive. The x values are related to the more commonly used capacity factor, k, by
the following equation (9):
Thermodynamic alpha values, which are defined as k2/k1, are related to x values
with the following equation:
α =χ2 1− χ1( )χ1 1− χ2( )
χ = k
k +1
The influence of EOF (and therefore the
migration window) on resolution can be
calculated using equation 9 assuming
constant values for x, electrophoretic
mobility of the additive, and free solu-
tion electrophoretic mobility of the two
analytes. As an example, assume neu-
tral analytes (µfs = 0), negatively
charged micelles with µadditive,ep =
-4.4 x 10⁻⁴ cm2/Vs, x1 = 0.50 and x2
= 0.51 (α=1.04), V = 15,000 volts,
L= 60 cm, l = 52.5 cm and D =
8 x 10⁻⁶ cm2/Vs (typical value for an
analyte with MW < 500).
Since the analytes have the same elec-
trophoretic mobility, equation 10 can
be used. Resolution of the two analytes
was plotted as a function of electroos-
motic mobility, Figure 1. A symmetrical
curve was generated, centered about a
point at which the resolution is infinity.
This point occurs at an electroosmotic
mobility of +2.222 x 10⁻⁴ cm2/Vs for
these assumed values.
Using equations 5, 6, 7, and 8, the
apparent mobilities of each analyte can
be calculated as a function of electroos-
motic mobility. Using equation 4, the
plate count can be calculated. These
results are plotted in Figure 2. As the
electroosmotic mobility approaches
+2.222 x 10⁻⁴
cm2/Vs, the average
apparent mobility decreases. Since the
plate count is directly proportional to the
average apparent mobility, the plates
also decrease.
For the given x values (0.50 and 0.51),
at electroosmotic mobilities less than
+2.222 x 10⁻⁴ cm2/Vs, the net mobili-
ties of the analytes are toward the
anode, while at values greater than
+2.222 x 10⁻⁴ cm2/Vs the net mobili-
ties are toward the cathode.
Furthermore, below electroosmotic
mobilities of +2.222 x 10⁻⁴ cm2/Vs,
the more highly retained analyte (x2)
has the higher mobility, while above
+2.222 x 10⁻⁴ cm2/Vs, the more high-
ly retained analyte has the lower mobili-
ty. Therefore, an inversion of migration
order is expected. Electroosmotic mobil-
ities near +2.222 x 10⁻⁴ cm2/Vs lead
to very low analyte mobilities and long
analysis times. Clearly, a tradeoff exists;
higher resolution can be obtained at the
expense of longer analysis time.
0.05 0.1
0.15 0.2
0.25 0.3
0.35 0.4
0.45 0.5
0.55 0.6
0.65 0.7
0.75 0.8
0.9
0.95 1
0.85
0
X1
7
6
5
4
3
2
1
0
Reso
lutio
n
d dc cb
b
a
a
e
e
Figure 3: Plot of Resolution versus Partitioning (x Value) for Several Electroosmotic Mobilities
a) µos=+6.0 x 10⁻⁴ cm2/Vs
b) µos=+4.4 x 10⁻⁴ cm2/Vs
c) µos=+4.0 x 10⁻⁴ cm2/Vs
d) µos=+2.2 x 10⁻⁴ cm2/Vs
e) µos=0
[10]
[11]
[12]
Rs = Vl
16LD
1
2 x1 − x2( ) µadditive,ep − µ fs,ep( )x1 + x2( ) µadditive,ep − µ fs,ep( ) + 2µos + 2µ fs,ep
1
2
Rs = Vl
16LD
1
2 x1 µadditive,ep − µ fs,1,ep( ) − x2 µadditive,ep − µ fs,2,ep( ) + µ fs,1,ep − µ fs,2,ep
x1 µadditive,ep − µ fs,1,ep( ) + x2 µadditive,ep − µ fs,2,ep( ) + 2µos + µ fs,1,ep + µ fs,2,ep
1
2
[9]

15
The influence of x on resolution for sev-
eral migration windows can also be cal-
culated using equation 12 in conjunc-
tion with equation 10. Note that when
varying x, both the average apparent
mobility and the difference in apparent
mobility change (equation 10). Assume
neutral analytes (µfs = 0), negatively
charged micelles with µadditive,ep = -4.4 x
10-4 cm2/Vs, α=1.04, V = 15,000
volts, L= 60 cm, l = 52.5 cm and D =
8 x 10⁻⁶ cm2/Vs. The influence of x on
resolution for several migration windows
is shown in Figure 3.
With a finite migration window (i.e.,
the micelles move in the same direction
as the electroosmotic flow but at a slow-
er rate), an optimum value for x is seen
and the resolution goes to zero when
x = 1 (Figure 3a, µos = 6.0 x 10⁻⁴
cm2/Vs, µmc = 1.6 x 10⁻⁴
cm2/Vs).
With an infinite migration window (the
micelles do not move), resolution is high-
er at all x values and the optimum xvalue is higher (Figure 3b, µos = 4.4 x
10-4 cm2/Vs, µmc,app = 0 x 10-4
cm2/Vs). This shift in the optimum xvalue is in agreement with the Foley
equation, which shows that the optimum
capacity factor in MEKC depends on
the migration window (10).
With a negative migration window
where the micelles move slowly toward
the anode, the optimum x value increas-
es compared to an infinite migration
window, and infinite resolution can be
obtained (Figure 3c, µos = 4.0 x 10⁻⁴
cm2/Vs, µmc = -0.4 x 10⁻⁴ cm2/Vs).
Resolution is higher at x values from x =
0 to 0.97 (the infinite resolution point)
for the negative migration window (3c)
compared to the infinite migration win-
dow (3b). However, at x values > 0.97,
better resolution is obtained with an infi-
nite migration window.
With a symmetrical, negative migration
window (the micelles move toward the
anode with the same velocity that the
bulk aqueous phase moves toward the
cathod), the optimum x value is lower
than with a negative migration window
where the micelles move slowly toward
the anode (Figure 3d, µos = 2.2 x 10⁻⁴
cm2/Vs, µmc = -2.2 x 10⁻⁴ cm2/Vs).
Note the similarities of this curve to the
one in Figure 1, where the migration
window was varied while x was
constant.
Finally, with an infinite migration win-
dow where the micelle moves toward
the anode but the bulk aqueous phase
does not move, the optimum x value
shifts lower compared to a symmetrical,
negative migration window (Figure 3e,
µos = 0 x 10-4 cm2/Vs, µmc = -4.4 x 10⁻⁴
cm2/Vs). Also note that the curve is the
same shape as with an infinite migration
window where the micelle does not
move (3b), but is reversed.
To determine if equation 10 correctly
predicts the influence of electroosmotic
flow and x on resolution, the plots in
Figure 1 and Figure 3d will be verified
experimentally.
ExperimentalSeparations were performed on a
Waters Quanta® 4000E system
(Milford, MA). AccuSep™ uncoated
fused silica capillaries (50 µm x 60 cm,
52.5 cm injection to detection) were
rinsed with 0.5 M NaOH initially,
and with 0.1 M NaOH at the begin-
ning and end of the day. A coated
capillary with minimal electroosmotic
flow (eCAP™ neutral, 50 µm x 45 cm,
35 cm injection to detection) was
obtained from Beckman (Fullerton, CA).
Injections were performed hydrostatical-
ly (10 cm height) for times of 2-10 sec-
onds. Between injections, the capillaries
were purged with run buffer for 5 min-
utes. Electropherograms were recorded
and analysed using the Millennium®
Figure 4: Surfactant Structures
Chromatography Manager (Waters).
The micelle marker was sulconazole,
while the EOF marker was methanol.
Sodium phosphate (monobasic and
dibasic), sodium acetate, sodium
hydroxide, phosphoric acid, benzoin
(racemate and (+)-enantiomer), and
N-methylpseudoephedrine (individual
enantiomers) were obtained from
Sigma (St. Louis, MO).
The synthesis of the novel chiral surfac-
tant (S)-2-[(1-oxododecyl)amino]-(3S)-
methyl-1-sulphooxypentane will be
described in a future publication. The
synthesis of (S)-N-dodecoxycarbonylva-
line has been described (3). Structures
of the two surfactants are shown in
Figure 4.
ResultsTo demonstrate the influence of the
migration window on resolution, the
dependence of EOF on pH was exploit-
ed (4). A phosphate-acetate buffer (25
mM each, sodium salts) was employed
over the pH range 3-6, with the elec-
troosmotic mobility ranging from 5.3 x10⁻⁴ cm2/Vs (pH 6) to 0.5 x 10⁻⁴
cm2/Vs (pH 3). The enantiomers of the
neutral (µfs = 0) analyte, benzoin, were
separated (3:1 ratio of (+):(-)). A novel
chiral surfactant, (S)-2-[(1-oxododecyl)
amino]-(3S)-methyl-1-sulphooxypentane
(Figure 4a, patent pending), was
employed. Its electrophoretic mobility
(µphase,ep = -4.4 x 10⁻⁴ cm2/Vs) was
constant over the pH range studied.
O N
O
O
H
OH
H
O N
O
O
O
O
SH H
OH
H
4A (S)-2-[(1-OXODODECYL)AMINO]-(3S)-METHYL-1-SULFOOXYPENTANE
4B (S)-N-DODECOXYCARBONYLVALINE
16
It was initially assumed that the x values
of the benzoin enantiomers would not
change over the pH range of 3-6. The
observed differences in x over the pH
range are attributed to joule heating as
no attempt was made to perform the
experiments at constant ionic strength.
Table 1 lists the values of Tm(+), Tm(-), Tos,
Tmc, resolution, plate counts, x, and
alpha at the different pH-values. From
the apparent mobilities of the analyte,
micellar phase, and electroosmotic
flow, the x value of the analyte was
determined using the following
equation:
[13]This equation is simply a rearrangement
of equation 5. Alphas values were cal-
culated using equation 12.
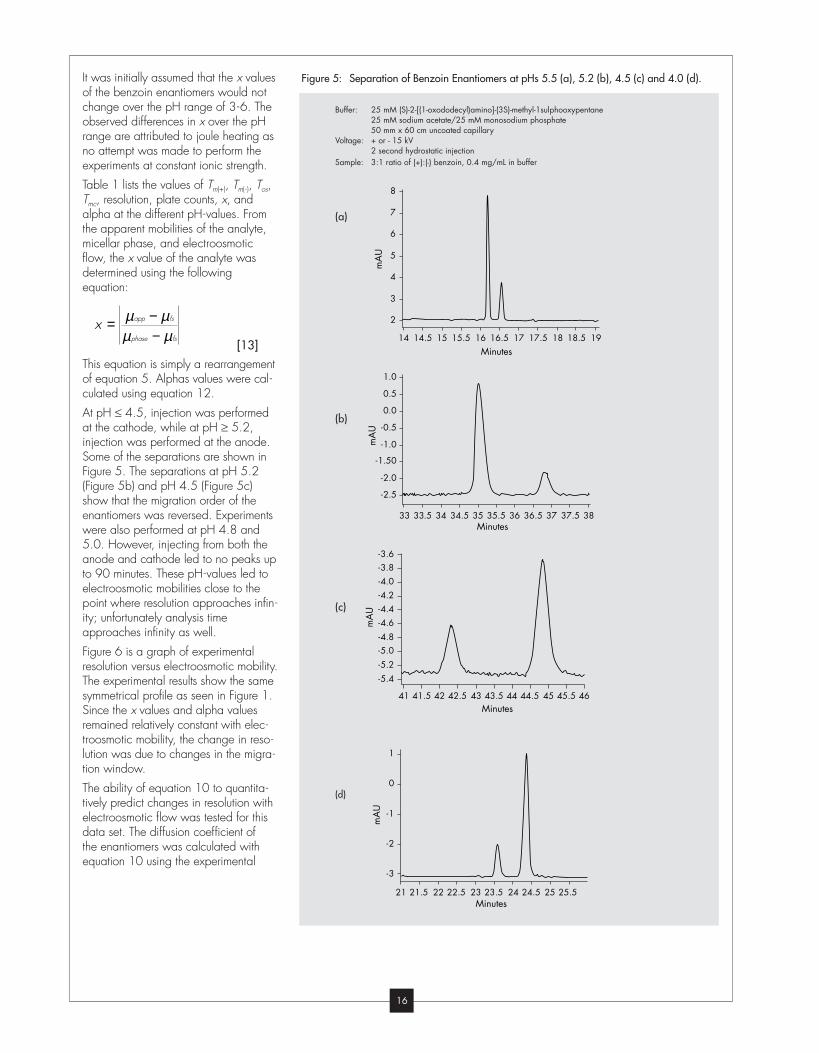
At pH ≤ 4.5, injection was performed
at the cathode, while at pH ≥ 5.2,
injection was performed at the anode.
Some of the separations are shown in
Figure 5. The separations at pH 5.2
(Figure 5b) and pH 4.5 (Figure 5c)
show that the migration order of the
enantiomers was reversed. Experiments
were also performed at pH 4.8 and
5.0. However, injecting from both the
anode and cathode led to no peaks up
to 90 minutes. These pH-values led to
electroosmotic mobilities close to the
point where resolution approaches infin-
ity; unfortunately analysis time
approaches infinity as well.
Figure 6 is a graph of experimental
resolution versus electroosmotic mobility.
The experimental results show the same
symmetrical profile as seen in Figure 1.
Since the x values and alpha values
remained relatively constant with elec-
troosmotic mobility, the change in reso-
lution was due to changes in the migra-
tion window.
The ability of equation 10 to quantita-
tively predict changes in resolution with
electroosmotic flow was tested for this
data set. The diffusion coefficient of
the enantiomers was calculated with
equation 10 using the experimental
x = µapp − µfs
µphase − µfs
Figure 5: Separation of Benzoin Enantiomers at pHs 5.5 (a), 5.2 (b), 4.5 (c) and 4.0 (d).
8
7
6
5
4
3
2
14 14.5 15 15.5 16 16.5 17 17.5 18 18.5 19Minutes
mA
U
Buffer: 25 mM (S)-2-[(1-oxododecyl)amino]-(3S)-methyl-1sulphooxypentane25 mM sodium acetate/25 mM monosodium phosphate50 mm x 60 cm uncoated capillary
Voltage: + or - 15 kV2 second hydrostatic injection
Sample: 3:1 ratio of (+):(-) benzoin, 0.4 mg/mL in buffer
-2.5
-2.0
-1.50
-1.0
-0.5
0.0
0.5
1.0
33 3433.5 3534.5 3635.5 3736.5 3837.5Minutes
mA
U
-5.4
-5.2
-5.0-4.8
-4.4
-4.2
-4.0
-3.8-3.6
-4.6
41 41.5 42 42.5 43 43.5 44 45 45.5 4644.5Minutes
mA
U
-3
-2
-1
0
1
21 21.5 22 22.5 23 23.5 24 24.5 25 25.5Minutes
mA
U
(a)
(b)
(c)
(d)

17
resolution at pH 6.0 as well as the x
values, electroosmotic mobility, additive
electrophoretic mobility, capillary
lengths and voltage. The diffusion
coefficient was calculated to be
6.45 x 10⁻⁶ cm2/s. Then, using this
value for the diffusion coefficient and
assuming constant x values, resolution
was calculated as a function of elec-
troosmotic mobility at each pH. Table 2
gives the calculated and experimental
resolution at each pH, as well as the %
difference. Generally, the predicted
value using equation 10 is within 10%
of the actual resolution value. The one
exception is at pH 4.5, where the dif-
ference was 21%. This large difference
is attributed to the fact that the x values,
which were assumed to be the same as
at pH 6.0, were significantly different
at pH 4.5 (see Table 1). If the x values
measured at pH 4.5 are used, the pre-
dicted resolution is 4.19, only a 3.7%
difference from the experimental resolu-
tion. Another possible source of error
could be improperly measured values
for the electroosmotic flow and micelle
marker time.
Trends in resolution similar to those in
Figure 6 can also be generated with
a negative, symmetrical migration win-
dow by changing the analytes’ x values
(Figure 3d). In an equilibrium distribution
process, such as MEKC, an analyte’s xvalue, or partitioning, can be altered
thermodynamically (by changing the
nature of one of the phases) or through
phase ratio (by changing the concentra-
tion of one of the phases in relation to
the other). The advantage of changing
the partitioning through phase ratio is
that selectivity (α) does not change. To
demonstrate this concept, the separation
of benzoin enantiomers was performed
at pH 5.0 with surfactant concentrations
of 60, 30, 15 and 10 mM. At pH
5.0, µos = +2.1 x 10⁻⁴ cm2/Vs and
µmc = -2.3 x 10⁻⁴ cm2/Vs, which is
essentially a symmetrical, infinite migra-
tion window. The separations at the four
surfactant concentrations are shown in
Figure 7. Note the similarity to those
shown in Figure 5 and the fact that a
reversal of migration order was
obtained. The general trend in resolu-
tion with x (surfactant concentration) is
similar to the theoretical curve (Figure
3d). Quantitative predictions of resolu-
tion as a function of x values using
equation 10 are problematic since the
electroosmotic flow changes with the
change in surfactant concentration.
The alpha value for benzoin using (S)-2-
[(1-oxododecyl)amino]-(3S)-methyl-1-
sulphooxypentane is 1.04, which was
sufficient for baseline resolution under all
the conditions investigated. In many
cases, lower selectivities are found. By
optimising the migration window and xvalues for a given system using equation
9 or 10, solute pairs with alpha values
less than 1.04 can be baseline
resolved. Very high resolution values can
be realised by optimising the migration
window and/or x values when the
alpha value is higher. To demonstrate
this point, separation of the enantiomers
of N-methylpseudoephedrine was
Table 1: Migration Times, Resolution, Plate Counts, Partitioning (x), and Alpha at Each pH
6.0 13.193 13.397 6.590 38.890 2.15 263,000 0.60 0.61 1.04
5.5 16.187 16.540 7.393 116.990 2.64 230,000 0.58 0.59 1.04
5.2 35.037 36.827 9.890 (40.698) 4.17 107,000 0.59 0.60 1.04
4.5 (44.820) (42.323) 21.875 (9.210) 4.35 82,000 0.52 0.53 1.04
4.0 (24.450) (23.630) 43.750 (9.722) 2.80 155,000 0.55 0.56 1.04
3.0 (19.183) (18.707) 69.750 (9.000) 2.32 210,000 0.55 0.56 1.04
All migration times are in minutes; values in parentheses indicate migration towardthe anode.
performed with (S)-N-dodecoxycar-
bonylvaline (Figure 4b, µmc,ep = -4.5 x
10-4 cm2/Vs) under high and low EOF
conditions. The alpha value for this pair
of enantiomers is 1.3 with (S)-N-dodec-
oxycarbonylvaline (3). Separations
of the enantiomers were performed in
50 mM Na2HPO4 adjusted to pH 8.0,
where N-methylpseudoephedrine is
positively charged (µfs,ep= +2.1 x 10⁻⁴
cm2/Vs). Separations were performed in
an uncoated capillary with robust EOF
(µos = +5.5 x 10⁻⁴ cm2/Vs, µmc = +1.0
x 10-4 cm2/Vs) and in a coated capil-
lary with low EOF (µos = +0.5 x 10⁻⁴
cm2/Vs, µmc = -4.0 x 10⁻⁴ cm2/Vs). In
the uncoated capillary, a finite migration
window was obtained, while with the
coated capillary a negative migration
window was obtained.
Figure 6: Plot of Resolution versus Electroosmotic Mobility (Data in Table 1)
3.6
EOF (10-4 cm2/Vs)
4.75.31.5
2
2.5
3.5
4
4.5
3
0.50.81.5
Rs
Conditions: Used For Data Generated in Table 1:Buffer: 25mM (S)-2-[(1-oxododecyl)amino]-(3S)-methyl-1-sulphooxypentane
25mM sodium acetate/25 mM monosodium phosphate 50 µm x 60 cm uncoated capillary; + or - 15 kV; 2 second hydrostatic injection
Sample: 3:1 ratio of (+):(-) benzoin, 0.4 mg/mL in buffer
pH Tm(+) Tm(-) Tos Tmc Rs Navg. x1 x2 α

18
Figure 7: Separation of Benzoin Enantiomers at 60 (a), 30 (b), 15 (c), and 10 (d) mMSurfactant. Buffer pH 5.0.
-1.5
-1
-1.5
1.5
-.5
0
1
21 21.5 22 22.5 23 23.5 24 24.520 20.5
Minutesm
AU
0
.5
1
1.5
50 51 52 53 54 55 56 57 58
Minutes
mA
U
-5.0
-4.5
-4.0
-3.5
31.5 32 32.5 33 33.5 34 34.5 35Minutes
mA
U
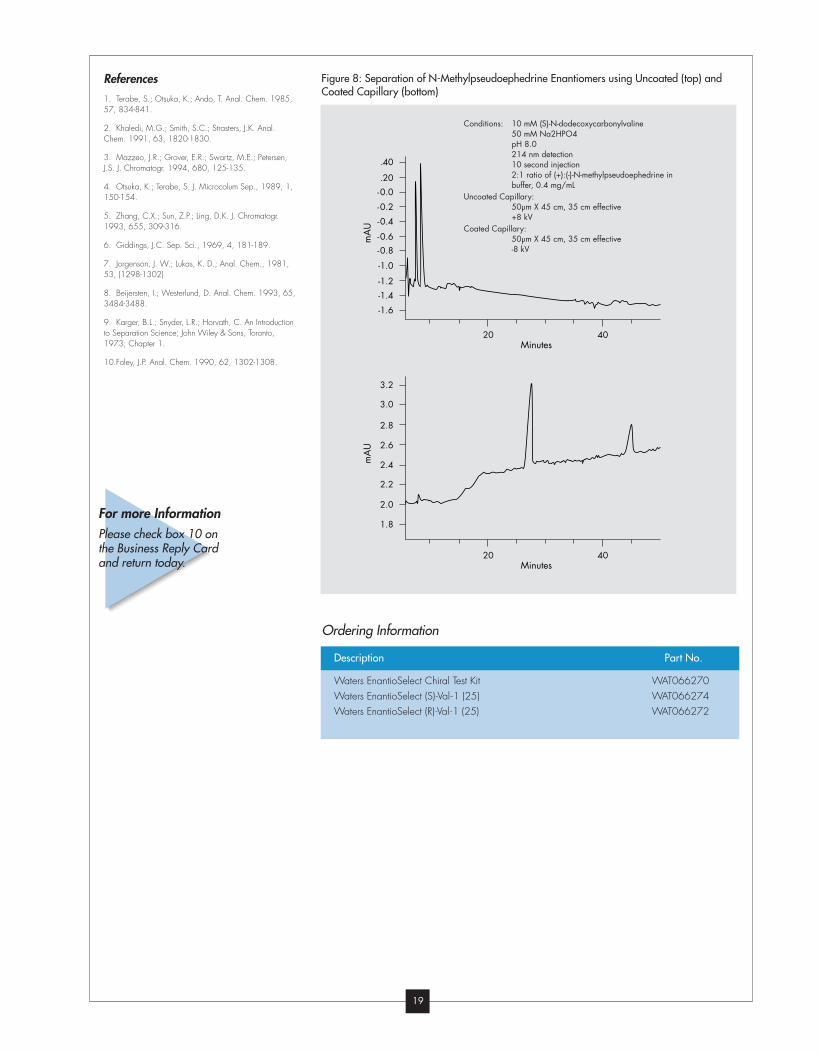
Figure 8 shows the two separations,
with the resolution increasing from 2.4
(uncoated capillary) to 11.0 (coated
capillary). The same buffer was used
for both separations, the only difference
being the capillary employed (and
hence the magnitude of electroosmotic
flow).
ConclusionsA resolution equation for EKC based on
electrophoretic mobilities is a useful tool
in predicting the influence of the migra-
tion window and partitioning on resolu-
tion. Several points can be made about
the simulated resolution vs. migration
window and partitioning curves pre-
pared using equation 10. First, the
migration window is a powerful para-
meter to optimise resolution in EKC.
Infinite resolution is possible. Second,
for compounds which spend more time
with the additive than in bulk solution,
i.e., x values > 0.50, an infinite migra-
tion window where the additive does
not move is preferable to an infinite
migration window where the additive
does move. For compounds with x val-
ues < 0.50, the latter case is preferred.
This situation is due to the fact that the
lower the average apparent mobility
of the analytes, the better the resolution.
When the additive does not move,
analytes which spend more time with
the additive will have lower average
apparent mobility. When the bulk solu-
tion does not move, analytes which
spend more time in it (and therefore less
time with the additive) will have the
lower average apparent mobility.
Finally, through a combination of EOF
and/or x value manipulation, reversals
in migration order can be obtained in
EKC.
The system employed here to verify the
predictions of equation 10 is an ideal
one. The analytes are enantiomers
and neutral over a wide pH range; the
surfactant is fully ionised over a wide
pH range. However, the separation of
enantiomers is an important practical
problem, and the thought process
demonstrated in this paper makes the
optimisation of such a separation by
chiral MEKC both rational and efficient.
-11
-10
-9
-8
-7
50 52 54 56 58 60
Minutes
mA
U
(a)
(b)
(c)
(d)
Table 2: Comparison of Experimental Resolution and Resolution Calculated using Equation 10
5.5 2.64 2.43 8.05.2 4.17 3.81 8.64.5 4.35 3.42 21.44.0 2.80 2.58 8.03.0 2.32 2.39 3.0
pH Experimental Rs Calculated Rs %Difference
19
Figure 8: Separation of N-Methylpseudoephedrine Enantiomers using Uncoated (top) andCoated Capillary (bottom)
Ordering Information
References1. Terabe, S.; Otsuka, K.; Ando, T. Anal. Chem. 1985,57, 834-841.
2. Khaledi, M.G.; Smith, S.C.; Strasters, J.K. Anal.Chem. 1991, 63, 1820-1830.
3. Mazzeo, J.R.; Grover, E.R.; Swartz, M.E.; Petersen,J.S. J. Chromatogr. 1994, 680, 125-135.
4. Otsuka, K.; Terabe, S. J. Microcolum Sep., 1989, 1,150-154.
5. Zhang, C.X.; Sun, Z.P.; Ling, D.K. J. Chromatogr.1993, 655, 309-316.
6. Giddings, J.C. Sep. Sci., 1969, 4, 181-189.
7. Jorgenson, J. W.; Lukas, K. D.; Anal. Chem., 1981,53, (1298-1302)
8. Beijersten, I.; Westerlund, D. Anal. Chem. 1993, 65,3484-3488.
9. Karger, B.L.; Snyder, L.R.; Horvath, C. An Introductionto Separation Science; John Wiley & Sons, Toronto,1973; Chapter 1.
10.Foley, J.P. Anal. Chem. 1990, 62, 1302-1308.
-1.6
-1.4
-1.2
-1.0
-0.8-0.6
-0.4
-0.2
-0.0
.20
.40
20 40Minutes
mA
U
1.8
2.0
2.2
2.4
2.6
2.8
3.0
3.2
20 40Minutes
mA
U
Conditions: 10 mM (S)-N-dodecoxycarbonylvaline50 mM Na2HPO4pH 8.0214 nm detection10 second injection2:1 ratio of (+):(-)-N-methylpseudoephedrine inbuffer, 0.4 mg/mL
Uncoated Capillary:50µm X 45 cm, 35 cm effective+8 kV
Coated Capillary:50µm X 45 cm, 35 cm effective-8 kV
Waters EnantioSelect Chiral Test Kit WAT066270
Waters EnantioSelect (S)-Val-1 (25) WAT066274
Waters EnantioSelect (R)-Val-1 (25) WAT066272
Description Part No.
For more InformationPlease check box 10 onthe Business Reply Cardand return today.

20
Literature Corner:
“Analysis of Cisapride in Neonatal Plasma Using High-Performance LiquidChromatography with a Base-Stable Column and Fluorescence Detection”
Y. Preechagoon and B. G. Charles, J.Chromatogr. B 670 (1995), 139
“Development of a High Performance LiquidChromatographic Method for the Analysis ofStaurosporine”
L. R. Gurley, K. O. Umbarger, J. M. Kim, E.M. Bradbury and B. E. Lehnert, J.Chromatogr. B 670 (1995), 125
The authors describe a method for measuring the level of staurosporine which is a protein-
kinase inhibitor in blood. The assay required that the acetone extract be diluted 1:1 in order
for the staurosporine to bind to the µBondapak C18 Radial-Pak cartridge (8 mm x 100 mm).
Direct injection of the plasma sample was not possible because the protein and drug would
co-elute using a linear elution gradient of acetonitrile with 0.2% TFA. The UV detection
allowed a range from 0.1 to 2 µg staurosporine. This method was also used to determine
the pharmacokinetics of the drug in vivo.
Dorothy J. Phillips
Simple, rapid and robust methods are most suitable for drug analyses. For the analysis of
drugs in plasma a high degree of sensitivity and selectivity are also required. A simple, selec-
tive, sensitive and precise high-performance liquid chromatography method was developed
for the basic drug cisapride. The plasma extracts were analysed on a Waters Symmetry® C8
column (3.9 mm x 150 mm) with a simple mobile phase of acetonitrile and phosphate buffer.
No mobile phase additives were required for sharp, symmetrical peaks. The linear range for
cisapride was 5 to 250 ng/mL. The specificity of the assay was confirmed by showing that
cisapride did not co-elute with its metabolite nor with twelve other drugs used in neonatal
pharmacotherapeutics. The short analysis time of 10 minutes also made the assay suitable
for clinical assays. This is one of the first reported clinical applications in neonatal medicine
of the Symmetry® column, which is a recently developed column from Waters that is ideally
suited for this type of analysis.
Dorothy J. Phillips
“High-Performance Liquid ChromatographyMethod for Potency Determination ofCephalexin in Commercial Preparations andfor Stability Studies”
M. Hsu, Y. Lin and H. Chung, J. Chromatogr.A 692 (1995), 67
The U. S. Pharmacopeia method for cephalexin (an antibiotic) requires the use of both an ion-
pairing reagent and a silanol blocking agent . Also the method uses an uncommon internal
standard. The British Pharmacopeia method for the analysis of cephalexin oralpreparation is
an iodometric titration. The US Code of Federal Regulations describe both an iodometric titra-
tion and a microbiological method. The authors of this paper have developed a method which
has a simple mobile phase (methanol/1.25% glacial acetic acid) with the readily available
drug acetaminophen as the internal standard. The µBondapak C18 column (3.9 mm x 300 mm)
gave a short analysis time of 15 minutes with a cephalexin concentration range of 0.2 to
1.75 mg/mL. It was shown that excipients from commercial formulations do not interfere with
the assay. The assay was also used for product degradation studies and to determine peak
purity with a photodiode array detector. The results from the HPLC method were compared
to those of the microbiological assay and showed that the chromatographic method is a
suitable substitute. In addition, the HPLC assay is more specific than either the titration or the
microbiological assay.
Dorothy J. Phillips
“Stereospecific High-Performance LiquidChromatographic Assay of Iomefloxacin inHuman Plasma”
R. T. Foster, R. A. Carr, F. M. Pasutto, J. A.Longstreth, Journal of Pharmaceutical andBiomedical Analysis 13 (1995), 1243
Several methods have been reported in the literature for the quantitation of iomefloxacin, a
chiral quinolone carboxylic acid antibiotic. The literature methods are not able to discern the
quantities of the individual enantiomers of this drug in biological fluids. The method reported
in this paper describes an HPLC assay for quantitation of the enantiomers of iomefloxacin.
The drug is extracted from plasma at pH 7 in the presence of the internal standard, racemic
acebutolol. A two-step precolumn derivatization with unichiral (S)-(+)-naphthylethyl isocyanate
and achiral ethyl chloroformate is then carried out. The enatiomers are separated as diastere-
omers on Waters Nova-Pak® silica packing in the 8 mm x 100 mm Radial-Pak™column
segment.
Dorothy J. Phillips
“Simultaneous Determination ofPreservatives, Sweeteners and Antioxidantsin Food by Paired-Ion LiquidChromatography”
B. H. Chen and S. C. Fu, Chromatographia41 (1995), 43
The authors developed a paired-ion HPLC method for the simultaneous determination of
sweeteners (dulcin, saccharin-NA and acesulphame-K), preservatives (acetic, sorbic, salicylic,
benzoic, succinic, methyl-p-hydroxybenzoic, ethyl-p-hydroxybenzoic, n-propyl-p-hydroxyben-
zoic and i-propyl-p-hydroxybenzoic acids) and antioxidants (3-t-butyl-4-hydroxy-anisole and
t-butyl-hydroquinone). Detailed sample preparation procedures are given for soy sauce, dried
roast beef and sugared fruit using solid-phase extraction with Waters Sep-Pak C18 cartridges.
Uwe D. Neue
Pharmaceutical Applications:
fl fl fl fl fl fl fl fl fl fl fl fl fl fl fl fl fl fl fl fl fl fl fl fl fl fl fl fl fl fl fl fl fl fl fl fl
fl fl fl fl fl fl fl fl fl fl fl fl fl fl fl fl fl fl fl fl fl fl fl fl fl fl fl fl fl fl fl fl fl fl fl fl
fl fl fl fl fl fl fl fl fl fl fl fl fl fl fl fl fl fl fl fl fl fl fl fl fl fl fl fl fl fl fl fl fl fl fl fl
Food Applications:

21
Waters™ Columns now available from Phase Separations
“Structure of Hydroxycinnamic AcidDerivatives Established by High-Performance Liquid Chromatography withPhotodiode-Array Detection”
L. Bengoechea, T. Hernández, C. Quesada, B. Bartolomé, I. Estrella and C. Gce Liquid Chromatography with Photodiode-Array
Hydroxycinnamic acid derivatives are widely distributed throughout the plant kingdom and
play an important role in the secondary metabolism in plants. In this paper, hydroxycinnamic
acid derivatives are separated by reversed-phase HPLC using a Nova-Pak C18 column and
categorised using a Waters Model 991 Photodiode Array Detector. p-Coumaric acid deriva-
tives are distinguishable from caffeic and ferulic acid derivatives, but it is not possible to distin-
guish between the latter two groups due to overlap of the ranges of spectral characteristics.
Uwe D. Neue
Food Applications:
fl fl fl fl fl fl fl fl fl fl fl fl fl fl fl fl fl fl fl fl fl fl fl fl fl fl fl fl fl fl fl fl fl fl fl fl fl fl fl fl fl fl fl fl fl fl fl fl fl fl fl fl fl fl fl fl fl fl fl fl fl fl fl fl fl fl fl fl fl
The Choice is Yours
For more Information on
Spherisorb Columns, pleasecheck box 21 on the BusinessReply Card and return today.
We credit the tremendous success of Symmetry® columns to the fact that their development is a
direct result of a dialogue with our customers. So in our search for a better way to sell and
deliver Waters™ HPLC columns, we initiated another dialogue with our customers; both scientists
and purchasing professionals.
What we’ve found is that you are happy with our products and support, but would like to pur-
chase all of your chromatography supplies from a convenient, single source. While you would
like to be able to purchase Waters™ columns from a chromatography “superstore”, you strongly
cautioned us against taking any action that would compromise the high level of technical
support you receive from Waters today.
Our search for a better way to sell and deliver Waters™ columns led us to Phase Separations, a
well established United Kingdom based chromatography supplies company. With Phase Sep,
you have one source for the broadest selection of chromatography columns and supplies in the
world. They have skilled technical support to help you with your applications and they never
offer any “substitute” brands.
With their new international presence, Phase Sep can help Waters give you what you want
because we have given them exclusive third party distribution rights to Waters™ columns. Phase
Sep can provide you with Waters™ columns as well as other column brands you may use. They
can also support Waters™ columns the way you would like them to be supported. Of course,
all of our products can still be purchased directly from Waters with the same guarantee of
excellence in technical support.
Spherisorb® Columns now available from Waters
Spherisorb®, one of the world’s widely used HPLC columns was first developed by Phase
Separations in the late 1970s. It has been Phase Sep’s historical practice to sell Spherisorb®
packing material broadly to secondary manufacturing companies who then pack this material
into a steel column and re-sell it under the Spherisorb® brand name. While this practice gained
broad distribution for Spherisorb® products, given the critical nature of the assays performed by
HPLC, Phase Sep and Waters are taking steps to bring a higher level of quality and consistency
to the finished Spherisorb® column wherever and from whomever you purchase it.
Effective immediately, Phase Separations has granted exclusive manufacturing and distribution
rights for Spherisorb® products to Waters. Spherisorb® columns will still be available from Phase
Separations as well as from your current source, but you now have the option of purchasing them
direct from Waters, and at a very attractive price.
For price and delivery information on Waters Spherisorb® columns, call your local sales office listed on page 22.
22
What’s newNew catalog available in MaySpherisorb® Columns now available from Waters (previous page)
How to reach usSales Offices
Austria and European Export (Central Europe, CIS, India and India Subcontinent)Waters Ges.m.b.H.Tel.: 1 8771807Fax: 1 8771808
Australia Waters Australia Pty. LimitedTel.: 2 933 1777Fax: 2 898 1455
Belgium and Luxembourg Waters S.A. - N.V.Tel.: 02 7261000Fax: 02 7261100
Brazil Waters Comercial LTDATel.: 011 55 11 543 7788Fax: 011 55 11 530 6413
Canada Waters LimitedTel.: 800 252 4752Fax: 905 678 9237
CIS Waters Representation Office, MoscowTel.: 7 095 9 336 7000Fax: 7 095 9 931 9193
Czech Republic and SlovakiaWaters Ges.m.b.H.Tel.: 42 2 205 138 41Fax: 42 2 35 23 75
Denmark Waters A/STel.: 46 598080Fax: 46 598585
Finland Waters OyTel.: 0 506 4140Fax: 0 5064 1411
France Waters S.A.Tel.: 1 30487200Fax: 1 30487201
Germany Waters GmbHTel.: 06196 40 06 00Fax: 06196 48 23 88
Hong Kong Waters China Ltd.Tel.: 82 2546 7771Fax: 82 2547 7933
Hungary Waters kftTel.: 1 1620686Fax: 1 1853236
India Waters Pvt. Ltd.Tel.: 80 3341944Fax: 80 3340527
Italy Waters S.p.A.Tel.: 02 2500565Fax: 02 2501827
Japan Nihon Waters Ltd.Tel.: 3 3471 7191Fax: 3 3471 7116
Malaysia Waters Asia Ltd.Tel.: 3 704 8600Fax: 3 704 8599
Mexico Waters S.A. DE C.V.Tel.: 525 359 0121Fax: 525 359 0394
The Netherlands Waters Chromatography B.V.Tel.: 7650 87200Fax: 7650 87280
Norway Waters ASTel.: 638 46 050Fax: 638 46 051
Peoples Republic of China - BeijingWaters China Ltd.Tel.: 10 592 8918Fax: 10 506 0344
Poland Waters Sp.zo.oTel.: 48 2 669 1225Fax: 48 2 663 7033
Puerto Rico WatersTel.: 809 747 8445, 790 2225Fax: 809 747 8448
Singapore Waters Asia Ltd. (Asia Headquarters)Tel.: 225 4855Fax: 225 4655
Spain Waters Cromatografia S.A.Tel.: 3 325 9616Fax: 3 325 9896
Sweden Waters Sverige ABTel.: 08 623 00 90Fax: 08 623 00 95
Switzerland Waters AGTel.: 62 889 2030Fax: 62 889 2059
Taiwan Waters Asia Ltd.Tel.: 2 706 8766Fax: 2 706 9704
UK and Ireland Waters Ltd.Tel.: 1 923 816700 Fax: 1 923 219012
All other countries
Waters Corporation34 Maple StreetMilford, MA 01757 USATel.: 508 478 2000Toll-free: 1 800 252 4752Fax: 508 872 1990
The Waters Chromatography Columns and SuppliesCatalog 1996-1997 will be available in early May. For your free copy, please check box 11 on the Business Reply Card and return today.
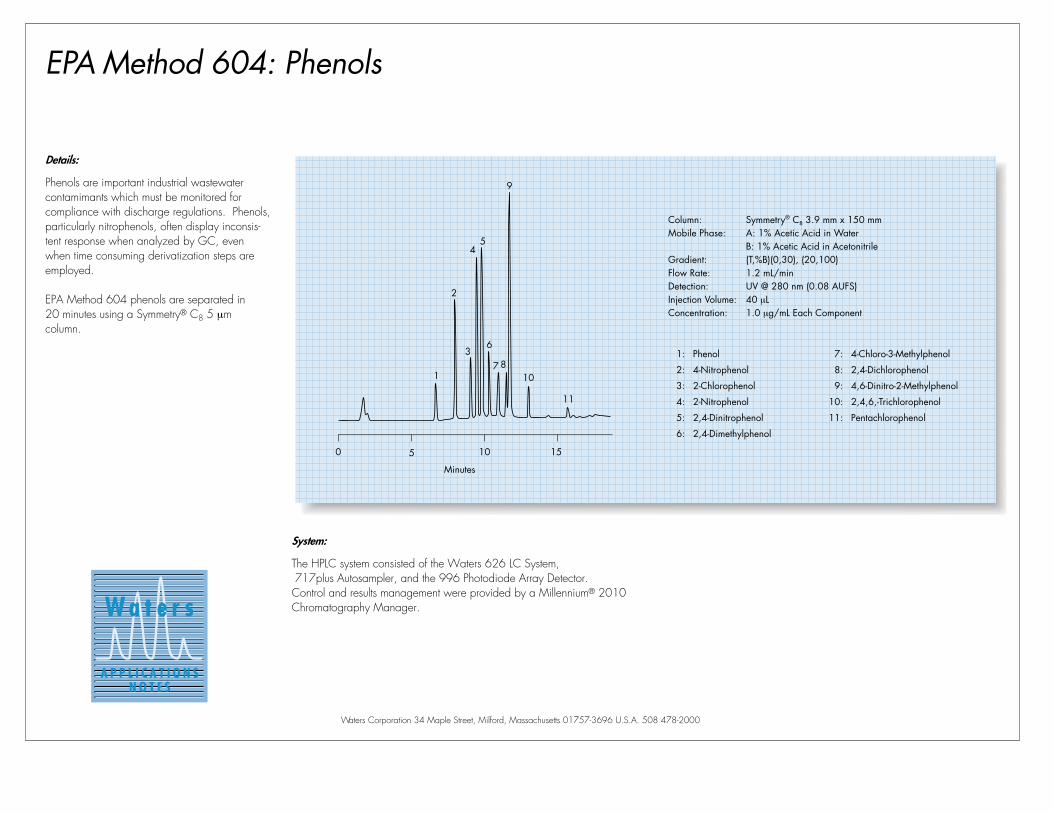
EPA Method 604: Phenols
System:
The HPLC system consisted of the Waters 626 LC System,717plus Autosampler, and the 996 Photodiode Array Detector.Control and results management were provided by a Millennium® 2010Chromatography Manager.
Waters Corporation 34 Maple Street, Milford, Massachusetts 01757-3696 U.S.A. 508 478-2000
Details:
Phenols are important industrial wastewatercontamimants which must be monitored forcompliance with discharge regulations. Phenols, particularly nitrophenols, often display inconsis-tent response when analyzed by GC, evenwhen time consuming derivatization steps areemployed.
EPA Method 604 phenols are separated in20 minutes using a Symmetry® C8 5 µmcolumn.
1
2
3
45
6
7 8
9
10
11
0 5 10 15
Minutes
Column: Symmetry® C8 3.9 mm x 150 mmMobile Phase: A: 1% Acetic Acid in Water
B: 1% Acetic Acid in AcetonitrileGradient: (T,%B)(0,30), (20,100)Flow Rate: 1.2 mL/minDetection: UV @ 280 nm (0.08 AUFS)Injection Volume: 40 µLConcentration: 1.0 µg/mL Each Component
1: Phenol
2: 4-Nitrophenol
3: 2-Chlorophenol
4: 2-Nitrophenol
5: 2,4-Dinitrophenol
6: 2,4-Dimethylphenol
7: 4-Chloro-3-Methylphenol
8: 2,4-Dichlorophenol
9: 4,6-Dinitro-2-Methylphenol
10: 2,4,6,-Trichlorophenol
11: Pentachlorophenol
Millennium® 2010 Chromatography Manager
Advanced computer technology simplifies accessing, interpreting, and reporting your results.
The productivity of today’s chromatography is centered around
the ability to find, generate, summarise, and report results in a
way that meets your needs and complies with any regulatory
requirements. The Millennium relational database lets you create
your own view filters to customise the way you sort your informa-
tion, such as “lotCode”.
• Using the database, you can track a method history giving
you audit trail capability that ensures total security of your
raw data and results. In addition, you can specify “Access
Type” which allows you to “lock” your methods for even
greater security.
• The database keeps track of your instruments, triggering an
alarm when scheduled maintenance is required. The
Millennium relational database lets you view the injection
information on any calibration point at any particular point
in time on a processing sequence. This gives you a
detailed account of the processing method for that injec
tion, ensuring an accurate audit trail for regulatory
compliance.
• The Millennium Chromatography Manager can provide
acquisition and control for as many as four chromato-
graphic systems, including three HP5890 GC.
• The Millennium Report Publisher has the capability to give
you exactly what you want.
Waters 996 Photodiode Array Detector
Complete Spectral Data-Complete Confidence in Peak Purity and Identity.
With Waters 996 Photodiode Array Detector, you can be
confident that if there is an impurity in your sample, you will
find it; that your compound is really what you report it to be
and not something else. Every spectral detail of your sample
is rapidly, easily, and accurately detected. Every peak is
analysed with mathematical precision so you can be sure to
asses the purity of peaks and confirm their identity. And you
will never have to trade off resolution against sensitivity.
• The 996 PDA Detector lets you look at your results in a
variety of ways - even while a separation is under way.
• Absorbency measurement over the entire 190-800 nm
wavelength range.
• The MaxPlot feature of the Millennium PDA Software
automatically detects UV/Vis absorbing compounds
anywhere within the 190-800 nm range. It measures
their absorbence maxima, and plots a peak for each
compound at its absorbence maximum, creating a
composite chromatogram of all of the compounds it
has detected.
Waters 717plus Autosampler
Waters 717plus Autosampler is a fully programmable
autosampler for High-Pressure Liquid Chromatography.
Waters 626 LC System
Innovative LC technology.
The Waters 626 LC System combines advanced polymeric
technology and low dispersion system volume into a liquid
chromatograph that provides the highest level of performance
available in a non-metallic system. The 626 LC System is
optimised for ion exchange, gel filtration, affinity, hydropho-
bic interaction and reversed-phase chemistries used in micro-
bore, analytical or micro preparative methods relevant to the
chemist. The 626 LC System has maximum system operating
pressure of up to 4000 psi.
For more Information onFor more information on these products please check box 17-21 on the Business Reply Card.
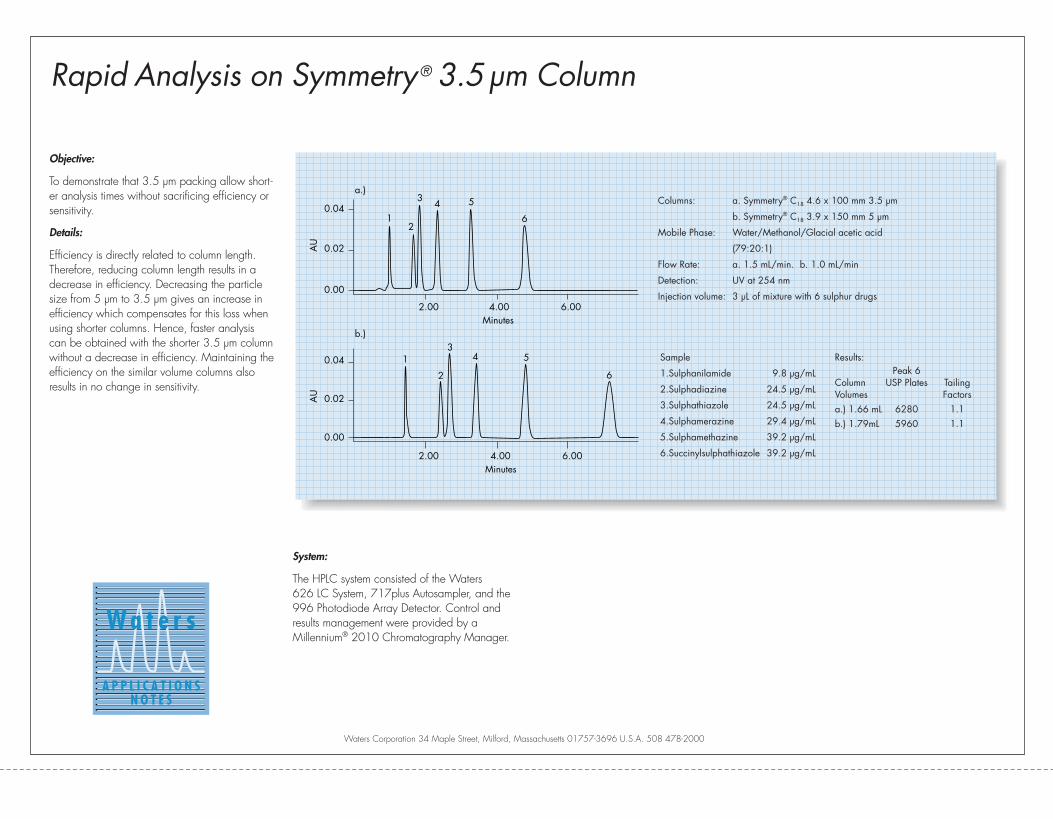
Rapid Analysis on Symmetry® 3.5 µm Column
2.00 4.00 6.00Minutes
0.00
0.02
0.04
AU
AU
2.00 4.00 6.00Minutes
0.00
0.02
0.04
12
3 4 5
6
1
2
34 5
6
a.)
b.)
Objective:
To demonstrate that 3.5 µm packing allow short-
er analysis times without sacrificing efficiency or
sensitivity.
Details:
Efficiency is directly related to column length.
Therefore, reducing column length results in a
decrease in efficiency. Decreasing the particle
size from 5 µm to 3.5 µm gives an increase in
efficiency which compensates for this loss when
using shorter columns. Hence, faster analysis
can be obtained with the shorter 3.5 µm column
without a decrease in efficiency. Maintaining the
efficiency on the similar volume columns also
results in no change in sensitivity.
System:
The HPLC system consisted of the Waters
626 LC System, 717plus Autosampler, and the
996 Photodiode Array Detector. Control and
results management were provided by a
Millennium® 2010 Chromatography Manager.
Waters Corporation 34 Maple Street, Milford, Massachusetts 01757-3696 U.S.A. 508 478-2000
Columns: a. Symmetry® C18 4.6 x 100 mm 3.5 µm
b. Symmetry® C18 3.9 x 150 mm 5 µm
Mobile Phase: Water/Methanol/Glacial acetic acid
(79:20:1)
Flow Rate: a. 1.5 mL/min. b. 1.0 mL/min
Detection: UV at 254 nm
Injection volume: 3 µL of mixture with 6 sulphur drugs
Sample
1.Sulphanilamide 9.8 µg/mL
2.Sulphadiazine 24.5 µg/mL
3.Sulphathiazole 24.5 µg/mL
4.Sulphamerazine 29.4 µg/mL
5.Sulphamethazine 39.2 µg/mL
6.Succinylsulphathiazole 39.2 µg/mL
Results:Peak 6
Column USP Plates TailingVolumes Factorsa.) 1.66 mL 6280 1.1b.) 1.79mL 5960 1.1

Waters 996 Photodiode Array Detector
Complete Spectral Data-Complete Confidence in Peak Purity and Identity.
With Waters 996 Photodiode Array Detector, you can be
confident that if there is an impurity in your sample, you will
find it; that your compound is really what you report it to be
and not something else. Every spectral detail of your sample
is rapidly, easily, and accurately detected. Every peak is
analysed with mathematical precision so you can be sure to
asses the purity of peaks and confirm their identity. And you
will never have to trade off resolution against sensitivity.
• The 996 PDA Detector lets you look at your results in a
variety of ways - even while a separation is under way.
• Absorbency measurement over the entire 190-800 nm
wavelength range.
• The MaxPlot feature of the Millennium PDA Software
automatically detects UV/Vis absorbing compounds
anywhere within the 190-800 nm range. It measures
their absorbence maxima, and plots a peak for each
compound at its absorbence maximum, creating a
composite chromatogram of all of the compounds it
has detected.
Waters 626 LC System
Innovative LC technology.
The Waters 626 LC System combines advanced polymeric
technology and low dispersion system volume into a liquid
chromatograph that provides the highest level of performance
available in a non-metallic system. The 626 LC System is
optimised for ion exchange, gel filtration, affinity, hydropho-
bic interaction and reversed-phase chemistries used in micro-
bore, analytical or micro preparative methods relevant to the
chemist The 626 LC System has maximum system operating
pressure of up to 4000 psi.
For more Information on
For more information on these products please check box 17-21 on the Business Reply Card.
Millennium® 2010 Chromatography Manager
Advanced computer technology simplifies accessing, interpreting, and reporting your results.
The productivity of today’s chromatography is centered around
the ability to find, generate, summarise, and report results in a
way that meets your needs and complies with any regulatory
requirements. The Millennium relational database lets you create
your own view filters to customise the way you sort your informa-
tion, such as “lotCode”.
• Using the database, you can track a method history giving
you audit trail capability that ensures total security of your
raw data and results. In addition, you can specify “Access
Type” which allows you to “lock” your methods for even
greater security.
• The database keeps track of your instruments, triggering an
alarm when scheduled maintenance is required. The
Millennium relational database lets you view the injection
information on any calibration point at any particular point
in time on a processing sequence. This gives you a
detailed account of the processing method for that injec
tion, ensuring an accurate audit trail for regulatory
compliance.
• The Millennium Chromatography Manager can provide
acquisition and control for as many as four chromato-
graphic systems, including three HP5890 GC.
• The Millennium Report Publisher has the capability to give
you exactly what you want.
Waters 717plus Autosampler
Waters 717plus Autosampler is a fully programmable
autosampler for High-Pressure Liquid Chromatography.