Embed Size (px)
Citation preview

SMALL MOLECULE STRUCTURE SOLUTION AND REFINEMENT
Small Molecule Structure Solution and Refinement
Step 18: Defining formula
Structure solution and refinement of organic and inorganic molecules and peptides can be performed in the HKL-3000SM command center. This part of HKL-3000 is integrated with SHELXS and SHELXL from the SHELX-97
package, written by Prof. George Sheldrick. These programs can be acquired directly from the author at
http://shelx.uni-ac.gwdg.de/SHELX/. The structure solution process can be simplified if the chemical composition of
the molecule under study is known. Exact knowledge of the chemical composition is not necessary, but a precise
definition of the chemical composition will make all subsequent steps straightforward. The chemical content can be
entered in the Project panel. In the Project box click the EDIT PROJECT button (Figure 1). A new window, Setup
Project, will appear. Click the DEFINE FORMULA button and the periodic table of elements will appear (Figure 2). To
build the formula of the compound, click on the symbol for each element present in the compound and change the
number of atoms using the arrows or by typing directly into the box. Close the Element Composition box, click DONE
in the Setup Project window to close it, and, if your data are already collected and reduced, you can go to the
Structure tab.
Figure 1. Edit and Setup Project windows

SMALL MOLECULE STRUCTURE SOLUTION AND REFINEMENT
Figure 2. The periodic table that is used to define element composition
I don‟t want to lose time solving structures that have already been solved. Any suggestions?
Search databases! Over 390,000 carbon-containing structures analyzed with X-ray or neutron diffraction methods are
provided by the Cambridge Structural Database (CSD). If you have a license to access the CSD, click the CAMBRIDGE
DATABASE button in the right lower corner of the Index panel, you can check the indexed pre-scaled unit cell
parameters, or check the parameters of the unit cell after scaling your data. In the latter case find the CAMBRIDGE
DATABASE button under the Project tab and click on it (Figure 3). You will also find the CAMBRIDGE DATABASE button
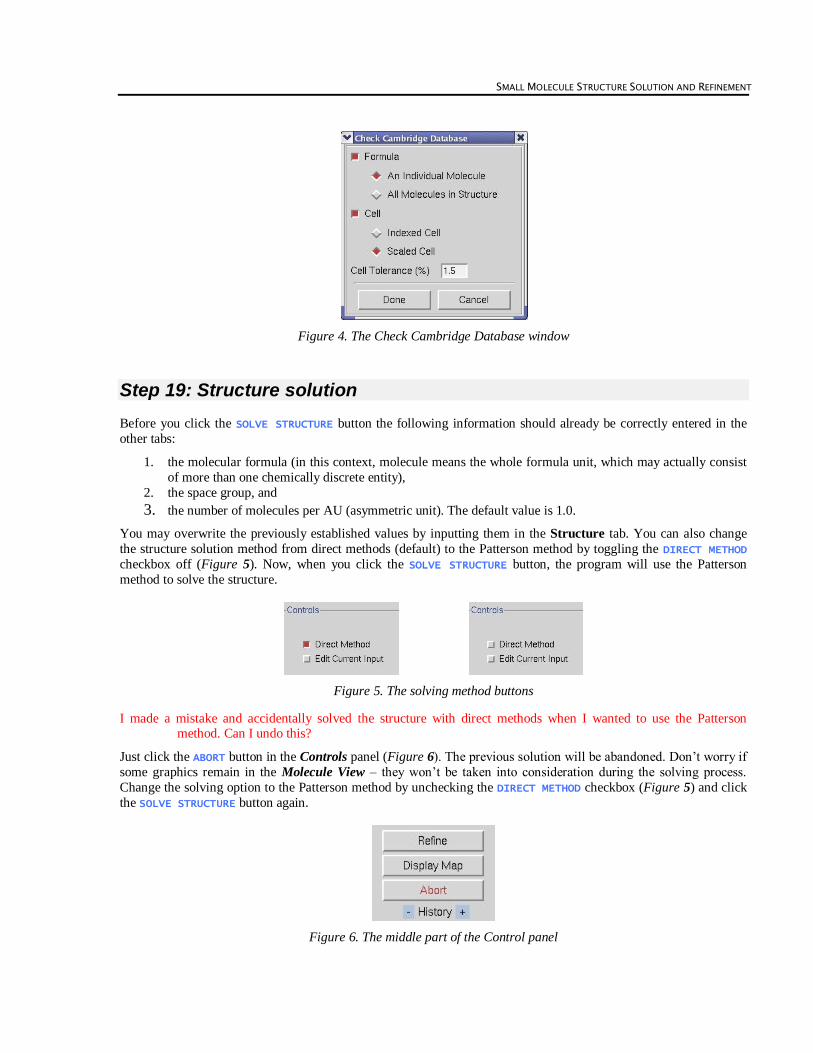
in the Setup Project window (Figure 1). A new window (Figure 4) entitled Check Cambridge Database will open.
In this window you will see what parameters will be taken under consideration while searching through the CSD. By
default, the formula you defined is treated as the formula of an individual molecule (if your compound consists of
more than one type of ion or molecule, you should select All Molecules in Structure to find a result). Other defaults
are: tolerance of 1.5% (expressed as a percentage of the longest cell dimension), searching on the reduced cell and choice of the primitive (P) lattice type. The tolerance value is changeable in the Check Cambridge Database
window and other parameters can be changed after opening the Build Queries tab in CCDC ConQuest window. The
results, sorted by identifiers called refcodes, are shown in the View Results window. You can toggle between the
Author/Journal, Chemical, Crystal, Experimental, Diagram, 3D Visualizer and CSD Internals tabs to find out if
the structure has previously been solved. For more details see the CCDC web page at http://www.ccdc.cam.ac.uk/.
Figure 3. A button that opens the CSD window
SMALL MOLECULE STRUCTURE SOLUTION AND REFINEMENT
Figure 4. The Check Cambridge Database window
Step 19: Structure solution
Before you click the SOLVE STRUCTURE button the following information should already be correctly entered in the
other tabs:
1. the molecular formula (in this context, molecule means the whole formula unit, which may actually consist
of more than one chemically discrete entity),
2. the space group, and
3. the number of molecules per AU (asymmetric unit). The default value is 1.0.
You may overwrite the previously established values by inputting them in the Structure tab. You can also change
the structure solution method from direct methods (default) to the Patterson method by toggling the DIRECT METHOD
checkbox off (Figure 5). Now, when you click the SOLVE STRUCTURE button, the program will use the Patterson
method to solve the structure.
Figure 5. The solving method buttons
I made a mistake and accidentally solved the structure with direct methods when I wanted to use the Patterson method. Can I undo this?
Just click the ABORT button in the Controls panel (Figure 6). The previous solution will be abandoned. Don‟t worry if
some graphics remain in the Molecule View – they won‟t be taken into consideration during the solving process.
Change the solving option to the Patterson method by unchecking the DIRECT METHOD checkbox (Figure 5) and click
the SOLVE STRUCTURE button again.
Figure 6. The middle part of the Control panel
SMALL MOLECULE STRUCTURE SOLUTION AND REFINEMENT
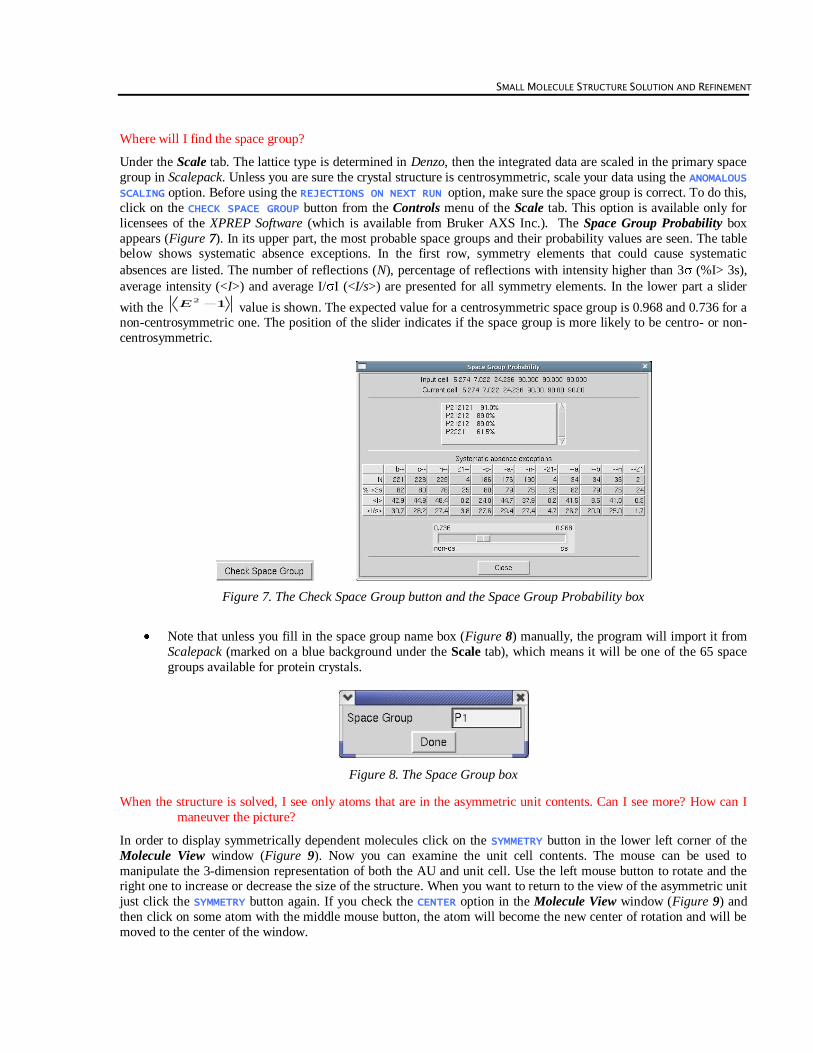
Where will I find the space group?
Under the Scale tab. The lattice type is determined in Denzo, then the integrated data are scaled in the primary space
group in Scalepack. Unless you are sure the crystal structure is centrosymmetric, scale your data using the ANOMALOUS
SCALING option. Before using the REJECTIONS ON NEXT RUN option, make sure the space group is correct. To do this,
click on the CHECK SPACE GROUP button from the Controls menu of the Scale tab. This option is available only for
licensees of the XPREP Software (which is available from Bruker AXS Inc.). The Space Group Probability box
appears (Figure 7). In its upper part, the most probable space groups and their probability values are seen. The table below shows systematic absence exceptions. In the first row, symmetry elements that could cause systematic
absences are listed. The number of reflections (N), percentage of reflections with intensity higher than 3 (%I> 3s),
average intensity (<I>) and average I/ I (<I/s>) are presented for all symmetry elements. In the lower part a slider
with the 12
E value is shown. The expected value for a centrosymmetric space group is 0.968 and 0.736 for a non-centrosymmetric one. The position of the slider indicates if the space group is more likely to be centro- or non-
centrosymmetric.
Figure 7. The Check Space Group button and the Space Group Probability box
Note that unless you fill in the space group name box (Figure 8) manually, the program will import it from
Scalepack (marked on a blue background under the Scale tab), which means it will be one of the 65 space
groups available for protein crystals.
Figure 8. The Space Group box
When the structure is solved, I see only atoms that are in the asymmetric unit contents. Can I see more? How can I
maneuver the picture?
In order to display symmetrically dependent molecules click on the SYMMETRY button in the lower left corner of the
Molecule View window (Figure 9). Now you can examine the unit cell contents. The mouse can be used to
manipulate the 3-dimension representation of both the AU and unit cell. Use the left mouse button to rotate and the right one to increase or decrease the size of the structure. When you want to return to the view of the asymmetric unit
just click the SYMMETRY button again. If you check the CENTER option in the Molecule View window (Figure 9) and
then click on some atom with the middle mouse button, the atom will become the new center of rotation and will be
moved to the center of the window.

SMALL MOLECULE STRUCTURE SOLUTION AND REFINEMENT
Note that if you choose an atom from a symmetry-related molecule to center on, the structure will be
centered on the corresponding atom from the molecule visible in Molecule View window when SYMMETRY is
switched off. This molecule has white colored bonds to distinguish it from the symmetry-related molecules
whose bonds are colored blue.
Figure 9. The Molecule View window
How do I modify the model of the solved structure? I want to delete some atoms and change the type or labels of others.
When you use the middle mouse button to click on any atom a new gray window will appear (Figure 10). At the top
of the window, three pieces of information are given: the label of that particular atom, the residual electron density
(in eÅ-3) on a difference Fourier map for the atom, and the B factor. These are followed by the list of elements that
are present in the molecular formula, which can be used to change the selected atom to a different element (simply
select the new element for the atom).
Next is the Rename option to change the label of a particular type of the atom (Figure 11). To check the default atom
label click the LABELS button at the bottom of the Molecule View window (Figure 9). When you choose the Rename
option, the new box will open (Figure 11) where you can change the atom label (according to SHELX-97
requirements, the atom name should not be longer than 4 characters). If you choose a number that is already assigned
to the same type of atom, the program will switch the numbers between these two atoms.
In order to delete an atom, place the cursor on this atom, click the middle mouse button, and select the Delete option.
The last two options are Symm Atom and Symm Molecule. Symm Atom (or Molecule) is used when a particular
atom or molecule, selected in the Molecule View window, is assigned a symmetry related position but should be part
of the main structure . To change this assignment, follow the same general procedure as for deleting and renaming,
but choose Symm Atom, and choose the atom you wish to reassign using the mouse middle button.
SMALL MOLECULE STRUCTURE SOLUTION AND REFINEMENT
Figure 10. The atoms information box
How do I check the distances and angles between atoms?
Check the option MEASURE DISTANCE/ANGLE (the angle option is active after clicking on the word DISTANCE) on the
lower right corner of the Molecule View window (see Figure 9). Using the middle mouse button, choose the atoms
between which you want to know the distance or bond angle. The radii of the selected atoms will enlarge and the
value of the distance (in angstroms) or bond angle (in degrees) will appear in the lower right corner of the Molecule
View window.
Figure 11. The Rename window
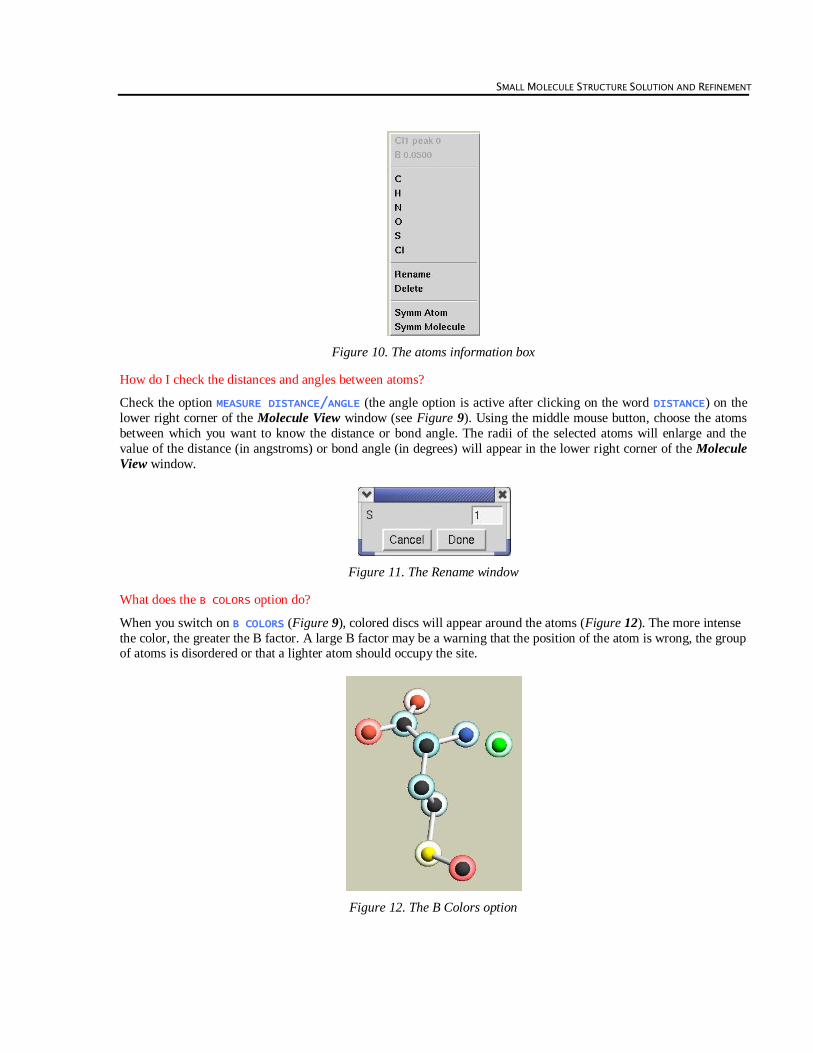
What does the B COLORS option do?
When you switch on B COLORS (Figure 9), colored discs will appear around the atoms (Figure 12). The more intense
the color, the greater the B factor. A large B factor may be a warning that the position of the atom is wrong, the group of atoms is disordered or that a lighter atom should occupy the site.
Figure 12. The B Colors option
SMALL MOLECULE STRUCTURE SOLUTION AND REFINEMENT
The solved structure looks nice and colorful but I am used to looking at log files or *.lst files. How I can see
them?
Go to the Controls box and click SHOW LOG (see Figure 13). A new editor window will open with the log file loaded.
The default editor is Emacs, but you can choose between several common editors under Options in the top menubar
of the HKL-2000 window. When you click Save Options, your favorite editor and setup will be used in the future.
Now you can inspect and manually edit the SHELX-97 *.lst file. Note that manual editing of *.lst files is
necessary only in very rare circumstances, and should not be used as a standard method for structure solution.
Figure 13. The left part of the Controls panel
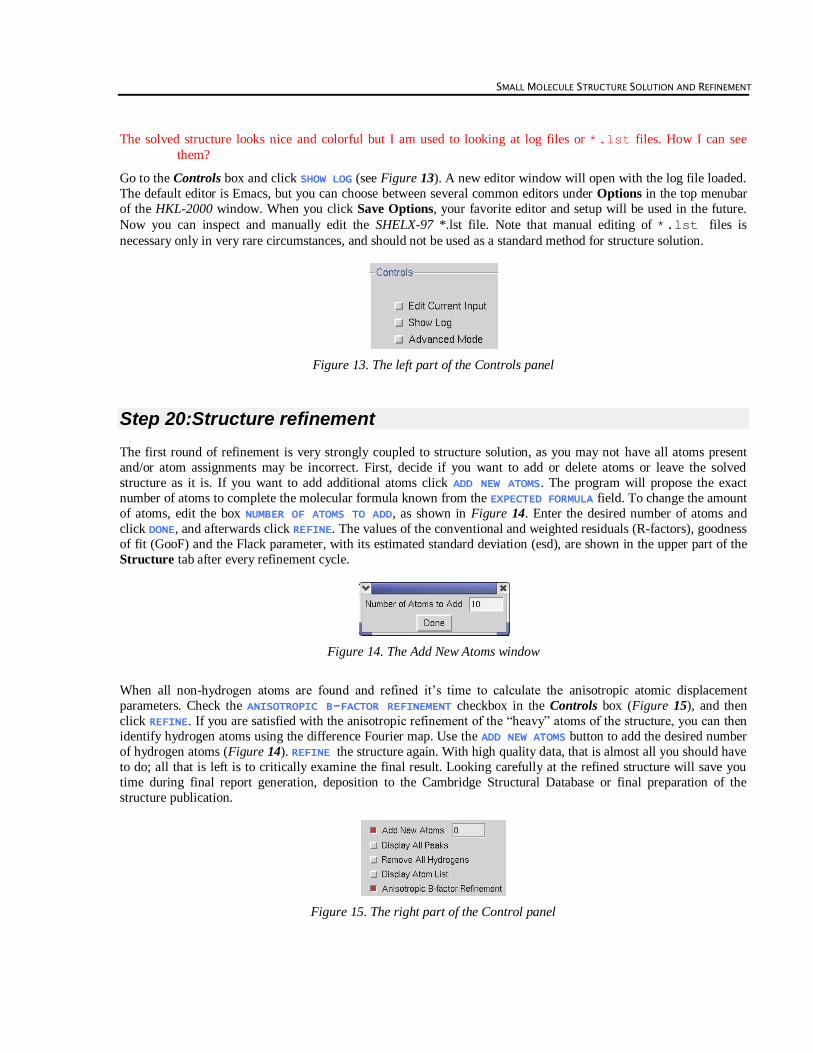
Step 20:Structure refinement
The first round of refinement is very strongly coupled to structure solution, as you may not have all atoms present
and/or atom assignments may be incorrect. First, decide if you want to add or delete atoms or leave the solved
structure as it is. If you want to add additional atoms click ADD NEW ATOMS. The program will propose the exact
number of atoms to complete the molecular formula known from the EXPECTED FORMULA field. To change the amount
of atoms, edit the box NUMBER OF ATOMS TO ADD, as shown in Figure 14. Enter the desired number of atoms and
click DONE, and afterwards click REFINE. The values of the conventional and weighted residuals (R-factors), goodness
of fit (GooF) and the Flack parameter, with its estimated standard deviation (esd), are shown in the upper part of the
Structure tab after every refinement cycle.
Figure 14. The Add New Atoms window
When all non-hydrogen atoms are found and refined it‟s time to calculate the anisotropic atomic displacement
parameters. Check the ANISOTROPIC B-FACTOR REFINEMENT checkbox in the Controls box (Figure 15), and then
click REFINE. If you are satisfied with the anisotropic refinement of the “heavy” atoms of the structure, you can then
identify hydrogen atoms using the difference Fourier map. Use the ADD NEW ATOMS button to add the desired number
of hydrogen atoms (Figure 14). REFINE the structure again. With high quality data, that is almost all you should have
to do; all that is left is to critically examine the final result. Looking carefully at the refined structure will save you
time during final report generation, deposition to the Cambridge Structural Database or final preparation of the
structure publication.
Figure 15. The right part of the Control panel
SMALL MOLECULE STRUCTURE SOLUTION AND REFINEMENT
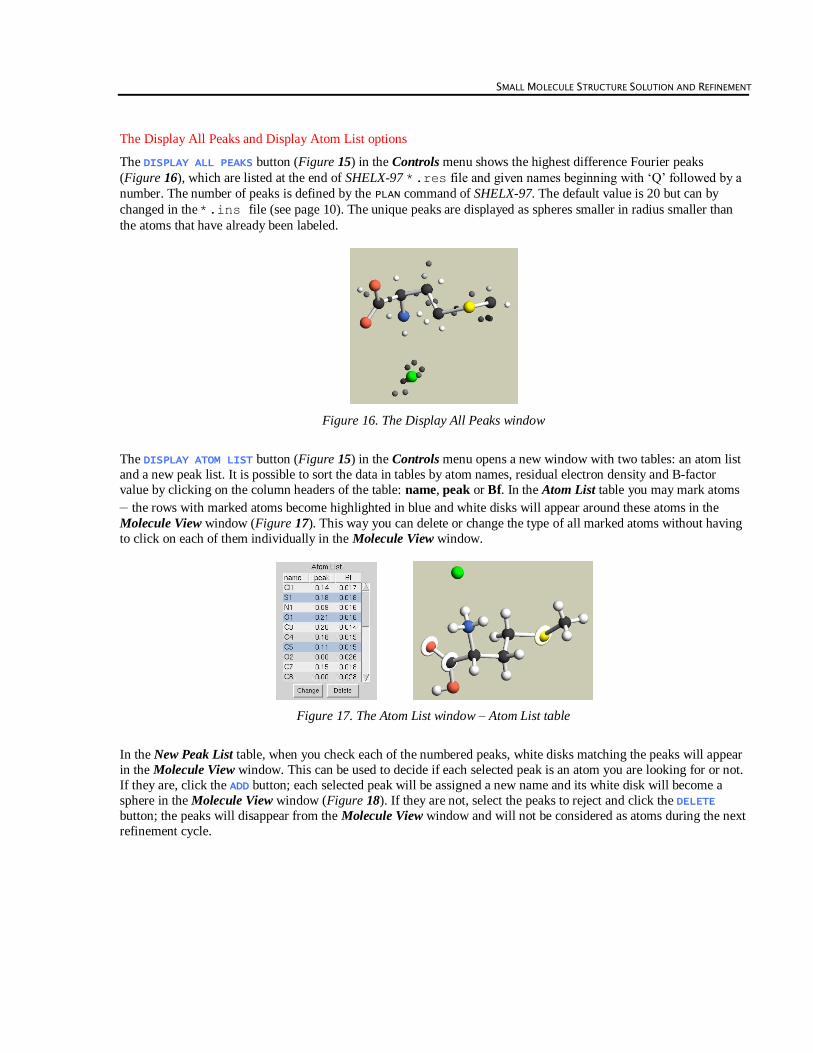
The Display All Peaks and Display Atom List options
The DISPLAY ALL PEAKS button (Figure 15) in the Controls menu shows the highest difference Fourier peaks
(Figure 16), which are listed at the end of SHELX-97 *.res file and given names beginning with „Q‟ followed by a
number. The number of peaks is defined by the PLAN command of SHELX-97. The default value is 20 but can by
changed in the *.ins file (see page 10). The unique peaks are displayed as spheres smaller in radius smaller than
the atoms that have already been labeled.
Figure 16. The Display All Peaks window
The DISPLAY ATOM LIST button (Figure 15) in the Controls menu opens a new window with two tables: an atom list
and a new peak list. It is possible to sort the data in tables by atom names, residual electron density and B-factor
value by clicking on the column headers of the table: name, peak or Bf. In the Atom List table you may mark atoms – the rows with marked atoms become highlighted in blue and white disks will appear around these atoms in the
Molecule View window (Figure 17). This way you can delete or change the type of all marked atoms without having
to click on each of them individually in the Molecule View window.
Figure 17. The Atom List window – Atom List table
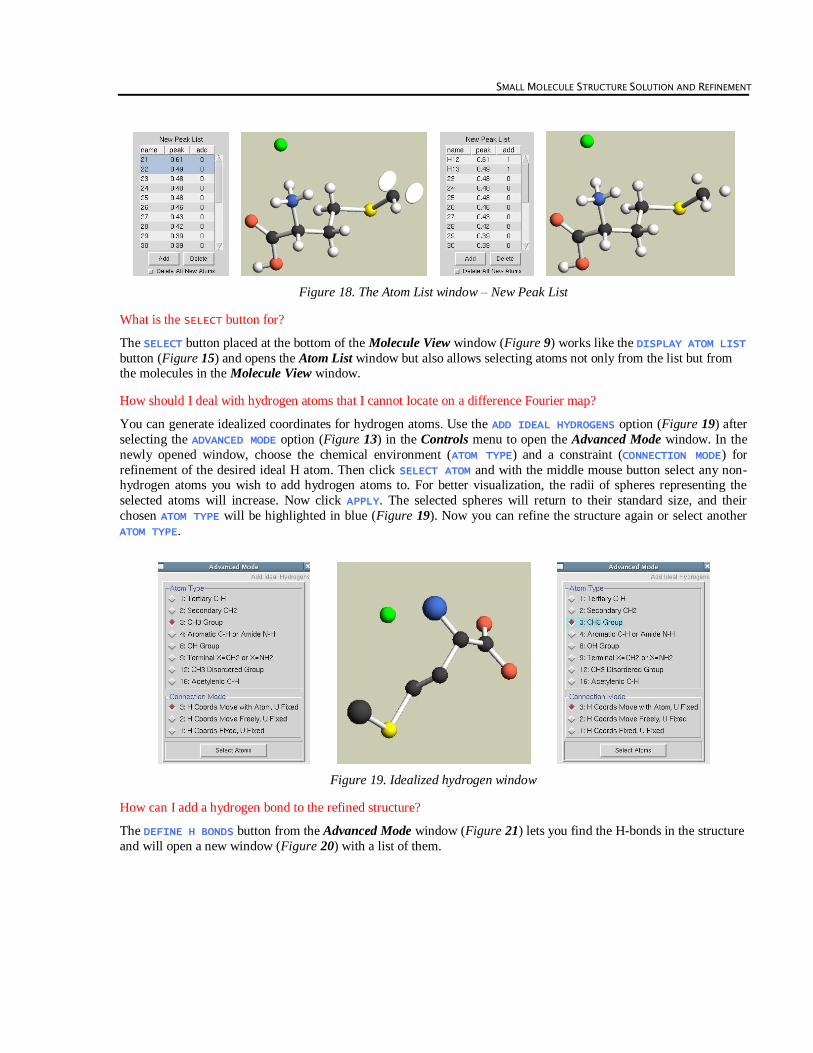
In the New Peak List table, when you check each of the numbered peaks, white disks matching the peaks will appear
in the Molecule View window. This can be used to decide if each selected peak is an atom you are looking for or not.
If they are, click the ADD button; each selected peak will be assigned a new name and its white disk will become a
sphere in the Molecule View window (Figure 18). If they are not, select the peaks to reject and click the DELETE
button; the peaks will disappear from the Molecule View window and will not be considered as atoms during the next
refinement cycle.
SMALL MOLECULE STRUCTURE SOLUTION AND REFINEMENT
Figure 18. The Atom List window – New Peak List
What is the SELECT button for?
The SELECT button placed at the bottom of the Molecule View window (Figure 9) works like the DISPLAY ATOM LIST
button (Figure 15) and opens the Atom List window but also allows selecting atoms not only from the list but from the molecules in the Molecule View window.
How should I deal with hydrogen atoms that I cannot locate on a difference Fourier map?
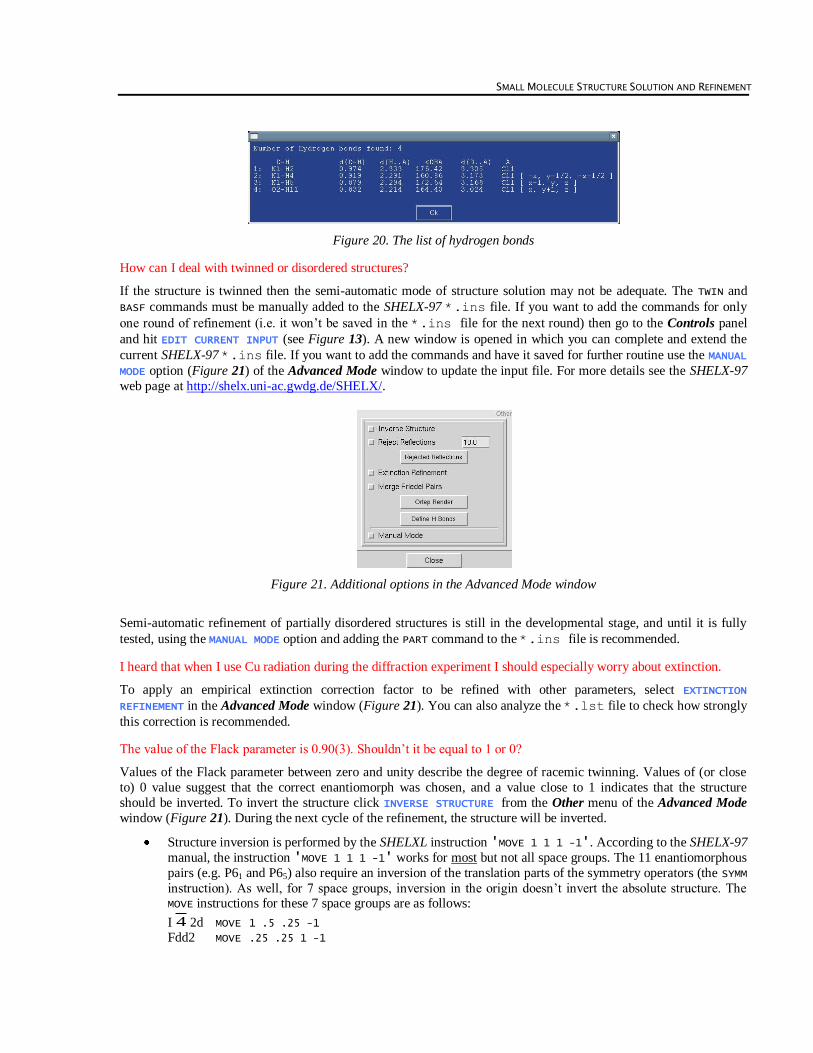
You can generate idealized coordinates for hydrogen atoms. Use the ADD IDEAL HYDROGENS option (Figure 19) after
selecting the ADVANCED MODE option (Figure 13) in the Controls menu to open the Advanced Mode window. In the
newly opened window, choose the chemical environment (ATOM TYPE) and a constraint (CONNECTION MODE) for
refinement of the desired ideal H atom. Then click SELECT ATOM and with the middle mouse button select any non-hydrogen atoms you wish to add hydrogen atoms to. For better visualization, the radii of spheres representing the
selected atoms will increase. Now click APPLY. The selected spheres will return to their standard size, and their
chosen ATOM TYPE will be highlighted in blue (Figure 19). Now you can refine the structure again or select another
ATOM TYPE.
Figure 19. Idealized hydrogen window
How can I add a hydrogen bond to the refined structure?
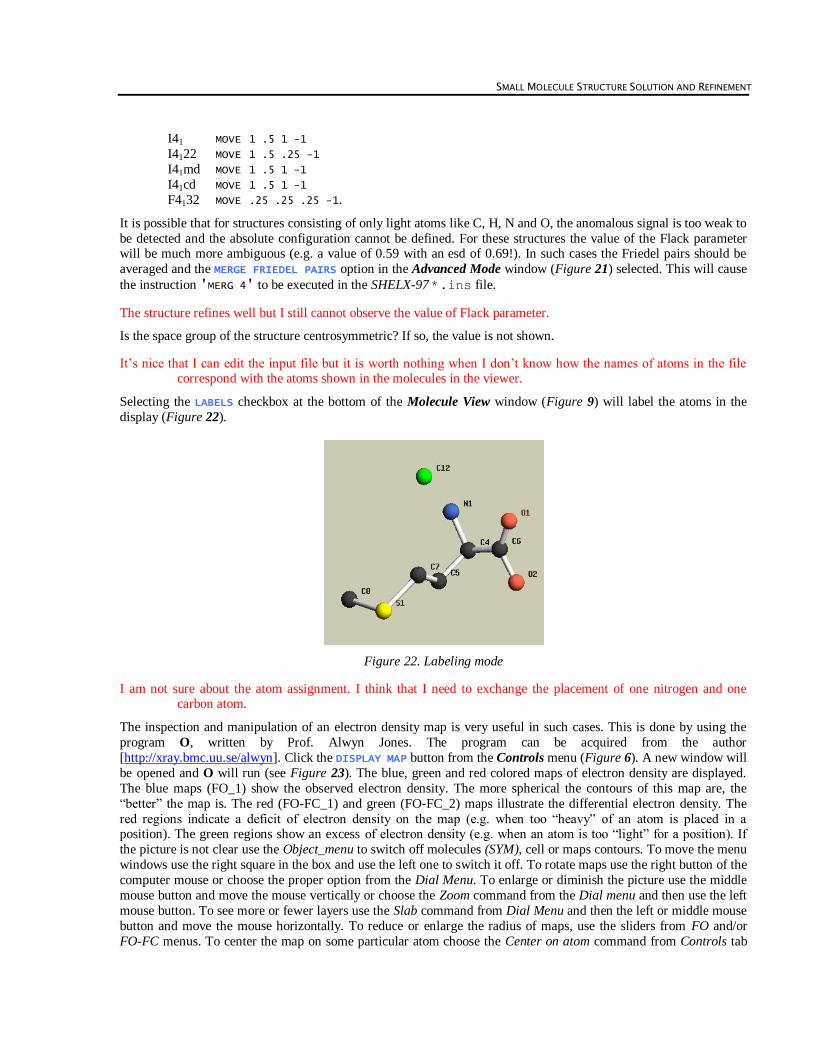
The DEFINE H BONDS button from the Advanced Mode window (Figure 21) lets you find the H-bonds in the structure
and will open a new window (Figure 20) with a list of them.
SMALL MOLECULE STRUCTURE SOLUTION AND REFINEMENT
Figure 20. The list of hydrogen bonds
How can I deal with twinned or disordered structures?
If the structure is twinned then the semi-automatic mode of structure solution may not be adequate. The TWIN and
BASF commands must be manually added to the SHELX-97 *.ins file. If you want to add the commands for only
one round of refinement (i.e. it won‟t be saved in the *.ins file for the next round) then go to the Controls panel
and hit EDIT CURRENT INPUT (see Figure 13). A new window is opened in which you can complete and extend the
current SHELX-97 *.ins file. If you want to add the commands and have it saved for further routine use the MANUAL
MODE option (Figure 21) of the Advanced Mode window to update the input file. For more details see the SHELX-97
web page at http://shelx.uni-ac.gwdg.de/SHELX/.
Figure 21. Additional options in the Advanced Mode window
Semi-automatic refinement of partially disordered structures is still in the developmental stage, and until it is fully
tested, using the MANUAL MODE option and adding the PART command to the *.ins file is recommended.
I heard that when I use Cu radiation during the diffraction experiment I should especially worry about extinction.
To apply an empirical extinction correction factor to be refined with other parameters, select EXTINCTION
REFINEMENT in the Advanced Mode window (Figure 21). You can also analyze the *.lst file to check how strongly
this correction is recommended.
The value of the Flack parameter is 0.90(3). Shouldn‟t it be equal to 1 or 0?
Values of the Flack parameter between zero and unity describe the degree of racemic twinning. Values of (or close
to) 0 value suggest that the correct enantiomorph was chosen, and a value close to 1 indicates that the structure
should be inverted. To invert the structure click INVERSE STRUCTURE from the Other menu of the Advanced Mode
window (Figure 21). During the next cycle of the refinement, the structure will be inverted.
Structure inversion is performed by the SHELXL instruction 'MOVE 1 1 1 -1'. According to the SHELX-97
manual, the instruction 'MOVE 1 1 1 -1' works for most but not all space groups. The 11 enantiomorphous
pairs (e.g. P61 and P65) also require an inversion of the translation parts of the symmetry operators (the SYMM
instruction). As well, for 7 space groups, inversion in the origin doesn‟t invert the absolute structure. The MOVE instructions for these 7 space groups are as follows:
I 4 2d MOVE 1 .5 .25 -1 Fdd2 MOVE .25 .25 1 -1
SMALL MOLECULE STRUCTURE SOLUTION AND REFINEMENT
I41 MOVE 1 .5 1 -1 I4122 MOVE 1 .5 .25 -1 I41md MOVE 1 .5 1 -1 I41cd MOVE 1 .5 1 -1 F4132 MOVE .25 .25 .25 -1.
It is possible that for structures consisting of only light atoms like C, H, N and O, the anomalous signal is too weak to
be detected and the absolute configuration cannot be defined. For these structures the value of the Flack parameter will be much more ambiguous (e.g. a value of 0.59 with an esd of 0.69!). In such cases the Friedel pairs should be
averaged and the MERGE FRIEDEL PAIRS option in the Advanced Mode window (Figure 21) selected. This will cause
the instruction 'MERG 4' to be executed in the SHELX-97 *.ins file.
The structure refines well but I still cannot observe the value of Flack parameter.
Is the space group of the structure centrosymmetric? If so, the value is not shown.
It‟s nice that I can edit the input file but it is worth nothing when I don‟t know how the names of atoms in the file correspond with the atoms shown in the molecules in the viewer.
Selecting the LABELS checkbox at the bottom of the Molecule View window (Figure 9) will label the atoms in the
display (Figure 22).
Figure 22. Labeling mode
I am not sure about the atom assignment. I think that I need to exchange the placement of one nitrogen and one carbon atom.
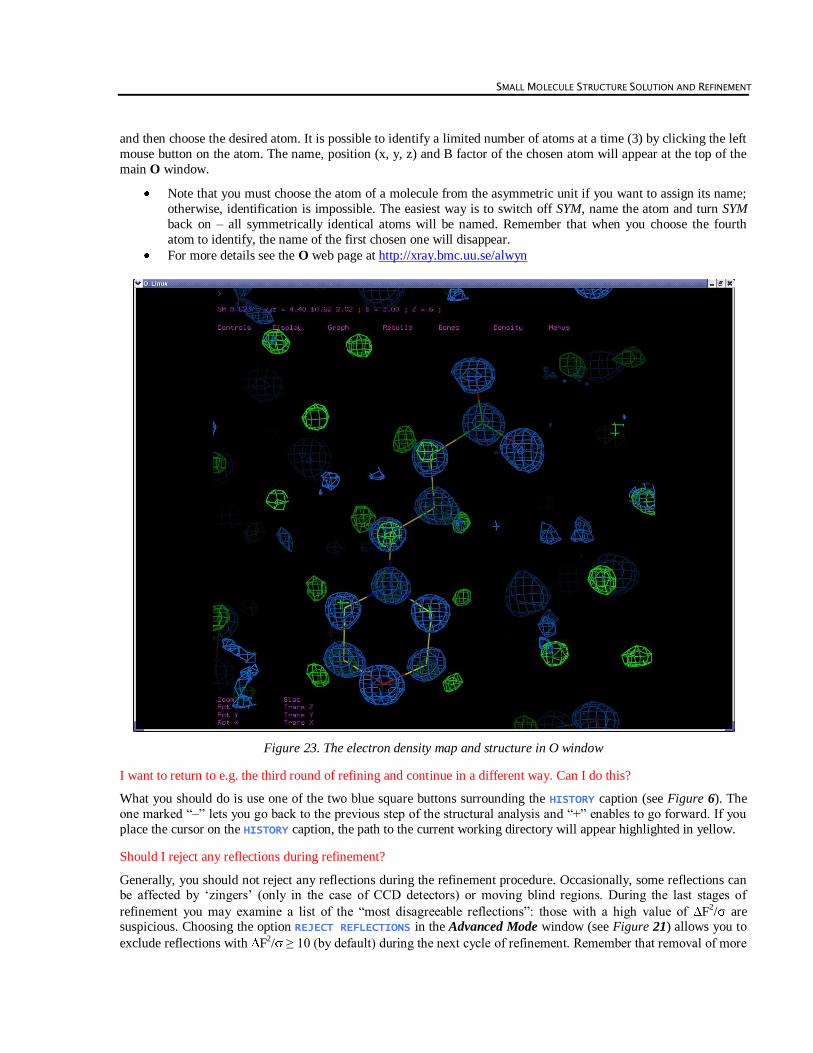
The inspection and manipulation of an electron density map is very useful in such cases. This is done by using the
program O, written by Prof. Alwyn Jones. The program can be acquired from the author
[http://xray.bmc.uu.se/alwyn]. Click the DISPLAY MAP button from the Controls menu (Figure 6). A new window will
be opened and O will run (see Figure 23). The blue, green and red colored maps of electron density are displayed.
The blue maps (FO_1) show the observed electron density. The more spherical the contours of this map are, the
“better” the map is. The red (FO-FC_1) and green (FO-FC_2) maps illustrate the differential electron density. The
red regions indicate a deficit of electron density on the map (e.g. when too “heavy” of an atom is placed in a position). The green regions show an excess of electron density (e.g. when an atom is too “light” for a position). If
the picture is not clear use the Object_menu to switch off molecules (SYM), cell or maps contours. To move the menu
windows use the right square in the box and use the left one to switch it off. To rotate maps use the right button of the
computer mouse or choose the proper option from the Dial Menu. To enlarge or diminish the picture use the middle
mouse button and move the mouse vertically or choose the Zoom command from the Dial menu and then use the left
mouse button. To see more or fewer layers use the Slab command from Dial Menu and then the left or middle mouse
button and move the mouse horizontally. To reduce or enlarge the radius of maps, use the sliders from FO and/or
FO-FC menus. To center the map on some particular atom choose the Center on atom command from Controls tab
SMALL MOLECULE STRUCTURE SOLUTION AND REFINEMENT
and then choose the desired atom. It is possible to identify a limited number of atoms at a time (3) by clicking the left
mouse button on the atom. The name, position (x, y, z) and B factor of the chosen atom will appear at the top of the
main O window.
Note that you must choose the atom of a molecule from the asymmetric unit if you want to assign its name;
otherwise, identification is impossible. The easiest way is to switch off SYM, name the atom and turn SYM
back on – all symmetrically identical atoms will be named. Remember that when you choose the fourth
atom to identify, the name of the first chosen one will disappear.
For more details see the O web page at http://xray.bmc.uu.se/alwyn
Figure 23. The electron density map and structure in O window
I want to return to e.g. the third round of refining and continue in a different way. Can I do this?
What you should do is use one of the two blue square buttons surrounding the HISTORY caption (see Figure 6). The
one marked “–” lets you go back to the previous step of the structural analysis and “+” enables to go forward. If you
place the cursor on the HISTORY caption, the path to the current working directory will appear highlighted in yellow.
Should I reject any reflections during refinement?
Generally, you should not reject any reflections during the refinement procedure. Occasionally, some reflections can be affected by „zingers‟ (only in the case of CCD detectors) or moving blind regions. During the last stages of
refinement you may examine a list of the “most disagreeable reflections”: those with a high value of F2/ are suspicious. Choosing the option REJECT REFLECTIONS in the Advanced Mode window (see Figure 21) allows you to
exclude reflections with F2/ ≥ 10 (by default) during the next cycle of refinement. Remember that removal of more
SMALL MOLECULE STRUCTURE SOLUTION AND REFINEMENT
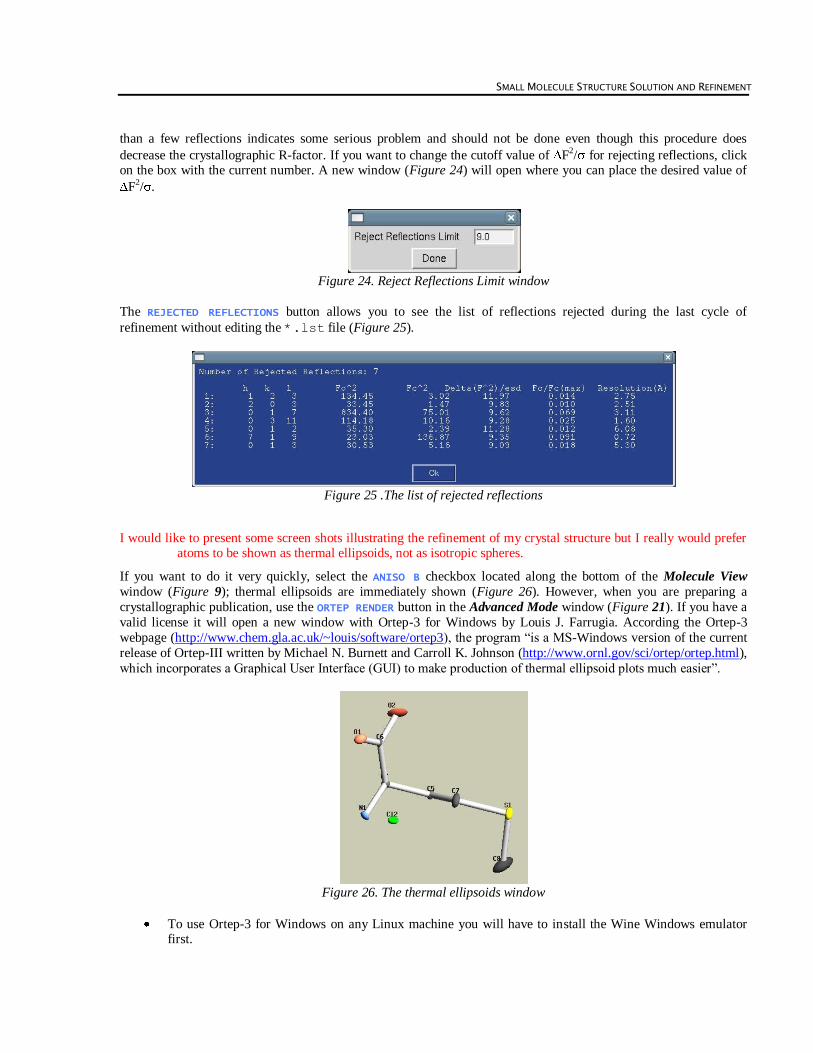
than a few reflections indicates some serious problem and should not be done even though this procedure does
decrease the crystallographic R-factor. If you want to change the cutoff value of F2/ for rejecting reflections, click
on the box with the current number. A new window (Figure 24) will open where you can place the desired value of
F2/ .
Figure 24. Reject Reflections Limit window
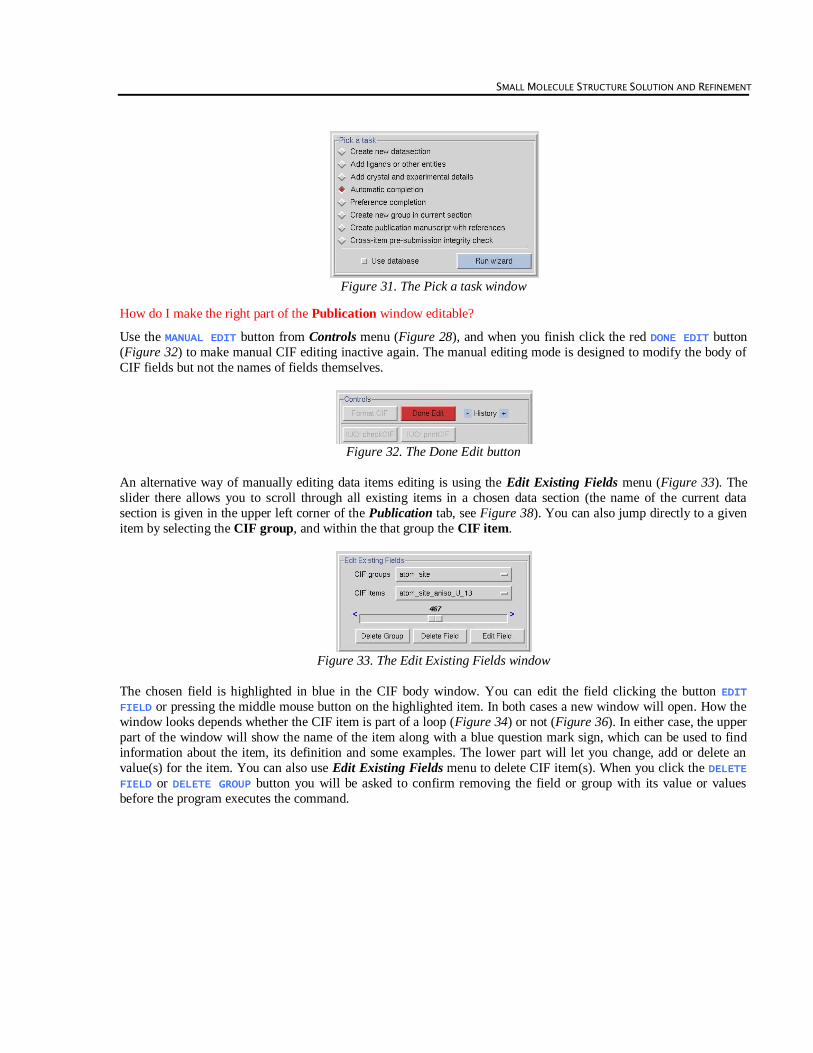
The REJECTED REFLECTIONS button allows you to see the list of reflections rejected during the last cycle of
refinement without editing the *.lst file (Figure 25).
Figure 25 .The list of rejected reflections
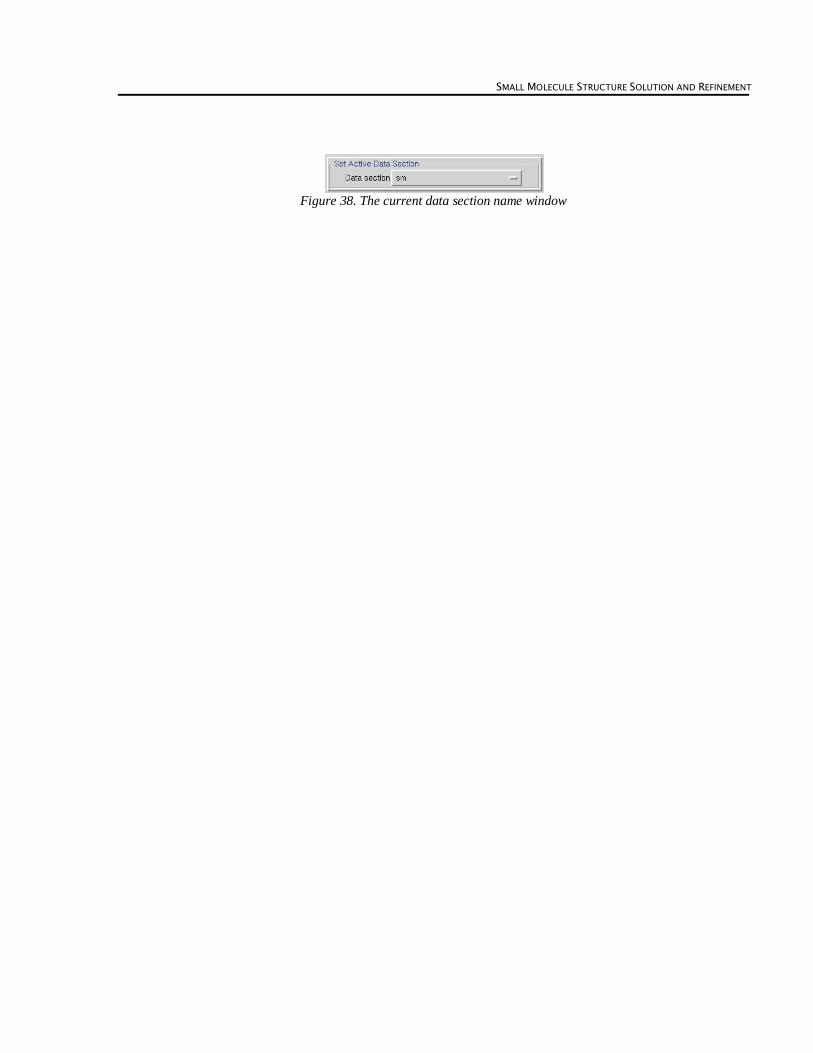
I would like to present some screen shots illustrating the refinement of my crystal structure but I really would prefer atoms to be shown as thermal ellipsoids, not as isotropic spheres.
If you want to do it very quickly, select the ANISO B checkbox located along the bottom of the Molecule View
window (Figure 9); thermal ellipsoids are immediately shown (Figure 26). However, when you are preparing a
crystallographic publication, use the ORTEP RENDER button in the Advanced Mode window (Figure 21). If you have a
valid license it will open a new window with Ortep-3 for Windows by Louis J. Farrugia. According the Ortep-3
webpage (http://www.chem.gla.ac.uk/~louis/software/ortep3), the program “is a MS-Windows version of the current
release of Ortep-III written by Michael N. Burnett and Carroll K. Johnson (http://www.ornl.gov/sci/ortep/ortep.html),
which incorporates a Graphical User Interface (GUI) to make production of thermal ellipsoid plots much easier”.
Figure 26. The thermal ellipsoids window
To use Ortep-3 for Windows on any Linux machine you will have to install the Wine Windows emulator first.

SMALL MOLECULE STRUCTURE SOLUTION AND REFINEMENT
Step 21: Crystallographic Information File
You will find a very useful tool under the Publication tab (Figure 27). It is used to create, complete, check and print
the Crystallographic Information File (CIF), which is an essential component of all papers describing small molecule
crystallographic structures.
Figure 27. The Publication window
How do I start?
When you open the Publication tab after finishing structure solution and refinement in the Structure window, a
partially filled CIF template will appear in the right half of the window. At the top of the CIF body, the path to the
directory where the file will be saved is shown. CIF template program primarily uses the sm.cif file from the last
refine subdirectory placed in the structure_sm directory to generate the initial template.
Can I use a *.cif file other than the generated template in the Publication panel?
Yes, you can. In the lower left corner of the Controls menu, click the LOAD CIF button (Figure 28).Then you will be
prompted to select the *.cif file you wish to use.

SMALL MOLECULE STRUCTURE SOLUTION AND REFINEMENT
Figure 28. The CIF Controls menu
Can I use the data from two different *.cif files? I had prepared the whole file before, but I managed to further
refine the structure. Now I do not want to waste time filling out the template once again .
In this case you can use the MERGE CIF button (Figure 28) in the Controls menu. A new window CIF merge
datasection name assignment is opened (Figure 29). It is important to carefully assign the names of the merged data
sections, especially when the same block of data is named differently in the files to be merged. Otherwise instead of
merging values of the same fields, the program will add a new data section at the end of the old file. For example, if
the new file has a data section data_I, and the existing file has the same items in a data section named data_sm,
choose the MERGE TO SM option instead of choosing KEEP CURRENT NAME.
Figure 29. The CIF merge datasection name assignment window
New values are preferred for merging (i.e. the values in the new CIF file) but you can change this behavior by
unselecting the New value preferred for merge option (Figure 28). The program will inform you if “nothing
suspicious is found;” otherwise a new window will open (Figure 30). This window will list data items which are
present in both *.cif files but differ in value. For each one you can select the value to keep.
Figure 30. The Merge CIF window
What is the Pick a task box for?
The options from the Pick a task window (Figure 31) let you, generally, do two things. The first is to fill in data in
the CIF file using information already calculated by HKL-3000. These include replacing question marks with proper
data taken from Denzo and Scalepack programs (the AUTOMATIC COMPLETION button), or from a personally created
database (PREFACE COMPLETION button), or using your knowledge about the crystal description (ADD CRYSTAL AND
EXPERIMENTAL DETAILS button). The second is to add additional data sections, which are required parts of CIF but
are not provided in a “raw” CIF produced by the instruction ACTA in the SHELXL *.ins file. These additional
fields can be created by picking the following options: CREATE NEW DATASECTION, CREATE NEW GROUP IN CURRENT
SECTION, CREATE PUBLICATION MANUSCRIPT WITH REFERENCES. After choosing a task, click the RUN WIZARD button
to execute it.
SMALL MOLECULE STRUCTURE SOLUTION AND REFINEMENT
Figure 31. The Pick a task window
How do I make the right part of the Publication window editable?
Use the MANUAL EDIT button from Controls menu (Figure 28), and when you finish click the red DONE EDIT button
(Figure 32) to make manual CIF editing inactive again. The manual editing mode is designed to modify the body of
CIF fields but not the names of fields themselves.
Figure 32. The Done Edit button
An alternative way of manually editing data items editing is using the Edit Existing Fields menu (Figure 33). The
slider there allows you to scroll through all existing items in a chosen data section (the name of the current data
section is given in the upper left corner of the Publication tab, see Figure 38). You can also jump directly to a given
item by selecting the CIF group, and within the that group the CIF item.
Figure 33. The Edit Existing Fields window
The chosen field is highlighted in blue in the CIF body window. You can edit the field clicking the button EDIT
FIELD or pressing the middle mouse button on the highlighted item. In both cases a new window will open. How the
window looks depends whether the CIF item is part of a loop (Figure 34) or not (Figure 36). In either case, the upper
part of the window will show the name of the item along with a blue question mark sign, which can be used to find
information about the item, its definition and some examples. The lower part will let you change, add or delete an
value(s) for the item. You can also use Edit Existing Fields menu to delete CIF item(s). When you click the DELETE
FIELD or DELETE GROUP button you will be asked to confirm removing the field or group with its value or values
before the program executes the command.

SMALL MOLECULE STRUCTURE SOLUTION AND REFINEMENT
Figure 34. The CIF edition of looped item
If you realize that some parts of the CIF file are missing, you can use the ADD NEW FIELDS menu (Figure 35) which
works analogously to the EDIT FILE menu.
Figure 35. The Add New Fields window
What are these strange blue marks “>” in the editing windows for?
Click on this mark to expand the editing area for the field (Figure 36). This is useful when you wish to add a longer
sentence or just more than one word or symbol.
Figure 36. The CIF edition of the common item
Is there a search function in the Publication panel?
Below the window with the main body of the CIF file, you will find a keyword searching tool (Figure 37) which
helps locate a particular word in the whole CIF body or in a CIF item from the dictionary (CIF items are these written
in blue in the right half of the main window). Type the keyword in the Pattern window and click the SCAN CIF FILE or SCAN DICTIONARY button. A new window will appear with all CIF items containing the keyword. Choose the
proper item – it will be highlighted in blue in the new window as well as in the main CIF contents.
Figure 37. The CIF key word searching tool
How can I validate my CIF file?
Once you have created your CIF you should check both the format and essential components of the *.cif file. Use
the FORMAT CIF button in Controls menu (Figure 28) and the number of marks on each line and the presence of the
proper punctuation marks will be checked. After corrections, if your computer is connected to the Internet, click the
IUCR CHECK CIF button. Your structure will be checked using the checkCIF/PLATON service at
http://journals.iucr.org/services/cif/checkcif.html. Using IUCR PRINT CIF lets you preview your article before
submission using the printcif service at http://journals.iucr.org/services/cif/print.
SMALL MOLECULE STRUCTURE SOLUTION AND REFINEMENT
Figure 38. The current data section name window

SMALL MOLECULE STRUCTURE SOLUTION AND REFINEMENT