Embed Size (px)
Citation preview

45th International Conference on Environmental Systems ICES-2015-283 12-16 July 2015, Bellevue, Washington
International Conference on Environmental Systems
1
Small-GEO Satellite: Electrical Propulsion Sub-System (EPPS) Thermal Design and Lessons Learnt
Davide Rizzo1, Christian Vettore
2, Alessandro Spalla
3
CGS Compagnia Generale per lo Spazio, Milano, 20151, Italy
Marcus Gröller4, Dr. Frank Bodendieck
5, Dr. Dieter Birreck
6
OHB System SE, Bremen, Germany
Small-GEO is a general-purpose small geostationary satellite platform that is giving
European industry the opportunity to play a significant role in the commercial telecom
market. Small-GEO has been developed by an industrial team managed by OHB System SE.
The Thermal Control System (TCS) Critical Design Review (CDR) close-out was
successfully closed and the integration tasks have just been accomplished. The satellite is
now on his way to Thermal Vacuum (TVAC) test facility. Small-GEO foresees three
different types of propulsion systems, namely chemical, electrical and cold gas. This paper
describes the Satellite Platform Electrical Propulsion Sub-System (EPPS) thermal control
which uses mainly passive concepts complemented with heaters either thermostatically or
software regulated. The sizing cases used to design the thermal control system will be
presented as well as the final predictions both for transfer and geostationary phases. The
EPPS design is mainly connected to the GEO phases. The EPPS provides, with electric
propulsion thrusters, the impulse for orbit control, as well as for dissipation of excess
angular momentum that is accumulated in the reaction wheels. An overview of the sizing
firing scenarios will be presented; they involve not only the thrusters but the control units
and the related piping too. Then the most relevant results will be shown and discussed. The
last part of the paper deals with the problems encountered, the solutions adopted and the
lessons learnt during the design and optimization steps.
Nomenclature
ADE = Actuator Drive Electronics
ADPM = Antenna Deployment and Pointing Mechanism
AVG = Average
BOL = Beginning Of Life
CDR = Critical Design Review
CFRP = Carbon Fiber Reinforced Plastic
CGTA = Cold Gas Thruster Assembly
COP = Cold OPerating
EOL = End Of Life
EPPS = Electrical ProPulsion Sub-System
EP = Electrical Propulsion
EPTA = Electrical Propulsion Thruster Assembly
EQ = Equinox
1 Senior Thermal Engineer, Thermal & Mechanical Dept, [email protected].
2 Head of Thermal and Mechanical Department, Thermal & Mechanical Dept, [email protected].
3 Thermal Engineer, Thermal & Mechanical Dept, [email protected].
4 System Thermal Engineer, Thermal Design & Verification Dept, [email protected].
5 Head of Thermal Analysis and Verification Department, Thermal Dept, [email protected].
6 SGEO Project Manager, [email protected].
International Conference on Environmental Systems
2
ETSU = External Thruster Switching Unit
FDV = Fill and Drain Valve
FU = Filter Unit
GEO = Geostationary
GTO = Geostationary Transfer Orbit
HAG1 = Hispasat Advanced Generation 1
HET = Hall Effect Thruster
HIB = Hot Interface Box
LEOP = Launch and Early Orbit Phases
MLI = Multi Layer Insulator
OSR = Optical Solar Reflector
P/F = Platform
P/L = Payload
PPU = Power Processing Unit
PRP = Pressure Regulation Panel
PSA = Propellant Supply Assembly
RW = Reaction Wheel
S/C = Spacecraft
SCE = Support Control Electronics
SGEO = Small GEO
SM = Safe Mode
SMHP = Surface Mounted Heat Pipe
SS = Summer Solstice
TCS = Thermal Control System
TRP = Thermal Reference Point
TVAC = Thermal Vacuum
XFC = Xenon Flow Control unit
XTA = Xenon Tank Assembly
WS = Winter Solstice
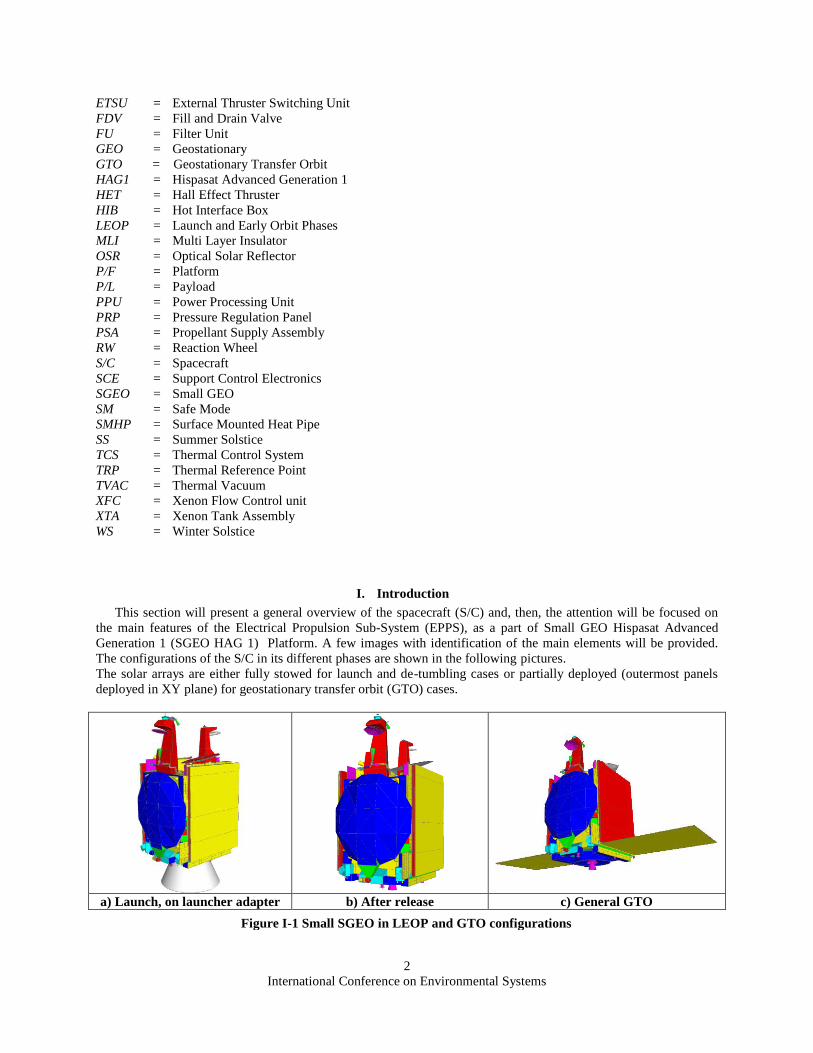
I. Introduction
This section will present a general overview of the spacecraft (S/C) and, then, the attention will be focused on
the main features of the Electrical Propulsion Sub-System (EPPS), as a part of Small GEO Hispasat Advanced
Generation 1 (SGEO HAG 1) Platform. A few images with identification of the main elements will be provided.
The configurations of the S/C in its different phases are shown in the following pictures.
The solar arrays are either fully stowed for launch and de-tumbling cases or partially deployed (outermost panels
deployed in XY plane) for geostationary transfer orbit (GTO) cases.
a) Launch, on launcher adapter b) After release c) General GTO
Figure I-1 Small SGEO in LEOP and GTO configurations

International Conference on Environmental Systems
3
The next pictures show the location of the Hall Effect Thrusters (HET) thrusters and an overview of the Xenon tanks
and the EPPS piping inside the S/C.
Figure I-3 HET-HET thrusters support panel and location
Figure I-4 SGEO HAG1 EPPS internal model overview
Figure I-2 Small SGEO in GEO configuration

International Conference on Environmental Systems
4
II. Small-GEO EPPS functional description
The Electrical Propulsion System is a part of the Small Geostationary Platform.
The function of the EPPS is to perform orbital manoeuvers during:
- initial detumble after separation from Launch Vehicle (Cold Gas Thruster Assembly);
- station acquisition and repositioning;
- station-keeping N/S and E/W during 15 years;
- momentum management during all phases except during GTO-GEO transfer;
- transfer to graveyard orbit at End of Mission.
Electrical propulsion system components are:
- Xenon Tanks Assembly (XTA).
- Propellant Supply Assembly (PSA): Support Control Electronics (SCE) and Pressure Regulator Panel (PRP)
- 2 EP Thruster Assembly (EPTA) each composed of: Power Processing Unit (PPU), 4 Hall Effect Thrusters
(HET), 4+4 Xe Flow Control unit (XFC), 4 Filter Units (FU) and an External Switching Unit (ETSU).
- EPPS Inter-assembly Tubing including valves and tubing support.
The following schematic summarizes all the SGEO EPPS components.
Figure II-1 Small SGEO EPPS overview

International Conference on Environmental Systems
5
The power demand for the SGEO HAG1 EPPS is 1.6kW.
A. XTA
The XTA consists of two tanks that have an internal volume of 60L. The tanks are made from a Ti-6Al4V
liner with two welded-on tubes (Ti-3Al-2.5V). This liner is overwrapped with Carbon Fiber Reinforced Plastic
(CFRP). The mechanical interface on the lower (-Z) end is an adapter flange to the SGEO structure. At the upper
(+) end there is a ball bearing to allow limited movement of the tank. For the SGEO program, one of the tank
ports has been rotated by 180 deg in order to simplify accommodation into SGEO.
B. PSA
The function of the PSA is to decrease the pressure from the XTA (186 bar @ BOL @ 50 ºC) to the required
operational pressure (2.2 bar @ 20ºC) and to supply a constant feed pressure to the different thruster assemblies.
The PSA consists of a PRP, which is the mechanical part of the system and the SCE which is the electronics that
controls the PRP. The PRP has two ports to the exterior of the satellite. These allow filling of the XTA, at high
pressure, and provides a test port for the low pressure side of the PRP. There are also four ports to the remaining
EPPS, three low pressure branches and one high pressure branch. The low pressure branches lead to the two
discrete ion propulsion branches and one to the tube leading to the Cold Gas Conditioning System (CGCS). The
high pressure branch leads to the lower port of the two XTAs.
C. EPTA
The Electronic Propulsion Thruster Assembly consists of one PPU, one ETSU and four HETs, each with
their dedicated Hot Interface Box (HIB), FU and XFC. The PPU connects to the system bus to be able to provide
power to the ETSU, which in turn powers the HETs, via the FUs. The HETs are, via the XFCs, attached to one
of the low pressure branches of the PSA.
Electrical Propulsion Subsystem
(EPPS)
Xenon Tank Assembly
(XTA)
Propellant Supply Assembly
(PSA)
Support Control Electronics (SCE)
Pressure Regulator Panel (PRP)
Harness
Xenon Tanks
EP Thruster Assembly
(HET)
Power Processing Unit (PPU)
Xenon Flow Control Unit (XFC)
Thruster (HET)
External Thruster Switching Unit
(ETSU)
Filter Unit (FU)
Harness
EPPS inter-assembly tubing
Tubing
Isolation valves
Tubing support
Figure II-2 Small SGEO EPPS breakdown

International Conference on Environmental Systems
6
Each of the four HET thrusters with the corresponding XFC, HIB and interconnecting tubing and harness, are
assembled onto structural brackets into eight HET thruster sub-assemblies, given by the figure below. The
complete assembly is integrated from the outside onto the thruster panel.
The HET assemblies (i.e. HET + HET bracket) are mounted on large common brackets, HET assembly brackets.
Each HET assembly bracket is attached on one side to a S/C radiator (65 deg zones) and on the other side to a
CFRP panel as shown in the next picture.
Figure II-4 Small SGEO two HET assemblies on a S/C corner
Figure II-3 Small SGEO single HET sub-assembly
Figure II-5 Small SGEO HET thruster

International Conference on Environmental Systems
7
D. EPPS inter-assembly tubing
The inter-assembly tubing consists of a high-pressure branch and a low-pressure branch.
The high-pressure tubing connects the lower Xenon tank ports to the PSA pressure regulation panel and one
FDV. High pressure tubing is also used to connect the upper Xenon tank ports to the Fill and Drain Valve (FDV)
used drain the system. The low pressure tubing is all Xenon tubing downstream of the PSA. This tubing is made
up of four branches, two connecting the PSA to the HETs, one connecting the PSA to the CGCS and one
connecting the CGCS to the CG Thruster Valves (CGTV). The tubing material is Ti-3Al2.5V The tubing is held
together by aluminum stand-offs, which are attached to the satellite structure. There are two main types of stand-
offs, one that can support up to five tubes and one that can support up to two tubes. These are further subdivided
to provide support in different configurations, vertical or horizontal and with varying base.
The EPPS has three Fill and Drain Valves connecting the tubing system to the outside of the satellite. They are
positioned on the –Z Antenna Deployment and Pointing Mechanism (ADPM) structure panel. The first FDV is
used as a test port to externally test the pressure of the xenon propellant at the low pressure node of the PSA. The
second FDV connects to the high pressure node of the PSA. It is used to fill the XTA as well as to test the EPPS,
including the PSA but without the XTA. This can be done by closing isolation valves placed at the input to each
Xenon tank. The third FDV is used as a high pressure drain port, to be used when evacuating the XTA, without
affecting the remaining EPPS.
III. Small-GEO EPPS applicable thermal requirements
The qualification or design temperature ranges, at Thermal Reference Point (TRP) level, applicable to the SGEO
EPPS equipment are reported here below:
EPPS Platform Equipment Design temperatures
Non Operating Start-Up Operating
Description Abbreviation TNOP,min TNOP,max TST,min TST,max TOP,min TOP,max
[°C] [°C] [°C] [°C] [°C] [°C]
Propellant Supply Assembly PSA
PSA - Support Control Electronics SCE -10 50 -10 50 -10 50
PSA - Fill & Drain Valve FDV -35 50 -35 50 -35 50
CG Thruster Assembly CGTA
CG Actuator Drive Electronics ADE -10 50 -10 50 -10 50
CG Thruster Valve TV 15 50 15 50 20 50
HET Assembly
HET Thruster HET -20 190 -20 190 -20 190
HET Xenon Flow Control XFC -5 85 -5 85 -5 85
HET electrical Filter Unit FU -30 60 -30 60 -15 60
HET Hot Interface Box HIB -15 110 -15 110 -15 110
HET External Thruster Switching Unit
ETSU -15 50 -15 50 -10 50
HET Power Processing Unit PPU -15 50 -15 50 -10 50
Table III-1 SGEO EPPS equipment temperatures

International Conference on Environmental Systems
8
EPPS Platform Equipment Design temperatures
Non Operating Start-Up Operating
Description Abbreviation TNOP,min TNOP,max TST,min TST,max TOP,min TOP,max
[°C] [°C] [°C] [°C] [°C] [°C]
Xenon Tank Assembly XTA 20 50
35 47
Propellant Supply Assembly PSA
PSA – PRP PRP 30 40 30 40 20 50
CG Thruster Assembly CGTA
CG Conditioning System CGCS 30 40 30 40 20 50
Xenon Tubing
Tubing Low Pressure (LP) XTA -35 80 NA NA -35 80
Tubing High Pressure (HP) XTA 20 50 NA NA 20 50
Table III-2 SGEO EPPS equipment temperatures (cont.)
The power dissipation of each EPPS component is here below presented:
Power [W]
EQB
OL
CO
P1
2
EQB
OL
CO
P1
EQB
OL
CO
P2
EQB
OL
CO
P3
EQB
OL
CO
P4
EQB
OL
TC7
EQEO
L TC
8
EQEO
L TC
9
SMEQ
BO
L G
12
SSB
OL
B1
SSB
OL
TC7
SSEO
L E1
SSEO
L TC
8
SSEO
L TC
9
WSB
OL
C1
WSB
OL
TC6
WSB
OL
TC7
WSE
OL
F1
WSE
OL
TC8
WSE
OL
TC9
HET MAX 0 0 0 0 0 284.3 284.3 284.3 0 284.3 284.3 284.3 284.3 284.3 284.3 284.3 284.3 284.3 284.3 284.3
HET MIN 0 0 0 0 0 0 0 0 0 0 0 0 0 0 0 0 0 0 0 0
HET AVG 0 0 0 0 0 45.958 45.958 45.958 0 45.958 45.958 45.958 45.958 45.958 45.958 45.958 45.958 45.958 45.958 45.958
XFC MAX 0 0 0 0 0 1.9 1.9 1.9 0 1.9 1.9 1.9 1.9 1.9 1.9 1.9 1.9 1.9 1.9 1.9
XFC MIN 0 0 0 0 0 0 0 0 0 0 0 0 0 0 0 0 0 0 0 0
XFC AVG 0 0 0 0 0 0.307 0.307 0.307 0 0.307 0.307 0.307 0.307 0.307 0.307 0.307 0.307 0.307 0.307 0.307
FU MAX 0 0 0 0 0 1.9 1.9 1.9 0 1.9 1.9 1.9 1.9 1.9 1.9 1.9 1.9 1.9 1.9 1.9
FU MIN 0 0 0 0 0 0 0 0 0 0 0 0 0 0 0 0 0 0 0 0
FU AVG 0 0 0 0 0 0.307 0.307 0.307 0 0.307 0.307 0.307 0.307 0.307 0.307 0.307 0.307 0.307 0.307 0.307
HARNESS MAX 0 0 0 0 0 2.32 2.32 2.32 0 2.32 2.32 2.32 2.32 2.32 2.32 2.32 2.32 2.32 2.32 2.32
HARNESS MIN 0 0 0 0 0 0 0 0 0 0 0 0 0 0 0 0 0 0 0 0
HARNESS AVG 0 0 0 0 0 0.375 0.375 0.375 0 0.375 0.375 0.375 0.375 0.375 0.375 0.375 0.375 0.375 0.375 0.375
PRP MAX 0 0 0 0 0 6.9 6.9 6.9 8.1 6.9 6.9 6.9 6.9 6.9 6.9 6.9 6.9 6.9 6.9 6.9
PRP MIN 0 0 0 0 0 0 0 0 8.1 0 0 0 0 0 0 0 0 0 0 0
PRP AVG 0 0 0 0 0 1.115 1.115 1.115 8.1 1.115 1.115 1.115 1.115 1.115 1.115 1.115 1.115 1.115 1.115 1.115
CGCS MAX 0 0 0 0 0 0 0 0 0 0 0 0 0 0 0 0 0 0 0 0
CGCS MIN 0 0 0 0 0 0 0 0 0 0 0 0 0 0 0 0 0 0 0 0
CGCS AVG 0 0 0 0 0 0 0 0 0 0 0 0 0 0 0 0 0 0 0 0
CGTV MAX 0 0 0 0 0 0 0 0 0 0 0 0 0 0 0 0 0 0 0 0
CGTV MIN 0 0 0 0 0 0 0 0 0 0 0 0 0 0 0 0 0 0 0 0
CGTV AVG 0 0 0 0 0 0 0 0 0 0 0 0 0 0 0 0 0 0 0 0
Table III-3 EPPS power dissipation summary
IV. Small-GEO EPPS Thermal Control Subsystem description
The main function of the SGEO Thermal Control System (TCS) is to maintain all the S/C equipment within the
allowed temperature ranges. For this purpose, SGEO uses thermal control techniques common to all S/Cs:
- large lightweight radiators
- Multi-Layer Insulator (MLI) blankets on all external surfaces not used for radiators.
- embedded and surface mounted heat pipes
- high emittance internal coatings
- internal MLI/ Single-Layer Insulator (SLI) blankets
- heaters/thermostats
- coating/painting
EPPS thermal control main features are:
- Xenon tanks are fully covered with MLI and equipped with heaters;
- Xenon piping is isolated from structure by low conductivity stand-offs;
- specific piping sections are heater controlled and covered by low-emissivity tape;
- HET assemblies are mounted on Al brackets, attached to a S/C radiator and to a CFRP panel;
- PPU is mounted on heat pipes, along with ADE and SCE, to reject its high dissipation;
- ETSU is heaters controlled and installed on an Al doubler;

International Conference on Environmental Systems
9
- PRP and CGCS are bolted on CFRP panel, isolated by Ti washers and heaters controlled.
Each of the above mentioned bullets are now fully explained. Here below some pictures of the integrated S/C are
presented.
A. XTA and piping
The two Xenon tanks are fully covered with MLI and equipped with heaters for maintaining the temperature
level during the cold phases. The parts of the Xenon piping that are thermally controlled are covered as a baseline
with low emissivity tape. No MLI is used. Low conductivity stand-offs keep the piping at few centimeters from the
walls.
Figure IV-1 Small SGEO Satellite EPPS components
Figure IV-2 Small SGEO Satellite EPPS piping

International Conference on Environmental Systems
10
B. Thrusters
The HET assemblies are mounted as shown in Figure II-4. The HET thruster is mounted on an aluminum bracket
(i.e. HET bracket) that also carries the XFC and HIB units, as shown in Figure II-3. All these components are
mounted without thermal filler. Heaters on the HET bracket maintain the thruster above the minimum non-operating
temperature in cold cases.
The HET assembly is mounted – again without thermal filler – on the HET Bracket at 6 fixation points.
Figure IV-3 HET bracket mounting
C. PPU/ETSU
The PPU, sitting on the South Platform (P/F) Radiator, that powers the HET thrusters has a dissipation of up to
136W during thruster operation. This very large dissipation is spread over the platform radiator by means of the heat
pipe network.
The ETSU, with its small dissipation, does not need heat pipes and is cooled by conduction to the radiator and
radiation to the environment.
The ETSUs are sitting on an aluminum doubler that serves mainly to spread the heat transferred by Reaction Wheels
Heat pipes.
D. SCE
This low dissipation electronic unit is functionally associated to the PSA-PRP. It is located on the same heat
pipes as the PPUs.
E. PSA PRP
The PSA PRP are mounted to internal CFRP panels with 19 bolts for PSA-PRP. Titanium washers are used at all
bolts and there is no contact between the two units and the supporting panels. The dissipation is evacuated mainly by
radiation to the environment. No special thermal control means are needed except cold case heaters.
V. Thermal sizing cases and EPPS operation scenarios
In order to derive the thermal sizing cases the complete mission profile has been analyzed and specific
dissipation cases have been selected depending on the scenario (e.g. GTO vs GEO).
Phase Description
Pre-launch Ground operation.
LEOP From liftoff (depending on mission, the S/C may be launched in an active/passive state) up to S/C separation. Depending on mission, the S/C may be launched in an active/passive state.
GTO This phase is entered when the spacecraft is transferred from the GTO to the GEO orbit.
Orbit Relocation This phase is activated when the satellite is to be manoeuvered in its orbital position for operational reasons. Payloads are deactivated in this phase.
On-Station The On-Station phase represents the nominal phase when the satellite has reached its geo-stationary position. Payloads can only be activated in this phase.
Graveyard This phase is entered when the satellite is retired.
Table V-1 Complete mission profile summary
The EPPS works mainly after the LEOP and GTO phases.
The driving factors and the criticalities for the EPPS firing sizing cases are:

International Conference on Environmental Systems
11
HET thruster firing duration;
orbital position and season;
reaction wheels power dissipation profiles;
PPU (South side, one is very close to the reaction wheels) temperature limits;
FU temperature limits;
The most critical cases for the SGEO EPPS are in hot environment, that is to say that the HET thrusters firing
occurs when the Sun is illuminating the North (Summer Solstice) or the South (Winter Solstice) side of the
satellite.
Figure V-1 On station Sun illumination
The other driving factors are the Payload (P/L) and P/F dissipation profiles. A quick synoptic summary of the EPPS
power dissipation is provided in section III.
A. EPPS EP configuration
Figure V-2 shows the Electrical Propulsion (EP) thrusters accommodation on the satellite. The EP system
consists of two branches, which are operated in cold redundancy in the baseline:
Branch A (EP1, EP4, EP5, EP8) made of HET/ SPT-100 operated at 75 mN
Branch B (EP2, EP3, EP6, EP7) made of HET/ SPT-100 operated at 75 mN
Only branch A is supposed to fire in the simulations.
Figure V-2 EP Thrusters accommodation on the Satellite
In the baseline operational concept, only one EP thruster is operated at a time at its nominal operating point
(nominal power, thrust and specific impulse). If a manoeuver requires the use of two thrusters, it is split into two

International Conference on Environmental Systems
12
sequential manoeuvers using only one thruster each at a time. To switch from one thruster to another, a minimum
gap of 60 s shall be assumed between two sequential manoeuvers.
B. Nominal operation – Station Keeping
During station-keeping, 4 HET thrusters are typically fired in total 5 or 6 times per day (i.e. each thruster is fired
once or twice). The specified firing scenarios have been somewhat modified in order to make the implementation in
the thermal model easier. The main differences are:
• no gap between thruster switching is considered, however the specified maximum burn time for each thruster is
considered as well as the preheating of the thrusters;
• the PPU as the driving factor is powered until the temperature limit is achieved, this is estimated to be 116
minutes of continuing firing;
• the FU and XFC as the driving factors are powered until the temperature limit is achieved, this is estimated to be
63 minutes of continues firing, the total amount of 116 minutes for two adjacent firings has been assumed;
• in order to catch the worst case for the thruster, the firing manoeuver starts at the hottest point in orbit, which
might deviate from the actual node for a given sequence. Here after are the firing sequences described applicable to
the different seasonal cases.
Summer solstice
1st thruster Start time 2nd thruster
First sequence EP4 17430s EP5
Second sequence EP1 70930s EP8
Winter solstice
1st thruster Start time 2nd thruster
First sequence EP5 17830s EP4
Second sequence EP8 72130s EP1
Winter solstice: PPU combined with the hottest RW
1st thruster Start time 2nd thruster
First sequence EP5 50380s EP4
Second sequence EP8 137140s EP1
Equinox
1st thruster Start time 2nd thruster
First sequence EP8 31740s EP1
Second sequence EP5 62910s EP4
Table V-2 HET firing sequences
The firing scenarios and associated dissipation are hereafter presented for equinox (winter and solstice profiles are
identical with different firing starting points):

International Conference on Environmental Systems
13
0 6 12 18 24 30 36 42 480
50
100
150
200
250
300
Time [hrs]
Po
we
r [W
]
EP1
EP2
EP3
EP4
EP5
EP6
EP7
EP8
0 6 12 18 24 30 36 42 480
0.2
0.4
0.6
0.8
1
1.2
1.4
1.6
1.8
2
Time [hrs]
Po
we
r [W
]
FU1
FU2
FU3
FU4
FU5
FU6
FU7
FU8
0 6 12 18 24 30 36 42 480
0.2
0.4
0.6
0.8
1
1.2
1.4
1.6
1.8
2
Time [hrs]
Po
we
r [W
]
XFC1
XFC2
XFC3
XFC4
XFC5
XFC6
XFC7
XFC8
Figure V-3 Equinox – HET, FU and XFC dissipations during firing
0 6 12 18 24 30 36 42 480
20
40
60
80
100
120
140
Time [hrs]
Po
we
r [W
]
PPU 1
PPU 2
0 6 12 18 24 30 36 42 480
1
2
3
4
5
6
7
8
Time [hrs]
Po
we
r [W
]
TSU 1
TSU 2
ADE
SCE
Figure V-4 Equinox PPU, TSU, ADE and SCE dissipations during firing
C. GEO Station acquisition and repositioning
During this case, the S/C rotates slowly around its Z axis (4 rotations per day), which remains pointed to the
Earth. The HETs are firing 16 times per day, in a sequence such that the firing direction is always in the same
quadrant of the S/C, Figure V-6.
Figure V-5: Attitude during Repositioning Thruster Firing Scenario

International Conference on Environmental Systems
14
Orbit path
Flight direction
72 min firing
9 min gap
9 min gap
Spin rate around Z 1°/min
Figure V-6: Thruster Firing Scenario
Also the cases with 60 minutes firing instead of 72 has been considered. The gaps are 15 minutes each.
The firing scenarios and associated dissipation for the specific on station acquisition/repositioning case (i.e. the HET
are firing 16 times per day) is hereafter presented.
0 6 12 18 24 30 36 42 480
50
100
150
200
250
300
Time [hrs]
Po
we
r [W
]
EP1
EP2
EP3
EP4
EP5
EP6
EP7
EP8
0 6 12 18 24 30 36 42 480
0.2
0.4
0.6
0.8
1
1.2
1.4
1.6
1.8
2
Time [hrs]
Po
we
r [W
]
FU1
FU2
FU3
FU4
FU5
FU6
FU7
FU8
0 6 12 18 24 30 36 42 480
0.2
0.4
0.6
0.8
1
1.2
1.4
1.6
1.8
2
Time [hrs]
Po
we
r [W
]
XFC1
XFC2
XFC3
XFC4
XFC5
XFC6
XFC7
XFC8
Figure V-7 Winter Solstice Repositioning – HET, FU and XFC dissipations during firing
0 6 12 18 24 30 36 42 480
20
40
60
80
100
120
140
Time [hrs]
Po
we
r [W
]
PPU 1
PPU 2
0 6 12 18 24 30 36 42 480
1
2
3
4
5
6
7
8
Time [hrs]
Po
we
r [W
]
TSU 1
TSU 2
ADE
SCE
Figure V-8 Winter Solstice Repositioning – PPU, TSU, ADE and SCE dissipations during firing

International Conference on Environmental Systems
15
VI. Thermal analysis results
The main objective of the thermal analyses presented here is to demonstrate that the SGEO EPPS TCS complies
with the thermal performance requirements. These can be summarized as follows:
the TCS must maintain at all times all the parts and equipment within the applicable temperature limits, with
the applicable margins;
this must be achieved within the available resources (mass and power budget, number of heater lines, …).
The presented temperatures figures are predicted ones, that means calculated values plus (for the maximum
temperatures) and minus (for the minimum temperatures) the estimated uncertainties.
The Cold Operating (COP) and the Safe Mode (SM) are not sizing cases, that is why firing scenarios have not been
taken into account for these ones in the simulations. All the EPPS units remain within their limits in cold cases
thanks to the heating power coming from EPPS heater lines. Table VI-1 summarizes the duty cycles all over the
analysed cases:
HEATER LINES/DUTY
CYCLE [%]
EQB
OL
CO
P1
2
EQB
OL
CO
P1
EQB
OL
CO
P2
EQB
OL
CO
P3
EQB
OL
CO
P4
EQB
OL
TC7
EQEO
L TC
8
EQEO
L TC
9
SMEQ
BO
L G
12
SSB
OL
B1
SSB
OL
TC7
SSEO
L E1
SSEO
L TC
8
SSEO
L TC
9
WSB
OL
C1
WSB
OL
TC6
WSB
OL
TC7
WSE
OL
F1
WSE
OL
TC8
WSE
OL
TC9
TSU 1 60 60 58 50 50 25 23 25 29 23 23 16 10 14 0 0 0 0 0 0
TSU 2 40 40 43 35 35 17 18 18 34 15 16 10 9 9 0 0 0 0 0 0
HP PF S1 9 9 9 7 7 2 2 2 1 0 0 0 0 0 0 7 7 0 0 0
HP PF S2 100 100 100 100 100 79 74 75 100 81 81 76 74 76 0 0 0 0 0 0
HP PF N 0 0 0 0 0 0 0 0 0 0 0 0 0 0 0 0 0 0 0 0
XTA-1 38 38 38 33 33 28 31 32 36 25 25 24 25 25 13 21 21 6 17 17
XTA-2 31 33 32 31 31 24 25 27 34 15 16 8 10 13 16 21 21 17 18 20
PRP 31 31 31 30 30 19 18 20 0 12 14 4 4 5 11 17 17 4 9 11
HET EP-1 41 41 41 29 29 11 15 19 51 0 0 0 0 0 6 15 15 5 10 14
HET EP-2 35 35 35 29 29 15 19 22 75 0 0 0 0 0 14 21 22 15 18 21
HET EP-3 25 25 25 24 24 3 4 11 49 0 0 0 0 0 0 5 6 3 1 8
HET EP-4 27 27 27 26 26 7 9 16 74 0 0 0 0 0 7 12 13 13 9 15
HET EP-5 31 32 31 30 30 12 18 23 56 25 20 27 17 23 0 0 0 0 0 0
HET EP-6 29 29 29 28 28 14 19 23 81 28 23 30 22 27 0 0 0 0 0 0
HET EP-7 50 51 50 28 28 14 25 22 56 19 20 26 24 19 0 0 0 0 0 0
HET EP-8 42 42 42 29 29 15 26 22 79 23 24 30 28 24 0 0 0 0 0 0
FU-1 0 0 0 0 0 0 0 0 0 0 0 0 0 0 0 0 0 0 0 0
FU-2 0 0 0 0 0 0 0 0 0 0 0 0 0 0 0 0 0 0 0 0
FU-3 0 0 0 0 0 0 0 0 0 0 0 0 0 0 0 0 0 0 0 0
FU-4 0 0 0 0 0 0 0 0 0 0 0 0 0 0 0 0 0 0 0 0
FU-5 0 0 0 0 0 0 0 0 0 0 0 0 0 0 0 0 0 0 0 0
FU-6 0 0 0 0 0 0 0 0 0 0 0 0 0 0 0 0 0 0 0 0
FU-7 0 0 0 0 0 0 0 0 0 0 0 0 0 0 0 0 0 0 0 0
FU-8 0 0 0 0 0 0 0 0 0 0 0 0 0 0 0 0 0 0 0 0
XE SOUTH 99 99 98 92 92 75 83 82 100 70 71 70 68 67 7 42 44 0 11 10
XE EAST 86 86 86 82 82 52 55 63 90 16 23 3 5 11 36 49 51 32 38 46
XE TO FDV 7 7 7 6 6 3 2 3 0 0 0 0 0 0 0 1 1 0 0 0
XE EP-1 5 5 5 5 5 4 4 4 5 1 1 0 0 1 3 4 4 3 3 4
XE EP-2 5 5 5 5 5 4 4 4 5 0 1 0 0 1 3 3 3 3 3 3
XE EP-3 4 4 4 4 4 3 3 3 5 0 1 0 0 0 2 3 3 3 3 3
XE EP-4 3 3 3 3 3 2 2 2 4 0 0 0 0 0 1 2 2 1 1 2
XE EP-5 5 5 5 4 4 3 4 4 5 4 3 4 3 3 0 1 1 0 0 1
XE EP-6 4 4 4 4 4 3 4 4 5 3 3 4 3 3 0 1 1 0 0 1
XE EP-7 5 5 5 5 5 4 4 4 5 4 4 4 4 4 0 1 1 0 1 0
XE EP-8 12 12 12 11 11 9 10 9 13 8 8 9 9 8 0 2 3 0 1 1 Table VI-1 EPPS heater lines duty cycles
An orange cell means that the duty cycle is between 90% and saturation, while a red one means that a specific line is
in saturation. The following bar charts prove that in the cold cases all the instrumentation is compliant (no out of
specifications encountered):

International Conference on Environmental Systems
16
-50°C
-50°C
-10°C
-10°C
30°C
30°C
70°C
70°C
110°C
110°C
150°C
150°C
190°C
190°C
230°C
230°C
EPTA NW CORNER
HET EP 1 54.48-20°C2 152.95 +190°C
XFC EP 1 nom 24.5-5°C 3 61.67 +85°C
XFC EP 1 red 22.39-5°C 4 62.81 +85°C
FU EP 1 19.58-30°C 25.33 45.09 +60°C
HIB EP 1 23.34-15°C 14.74 86.92 +110°C
HET EP 2 42.26-20°C 8.6 159.12 +190°C
XFC EP 2 nom 21.51-5°C 5. 62.83 +85°C
XFC EP 2 red 21.4-5°C 5. 62.97 +85°C
FU EP 2 21.36-30°C 29.5 39.14 +60°C
HIB EP 2 22.24-15°C 15.62 87.14 +110°C
EPTA NE CORNER
HET EP 3 40.65-20°C 9.2 160.09 +190°C
XFC EP 3 nom 20.43-5°C 7. 62.26 +85°C
XFC EP 3 red 20.35-5°C 7. 62.34 +85°C
FU EP 3 14.54-30°C 31.41 44.05 +60°C
HIB EP 3 21.07-15°C 17.04 86.89 +110°C
HET EP 4 55.44-20°C1 153 +190°C
XFC EP 4 nom 22.33-5°C 6. 61.42 +85°C
XFC EP 4 red 22.24-5°C 6. 61.58 +85°C
FU EP 4 22.08-30°C 30.35 37.57 +60°C
HIB EP 4 23.1-15°C 16.03 85.87 +110°C
EPTA SE CORNER
HET EP 5 50.9-20°C 3 155.3 +190°C
XFC EP 5 nom 23.64-5°C3 62.92 +85°C
XFC EP 5 red 21.55-5°C 4 64.07 +85°C
FU EP 5 15.17-30°C 29.15 45.68 +60°C
HIB EP 5 22.45-15°C 14.56 87.99 +110°C
HET EP 6 40.39-20°C 8.8 160.8 +190°C
XFC EP 6 nom 20.53-5°C 5. 63.99 +85°C
XFC EP 6 red 20.38-5°C 5. 64.15 +85°C
FU EP 6 22.47-30°C 28.54 38.99 +60°C
HIB EP 6 21.31-15°C 15.51 88.18 +110°C
EPTA SW CORNER
HET EP 7 40.07-20°C 9.7 160.17 +190°C
XFC EP 7 nom 20.8-5°C 5. 64.19 +85°C
XFC EP 7 red 20.74-5°C 4 64.37 +85°C
FU EP 7 22.63-30°C 22.71 44.66 +60°C
HIB EP 7 21.14-15°C 15.18 88.68 +110°C
HET EP 8 57.69-20°C0 151.4 +190°C
XFC EP 8 nom 25.94-5°C2 61.25 +85°C
XFC EP 8 red 23.95-5°C 3 62.39 +85°C
FU EP 8 21.88-30°C 28.55 39.57 +60°C
HIB EP 8 24.24-15°C 13.89 86.87 +110°C
Figure VI-1 Equinox COP cases and Safe Mode min-max summary for EPTA corners
International Conference on Environmental Systems
17
-60°C
-60°C
-20°C
-20°C
20°C
20°C
60°C
60°C
100°C
100°C
Prop. Supply Assy
PRP 16.7+20°C1 +50°C
SCE 14.71-10°C2 42.86 +50°C
EPTA Electronic Units
ETSU Branch A 16.02-15°C 4. 43.99 +50°C
PPU Branch A 16.6-15°C 5. 42.63 +50°C
ETSU Branch B 16.02-15°C 4. 43.99 +50°C
PPU Branch B 14.59-15°C 6. 43.59 +50°C
Fill and Drain Valves
FDV-XTA 33.42-35°C 32.81 18.77 +50°C
FDV-PRP 33.42-35°C 32.81 18.77 +50°C
FDV-test 33.42-35°C 32.81 18.77 +50°C
Figure VI-2 Equinox COP cases and Safe Mode min-max summary for other EPPS units
-20°C
-20°C
20°C
20°C
60°C
60°C
100°C
100°C
Xenon Tanks Assy
XTA-1 10.+35°C +47°C
XTA-2 10.+35°C +47°C
Figure VI-3 Equinox COP cases and Safe Mode min-max summary for XTA
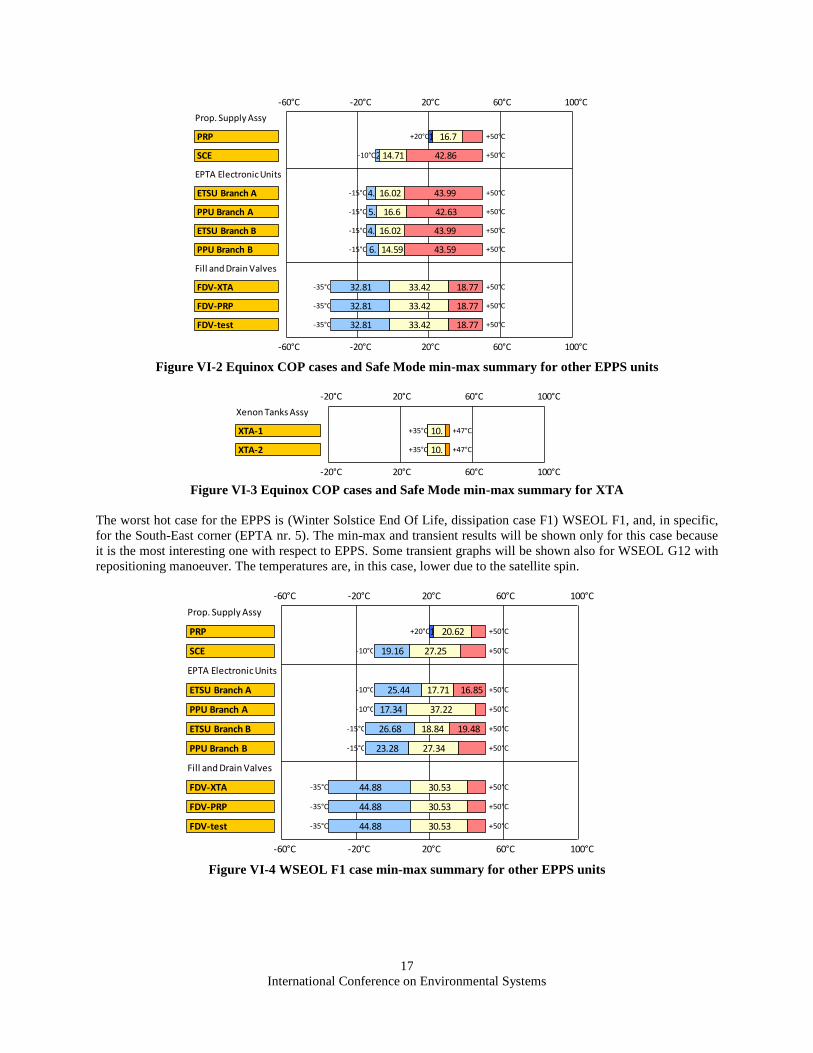
The worst hot case for the EPPS is (Winter Solstice End Of Life, dissipation case F1) WSEOL F1, and, in specific,
for the South-East corner (EPTA nr. 5). The min-max and transient results will be shown only for this case because
it is the most interesting one with respect to EPPS. Some transient graphs will be shown also for WSEOL G12 with
repositioning manoeuver. The temperatures are, in this case, lower due to the satellite spin.
-60°C
-60°C
-20°C
-20°C
20°C
20°C
60°C
60°C
100°C
100°C
Prop. Supply Assy
PRP 20.62+20°C1 +50°C
SCE 27.25-10°C 19.16 +50°C
EPTA Electronic Units
ETSU Branch A 17.71-10°C 25.44 16.85 +50°C
PPU Branch A 37.22-10°C 17.34 +50°C
ETSU Branch B 18.84-15°C 26.68 19.48 +50°C
PPU Branch B 27.34-15°C 23.28 +50°C
Fill and Drain Valves
FDV-XTA 30.53-35°C 44.88 +50°C
FDV-PRP 30.53-35°C 44.88 +50°C
FDV-test 30.53-35°C 44.88 +50°C
Figure VI-4 WSEOL F1 case min-max summary for other EPPS units

International Conference on Environmental Systems
18
-20°C
-20°C
20°C
20°C
60°C
60°C
100°C
100°C
Xenon Tanks Assy
XTA-1 10.+35°C +47°C
XTA-2 10.+35°C +47°C
Figure VI-5 WSEOL F1 case min-max summary for XTA
-50°C
-50°C
-10°C
-10°C
30°C
30°C
70°C
70°C
110°C
110°C
150°C
150°C
190°C
190°C
230°C
230°C
EPTA NW CORNER
HET EP 1 128.92-20°C0 80.56 +190°C
XFC EP 1 nom 50.68-5°C 6. 32.4 +85°C
XFC EP 1 red 42.67-5°C 8.1 39.2 +85°C
FU EP 1 23.38-15°C 26.27 25.35 +60°C
HIB EP 1 44.4-15°C 17.13 53.47 +100°C
HET EP 2 46.28-20°C 8.2 155.47 +190°C
XFC EP 2 nom 30.67-5°C 9.5 49.83 +85°C
XFC EP 2 red 30.39-5°C 9.6 49.93 +85°C
FU EP 2 17.17-30°C 46.96 25.87 +60°C
HIB EP 2 32.64-15°C 18.7 73.66 +110°C
EPTA NE CORNER
HET EP 3 43.66-20°C 7. 159.1 +190°C
XFC EP 3 nom 29.11-5°C 9.2 51.6 +85°C
XFC EP 3 red 28.93-5°C 9.4 51.63 +85°C
FU EP 3 18.46-30°C 42.63 28.91 +60°C
HIB EP 3 30.18-15°C 19.1 75.72 +110°C
HET EP 4 128.73-20°C1 80.06 +190°C
XFC EP 4 nom 48.53-5°C 9.4 31.98 +85°C
XFC EP 4 red 42.75-5°C 9.5 37.68 +85°C
FU EP 4 23.64-15°C 32.24 19.12 +60°C
HIB EP 4 43.59-15°C 18.96 52.45 +100°C
EPTA SE CORNER
HET EP 5 118.29-20°C 31.09 60.62 +190°C
XFC EP 5 nom 49.93-5°C 32.44 +85°C
XFC EP 5 red 41.33-5°C 33.77 14.9 +85°C
FU EP 5 24.48-15°C 49.66 +60°C
HIB EP 5 42.87-15°C 41.93 30.2 +100°C
HET EP 6 40.36-20°C 36.36 133.28 +190°C
XFC EP 6 nom 30.23-5°C 32.83 26.94 +85°C
XFC EP 6 red 29.95-5°C 33.07 26.98 +85°C
FU EP 6 18.63-30°C 62.11 +60°C
HIB EP 6 32.05-15°C 41.77 51.18 +110°C
EPTA SW CORNER
HET EP 7 41.2-20°C 34.27 134.53 +190°C
XFC EP 7 nom 28.75-5°C 30.58 30.67 +85°C
XFC EP 7 red 28.47-5°C 30.76 30.77 +85°C
FU EP 7 18.37-30°C 61.67 +60°C
HIB EP 7 30.14-15°C 40.03 54.83 +110°C
HET EP 8 123.48-20°C 27.62 58.9 +190°C
XFC EP 8 nom 49.38-5°C 28.81 +85°C
XFC EP 8 red 41.03-5°C 29.98 18.99 +85°C
FU EP 8 19.94-15°C 45.96 9.1 +60°C
HIB EP 8 41.63-15°C 39.38 33.99 +100°C
Figure VI-6 WSEOL F1 case min-max summary for EPTA corners

International Conference on Environmental Systems
19
For this specific case, now the transients (calculated temperatures) of the EPPS are shown:
0 6 12 18 24 30 36 42 48-20
0
20
40
60
80
100
Time [hrs]
Te
mp
era
ture
[°C
]
EP3
EP4
FU3
FU4
XFC3a
XFC3b
XFC4a
XFC4b
0 6 12 18 24 30 36 42 48-20
0
20
40
60
80
100
Time [hrs]
Te
mp
era
ture
[°C
]
EP1
EP2
FU1
FU2
XFC1a
XFC1b
XFC2a
XFC2b
0 6 12 18 24 30 36 42 4820
30
40
50
60
70
80
90
100
110
120
Time [hrs]
Te
mp
era
ture
[°C
]
EP5
EP6
FU5
FU6
XFC5a
XFC5b
XFC6a
XFC6b
0 6 12 18 24 30 36 42 480
20
40
60
80
100
120
Time [hrs]
Te
mp
era
ture
[°C
]
EP7
EP8
FU7
FU8
XFC7a
XFC7b
XFC8a
XFC8b
Figure VI-7 Case WSEOL F1 EPTA transient temperatures
0 6 12 18 24 30 36 42 4810
15
20
25
30
35
40
Time [hrs]
Te
mp
era
ture
[°C
]
PPU 1
PPU 2
0 6 12 18 24 30 36 42 4826
27
28
29
30
31
32
33
34
35
36
Time [hrs]
Te
mp
era
ture
[°C
]
PRP
CGCS
0 6 12 18 24 30 36 42 4812
14
16
18
20
22
24
26
28
30
32
Time [hrs]
Te
mp
era
ture
[°C
]
TSU
ADE
SCE
0 6 12 18 24 30 36 42 4839
39.5
40
40.5
41
41.5
Time [hrs]
Te
mp
era
ture
[°C
]
Xenon Tank 1
Xenon Tank 2
Figure VI-8 Case WSEOL F1 other EPPS components transient temperatures

International Conference on Environmental Systems
20
0 6 12 18 24 30 36 42 48-20
0
20
40
60
80
100
120
Time [hrs]
Te
mp
era
ture
[°C
]
EP3
EP4
FU3
FU4
XFC3a
XFC3b
XFC4a
XFC4b
0 6 12 18 24 30 36 42 48-20
0
20
40
60
80
100
120
Time [hrs]
Te
mp
era
ture
[°C
]
EP1
EP2
FU1
FU2
XFC1a
XFC1b
XFC2a
XFC2b
0 6 12 18 24 30 36 42 48-20
0
20
40
60
80
100
Time [hrs]
Te
mp
era
ture
[°C
]
EP5
EP6
FU5
FU6
XFC5a
XFC5b
XFC6a
XFC6b
0 6 12 18 24 30 36 42 48-20
0
20
40
60
80
100
120
Time [hrs]
Te
mp
era
ture
[°C
]
EP7
EP8
FU7
FU8
XFC7a
XFC7b
XFC8a
XFC8b
Figure VI-9 Case WSEOL G12 with repositioning manoeuver EPTA transient temperatures
0 6 12 18 24 30 36 42 48-5
0
5
10
15
20
25
30
35
Time [hrs]
Te
mp
era
ture
[°C
]
PPU 1
PPU 2
0 6 12 18 24 30 36 42 4825
26
27
28
29
30
31
32
33
34
35
Time [hrs]
Te
mp
era
ture
[°C
]
PRP
CGCS
0 6 12 18 24 30 36 42 48-5
0
5
10
15
20
25
30
Time [hrs]
Te
mp
era
ture
[°C
]
TSU
ADE
SCE
0 6 12 18 24 30 36 42 4839
39.5
40
40.5
41
41.5
Time [hrs]
Te
mp
era
ture
[°C
]
Xenon Tank 1
Xenon Tank 2
Figure VI-10 Case WSEOL G12 with repositioning manoeuver other components transient temperatures

International Conference on Environmental Systems
21
Here below a quick summary of the EPPS piping min-max temperatures is shown:
-60°C
-60°C
-20°C
-20°C
20°C
20°C
60°C
60°C
100°C
100°C
LP Xe tubing to HET
LP Xe to FDV-Test 25.08-35°C 35.66 54.25 +80°C
LP Xe to FDV-PRP 24.91-35°C 37.03 53.05 +80°C
LP Xe to FDV-XTA 22.90-35°C 35.65 56.44 +80°C
LP Xe from FDV-XTA 13.79-35°C 39.60 61.61 +80°C
LP Xe to XTA-1 #1 18.87-35°C 37.89 58.22 +80°C
LP Xe to XTA-1 #2 27.22-35°C 33.58 54.19 +80°C
LP Xe to XTA-2 #1 15.07-35°C 52.21 47.71 +80°C
LP Xe to XTA-2 #2 16.18-35°C 61.23 37.58 +80°C
LP Xe to XTA-2 #3 16.58-35°C 59.52 38.89 +80°C
LP Xe to XTA-2 #4 14.20-35°C 57.76 43.03 +80°C
LP Xe to XTA-2 #5 13.31-35°C 48.48 53.2 +80°C
LP Xe to XTA-2 #6 14.52-35°C 37.33 63.14 +80°C
LP Xe to XTA-2 #7 23.89-35°C 33.40 57.7 +80°C
LP Xe from PRP 14.33-35°C 49.42 51.25 +80°C
LP Xe to HET North 13.0-35°C 56.52 45.39 +80°C
LP Xe to HET 1-2 #1 11.9-35°C 51.87 51.14 +80°C
LP Xe to HET 1-2 #2 12.6-35°C 37.65 64.7 +80°C
LP Xe to HET 1-2 #3 13.47-35°C 35.46 66.06 +80°C
LP Xe to HET 1-2 #4 18.01-35°C 35.43 61.56 +80°C
LP Xe to HET 1 17.80-35°C 47.05 50.14 +80°C
LP Xe to HET 2 #1 21.23-35°C 44.29 49.47 +80°C
LP Xe to HET 2 #2 15.61-35°C 43.98 55.4 +80°C
LP Xe to HET 3-4 17.60-35°C 43.06 54.33 +80°C
LP Xe to HET 3 17.76-35°C 47.99 49.24 +80°C
LP Xe to HET 4 #1 20.67-35°C 39.00 55.32 +80°C
LP Xe to HET 4 #2 23.22-35°C 46.41 45.36 +80°C
LP Xe to HET South #1 15.28-35°C 62.33 37.38 +80°C
LP Xe to HET South #2 17.03-35°C 59.00 38.96 +80°C
LP Xe to HET 5-6 17.92-35°C 42.97 54.23 +80°C
LP Xe to HET 5 19.38-35°C 46.21 49.41 +80°C
LP Xe to HET 6 #1 20.98-35°C 53.08 40.92 +80°C
LP Xe to HET 6 #2 15.92-35°C 40.79 58.29 +80°C
LP Xe to HET 7-8 #1 16.75-35°C 60.03 38.21 +80°C
LP Xe to HET 7-8 #2 14.24-35°C 57.58 43.17 +80°C
LP Xe to HET 7-8 #3 11.7-35°C 55.53 47.75 +80°C
LP Xe to HET 7-8 #4 13.0-35°C 51.99 49.92 +80°C
LP Xe to HET 7-8 #5 20.79-35°C 35.42 58.78 +80°C
LP Xe to HET 7 18.17-35°C 45.55 51.28 +80°C
LP Xe to HET 8 #1 18.21-35°C 41.42 55.36 +80°C
LP Xe to HET 8 #2 24.91-35°C 43.77 46.31 +80°C
-60°C
-60°C
-20°C
-20°C
20°C
20°C
60°C
60°C
100°C
100°C
LP Xe tubing to CGTV
LP Xe from PRP 14.33-35°C 49.42 51.25 +80°C
LP Xe PRP to CGCS #1 15.28-35°C 62.33 37.38 +80°C
LP Xe PRP to CGCS #2 17.03-35°C 59.00 38.96 +80°C
LP Xe PRP to CGCS #3 16.75-35°C 60.03 38.21 +80°C
LP Xe PRP to CGCS #4 14.24-35°C 57.58 43.17 +80°C
LP Xe PRP to CGCS #5 13.55-35°C 57.22 44.23 +80°C
LP Xe to CGCS #1 14.04-35°C 38.56 62.39 +80°C
LP Xe to CGCS #2 16.39-35°C 40.51 58.09 +80°C
LP Xe from CGCS #1 26.93-35°C 38.25 49.81 +80°C
LP Xe from CGCS #2 35.09-35°C 29.76 50.14 +80°C
LP Xe from CGCS #3 33.34-35°C 31.39 50.26 +80°C
LP Xe to CGTV 31.19-35°C 32.07 51.74 +80°C
LP Xe to CGTV 31.71-35°C 28.70 54.58 +80°C
LP Xe to CGTV-1 #1 28.92-35°C 27.63 58.45 +80°C
LP Xe to CGTV-1 #2 28.51-35°C 27.06 59.42 +80°C
LP Xe to CGTV-1 #3 30.53-35°C 27.91 56.54 +80°C
LP Xe to CGTV-1 #4 27.22-35°C 56.78 30.99 +80°C
LP Xe to CGTV-2 #1 32.95-35°C 29.06 52.98 +80°C
LP Xe to CGTV-2 #2 31.77-35°C 69.26 +80°C
LP Xe to CGTV 24.76-35°C 33.24 56.99 +80°C
LP Xe to CGTV-3 #1 26.48-35°C 33.01 55.5 +80°C
LP Xe to CGTV-3 #2 27.22-35°C 65.08 22.69 +80°C
LP Xe to CGTV-4 #1 27.67-35°C 31.39 55.94 +80°C
LP Xe to CGTV-4 #2 24.74-35°C 32.09 58.15 +80°C
LP Xe to CGTV-4 #3 24.17-35°C 32.00 58.82 +80°C
LP Xe to CGTV-4 #4 25.94-35°C 31.81 57.23 +80°C
LP Xe to CGTV-4 #5 22.91-35°C 33.26 58.82 +80°C
LP Xe to CGTV-4 #6 27.90-35°C 59.86 27.23 +80°C
Figure VI-11 Equinox COP cases and Safe Mode min-max summary for EPPS piping
-20°C
-20°C
20°C
20°C
60°C
60°C
100°C
100°C
HP Xe tubing
HP Xe from XTA-1 10.6+20°C 6 +50°C
HP Xe from XTA-2 #1 11.7+20°C1 16.58 +50°C
HP Xe from XTA-2 #2 12.5+20°C0 16.88 +50°C
HP Xe from XTA-2 #3 13.49+20°C2 +50°C
HP Xe from XTA-2 #4 15.10+20°C3 +50°C
HP Xe from XTA-2 #5 16.53+20°C3 +50°C
HP Xe from XTA-2 #6 16.07+20°C 6. +50°C
HP Xe from XTA-2 #7 14.39+20°C 4 +50°C
HP Xe from XTA-2 #8 11.7+20°C3 14.76 +50°C
HP Xe to PRP 15.15+20°C 8.1 +50°C

International Conference on Environmental Systems
22
-60°C
-60°C
-20°C
-20°C
20°C
20°C
60°C
60°C
100°C
100°C
LP Xe tubing to HET
LP Xe to FDV-Test 27.02-35°C 45.11 42.86 +80°C
LP Xe to FDV-PRP 24.05-35°C 47.77 43.16 +80°C
LP Xe to FDV-XTA 20.80-35°C 47.73 46.46 +80°C
LP Xe from FDV-XTA 11.8-35°C 54.43 48.7 +80°C
LP Xe to XTA-1 #1 17.36-35°C 58.47 39.16 +80°C
LP Xe to XTA-1 #2 23.51-35°C 55.83 35.65 +80°C
LP Xe to XTA-2 #1 14.62-35°C 64.29 36.09 +80°C
LP Xe to XTA-2 #2 14.83-35°C 67.17 33 +80°C
LP Xe to XTA-2 #3 12.8-35°C 69.53 32.57 +80°C
LP Xe to XTA-2 #4 10.4-35°C 70.30 34.22 +80°C
LP Xe to XTA-2 #5 11.6-35°C 68.21 35.16 +80°C
LP Xe to XTA-2 #6 11.6-35°C 64.82 38.49 +80°C
LP Xe to XTA-2 #7 18.06-35°C 61.48 35.45 +80°C
LP Xe from PRP 14.23-35°C 61.15 39.61 +80°C
LP Xe to HET North 13.2-35°C 62.10 39.69 +80°C
LP Xe to HET 1-2 #1 11.6-35°C 56.03 47.33 +80°C
LP Xe to HET 1-2 #2 10-35°C 51.19 53.54 +80°C
LP Xe to HET 1-2 #3 11.3-35°C 50.62 52.98 +80°C
LP Xe to HET 1-2 #4 21.19-35°C 46.50 47.3 +80°C
LP Xe to HET 1 22.71-35°C 51.09 41.19 +80°C
LP Xe to HET 2 #1 27.01-35°C 47.25 40.72 +80°C
LP Xe to HET 2 #2 18.65-35°C 50.00 46.34 +80°C
LP Xe to HET 3-4 21.70-35°C 47.65 45.64 +80°C
LP Xe to HET 3 20.42-35°C 51.47 43.1 +80°C
LP Xe to HET 4 #1 33.37-35°C 42.44 39.21 +80°C
LP Xe to HET 4 #2 37.43-35°C 49.31 28.26 +80°C
LP Xe to HET South #1 14.28-35°C 68.06 32.65 +80°C
LP Xe to HET South #2 15.48-35°C 66.61 32.89 +80°C
LP Xe to HET 5-6 24.82-35°C 66.83 23.34 +80°C
LP Xe to HET 5 29.14-35°C 67.87 17.98 +80°C
LP Xe to HET 6 #1 29.35-35°C 65.68 19.96 +80°C
LP Xe to HET 6 #2 23.98-35°C 67.83 23.18 +80°C
LP Xe to HET 7-8 #1 12.6-35°C 69.74 32.61 +80°C
LP Xe to HET 7-8 #2 10-35°C 70.39 34.16 +80°C
LP Xe to HET 7-8 #3 12.4-35°C 64.72 37.85 +80°C
LP Xe to HET 7-8 #4 14.58-35°C 64.64 35.76 +80°C
LP Xe to HET 7-8 #5 25.12-35°C 61.73 28.14 +80°C
LP Xe to HET 7 24.07-35°C 63.29 27.63 +80°C
LP Xe to HET 8 #1 31.77-35°C 61.35 21.88 +80°C
LP Xe to HET 8 #2 45.63-35°C 58.662 +80°C
-60°C
-60°C
-20°C
-20°C
20°C
20°C
60°C
60°C
100°C
100°C
LP Xe tubing to CGTV
LP Xe from PRP 14.23-35°C 61.15 39.61 +80°C
LP Xe PRP to CGCS #1 14.28-35°C 68.06 32.65 +80°C
LP Xe PRP to CGCS #2 15.48-35°C 66.61 32.89 +80°C
LP Xe PRP to CGCS #3 12.6-35°C 69.74 32.61 +80°C
LP Xe PRP to CGCS #4 10-35°C 70.39 34.16 +80°C
LP Xe PRP to CGCS #5 11.1-35°C 69.41 34.49 +80°C
LP Xe to CGCS #1 12.7-35°C 65.82 36.38 +80°C
LP Xe to CGCS #2 15.78-35°C 60.39 38.81 +80°C
LP Xe from CGCS #1 28.34-35°C 49.19 37.46 +80°C
LP Xe from CGCS #2 35.80-35°C 43.69 35.51 +80°C
LP Xe from CGCS #3 34.40-35°C 44.55 36.04 +80°C
LP Xe to CGTV 32.45-35°C 46.74 35.8 +80°C
LP Xe to CGTV 31.44-35°C 47.63 35.92 +80°C
LP Xe to CGTV-1 #1 27.91-35°C 49.48 37.6 +80°C
LP Xe to CGTV-1 #2 26.17-35°C 50.72 38.1 +80°C
LP Xe to CGTV-1 #3 26.89-35°C 51.35 36.75 +80°C
LP Xe to CGTV-1 #4 27.32-35°C 67.64 20.03 +80°C
LP Xe to CGTV-2 #1 33.00-35°C 47.00 35 +80°C
LP Xe to CGTV-2 #2 30.01-35°C 75.33 +80°C
LP Xe to CGTV 24.89-35°C 46.82 43.28 +80°C
LP Xe to CGTV-3 #1 24.41-35°C 43.26 47.32 +80°C
LP Xe to CGTV-3 #2 26.37-35°C 67.55 21.07 +80°C
LP Xe to CGTV-4 #1 25.99-35°C 42.60 46.41 +80°C
LP Xe to CGTV-4 #2 22.26-35°C 43.46 49.27 +80°C
LP Xe to CGTV-4 #3 19.82-35°C 43.66 51.51 +80°C
LP Xe to CGTV-4 #4 22.06-35°C 43.30 49.62 +80°C
LP Xe to CGTV-4 #5 20.06-35°C 43.19 51.73 +80°C
LP Xe to CGTV-4 #6 26.55-35°C 63.63 24.81 +80°C
Figure VI-12 WSEOL F1 min-max summary for EPPS piping
VII. Lessons learnt
A. FU recovery
A major difficulty for the thermal control system is the cooling of the Filter Unit which is attached at the same
common bracket of the HET thruster. During the station keeping manoeuvers, which last up to 60 minutes, a part of
the dissipated heat of the thruster is evacuated through the bracket and into the radiator. The entire bracket increases
in temperature which results in too high interface temperatures for the FU.
-20°C
-20°C
20°C
20°C
60°C
60°C
100°C
100°C
HP Xe tubing
HP Xe from XTA-1 10.6+20°C 6. +50°C
HP Xe from XTA-2 #1 13.2+20°C 9.8 +50°C
HP Xe from XTA-2 #2 12.8+20°C 11.5 +50°C
HP Xe from XTA-2 #3 10.8+20°C 14.71 +50°C
HP Xe from XTA-2 #4 10.7+20°C 15.46 +50°C
HP Xe from XTA-2 #5 13.69+20°C 14.01 +50°C
HP Xe from XTA-2 #6 14.67+20°C 12.1 +50°C
HP Xe from XTA-2 #7 13.97+20°C 11.1 +50°C
HP Xe from XTA-2 #8 11.9+20°C 4 +50°C
HP Xe to PRP 15.40+20°C 5. +50°C
International Conference on Environmental Systems
23
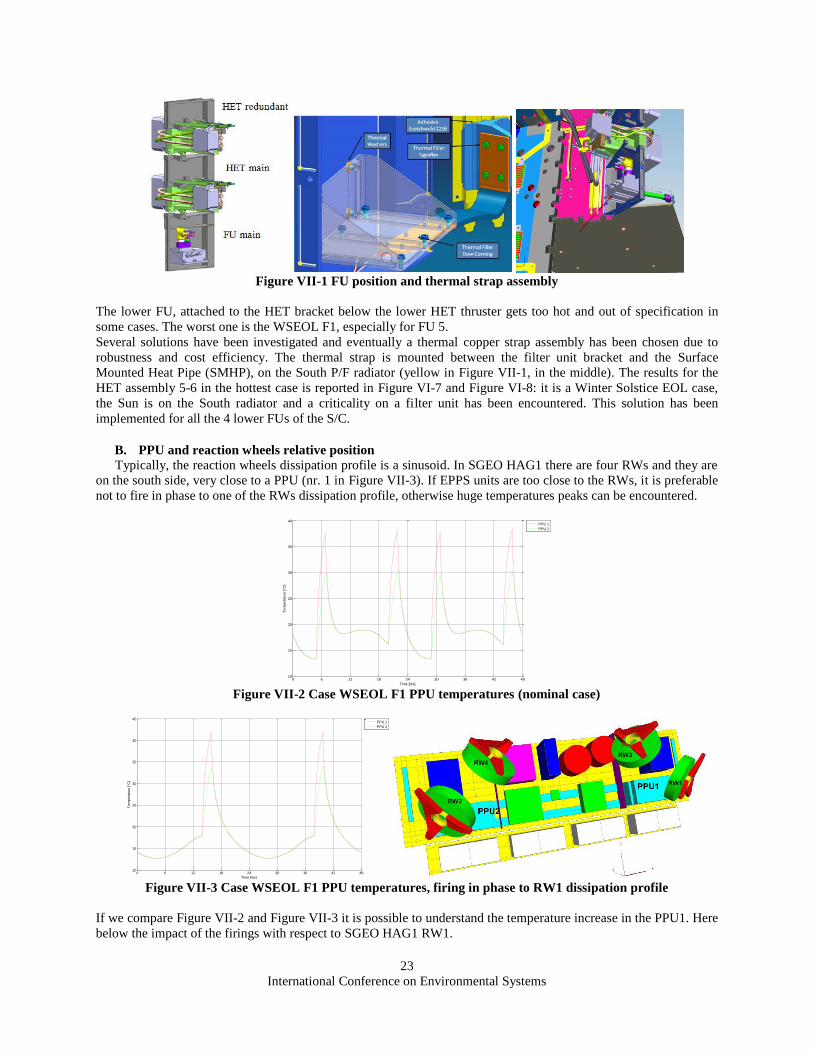
Figure VII-1 FU position and thermal strap assembly
The lower FU, attached to the HET bracket below the lower HET thruster gets too hot and out of specification in
some cases. The worst one is the WSEOL F1, especially for FU 5.
Several solutions have been investigated and eventually a thermal copper strap assembly has been chosen due to
robustness and cost efficiency. The thermal strap is mounted between the filter unit bracket and the Surface
Mounted Heat Pipe (SMHP), on the South P/F radiator (yellow in Figure VII-1, in the middle). The results for the
HET assembly 5-6 in the hottest case is reported in Figure VI-7 and Figure VI-8: it is a Winter Solstice EOL case,
the Sun is on the South radiator and a criticality on a filter unit has been encountered. This solution has been
implemented for all the 4 lower FUs of the S/C.
B. PPU and reaction wheels relative position
Typically, the reaction wheels dissipation profile is a sinusoid. In SGEO HAG1 there are four RWs and they are
on the south side, very close to a PPU (nr. 1 in Figure VII-3). If EPPS units are too close to the RWs, it is preferable
not to fire in phase to one of the RWs dissipation profile, otherwise huge temperatures peaks can be encountered.
0 6 12 18 24 30 36 42 4810
15
20
25
30
35
40
Time [hrs]
Te
mp
era
ture
[°C
]
PPU 1
PPU 2
Figure VII-2 Case WSEOL F1 PPU temperatures (nominal case)
0 6 12 18 24 30 36 42 4810
15
20
25
30
35
40
45
Time [hrs]
Te
mp
era
ture
[°C
]
PPU 1
PPU 2
Figure VII-3 Case WSEOL F1 PPU temperatures, firing in phase to RW1 dissipation profile
If we compare Figure VII-2 and Figure VII-3 it is possible to understand the temperature increase in the PPU1. Here
below the impact of the firings with respect to SGEO HAG1 RW1.

International Conference on Environmental Systems
24
0 6 12 18 24 30 36 42 480
5
10
15
20
25
30
35
40
45
50
Time [hrs]
Te
mp
era
ture
[°C
]
RW1 nom
RW1 PPURW
Firing nom
Firing PPURW
Figure VII-4 Case WSEOL F1 RW1 temperatures comparison
C. EPPS piping thermistor bracket
For the heater lines Xenon South and East the presence of the bracket is represented by an arithmetic node per
each thermistor. So, an additional link has been implemented between the thermistor and the piping, as shown in the
next picture.
Figure VII-5 Piping thermistor bracket
Even if no considerable changes have been detected after the implementation of the thermistor support bracket, in
terms of temperature or heater duty cycle variations, it is preferable to keep the implementation in order to avoid
errors in detecting the temperature in a wrong location.
D. OSR degradation due to EPPS
The HET thrusters firings cause a degradation in the radiators performance. It has been calculated the thickness of
the layer deposited on the Optical Solar Reflector (OSR) due to the back sputtering of the solar panels eroded
materials. Two thrusters causing the highest deposition rates and placed at adjacent corners of the OSR have been
considered. The OSR performance degradation is translated in the increase of the absorptivity α when the thickness
of the deposited layer grows. At system level, the degradation of the OSR performance has been considered using
0.31 for α coefficient in a semicircle of 1 m in radius centered at the thrusters location. The OSR degradation is
therefore modeled with margin in the system thermal analysis. The darker zones in the next picture near the HET
closure bracket are due to the effect of the HET thruster firing contamination. This phenomenon is considered only
in EOL. The OSR degradation is simulated considering an absorptivity of 0.31 instead of 0.26.

International Conference on Environmental Systems
25
Figure VII-6 OSR thermo-optical properties degradation
This degradation causes an increment of the solar absorbed flux and, consequently, of the internal components
temperatures, anyway, within the allowable limits of the units themselves.
E. HET thrusters piping heater lines
On each corner of the S/C the bracket hosts two thrusters, one belonging to the main branch and the second one
to the redundant. Each thruster piping final segment is controlled by independent lines, instead of by a single one, in
order to avoid over-temperatures on the non-operative branch.
VIII. Conclusions
SGEO HAG1 is a pioneer for his class. It is not the first time that a telecom S/C hosts three different propulsive
systems, but, for sure, it is the first time that a telecom satellite has this small size. So the difficult task of the TCS is
to make them coexist also in a smaller space. Anyway, SGEO HAG1 EPPS TCS design works properly, according
to the simulations. Specified operating temperatures are met for units in all the design cases resulting in comfortable
positive margins. All the discussed recovery actions have been implemented successfully. Further, temperatures
experienced by the units in the repositioning cases does not pose any limitation in the use of the sub-system.
Acknowledgments
The authors want to acknowledge the entire thermal department of CGS, which supported the analysis and
documentation execution, the OHB System one and the whole SGEO team. A sincere acknowledgment goes also to
Philippe Delouard and his team of RUAG S.


![A GEO-LEO Hybrid Architecture Design of Satellite Internet 2018... · 2018. 11. 22. · 2.1 GEO Broadband Satellite Communication System . 2.1.1 IPSTAR [1] IPSTAR is the world's largest](https://img.pdfslide.us/doc/110x75/6114743666d49b55053b0b61/a-geo-leo-hybrid-architecture-design-of-satellite-internet-2018-2018-11-22.jpg)