Embed Size (px)
Citation preview
© Copyright 2015, Zacks Investment Research. All Rights Reserved.
LED Medical Diagnostics (V.LMD)
Current Recommendation Buy
Prior Recommendation N/A
Date of Last Change 01/20/2014
Current Price (07/09/2015) $0.25
Target Price $2.00
OUTLOOK
SUMMARY DATA
Risk Level N/A
Type of Stock Large-Growth
Industry Med/Dental-Supp
LED Medical's VELscope is the world's leading device used for oral cancer screening with 13k units sold and 25 million scans done since the 2006 launch. Demand is fueled by a quantity of clinical data and recommendations from influential sources supporting use of the device as well as increased awareness of the dangers of oral cancer. Despite their leading position, the market remains barely penetrated, offering significant upside opportunity.
LED recently revamped its sales strategy to one with multiple distributors and complemented by a direct sales force. This is expected to further expand their footprint, drive utilization and increase profitability. LED is also now highly focused on bringing new products to market, specifically in the dental imaging market. These products have already begun to make a major contribution to revenue and are expected to be a significant driver of growth for the foreseeable future.
52-Week High $0.53
52-Week Low $0.19
One-Year Return (%) -31
Beta N/A
Average Daily Volume (sh) 90,574
Shares Outstanding (mil) 100
Market Capitalization ($mil) 25
Short Interest Ratio (days) N/A
Institutional Ownership (%) N/A
Insider Ownership (%) N/A
Annual Cash Dividend N/A
Dividend Yield (%) N/A
5-Yr. Historical Growth Rates
Sales (%) N/A
Earnings Per Share (%) N/A
Dividend (%) N/A
P/E using TTM EPS N/A
P/E using 2015 Estimate N/A
P/E using 2016 Estimate N/A
Zacks Rank N/A
ZACKS ESTIMATES
Revenue (in '000)
Q1 Q2 Q3 Q4 Year (Mar) (Jun) (Sep) (Dec) (Dec)
2014
$1055 A $1590 A $1629 A $4688 A $8962 A 2015
$2443 A $3083 E $3083 E $6698 E $15313 E 2016
$26499 E 2017
$35617 E Earnings per Share
Q1 Q2 Q3 Q4 Year (Mar) (Jun) (Sep) (Dec) (Dec)
2014
-$0.04 A $0.00 A -$0.03 A -$0.01 A -$0.08 A 2015
-$0.02 A -$0.02 E -$0.01 E -$0.01 E -$0.05 E 2016
-$0.02 E 2017
-$0.01 E
Zacks Projected EPS Growth Rate - Next 5 Years % N/A
Small-Cap Research
scr.zacks.com
10 S. Riverside Plaza, Ste 1600, Chicago, IL 60606
July 9, 2015
Brian Marckx, CFA [email protected]
Ph (312) 265-9474
V.LMD: Q2 Revenue Preannouncement, FY Guidance Reaffirmed
Zacks Investment Research Page 2 scr.zacks.com
Q2 2015 Revenue Preannouncement, FY Revenue Guidance Reaffirmed
Yesterday (7/8/2015) LED announced preliminary revenue guidance of $3M - $3.3M for the second quarter ending June 30th, which was well ahead of our $2.7M estimate (which we have since adjusted to $3.1M). This would represent 89% - 108% growth from Q2 2014. And importantly, management continues to guide to full-year 2015 revenue of $15M - $16M, implying yoy growth of between 67% and 79%. We continue to look for 2015 revenue to come in near the lower end of that guidance, modeling $15.3M in sales for the full year.
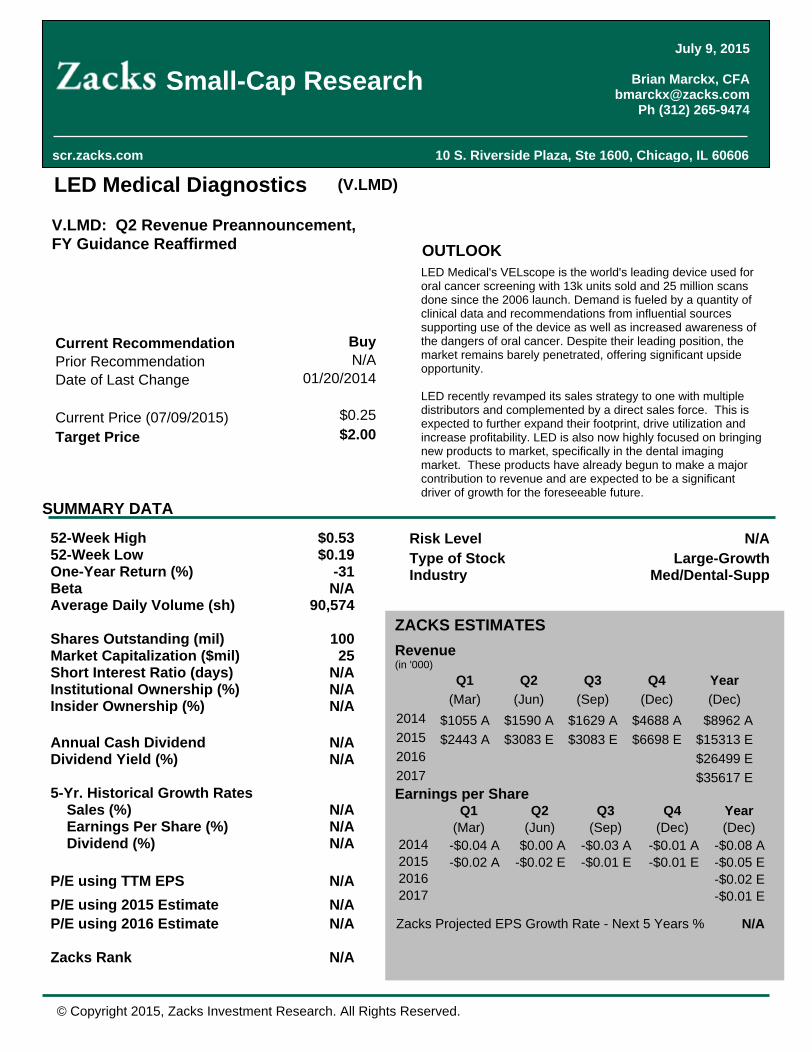
Other recent operational highlights include another addition to LED's growing digital imaging product portfolio and integration capability of VELscope with Apple iPOD touch. In mid-June the company announced that they will begin distribution of 3Shape's 3D intraoral digital impression and desktop scanner to the orthodontic market. The TRIOS 3 digital impressioning system further beefs up the company's burgeoning digital imaging product portfolio and provides more headway towards exploiting the high potential opportunity in the orthodontics space which has seen growing demand for higher quality imaging.
3Shape Trios Scanner and sample images
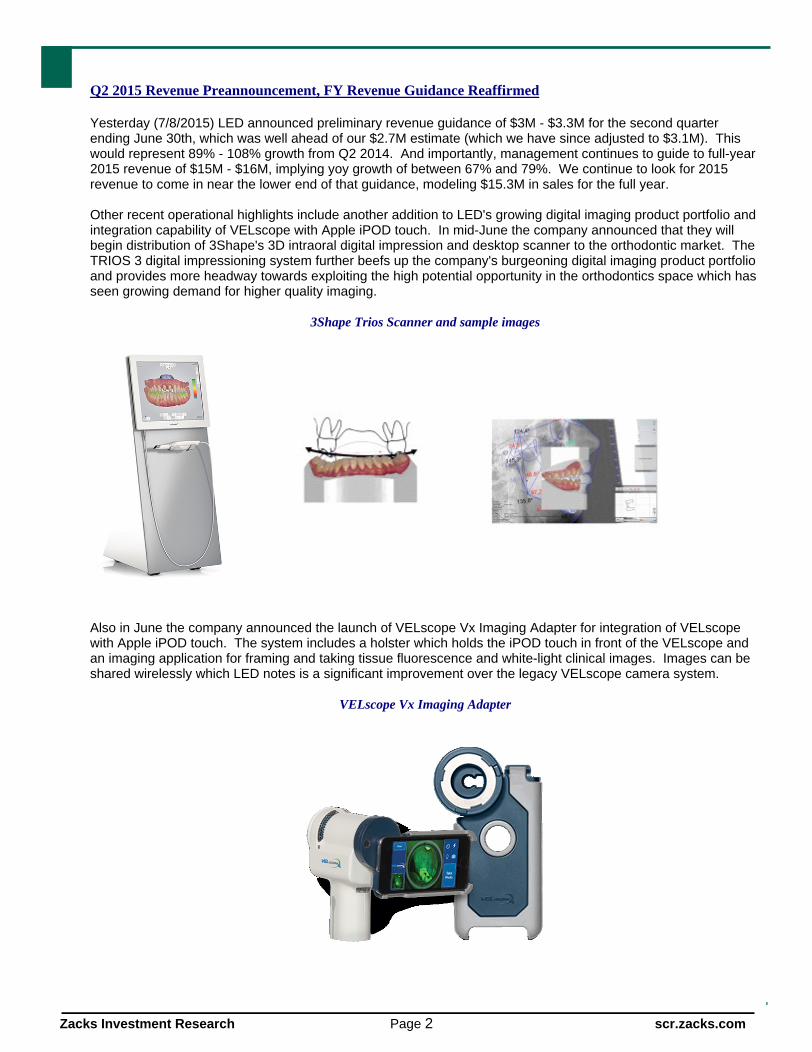
Also in June the company announced the launch of VELscope Vx Imaging Adapter for integration of VELscope with Apple iPOD touch. The system includes a holster which holds the iPOD touch in front of the VELscope and an imaging application for framing and taking tissue fluorescence and white-light clinical images. Images can be shared wirelessly which LED notes is a significant improvement over the legacy VELscope camera system.
VELscope Vx Imaging Adapter
Zacks Investment Research Page 3 scr.zacks.com
Operational Progress Continues . Per our recent updates, on the operational front LED continues to be aggressive in exploring opportunities to grow both the VELscope and dental imaging business lines and has recently made more progress in both areas.
Relative to recent activity at LED Dental, the digital imaging business, the company launched their latest product, 3Shape Trios Scanner. They also recently entered into a potentially significant partnership with OrthoSynetics which puts them in front of 350 or more orthodontic practices that utilize OrthoSynetics for administrative and other support services. This deal, which provides OrthoSynetics clients with preferred pricing of LED s dental imaging products, could have the effect of further steepening the revenue curve but, perhaps just as important, providing greater awareness and validation of Ray Co s product line and result in even broader industry-wide adoption of their products over the long-term.
And relative to VELscope, LED has recently begun looking at more outside-of-the-box ways to expand adoption and the user base. This has most recently included partnering with the Oral Cancer Foundation in that organization s recent initiative to promote more oral cancer screening. Under this relationship, LED will provide a VELscope free of charge to dental practices that agree to perform at least three daily oral screenings over three years. While LED will provide the instrument at no cost, they will charge the practices for the single-use consumable (i.e. disposable caps), which is where most of the margin is. And the recent launch of the VELscope Vx Imaging Adapter and imaging application provides enhanced and more user-friendly utility which could further support increased adoption of the instrument.
LED also recently partnered with London Drugs, a pharmacy chain in Canada, in a 3-day pilot program held last week whereby London Drug customers were offered free oral cancer screenings with VELscope by dentists at twelve of the pharmacy locations. Depending on the success of the pilot program, LED and London Drugs will consider rolling it out further which would be offered at little or no cost. And while if expanded it will likely not be a financial contributor to LED, it has the potential to increase awareness and possibly drive further adoption at the dental practice level.
While these types of non-traditional marketing initiatives may not result in immediate ROI, they have the potential to broaden the user base over the long-term. And a larger user base is particularly valuable to a company like LED that uses a razor/razor blade revenue model in their VELscope segment which affords the potential for revenue and profitability to exponentially improve with just incremental growth in the installed base. LED Returns to Growth Via Exploiting Changes in Dental Imaging Market, Reviving VELscope
As we have highlighted in our ongoing coverage of LED, the company's recent shift strategy aimed at reviving revenue and earnings growth includes a beefing up of their product portfolio. New additions to LED's leadership including CEO Dr. David Gane and Lamar Roberts (President of the newly formed LED Dental division) came from high level positions with major dental imaging and dental technology companies.
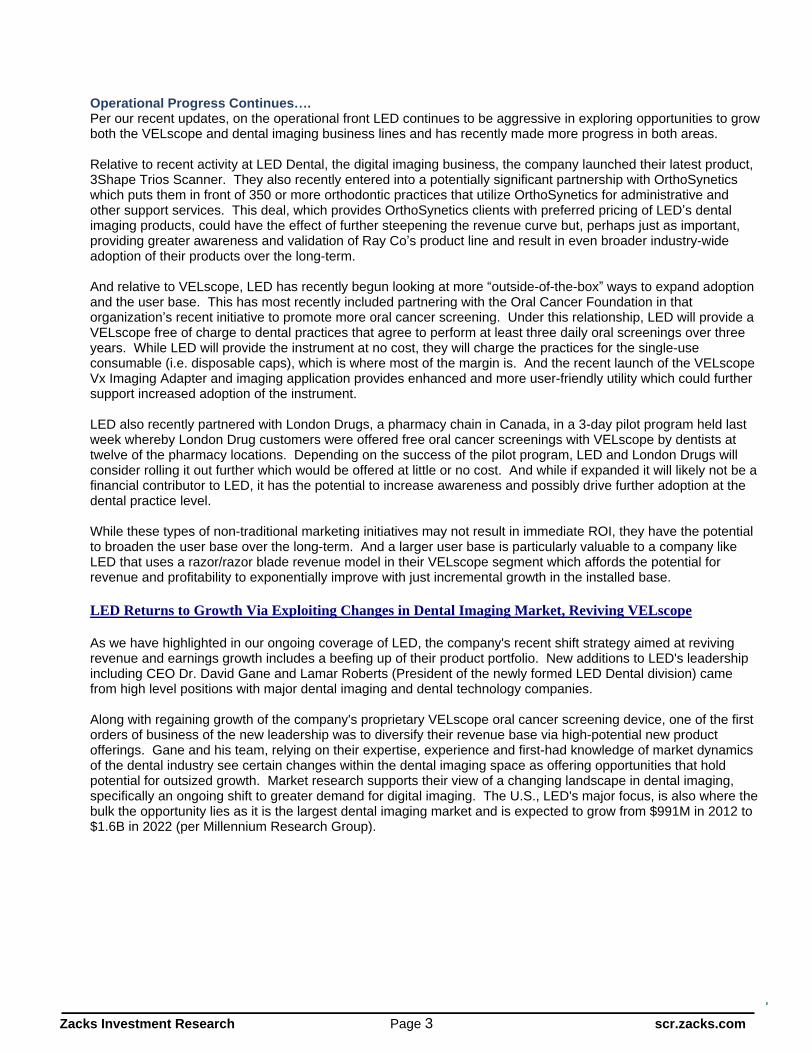
Along with regaining growth of the company's proprietary VELscope oral cancer screening device, one of the first orders of business of the new leadership was to diversify their revenue base via high-potential new product offerings. Gane and his team, relying on their expertise, experience and first-had knowledge of market dynamics of the dental industry see certain changes within the dental imaging space as offering opportunities that hold potential for outsized growth. Market research supports their view of a changing landscape in dental imaging, specifically an ongoing shift to greater demand for digital imaging. The U.S., LED's major focus, is also where the bulk the opportunity lies as it is the largest dental imaging market and is expected to grow from $991M in 2012 to $1.6B in 2022 (per Millennium Research Group).
Zacks Investment Research Page 4 scr.zacks.com
During 2014 the company formed a new operating subsidiary, LED Imaging, which is charged with exploiting these changes, specifically growth of dental digital imaging. These growth opportunities include the rapid adoption of 3D imaging, the ongoing switch from film to digital imaging methods and the increasing use of advanced software for design and manufacturing of dental restorations.
CBCT Fastest Growing Dental Imaging Modality, LED Riding the Wave
Cone beam computed tomography, or CBCT, are extraoral (i.e. - outside the mouth) scanners which rotate around the head during an exam, providing a 3600 view and with 3D images. Extraoral imaging is used to examine both the teeth and bones of the face and jaw, largely for the purposes of implantology (i.e. - assessment and planning of dental implants) and orthodontics. CBCT's ability to provide 3D images is viewed as a significant advantage to the 2D images provided by conventional extraoral imaging modalities. Unlike 2D X-rays, 3D imaging provides the benefit of viewing adjacent and anomalous structures which provides better accuracy and allows for improved visualization and treatment planning, particularly for more complex diagnoses.
A paper published in the October 2010 issue of The Journal of The American Dental Association titled Practical Applications of Cone-Beam Computed Tomography in Orthodontics1 cites several advantages of CBTC over conventional 2D imaging in orthodontics which provide for improved diagnosis and planning. And relative to utility in implantology, in June 2012 the American Academy of Oral and Maxillofacial Radiology updated their guidelines for dental implant imaging, recommending CBCT as the preferred method for presurgical assessment of dental implant sites.
In September 2013 Millennium Research Group published a research study on dental imaging industry trends titled Global Markets for Dental Imaging Systems 2014. The authors expect growth in the dental implant market and increasing demand for higher quality images will drive future sales of CBCT systems, which they predict will expand at a CAGR of approximately 15% globally and 16% in the U.S. over the ten year period of 2012 - 2022. The report further notes that CBCT is the fastest growing segment in dental imaging and is expected to continue to be so as dental professionals
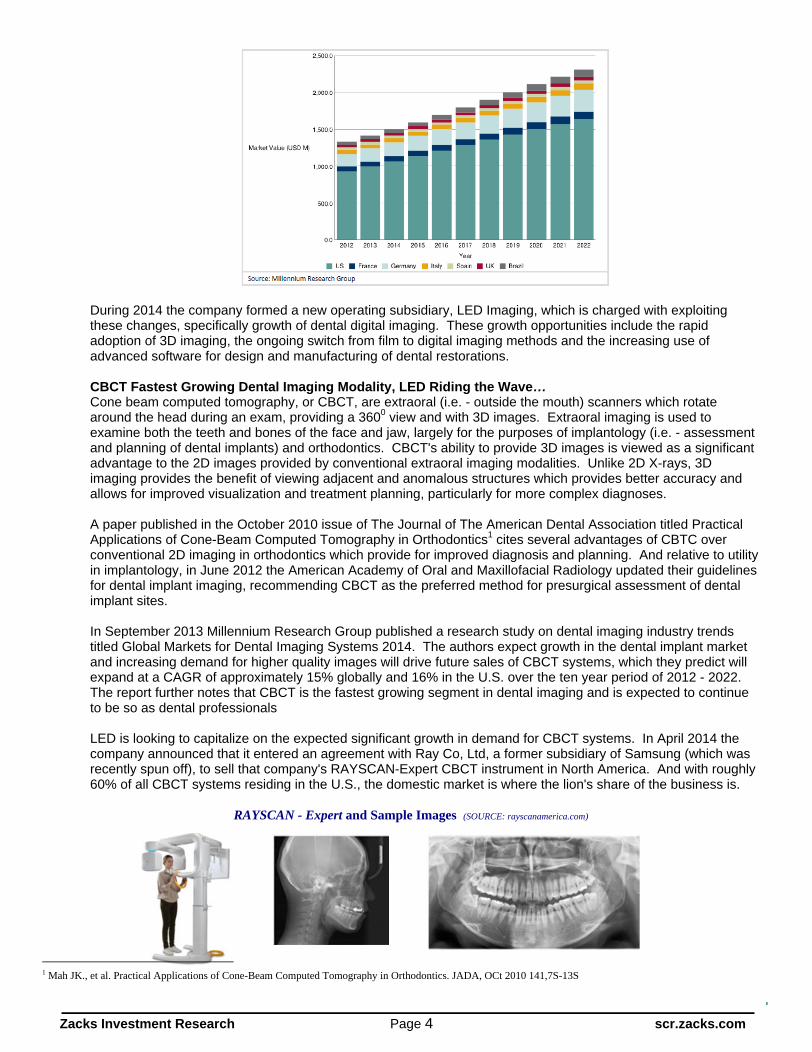
LED is looking to capitalize on the expected significant growth in demand for CBCT systems. In April 2014 the company announced that it entered an agreement with Ray Co, Ltd, a former subsidiary of Samsung (which was recently spun off), to sell that company's RAYSCAN-Expert CBCT instrument in North America. And with roughly 60% of all CBCT systems residing in the U.S., the domestic market is where the lion's share of the business is.
RAYSCAN - Expert and Sample Images (SOURCE: rayscanamerica.com)
1 Mah JK., et al. Practical Applications of Cone-Beam Computed Tomography in Orthodontics. JADA, OCt 2010 141,7S-13S
Zacks Investment Research Page 5 scr.zacks.com
Film-Based Imaging Being Replaced By Digital Imaging
According to the 2013 Millennium Research Group report the global market for dental imaging will grow from $1.4B in 2012 to $2.3B in 2022, a CAGR of 5.5% which will be driven in part by the transition of film-based to digital-based imaging. Other factors also expected to facilitate this growth are greater demand for technologies that can increase patient flow (which also relates to the switch from film to digital imaging) as well as growing popularity of cosmetic dentistry procedures, such as veneers and orthodontics.
Intraoral imaging is used for the detection of cavities, to look at the roots of the tooth and to evaluate the health of area around tooth. There are two types of digital intraoral imaging systems; photostimulable phosphor plate systems (PSP plate systems) and digital X-ray sensors. PSP plate systems are indirect and involves a small plate (that is used in place of film) that is inserted into the mouth and then removed and digitally scanned. Digital sensors are direct, meaning that the sensor sends the data directly to a computer. PSP plate systems are more economical in terms of upfront costs but have disadvantages to digital sensors including that while sensors provide immediate results, scanning time with PSP plate systems can take up to two minutes.
Millennium Research expects film based modalities to be replaced by digital systems and for PSP plate systems to increase at a CAGR of about 2.6% in the U.S. over the next ten years. However, as practitioners are increasingly demanding improved workflow and patient throughput, the minutes lost waiting for scanning via PSP will drive even greater interest in digital X-ray sensors. Another advantage of digital X-ray sensors is their easy integration with electronic medical record systems. Millennium expects these advantages to push the U.S. digital X-ray sensor market up at a CAGR of about 4.4% over the next ten years.
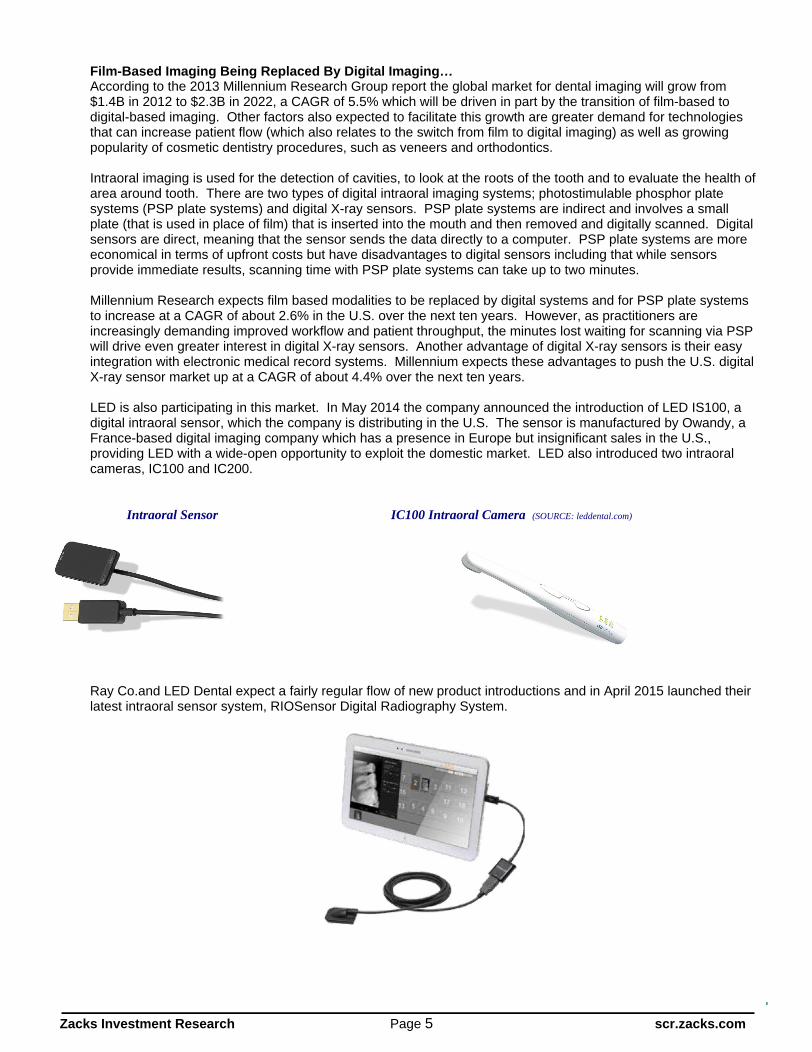
LED is also participating in this market. In May 2014 the company announced the introduction of LED IS100, a digital intraoral sensor, which the company is distributing in the U.S. The sensor is manufactured by Owandy, a France-based digital imaging company which has a presence in Europe but insignificant sales in the U.S., providing LED with a wide-open opportunity to exploit the domestic market. LED also introduced two intraoral cameras, IC100 and IC200.
Intraoral Sensor IC100 Intraoral Camera (SOURCE: leddental.com)
Ray Co.and LED Dental expect a fairly regular flow of new product introductions and in April 2015 launched their latest intraoral sensor system, RIOSensor Digital Radiography System.
Zacks Investment Research Page 6 scr.zacks.com
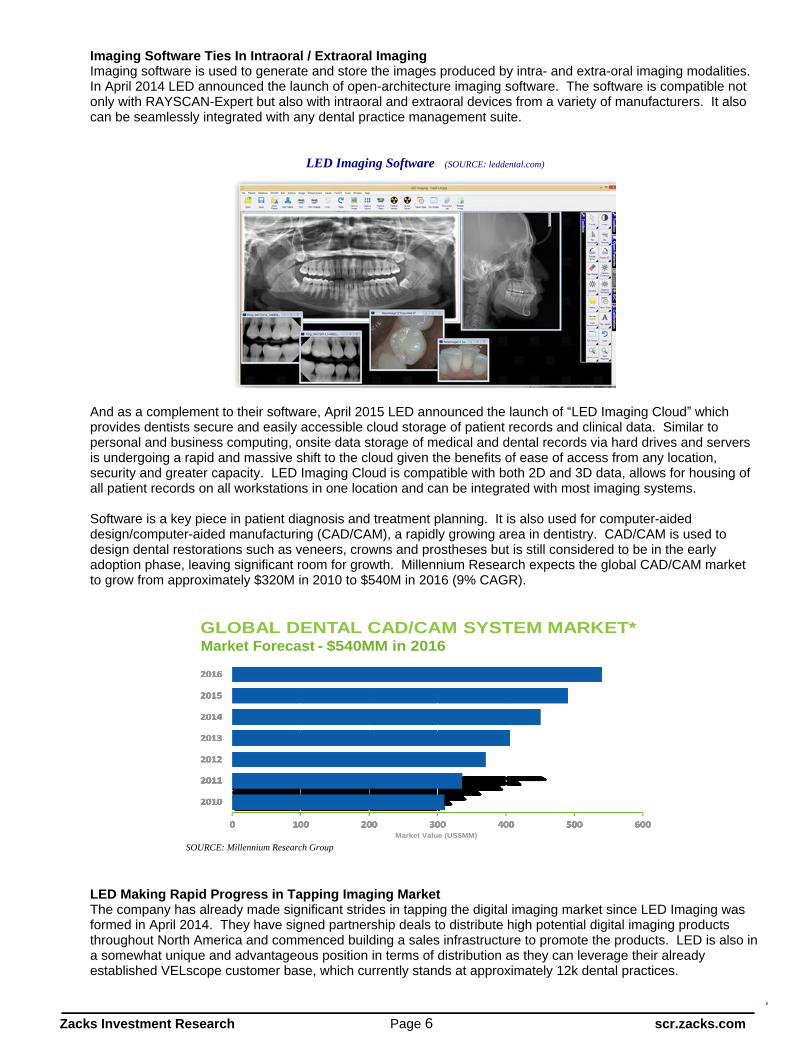
Imaging Software Ties In Intraoral / Extraoral Imaging Imaging software is used to generate and store the images produced by intra- and extra-oral imaging modalities. In April 2014 LED announced the launch of open-architecture imaging software. The software is compatible not only with RAYSCAN-Expert but also with intraoral and extraoral devices from a variety of manufacturers. It also can be seamlessly integrated with any dental practice management suite.
LED Imaging Software (SOURCE: leddental.com)
And as a complement to their software, April 2015 LED announced the launch of LED Imaging Cloud which provides dentists secure and easily accessible cloud storage of patient records and clinical data. Similar to personal and business computing, onsite data storage of medical and dental records via hard drives and servers is undergoing a rapid and massive shift to the cloud given the benefits of ease of access from any location, security and greater capacity. LED Imaging Cloud is compatible with both 2D and 3D data, allows for housing of all patient records on all workstations in one location and can be integrated with most imaging systems.
Software is a key piece in patient diagnosis and treatment planning. It is also used for computer-aided design/computer-aided manufacturing (CAD/CAM), a rapidly growing area in dentistry. CAD/CAM is used to design dental restorations such as veneers, crowns and prostheses but is still considered to be in the early adoption phase, leaving significant room for growth. Millennium Research expects the global CAD/CAM market to grow from approximately $320M in 2010 to $540M in 2016 (9% CAGR).
GLOBAL DENTAL CAD/CAM SYSTEM MARKET*
Market Value (US$MM)
Market Forecast - $540MM in 2016
SOURCE: Millennium Research Group
LED Making Rapid Progress in Tapping Imaging Market The company has already made significant strides in tapping the digital imaging market since LED Imaging was formed in April 2014. They have signed partnership deals to distribute high potential digital imaging products throughout North America and commenced building a sales infrastructure to promote the products. LED is also in a somewhat unique and advantageous position in terms of distribution as they can leverage their already established VELscope customer base, which currently stands at approximately 12k dental practices.
Zacks Investment Research Page 7 scr.zacks.com
And while the company has already brought several third-party digital imaging products under its distribution umbrella, management has indicated that they remain highly engaged with existing and other potential new partners with an eye on further expanding their dental imaging and technology product suite and expect their LED Imaging business to be a major driver of long-term growth of the company.
This early progress has already culminated in a significant increase in orders and revenue. Revenue grew 256% to $9.0M in 2014 and management s guidance is for 2015 revenue growth of 67% - 79% ($15M - $16M).
VELscope Also Remains a Focus And while LED has dedicated considerable energy on building its imaging division, reviving sales of the company's proprietary oral cancer screening device, VELscope, also remains a priority. VELscope continues to hold the title of the world's leading adjunctive screening device for oral tissue abnormalities, including oral cancer. There are currently about 13k devices in use. But despite success in building a sizeable installed base, VELscope sales have recently lagged. Revenue fell from $6.3M in 2012 to $2.5M in 2013 in the midst of a change in distribution model.
Since then the new management team has implemented changes related to VELscope distribution and optimized sales and marketing. This has included changing their distribution - from one which was heavily reliant on a single distributor to one which now will include several sales organizations. LED has made considerable progress in this regard. Since late 2013, the company has penned new distribution agreements with eight distributors including "majors" Patterson Dental, Henry Schein and DenMat Holdings. Optimization of the distribution model along with expected forthcoming additional clinical evidence supporting the use of VELscope for oral cancer detection, is expected to culminate in a resurgence of growth in sales of the device. Early indications are that the revamped distribution strategy is already paying off. LED noted in their 1/21/2015 revenue preannouncement that much of ~$6.4 million revenue growth (+256%) from 2013 to 2014 was driven by a significant increase in contribution from VELscope products.
And LED has recently begun looking at more outside-of-the-box ways to expand adoption and the user base. This has most recently included partnering with the Oral Cancer Foundation in that organization s recent initiative to promote more oral cancer screening. Under this relationship, LED will provide a VELscope free of charge to dental practices that agree to perform at least three daily oral screenings over three years. While LED will provide the instrument at no cost, they will charge the practices for the single-use consumable (i.e. disposable caps), which is where most of the margin is. And the recent launch of the VELscope Vx Imaging Adapter and imaging application provides enhanced and more user-friendly utility which could further support increased adoption of the instrument.
LED also recently partnered with London Drugs, a pharmacy chain in Canada, in a 3-day pilot program held last week whereby London Drug customers were offered free oral cancer screenings with VELscope by dentists at twelve of the pharmacy locations. Depending on the success of the pilot program, LED and London Drugs will consider rolling it out further which would be offered at little or no cost. And while if expanded it will likely not be a financial contributor to LED, it has the potential to increase awareness and possibly drive further adoption at the dental practice level.
While these types of non-traditional marketing initiatives may not result in immediate ROI, they have the potential to broaden the user base over the long-term. And a larger user base is particularly valuable to a company like LED that uses a razor/razor blade revenue model in their VELscope segment which affords the potential for revenue and profitability to exponentially improve with just incremental growth in the installed base.
Financial Model With RAYSCAN-Expert retailing for approximately $100k, the instrument could be a very significant revenue source for LED. LED's $15M - $16M revenue guidance for 2015 includes the expectation that sales of their digital imaging products show a much more substantial contribution compared to 2014. Furthermore, the company has indicated that they expect the digital imaging products will continue to be a significant contributor to total sales going forward.
Revenue fell 60% in 2013 but has since done an about-face, increasing 256% in 2014. We think it is now clear that the initial portion of the company's shift in strategy, which includes a major focus on expanding distribution and complementary revenue opportunities, has already been well established - and has been done in much more
Zacks Investment Research Page 8 scr.zacks.com
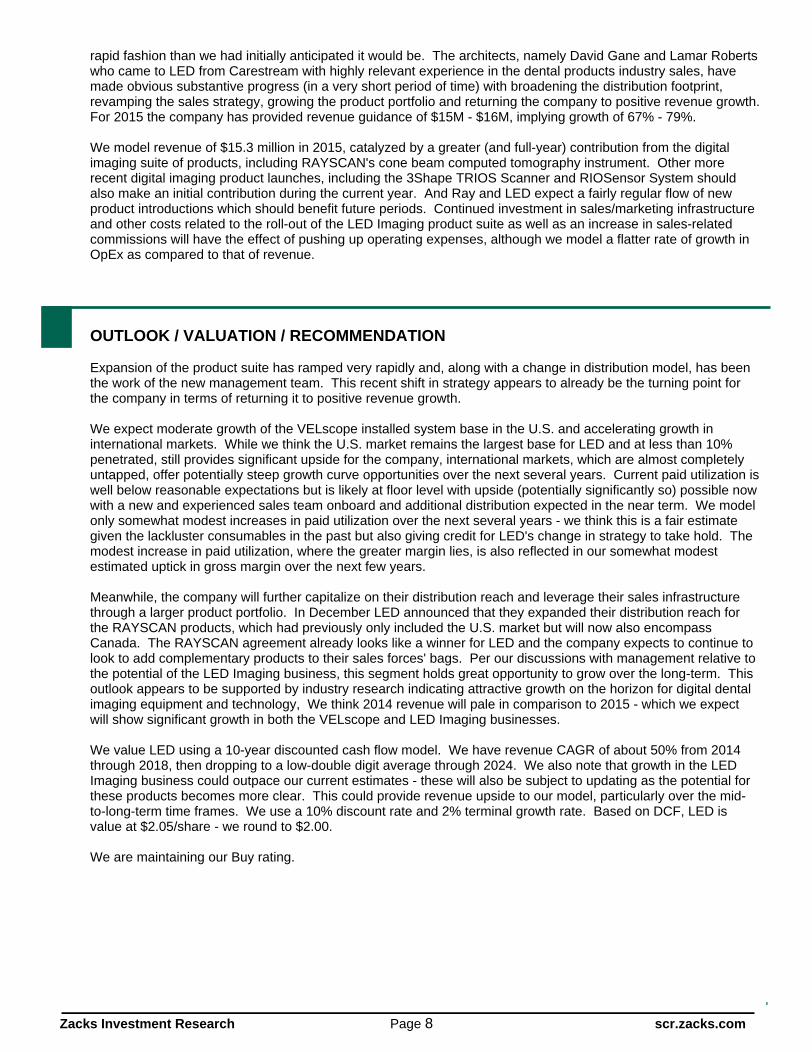
rapid fashion than we had initially anticipated it would be. The architects, namely David Gane and Lamar Roberts who came to LED from Carestream with highly relevant experience in the dental products industry sales, have made obvious substantive progress (in a very short period of time) with broadening the distribution footprint, revamping the sales strategy, growing the product portfolio and returning the company to positive revenue growth. For 2015 the company has provided revenue guidance of $15M - $16M, implying growth of 67% - 79%.
We model revenue of $15.3 million in 2015, catalyzed by a greater (and full-year) contribution from the digital imaging suite of products, including RAYSCAN's cone beam computed tomography instrument. Other more recent digital imaging product launches, including the 3Shape TRIOS Scanner and RIOSensor System should also make an initial contribution during the current year. And Ray and LED expect a fairly regular flow of new product introductions which should benefit future periods. Continued investment in sales/marketing infrastructure and other costs related to the roll-out of the LED Imaging product suite as well as an increase in sales-related commissions will have the effect of pushing up operating expenses, although we model a flatter rate of growth in OpEx as compared to that of revenue.
OUTLOOK / VALUATION / RECOMMENDATION
Expansion of the product suite has ramped very rapidly and, along with a change in distribution model, has been the work of the new management team. This recent shift in strategy appears to already be the turning point for the company in terms of returning it to positive revenue growth.
We expect moderate growth of the VELscope installed system base in the U.S. and accelerating growth in international markets. While we think the U.S. market remains the largest base for LED and at less than 10% penetrated, still provides significant upside for the company, international markets, which are almost completely untapped, offer potentially steep growth curve opportunities over the next several years. Current paid utilization is well below reasonable expectations but is likely at floor level with upside (potentially significantly so) possible now with a new and experienced sales team onboard and additional distribution expected in the near term. We model only somewhat modest increases in paid utilization over the next several years - we think this is a fair estimate given the lackluster consumables in the past but also giving credit for LED's change in strategy to take hold. The modest increase in paid utilization, where the greater margin lies, is also reflected in our somewhat modest estimated uptick in gross margin over the next few years.
Meanwhile, the company will further capitalize on their distribution reach and leverage their sales infrastructure through a larger product portfolio. In December LED announced that they expanded their distribution reach for the RAYSCAN products, which had previously only included the U.S. market but will now also encompass Canada. The RAYSCAN agreement already looks like a winner for LED and the company expects to continue to look to add complementary products to their sales forces' bags. Per our discussions with management relative to the potential of the LED Imaging business, this segment holds great opportunity to grow over the long-term. This outlook appears to be supported by industry research indicating attractive growth on the horizon for digital dental imaging equipment and technology, We think 2014 revenue will pale in comparison to 2015 - which we expect will show significant growth in both the VELscope and LED Imaging businesses.
We value LED using a 10-year discounted cash flow model. We have revenue CAGR of about 50% from 2014 through 2018, then dropping to a low-double digit average through 2024. We also note that growth in the LED Imaging business could outpace our current estimates - these will also be subject to updating as the potential for these products becomes more clear. This could provide revenue upside to our model, particularly over the mid-to-long-term time frames. We use a 10% discount rate and 2% terminal growth rate. Based on DCF, LED is value at $2.05/share - we round to $2.00.
We are maintaining our Buy rating.

Zacks Investment Research Page 9 scr.zacks.com
© Copyright 2015, Zacks Investment Research. All Rights Reserved.
FINANCIAL MODEL
LED Medical Inc.
2014 A
Q1A
Q2E
Q3E
Q4E
2015 E
2016 E
2017 E
2018 E
Revenue $8,962
$2,443
$3,090
$3,083
$6,698
$15,313
$26,499
$35,617
$44,464
YOY Growth
255.7%
131.6%
94.3%
89.3%
42.9%
70.9%
73.0%
34.4%
24.8%
Cost of sales
$5,502
$1,720
$2,162
$2,126
$4,852
$10,861
$15,144
$19,041
$23,491
Gross Income
$3,460
$722
$928
$957
$1,845
$4,452
$11,355
$16,576
$20,973
Total Gross Margin
38.6%
29.6%
30.0%
31.0%
27.6%
29.1%
42.9%
46.5%
47.2%
SG&A
$8,659
$2,097
$2,360
$2,464
$3,455
$10,376
$13,888
$16,588
$18,015
% SG&A
96.6%
85.9%
76.4%
79.9%
51.6%
67.8%
52.4%
46.6%
40.5%
R&D
$503
$50
$108
$111
$87
$356
$887
$1,004
$1,116
% R&D
5.6%
2.0%
3.5%
3.6%
1.3%
2.3%
3.3%
2.8%
2.5%
Operating Income
($5,702)
($1,425)
($1,540)
($1,618)
($1,697)
($6,280)
($3,420)
($1,016)
$1,842
Operating Margin
-63.6%
-58.3%
-49.8%
-52.5%
-25.3%
-41.0%
-12.9%
-2.9%
4.1%
Total Other Income
($326)
$0
$6
$61
$14
$142
$70
$85
$0
Pre-Tax Income
($6,028)
($1,425)
($1,534)
($1,557)
($1,683)
($6,138)
($3,350)
($931)
$1,842
Taxes (benefit)
$0.0
$0.0
$0.0
$0.0
$0.0
$0.0
$0.0
$0.0
$0.0
Tax Rate
0.0%
0.0%
0.0%
0.0%
0.0%
0.0%
0.0%
0.0%
0.0%
Net Income
($6,028)
($1,425)
($1,534)
($1,557)
($1,683)
($6,138)
($3,350)
($931)
$1,842
Net Margin
-67.3%
-58.3%
-49.7%
-50.5%
-25.1%
-40.1%
-12.6%
-2.6%
4.1%
EPS ($0.08)
($0.02)
($0.02)
($0.01)
($0.01)
($0.05)
($0.02)
($0.01)
$0.01
YOY Growth
-42.3%
-60.9%
-1479.0%
-61.1%
108.5%
-28.2%
-57.4%
-73.1%
-291.5%
Diluted Shares O/S
79,821
92,660
100,500
122,220
137,150
113,132
145,000
150,000
155,000
Brian Marckx, CFA
© Copyright 2015, Zacks Investment Research. All Rights Reserved.
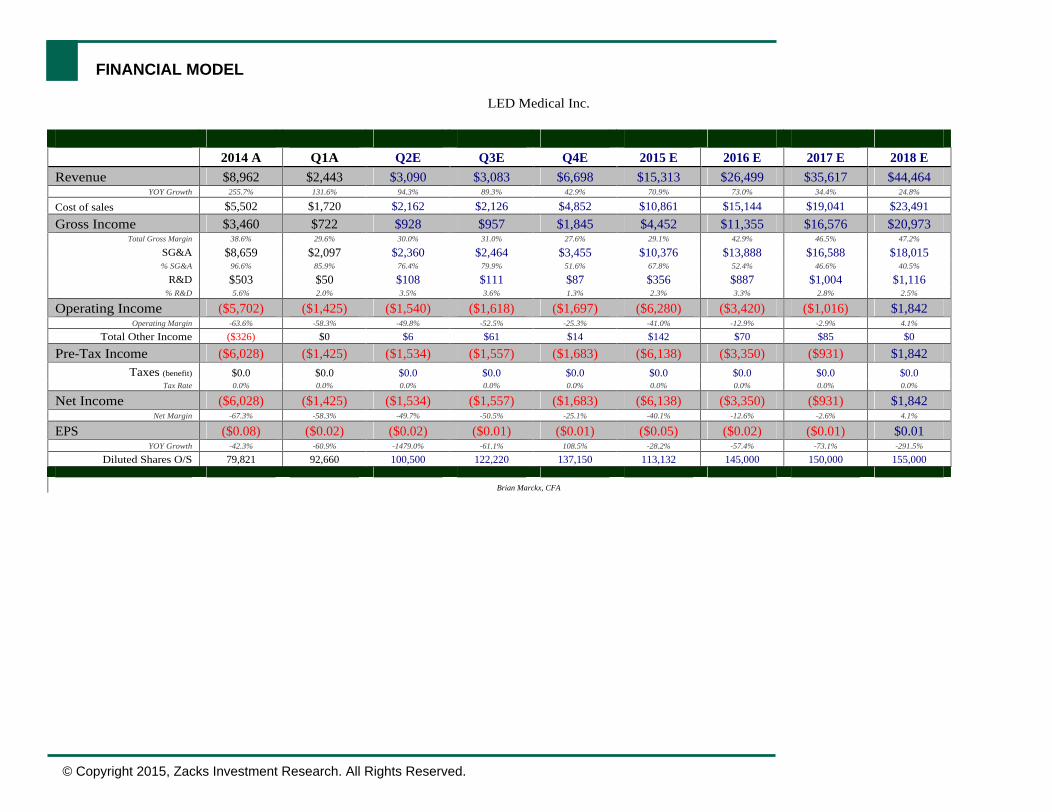
HISTORICAL ZACKS RECOMMENDATIONS
DISCLOSURES The following disclosures relate to relationships between Zacks Small-Cap Research ( Zacks SCR ), a division of Zacks Investment Research ( ZIR ), and the issuers covered by the Zacks SCR Analysts in the Small-Cap Universe.
ANALYST DISCLOSURES
I, Brian Marckx, CFA, CFA, hereby certify that the view expressed in this research report accurately reflect my personal views about the subject securities and issuers. I also certify that no part of my compensation was, is, or will be, directly or indirectly, related to the recommendations or views expressed in this research report. I believe the information used for the creation of this report has been obtained from sources I considered to be reliable, but I can neither guarantee nor represent the completeness or accuracy of the information herewith. Such information and the opinions expressed are subject to change without notice.
INVESMENT BANKING, REFERRALS, AND FEES FOR SERVICE
Zacks SCR does not provide nor has received compensation for investment banking services on the securities covered in this report. Zacks SCR does not expect to receive compensation for investment banking services on the Small-Cap Universe. Zacks SCR may seek to provide referrals for a fee to investment banks. Zacks & Co., a separate legal entity from ZIR, is, among others, one of these investment banks. Referrals may include securities and issuers noted in this report. Zacks & Co. may have paid referral fees to Zacks SCR related to some of the securities and issuers noted in this report. From time to time, Zacks SCR pays investment banks, including Zacks & Co., a referral fee for research coverage.
Zacks SCR has received compensation for non-investment banking services on the Small-Cap Universe, and expects to receive additional compensation for non-investment banking services on the Small-Cap Universe, paid by issuers of securities covered by Zacks SCR Analysts. Non-investment banking services include investor relations services and software, financial database analysis, advertising services, brokerage services, advisory services, equity research, investment management, non-deal road shows, and attendance fees for conferences sponsored or co-sponsored by Zacks SCR. The fees for these services vary on a per client basis and are subject to the number of services contracted. Fees typically range between ten thousand and fifty thousand USD per annum.
POLICY DISCLOSURES
Zacks SCR Analysts are restricted from holding or trading securities placed on the ZIR, SCR, or Zacks & Co. restricted list, which may include issuers in the Small-Cap Universe. ZIR and Zacks SCR do not make a market in any security nor do they act as dealers in securities. Each Zacks SCR Analyst has full discretion on the rating and price target based on his or her own due diligence. Analysts are paid in part based on the overall profitability of Zacks SCR. Such profitability is derived from a variety of sources and includes payments received from issuers of securities covered by Zacks SCR for services described above. No part of analyst compensation was, is or will be, directly or indirectly, related to the specific recommendations or views expressed in any report or article.
ADDITIONAL INFORMATION

Zacks Investment Research Page 12 scr.zacks.com
Additional information is available upon request. Zacks SCR reports are based on data obtained from sources we believe to be reliable, but are not guaranteed as to be accurate nor do we purport to be complete. Because of individual objectives, this report should not be construed as advice designed to meet the particular investment needs of any investor. Any opinions expressed by Zacks SCR Analysts are subject to change without notice. Reports are not to be construed as an offer or solicitation of an offer to buy or sell the securities herein mentioned.
ZACKS RATING & RECOMMENDATION
ZIR uses the following rating system for the 1115 companies whose securities it covers, including securities covered by Zacks SCR: Buy/Outperform: The analyst expects that the subject company will outperform the broader U.S. equity market over the next one to two quarters. Hold/Neutral: The analyst expects that the company will perform in line with the broader U.S. equity market over the next one to two quarters. Sell/Underperform: The analyst expects the company will underperform the broader U.S. Equity market over the next one to two quarters.
The current distribution is as follows: Buy/Outperform- 25.5%, Hold/Neutral- 57.8%, Sell/Underperform 14.3%. Data is as of midnight on the business day immediately prior to this publication.