Embed Size (px)
Citation preview

© Copyright 2017, Zacks Investment Research. All Rights Reserved.
MediciNova, Inc. (MNOV - Nasdaq)
Current Price (10/31/17) $7.16
Valuation $12.00
OUTLOOK
SUMMARY DATA
Risk Level Above Average
Type of Stock Small-Growth Industry Med-Biomed/Gene
On October 30, 2017, MediciNova, Inc. (MNOV) announced positive results from the Phase 2b study of MN-166 (ibudilast) in patients with progressive multiple sclerosis (MS). Treatment with MN-166 resulted in a statistically significant 48% reduction in the rate of progression of whole brain atrophy compared with placebo (P=0.04). In addition, MN-166 was safe and well-tolerated. Analysis of additional endpoints are currently being conducted by the NeuroNEXT network. The data compares quite favorably with that of ocrelizumab, which was approved for the treatment of progressive MS earlier in 2017 and which is forecast to generate revenues in excess of $4 billion in 2022.
52-Week High $7.77 52-Week Low $4.43 One-Year Return (%) 5.45 Beta 0.05 Average Daily Volume (sh) 228,516 Shares Outstanding (mil) 36 Market Capitalization ($mil) $258 Short Interest Ratio (days) N/A Institutional Ownership (%) 22 Insider Ownership (%) 15
Annual Cash Dividend $0.00 Dividend Yield (%) 0.00 5-Yr. Historical Growth Rates Sales (%) N/A Earnings Per Share (%) N/A Dividend (%) N/A
P/E using TTM EPS N/A
P/E using 2015 Estimate N/A
P/E using 2016 Estimate N/A
Small-Cap Research scr.zacks.com 10 S. Riverside Plaza, Suite 1600, Chicago, IL 60606
October 31, 2017 David Bautz, PhD
312-265-9471 [email protected]
ZACKS ESTIMATES
Revenue (In millions of $)
Q1 Q2 Q3 Q4 Year
(Mar) (Jun) (Sep) (Dec) (Dec)
2016 0 A 0 A 0 A 0 A 0 A
2017 0 A 0 A 0 A 0 E 0 E
2018 0 E
2019 0 E
Earnings per Share (EPS is operating earnings before non-recurring items)
Q1 Q2 Q3 Q4 Year
(Mar) (Jun) (Sep) (Dec) (Dec)
2016 -$0.11 A -$0.10 A -$0.08 A -$0.04 A -$0.33 A
2017 -$0.09 A -$0.08 A -$0.11 A -$0.09 E -$0.38 E
2018 -$0.37 E
2019 -$0.38 E
MNOV: Positive Results in Phase 2b Study of MN-166 in Progressive MS…
Based on our probability adjusted DCF model that takes into account potential future revenues from MN-166 in ALS, progressive MS and addiction and MN-001 in NASH and IPF, MNOV is valued at $12/share. This model is highly dependent upon continued clinical success of both MN-166 and MN-001 and will be adjusted accordingly based upon future clinical results.

Zacks Investment Research Page 2 scr.zacks.com
WHAT’S NEW
Business Update SPRINT-MS Trial Achieves Primary Endpoints On October 30, 2017, MediciNova, Inc. (MNOV) announced positive top-line results from the SPRINT-MS Phase 2b clinical trial of MN-166 (ibudilast) in patients with progressive multiple sclerosis (MS). The trial achieved both primary endpoints: 1) Treatment with MN-166 resulted in a statistically significant 48% reduction in the rate of progression of whole
brain atrophy; 2) MN-166 was safe and well tolerated with an adverse event profile that was similar to placebo Evaluation of additional secondary endpoints (including clinical outcomes) are ongoing, and the company will report those as soon as the analysis is completed by the NeuroNEXT network. SPRINT-MS Trial The SPRINT-MS trial was a Phase 2b clinical trial that evaluated MN-166 in patients with primary progressive multiple sclerosis (PPMS) and secondary progressive multiple sclerosis (SPMS). The trial enrolled a total of 255 patients randomized 1:1 between placebo (n=126) and MN-166 (n=129). Inclusion criteria included a diagnosis of either PPMS or SPMS (48% of placebo-treated and 47% of MN-166-treated had SPMS), an Expanded Disability Status Scale (EDSS, Kurtzke, 1983) score between 3.0 and 6.5 (includes patients with limitations in walking and those requiring assistance with walking), and disability progression during the previous two years (as measured by worsening of EDSS of at least 0.5 points, 20% worsening in 25-foot walk, OR 20% worsening in 9-hold peg test in either hand). Patients were permitted to be on interferon-beta and/or glatiramer acetate. Study subjects were treated for 96 weeks, during which time various metrics were analyzed, as shown below.
The primary outcome of the study was the rate of change in brain atrophy over 96 weeks as measured by brain parenchymal fraction (BPF) using MRI. There is a very high degree of variability in skull/brain sizes that leads to a large spread in “normal” values. The BPF was developed to decrease the range of “normal” values and is calculated by dividing the brain parenchymal volume (BPV) by the total intracranial volume (ICV) (Rudick et al., 1999). The brain consists primarily of three parts: white matter (myelinated axons and glial cells), gray matter (neuron cell bodies, dendrites, and unmyelinated axons), and cerebrospinal fluid (CSF). The BPV is the volume of the parenchymal part of the brain (e.g., white matter and gray matter) and does not include the CSF. How the BPF is calculated is best represented by the following MRI images:
Zacks Investment Research Page 3 scr.zacks.com
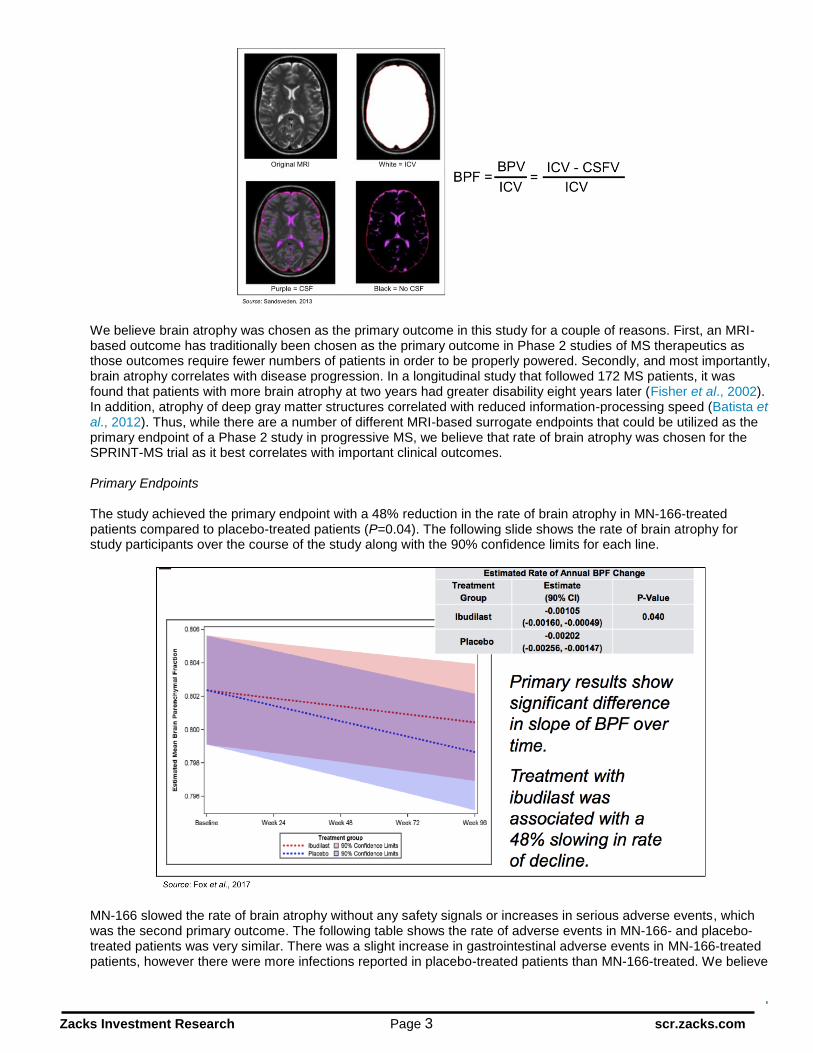
We believe brain atrophy was chosen as the primary outcome in this study for a couple of reasons. First, an MRI-based outcome has traditionally been chosen as the primary outcome in Phase 2 studies of MS therapeutics as those outcomes require fewer numbers of patients in order to be properly powered. Secondly, and most importantly, brain atrophy correlates with disease progression. In a longitudinal study that followed 172 MS patients, it was found that patients with more brain atrophy at two years had greater disability eight years later (Fisher et al., 2002). In addition, atrophy of deep gray matter structures correlated with reduced information-processing speed (Batista et al., 2012). Thus, while there are a number of different MRI-based surrogate endpoints that could be utilized as the primary endpoint of a Phase 2 study in progressive MS, we believe that rate of brain atrophy was chosen for the SPRINT-MS trial as it best correlates with important clinical outcomes. Primary Endpoints The study achieved the primary endpoint with a 48% reduction in the rate of brain atrophy in MN-166-treated patients compared to placebo-treated patients (P=0.04). The following slide shows the rate of brain atrophy for study participants over the course of the study along with the 90% confidence limits for each line.
MN-166 slowed the rate of brain atrophy without any safety signals or increases in serious adverse events, which was the second primary outcome. The following table shows the rate of adverse events in MN-166- and placebo-treated patients was very similar. There was a slight increase in gastrointestinal adverse events in MN-166-treated patients, however there were more infections reported in placebo-treated patients than MN-166-treated. We believe

Zacks Investment Research Page 4 scr.zacks.com
the lower rate of infections in the MN-166 group is due to MN-166’s mechanism of inhibiting macrophage migration inhibitory factor (MIF), which has been shown to play a role in reducing infections.
Lastly, there was no significant difference in discontinuations, early terminations, or early drug withdrawals between MN-166- and placebo-treated patients.
How Ibuidlast Compares to Ocrelizumab Ocrelizumab (Ocrevus®) was approved for the treatment of PPMS (but not SPMS) based on the results of the Phase 3 ORATORIO trial (Montalban et al., 2016). The trial randomized 732 PPMS patients in a 2:1 ratio to receive intravenous ocrelizumab or placebo every 24 weeks for at least 120 weeks. The primary endpoint was the percentage of patients with disability progression confirmed at 12 weeks in a time-to-event analysis. The study achieved the primary endpoint, as the percentage of patients with 12-week confirmed disability progression was 32.9% with ocrelizumab compared to 39.3% with placebo (P=0.03). Interestingly, the Kaplan Meier graphs of disability progression indicate that there was almost no separation of the curves at week 96, which was the original endpoint in the ocrelizumab trial. It was only when the study was extended out to week 120 that the curves showed enough separation to get statistical significance for disability progression.
Zacks Investment Research Page 5 scr.zacks.com
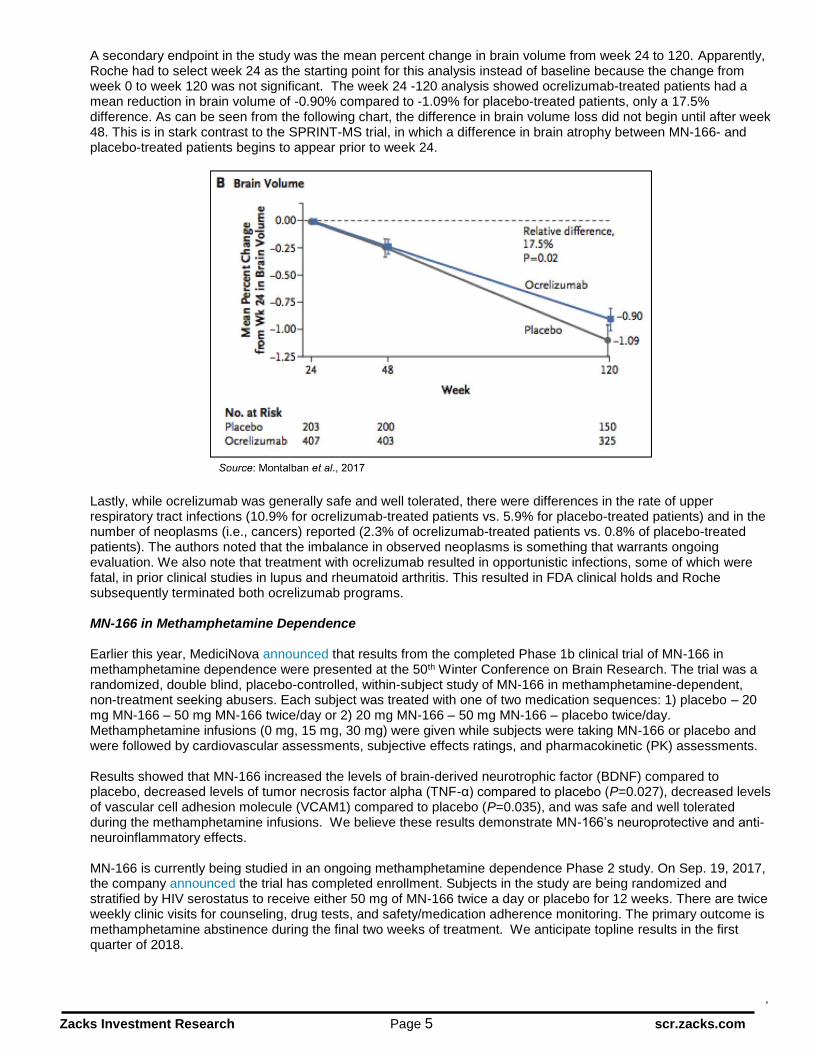
A secondary endpoint in the study was the mean percent change in brain volume from week 24 to 120. Apparently, Roche had to select week 24 as the starting point for this analysis instead of baseline because the change from week 0 to week 120 was not significant. The week 24 -120 analysis showed ocrelizumab-treated patients had a mean reduction in brain volume of -0.90% compared to -1.09% for placebo-treated patients, only a 17.5% difference. As can be seen from the following chart, the difference in brain volume loss did not begin until after week 48. This is in stark contrast to the SPRINT-MS trial, in which a difference in brain atrophy between MN-166- and placebo-treated patients begins to appear prior to week 24.
Lastly, while ocrelizumab was generally safe and well tolerated, there were differences in the rate of upper respiratory tract infections (10.9% for ocrelizumab-treated patients vs. 5.9% for placebo-treated patients) and in the number of neoplasms (i.e., cancers) reported (2.3% of ocrelizumab-treated patients vs. 0.8% of placebo-treated patients). The authors noted that the imbalance in observed neoplasms is something that warrants ongoing evaluation. We also note that treatment with ocrelizumab resulted in opportunistic infections, some of which were fatal, in prior clinical studies in lupus and rheumatoid arthritis. This resulted in FDA clinical holds and Roche subsequently terminated both ocrelizumab programs. MN-166 in Methamphetamine Dependence Earlier this year, MediciNova announced that results from the completed Phase 1b clinical trial of MN-166 in methamphetamine dependence were presented at the 50th Winter Conference on Brain Research. The trial was a randomized, double blind, placebo-controlled, within-subject study of MN-166 in methamphetamine-dependent, non-treatment seeking abusers. Each subject was treated with one of two medication sequences: 1) placebo – 20 mg MN-166 – 50 mg MN-166 twice/day or 2) 20 mg MN-166 – 50 mg MN-166 – placebo twice/day. Methamphetamine infusions (0 mg, 15 mg, 30 mg) were given while subjects were taking MN-166 or placebo and were followed by cardiovascular assessments, subjective effects ratings, and pharmacokinetic (PK) assessments. Results showed that MN-166 increased the levels of brain-derived neurotrophic factor (BDNF) compared to placebo, decreased levels of tumor necrosis factor alpha (TNF-α) compared to placebo (P=0.027), decreased levels of vascular cell adhesion molecule (VCAM1) compared to placebo (P=0.035), and was safe and well tolerated during the methamphetamine infusions. We believe these results demonstrate MN-166’s neuroprotective and anti-neuroinflammatory effects. MN-166 is currently being studied in an ongoing methamphetamine dependence Phase 2 study. On Sep. 19, 2017, the company announced the trial has completed enrollment. Subjects in the study are being randomized and stratified by HIV serostatus to receive either 50 mg of MN-166 twice a day or placebo for 12 weeks. There are twice weekly clinic visits for counseling, drug tests, and safety/medication adherence monitoring. The primary outcome is methamphetamine abstinence during the final two weeks of treatment. We anticipate topline results in the first quarter of 2018.

Zacks Investment Research Page 6 scr.zacks.com
Financial Update On October 23, 2017, MediciNova filed form 10-Q with financial results for the third quarter of 2017. As expected, the company did not report any revenues. Net loss for the third quarter of 2017 was $3.8 million, or $0.11 per share, and was comprised of $1.3 million in R&D expenses and $2.5 million in G&A expenses. This compares to $0.9 million in R&D expenses and $2.0 million in G&A expenses for the corresponding period of 2016. The increase in R&D expenses was due to increased clinical trial activities in 2017 compared to 2016. The increase in G&A expenses was primarily due to higher stock compensation expense and an increase in legal fees. The company exited the third quarter of 2017 with approximately $24.5 million in cash and cash equivalents. We believe the company has sufficient capital to fund operations through the end of 2019. As of October 20, 2017 the company had 36.1 million shares of common stock outstanding. When factoring in the 5.5 million stock options and 0.9 million warrants the company has a fully diluted share count of 42.5 million. Conclusion The positive results for MN-166 in the SPRINT-MS trial are an exciting development for the company and we look forward to evaluating the data on disability and other outcomes when they are reported. As a reminder, the SPRINT-MS study is being conducted by the NeuroNEXT consortium that is responsible for all data analysis, thus when those results are reported is completely out of MediciNova’s control. The data on brain atrophy reported for MN-166 are better than was reported for ocrelizumab in a Phase 3 study of patients with PPMS. In that study, ocrelizumab treatment only decreased the rate of brain atrophy compared to placebo by 17.5%. According to EvaluatePharma, ocrelizumab is expected to generate revenues in excess of $4 billion in 2022, thus showing the potential for a progressive MS treatment. In addition to the release of additional data from the SPRINT-MS trial in progressive MS, we look forward to other upcoming data releases including data from the six-month double-blind portion of the ALS study by the end of this year and data from the methamphetamine dependence trial in the first quarter of 2018. Based upon the results of the SPRINT-MS trial, we have increased the probability of approval for MN-166 in MS to 50%, which has increased our valuation to $12 per share. However, if the disability data from the SPRINT-MS trial are positive, we anticipate that valuation would increase substantially.

© Copyright 2017, Zacks Investment Research. All Rights Reserved.
PROJECTED FINANCIALS
MediciNova Inc. Income Statement
MediciNova, Inc. 2016 A Q1 A Q2 A Q3 A Q4 E 2017 E 2018 E 2019 E
MN-166 (Multiple Sclerosis) $0 $0 $0 $0 $0 $0 $0 $0
YOY Growth - - - - - - - -
MN-166 (ALS) $0 $0 $0 $0 $0 $0 $0 $0
YOY Growth - - - - - - - -
MN-166 (Addiction) $0 $0 $0 $0 $0 $0 $0 $0
YOY Growth - - - - - - - -
MN-001 (NASH) $0 $0 $0 $0 $0 $0 $0 $0
YOY Growth - - - - - - - -
MN-001 (IPF) $0 $0 $0 $0 $0 $0 $0 $0
YOY Growth - - - - - - - -
Grants & Collaborative Revenue $0 $0 $0 $0 $0 $0 $0 $0
YOY Growth - - - - - - - -
Total Revenues $0 $0 $0 $0 $0 $0 $0 $0 YOY Growth - - - - - - - -
Cost of Sales $0 $0 $0 $0 $0 $0 $0 $0
Product Gross Margin - - - - - - - -
Research & Development $3.519 $0.901 $0.897 $1.268 $1.100 $4.166 $4.500 $4.700
General & Administrative $7.363 $2.123 $1.908 $2.523 $2.000 $8.554 $8.300 $8.500
Other Expenses $0 $0 $0 $0 $0 $0 $0 $0
Operating Income ($10.882) ($3.024) ($2.805) ($3.792) ($3.100) ($12.7) ($12.8) ($13.2)
Operating Margin - - - - - - - -
Non-Operating Expenses (Net) $0.0 $0.01 $0.02 $0.04 ($0.01) ($0.5) ($0.5) ($0.5)
Pre-Tax Income ($10.862) ($3.012) ($2.787) ($3.753) ($3.110) ($13.2) ($13.3) ($13.7)
Income Taxes Paid $0 $0 $0 $0 $0 $0 $0 $0
Tax Rate 0% 0% 0% 0% 0% 0% 0% 0%
Net Income ($10.9) ($3.017) ($2.789) ($3.755) ($3.112) ($13.2) ($13.3) ($13.7) Net Margin - - - - - - - -
Reported EPS ($0.33) ($0.09) ($0.08) ($0.11) ($0.09) ($0.38) ($0.37) ($0.38) YOY Growth - - - - - - - -
Basic Shares Outstanding 32.987 34.527 34.647 35.156 35.300 34.907 36.000 36.000
Source: Zacks Investment Research, Inc. David Bautz, PhD
© Copyright 2017, Zacks Investment Research. All Rights Reserved.
HISTORICAL STOCK PRICE

Zacks Investment Research Page 9 scr.zacks.com
DISCLOSURES The following disclosures relate to relationships between Zacks Small-Cap Research (“Zacks SCR”), a division of Zacks Investment Research (“ZIR”), and the issuers covered by the Zacks SCR Analysts in the Small-Cap Universe. ANALYST DISCLOSURES
I, David Bautz, PhD, hereby certify that the view expressed in this research report accurately reflect my personal views about the subject securities and issuers. I also certify that no part of my compensation was, is, or will be, directly or indirectly, related to the recommendations or views expressed in this research report. I believe the information used for the creation of this report has been obtained from sources I considered to be reliable, but I can neither guarantee nor represent the completeness or accuracy of the information herewith. Such information and the opinions expressed are subject to change without notice.
INVESTMENT BANKING AND FEES FOR SERVICES
Zacks SCR does not provide investment banking services nor has it received compensation for investment banking services from the issuers of the securities covered in this report or article. Zacks SCR has received compensation from the issuer directly or from an investor relations consulting firm engaged by the issuer for providing non-investment banking services to this issuer and expects to receive additional compensation for such non-investment banking services provided to this issuer. The non-investment banking services provided to the issuer includes the preparation of this report, investor relations services, investment software, financial database analysis, organization of non-deal road shows, and attendance fees for conferences sponsored or co-sponsored by Zacks SCR. The fees for these services vary on a per-client basis and are subject to the number and types of services contracted. Fees typically range between ten thousand and fifty thousand dollars per annum. Details of fees paid by this issuer are available upon request.
POLICY DISCLOSURES
This report provides an objective valuation of the issuer today and expected valuations of the issuer at various future dates based on applying standard investment valuation methodologies to the revenue and EPS forecasts made by the SCR Analyst of the issuer’s business. SCR Analysts are restricted from holding or trading securities in the issuers that they cover. ZIR and Zacks SCR do not make a market in any security followed by SCR nor do they act as dealers in these securities. Each Zacks SCR Analyst has full discretion over the valuation of the issuer included in this report based on his or her own due diligence. SCR Analysts are paid based on the number of companies they cover. SCR Analyst compensation is not, was not, nor will be, directly or indirectly, related to the specific valuations or views expressed in any report or article.
ADDITIONAL INFORMATION
Additional information is available upon request. Zacks SCR reports and articles are based on data obtained from sources that it believes to be reliable, but are not guaranteed to be accurate nor do they purport to be complete. Because of individual financial or investment objectives and/or financial circumstances, this report or article should not be construed as advice designed to meet the particular investment needs of any investor. Investing involves risk. Any opinions expressed by Zacks SCR Analysts are subject to change without notice. Reports or articles or tweets are not to be construed as an offer or solicitation of an offer to buy or sell the securities herein mentioned.