Embed Size (px)
Citation preview

Facts Monthly fund analysis and market reviews
Figures inNovember 2018
Small yet Precious
BOI AXA SMALL CAP FUND
(An open ended equity scheme predominantly investing in small cap stocks)
RISKOMETER
Moderate
Low
High
Moderately
Low
ModeratelyHigh
Investors understand that their principal will be at moderately high risk
LOW HIGH
• Long term capital appreciation
• Investment predominantly in equity & equity related instruments of Small Cap companies.
*Investor should consult their financial advisor if they are not clear about the suitability of the product.
THIS PRODUCT IS SUITABLE FOR INVESTORS WHO ARE SEEKING*:
Scheme
Re-opens:
December
27, 2018
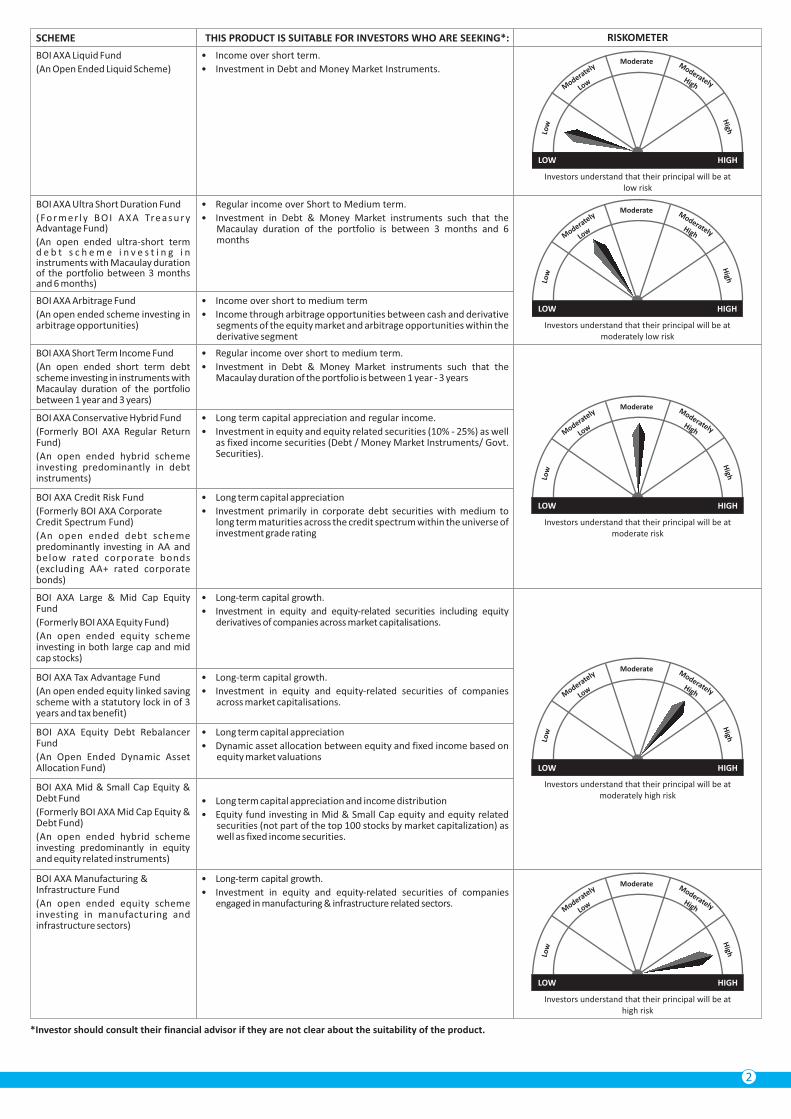
SCHEME THIS PRODUCT IS SUITABLE FOR INVESTORS WHO ARE SEEKING*:
BOI AXA Short Term Income Fund
(An open ended short term debt scheme investing in instruments with Macaulay duration of the portfolio between 1 year and 3 years)
• Regular income over short to medium term.
• Investment in Debt & Money Market instruments such that the Macaulay duration of the portfolio is between 1 year - 3 years
BOI AXA Conservative Hybrid Fund
(Formerly BOI AXA Regular Return Fund)
(An open ended hybrid scheme investing predominantly in debt instruments)
• Long term capital appreciation and regular income.
• Investment in equity and equity related securities (10% - 25%) as well as fixed income securities (Debt / Money Market Instruments/ Govt. Securities).
BOI AXA Credit Risk Fund
(Formerly BOI AXA Corporate Credit Spectrum Fund)
(An open ended debt scheme predominantly investing in AA and below rated corporate bonds (excluding AA+ rated corporate bonds)
• Long term capital appreciation
• Investment primarily in corporate debt securities with medium to long term maturities across the credit spectrum within the universe of investment grade rating
RISKOMETER
BOI AXA Large & Mid Cap Equity Fund
(Formerly BOI AXA Equity Fund)
(An open ended equity scheme investing in both large cap and mid cap stocks)
• Long-term capital growth.
• Investment in equity and equity-related securities including equity derivatives of companies across market capitalisations.
BOI AXA Tax Advantage Fund
(An open ended equity linked saving scheme with a statutory lock in of 3 years and tax benefit)
• Long-term capital growth.
• Investment in equity and equity-related securities of companies across market capitalisations.
BOI AXA Equity Debt Rebalancer Fund
(An Open Ended Dynamic Asset Allocation Fund)
• Long term capital appreciation
• Dynamic asset allocation between equity and fixed income based on equity market valuations
BOI AXA Liquid Fund
(An Open Ended Liquid Scheme)
• Income over short term.
• Investment in Debt and Money Market Instruments.Moderate
Low
High
Moderately
Low
ModeratelyHigh
Investors understand that their principal will be at low risk
LOW HIGH
Moderate
Low
High
Moderately
Low
ModeratelyHigh
Investors understand that their principal will be at moderately low risk
LOW HIGH
BOI AXA Mid & Small Cap Equity & Debt Fund
(Formerly BOI AXA Mid Cap Equity & Debt Fund)
(An open ended hybrid scheme investing predominantly in equity and equity related instruments)
• Long term capital appreciation and income distribution
• Equity fund investing in Mid & Small Cap equity and equity related securities (not part of the top 100 stocks by market capitalization) as well as fixed income securities.
*Investor should consult their financial advisor if they are not clear about the suitability of the product.
BOI AXA Manufacturing & Infrastructure Fund
(An open ended equity scheme investing in manufacturing and infrastructure sectors)
• Long-term capital growth.
• Investment in equity and equity-related securities of companies engaged in manufacturing & infrastructure related sectors.
Moderate
Low
High
Moderately
Low
ModeratelyHigh
Investors understand that their principal will be at high risk
LOW HIGH
BOI AXA Ultra Short Duration Fund
( Fo r m e r l y B O I A X A Tre a s u r y Advantage Fund)
(An open ended ultra-short term d e b t s c h e m e i n v e s t i n g i n instruments with Macaulay duration of the portfolio between 3 months and 6 months)
• Regular income over Short to Medium term.
• Investment in Debt & Money Market instruments such that the Macaulay duration of the portfolio is between 3 months and 6 months
Moderate
Low
High
Moderately
Low
ModeratelyHigh
Investors understand that their principal will be at moderate risk
LOW HIGH
Moderate
Low
High
Moderately
Low
ModeratelyHigh
Investors understand that their principal will be at moderately high risk
LOW HIGH
BOI AXA Arbitrage Fund
(An open ended scheme investing in arbitrage opportunities)
• Income over short to medium term
• Income through arbitrage opportunities between cash and derivative segments of the equity market and arbitrage opportunities within the derivative segment
2
Alok SinghCHIEF INVESTMENT OFFICERMARKET UPDATE
The Reserve Bank of India (RBI) kept the Repo rate unchanged at 6.5% and maintained the overall policy stance of “calibrated
tightening”. A sharp drop in oil prices since November 2018, a broad based decline in food inflation, stabilisation of the exchange rate
and benign headline CPI inflation readings below 4% target, prompted the unanimous decision to leave the rates unchanged.
The low level of food and fuel inflation lead to the projected path of inflation for the rest of this fiscal year being revised sharply lower to
a range of 2.7 - 3.2% in H2FY19 from the 3.9 - 4.5% projected in October 2018. As per RBI policy the inflation in the first half of next fiscal
year 2019-20 is also seen in a lower range of 3.8 - 4.2% compared to 4.8% projected in October for Q1FY20. The risks to the projected
path of inflation are still seen tilted on the upside because of uncertainty around the crude price and MSP impact going forward. Risk of
fiscal slippage at the central and state government level also remains, especially ahead of the general elections next year. The core
inflation still remains elevated, with October reading at 6.1% y-o-y and the policy statement notes that the output gap is almost closed.
Inflation expectations too remain broadly unchanged over the 1-year horizon. These short-term uncertainties, high core inflation and
with headline inflation projected to climb back above 4% during the next 1 year, seem to have influenced the decision to keep the stance
unchanged too.
The RBI maintained the real GDP growth forecast of 7.4% for the current fiscal year and 7.5% for the H1FY20. However, the changing
global liquidity conditions, slowing of global demand and persisting trade tensions, can act as drag going forward. With this downward
revision of inflation projection and acknowledgment of the downside risks to growth, the MPC has guided for a possible change in
policy stance back to “Neutral” in February 2019 meeting from “calibrated tightening” now. This along with the RBIs commitment to
continue with Open Market Operations purchases resulted in market yields moving down across the yield curve. The benchmark 10yr
bond yield moved to 7.40%. We expect market yields to consolidate around current levels.
The NBFC sector which has been under great amount of investor scrutiny for last two months has seen some amount of stabilization.
RBI also committed itself to remain lender of last resort if the need arises. It will take some more time for the situation to come back to
normalcy. The balance sheets of most of the NBFCs will undergo a change and many will also be forced to shrink it. Going forward, the
lending gap created by the non -availability of some NBFCs especially in housing and small businesses should be taken up by the banks
and Tier-1 NBFCs gradually. However, this transition may not be very smooth and can potentially impact the GDP growth rate.
The capacity utilisations for industry have been on an uptrend (as per RBI survey, at 76.1% in 2Q19 vs 73.8% in 1Q19). We expect private
capex to pick up in the next financial year and remain elevated over the medium term. The election outcome in 2019 may dampen this a
bit but overall trajectory should remain intact. Elections can add to volatility in markets in the short -run, but over a longer period, we
believe the fundamental drivers of earnings & liquidity would determine the market returns. Even historically, it has been observed that
election results impact short-term market movements (such as the immediate decline post the surprise win of INC in 2004), while over
a longer period, market returns have followed the underlying economic condition.
Source: Bloomberg (Unless indicated otherwise); Dated: December 6, 2018
3
INVESTMENT STYLE
Growth Blend Value
Small
Medium
Large
Mar
ket
Cap
ital
isat
ion
SIP SHIELD AVAILABLE
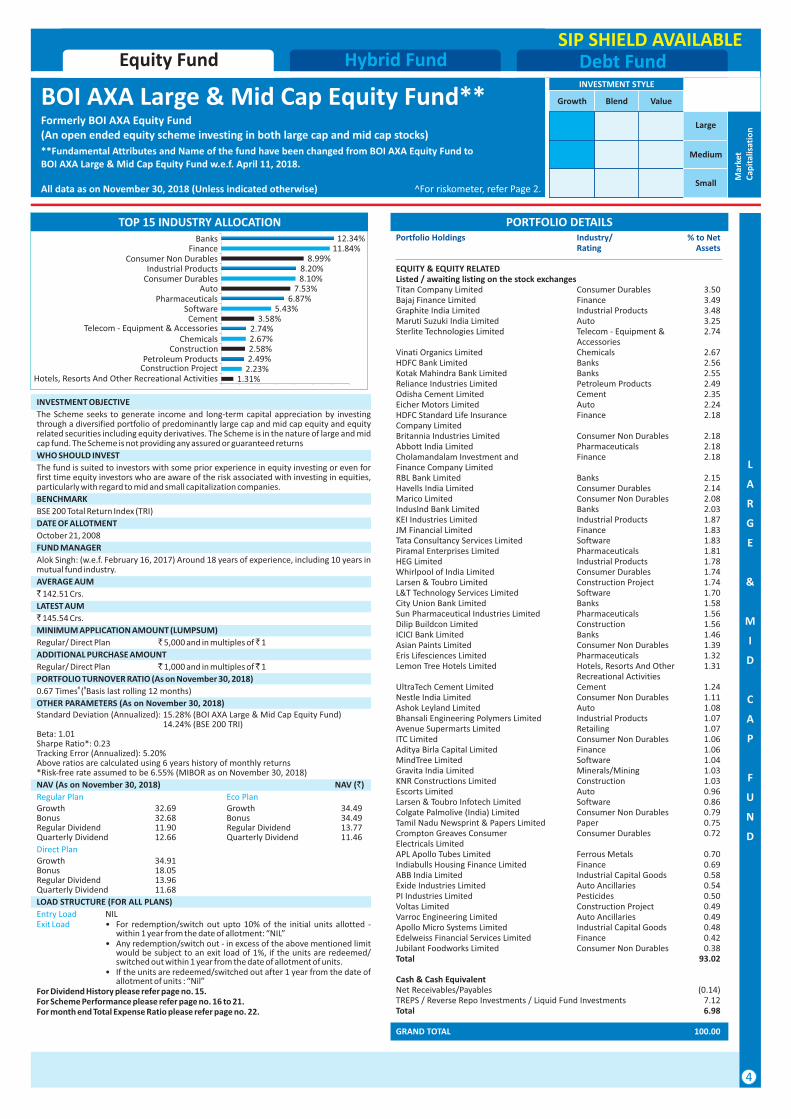
BOI AXA Large & Mid Cap Equity Fund**Formerly BOI AXA Equity Fund(An open ended equity scheme investing in both large cap and mid cap stocks)
**Fundamental Attributes and Name of the fund have been changed from BOI AXA Equity Fund to BOI AXA Large & Mid Cap Equity Fund w.e.f. April 11, 2018.
Debt FundHybrid FundEquity Fund
L
A
R
G
E
&
M
I
D
C
A
P
F
U
N
D
^For riskometer, refer Page 2.All data as on November 30, 2018 (Unless indicated otherwise)
PORTFOLIO DETAILSPortfolio Holdings Industry/ % to Net Rating Assets
EQUITY & EQUITY RELATED Listed / awaiting listing on the stock exchangesTitan Company Limited Consumer Durables 3.50Bajaj Finance Limited Finance 3.49Graphite India Limited Industrial Products 3.48Maruti Suzuki India Limited Auto 3.25Sterlite Technologies Limited Telecom - Equipment & 2.74 Accessories Vinati Organics Limited Chemicals 2.67HDFC Bank Limited Banks 2.56Kotak Mahindra Bank Limited Banks 2.55Reliance Industries Limited Petroleum Products 2.49Odisha Cement Limited Cement 2.35Eicher Motors Limited Auto 2.24HDFC Standard Life Insurance Finance 2.18Company LimitedBritannia Industries Limited Consumer Non Durables 2.18Abbott India Limited Pharmaceuticals 2.18Cholamandalam Investment and Finance 2.18Finance Company LimitedRBL Bank Limited Banks 2.15Havells India Limited Consumer Durables 2.14Marico Limited Consumer Non Durables 2.08IndusInd Bank Limited Banks 2.03KEI Industries Limited Industrial Products 1.87JM Financial Limited Finance 1.83Tata Consultancy Services Limited Software 1.83Piramal Enterprises Limited Pharmaceuticals 1.81HEG Limited Industrial Products 1.78Whirlpool of India Limited Consumer Durables 1.74Larsen & Toubro Limited Construction Project 1.74L&T Technology Services Limited Software 1.70City Union Bank Limited Banks 1.58Sun Pharmaceutical Industries Limited Pharmaceuticals 1.56Dilip Buildcon Limited Construction 1.56ICICI Bank Limited Banks 1.46Asian Paints Limited Consumer Non Durables 1.39Eris Lifesciences Limited Pharmaceuticals 1.32Lemon Tree Hotels Limited Hotels, Resorts And Other 1.31 Recreational Activities UltraTech Cement Limited Cement 1.24Nestle India Limited Consumer Non Durables 1.11Ashok Leyland Limited Auto 1.08Bhansali Engineering Polymers Limited Industrial Products 1.07Avenue Supermarts Limited Retailing 1.07ITC Limited Consumer Non Durables 1.06Aditya Birla Capital Limited Finance 1.06MindTree Limited Software 1.04Gravita India Limited Minerals/Mining 1.03KNR Constructions Limited Construction 1.03Escorts Limited Auto 0.96Larsen & Toubro Infotech Limited Software 0.86Colgate Palmolive (India) Limited Consumer Non Durables 0.79Tamil Nadu Newsprint & Papers Limited Paper 0.75Crompton Greaves Consumer Consumer Durables 0.72Electricals LimitedAPL Apollo Tubes Limited Ferrous Metals 0.70Indiabulls Housing Finance Limited Finance 0.69ABB India Limited Industrial Capital Goods 0.58Exide Industries Limited Auto Ancillaries 0.54PI Industries Limited Pesticides 0.50Voltas Limited Construction Project 0.49Varroc Engineering Limited Auto Ancillaries 0.49Apollo Micro Systems Limited Industrial Capital Goods 0.48Edelweiss Financial Services Limited Finance 0.42Jubilant Foodworks Limited Consumer Non Durables 0.38Total 93.02
Cash & Cash Equivalent Net Receivables/Payables (0.14)TREPS / Reverse Repo Investments / Liquid Fund Investments 7.12Total 6.98
GRAND TOTAL 100.00
INVESTMENT OBJECTIVE
The Scheme seeks to generate income and long-term capital appreciation by investing through a diversified portfolio of predominantly large cap and mid cap equity and equity related securities including equity derivatives. The Scheme is in the nature of large and mid cap fund. The Scheme is not providing any assured or guaranteed returns
WHO SHOULD INVEST
The fund is suited to investors with some prior experience in equity investing or even for first time equity investors who are aware of the risk associated with investing in equities, particularly with regard to mid and small capitalization companies.
BENCHMARK
BSE 200 Total Return Index (TRI)
DATE OF ALLOTMENT
October 21, 2008
FUND MANAGER
Alok Singh: (w.e.f. February 16, 2017) Around 18 years of experience, including 10 years in mutual fund industry.
AVERAGE AUM
` 142.51 Crs.
LATEST AUM
` 145.54 Crs.
MINIMUM APPLICATION AMOUNT (LUMPSUM)
Regular/ Direct Plan ` 5,000 and in multiples of ̀ 1
ADDITIONAL PURCHASE AMOUNT
Regular/ Direct Plan ` 1,000 and in multiples of ̀ 1
PORTFOLIO TURNOVER RATIO (As on November 30, 2018)# #0.67 Times ( Basis last rolling 12 months)
OTHER PARAMETERS (As on November 30, 2018)Standard Deviation (Annualized): 15.28% (BOI AXA Large & Mid Cap Equity Fund) 14.24% (BSE 200 TRI)Beta: 1.01Sharpe Ratio*: 0.23Tracking Error (Annualized): 5.20%Above ratios are calculated using 6 years history of monthly returns*Risk-free rate assumed to be 6.55% (MIBOR as on November 30, 2018)
NAV (As on November 30, 2018) NAV (`)
Regular Plan Eco PlanGrowth 32.69 Growth 34.49Bonus 32.68 Bonus 34.49Regular Dividend 11.90 Regular Dividend 13.77Quarterly Dividend 12.66 Quarterly Dividend 11.46
Direct PlanGrowth 34.91Bonus 18.05Regular Dividend 13.96Quarterly Dividend 11.68
LOAD STRUCTURE (FOR ALL PLANS)
Entry Load NILExit Load • For redemption/switch out upto 10% of the initial units allotted -
within 1 year from the date of allotment: “NIL” • Any redemption/switch out - in excess of the above mentioned limit
would be subject to an exit load of 1%, if the units are redeemed/ switched out within 1 year from the date of allotment of units.
• If the units are redeemed/switched out after 1 year from the date of allotment of units : “Nil”
For Dividend History please refer page no. 15.For Scheme Performance please refer page no. 16 to 21.For month end Total Expense Ratio please refer page no. 22.
TOP 15 INDUSTRY ALLOCATION
4
1.31%2.23%2.49%2.58%2.67%2.74%
3.58%5.43%
6.87%7.53%
8.10%8.20%
8.99%11.84%
12.34%
Hotels, Resorts And Other Recreational ActivitiesConstruction ProjectPetroleum Products
ConstructionChemicals
Telecom - Equipment & AccessoriesCement
SoftwarePharmaceuticals
AutoConsumer DurablesIndustrial Products
Consumer Non DurablesFinance
Banks
80C Benefit
E
Q
U
I
T
Y
L
I
N
K
E
D
S
A
V
I
N
G
S
C
H
E
M
E
SIP SHIELD AVAILABLE
^For riskometer, refer Page 2.All data as on November 30, 2018 (Unless indicated otherwise)
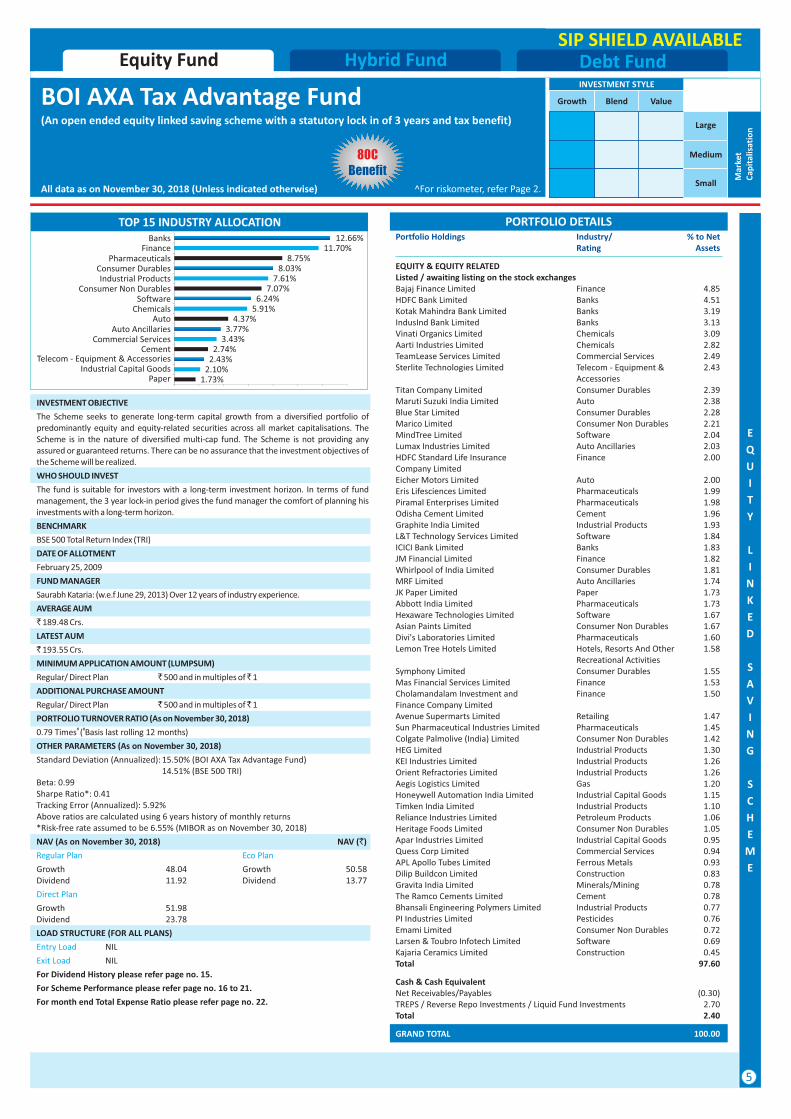
BOI AXA Tax Advantage Fund(An open ended equity linked saving scheme with a statutory lock in of 3 years and tax benefit)
PORTFOLIO DETAILSPortfolio Holdings Industry/ % to Net Rating Assets
EQUITY & EQUITY RELATED Listed / awaiting listing on the stock exchangesBajaj Finance Limited Finance 4.85HDFC Bank Limited Banks 4.51Kotak Mahindra Bank Limited Banks 3.19IndusInd Bank Limited Banks 3.13Vinati Organics Limited Chemicals 3.09Aarti Industries Limited Chemicals 2.82TeamLease Services Limited Commercial Services 2.49Sterlite Technologies Limited Telecom - Equipment & 2.43 AccessoriesTitan Company Limited Consumer Durables 2.39Maruti Suzuki India Limited Auto 2.38Blue Star Limited Consumer Durables 2.28Marico Limited Consumer Non Durables 2.21MindTree Limited Software 2.04Lumax Industries Limited Auto Ancillaries 2.03HDFC Standard Life Insurance Finance 2.00Company LimitedEicher Motors Limited Auto 2.00Eris Lifesciences Limited Pharmaceuticals 1.99Piramal Enterprises Limited Pharmaceuticals 1.98Odisha Cement Limited Cement 1.96Graphite India Limited Industrial Products 1.93L&T Technology Services Limited Software 1.84ICICI Bank Limited Banks 1.83JM Financial Limited Finance 1.82Whirlpool of India Limited Consumer Durables 1.81MRF Limited Auto Ancillaries 1.74JK Paper Limited Paper 1.73Abbott India Limited Pharmaceuticals 1.73Hexaware Technologies Limited Software 1.67Asian Paints Limited Consumer Non Durables 1.67Divi's Laboratories Limited Pharmaceuticals 1.60Lemon Tree Hotels Limited Hotels, Resorts And Other 1.58 Recreational Activities Symphony Limited Consumer Durables 1.55Mas Financial Services Limited Finance 1.53Cholamandalam Investment and Finance 1.50Finance Company LimitedAvenue Supermarts Limited Retailing 1.47Sun Pharmaceutical Industries Limited Pharmaceuticals 1.45Colgate Palmolive (India) Limited Consumer Non Durables 1.42HEG Limited Industrial Products 1.30KEI Industries Limited Industrial Products 1.26Orient Refractories Limited Industrial Products 1.26Aegis Logistics Limited Gas 1.20Honeywell Automation India Limited Industrial Capital Goods 1.15Timken India Limited Industrial Products 1.10Reliance Industries Limited Petroleum Products 1.06Heritage Foods Limited Consumer Non Durables 1.05Apar Industries Limited Industrial Capital Goods 0.95Quess Corp Limited Commercial Services 0.94APL Apollo Tubes Limited Ferrous Metals 0.93Dilip Buildcon Limited Construction 0.83Gravita India Limited Minerals/Mining 0.78The Ramco Cements Limited Cement 0.78Bhansali Engineering Polymers Limited Industrial Products 0.77PI Industries Limited Pesticides 0.76Emami Limited Consumer Non Durables 0.72Larsen & Toubro Infotech Limited Software 0.69Kajaria Ceramics Limited Construction 0.45Total 97.60
Cash & Cash Equivalent Net Receivables/Payables (0.30)TREPS / Reverse Repo Investments / Liquid Fund Investments 2.70Total 2.40
GRAND TOTAL 100.00
INVESTMENT OBJECTIVE
The Scheme seeks to generate long-term capital growth from a diversified portfolio of predominantly equity and equity-related securities across all market capitalisations. The Scheme is in the nature of diversified multi-cap fund. The Scheme is not providing any assured or guaranteed returns. There can be no assurance that the investment objectives of the Scheme will be realized.
WHO SHOULD INVEST
The fund is suitable for investors with a long-term investment horizon. In terms of fund management, the 3 year lock-in period gives the fund manager the comfort of planning his investments with a long-term horizon.
BENCHMARK
BSE 500 Total Return Index (TRI)
DATE OF ALLOTMENT
February 25, 2009
FUND MANAGER
Saurabh Kataria: (w.e.f June 29, 2013) Over 12 years of industry experience.
AVERAGE AUM
` 189.48 Crs.
LATEST AUM
` 193.55 Crs.
MINIMUM APPLICATION AMOUNT (LUMPSUM)
Regular/ Direct Plan ` 500 and in multiples of ̀ 1
ADDITIONAL PURCHASE AMOUNT
Regular/ Direct Plan ` 500 and in multiples of ̀ 1
PORTFOLIO TURNOVER RATIO (As on November 30, 2018)# #0.79 Times ( Basis last rolling 12 months)
OTHER PARAMETERS (As on November 30, 2018)
Standard Deviation (Annualized): 15.50% (BOI AXA Tax Advantage Fund) 14.51% (BSE 500 TRI)Beta: 0.99Sharpe Ratio*: 0.41Tracking Error (Annualized): 5.92%Above ratios are calculated using 6 years history of monthly returns*Risk-free rate assumed to be 6.55% (MIBOR as on November 30, 2018)
NAV (As on November 30, 2018) NAV (`)
Regular Plan Eco Plan
Growth 48.04 Growth 50.58Dividend 11.92 Dividend 13.77
Direct Plan
Growth 51.98Dividend 23.78
LOAD STRUCTURE (FOR ALL PLANS)
Entry Load NIL
Exit Load NIL
For Dividend History please refer page no. 15.
For Scheme Performance please refer page no. 16 to 21.
For month end Total Expense Ratio please refer page no. 22.
TOP 15 INDUSTRY ALLOCATION
5
INVESTMENT STYLE
Growth Blend Value
Small
Medium
Large
Mar
ket
Cap
ital
isat
ion
Debt FundHybrid FundEquity Fund
1.73%2.10%2.43%2.74%
3.43%3.77%
4.37%5.91%6.24%
7.07%7.61%
8.03%8.75%
11.70%12.66%
PaperIndustrial Capital Goods
Telecom - Equipment & AccessoriesCement
Commercial ServicesAuto Ancillaries
AutoChemicals
SoftwareConsumer Non Durables
Industrial ProductsConsumer Durables
PharmaceuticalsFinance
Banks
S
E
C
T
O
R
A
L
F
U
N
D
INVESTMENT STYLE
Growth Blend Value
Small
Medium
Large
Mar
ket
Cap
ital
isat
ion
^For riskometer, refer Page 2.All data as on November 30, 2018 (Unless indicated otherwise)
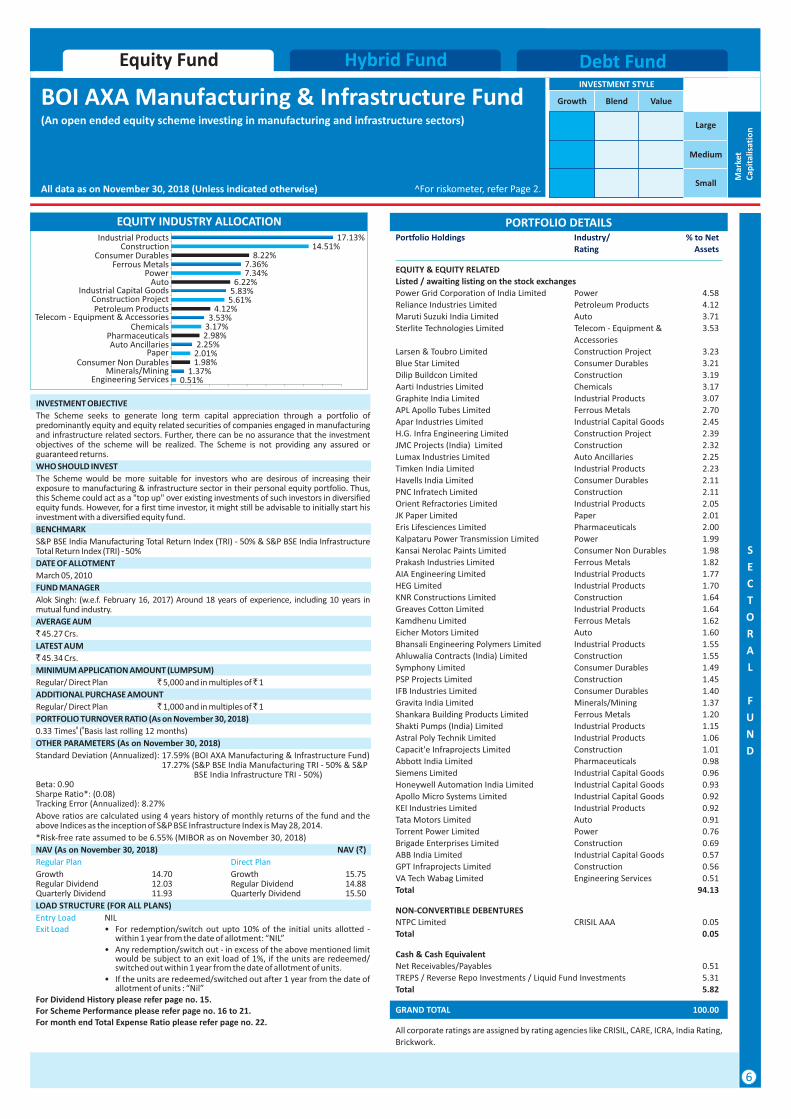
BOI AXA Manufacturing & Infrastructure Fund(An open ended equity scheme investing in manufacturing and infrastructure sectors)
Debt FundHybrid FundEquity Fund
PORTFOLIO DETAILSPortfolio Holdings Industry/ % to Net
Rating Assets
EQUITY & EQUITY RELATED
Listed / awaiting listing on the stock exchanges
Power Grid Corporation of India Limited Power 4.58
Reliance Industries Limited Petroleum Products 4.12
Maruti Suzuki India Limited Auto 3.71
Sterlite Technologies Limited Telecom - Equipment & 3.53
Accessories
Larsen & Toubro Limited Construction Project 3.23
Blue Star Limited Consumer Durables 3.21
Dilip Buildcon Limited Construction 3.19
Aarti Industries Limited Chemicals 3.17
Graphite India Limited Industrial Products 3.07
APL Apollo Tubes Limited Ferrous Metals 2.70
Apar Industries Limited Industrial Capital Goods 2.45
H.G. Infra Engineering Limited Construction Project 2.39
JMC Projects (India) Limited Construction 2.32
Lumax Industries Limited Auto Ancillaries 2.25
Timken India Limited Industrial Products 2.23
Havells India Limited Consumer Durables 2.11
PNC Infratech Limited Construction 2.11
Orient Refractories Limited Industrial Products 2.05
JK Paper Limited Paper 2.01
Eris Lifesciences Limited Pharmaceuticals 2.00
Kalpataru Power Transmission Limited Power 1.99
Kansai Nerolac Paints Limited Consumer Non Durables 1.98
Prakash Industries Limited Ferrous Metals 1.82
AIA Engineering Limited Industrial Products 1.77
HEG Limited Industrial Products 1.70
KNR Constructions Limited Construction 1.64
Greaves Cotton Limited Industrial Products 1.64
Kamdhenu Limited Ferrous Metals 1.62
Eicher Motors Limited Auto 1.60
Bhansali Engineering Polymers Limited Industrial Products 1.55
Ahluwalia Contracts (India) Limited Construction 1.55
Symphony Limited Consumer Durables 1.49
PSP Projects Limited Construction 1.45
IFB Industries Limited Consumer Durables 1.40
Gravita India Limited Minerals/Mining 1.37
Shankara Building Products Limited Ferrous Metals 1.20
Shakti Pumps (India) Limited Industrial Products 1.15
Astral Poly Technik Limited Industrial Products 1.06
Capacit'e Infraprojects Limited Construction 1.01
Abbott India Limited Pharmaceuticals 0.98
Siemens Limited Industrial Capital Goods 0.96
Honeywell Automation India Limited Industrial Capital Goods 0.93
Apollo Micro Systems Limited Industrial Capital Goods 0.92
KEI Industries Limited Industrial Products 0.92
Tata Motors Limited Auto 0.91
Torrent Power Limited Power 0.76
Brigade Enterprises Limited Construction 0.69
ABB India Limited Industrial Capital Goods 0.57
GPT Infraprojects Limited Construction 0.56
VA Tech Wabag Limited Engineering Services 0.51
Total 94.13
NON-CONVERTIBLE DEBENTURES
NTPC Limited CRISIL AAA 0.05
Total 0.05
Cash & Cash Equivalent
Net Receivables/Payables 0.51
TREPS / Reverse Repo Investments / Liquid Fund Investments 5.31
Total 5.82
GRAND TOTAL 100.00
All corporate ratings are assigned by rating agencies like CRISIL, CARE, ICRA, India Rating,
Brickwork.
EQUITY INDUSTRY ALLOCATION
INVESTMENT OBJECTIVE
The Scheme seeks to generate long term capital appreciation through a portfolio of predominantly equity and equity related securities of companies engaged in manufacturing and infrastructure related sectors. Further, there can be no assurance that the investment objectives of the scheme will be realized. The Scheme is not providing any assured or guaranteed returns.
WHO SHOULD INVEST
The Scheme would be more suitable for investors who are desirous of increasing their exposure to manufacturing & infrastructure sector in their personal equity portfolio. Thus, this Scheme could act as a "top up" over existing investments of such investors in diversified equity funds. However, for a first time investor, it might still be advisable to initially start his investment with a diversified equity fund.
BENCHMARK
S&P BSE India Manufacturing Total Return Index (TRI) - 50% & S&P BSE India Infrastructure Total Return Index (TRI) - 50%
DATE OF ALLOTMENT
March 05, 2010
FUND MANAGER
Alok Singh: (w.e.f. February 16, 2017) Around 18 years of experience, including 10 years in mutual fund industry.
AVERAGE AUM
` 45.27 Crs.
LATEST AUM
` 45.34 Crs.
MINIMUM APPLICATION AMOUNT (LUMPSUM)
Regular/ Direct Plan ` 5,000 and in multiples of ̀ 1
ADDITIONAL PURCHASE AMOUNT
Regular/ Direct Plan ` 1,000 and in multiples of ̀ 1
PORTFOLIO TURNOVER RATIO (As on November 30, 2018)# #0.33 Times ( Basis last rolling 12 months)
OTHER PARAMETERS (As on November 30, 2018)
Standard Deviation (Annualized): 17.59% (BOI AXA Manufacturing & Infrastructure Fund) 17.27% (S&P BSE India Manufacturing TRI - 50% & S&P BSE India Infrastructure TRI - 50%)Beta: 0.90Sharpe Ratio*: (0.08)Tracking Error (Annualized): 8.27%
Above ratios are calculated using 4 years history of monthly returns of the fund and the above Indices as the inception of S&P BSE Infrastructure Index is May 28, 2014.
*Risk-free rate assumed to be 6.55% (MIBOR as on November 30, 2018)
NAV (As on November 30, 2018) NAV (`)
Regular Plan Direct Plan
Growth 14.70 Growth 15.75Regular Dividend 12.03 Regular Dividend 14.88Quarterly Dividend 11.93 Quarterly Dividend 15.50
LOAD STRUCTURE (FOR ALL PLANS)
Entry Load NILExit Load • For redemption/switch out upto 10% of the initial units allotted -
within 1 year from the date of allotment: “NIL” • Any redemption/switch out - in excess of the above mentioned limit
would be subject to an exit load of 1%, if the units are redeemed/ switched out within 1 year from the date of allotment of units.
• If the units are redeemed/switched out after 1 year from the date of allotment of units : “Nil”
For Dividend History please refer page no. 15.For Scheme Performance please refer page no. 16 to 21.For month end Total Expense Ratio please refer page no. 22.
6
0.51%1.37%
1.98%2.01%2.25%
2.98%3.17%3.53%
4.12%5.61%5.83%6.22%
7.34%7.36%
8.22%14.51%
17.13%
Engineering ServicesMinerals/Mining
Consumer Non DurablesPaper
Auto AncillariesPharmaceuticals
ChemicalsTelecom - Equipment & Accessories
Petroleum ProductsConstruction Project
Industrial Capital GoodsAuto
PowerFerrous Metals
Consumer DurablesConstruction
Industrial Products
A
G
G
R
E
S
S
I
V
E
H
Y
B
R
I
D
F
U
N
D
INVESTMENT STYLE
Growth Blend Value
Small
Medium
Large
Mar
ket
Cap
ital
isat
ion
^For riskometer, refer Page 2.All data as on November 30, 2018 (Unless indicated otherwise)
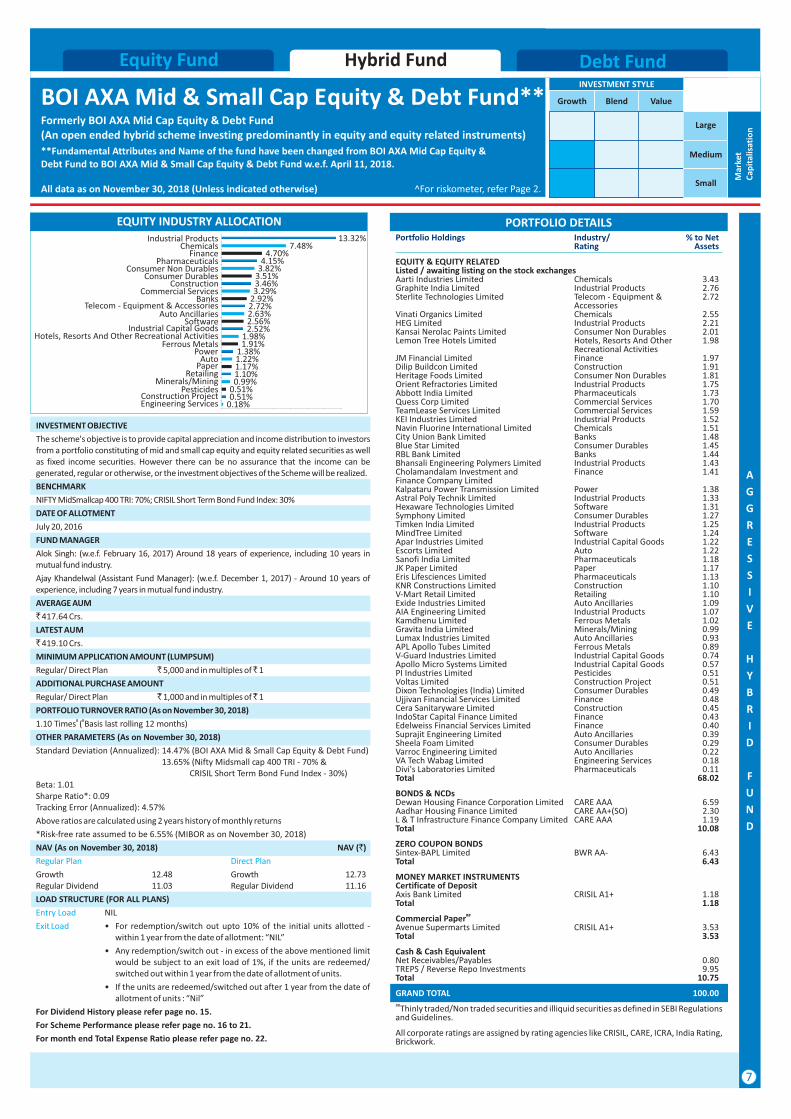
BOI AXA Mid & Small Cap Equity & Debt Fund**Formerly BOI AXA Mid Cap Equity & Debt Fund(An open ended hybrid scheme investing predominantly in equity and equity related instruments)
**Fundamental Attributes and Name of the fund have been changed from BOI AXA Mid Cap Equity & Debt Fund to BOI AXA Mid & Small Cap Equity & Debt Fund w.e.f. April 11, 2018.
Debt FundHybrid FundEquity Fund
PORTFOLIO DETAILSPortfolio Holdings Industry/ % to Net Rating Assets
EQUITY & EQUITY RELATED Listed / awaiting listing on the stock exchangesAarti Industries Limited Chemicals 3.43Graphite India Limited Industrial Products 2.76Sterlite Technologies Limited Telecom - Equipment & 2.72 Accessories Vinati Organics Limited Chemicals 2.55HEG Limited Industrial Products 2.21Kansai Nerolac Paints Limited Consumer Non Durables 2.01Lemon Tree Hotels Limited Hotels, Resorts And Other 1.98 Recreational Activities JM Financial Limited Finance 1.97Dilip Buildcon Limited Construction 1.91Heritage Foods Limited Consumer Non Durables 1.81Orient Refractories Limited Industrial Products 1.75Abbott India Limited Pharmaceuticals 1.73Quess Corp Limited Commercial Services 1.70TeamLease Services Limited Commercial Services 1.59KEI Industries Limited Industrial Products 1.52Navin Fluorine International Limited Chemicals 1.51City Union Bank Limited Banks 1.48Blue Star Limited Consumer Durables 1.45 RBL Bank Limited Banks 1.44Bhansali Engineering Polymers Limited Industrial Products 1.43Cholamandalam Investment and Finance 1.41Finance Company LimitedKalpataru Power Transmission Limited Power 1.38Astral Poly Technik Limited Industrial Products 1.33Hexaware Technologies Limited Software 1.31Symphony Limited Consumer Durables 1.27Timken India Limited Industrial Products 1.25MindTree Limited Software 1.24Apar Industries Limited Industrial Capital Goods 1.22Escorts Limited Auto 1.22Sanofi India Limited Pharmaceuticals 1.18JK Paper Limited Paper 1.17Eris Lifesciences Limited Pharmaceuticals 1.13KNR Constructions Limited Construction 1.10V-Mart Retail Limited Retailing 1.10Exide Industries Limited Auto Ancillaries 1.09AIA Engineering Limited Industrial Products 1.07Kamdhenu Limited Ferrous Metals 1.02Gravita India Limited Minerals/Mining 0.99Lumax Industries Limited Auto Ancillaries 0.93APL Apollo Tubes Limited Ferrous Metals 0.89V-Guard Industries Limited Industrial Capital Goods 0.74Apollo Micro Systems Limited Industrial Capital Goods 0.57PI Industries Limited Pesticides 0.51Voltas Limited Construction Project 0.51Dixon Technologies (India) Limited Consumer Durables 0.49Ujjivan Financial Services Limited Finance 0.48Cera Sanitaryware Limited Construction 0.45IndoStar Capital Finance Limited Finance 0.43Edelweiss Financial Services Limited Finance 0.40Suprajit Engineering Limited Auto Ancillaries 0.39Sheela Foam Limited Consumer Durables 0.29Varroc Engineering Limited Auto Ancillaries 0.22VA Tech Wabag Limited Engineering Services 0.18Divi's Laboratories Limited Pharmaceuticals 0.11Total 68.02
BONDS & NCDs Dewan Housing Finance Corporation Limited CARE AAA 6.59Aadhar Housing Finance Limited CARE AA+(SO) 2.30L & T Infrastructure Finance Company Limited CARE AAA 1.19Total 10.08
ZERO COUPON BONDSSintex-BAPL Limited BWR AA- 6.43Total 6.43
MONEY MARKET INSTRUMENTSCertificate of DepositAxis Bank Limited CRISIL A1+ 1.18Total 1.18
##Commercial Paper Avenue Supermarts Limited CRISIL A1+ 3.53Total 3.53
Cash & Cash Equivalent Net Receivables/Payables 0.80TREPS / Reverse Repo Investments 9.95Total 10.75
GRAND TOTAL 100.00 ##Thinly traded/Non traded securities and illiquid securities as defined in SEBI Regulations and Guidelines.
All corporate ratings are assigned by rating agencies like CRISIL, CARE, ICRA, India Rating, Brickwork.
INVESTMENT OBJECTIVE
The scheme's objective is to provide capital appreciation and income distribution to investors from a portfolio constituting of mid and small cap equity and equity related securities as well as fixed income securities. However there can be no assurance that the income can be generated, regular or otherwise, or the investment objectives of the Scheme will be realized.
BENCHMARK
NIFTY MidSmallcap 400 TRI: 70%; CRISIL Short Term Bond Fund Index: 30%
DATE OF ALLOTMENT
July 20, 2016
FUND MANAGER
Alok Singh: (w.e.f. February 16, 2017) Around 18 years of experience, including 10 years in mutual fund industry.
Ajay Khandelwal (Assistant Fund Manager): (w.e.f. December 1, 2017) - Around 10 years of experience, including 7 years in mutual fund industry.
AVERAGE AUM
` 417.64 Crs.
LATEST AUM
` 419.10 Crs.
MINIMUM APPLICATION AMOUNT (LUMPSUM)
Regular/ Direct Plan ` 5,000 and in multiples of ̀ 1
ADDITIONAL PURCHASE AMOUNT
Regular/ Direct Plan ` 1,000 and in multiples of ̀ 1
PORTFOLIO TURNOVER RATIO (As on November 30, 2018)# #1.10 Times ( Basis last rolling 12 months)
OTHER PARAMETERS (As on November 30, 2018)
Standard Deviation (Annualized): 14.47% (BOI AXA Mid & Small Cap Equity & Debt Fund) 13.65% (Nifty Midsmall cap 400 TRI - 70% & CRISIL Short Term Bond Fund Index - 30%)Beta: 1.01Sharpe Ratio*: 0.09Tracking Error (Annualized): 4.57%
Above ratios are calculated using 2 years history of monthly returns
*Risk-free rate assumed to be 6.55% (MIBOR as on November 30, 2018)
NAV (As on November 30, 2018) NAV (`)
Regular Plan Direct Plan
Growth 12.48 Growth 12.73Regular Dividend 11.03 Regular Dividend 11.16
LOAD STRUCTURE (FOR ALL PLANS)
Entry Load NIL
Exit Load • For redemption/switch out upto 10% of the initial units allotted -within 1 year from the date of allotment: “NIL”
• Any redemption/switch out - in excess of the above mentioned limit would be subject to an exit load of 1%, if the units are redeemed/ switched out within 1 year from the date of allotment of units.
• If the units are redeemed/switched out after 1 year from the date of allotment of units : “Nil”
For Dividend History please refer page no. 15.
For Scheme Performance please refer page no. 16 to 21.
For month end Total Expense Ratio please refer page no. 22.
EQUITY INDUSTRY ALLOCATION
7
0.18%0.51%0.51%0.99%1.10%1.17%1.22%1.38%
1.91%1.98%
2.52%2.56%2.63%2.72%2.92%3.29%3.46%3.51%3.82%4.15%
4.70%7.48%
13.32%
Engineering ServicesConstruction Project
PesticidesMinerals/Mining
RetailingPaperAuto
PowerFerrous Metals
Hotels, Resorts And Other Recreational ActivitiesIndustrial Capital Goods
SoftwareAuto Ancillaries
Telecom - Equipment & AccessoriesBanks
Commercial ServicesConstruction
Consumer DurablesConsumer Non Durables
PharmaceuticalsFinance
ChemicalsIndustrial Products
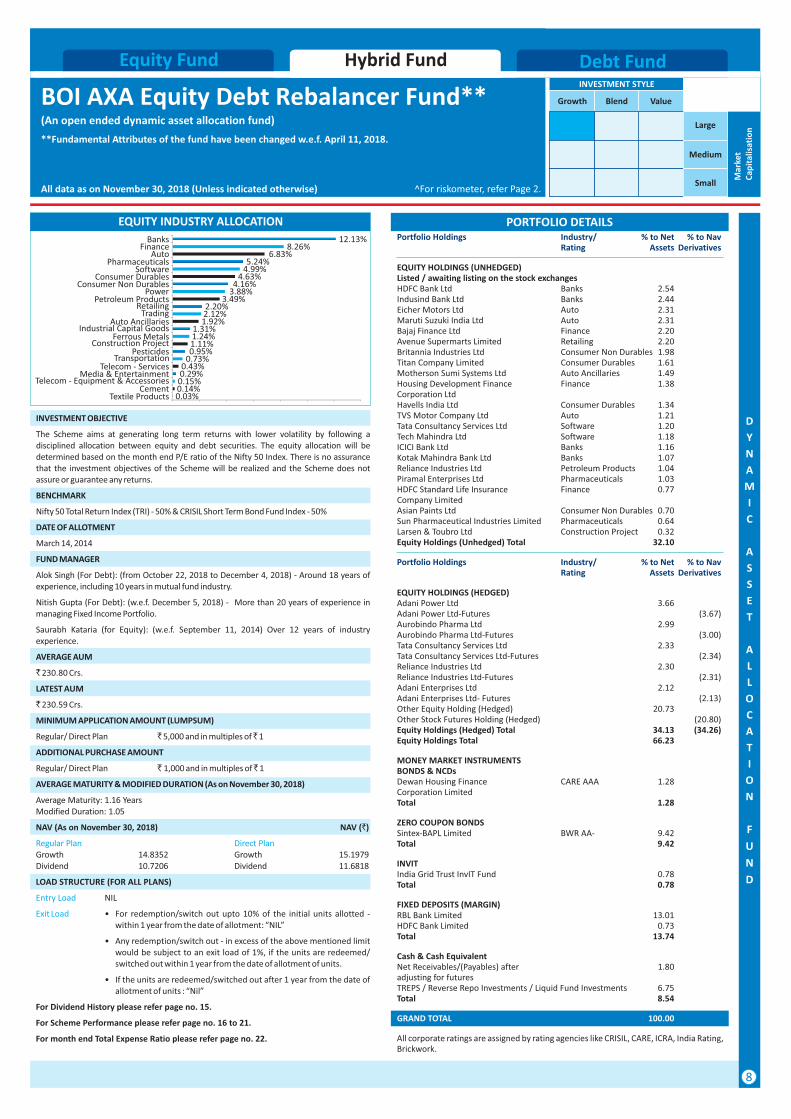
0.03%0.14%0.15%0.29%0.43%
0.73%0.95%1.11%1.24%1.31%
1.92%2.12%2.20%
3.49%3.88%4.16%
4.63%4.99%5.24%
6.83%8.26%
12.13%
Textile ProductsCement
Telecom - Equipment & AccessoriesMedia & Entertainment
Telecom - ServicesTransportation
PesticidesConstruction Project
Ferrous MetalsIndustrial Capital Goods
Auto AncillariesTrading
RetailingPetroleum Products
PowerConsumer Non Durables
Consumer DurablesSoftware
PharmaceuticalsAuto
FinanceBanks
D
Y
N
A
M
I
C
A
S
S
E
T
A
L
L
O
C
A
T
I
O
N
F
U
N
D
INVESTMENT STYLE
Growth Blend Value
Small
Medium
Large
Mar
ket
Cap
ital
isat
ion
^For riskometer, refer Page 2.All data as on November 30, 2018 (Unless indicated otherwise)
BOI AXA Equity Debt Rebalancer Fund**(An open ended dynamic asset allocation fund)
**Fundamental Attributes of the fund have been changed w.e.f. April 11, 2018.
Debt FundHybrid FundEquity Fund
EQUITY INDUSTRY ALLOCATION PORTFOLIO DETAILSPortfolio Holdings Industry/ % to Net % to Nav Rating Assets Derivatives
EQUITY HOLDINGS (UNHEDGED)Listed / awaiting listing on the stock exchangesHDFC Bank Ltd Banks 2.54Indusind Bank Ltd Banks 2.44Eicher Motors Ltd Auto 2.31Maruti Suzuki India Ltd Auto 2.31Bajaj Finance Ltd Finance 2.20Avenue Supermarts Limited Retailing 2.20Britannia Industries Ltd Consumer Non Durables 1.98Titan Company Limited Consumer Durables 1.61Motherson Sumi Systems Ltd Auto Ancillaries 1.49Housing Development Finance Finance 1.38Corporation LtdHavells India Ltd Consumer Durables 1.34TVS Motor Company Ltd Auto 1.21Tata Consultancy Services Ltd Software 1.20Tech Mahindra Ltd Software 1.18ICICI Bank Ltd Banks 1.16Kotak Mahindra Bank Ltd Banks 1.07Reliance Industries Ltd Petroleum Products 1.04Piramal Enterprises Ltd Pharmaceuticals 1.03HDFC Standard Life Insurance Finance 0.77Company LimitedAsian Paints Ltd Consumer Non Durables 0.70Sun Pharmaceutical Industries Limited Pharmaceuticals 0.64Larsen & Toubro Ltd Construction Project 0.32Equity Holdings (Unhedged) Total 32.10
Portfolio Holdings Industry/ % to Net % to Nav Rating Assets Derivatives
EQUITY HOLDINGS (HEDGED)Adani Power Ltd 3.66 Adani Power Ltd-Futures (3.67)Aurobindo Pharma Ltd 2.99 Aurobindo Pharma Ltd-Futures (3.00)Tata Consultancy Services Ltd 2.33 Tata Consultancy Services Ltd-Futures (2.34)Reliance Industries Ltd 2.30 Reliance Industries Ltd-Futures (2.31)Adani Enterprises Ltd 2.12 Adani Enterprises Ltd- Futures (2.13)Other Equity Holding (Hedged) 20.73Other Stock Futures Holding (Hedged) (20.80)Equity Holdings (Hedged) Total 34.13 (34.26)Equity Holdings Total 66.23
MONEY MARKET INSTRUMENTSBONDS & NCDs Dewan Housing Finance CARE AAA 1.28Corporation LimitedTotal 1.28
ZERO COUPON BONDSSintex-BAPL Limited BWR AA- 9.42Total 9.42
INVITIndia Grid Trust InvIT Fund 0.78Total 0.78
FIXED DEPOSITS (MARGIN) RBL Bank Limited 13.01HDFC Bank Limited 0.73Total 13.74
Cash & Cash Equivalent Net Receivables/(Payables) after 1.80adjusting for futures TREPS / Reverse Repo Investments / Liquid Fund Investments 6.75Total 8.54
GRAND TOTAL 100.00
All corporate ratings are assigned by rating agencies like CRISIL, CARE, ICRA, India Rating, Brickwork.
INVESTMENT OBJECTIVE
The Scheme aims at generating long term returns with lower volatility by following a disciplined allocation between equity and debt securities. The equity allocation will be determined based on the month end P/E ratio of the Nifty 50 Index. There is no assurance that the investment objectives of the Scheme will be realized and the Scheme does not assure or guarantee any returns.
BENCHMARK
Nifty 50 Total Return Index (TRI) - 50% & CRISIL Short Term Bond Fund Index - 50%
DATE OF ALLOTMENT
March 14, 2014
FUND MANAGER
Alok Singh (For Debt): (from October 22, 2018 to December 4, 2018) - Around 18 years of experience, including 10 years in mutual fund industry.
Nitish Gupta (For Debt): (w.e.f. December 5, 2018) - More than 20 years of experience in managing Fixed Income Portfolio.
Saurabh Kataria (for Equity): (w.e.f. September 11, 2014) Over 12 years of industry experience.
AVERAGE AUM
` 230.80 Crs.
LATEST AUM
` 230.59 Crs.
MINIMUM APPLICATION AMOUNT (LUMPSUM)
Regular/ Direct Plan ` 5,000 and in multiples of ̀ 1
ADDITIONAL PURCHASE AMOUNT
Regular/ Direct Plan ` 1,000 and in multiples of ̀ 1
AVERAGE MATURITY & MODIFIED DURATION (As on November 30, 2018)
Average Maturity: 1.16 YearsModified Duration: 1.05
NAV (As on November 30, 2018) NAV (`)
Regular Plan Direct PlanGrowth 14.8352 Growth 15.1979Dividend 10.7206 Dividend 11.6818
LOAD STRUCTURE (FOR ALL PLANS)
Entry Load NIL
Exit Load • For redemption/switch out upto 10% of the initial units allotted -within 1 year from the date of allotment: “NIL”
• Any redemption/switch out - in excess of the above mentioned limit would be subject to an exit load of 1%, if the units are redeemed/ switched out within 1 year from the date of allotment of units.
• If the units are redeemed/switched out after 1 year from the date of allotment of units : “Nil”
For Dividend History please refer page no. 15.
For Scheme Performance please refer page no. 16 to 21.
For month end Total Expense Ratio please refer page no. 22.
8
C
O
N
S
E
R
V
A
T
I
V
E
H
Y
B
R
I
D
F
U
N
D
INVESTMENT STYLE
Growth Blend Value
Small
Medium
Large
Mar
ket
Cap
ital
isat
ion
^For riskometer, refer Page 2.All data as on November 30, 2018 (Unless indicated otherwise)
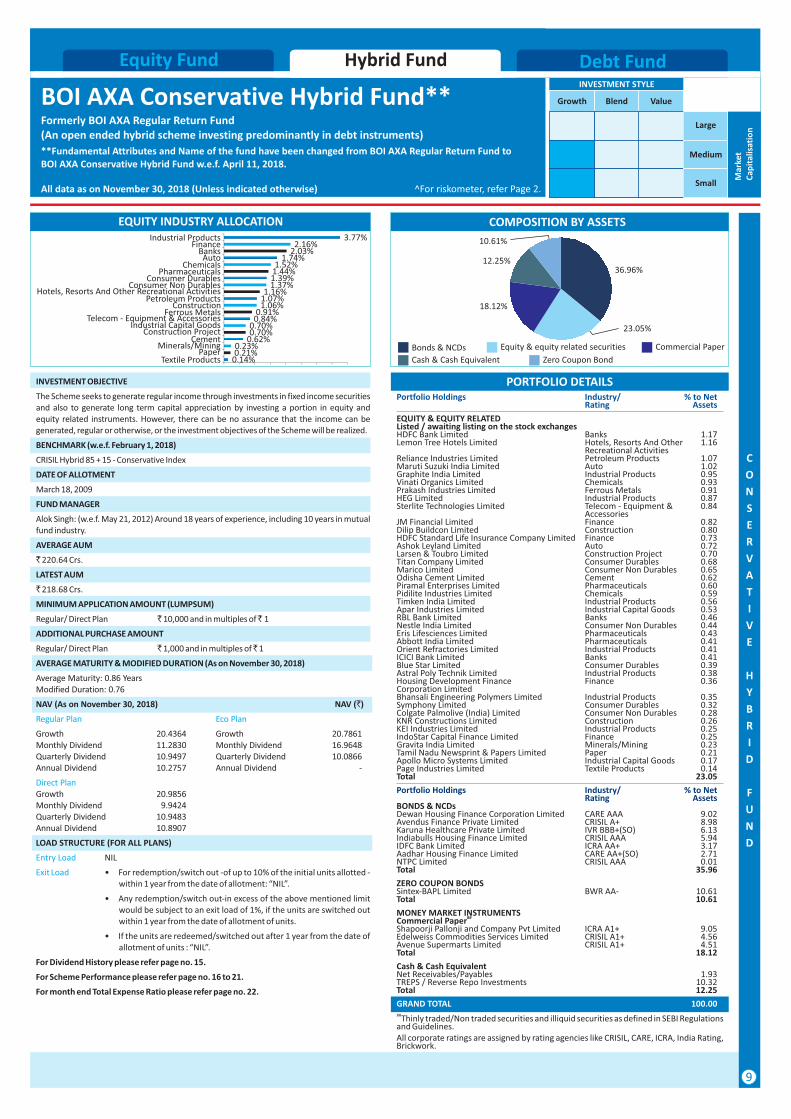
BOI AXA Conservative Hybrid Fund**Formerly BOI AXA Regular Return Fund(An open ended hybrid scheme investing predominantly in debt instruments)
**Fundamental Attributes and Name of the fund have been changed from BOI AXA Regular Return Fund to BOI AXA Conservative Hybrid Fund w.e.f. April 11, 2018.
Debt FundHybrid FundEquity Fund
PORTFOLIO DETAILSPortfolio Holdings Industry/ % to Net Rating Assets
EQUITY & EQUITY RELATEDListed / awaiting listing on the stock exchangesHDFC Bank Limited Banks 1.17Lemon Tree Hotels Limited Hotels, Resorts And Other 1.16 Recreational ActivitiesReliance Industries Limited Petroleum Products 1.07Maruti Suzuki India Limited Auto 1.02Graphite India Limited Industrial Products 0.95Vinati Organics Limited Chemicals 0.93Prakash Industries Limited Ferrous Metals 0.91HEG Limited Industrial Products 0.87Sterlite Technologies Limited Telecom - Equipment & 0.84 Accessories JM Financial Limited Finance 0.82Dilip Buildcon Limited Construction 0.80HDFC Standard Life Insurance Company Limited Finance 0.73Ashok Leyland Limited Auto 0.72Larsen & Toubro Limited Construction Project 0.70Titan Company Limited Consumer Durables 0.68Marico Limited Consumer Non Durables 0.65Odisha Cement Limited Cement 0.62Piramal Enterprises Limited Pharmaceuticals 0.60Pidilite Industries Limited Chemicals 0.59Timken India Limited Industrial Products 0.56Apar Industries Limited Industrial Capital Goods 0.53RBL Bank Limited Banks 0.46Nestle India Limited Consumer Non Durables 0.44Eris Lifesciences Limited Pharmaceuticals 0.43Abbott India Limited Pharmaceuticals 0.41Orient Refractories Limited Industrial Products 0.41ICICI Bank Limited Banks 0.41Blue Star Limited Consumer Durables 0.39Astral Poly Technik Limited Industrial Products 0.38Housing Development Finance Finance 0.36Corporation LimitedBhansali Engineering Polymers Limited Industrial Products 0.35Symphony Limited Consumer Durables 0.32Colgate Palmolive (India) Limited Consumer Non Durables 0.28KNR Constructions Limited Construction 0.26KEI Industries Limited Industrial Products 0.25IndoStar Capital Finance Limited Finance 0.25Gravita India Limited Minerals/Mining 0.23Tamil Nadu Newsprint & Papers Limited Paper 0.21Apollo Micro Systems Limited Industrial Capital Goods 0.17Page Industries Limited Textile Products 0.14Total 23.05
Portfolio Holdings Industry/ % to Net Rating Assets BONDS & NCDs Dewan Housing Finance Corporation Limited CARE AAA 9.02Avendus Finance Private Limited CRISIL A+ 8.98Karuna Healthcare Private Limited IVR BBB+(SO) 6.13Indiabulls Housing Finance Limited CRISIL AAA 5.94IDFC Bank Limited ICRA AA+ 3.17Aadhar Housing Finance Limited CARE AA+(SO) 2.71NTPC Limited CRISIL AAA 0.01Total 35.96
ZERO COUPON BONDSSintex-BAPL Limited BWR AA- 10.61Total 10.61
MONEY MARKET INSTRUMENTS ##Commercial Paper
Shapoorji Pallonji and Company Pvt Limited ICRA A1+ 9.05Edelweiss Commodities Services Limited CRISIL A1+ 4.56Avenue Supermarts Limited CRISIL A1+ 4.51Total 18.12
Cash & Cash Equivalent Net Receivables/Payables 1.93TREPS / Reverse Repo Investments 10.32Total 12.25
GRAND TOTAL 100.00##Thinly traded/Non traded securities and illiquid securities as defined in SEBI Regulations and Guidelines.All corporate ratings are assigned by rating agencies like CRISIL, CARE, ICRA, India Rating, Brickwork.
36.96%12.25%
COMPOSITION BY ASSETSEQUITY INDUSTRY ALLOCATION
INVESTMENT OBJECTIVE
The Scheme seeks to generate regular income through investments in fixed income securities and also to generate long term capital appreciation by investing a portion in equity and equity related instruments. However, there can be no assurance that the income can be generated, regular or otherwise, or the investment objectives of the Scheme will be realized.
BENCHMARK (w.e.f. February 1, 2018)
CRISIL Hybrid 85 + 15 - Conservative Index
DATE OF ALLOTMENT
March 18, 2009
FUND MANAGER
Alok Singh: (w.e.f. May 21, 2012) Around 18 years of experience, including 10 years in mutual fund industry.
AVERAGE AUM
` 220.64 Crs.
LATEST AUM
` 218.68 Crs.
MINIMUM APPLICATION AMOUNT (LUMPSUM)
Regular/ Direct Plan ` 10,000 and in multiples of ̀ 1
ADDITIONAL PURCHASE AMOUNT
Regular/ Direct Plan ` 1,000 and in multiples of ̀ 1
AVERAGE MATURITY & MODIFIED DURATION (As on November 30, 2018)
Average Maturity: 0.86 YearsModified Duration: 0.76
NAV (As on November 30, 2018) NAV (`)
Regular Plan Eco Plan
Growth 20.4364 Growth 20.7861Monthly Dividend 11.2830 Monthly Dividend 16.9648Quarterly Dividend 10.9497 Quarterly Dividend 10.0866Annual Dividend 10.2757 Annual Dividend -
Direct PlanGrowth 20.9856Monthly Dividend 9.9424Quarterly Dividend 10.9483Annual Dividend 10.8907
LOAD STRUCTURE (FOR ALL PLANS)
Entry Load NIL
Exit Load • For redemption/switch out -of up to 10% of the initial units allotted - within 1 year from the date of allotment: “NIL”.
• Any redemption/switch out-in excess of the above mentioned limit would be subject to an exit load of 1%, if the units are switched out within 1 year from the date of allotment of units.
• If the units are redeemed/switched out after 1 year from the date of allotment of units : “NIL”.
For Dividend History please refer page no. 15.
For Scheme Performance please refer page no. 16 to 21.
For month end Total Expense Ratio please refer page no. 22.
Zero Coupon Bond
Bonds & NCDs Equity & equity related securities
Cash & Cash Equivalent
23.05%
10.61%
9
0.14%0.21%0.23%
0.62%0.70%0.70%
0.84%0.91%
1.06%1.07%1.16%
1.37%1.39%1.44%1.52%
1.74%2.03%2.16%
3.77%
Textile ProductsPaper
Minerals/MiningCement
Construction ProjectIndustrial Capital Goods
Telecom - Equipment & AccessoriesFerrous Metals
ConstructionPetroleum Products
Hotels, Resorts And Other Recreational ActivitiesConsumer Non Durables
Consumer DurablesPharmaceuticals
ChemicalsAuto
BanksFinance
Industrial Products
Commercial Paper
18.12%
Debt FundHybrid FundEquity Fund
A
R
B
I
T
R
A
G
E
F
U
N
D
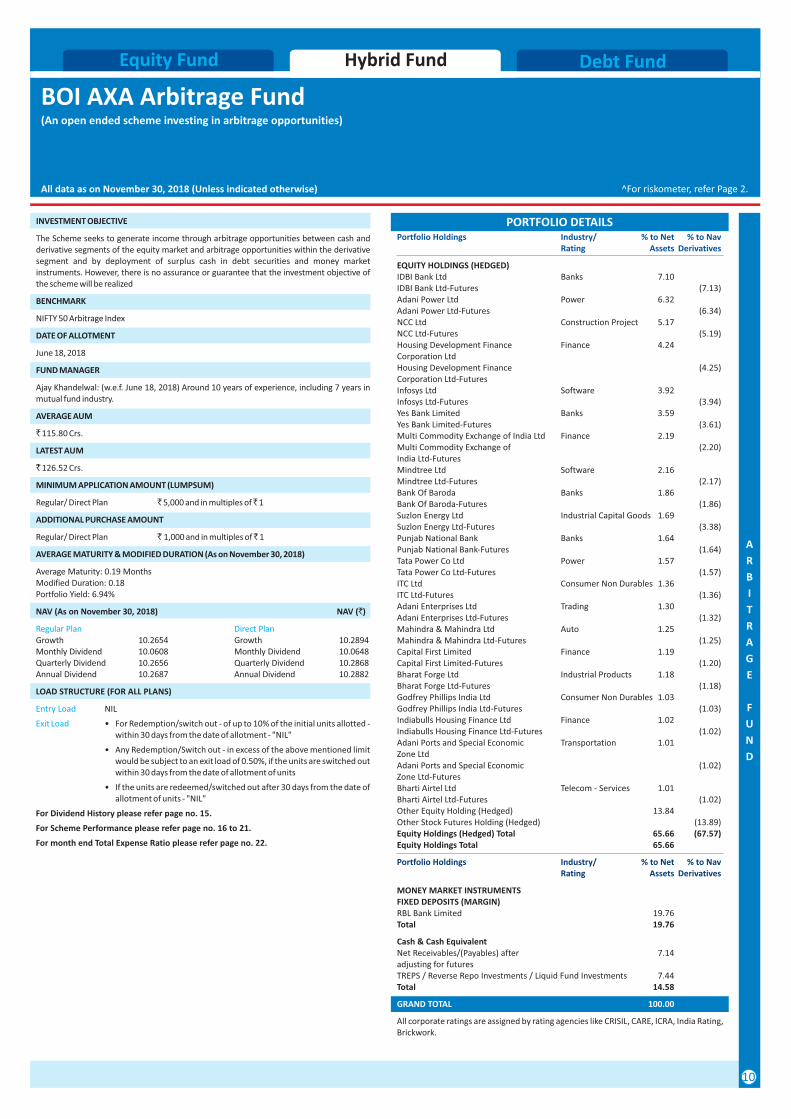
PORTFOLIO DETAILSPortfolio Holdings Industry/ % to Net % to Nav Rating Assets Derivatives
EQUITY HOLDINGS (HEDGED)IDBI Bank Ltd Banks 7.10 IDBI Bank Ltd-Futures (7.13)Adani Power Ltd Power 6.32 Adani Power Ltd-Futures (6.34)NCC Ltd Construction Project 5.17 NCC Ltd-Futures (5.19)Housing Development Finance Finance 4.24 Corporation LtdHousing Development Finance (4.25)Corporation Ltd-Futures Infosys Ltd Software 3.92 Infosys Ltd-Futures (3.94)Yes Bank Limited Banks 3.59 Yes Bank Limited-Futures (3.61)Multi Commodity Exchange of India Ltd Finance 2.19 Multi Commodity Exchange of (2.20)India Ltd-Futures Mindtree Ltd Software 2.16 Mindtree Ltd-Futures (2.17)Bank Of Baroda Banks 1.86 Bank Of Baroda-Futures (1.86)Suzlon Energy Ltd Industrial Capital Goods 1.69 Suzlon Energy Ltd-Futures (3.38)Punjab National Bank Banks 1.64 Punjab National Bank-Futures (1.64)Tata Power Co Ltd Power 1.57 Tata Power Co Ltd-Futures (1.57)ITC Ltd Consumer Non Durables 1.36 ITC Ltd-Futures (1.36)Adani Enterprises Ltd Trading 1.30 Adani Enterprises Ltd-Futures (1.32)Mahindra & Mahindra Ltd Auto 1.25 Mahindra & Mahindra Ltd-Futures (1.25)Capital First Limited Finance 1.19 Capital First Limited-Futures (1.20)Bharat Forge Ltd Industrial Products 1.18 Bharat Forge Ltd-Futures (1.18)Godfrey Phillips India Ltd Consumer Non Durables 1.03 Godfrey Phillips India Ltd-Futures (1.03)Indiabulls Housing Finance Ltd Finance 1.02 Indiabulls Housing Finance Ltd-Futures (1.02)Adani Ports and Special Economic Transportation 1.01 Zone Ltd Adani Ports and Special Economic (1.02)Zone Ltd-Futures Bharti Airtel Ltd Telecom - Services 1.01 Bharti Airtel Ltd-Futures (1.02)Other Equity Holding (Hedged) 13.84Other Stock Futures Holding (Hedged) (13.89)Equity Holdings (Hedged) Total 65.66 (67.57)Equity Holdings Total 65.66
Portfolio Holdings Industry/ % to Net % to Nav Rating Assets Derivatives
MONEY MARKET INSTRUMENTSFIXED DEPOSITS (MARGIN) RBL Bank Limited 19.76Total 19.76
Cash & Cash Equivalent Net Receivables/(Payables) after 7.14adjusting for futures TREPS / Reverse Repo Investments / Liquid Fund Investments 7.44Total 14.58
GRAND TOTAL 100.00
All corporate ratings are assigned by rating agencies like CRISIL, CARE, ICRA, India Rating, Brickwork.
INVESTMENT OBJECTIVE
The Scheme seeks to generate income through arbitrage opportunities between cash and derivative segments of the equity market and arbitrage opportunities within the derivative segment and by deployment of surplus cash in debt securities and money market instruments. However, there is no assurance or guarantee that the investment objective of the scheme will be realized
BENCHMARK
NIFTY 50 Arbitrage Index
DATE OF ALLOTMENT
June 18, 2018
FUND MANAGER
Ajay Khandelwal: (w.e.f. June 18, 2018) Around 10 years of experience, including 7 years in mutual fund industry.
AVERAGE AUM
` 115.80 Crs.
LATEST AUM
` 126.52 Crs.
MINIMUM APPLICATION AMOUNT (LUMPSUM)
Regular/ Direct Plan ` 5,000 and in multiples of ̀ 1
ADDITIONAL PURCHASE AMOUNT
Regular/ Direct Plan ` 1,000 and in multiples of ̀ 1
AVERAGE MATURITY & MODIFIED DURATION (As on November 30, 2018)
Average Maturity: 0.19 MonthsModified Duration: 0.18Portfolio Yield: 6.94%
NAV (As on November 30, 2018) NAV (`)
Regular Plan Direct PlanGrowth 10.2654 Growth 10.2894Monthly Dividend 10.0608 Monthly Dividend 10.0648Quarterly Dividend 10.2656 Quarterly Dividend 10.2868Annual Dividend 10.2687 Annual Dividend 10.2882
LOAD STRUCTURE (FOR ALL PLANS)
Entry Load NIL
Exit Load • For Redemption/switch out - of up to 10% of the initial units allotted -within 30 days from the date of allotment - "NIL"
• Any Redemption/Switch out - in excess of the above mentioned limit would be subject to an exit load of 0.50%, if the units are switched out within 30 days from the date of allotment of units
• If the units are redeemed/switched out after 30 days from the date of allotment of units - "NIL"
For Dividend History please refer page no. 15.
For Scheme Performance please refer page no. 16 to 21.
For month end Total Expense Ratio please refer page no. 22.
^For riskometer, refer Page 2.All data as on November 30, 2018 (Unless indicated otherwise)
BOI AXA Arbitrage Fund(An open ended scheme investing in arbitrage opportunities)
10
11
CREDIT QUALITY
High Medium Low
Low
Medium
High
Inte
rest
Rat
eSe
nsi
tivi
ty
C
R
E
D
I
T
R
I
S
K
F
U
N
D
^For riskometer, refer Page 2.All data as on November 30, 2018 (Unless indicated otherwise)
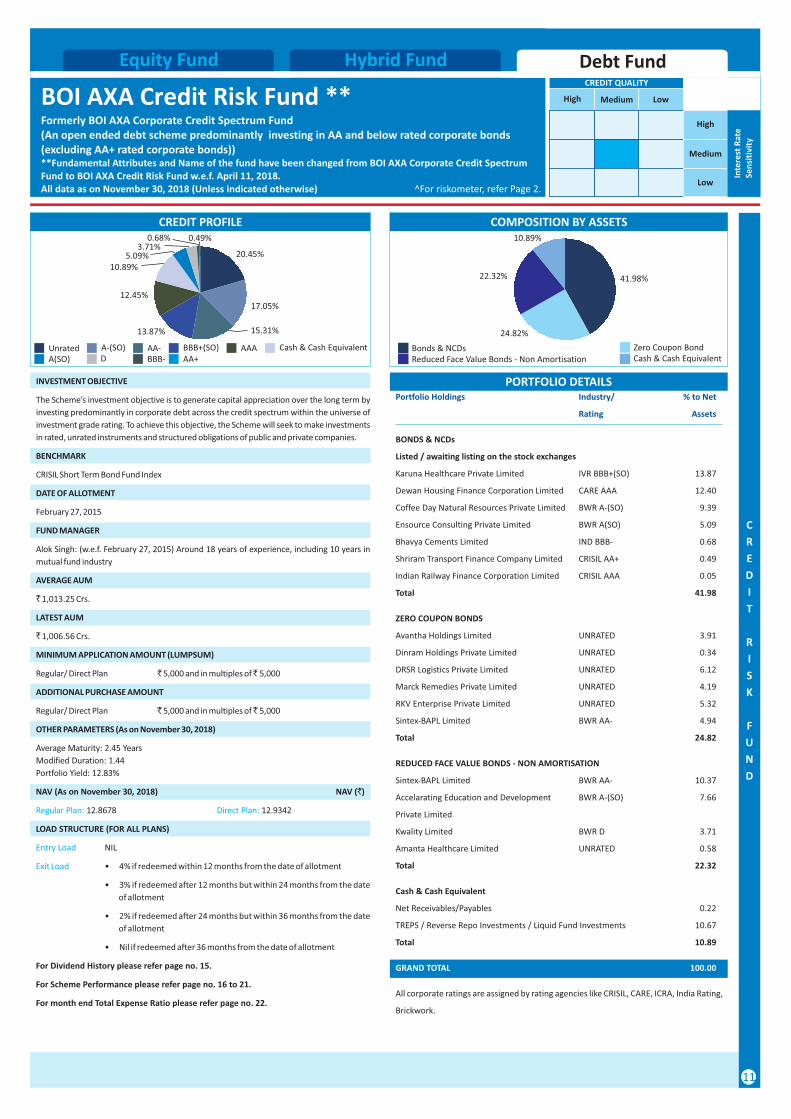
BOI AXA Credit Risk Fund **Formerly BOI AXA Corporate Credit Spectrum Fund(An open ended debt scheme predominantly investing in AA and below rated corporate bonds (excluding AA+ rated corporate bonds))**Fundamental Attributes and Name of the fund have been changed from BOI AXA Corporate Credit Spectrum Fund to BOI AXA Credit Risk Fund w.e.f. April 11, 2018.
Debt FundHybrid FundEquity Fund
PORTFOLIO DETAILS
CREDIT PROFILE
INVESTMENT OBJECTIVE
The Scheme’s investment objective is to generate capital appreciation over the long term by
investing predominantly in corporate debt across the credit spectrum within the universe of
investment grade rating. To achieve this objective, the Scheme will seek to make investments
in rated, unrated instruments and structured obligations of public and private companies.
BENCHMARK
CRISIL Short Term Bond Fund Index
DATE OF ALLOTMENT
February 27, 2015
FUND MANAGER
Alok Singh: (w.e.f. February 27, 2015) Around 18 years of experience, including 10 years in
mutual fund industry
AVERAGE AUM
` 1,013.25 Crs.
LATEST AUM
` 1,006.56 Crs.
MINIMUM APPLICATION AMOUNT (LUMPSUM)
Regular/ Direct Plan ` 5,000 and in multiples of ̀ 5,000
ADDITIONAL PURCHASE AMOUNT
Regular/ Direct Plan ` 5,000 and in multiples of ̀ 5,000
OTHER PARAMETERS (As on November 30, 2018)
Average Maturity: 2.45 Years
Modified Duration: 1.44
Portfolio Yield: 12.83%
NAV (As on November 30, 2018) NAV (`)
Regular Plan: Direct Plan: 12.8678 12.9342
LOAD STRUCTURE (FOR ALL PLANS)
Entry Load NIL
Exit Load • 4% if redeemed within 12 months from the date of allotment
• 3% if redeemed after 12 months but within 24 months from the date
of allotment
• 2% if redeemed after 24 months but within 36 months from the date
of allotment
• Nil if redeemed after 36 months from the date of allotment
For Dividend History please refer page no. 15.
For Scheme Performance please refer page no. 16 to 21.
For month end Total Expense Ratio please refer page no. 22.
COMPOSITION BY ASSETS
Portfolio Holdings Industry/ % to Net
Rating Assets
BONDS & NCDs
Listed / awaiting listing on the stock exchanges
Karuna Healthcare Private Limited IVR BBB+(SO) 13.87
Dewan Housing Finance Corporation Limited CARE AAA 12.40
Coffee Day Natural Resources Private Limited BWR A-(SO) 9.39
Ensource Consulting Private Limited BWR A(SO) 5.09
Bhavya Cements Limited IND BBB- 0.68
Shriram Transport Finance Company Limited CRISIL AA+ 0.49
Indian Railway Finance Corporation Limited CRISIL AAA 0.05
Total 41.98
ZERO COUPON BONDS
Avantha Holdings Limited UNRATED 3.91
Dinram Holdings Private Limited UNRATED 0.34
DRSR Logistics Private Limited UNRATED 6.12
Marck Remedies Private Limited UNRATED 4.19
RKV Enterprise Private Limited UNRATED 5.32
Sintex-BAPL Limited BWR AA- 4.94
Total 24.82
REDUCED FACE VALUE BONDS - NON AMORTISATION
Sintex-BAPL Limited BWR AA- 10.37
Accelarating Education and Development BWR A-(SO) 7.66
Private Limited
Kwality Limited BWR D 3.71
Amanta Healthcare Limited UNRATED 0.58
Total 22.32
Cash & Cash Equivalent
Net Receivables/Payables 0.22
TREPS / Reverse Repo Investments / Liquid Fund Investments 10.67
Total 10.89
GRAND TOTAL 100.00
All corporate ratings are assigned by rating agencies like CRISIL, CARE, ICRA, India Rating,
Brickwork.
A(SO) AA+BBB-Unrated A-(SO) AA- BBB+(SO) Cash & Cash Equivalent
DAAA
41.98%
10.89%
20.45%
17.05%
15.31%13.87%
12.45%
10.89%5.09%
3.71%0.68% 0.49%
24.82%
22.32%
Cash & Cash EquivalentBonds & NCDs Zero Coupon Bond
Reduced Face Value Bonds - Non Amortisation
S
H
O
R
T
D
U
R
A
T
I
O
N
F
U
N
D
12
CREDIT QUALITY
High Medium Low
Low
Medium
High
Inte
rest
Rat
eSe
nsi
tivi
ty
^For riskometer, refer Page 2.All data as on November 30, 2018 (Unless indicated otherwise)
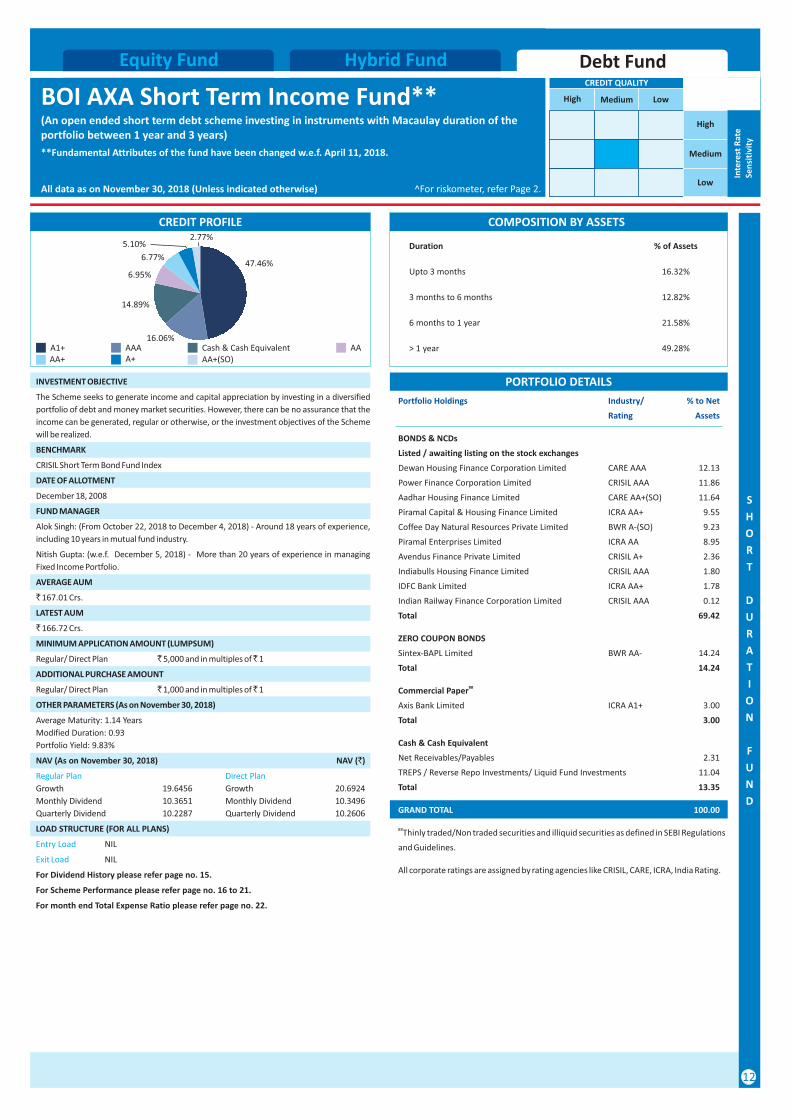
BOI AXA Short Term Income Fund**(An open ended short term debt scheme investing in instruments with Macaulay duration of the portfolio between 1 year and 3 years)
**Fundamental Attributes of the fund have been changed w.e.f. April 11, 2018.
Debt FundHybrid FundEquity Fund
Duration % of Assets
Upto 3 months 16.32%
3 months to 6 months 12.82%
6 months to 1 year 21.58%
> 1 year 49.28%
PORTFOLIO DETAILS
Portfolio Holdings Industry/ % to Net
Rating Assets
BONDS & NCDs
Listed / awaiting listing on the stock exchanges
Dewan Housing Finance Corporation Limited CARE AAA 12.13
Power Finance Corporation Limited CRISIL AAA 11.86
Aadhar Housing Finance Limited CARE AA+(SO) 11.64
Piramal Capital & Housing Finance Limited ICRA AA+ 9.55
Coffee Day Natural Resources Private Limited BWR A-(SO) 9.23
Piramal Enterprises Limited ICRA AA 8.95
Avendus Finance Private Limited CRISIL A+ 2.36
Indiabulls Housing Finance Limited CRISIL AAA 1.80
IDFC Bank Limited ICRA AA+ 1.78
Indian Railway Finance Corporation Limited CRISIL AAA 0.12
Total 69.42
ZERO COUPON BONDS
Sintex-BAPL Limited BWR AA- 14.24
Total 14.24
##Commercial Paper
Axis Bank Limited ICRA A1+ 3.00
Total 3.00
Cash & Cash Equivalent
Net Receivables/Payables 2.31
TREPS / Reverse Repo Investments/ Liquid Fund Investments 11.04
Total 13.35
GRAND TOTAL 100.00
##Thinly traded/Non traded securities and illiquid securities as defined in SEBI Regulations
and Guidelines.
All corporate ratings are assigned by rating agencies like CRISIL, CARE, ICRA, India Rating.
COMPOSITION BY ASSETS
INVESTMENT OBJECTIVE
The Scheme seeks to generate income and capital appreciation by investing in a diversified
portfolio of debt and money market securities. However, there can be no assurance that the
income can be generated, regular or otherwise, or the investment objectives of the Scheme
will be realized.
BENCHMARK
CRISIL Short Term Bond Fund Index
DATE OF ALLOTMENT
December 18, 2008
FUND MANAGER
Alok Singh: (From October 22, 2018 to December 4, 2018) - Around 18 years of experience,
including 10 years in mutual fund industry.
Nitish Gupta: (w.e.f. December 5, 2018) - More than 20 years of experience in managing
Fixed Income Portfolio.
AVERAGE AUM
` 167.01 Crs.
LATEST AUM
` 166.72 Crs.
MINIMUM APPLICATION AMOUNT (LUMPSUM)
Regular/ Direct Plan ` 5,000 and in multiples of ̀ 1
ADDITIONAL PURCHASE AMOUNT
Regular/ Direct Plan ` 1,000 and in multiples of ̀ 1
OTHER PARAMETERS (As on November 30, 2018)
Average Maturity: 1.14 Years
Modified Duration: 0.93
Portfolio Yield: 9.83%
NAV (As on November 30, 2018) NAV (`)
Regular Plan Direct Plan
Growth 19.6456 Growth 20.6924
Monthly Dividend 10.3651 Monthly Dividend 10.3496
Quarterly Dividend 10.2287 Quarterly Dividend 10.2606
LOAD STRUCTURE (FOR ALL PLANS)
Entry Load NIL
Exit Load NIL
For Dividend History please refer page no. 15.
For Scheme Performance please refer page no. 16 to 21.
For month end Total Expense Ratio please refer page no. 22.
CREDIT PROFILE
47.46%
16.06%
6.77%
2.77%5.10%
6.95%
A1+AA+
AAA Cash & Cash Equivalent AAAA+(SO)A+
14.89%
U
L
T
R
A
S
H
O
R
T
D
U
R
A
T
I
O
N
F
U
N
D
13
CREDIT QUALITY
High Medium Low
Low
Medium
High
Inte
rest
Rat
eSe
nsi
tivi
ty
^For riskometer, refer Page 2.All data as on November 30, 2018 (Unless indicated otherwise)
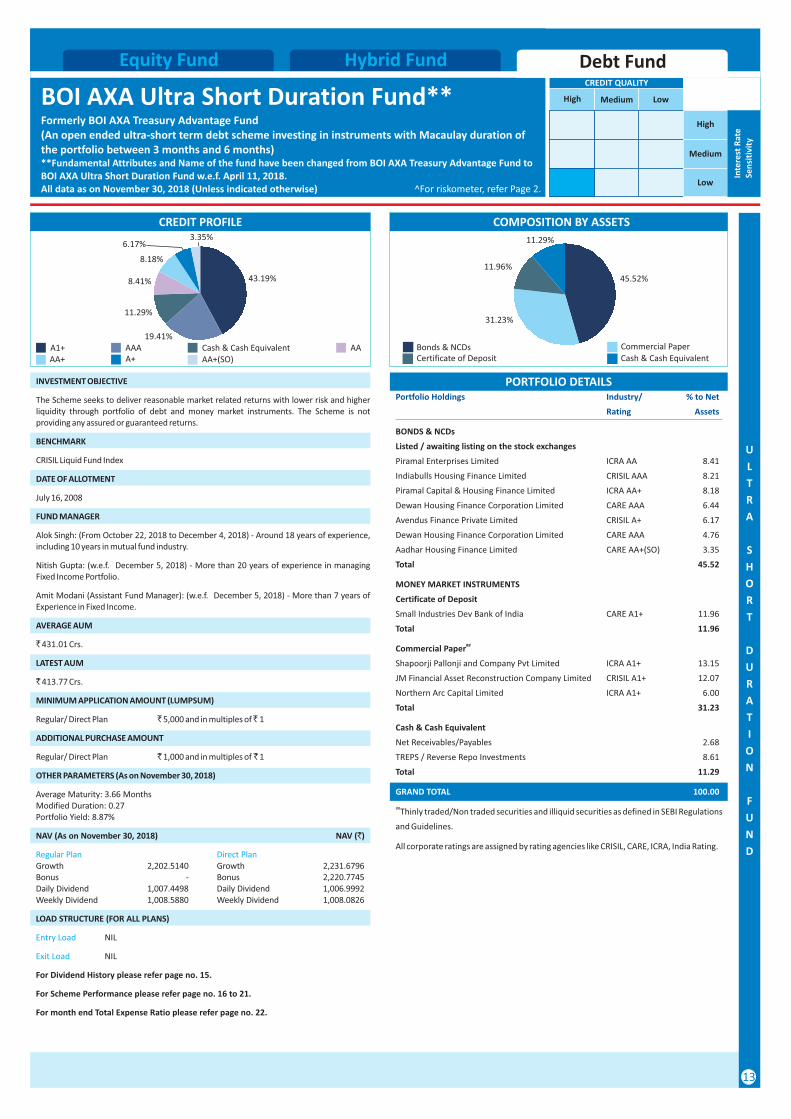
BOI AXA Ultra Short Duration Fund** Formerly BOI AXA Treasury Advantage Fund(An open ended ultra-short term debt scheme investing in instruments with Macaulay duration of the portfolio between 3 months and 6 months)**Fundamental Attributes and Name of the fund have been changed from BOI AXA Treasury Advantage Fund to BOI AXA Ultra Short Duration Fund w.e.f. April 11, 2018.
Debt FundHybrid FundEquity Fund
PORTFOLIO DETAILS
CREDIT PROFILE
43.19%
19.41%
8.18%
3.35%6.17%
8.41%
A1+AA+
AAA Cash & Cash Equivalent AAAA+(SO)
COMPOSITION BY ASSETS
45.52%
11.29%
11.96%
Cash & Cash EquivalentBonds & NCDs Commercial Paper
Certificate of Deposit
31.23%
INVESTMENT OBJECTIVE
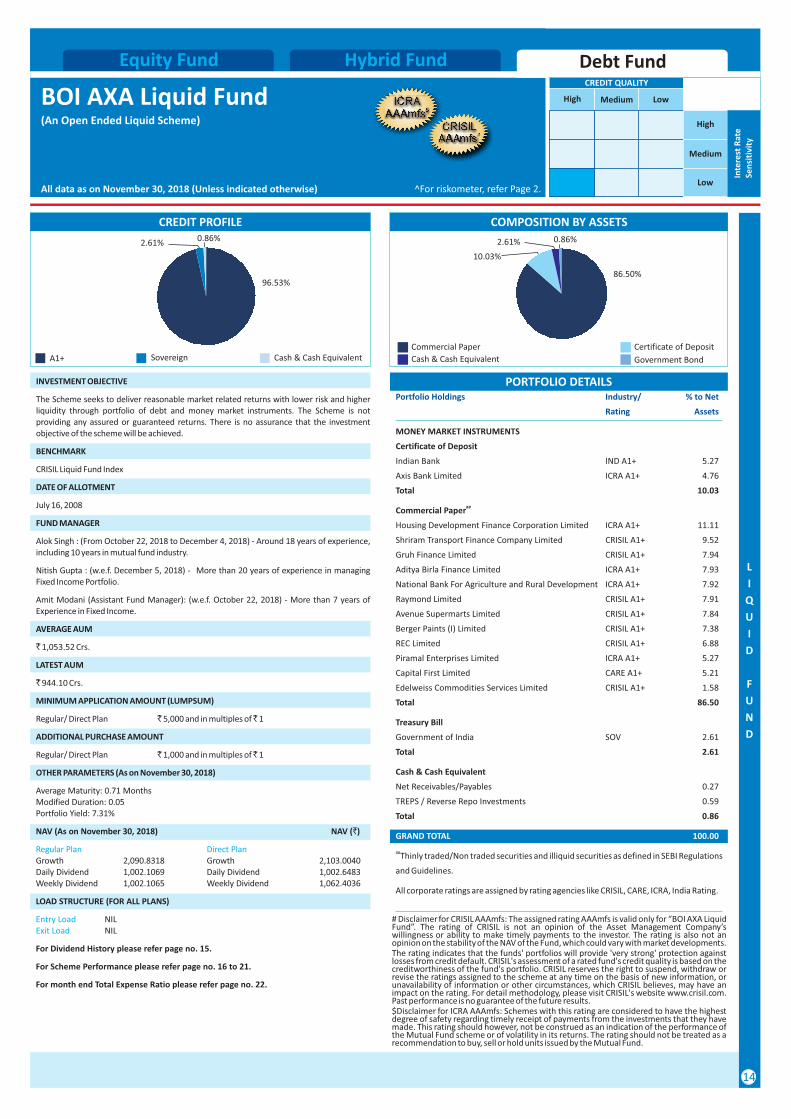
The Scheme seeks to deliver reasonable market related returns with lower risk and higher liquidity through portfolio of debt and money market instruments. The Scheme is not providing any assured or guaranteed returns.
BENCHMARK
CRISIL Liquid Fund Index
DATE OF ALLOTMENT
July 16, 2008
FUND MANAGER
Alok Singh: (From October 22, 2018 to December 4, 2018) - Around 18 years of experience, including 10 years in mutual fund industry.
Nitish Gupta: (w.e.f. December 5, 2018) - More than 20 years of experience in managing Fixed Income Portfolio.
Amit Modani (Assistant Fund Manager): (w.e.f. December 5, 2018) - More than 7 years of Experience in Fixed Income.
AVERAGE AUM
` 431.01 Crs.
LATEST AUM
` 413.77 Crs.
MINIMUM APPLICATION AMOUNT (LUMPSUM)
Regular/ Direct Plan ` 5,000 and in multiples of ̀ 1
ADDITIONAL PURCHASE AMOUNT
Regular/ Direct Plan ` 1,000 and in multiples of ̀ 1
OTHER PARAMETERS (As on November 30, 2018)
Average Maturity: 3.66 MonthsModified Duration: 0.27Portfolio Yield: 8.87%
NAV (As on November 30, 2018) NAV (`)
Regular Plan Direct PlanGrowth 2,202.5140 Growth 2,231.6796Bonus - Bonus 2,220.7745Daily Dividend 1,007.4498 Daily Dividend 1,006.9992Weekly Dividend 1,008.5880 Weekly Dividend 1,008.0826
LOAD STRUCTURE (FOR ALL PLANS)
Entry Load NIL
Exit Load NIL
For Dividend History please refer page no. 15.
For Scheme Performance please refer page no. 16 to 21.
For month end Total Expense Ratio please refer page no. 22.
Portfolio Holdings Industry/ % to Net
Rating Assets
BONDS & NCDs
Listed / awaiting listing on the stock exchanges
Piramal Enterprises Limited ICRA AA 8.41
Indiabulls Housing Finance Limited CRISIL AAA 8.21
Piramal Capital & Housing Finance Limited ICRA AA+ 8.18
Dewan Housing Finance Corporation Limited CARE AAA 6.44
Avendus Finance Private Limited CRISIL A+ 6.17
Dewan Housing Finance Corporation Limited CARE AAA 4.76
Aadhar Housing Finance Limited CARE AA+(SO) 3.35
Total 45.52
MONEY MARKET INSTRUMENTS
Certificate of Deposit
Small Industries Dev Bank of India CARE A1+ 11.96
Total 11.96
##Commercial Paper
Shapoorji Pallonji and Company Pvt Limited ICRA A1+ 13.15
JM Financial Asset Reconstruction Company Limited CRISIL A1+ 12.07
Northern Arc Capital Limited ICRA A1+ 6.00
Total 31.23
Cash & Cash Equivalent
Net Receivables/Payables 2.68
TREPS / Reverse Repo Investments 8.61
Total 11.29
GRAND TOTAL 100.00
##Thinly traded/Non traded securities and illiquid securities as defined in SEBI Regulations
and Guidelines.
All corporate ratings are assigned by rating agencies like CRISIL, CARE, ICRA, India Rating.
A+
11.29%
Debt FundHybrid FundEquity FundCREDIT QUALITY
High Medium Low
Low
Medium
High
Inte
rest
Rat
eSe
nsi
tivi
ty
^For riskometer, refer Page 2.All data as on November 30, 2018 (Unless indicated otherwise)
BOI AXA Liquid Fund(An Open Ended Liquid Scheme)
14
L
I
Q
U
I
D
F
U
N
D
# Disclaimer for CRISIL AAAmfs: The assigned rating AAAmfs is valid only for “BOI AXA Liquid Fund”. The rating of CRISIL is not an opinion of the Asset Management Company’s willingness or ability to make timely payments to the investor. The rating is also not an opinion on the stability of the NAV of the Fund, which could vary with market developments.The rating indicates that the funds' portfolios will provide 'very strong' protection against losses from credit default. CRISIL's assessment of a rated fund's credit quality is based on the creditworthiness of the fund's portfolio. CRISIL reserves the right to suspend, withdraw or revise the ratings assigned to the scheme at any time on the basis of new information, or unavailability of information or other circumstances, which CRISIL believes, may have an impact on the rating. For detail methodology, please visit CRISIL's website www.crisil.com. Past performance is no guarantee of the future results.$Disclaimer for ICRA AAAmfs: Schemes with this rating are considered to have the highest degree of safety regarding timely receipt of payments from the investments that they have made. This rating should however, not be construed as an indication of the performance of the Mutual Fund scheme or of volatility in its returns. The rating should not be treated as a recommendation to buy, sell or hold units issued by the Mutual Fund.
PORTFOLIO DETAILSPortfolio Holdings Industry/ % to Net
Rating Assets
MONEY MARKET INSTRUMENTS
Certificate of Deposit
Indian Bank IND A1+ 5.27
Axis Bank Limited ICRA A1+ 4.76
Total 10.03
##Commercial Paper
Housing Development Finance Corporation Limited ICRA A1+ 11.11
Shriram Transport Finance Company Limited CRISIL A1+ 9.52
Gruh Finance Limited CRISIL A1+ 7.94
Aditya Birla Finance Limited ICRA A1+ 7.93
National Bank For Agriculture and Rural Development ICRA A1+ 7.92
Raymond Limited CRISIL A1+ 7.91
Avenue Supermarts Limited CRISIL A1+ 7.84
Berger Paints (I) Limited CRISIL A1+ 7.38
REC Limited CRISIL A1+ 6.88
Piramal Enterprises Limited ICRA A1+ 5.27
Capital First Limited CARE A1+ 5.21
Edelweiss Commodities Services Limited CRISIL A1+ 1.58
Total 86.50
Treasury Bill
Government of India SOV 2.61
Total 2.61
Cash & Cash Equivalent
Net Receivables/Payables 0.27
TREPS / Reverse Repo Investments 0.59
Total 0.86
GRAND TOTAL 100.00
##Thinly traded/Non traded securities and illiquid securities as defined in SEBI Regulations
and Guidelines.
All corporate ratings are assigned by rating agencies like CRISIL, CARE, ICRA, India Rating.
CREDIT PROFILE
INVESTMENT OBJECTIVE
The Scheme seeks to deliver reasonable market related returns with lower risk and higher liquidity through portfolio of debt and money market instruments. The Scheme is not providing any assured or guaranteed returns. There is no assurance that the investment objective of the scheme will be achieved.
BENCHMARK
CRISIL Liquid Fund Index
DATE OF ALLOTMENT
July 16, 2008
FUND MANAGER
Alok Singh : (From October 22, 2018 to December 4, 2018) - Around 18 years of experience, including 10 years in mutual fund industry.
Nitish Gupta : (w.e.f. December 5, 2018) - More than 20 years of experience in managing Fixed Income Portfolio.
Amit Modani (Assistant Fund Manager): (w.e.f. October 22, 2018) - More than 7 years of Experience in Fixed Income.
AVERAGE AUM
` 1,053.52 Crs.
LATEST AUM
` 944.10 Crs.
MINIMUM APPLICATION AMOUNT (LUMPSUM)
Regular/ Direct Plan ` 5,000 and in multiples of ̀ 1
ADDITIONAL PURCHASE AMOUNT
Regular/ Direct Plan ` 1,000 and in multiples of ̀ 1
OTHER PARAMETERS (As on November 30, 2018)
Average Maturity: 0.71 MonthsModified Duration: 0.05Portfolio Yield: 7.31%
NAV (As on November 30, 2018) NAV (`)
Regular Plan Direct Plan Growth 2,090.8318 Growth 2,103.0040Daily Dividend 1,002.1069 Daily Dividend 1,002.6483Weekly Dividend 1,002.1065 Weekly Dividend 1,062.4036
LOAD STRUCTURE (FOR ALL PLANS)
Entry Load NIL NILExit Load
For Dividend History please refer page no. 15.
For Scheme Performance please refer page no. 16 to 21.
For month end Total Expense Ratio please refer page no. 22.
A1+
96.53%
0.86%
COMPOSITION BY ASSETS
86.50%
0.86%2.61%
Certificate of DepositCommercial Paper
Government BondCash & Cash EquivalentSovereign Cash & Cash Equivalent
2.61%
10.03%
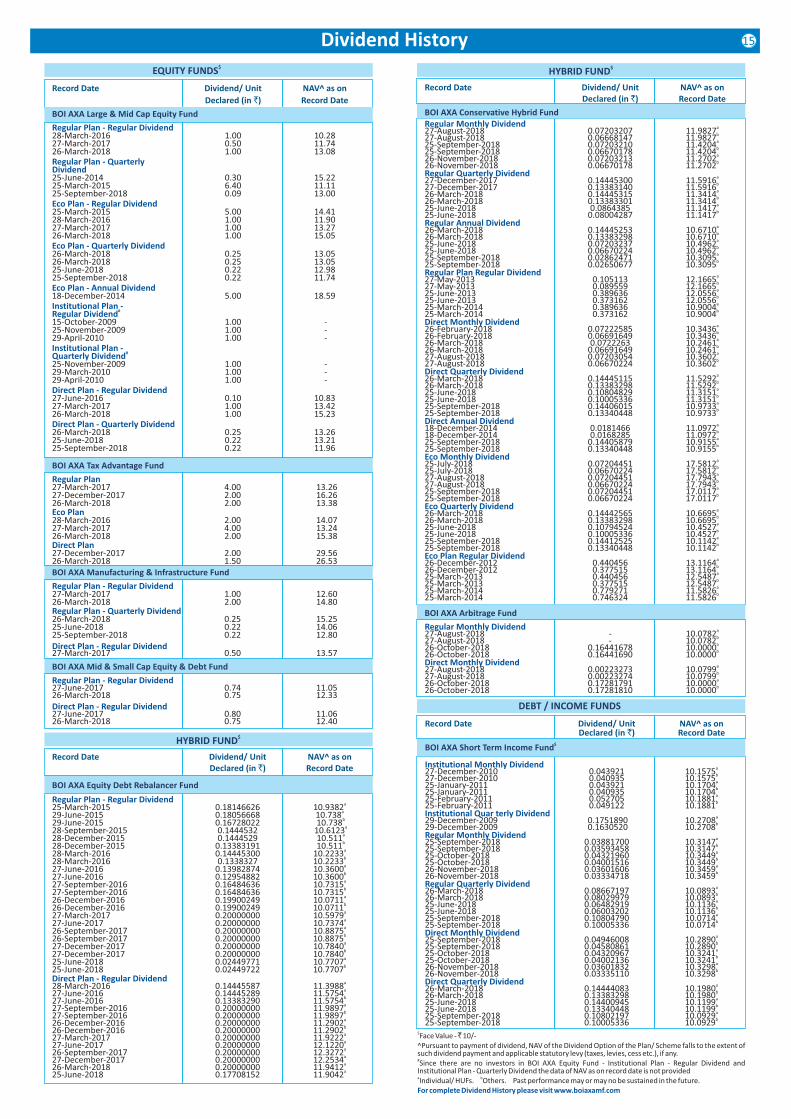
Dividend History$EQUITY FUNDS
$Face Value - ̀ 10/-
^Pursuant to payment of dividend, NAV of the Dividend Option of the Plan/ Scheme falls to the extent of such dividend payment and applicable statutory levy (taxes, levies, cess etc.), if any. #Since there are no investors in BOI AXA Equity Fund - Institutional Plan - Regular Dividend and
Institutional Plan - Quarterly Dividend the data of NAV as on record date is not provideda bIndividual/ HUFs. Others. Past performance may or may no be sustained in the future.
For complete Dividend History please visit www.boiaxamf.com
DEBT / INCOME FUNDS
Record Date Dividend/ Unit NAV^ as on Declared (in `) Record Date
$BOI AXA Short Term Income Fund
Institutional Monthly Dividend a27-December-2010 0.043921 10.1575b27-December-2010 0.040935 10.1575a25-January-2011 0.043921 10.1704b25-January-2011 0.040935 10.1704a25-February-2011 0.052705 10.1881b25-February-2011 0.049122 10.1881Institutional Quar terly Dividend a29-December-2009 0.1751890 10.2708 b29-December-2009 0.1630520 10.2708 Regular Monthly Dividend a25-September-2018 0.03881700 10.3147b25-September-2018 0.03593458 10.3147a25-October-2018 0.04321960 10.3449b25-October-2018 0.04001516 10.3449a26-November-2018 0.03601606 10.3459b26-November-2018 0.03334718 10.3459Regular Quarterly Dividend a26-March-2018 0.08667197 10.0893b26-March-2018 0.08029979 10.0893a25-June-2018 0.06482919 10.1136b25-June-2018 0.06003202 10.1136a25-September-2018 0.10804790 10.0714b25-September-2018 0.10005336 10.0714Direct Monthly Dividend a25-September-2018 0.04946008 10.2890b25-September-2018 0.04580861 10.2890a25-October-2018 0.04320967 10.3241b25-October-2018 0.04002136 10.3241a26-November-2018 0.03601832 10.3298b26-November-2018 0.03335110 10.3298Direct Quarterly Dividend a26-March-2018 0.14444083 10.1980b26-March-2018 0.13383298 10.1980a25-June-2018 0.14400945 10.1199b25-June-2018 0.13340448 10.1199a25-September-2018 0.10802197 10.0929b25-September-2018 0.10005336 10.0929
$HYBRID FUND
Record Date Dividend/ Unit NAV^ as on Declared (in `) Record Date
BOI AXA Equity Debt Rebalancer Fund
Regular Plan - Regular Dividend a25-March-2015 0.18146626 10.9382
a29-June-2015 0.18056668 10.738 b29-June-2015 0.16728022 10.738
a28-September-2015 0.1444532 10.6123 a28-December-2015 0.1444529 10.511 b28-December-2015 0.13383191 10.511 a28-March-2016 0.14445300 10.2233 b28-March-2016 0.1338327 10.2233 a27-June-2016 0.13982874 10.3600 b27-June-2016 0.12954882 10.3600 a27-September-2016 0.16484636 10.7315 b27-September-2016 0.16484636 10.7315 a26-December-2016 0.19900249 10.0711 b26-December-2016 0.19900249 10.0711a27-March-2017 0.20000000 10.5979 a27-June-2017 0.20000000 10.7374 a26-September-2017 0.20000000 10.8875 b26-September-2017 0.20000000 10.8875 a27-December-2017 0.20000000 10.7840 b27-December-2017 0.20000000 10.7840a25-June-2018 0.02449771 10.7707 b25-June-2018 0.02449722 10.7707
Direct Plan - Regular Dividend a28-March-2016 0.14445587 11.3988 a27-June-2016 0.14445289 11.5754 b27-June-2016 0.13383290 11.5754 a27-September-2016 0.20000000 11.9897 b27-September-2016 0.20000000 11.9897 a26-December-2016 0.20000000 11.2902 b26-December-2016 0.20000000 11.2902a27-March-2017 0.20000000 11.9222 a27-June-2017 0.20000000 12.1220 a26-September-2017 0.20000000 12.3272 a27-December-2017 0.20000000 12.2534 a26-March-2018 0.20000000 11.9412 a25-June-2018 0.17708152 11.9042
BOI AXA Tax Advantage Fund
Regular Plan 27-March-2017 4.00 13.26 27-December-2017 2.00 16.2626-March-2018 2.00 13.38Eco Plan 28-March-2016 2.00 14.07 27-March-2017 4.00 13.24 26-March-2018 2.00 15.38Direct Plan 27-December-2017 2.00 29.5626-March-2018 1.50 26.53BOI AXA Manufacturing & Infrastructure Fund
Regular Plan - Regular Dividend27-March-2017 1.00 12.60 26-March-2018 2.00 14.80Regular Plan - Quarterly Dividend26-March-2018 0.25 15.2525-June-2018 0.22 14.0625-September-2018 0.22 12.80Direct Plan - Regular Dividend27-March-2017 0.50 13.57
BOI AXA Mid & Small Cap Equity & Debt Fund
Regular Plan - Regular Dividend27-June-2017 0.74 11.05 26-March-2018 0.75 12.33 Direct Plan - Regular Dividend27-June-2017 0.80 11.06 26-March-2018 0.75 12.40
Record Date Dividend/ Unit NAV^ as on
Declared (in `) Record Date
BOI AXA Large & Mid Cap Equity Fund
Regular Plan - Regular Dividend 28-March-2016 1.00 10.2827-March-2017 0.50 11.7426-March-2018 1.00 13.08Regular Plan - Quarterly Dividend 25-June-2014 0.30 15.2225-March-2015 6.40 11.1125-September-2018 0.09 13.00Eco Plan - Regular Dividend 25-March-2015 5.00 14.4128-March-2016 1.00 11.9027-March-2017 1.00 13.2726-March-2018 1.00 15.05Eco Plan - Quarterly Dividend26-March-2018 0.25 13.0526-March-2018 0.25 13.0525-June-2018 0.22 12.9825-September-2018 0.22 11.74Eco Plan - Annual Dividend18-December-2014 5.00 18.59Institutional Plan -
#Regular Dividend 15-October-2009 1.00 - 25-November-2009 1.00 - 29-April-2010 1.00 - Institutional Plan -
#Quarterly Dividend25-November-2009 1.00 - 29-March-2010 1.00 - 29-April-2010 1.00 - Direct Plan - Regular Dividend 27-June-2016 0.10 10.8327-March-2017 1.00 13.4226-March-2018 1.00 15.23Direct Plan - Quarterly Dividend 26-March-2018 0.25 13.2625-June-2018 0.22 13.2125-September-2018 0.22 11.96
Record Date Dividend/ Unit NAV^ as on Declared (in `) Record Date
BOI AXA Conservative Hybrid FundRegular Monthly Dividend a27-August-2018 0.07203207 11.9827b27-August-2018 0.06668147 11.9827a25-September-2018 0.07203210 11.4204b25-September-2018 0.06670178 11.4204a26-November-2018 0.07203213 11.2702b26-November-2018 0.06670178 11.2702Regular Quarterly Dividend a27-December-2017 0.14445300 11.5916b27-December-2017 0.13383140 11.5916a26-March-2018 0.14445315 11.3414b26-March-2018 0.13383301 11.3414a25-June-2018 0.0864385 11.1417b25-June-2018 0.08004287 11.1417Regular Annual Dividend a26-March-2018 0.14445253 10.6710b26-March-2018 0.13383298 10.6710a25-June-2018 0.07203237 10.4962b25-June-2018 0.06670224 10.4962a25-September-2018 0.02862471 10.3095b25-September-2018 0.02650677 10.3095Regular Plan Regular Dividend a27-May-2013 0.105113 12.1665 b27-May-2013 0.089559 12.1665 a25-June-2013 0.389636 12.0556 b25-June-2013 0.373162 12.0556 a25-March-2014 0.389636 10.9004 b25-March-2014 0.373162 10.9004 Direct Monthly Dividend a26-February-2018 0.07222585 10.3436b26-February-2018 0.06691649 10.3436a26-March-2018 0.0722263 10.2461b26-March-2018 0.06691649 10.2461a27-August-2018 0.07203054 10.3602b27-August-2018 0.06670224 10.3602Direct Quarterly Dividend a26-March-2018 0.14445115 11.5292b26-March-2018 0.13383298 11.5292a25-June-2018 0.10804829 11.3151b25-June-2018 0.10005336 11.3151a25-September-2018 0.14406015 10.9733b25-September-2018 0.13340448 10.9733Direct Annual Dividend a18-December-2014 0.0181466 11.0972 b18-December-2014 0.0168285 11.0972 a25-September-2018 0.14405879 10.9155b25-September-2018 0.13340448 10.9155Eco Monthly Dividend a25-July-2018 0.07204451 17.5812b25-July-2018 0.06670224 17.5812a27-August-2018 0.07204451 17.7943b27-August-2018 0.06670224 17.7943a25-September-2018 0.07204451 17.0117b25-September-2018 0.06670224 17.0117Eco Quarterly Dividend a26-March-2018 0.14442565 10.6695b26-March-2018 0.13383298 10.6695a25-June-2018 0.10794524 10.4527b25-June-2018 0.10005336 10.4527a25-September-2018 0.14412525 10.1142b25-September-2018 0.13340448 10.1142Eco Plan Regular Dividend a26-December-2012 0.440456 13.1164 b26-December-2012 0.377515 13.1164 a25-March-2013 0.440456 12.5487 b25-March-2013 0.377515 12.5487 a25-March-2014 0.779271 11.5826 b25-March-2014 0.746324 11.5826
$HYBRID FUND
BOI AXA Arbitrage Fund
Regular Monthly Dividend a27-August-2018 - 10.0782b27-August-2018 - 10.0782a26-October-2018 0.16441678 10.0000b26-October-2018 0.16441690 10.0000Direct Monthly Dividend a27-August-2018 0.00223273 10.0799b27-August-2018 0.00223274 10.0799a26-October-2018 0.17281791 10.0000b26-October-2018 0.17281810 10.0000
15
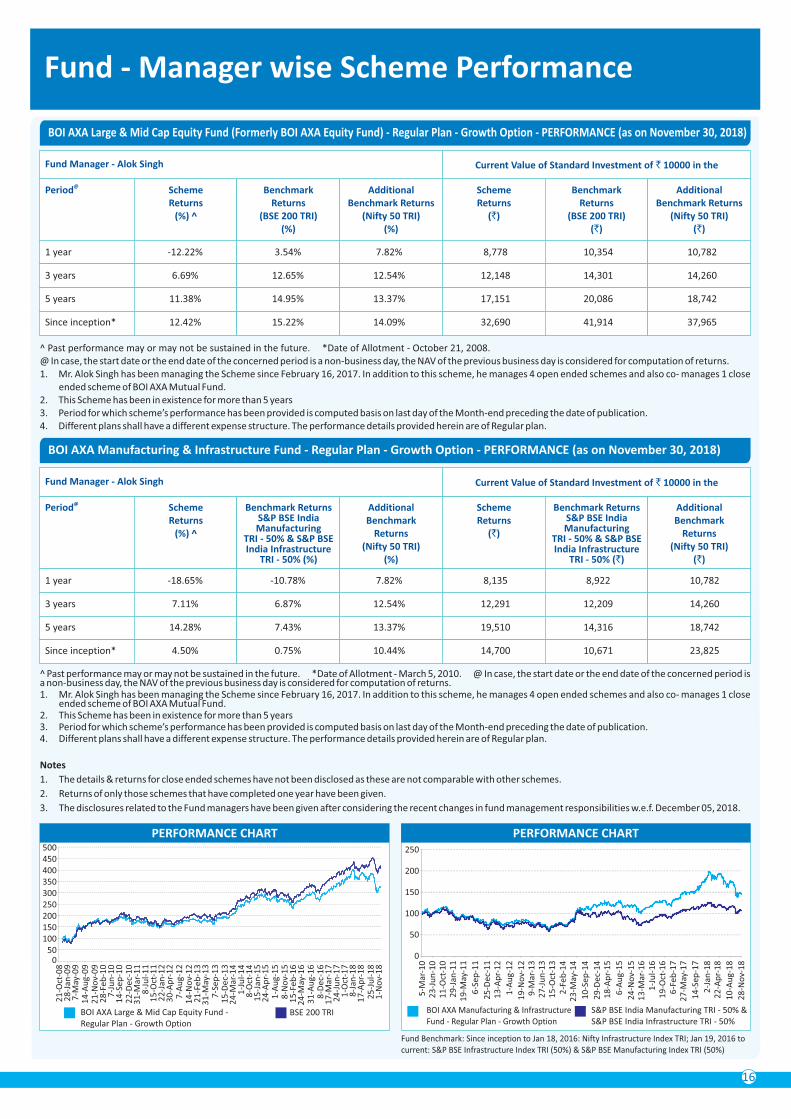
Fund - Manager wise Scheme Performance
@Period Scheme Returns
(%) ^
Benchmark Returns
(BSE 200 TRI)(%)
^ Past performance may or may not be sustained in the future. *Date of Allotment - October 21, 2008.@ In case, the start date or the end date of the concerned period is a non-business day, the NAV of the previous business day is considered for computation of returns.1. Mr. Alok Singh has been managing the Scheme since February 16, 2017. In addition to this scheme, he manages 4 open ended schemes and also co- manages 1 close
ended scheme of BOI AXA Mutual Fund.2. This Scheme has been in existence for more than 5 years 3. Period for which scheme’s performance has been provided is computed basis on last day of the Month-end preceding the date of publication.4. Different plans shall have a different expense structure. The performance details provided herein are of Regular plan.
PERFORMANCE CHART
BOI AXA Large & Mid Cap Equity Fund - Regular Plan - Growth Option
BSE 200 TRI
Additional Benchmark Returns
(Nifty 50 TRI)(%)
Scheme Returns
(`)
Benchmark Returns
(BSE 200 TRI)(`)
Additional Benchmark Returns
(Nifty 50 TRI)(`)
1 year -12.22% 3.54% 7.82% 8,778 10,354 10,782
3 years 6.69% 12.65% 12.54% 12,148 14,301 14,260
5 years 11.38% 14.95% 13.37% 17,151 20,086 18,742
Since inception* 12.42% 15.22% 14.09% 32,690 41,914 37,965
Current Value of Standard Investment of ` 10000 in the
^ Past performance may or may not be sustained in the future. *Date of Allotment - March 5, 2010. @ In case, the start date or the end date of the concerned period is a non-business day, the NAV of the previous business day is considered for computation of returns.1. Mr. Alok Singh has been managing the Scheme since February 16, 2017. In addition to this scheme, he manages 4 open ended schemes and also co- manages 1 close
ended scheme of BOI AXA Mutual Fund.2. This Scheme has been in existence for more than 5 years 3. Period for which scheme’s performance has been provided is computed basis on last day of the Month-end preceding the date of publication.4. Different plans shall have a different expense structure. The performance details provided herein are of Regular plan.
1 year -18.65% -10.78% 7.82% 8,135 8,922 10,782
3 years 7.11% 6.87% 12.54% 12,291 12,209 14,260
5 years 14.28% 7.43% 13.37% 19,510 14,316 18,742
Since inception* 4.50% 0.75% 10.44% 14,700 10,671 23,825
Notes
1. The details & returns for close ended schemes have not been disclosed as these are not comparable with other schemes.
2. Returns of only those schemes that have completed one year have been given.
3. The disclosures related to the Fund managers have been given after considering the recent changes in fund management responsibilities w.e.f. December 05, 2018.
PERFORMANCE CHART
BOI AXA Manufacturing & InfrastructureFund - Regular Plan - Growth Option
S&P BSE India Manufacturing TRI - 50% &S&P BSE India Infrastructure TRI - 50%
0
50
100
250
150
Fund Manager - Alok Singh
200
050
100150200250300350400450500
Fund Benchmark: Since inception to Jan 18, 2016: Nifty Infrastructure Index TRI; Jan 19, 2016 to current: S&P BSE Infrastructure Index TRI (50%) & S&P BSE Manufacturing Index TRI (50%)
@Period Scheme Returns
(%) ^
Benchmark Returns S&P BSE India Manufacturing
TRI - 50% & S&P BSE India Infrastructure
TRI - 50% (%)
Additional Benchmark
Returns (Nifty 50 TRI)
(%)
Scheme Returns
(`)
Benchmark Returns S&P BSE India Manufacturing
TRI - 50% & S&P BSE India Infrastructure
TRI - 50% (`)
Additional Benchmark
Returns (Nifty 50 TRI)
(`)
Current Value of Standard Investment of ` 10000 in theFund Manager - Alok Singh
16
BOI AXA Large & Mid Cap Equity Fund (Formerly BOI AXA Equity Fund) - Regular Plan - Growth Option - PERFORMANCE (as on November 30, 2018)
BOI AXA Manufacturing & Infrastructure Fund - Regular Plan - Growth Option - PERFORMANCE (as on November 30, 2018)
21
-Oct
-08
28
-Jan
-09
7-M
ay-0
91
4-A
ug-
09
21
-No
v-0
92
8-F
eb-1
07
-Ju
n-1
01
4-S
ep-1
02
2-D
ec-1
03
1-M
ar-1
18
-Ju
l-1
11
5-O
ct-1
12
2-J
an-1
23
0-A
pr-
12
7-A
ug-
12
14
-No
v-1
22
1-F
eb-1
33
1-M
ay-1
37
-Sep
-13
15
-Dec
-13
24
-Mar
-14
1-J
ul-
14
8-O
ct-1
41
5-J
an-1
52
4-A
pr-
15
1-A
ug-
15
8-N
ov-
15
15
-Feb
-16
24
-May
-16
31
-Au
g-1
68
-Dec
-16
17
-Mar
-17
24
-Ju
n-1
71
-Oct
-17
8-J
an-1
81
7-A
pr-
18
25
-Ju
l-1
81
-No
v-1
8
5-M
ar-1
02
3-J
un
-10
11
-Oct
-10
29
-Jan
-11
19
-May
-11
6-S
ep-1
1
25
-Dec
-11
13
-Ap
r-1
2
1-A
ug-
12
19
-No
v-1
29
-Mar
-13
27
-Ju
n-1
31
5-O
ct-1
32
-Feb
-14
23
-May
-14
10
-Sep
-14
29
-Dec
-14
18
-Ap
r-1
5
6-A
ug-
15
24
-No
v-1
51
3-M
ar-1
61
-Ju
l-1
61
9-O
ct-1
66
-Feb
-17
27
-May
-17
14
-Sep
-17
2-J
an-1
82
2-A
pr-
18
10
-Au
g-1
8
28
-No
v-1
8
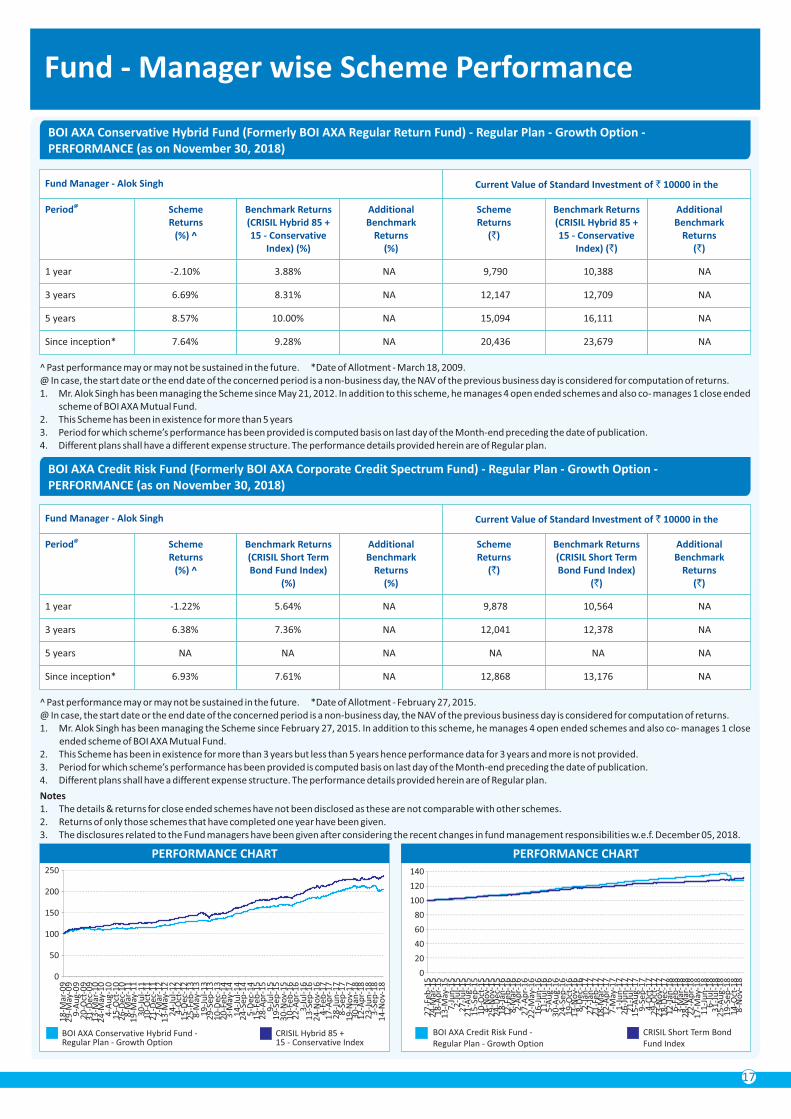
@Period Scheme Returns
(%) ^
Benchmark Returns(CRISIL Hybrid 85 + 15 - Conservative
Index) (%)
^ Past performance may or may not be sustained in the future. *Date of Allotment - March 18, 2009.@ In case, the start date or the end date of the concerned period is a non-business day, the NAV of the previous business day is considered for computation of returns.1. Mr. Alok Singh has been managing the Scheme since May 21, 2012. In addition to this scheme, he manages 4 open ended schemes and also co- manages 1 close ended
scheme of BOI AXA Mutual Fund.2. This Scheme has been in existence for more than 5 years 3. Period for which scheme’s performance has been provided is computed basis on last day of the Month-end preceding the date of publication.4. Different plans shall have a different expense structure. The performance details provided herein are of Regular plan.
Additional Benchmark
Returns(%)
Scheme Returns
(`)
Benchmark Returns(CRISIL Hybrid 85 + 15 - Conservative
Index) (`)
Additional Benchmark
Returns(`)
Current Value of Standard Investment of ` 10000 in the
PERFORMANCE CHART
BOI AXA Conservative Hybrid Fund -Regular Plan - Growth Option
CRISIL Hybrid 85 + 15 - Conservative Index
0
50
100
150
200
250
Fund Manager - Alok Singh
@Period Scheme Returns
(%) ^
Benchmark Returns(CRISIL Short TermBond Fund Index)
(%)
^ Past performance may or may not be sustained in the future. *Date of Allotment - February 27, 2015. @ In case, the start date or the end date of the concerned period is a non-business day, the NAV of the previous business day is considered for computation of returns.1. Mr. Alok Singh has been managing the Scheme since February 27, 2015. In addition to this scheme, he manages 4 open ended schemes and also co- manages 1 close
ended scheme of BOI AXA Mutual Fund.2. This Scheme has been in existence for more than 3 years but less than 5 years hence performance data for 3 years and more is not provided. 3. Period for which scheme’s performance has been provided is computed basis on last day of the Month-end preceding the date of publication.4. Different plans shall have a different expense structure. The performance details provided herein are of Regular plan.
BOI AXA Credit Risk Fund (Formerly BOI AXA Corporate Credit Spectrum Fund) - Regular Plan - Growth Option -PERFORMANCE (as on November 30, 2018)
Additional Benchmark
Returns(%)
Scheme Returns
(`)
Benchmark Returns(CRISIL Short TermBond Fund Index)
(`)
Additional Benchmark
Returns(`)
1 year -2.10% 3.88% NA 9,790 10,388 NA
3 years 6.69% 8.31% NA 12,147 12,709 NA
5 years 8.57% 10.00% NA 15,094 16,111 NA
Since inception* 7.64% 9.28% NA 20,436 23,679 NA
1 year -1.22% 5.64% NA 9,878 10,564 NA
3 years 6.38% 7.36% NA 12,041 12,378 NA
5 years NA NA NA NA NA NA
Since inception* 6.93% 7.61% NA 12,868 13,176 NA
Current Value of Standard Investment of ` 10000 in theFund Manager - Alok Singh
BOI AXA Credit Risk Fund -Regular Plan - Growth Option
CRISIL Short Term BondFund Index
PERFORMANCE CHART
0
20
40
60
80
100
120
140
Fund - Manager wise Scheme Performance
17
BOI AXA Conservative Hybrid Fund (Formerly BOI AXA Regular Return Fund) - Regular Plan - Growth Option -PERFORMANCE (as on November 30, 2018)
18
-Mar
-09
29
-May
-09
9-A
ug-
09
20
-Oct
-09
31
-Dec
-09
13
-Mar
-10
24
-May
-10
4-A
ug-
10
15
-Oct
-10
26
-Dec
-10
8-M
ar-1
11
9-M
ay-1
13
0-J
ul-
11
10
-Oct
-11
21
-Dec
-11
2-M
ar-1
21
3-M
ay-1
22
4-J
ul-
12
4-O
ct-1
21
5-D
ec-1
22
5-F
eb-1
38
-May
-13
19
-Ju
l-1
32
9-S
ep-1
31
0-D
ec-1
32
0-F
eb-1
43
-May
-14
14
-Ju
l-1
42
4-S
ep-1
45
-Dec
-14
15
-Feb
-15
28
-Ap
r-1
59
-Ju
l-1
51
9-S
ep-1
53
0-N
ov-
15
10
-Feb
-16
22
-Ap
r-1
63
-Ju
l-1
61
3-S
ep-1
62
4-N
ov-
16
4-F
eb-1
71
7-A
pr-
17
28
-Ju
n-1
78
-Sep
-17
19
-No
v-1
73
0-J
an-1
81
2-A
pr-
18
23
-Ju
n-1
83
-Sep
-18
14
-No
v-1
8
27
-Feb
-15
24
-Mar
-15
18
-Ap
r-1
51
3-M
ay-1
57
-Ju
n-1
52
-Ju
l-1
52
7-J
ul-
15
21
-Au
g-1
51
5-S
ep-1
51
0-O
ct-1
54
-No
v-1
52
9-N
ov-
15
24
-Dec
-15
18
-Jan
-16
12
-Feb
-16
8-M
ar-1
62
-Ap
r-1
62
7-A
pr-
16
22
-May
-16
16
-Ju
n-1
61
1-J
ul-
16
5-A
ug-
16
30
-Au
g-1
62
4-S
ep-1
61
9-O
ct-1
61
3-N
ov-
16
8-D
ec-1
62
-Jan
-17
27
-Jan
-17
21
-Feb
-17
18
-Mar
-17
12
-Ap
r-1
77
-May
-17
1-J
un
-17
26
-Ju
n-1
72
1-J
ul-
17
15
-Au
g-1
79
-Sep
-17
4-O
ct-1
72
9-O
ct-1
72
3-N
ov-
17
18
-Dec
-17
12
-Jan
-18
6-F
eb-1
83
-Mar
-18
28
-Mar
-18
22
-Ap
r-1
81
7-M
ay-1
81
1-J
un
-18
6-J
ul-
18
31
-Ju
l-1
82
5-A
ug-
18
19
-Sep
-18
14
-Oct
-18
8-N
ov-
18
Notes1. The details & returns for close ended schemes have not been disclosed as these are not comparable with other schemes.2. Returns of only those schemes that have completed one year have been given.3. The disclosures related to the Fund managers have been given after considering the recent changes in fund management responsibilities w.e.f. December 05, 2018.
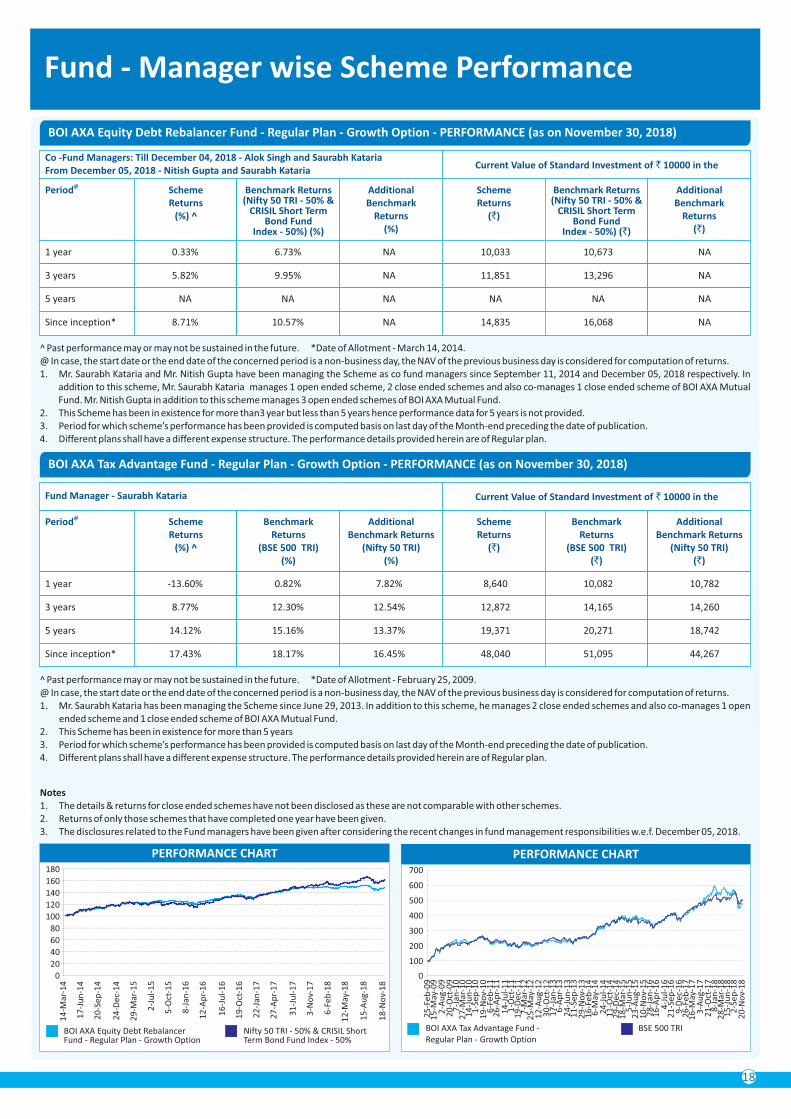
@Period Scheme Returns
(%) ^
Benchmark Returns(Nifty 50 TRI - 50% &
CRISIL Short Term Bond Fund
Index - 50%) (%)
^ Past performance may or may not be sustained in the future. *Date of Allotment - March 14, 2014. @ In case, the start date or the end date of the concerned period is a non-business day, the NAV of the previous business day is considered for computation of returns.1. Mr. Saurabh Kataria and Mr. Nitish Gupta have been managing the Scheme as co fund managers since September 11, 2014 and December 05, 2018 respectively. In
addition to this scheme, Mr. Saurabh Kataria manages 1 open ended scheme, 2 close ended schemes and also co-manages 1 close ended scheme of BOI AXA Mutual Fund. Mr. Nitish Gupta in addition to this scheme manages 3 open ended schemes of BOI AXA Mutual Fund.
2. This Scheme has been in existence for more than3 year but less than 5 years hence performance data for 5 years is not provided.3. Period for which scheme’s performance has been provided is computed basis on last day of the Month-end preceding the date of publication.4. Different plans shall have a different expense structure. The performance details provided herein are of Regular plan.
BOI AXA Equity Debt Rebalancer Fund - Regular Plan - Growth Option - PERFORMANCE (as on November 30, 2018)
Additional Benchmark
Returns(%)
Scheme Returns
(`)
Benchmark Returns(Nifty 50 TRI - 50% &
CRISIL Short Term Bond Fund
Index - 50%) (`)
Additional Benchmark
Returns(`)
Current Value of Standard Investment of ` 10000 in the
BOI AXA Equity Debt Rebalancer Fund - Regular Plan - Growth Option
Nifty 50 TRI - 50% & CRISIL Short Term Bond Fund Index - 50%
PERFORMANCE CHART
0
20
40
60
80
100
120
180
Co -Fund Managers: Till December 04, 2018 - Alok Singh and Saurabh KatariaFrom December 05, 2018 - Nitish Gupta and Saurabh Kataria
@Period Scheme Returns
(%) ^
Benchmark Returns
(BSE 500 TRI)(%)
^ Past performance may or may not be sustained in the future. *Date of Allotment - February 25, 2009. @ In case, the start date or the end date of the concerned period is a non-business day, the NAV of the previous business day is considered for computation of returns.1. Mr. Saurabh Kataria has been managing the Scheme since June 29, 2013. In addition to this scheme, he manages 2 close ended schemes and also co-manages 1 open
ended scheme and 1 close ended scheme of BOI AXA Mutual Fund.2. This Scheme has been in existence for more than 5 years 3. Period for which scheme’s performance has been provided is computed basis on last day of the Month-end preceding the date of publication.4. Different plans shall have a different expense structure. The performance details provided herein are of Regular plan.
BOI AXA Tax Advantage Fund - Regular Plan - Growth Option - PERFORMANCE (as on November 30, 2018)
Additional Benchmark Returns
(Nifty 50 TRI)(%)
Scheme Returns
(`)
Benchmark Returns
(BSE 500 TRI)(`)
Additional Benchmark Returns
(Nifty 50 TRI)(`)
1 year 0.33% 6.73% NA 10,033 10,673 NA
3 years 5.82% 9.95% NA 11,851 13,296 NA
5 years NA NA NA NA NA NA
Since inception* 8.71% 10.57% NA 14,835 16,068 NA
1 year -13.60% 0.82% 7.82% 8,640 10,082 10,782
3 years 8.77% 12.30% 12.54% 12,872 14,165 14,260
5 years 14.12% 15.16% 13.37% 19,371 20,271 18,742
Since inception* 17.43% 18.17% 16.45% 48,040 51,095 44,267
Current Value of Standard Investment of ` 10000 in theFund Manager - Saurabh Kataria
BOI AXA Tax Advantage Fund - Regular Plan - Growth Option
BSE 500 TRI
100
200
300
400
700
PERFORMANCE CHART
500140
600
0
160
Fund - Manager wise Scheme Performance
18
25
-Feb
-09
15
-May
-09
2-A
ug-
09
20
-Oct
-09
7-J
an-1
02
7-M
ar-1
01
4-J
un
-10
1-S
ep-1
01
9-N
ov-
10
6-F
eb-1
12
6-A
pr-
11
14
-Ju
l-1
11
-Oct
-11
19
-Dec
-11
7-M
ar-1
22
5-M
ay-1
21
2-A
ug-
12
30
-Oct
-12
17
-Jan
-13
6-A
pr-
13
24
-Ju
n-1
31
1-S
ep-1
32
9-N
ov-
13
16
-Feb
-14
6-M
ay-1
42
4-J
ul-
14
11
-Oct
-14
29
-Dec
-14
18
-Mar
-15
5-J
un
-15
23
-Au
g-1
51
0-N
ov-
15
28
-Jan
-16
16
-Ap
r-1
64
-Ju
l-1
62
1-S
ep-1
69
-Dec
-16
26
-Feb
-17
16
-May
-17
3-A
ug-
17
21
-Oct
-17
8-J
an-1
82
8-M
ar-1
81
5-J
un
-18
2-S
ep-1
82
0-N
ov-
18
14
-Mar
-14
17
-Ju
n-1
4
20
-Sep
-14
24
-Dec
-14
29
-Mar
-15
2-J
ul-
15
5-O
ct-1
5
8-J
an-1
6
12
-Ap
r-1
6
16
-Ju
l-1
6
19
-Oct
-16
22
-Jan
-17
27
-Ap
r-1
7
31
-Ju
l-1
7
3-N
ov-
17
6-F
eb-1
8
12
-May
-18
15
-Au
g-1
8
18
-No
v-1
8
Notes1. The details & returns for close ended schemes have not been disclosed as these are not comparable with other schemes.2. Returns of only those schemes that have completed one year have been given.3. The disclosures related to the Fund managers have been given after considering the recent changes in fund management responsibilities w.e.f. December 05, 2018.
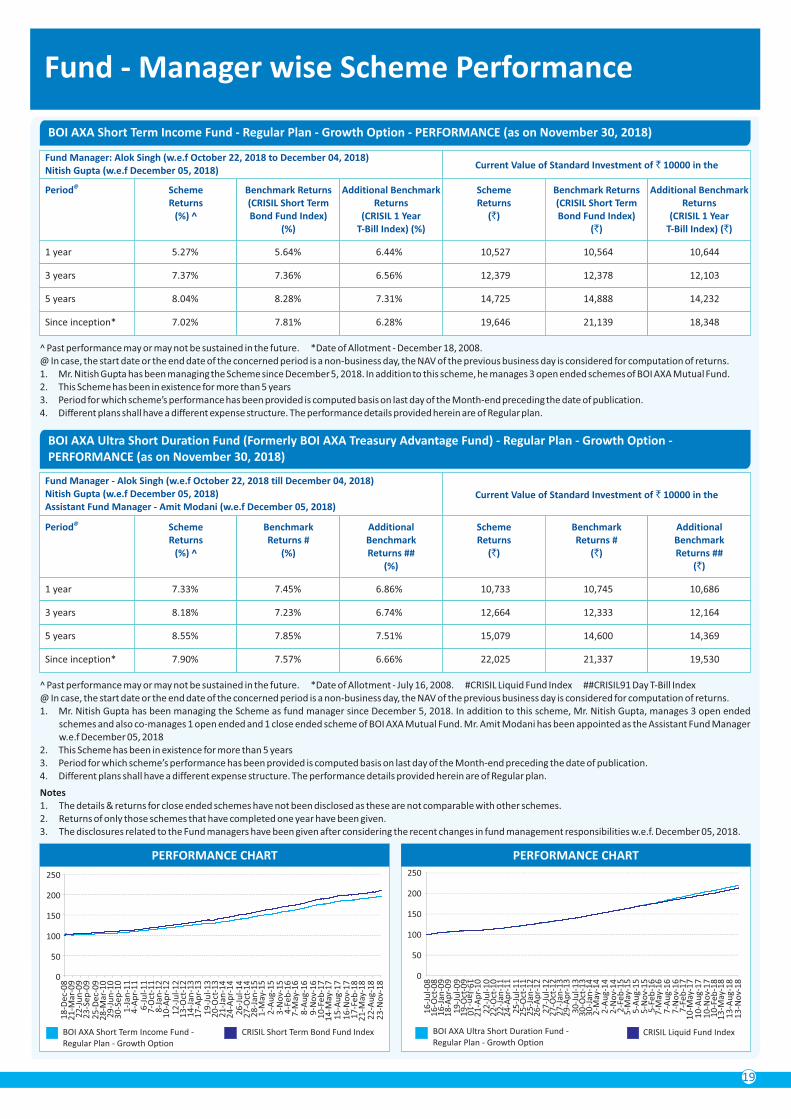
@Period Scheme Returns
(%) ^
Benchmark Returns(CRISIL Short Term Bond Fund Index)
(%)
^ Past performance may or may not be sustained in the future. *Date of Allotment - December 18, 2008. @ In case, the start date or the end date of the concerned period is a non-business day, the NAV of the previous business day is considered for computation of returns.1. Mr. Nitish Gupta has been managing the Scheme since December 5, 2018. In addition to this scheme, he manages 3 open ended schemes of BOI AXA Mutual Fund.2. This Scheme has been in existence for more than 5 years3. Period for which scheme’s performance has been provided is computed basis on last day of the Month-end preceding the date of publication.4. Different plans shall have a different expense structure. The performance details provided herein are of Regular plan.
BOI AXA Short Term Income Fund - Regular Plan - Growth Option - PERFORMANCE (as on November 30, 2018)
Additional Benchmark Returns
(CRISIL 1 Year T-Bill Index) (%)
Scheme Returns
(`)
Benchmark Returns(CRISIL Short Term Bond Fund Index)
(`)
Additional Benchmark Returns
(CRISIL 1 Year T-Bill Index) (`)
1 year 5.27% 5.64% 6.44% 10,527 10,564 10,644
3 years 7.37% 7.36% 6.56% 12,379 12,378 12,103
5 years 8.04% 8.28% 7.31% 14,725 14,888 14,232
Since inception* 7.02% 7.81% 6.28% 19,646 21,139 18,348
Current Value of Standard Investment of ` 10000 in theFund Manager: Alok Singh (w.e.f October 22, 2018 to December 04, 2018)Nitish Gupta (w.e.f December 05, 2018)
BOI AXA Ultra Short Duration Fund - Regular Plan - Growth Option
CRISIL Liquid Fund Index
PERFORMANCE CHART
0
50
100
150
200
250
@Period Scheme Returns
(%) ^
Benchmark Returns #
(%)
^ Past performance may or may not be sustained in the future. *Date of Allotment - July 16, 2008. #CRISIL Liquid Fund Index ##CRISIL91 Day T-Bill Index@ In case, the start date or the end date of the concerned period is a non-business day, the NAV of the previous business day is considered for computation of returns.1. Mr. Nitish Gupta has been managing the Scheme as fund manager since December 5, 2018. In addition to this scheme, Mr. Nitish Gupta, manages 3 open ended
schemes and also co-manages 1 open ended and 1 close ended scheme of BOI AXA Mutual Fund. Mr. Amit Modani has been appointed as the Assistant Fund Manager w.e.f December 05, 2018
2. This Scheme has been in existence for more than 5 years 3. Period for which scheme’s performance has been provided is computed basis on last day of the Month-end preceding the date of publication.4. Different plans shall have a different expense structure. The performance details provided herein are of Regular plan.
Additional Benchmark Returns ##
(%)
Scheme Returns
(`)
Benchmark Returns #
(`)
Additional Benchmark Returns ##
(`)
1 year 7.33% 7.45% 6.86% 10,733 10,745 10,686
3 years 8.18% 7.23% 6.74% 12,664 12,333 12,164
5 years 8.55% 7.85% 7.51% 15,079 14,600 14,369
Since inception* 7.90% 7.57% 6.66% 22,025 21,337 19,530
Current Value of Standard Investment of ` 10000 in the
Fund Manager - Alok Singh (w.e.f October 22, 2018 till December 04, 2018)Nitish Gupta (w.e.f December 05, 2018) Assistant Fund Manager - Amit Modani (w.e.f December 05, 2018)
PERFORMANCE CHART
BOI AXA Short Term Income Fund - Regular Plan - Growth Option
CRISIL Short Term Bond Fund Index
0
50
100
150
250
200
Fund - Manager wise Scheme Performance
19
BOI AXA Ultra Short Duration Fund (Formerly BOI AXA Treasury Advantage Fund) - Regular Plan - Growth Option -PERFORMANCE (as on November 30, 2018)
18
-Dec
-08
21
-Mar
-09
22
-Ju
n-0
92
3-S
ep-0
92
5-D
ec-0
92
8-M
ar-1
02
9-J
un
-10
30
-Sep
-10
1-J
an-1
14
-Ap
r-1
16
-Ju
l-1
17
-Oct
-11
8-J
an-1
21
0-A
pr-
12
12
-Ju
l-1
21
3-O
ct-1
21
4-J
an-1
31
7-A
pr-
13
19
-Ju
l-1
32
0-O
ct-1
32
1-J
an-1
42
4-A
pr-
14
26
-Ju
l-1
42
7-O
ct-1
42
8-J
an-1
51
-May
-15
2-A
ug-
15
3-N
ov-
15
4-F
eb-1
67
-May
-16
8-A
ug-
16
9-N
ov-
16
10
-Feb
-17
14
-May
-17
15
-Au
g-1
71
6-N
ov-
17
17
-Feb
-18
21
-May
-18
22
-Au
g-1
82
3-N
ov-
18
16
-Ju
l-0
81
6-O
ct-0
81
6-J
an-0
91
8-A
pr-
09
19
-Ju
l-0
91
9-O
ct-0
9
19
-Jan-1
0
21
-Ap
r-1
02
2-J
ul-
10
22
-Oct
-10
22
-Jan
-11
24
-Ap
r-1
12
5-J
ul-
11
25
-Oct
-11
25
-Jan
-12
26
-Ap
r-1
22
7-J
ul-
12
27
-Oct
-12
27
-Jan
-13
29
-Ap
r-1
33
0-J
ul-
13
30
-Oct
-13
30
-Jan
-14
2-M
ay-1
42
-Au
g-1
42
-No
v-1
42
-Feb
-15
5-M
ay-1
55
-Au
g-1
55
-No
v-1
55
-Feb
-16
7-M
ay-1
67
-Au
g-1
67
-No
v-1
67
-Feb
-17
10
-May
-17
10
-Au
g-1
71
0-N
ov-
17
10
-Feb
-18
13
-May
-18
13
-Au
g-1
81
3-N
ov-
18
Notes1. The details & returns for close ended schemes have not been disclosed as these are not comparable with other schemes.2. Returns of only those schemes that have completed one year have been given.3. The disclosures related to the Fund managers have been given after considering the recent changes in fund management responsibilities w.e.f. December 05, 2018.
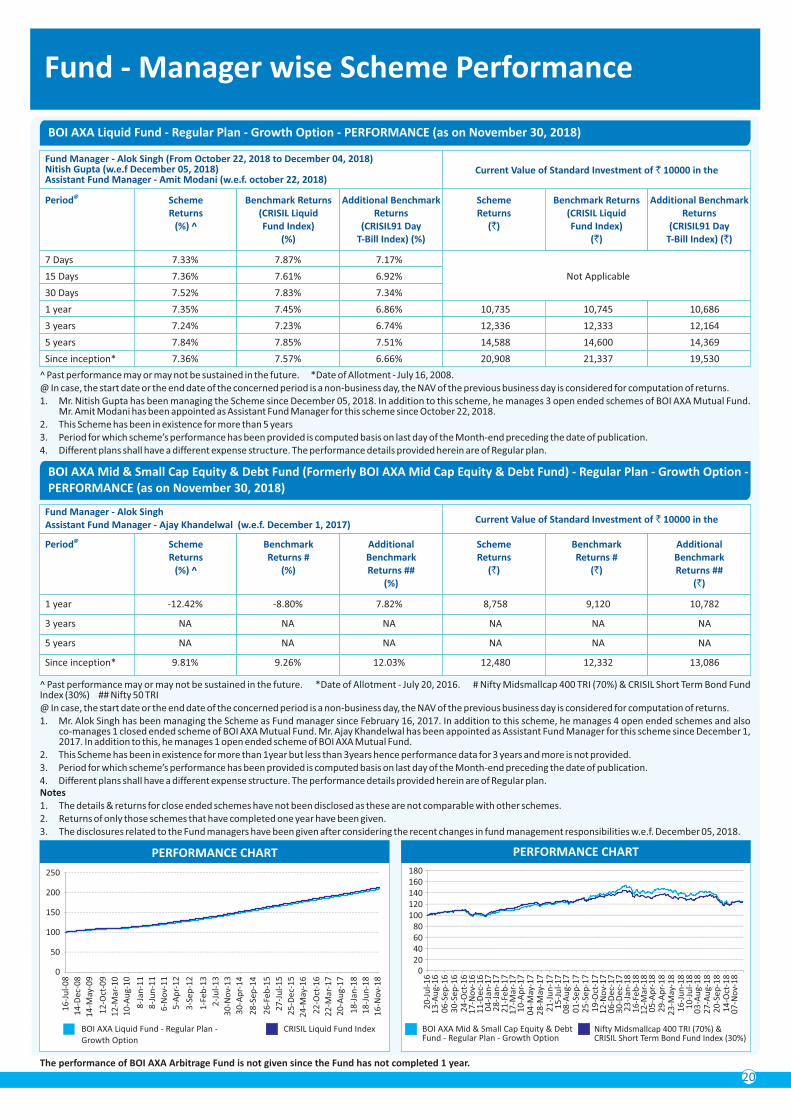
@Period Scheme Returns
(%) ^
Benchmark Returns(CRISIL Liquid Fund Index)
(%)
^ Past performance may or may not be sustained in the future. *Date of Allotment - July 16, 2008.@ In case, the start date or the end date of the concerned period is a non-business day, the NAV of the previous business day is considered for computation of returns.1. Mr. Nitish Gupta has been managing the Scheme since December 05, 2018. In addition to this scheme, he manages 3 open ended schemes of BOI AXA Mutual Fund.
Mr. Amit Modani has been appointed as Assistant Fund Manager for this scheme since October 22, 2018.2. This Scheme has been in existence for more than 5 years3. Period for which scheme’s performance has been provided is computed basis on last day of the Month-end preceding the date of publication.4. Different plans shall have a different expense structure. The performance details provided herein are of Regular plan.
BOI AXA Liquid Fund - Regular Plan - Growth Option - PERFORMANCE (as on November 30, 2018)
Additional Benchmark Returns
(CRISIL91 Day T-Bill Index) (%)
Scheme Returns
(`)
Benchmark Returns (CRISIL Liquid Fund Index)
(`)
Additional Benchmark Returns
(CRISIL91 Day T-Bill Index) (`)
Current Value of Standard Investment of ` 10000 in theFund Manager - Alok Singh (From October 22, 2018 to December 04, 2018) Nitish Gupta (w.e.f December 05, 2018)Assistant Fund Manager - Amit Modani (w.e.f. october 22, 2018)
@Period Scheme Returns
(%) ^
Benchmark Returns #
(%)
^ Past performance may or may not be sustained in the future. *Date of Allotment - July 20, 2016. # Nifty Midsmallcap 400 TRI (70%) & CRISIL Short Term Bond Fund Index (30%) ## Nifty 50 TRI@ In case, the start date or the end date of the concerned period is a non-business day, the NAV of the previous business day is considered for computation of returns.1. Mr. Alok Singh has been managing the Scheme as Fund manager since February 16, 2017. In addition to this scheme, he manages 4 open ended schemes and also
co-manages 1 closed ended scheme of BOI AXA Mutual Fund. Mr. Ajay Khandelwal has been appointed as Assistant Fund Manager for this scheme since December 1, 2017. In addition to this, he manages 1 open ended scheme of BOI AXA Mutual Fund.
2. This Scheme has been in existence for more than 1year but less than 3years hence performance data for 3 years and more is not provided.3. Period for which scheme’s performance has been provided is computed basis on last day of the Month-end preceding the date of publication.4. Different plans shall have a different expense structure. The performance details provided herein are of Regular plan.
Additional Benchmark Returns ##
(%)
Scheme Returns
(`)
Benchmark Returns #
(`)
Additional Benchmark Returns ##
(`)
Current Value of Standard Investment of ` 10000 in theFund Manager - Alok Singh Assistant Fund Manager - Ajay Khandelwal (w.e.f. December 1, 2017)
BOI AXA Mid & Small Cap Equity & Debt Fund - Regular Plan - Growth Option
Nifty Midsmallcap 400 TRI (70%) & CRISIL Short Term Bond Fund Index (30%)
PERFORMANCE CHARTPERFORMANCE CHART
BOI AXA Liquid Fund - Regular Plan - Growth Option
CRISIL Liquid Fund Index
0
50
100
150
200
250
1 year -12.42% -8.80% 7.82% 8,758 9,120 10,782
3 years NA NA NA NA NA NA
5 years NA NA NA NA NA NA
Since inception* 9.81% 9.26% 12.03% 12,480 12,332 13,086
7 Days 7.33% 7.87% 7.17%
15 Days 7.36% 7.61% 6.92% Not Applicable
30 Days 7.52% 7.83% 7.34%
1 year 7.35% 7.45% 6.86% 10,735 10,745 10,686
3 years 7.24% 7.23% 6.74% 12,336 12,333 12,164
5 years 7.84% 7.85% 7.51% 14,588 14,600 14,369
Since inception* 7.36% 7.57% 6.66% 20,908 21,337 19,530
20406080
100120
180
140160
0
The performance of BOI AXA Arbitrage Fund is not given since the Fund has not completed 1 year.
Fund - Manager wise Scheme Performance
20
BOI AXA Mid & Small Cap Equity & Debt Fund (Formerly BOI AXA Mid Cap Equity & Debt Fund) - Regular Plan - Growth Option - PERFORMANCE (as on November 30, 2018)
16
-Ju
l-0
8
14
-Dec
-08
14
-May
-09
12
-Oct
-09
12
-Mar
-10
10
-Au
g-1
0
8-J
an-1
1
8-J
un
-11
6-N
ov-
11
5-A
pr-
12
3-S
ep-1
2
1-F
eb-1
3
2-J
ul-
13
30
-No
v-1
3
30
-Ap
r-1
4
28
-Sep
-14
26
-Feb
-15
27
-Ju
l-1
5
25
-Dec
-15
24
-May
-16
22
-Oct
-16
22
-Mar
-17
20
-Au
g-1
7
18
-Jan
-18
18
-Ju
n-1
8
16
-No
v-1
8
20
-Ju
l-1
61
3-A
ug-
16
06
-Sep
-16
30
-Sep
-16
24
-Oct
-16
17
-No
v-1
61
1-D
ec-1
60
4-J
an-1
72
8-J
an-1
72
1-F
eb-1
71
7-M
ar-1
71
0-A
pr-
17
04
-May
-17
28
-May
-17
21
-Ju
n-1
71
5-J
ul-
17
08
-Au
g-1
70
1-S
ep-1
72
5-S
ep-1
71
9-O
ct-1
71
2-N
ov-
17
06
-Dec
-17
30
-Dec
-17
23
-Jan
-18
16
-Feb
-18
12
-Mar
-18
05
-Ap
r-1
82
9-A
pr-
18
23
-May
-18
16
-Ju
n-1
81
0-J
ul-
18
03
-Au
g-1
82
7-A
ug-
18
20
-Sep
-18
14
-Oct
-18
07
-No
v-1
8
Notes1. The details & returns for close ended schemes have not been disclosed as these are not comparable with other schemes.2. Returns of only those schemes that have completed one year have been given.3. The disclosures related to the Fund managers have been given after considering the recent changes in fund management responsibilities w.e.f. December 05, 2018.
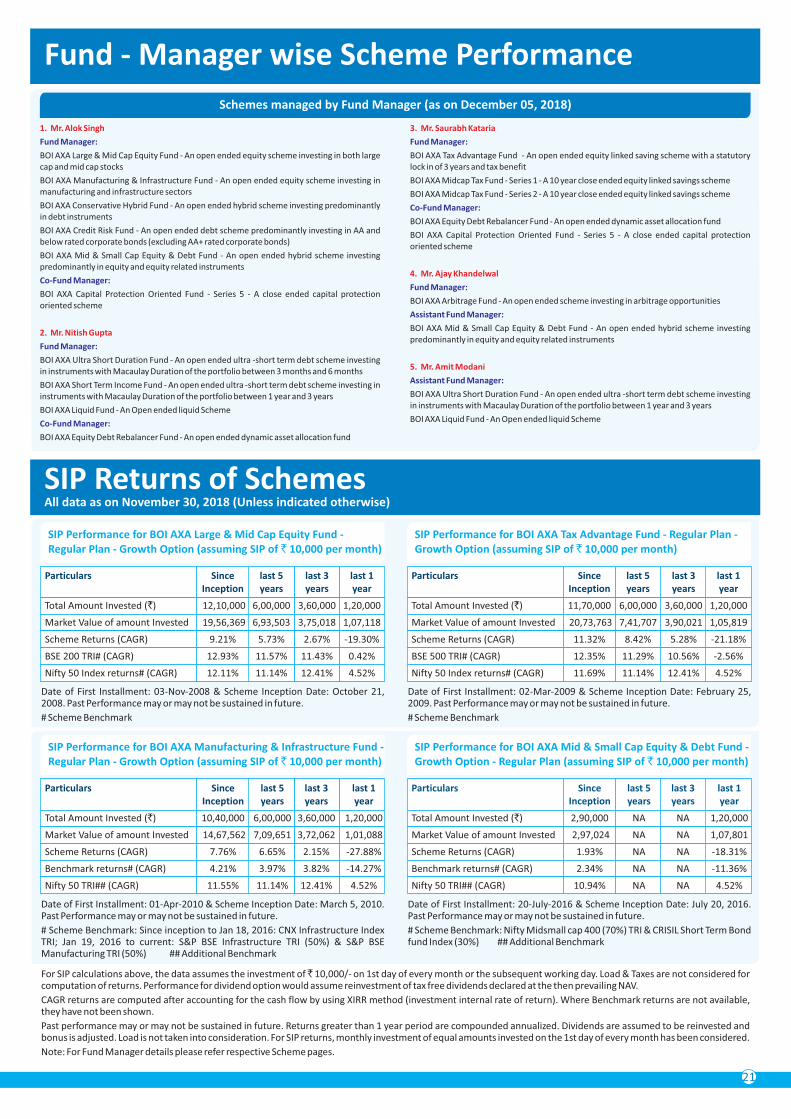
Schemes managed by Fund Manager (as on December 05, 2018)
1. Mr. Alok Singh
Fund Manager:
BOI AXA Large & Mid Cap Equity Fund - An open ended equity scheme investing in both large cap and mid cap stocks
BOI AXA Manufacturing & Infrastructure Fund - An open ended equity scheme investing in manufacturing and infrastructure sectors
BOI AXA Conservative Hybrid Fund - An open ended hybrid scheme investing predominantly in debt instruments
BOI AXA Credit Risk Fund - An open ended debt scheme predominantly investing in AA and below rated corporate bonds (excluding AA+ rated corporate bonds)
BOI AXA Mid & Small Cap Equity & Debt Fund - An open ended hybrid scheme investing predominantly in equity and equity related instruments
Co-Fund Manager:
BOI AXA Capital Protection Oriented Fund - Series 5 - A close ended capital protection oriented scheme
2. Mr. Nitish Gupta
Fund Manager:
BOI AXA Ultra Short Duration Fund - An open ended ultra -short term debt scheme investing in instruments with Macaulay Duration of the portfolio between 3 months and 6 months
BOI AXA Short Term Income Fund - An open ended ultra -short term debt scheme investing in instruments with Macaulay Duration of the portfolio between 1 year and 3 years
BOI AXA Liquid Fund - An Open ended liquid Scheme
Co-Fund Manager:
BOI AXA Equity Debt Rebalancer Fund - An open ended dynamic asset allocation fund
3. Mr. Saurabh Kataria
Fund Manager:
BOI AXA Tax Advantage Fund - An open ended equity linked saving scheme with a statutory lock in of 3 years and tax benefit
BOI AXA Midcap Tax Fund - Series 1 - A 10 year close ended equity linked savings scheme
BOI AXA Midcap Tax Fund - Series 2 - A 10 year close ended equity linked savings scheme
Co-Fund Manager:
BOI AXA Equity Debt Rebalancer Fund - An open ended dynamic asset allocation fund
BOI AXA Capital Protection Oriented Fund - Series 5 - A close ended capital protection oriented scheme
4. Mr. Ajay Khandelwal
Fund Manager:
BOI AXA Arbitrage Fund - An open ended scheme investing in arbitrage opportunities
Assistant Fund Manager:
BOI AXA Mid & Small Cap Equity & Debt Fund - An open ended hybrid scheme investing predominantly in equity and equity related instruments
5. Mr. Amit Modani
Assistant Fund Manager:
BOI AXA Ultra Short Duration Fund - An open ended ultra -short term debt scheme investing in instruments with Macaulay Duration of the portfolio between 1 year and 3 years
BOI AXA Liquid Fund - An Open ended liquid Scheme
SIP Returns of SchemesAll data as on November 30, 2018 (Unless indicated otherwise)
Date of First Installment: 03-Nov-2008 & Scheme Inception Date: October 21, 2008. Past Performance may or may not be sustained in future.
# Scheme Benchmark
Date of First Installment: 02-Mar-2009 & Scheme Inception Date: February 25, 2009. Past Performance may or may not be sustained in future.
# Scheme Benchmark
For SIP calculations above, the data assumes the investment of ̀ 10,000/- on 1st day of every month or the subsequent working day. Load & Taxes are not considered for computation of returns. Performance for dividend option would assume reinvestment of tax free dividends declared at the then prevailing NAV.
CAGR returns are computed after accounting for the cash flow by using XIRR method (investment internal rate of return). Where Benchmark returns are not available, they have not been shown.
Past performance may or may not be sustained in future. Returns greater than 1 year period are compounded annualized. Dividends are assumed to be reinvested and bonus is adjusted. Load is not taken into consideration. For SIP returns, monthly investment of equal amounts invested on the 1st day of every month has been considered.
Note: For Fund Manager details please refer respective Scheme pages.
Particulars Since last 5 last 3 last 1 Inception years years year
Total Amount Invested (`) 12,10,000 6,00,000 3,60,000 1,20,000
Market Value of amount Invested 19,56,369 6,93,503 3,75,018 1,07,118
Scheme Returns (CAGR) 9.21% 5.73% 2.67% -19.30%
BSE 200 TRI# (CAGR) 12.93% 11.57% 11.43% 0.42%
Nifty 50 Index returns# (CAGR) 12.11% 11.14% 12.41% 4.52%
Particulars Since last 5 last 3 last 1 Inception years years year
Total Amount Invested (`) 11,70,000 6,00,000 3,60,000 1,20,000
Market Value of amount Invested 20,73,763 7,41,707 3,90,021 1,05,819
Scheme Returns (CAGR) 11.32% 8.42% 5.28% -21.18%
BSE 500 TRI# (CAGR) 12.35% 11.29% 10.56% -2.56%
Nifty 50 Index returns# (CAGR) 11.69% 11.14% 12.41% 4.52%
Date of First Installment: 01-Apr-2010 & Scheme Inception Date: March 5, 2010. Past Performance may or may not be sustained in future.
# Scheme Benchmark: Since inception to Jan 18, 2016: CNX Infrastructure Index TRI; Jan 19, 2016 to current: S&P BSE Infrastructure TRI (50%) & S&P BSE Manufacturing TRI (50%) ## Additional Benchmark
Date of First Installment: 20-July-2016 & Scheme Inception Date: July 20, 2016. Past Performance may or may not be sustained in future.
# Scheme Benchmark: Nifty Midsmall cap 400 (70%) TRI & CRISIL Short Term Bond fund Index (30%) ## Additional Benchmark
Particulars Since last 5 last 3 last 1 Inception years years year
Total Amount Invested (`) 10,40,000 6,00,000 3,60,000 1,20,000
Market Value of amount Invested 14,67,562 7,09,651 3,72,062 1,01,088
Scheme Returns (CAGR) 7.76% 6.65% 2.15% -27.88%
Benchmark returns# (CAGR) 4.21% 3.97% 3.82% -14.27%
Nifty 50 TRI## (CAGR) 11.55% 11.14% 12.41% 4.52%
Particulars Since last 5 last 3 last 1 Inception years years year
Total Amount Invested (`) 2,90,000 NA NA 1,20,000
Market Value of amount Invested 2,97,024 NA NA 1,07,801
Scheme Returns (CAGR) 1.93% NA NA -18.31%
Benchmark returns# (CAGR) 2.34% NA NA -11.36%
Nifty 50 TRI## (CAGR) 10.94% NA NA 4.52%
Fund - Manager wise Scheme Performance
21
SIP Performance for BOI AXA Large & Mid Cap Equity Fund - Regular Plan - Growth Option (assuming SIP of ` 10,000 per month)
SIP Performance for BOI AXA Tax Advantage Fund - Regular Plan - Growth Option (assuming SIP of ` 10,000 per month)
SIP Performance for BOI AXA Manufacturing & Infrastructure Fund - Regular Plan - Growth Option (assuming SIP of ` 10,000 per month)
SIP Performance for BOI AXA Mid & Small Cap Equity & Debt Fund - Growth Option - Regular Plan (assuming SIP of ` 10,000 per month)
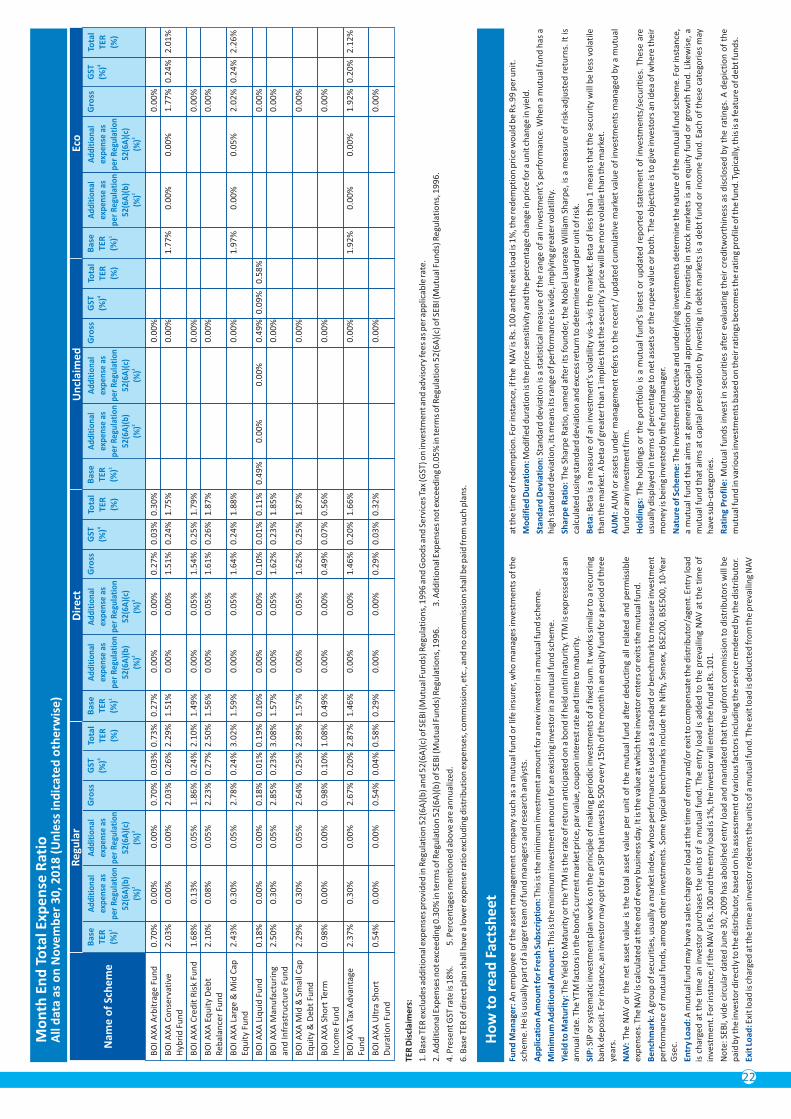
Mo
nth
En
d T
ota
l Exp
en
se R
atio
All
dat
a as
on
No
vem
be
r 3
0, 2
01
8 (
Un
less
ind
icat
ed
oth
erw
ise
)
Fun
d M
anag
er:
An
em
plo
yee
of t
he
asse
t m
anag
emen
t co
mp
any
such
as
a m
utu
al fu
nd
or
life
insu
rer,
wh
o m
anag
es in
vest
men
ts o
f th
e sc
hem
e. H
e is
usu
ally
par
t of a
larg
er te
am o
f fu
nd
man
ager
s an
d re
sear
ch a
nal
ysts
.
Ap
plic
atio
n A
mo
un
t fo
r Fre
sh S
ub
scri
pti
on
: Th
is is
the
min
imu
m in
vest
men
t am
ou
nt f
or a
new
inve
sto
r in
a m
utu
al fu
nd
sch
eme.
Min
imu
m A
dd
itio
nal
Am
ou
nt:
Th
is is
the
min
imu
m in
vest
men
t am
ou
nt f
or a
n e
xist
ing
inve
sto
r in
a m
utu
al fu
nd
sch
eme.
Yie
ld to
Mat
uri
ty: T
he
Yiel
d to
Mat
uri
ty o
r th
e YT
M is
the
rate
of r
etu
rn a
nti
cip
ated
on
a b
on
d if
hel
d u
nti
l mat
uri
ty. Y
TM is
exp
ress
ed a
s an
an
nu
al ra
te. T
he
YTM
fact
ors
in th
e b
on
d's
cu
rren
t mar
ket p
rice
, par
val
ue,
co
up
on
inte
rest
rate
an
d ti
me
to m
atu
rity
.
SIP
: SIP
or
syst
emat
ic in
vest
men
t pla
n w
ork
s o
n th
e p
rin
cip
le o
f mak
ing
per
iod
ic in
vest
men
ts o
f a fi
xed
su
m. I
t wo
rks
sim
ilar
to a
recu
rrin
g b
ank
dep
osi
t. F
or i
nst
ance
, an
inve
sto
r may
op
t fo
r an
SIP
that
inve
sts
Rs
50
0 e
very
15
th o
f th
e m
on
th in
an
eq
uit
y fu
nd
for a
per
iod
of t
hre
e ye
ars.
NA
V:
The
NA
V o
r th
e n
et a
sset
val
ue
is t
he
tota
l as
set
valu
e p
er u
nit
of
the
mu
tual
fu
nd
aft
er d
edu
ctin
g al
l re
late
d a
nd
per
mis
sib
le
exp
ense
s. T
he
NA
V is
cal
cula
ted
at t
he
end
of e
very
bu
sin
ess
day
. It i
s th
e va
lue
at w
hic
h th
e in
vest
or e
nte
rs o
r exi
ts th
e m
utu
al fu
nd
.
Be
nch
mar
k: A
gro
up
of s
ecu
riti
es, u
sual
ly a
mar
ket i
nd
ex, w
ho
se p
erfo
rman
ce is
use
d a
s a
stan
dar
d o
r ben
chm
ark
to m
easu
re in
vest
men
t p
erfo
rman
ce o
f m
utu
al f
un
ds,
am
on
g o
ther
inve
stm
ents
. So
me
typ
ical
ben
chm
arks
incl
ud
e th
e N
ifty
, Sen
sex,
BSE
20
0, B
SE5
00
, 10
-Yea
r G
sec.
Entr
y Lo
ad: A
mu
tual
fun
d m
ay h
ave
a sa
les
char
ge o
r lo
ad a
t th
e ti
me
of e
ntr
y an
d/o
r exi
t to
co
mp
ensa
te th
e d
istr
ibu
tor/
agen
t. E
ntr
y lo
ad
is c
har
ged
at
the
tim
e an
inve
sto
r p
urc
has
es t
he
un
its
of
a m
utu
al f
un
d.
The
entr
y lo
ad is
ad
ded
to
th
e p
reva
ilin
g N
AV
at
the
tim
e o
f in
vest
men
t. F
or i
nst
ance
, if t
he
NA
V is
Rs.
10
0 a
nd
the
entr
y lo
ad is
1%
, th
e in
vest
or w
ill e
nte
r th
e fu
nd
at R
s. 1
01
.
No
te: S
EBI,
vid
e ci
rcu
lar
dat
ed J
un
e 3
0, 2
00
9 h
as a
bo
lish
ed e
ntr
y lo
ad a
nd
man
dat
ed t
hat
th
e u
pfr
on
t co
mm
issi
on
to
dis
trib
uto
rs w
ill b
e p
aid
by
the
inve
sto
r dir
ectl
y to
the
dis
trib
uto
r, b
ased
on
his
ass
essm
ent o
f var
iou
s fa
cto
rs in
clu
din
g th
e se
rvic
e re
nd
ered
by
the
dis
trib
uto
r.
Exit
Lo
ad: E
xit l
oad
is c
har
ged
at t
he
tim
e an
inve
sto
r red
eem
s th
e u
nit
s o
f a m
utu
al fu
nd
. Th
e ex
it lo
ad is
ded
uct
ed fr
om
the
pre
vaili
ng
NA
V
Ho
w t
o r
ead
Fac
tsh
eet
TER
Dis
clai
me
rs:
1. B
ase
TER
exc
lud
es a
dd
itio
nal
exp
ense
s p
rovi
ded
in R
egu
lati
on
52
(6A
)(b
) an
d 5
2(6
A)(
c) o
f SEB
I (M
utu
al F
un
ds)
Reg
ula
tio
ns,
19
96
an
d G
oo
ds
and
Ser
vice
s Ta
x (G
ST) o
n in
vest
men
t an
d a
dvi
sory
fees
as
per
ap
plic
able
rate
.
2. A
dd
itio
nal
Exp
ense
s n
ot e
xcee
din
g 0
.30
% in
term
s o
f Reg
ula
tio
n 5
2(6
A)(
b) o
f SEB
I (M
utu
al F
un
ds)
Reg
ula
tio
ns,
19
96
.
3
. Ad
dit
ion
al E
xpen
ses
no
t exc
eed
ing
0.0
5%
in te
rms
of R
egu
lati
on
52
(6A
)(c)
of S
EBI (
Mu
tual
Fu
nd
s) R
egu
lati
on
s, 1
99
6.
4. P
rese
nt G
ST ra
te is
18
%.
5. P
erce
nta
ges
men
tio
ned
ab
ove
are
an
nu
aliz
ed.
6. B
ase
TER
of d
irec
t pla
n s
hal
l hav
e a
low
er e
xpen
se ra
tio
exc
lud
ing
dis
trib
uti
on
exp
ense
s, c
om
mis
sio
n, e
tc.,
an
d n
o c
om
mis
sio
n s
hal
l be
pai
d fr
om
su
ch p
lan
s.
at th
e ti
me
of r
edem
pti
on
. Fo
r in
stan
ce, i
f th
e N
AV
is R
s. 1
00
an
d th
e ex
it lo
ad is
1%
, th
e re
dem
pti
on
pri
ce w
ou
ld b
e R
s.9
9 p
er u
nit
.
Mo
dif
ied
Du
rati
on
: Mo
dif
ied
du
rati
on
is th
e p
rice
sen
siti
vity
an
d th
e p
erce
nta
ge c
han
ge in
pri
ce fo
r a u
nit
ch
ange
in y
ield
.
Stan
dar
d D
evi
atio
n: S
tan
dar
d d
evia
tio
n is
a s
tati
stic
al m
easu
re o
f th
e ra
nge
of a
n in
vest
men
t’s
per
form
ance
. Wh
en a
mu
tual
fun
d h
as a
h
igh
sta
nd
ard
dev
iati
on
, its
mea
ns
its
ran
ge o
f per
form
ance
is w
ide,
imp
lyin
g gr
eate
r vo
lati
lity.
Shar
pe
Rat
io: T
he
Shar
pe
Rat
io, n
amed
aft
er it
s fo
un
der
, th
e N
ob
el L
aure
ate
Will
iam
Sh
arp
e, is
a m
easu
re o
f ri
sk-a
dju
sted
ret
urn
s. It
is
calc
ula
ted
usi
ng
stan
dar
d d
evia
tio
n a
nd
exc
ess
retu
rn to
det
erm
ine
rew
ard
per
un
it o
f ris
k.
Bet
a: B
eta
is a
mea
sure
of
an in
vest
men
t’s
vola
tilit
y vi
s-à-
vis
the
mar
ket.
Bet
a o
f le
ss t
han
1 m
ean
s th
at t
he
secu
rity
will
be
less
vo
lati
le
than
the
mar
ket.
A b
eta
of g
reat
er th
an 1
imp
lies
that
the
secu
rity
's p
rice
will
be
mo
re v
ola
tile
than
the
mar
ket.
AU
M: A
UM
or
asse
ts u
nd
er m
anag
emen
t re
fers
to
th
e re
cen
t /
up
dat
ed c
um
ula
tive
mar
ket
valu
e o
f in
vest
men
ts m
anag
ed b
y a
mu
tual
fu
nd
or a
ny
inve
stm
ent f
irm
.
Ho
ldin
gs:
The
ho
ldin
gs o
r th
e p
ort
folio
is
a m
utu
al f
un
d’s
lat
est
or
up
dat
ed r
epo
rted
sta
tem
ent
of
inve
stm
ents
/sec
uri
ties
. Th
ese
are
usu
ally
dis
pla
yed
in t
erm
s o
f per
cen
tage
to
net
ass
ets
or
the
rup
ee v
alu
e o
r b
oth
. Th
e o
bje
ctiv
e is
to
giv
e in
vest
ors
an
idea
of w
her
e th
eir
mo
ney
is b
ein
g in
vest
ed b
y th
e fu
nd
man
ager
.
Nat
ure
of S
che
me
: Th
e in
vest
men
t ob
ject
ive
and
un
der
lyin
g in
vest
men
ts d
eter
min
e th
e n
atu
re o
f th
e m
utu
al fu
nd
sch
eme.
Fo
r in
stan
ce,
a m
utu
al f
un
d t
hat
aim
s at
gen
erat
ing
cap
ital
ap
pre
ciat
ion
by
inve
stin
g in
sto
ck m
arke
ts is
an
eq
uit
y fu
nd
or
gro
wth
fu
nd
. Li
kew
ise,
a
mu
tual
fu
nd
th
at a
ims
at c
apit
al p
rese
rvat
ion
by
inve
stin
g in
deb
t m
arke
ts is
a d
ebt
fun
d o
r in
com
e fu
nd
. Eac
h o
f th
ese
cate
gori
es m
ay
hav
e su
b-c
ateg
ori
es.
Rat
ing
Pro
file
: M
utu
al f
un
ds
inve
st in
sec
uri
ties
aft
er e
valu
atin
g th
eir
cred
itw
ort
hin
ess
as d
iscl
ose
d b
y th
e ra
tin
gs.
A d
epic
tio
n o
f th
e m
utu
al fu
nd
in v
ario
us
inve
stm
ents
bas
ed o
n th
eir r
atin
gs b
eco
mes
the
rati
ng
pro
file
of t
he
fun
d. T
ypic
ally
, th
is is
a fe
atu
re o
f deb
t fu
nd
s.
Re
gula
rD
ire
ctU
ncl
aim
ed
Eco
Nam
e o
f Sc
he
me
Bas
e
TER
1(%
)
Add
itio
nal
expe
nse
as
per
Reg
ulat
ion
52(6
A)(
b)
2(%
)
Gro
ssG
ST 4
(%)
Tota
l TE
R
(%)
BO
I AX
A A
rbit
rage
Fu
nd
0
.70
%
0.0
0%
0
.00
%
0.7
0%
0
.03
%
0.7
3%
0
.27
%
0.0
0%
0
.00
%
0.2
7%
0
.03
%
0.3
0%
0.0
0%
0.0
0%
BO
I AX
A C
on
serv
ativ
e
2.0
3%
0
.00
%
0.0
0%
2
.03
%
0.2
6%
2
.29
%
1.5
1%
0
.00
%
0.0
0%
1
.51
%
0.2
4%
1
.75
%
0
.00
%
1.7
7%
0
.00
%
0.0
0%
1
.77
%
0.2
4%
2
.01
%H
ybri
d F
un
d
BO
I AX
A C
red
it R
isk
Fun
d
1.6
8%
0
.13
%
0.0
5%
1
.86
%
0.2
4%
2
.10
%
1.4
9%
0
.00
%
0.0
5%
1
.54
%
0.2
5%
1
.79
%
0
.00
%
0
.00
%
BO
I AX
A E
qu
ity
Deb
t
2.1
0%
0
.08
%
0.0
5%
2
.23
%
0.2
7%
2
.50
%
1.5
6%
0
.00
%
0.0
5%
1
.61
%
0.2
6%
1
.87
%
0
.00
%
0
.00
%
R
ebal
ance
r Fu
nd
BO
I AX
A L
arge
& M
id C
ap
2.4
3%
0
.30
%
0.0
5%
2
.78
%
0.2
4%
3
.02
%
1.5
9%
0
.00
%
0.0
5%
1
.64
%
0.2
4%
1
.88
%
0
.00
%
1.9
7%
0
.00
%
0.0
5%
2
.02
%
0.2
4%
2
.26
%Eq
uit
y Fu
nd
BO
I AX
A L
iqu
id F
un
d
0.1
8%
0
.00
%
0.0
0%
0
.18
%
0.0
1%
0
.19
%
0.1
0%
0
.00
%
0.0
0%
0
.10
%
0.0
1%
0
.11
%
0.4
9%
0
.00
%
0.0
0%
0
.49
%
0.0
9%
0
.58
%
0
.00
%
BO
I AX
A M
anu
fact
uri
ng
2
.50
%
0.3
0%
0
.05
%
2.8
5%
0
.23
%
3.0
8%
1
.57
%
0.0
0%
0
.05
%
1.6
2%
0
.23
%
1.8
5%
0.0
0%
0.0
0%
and
Infr
astr
uct
ure
Fu
nd
BO
I AX
A M
id &
Sm
all C
ap
2.2
9%
0
.30
%
0.0
5%
2
.64
%
0.2
5%
2
.89
%
1.5
7%
0
.00
%
0.0
5%
1
.62
%
0.2
5%
1
.87
%
0
.00
%
0
.00
%
Eq
uit
y &
Deb
t Fu
nd
BO
I AX
A S
ho
rt T
erm
0
.98
%
0.0
0%
0
.00
%
0.9
8%
0
.10
%
1.0
8%
0
.49
%
0.0
0%
0
.00
%
0.4
9%
0
.07
%
0.5
6%
0.0
0%
0.0
0%
Inco
me
Fun
d
BO
I AX
A T
ax A
dva
nta
ge
2.3
7%
0
.30
%
0.0
0%
2
.67
%
0.2
0%
2
.87
%
1.4
6%
0
.00
%
0.0
0%
1
.46
%
0.2
0%
1
.66
%
0
.00
%
1.9
2%
0
.00
%
0.0
0%
1
.92
%
0.2
0%
2
.12
%Fu
nd
BO
I AX
A U
ltra
Sh
ort
0
.54
%
0.0
0%
0
.00
%
0.5
4%
0
.04
%
0.5
8%
0
.29
%
0.0
0%
0
.00
%
0.2
9%
0
.03
%
0.3
2%
0.0
0%
0.0
0%
Du
rati
on
Fu
nd
Add
itio
nal
expe
nse
as
per
Reg
ulat
ion
52(6
A)(
c)
3(%
)
Bas
e
TER
1(%
)
Add
itio
nal
expe
nse
as
per
Reg
ulat
ion
52(6
A)(
b)
2(%
)
Gro
ssG
ST 4
(%)
Tota
l TE
R
(%)
Add
itio
nal
expe
nse
as
per
Reg
ulat
ion
52(6
A)(
c)
3(%
)
Bas
e
TER
1(%
)
Add
itio
nal
expe
nse
as
per
Reg
ulat
ion
52(6
A)(
b)
2(%
)
Gro
ssG
ST 4
(%)
Tota
l TE
R
(%)
Add
itio
nal
expe
nse
as
per
Reg
ulat
ion
52(6
A)(
c)
3(%
)
Bas
e
TER
1(%
)
Add
itio
nal
expe
nse
as
per
Reg
ulat
ion
52(6
A)(
b)
2(%
)
Gro
ssG
ST 4
(%)
Tota
l TE
R
(%)
Add
itio
nal
expe
nse
as
per
Reg
ulat
ion
52(6
A)(
c)
3(%
)
22
Disclaimer/Statutory DetailsThe data in the Factsheet is updated up to , 2018 unless indicated otherwise. Statements relating to outlook and forecast are the opinions of the Author. The views December 7expressed by the author are personal and are not necessarily that of BOI AXA Investment Managers Private Limited (AMC). This report is for information purpose only and is not intended to be any investment advice. Please make independent research/ obtain professional help before taking any decision of investment/ sale. AMC makes no representation as to the quality, liquidity or market perception of any securities/ issuer/ borrower, if described in the report above, nor does it provide any guarantee whatsoever. Information and material used in this report are believed to be from reliable sources. However, AMC does not warrant the accuracy, reasonableness and/or completeness of any information. AMC does not undertake to update any information or material in this report. Decisions taken by you based on the information provided in this report are to your own account and risk. AMC and any of its officers, directors and employees shall not be liable for any loss or damage of any nature, as also any loss of profit in any way arising from the use of this material in any manner. AMC or its directors, officers and employees, including author of this report/ persons involved in the preparation or issuance of this report may, from time to time, have long or short positions in, and buy or sell the securities, if any, mentioned herein or have other potential conflict of interest with respect to any recommendation and related information and opinions given in the report/ report. This report, or any part of it, should not be duplicated, or contents altered/ modified, in whole or in part in any form and or re-distributed without AMC’s prior written consent. © BOI AXA Investment Managers Private Limited 2018.
Mutual Fund investments are subject to market risks, read all scheme related documents carefully.
AMC Website: www.boiaxamf.com is also an Investor Service Centre (for online transactions)
B/204, Tower 1, Peninsula Corporate Park, Ganpatrao Kadam Marg, Lower Parel, Mumbai - 400 013.Toll free number : 1800-103-2263 & 1800-266-2676 • Alternate number : 020-4011 2300 & 020-6685 4100 • Website : www.boiaxamf.com • Email : [email protected]
BOI AXA Investment Managers Pvt. Ltd.(Investment Manager for BOI AXA Mutual Fund)
BOI AXA Investment Managers’ Branches - Investor Service Centers (ISC's)
• Ahmedabad - Shop No.:- 405, 4th Floor, Zodiac Plaza, H. L. College Road, Navrangpura, Ahmedabad - 380 009. • Bangalore - 957, Regus Business Centre, Bangalore Pvt. Ltd., Level 9, Raheja Towers, 26 - 27, Mahatma Gandhi Road, Bangalore - 560 001. • Bhopal - F. F. 16, Part B, Mansarover Complex, Near Habibganj Railway Station, Bhopal - 462 016. • Chandigarh - 205, Megabyte Business Centre, SCO-333-334, Ist Floor, Sec-35B Chandigarh - 160 022. • Chennai - Cabin No. 203, Apeejay Business Center No: 39/12, Haddows Road, Nungambakkam, Chennai - 600 034. • Hyderabad - Cabin No. 23, Apeejay Business Centre, Tresorie, The Park, 22 Rajbhavan Road, Somajiguda, Hyderabad - 500 082. • Jaipur - Office no.154, 1st Floor, Ganpati Plaza,M I Road, Jaipur - 302 001. • Kolkata - Cabin 06, Block - A, 8th Floor, Apeejay House, 15 Park Street, Kolkata - 700 016. • Lucknow - Office No-504, 5th Floor, Sriram Tower, 13 Ashok Marg, Hazratganj, Lucknow - 226 001. • Mumbai - B/204, Tower 1, Peninsula Corporate Park, Ganpatrao Kadam Marg, Lower Parel, Mumbai - 400 013. • New Delhi - Room No. 610, Avanta Business Center, 4th Floor, Statesman House, Barakhamba Road, Connaught Place, New Delhi - 110 001. • Pune - Apeejay Business Centre, 1st Floor, Pride House, S.No. 108/7, Shivajinagar, University Road, Pune - 411 016. • Vadodara - 118, 1st Floor, Siddharth Complex, R C Dutt Road, Alkapuri, Vadodara - 390 005.
Karvy Fintech Private Ltd Branches - Investor Service Centers (ISC's)
• Agra: 1st Floor, Deepak Wasan Plaza, Behind Holiday Inn, Sanjay Place, Agra - 282 002. • Ahmedabad: 201/202, Shail Complex, Opp: Madhusudan House, B/H Girish Cold Drink, Off C G Road, Navrangpura, Ahmedabad - 380 006. • Akola: Yamuna Tarang Complex, Shop No 30, Ground Floor, N.H. No- 06, Murtizapur Road, Opp Radhakrishna Talkies, Akola - 444 004. • Allahabad: Rsa Towers, 2nd Floor, Above Sony Tv Showroom, 57, S P Marg, Civil Lines, Allahabad - 211 001. • Ambala: 6349, Nicholson Road, Adjacent Kos Hospital, Ambala Cant, Ambala - 133 001. • Amritsar: 72-A, Taylor'S Road, Opp Aga Heritage Club, Amritsar - 143 001. • Anand: B-42, Vaibhav Commercial Center, Nr Tvs Down Town Shrow Room, Grid Char Rasta, Anand - 380 001. • Andheri: 6 & 7, 131 Andheri Industrial Estate, Veera Desai Road, Andheri (West), Mumbai - 400 053. • Asansol: 114/71, G T Road, Bhanga Panchil, Near Nokia Care, Asansol - 713 303. • Aurangabad: Ramkunj Niwas, Railway Station Road, Near Osmanpura Circle, Aurangabad - 431 005. • Bangalore: 59, Skanda Puttanna Road, Basavanagudi, Bangalore - 560 004. • Baroda: 203, Corner Point, Jetalpur Road, Baroda - 390 007. • Belgaum: Cts No 3939/ A2 A1, Above Raymonds Show Room, Beside Harsha Appliances, Club Road, Belgaum - 590 001. • Bhagalpur: 2nd Floor, Chandralok Complex, Ghantaghar, Radha Rani Sinha Road, Bhagalpur - 812 001. • Bhavnagar: 303, Sterling Building,,Above HDFC Bank,,Waghawadi Road,,Bhavnagar - 364 001. • Bhopal: Kay Kay Business Centre, 133, Zone I, Mp Nagar, Above City Bank, Bhopal - 462 011. • Bhubaneswar: A/181, Back Side of Shivam Honda Show Room, Saheed Nagar, Bhubaneswar - 751 007. • Bilaspur: Shop No - 225, 226 & 227, 2nd Floor, Narayan Plaza, Link Road, Bilaspur - 495 001. • Bokaro: B-1, 1St Floor, City Centre, Sector- 4, Near Sona Chandi Jwellars, Bokaro - 827 004. • Borivali: Gomati Smuti, Ground Floor, Jambli Gully, Near Railway Station, Borivali, Mumbai - 400 092. • Burdwan: 63, G.T. Road, 1ST Floor, Halder Complex, Birhata, Burdwan - 713 101. • Calicut: 2nd Floor, Soubhagya Shopping Complex, Arayidathpalam, Mavoor Road, Calicut - 673 004. • Chandigarh: Sco- 2423-2424, Above Mirchi Restaurent, New Aroma Hotel, First Floor, Sector 22-C, Chandigarh - 160 022. • Chembur: Shop No 4, Ground Floor, Shram Saflya Bldg, N G Acharya Marg, Chembur, Mumbai - 400 071. • Chennai: F-11, Akshaya Plaza, 1st Floor, 108, Adhithanar Salai, Egmore, Opp To Chief Metropolitan Court, Chennai - 600 002. • Cochin: Ali Arcade, 1st Floor, Kizhavana Road, Panampilly Nagar, Near Atlantis Junction, Ernakualm - 682 036. • Coimbatore: 3rd Floor, Jaya Enclave, 1057 Avinashi Road, Coimbatore - 641 018. • Cuttack: Po - Buxi Bazar, Cuttack, Opp Dargha Bazar Police station, Dargha Bazar, Cuttack - 753001. • Dalhousie: 2nd Floor, Room No-226, R N Mukherjee Road, Kolkata - 700 001. • Dehradun: Kaulagarh Road, Near Sirmaur Margabove, Reliance Webworld, Dehradun - 248 001. • Dhanbad: 208 New Market, 2nd Floor, Bank More, Dhanbad - 826 001. • Durgapur: MWAV-16, Bengal Ambuja, 2nd Floor, City Centre, Distt. Burdwan, Durgapur - 713 216. • Erode: No: 4, Veerappan Traders Complex, KMY Salai, Sathy Road, Opp. Erode Bus Stand, Erode - 638003. • Faridabad: A-2B, 1st Floor, Nehru Ground, Neelam Bata Road, NIT, Faridabad - 121001. • Gandhinagar: 123, First Floor, Megh Malhar Complex, Opp. Vijay Petrol Pump, Sector - 11, Gandhinagar - 382 011. • Ghaziabad: 1St Floor C-7, Lohia Nagar, Ghaziabad - 201 001. • Gorakhpur: Above V.I.P. House Ajdacent, A.D. Girls College, Bank Road, Gorakpur - 273 001. • Gurgaon: Shop No.18, Ground Floor, Sector - 14, Opp. Akd Tower, Near Huda Office, Gurgaon - 122 001. • Guwahati: 1st Floor, Bajrangbali Building, Near Bora Service Station, GS Road, Guwahati - 781 007. • Gwalior: 2nd Floor, Rajeev Plaza, Jayendra Ganj, Lashkar, Gwalior - 474 009. • Hubli: CTC No.483/A1/A2, Ground Floor, Shri Ram Palza, Behind Kotak Mahindra Bank, Club Road, Hubli - 580 029. • Hyderabad: KARVY HOUSE, No:46, 8-2-609/K, Avenue 4, Street No. 1, Banjara Hills, Hyderabad - 500 034. • Hyderabad (Gachibowli): KARVY Selenium, Plot No: 31 & 32, Tower B, Survey No.115/22, 115/24, 115/25, Financial District, Gachibowli, Nanakramguda, Serilimgampally Mandal, Hyderabad - 500 032. • Indore: 2nd Floor, 203-205 Balaji Corporate House, Above ICICI Bank, 19/1 New Palasia, NearCurewell Hospital, Janjeerwala Square, Indore - 452 001. • Jabalpur: Grover Chamber, 43 Naya Bazar, Malviya Chowk, Opp Shyam Market, Jabalpur - 482 002. • Jaipur: S16/A, IIIrd Floor, Land Mark Building, Opp Jai Club, Mahaver Marg, C Scheme, Jaipur - 302 001. • Jalandhar: 1st Floor, Shanti Towers, SCO No. 37, PUDA Complex, Opposite Tehsil Complex, Jalandhar - 144 001. • Jammu: Gupta’s Tower, 2nd Floor, CB-12, Rail Head Complex, Jammu - 180 012. • Jamshedpur: 2nd Floor, R R Square, SB Shop Area, Near Relaance Foot Print & Hotel- BS Park Plaza, Main Road, Bistupur, Jamshedpur - 831 001. • Jodhpur: 203, Modi Arcade, Chopasni Road, Jodhpur - 342 001. • Kanpur: 15/46, B, Ground Floor, Opp : Muir Mills, Civil Lines, Kanpur - 208 001. • Kolhapur: 605/1/4 E Ward, Shahupuri 2nd Lane, Laxmi Niwas, Near Sultane Chambers, Kolhapur - 416 001. • Kolkata: Apeejay House (Beside Park Hotel), C Block, 3rd Floor, 15 Park Street, Kolkata - 700 016. • Lucknow: Ist Floor, A. A. Complex, 5 Park Road, Hazratganj, Thaper House, Lucknow - 226 001. • Ludhiana: Sco - 136, 1st Floor, Above Airtel Showroom, Feroze Gandhi Market, Ludhiana - 141 001. • Madurai: Rakesh Towers, 30-C, Ist Floor, Bye Pass Road, Opp Nagappa Motors, Madurai - 625 010. • Margoa: 2nd Floor, Dalal Commercial Complex, Pajifond, Margao - 403 601. • Meerut: 1st Floor, Medi Centre, Opp. ICICI Bank, Hapur Road, Near Bachha Park, Meerut - 250 002. • Moradabad: Om Arcade, Parker Road, Above Syndicate Bank, Chowk Tari Khana, Moradabad - 244 001. • Mumbai: 24/B, Raja Bahadur Compound, Ambalal Doshi Marg, Behind BSE Bldg, Fort - 400 001. • Muzaffarpur: First Floor, Shukla Complex, Near ICICI Bank, Civil Court Branch, Company Bagh, Muzaffarpur - 842 001. • Nagpur: Plot No 2/1, House No 102/1, Mata Mandir Road, Mangaldeep Appartment, Opp Khandelwal Jewelers, Dharampeth, Nagpur - 440 010. • Nanded: Shop No. 4, Santakripa Market, G G Road, Opp.Bank o f India, Nanded - 431 601. • Nasik: S-9, Second Floor, Suyojit Sankul, Sharanpur Road, Nasik - 422 002. • New Delhi: 305, New Delhi House, 27 Barakhamba Road, New Delhi - 110 001. • Noida: 405, 4th Floor, Vishal Chamber, Plot No.1, Sector-18, Noida - 201 301. • Panipat: JAVA Complex, 1st Floor, Above Vijaya Bank, G T Road, Panipat - 132 103. • Panjim: Flat No.1-A, H. No. 13/70, Timotio Bldg, Heliodoro Salgado Road, Next to Navhind Bhavan (Market Area), Panjim - 403 001. • Patiala: SCO 27 D, Chotti Baradari, Near Car Bazaar, Patiala, Punjab, Pincode: 147 001. • Patna: 3A, 3rd Floor, Anand Tower, Exhibition Road, Opp ICICI Bank, Patna - 800 001. • Pune: Mozaic Bldg, CTS No.1216/1, Final Plot No.576/1 TP, Scheme No.1, F C Road, Bhamburda, Shivaji Nagar, Pune - 411 004. • Raipur: Office No S-13, Second Floor, Reheja Tower, Fafadih Chowk, Jail Road, Raipur - 492 001. • Rajkot: 302, Metro Plaza, Near Moti Tanki Chowk, Rajkot, Gujarat - 360 001. • Ranchi: Room No 307, 3rd Floor, Commerce Tower, Beside Mahabir Tower, Ranchi - 834 001. • Rohtak: 1st Floor, Ashoka Plaza, Delhi Road, Rohtak - 124001.• Rourkela: 1st Floor, Sandhu Complex, Kachery Road, Uditnagar, Rourekla - 769 012. • Secunderabad: Crystal Plaza, 2nd Floor, Manday Lane, Near Sunshine Hospital, P G Road, Secunderabad - 500 003. • Shillong: Annex Mani Bhawan, Lower Thana Road, Near R K M Lp School, Shillong - 793 001. • Siliguri: Nanak Complex, Sevoke Road, Siliguri - 734 001. • Solapur: Block No 06, Vaman Nagar, Opp D-Mart, Jule Solapur, Solapur - 413 004. • Surat: Office No. 516, 5th Floor, Empire State Building, Near Udhna Darwaja, Ring Road, Surat - 395002. • T Nagar: G1, Ground Floor, No 22, Vijayaraghava Road, Swathi Court, T Nagar, Chennai - 600 017. • Thane: 101, Yaswant Tower, 1st Floor, Opposite Puja Hotel, Ram Maruti Road, Naupada, Thane (West), Mumbai - 400 602. • Udaipur: 201-202, Madhav Chambers, Opp G P O, Chetak Circle, Udaipur -313 001. • Ujjain: 101 Aashta Tower, 13/1 Dhanwantri Marg, Freeganj, Ujjain - 456 010. • Varanasi: D-64/132, 1st Floor, Anant Complex, Sigra, Varanashi - 221 010. • Vashi: Shop No.43-A, Ground Floor, Vashi Plaza, Sector-17, Near Apna Bazar, Vashi, Mumbai - 400 705. • Vijayawada: 39-10-7, Opp : Municipal Water Tank, Labbipet, Vijayawada - 520 010. • Vile Parle: 104, Sangam Arcade, V P Road, Opp: Railway Station, Above Axis Bank Atm, Vile Parle (West), Mumbai - 400 056. • Visakhapatnam: Door No: 48-8-7, Dwaraka Diamond, Ground Floor, Srinagar, Visakhapatnam - 530 016.
Date of Publication: 7/12/2018
23
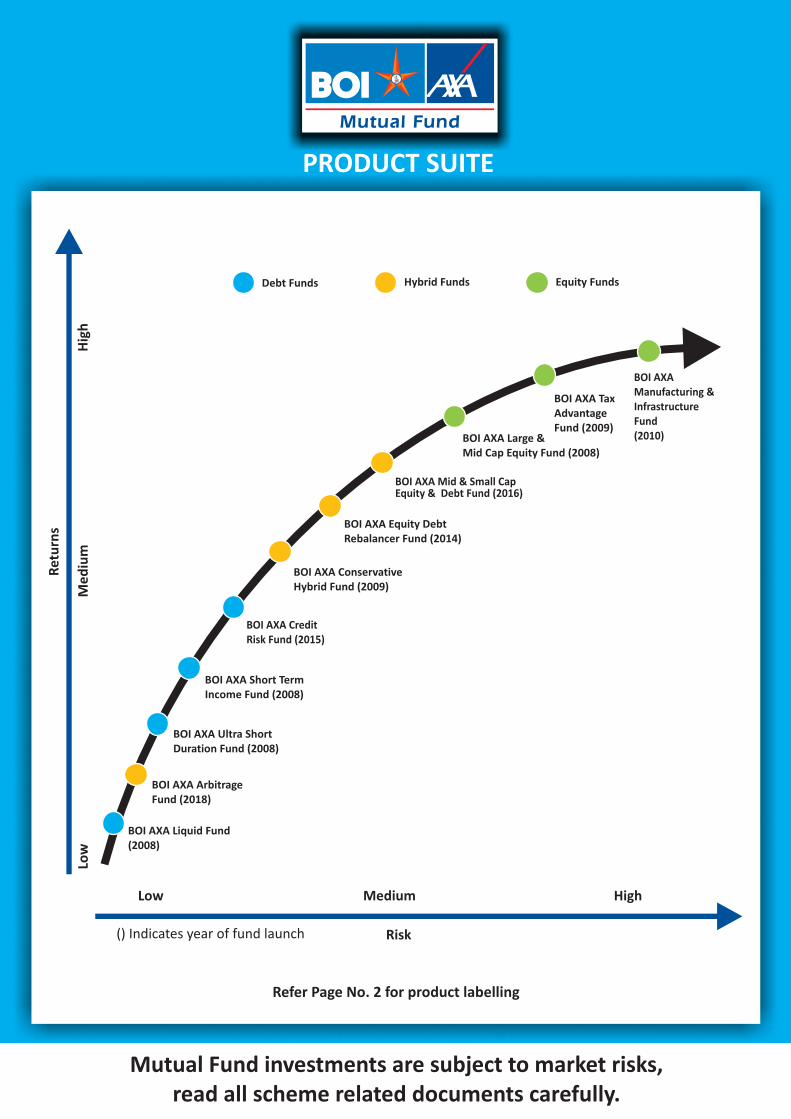
PRODUCT SUITE
Mutual Fund investments are subject to market risks, read all scheme related documents carefully.
Refer Page No. 2 for product labelling
Risk
Low Medium High
() Indicates year of fund launch
Low
Me
diu
mH
igh
Ret
urn
s
BOI AXA Conservative Hybrid Fund (2009)
BOI AXA Credit Risk Fund (2015)
BOI AXA Manufacturing & Infrastructure Fund(2010)
BOI AXA Tax Advantage Fund (2009)
BOI AXA Large & Mid Cap Equity Fund (2008)
BOI AXA Mid & Small Cap Equity & Debt Fund (2016)
BOI AXA Equity Debt Rebalancer Fund (2014)
BOI AXA Short Term Income Fund (2008)
BOI AXA Ultra Short Duration Fund (2008)
BOI AXA Liquid Fund (2008)
BOI AXA Arbitrage Fund (2018)
Debt Funds Hybrid Funds Equity Funds