1
SMALL BUSINESSES COMPRISE: ALL FIRMS with paid employees ALL FIRMS EXPORTING FIRMS KNOWN EXPORT VALUE PRIVATE SECTOR EMPLOYEES PRIVATE SECTOR PAYROLL August, 2018 WHAT IS A SMALL BUSINESS? BED, [2000-2017] Small businesses accounted for 66% of net new jobs. NUMBER OF FIRMS SBO [2012] 15M 20M 19.2M 8.0M 273K 1.9M 2.5M 2.6M 3.3M 2.5M 9.9M 14.8M 10M 5M Nonminority Minority American Indian and Alaska Native Asian Veteran Equally Male/ Woman Owned Black or African American Hispanic Woman Owned Male Owned BDS [2015] 414K STARTUPS* 396K CLOSURES * A startup is a firm that is less than one year old. 30.2M SMALL BUSINESSES IN THE U.S. NES Nonemployer Statistics BDS Business Dynamics Statistics SBO Survey of Business Owners SUSB Statistics of US Businesses US CENSUS BUREAU BED Business Employment Dynamics, Bureau of Labor Statistics ITA International Trade Administration, US Department of Commerce 66 % 66 % NET NEW JOBS NET NEW JOBS SUSB, NES [2015], ITA [2015] 99.9% 99.7% 32.9% 47.5% 40.8% 97.6% A small business is an independent business with fewer than 500 employees. 20% Paid employees SUSB, NES [2015] 80% No employees For even more information visit www.sba.gov/advocacy

SMALL BUSINESSES COMPRISE · SMALL BUSINESSES COMPRISE: ALL FIRMS with paid employees ALL FIRMS EXPORTING KNOWN EXPORT VALUE PRIVATE SECTOR EMPLOYEES PRIVATE SECTOR PAYROLL August,

  • Upload
    others

  • View
    3

  • Download
    0

Embed Size (px)

Citation preview

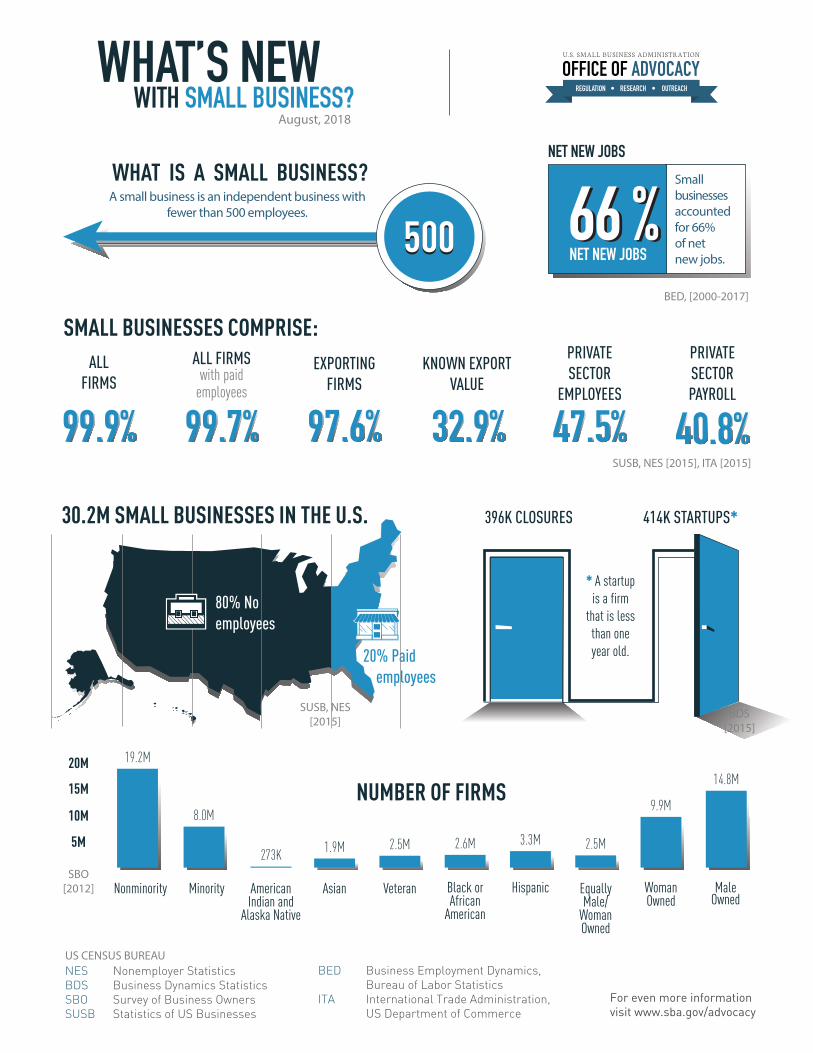
SMALL BUSINESSES COMPRISE:ALL FIRMS

with paidemployees

ALL FIRMS

EXPORTING FIRMS

KNOWN EXPORT VALUE

PRIVATE SECTOR

EMPLOYEES

PRIVATESECTORPAYROLL

August, 2018

WHAT IS A SMALL BUSINESS?

BED, [2000-2017]

Smallbusinessesaccountedfor 66%of netnew jobs.

NUMBER OF FIRMS

SBO[2012]

15M

20M 19.2M

8.0M

273K 1.9M 2.5M 2.6M 3.3M 2.5M

9.9M

14.8M

10M

5M

Nonminority Minority AmericanIndian and

Alaska Native

Asian Veteran EquallyMale/

WomanOwned

Black orAfrican

American

Hispanic WomanOwned

MaleOwned

BDS[2015]

414K STARTUPS*396K CLOSURES

* A startupis a firm

that is lessthan oneyear old.

30.2M SMALL BUSINESSES IN THE U.S.

NES Nonemployer StatisticsBDS Business Dynamics StatisticsSBO Survey of Business OwnersSUSB Statistics of US Businesses

US CENSUS BUREAUBED Business Employment Dynamics,

Bureau of Labor StatisticsITA International Trade Administration,

US Department of Commerce

66 %66 %NET NEW JOBS

NET NEW JOBS

SUSB, NES [2015], ITA [2015]

99.9% 99.7% 32.9% 47.5% 40.8%97.6%

A small business is an independent business with fewer than 500 employees.

20% Paid employees

SUSB, NES[2015]

80% No employees

For even more information visit www.sba.gov/advocacy