Embed Size (px)
Citation preview
1
Small area estimation and advances in demographic tool kits for fertility analysis: The 4-
parameters Own-Children Method and a Poisson regression based person-period approach
Abstract
This study assesses the relative capabilities of the 4-parameter own children method and a
person-period approach in estimating fertility rates of small geographical areas. The paper was
designed to appraise the Excel toolkit designed by Garenne and McCaa (2017) to implement a
4-parameter own children method and Schoumaker’s (2013) Stata software command tfr2
which implements a Poisson regression-based person-period approach to calculate fertility
rates. Using a descriptive approach, analyses were conducted on the 2015 Zimbabwe
Demographic and Health Survey, applying the two tools and methods to the estimation of
national and subnational fertility rates. Results showed that although both toolkits were
relatively strong in small area estimation of fertility, the 4-parameter own-children Excel
toolkit was more stable in reconstructing fertility trends of small sample sizes. The study
concluded that the 4-parameter own children method can be a reliable reference method for
studying fertility trends of small areas.
INTRODUCTION
Derivation of accurate estimates of fertility measures is a crucial component of understanding
past and current demographic patterns and changes. When combined with accurate mortality
estimates, fertility measures enhance effective projection of future demographic trends. An
accurate picture of the fertility profile of a country is vital for government planning, social
policy formulation and other population and development-oriented decision-making processes
and implementation of relevant interventions. Adapting national policies to small geographical
localities is even more important as this provides a basis for implementing impactful
interventions that are adapted to local needs. For instance, teenage fertility rates in a country
can vary by province or even districts due to differences in socio-economic contexts. In such
circumstances, the importance of having fertility estimation techniques and toolkits that
produce reliable indicators of fertility at low levels of aggregation is invaluable.
When fertility measures are not accurately estimated, governments’ efforts to make optimal
population-driven social spending are compromised thereby resulting in imbalances between
actual population needs and equitable distribution of services. Demographers therefore need to
produce accurate fertility estimates from the local level to national and regional levels. In the
context of sub-Saharan Africa (SSA) however, estimation of fertility measures has traditionally
been hampered by underdeveloped vital registration systems. Besides the decennial censuses,
2
population scientists have mostly relied on household survey data to generate estimates for
indicators of demographic events.
The introduction of World Fertility Surveys (WFS) in Africa (1977-1983) followed by
Demographic and Health Surveys (DHS) (1986-present) have contributed significantly to
filling the gap in data at sufficiently regular time intervals suitable for fertility research as well
as tracking changes in other indicators related to population and development. However, the
widely available DHS data are still not as reliable as complete registration systems that are well
established in the developed countries and can be easily used for localised fertility analysis.
One of the limitations of household survey data is that analysis of small geographical localities
can be compromised by limited sample sizes. For instance, cluster-level mortality rates are
difficult to derive from household survey data because of very small numbers of deaths per
cluster. This means that mortality estimates used in fertility estimation would have to be
borrowed from higher levels of aggregation. Nonetheless, with appropriate innovations in
estimation techniques and tool kits, reliable fertility estimates can be derived from survey data
to provide a basis for evidence-based understanding of spatial variability of fertility regimes
even at small geographic areas. During the post 2010 period, there have been innovations in
techniques and toolkits for fertility estimation that that can be applied to analysis of data for
small populations. One of these innovations was the adaptation of the Own Children Method
(OCM) to a 4-parameter OCM by Garenne and McCaa (2017). The other recent innovation
was by Schoumaker (2013) who developed a Stata module tfr2 that implements a person-period
approach.
The OCM is a reverse survival technique used to indirectly estimate fertility rates using
household survey or census data. The OCM was originally developed in the 1950s for
application with census data to generate estimates of fertility differentials (Avery et al., 2013).
Cho et al. (1986) are credited with developing the first manual for implementing the OCM.
The appeal of the OCM technique is that it can be applied by different scholars including those
in the field of anthropology who are mostly interested in understanding small communities
(Childs, 2004). According to Avery et al. (2013), the OCM can be applied with small samples
and any survey data that has age distribution by sex, household indicators namely line number,
relationship statuses, and survivorship status of each child’s mother.
3
Previous applications of the method including on small areas such as by Abbasi-Shavazi (1997)
and Childs (2001) involved making use of the Coale and Demeny (1983) model life tables
(MLTs) to derive mortality measures for use with OCM. A critic of using MLTs with OCM is
that resulting fertility estimates are easily affected if the mortality profile of the population
being studied deviates from that implied by the selected region of MLT (Cho et al., 1986).
When mortality estimates from external sources like MLTs are used with an indirect fertility
estimation technique, there is a risk of inflating numbers of children thereby interfering with
the resulting fertility levels. Furthermore, localised mortality indicators can differ markedly
among geographic areas within one country and this may not be fully captured when using
MLTs as a basis for adult mortality measure because mortality will be erroneously assumed to
be uniform across provinces or districts.
The 4-parameter OCM by Garenne and McCaa (2017) differs from previous OCM methods in
that it does not require the use of external data sources for estimating adult mortality and thus
accounts for spatial disparities in adult mortality. It obtains estimates of female adult mortality
is based on survival status of children’s mothers through logit transformation of proportions
who are maternal orphans, and use the logits to indirectly estimate adult mortality. The
differences in the derived logits, intercepts and slopes can reflect variability in adult mortality
across geographical areas. This was assessed using the ZDHS2015 and provincial differences
in adult mortality implied by proportions orphaned were found as shown in the differences in
the fitted linear trends of orphanhood (Figure 1).

4
Figure 1. Expected proportions of mothers who died based on ZDHS2015
There are existing studies that have conducted an appraisal of the OCM (Avery et al., 2013;
Krapf and Kreyenfeld, 2015) and those that have applied the method to examining fertility
trends (Abbasi-Shavazi, 1997; Abbasi-Shavazi and McDonald, 2000; Coleman and Dubuc,
2010; Dubuc, 2009). These studies employed OCM versions different from the 4-parameter
OCM which simplifies the process of computing fertility rates. This descriptive study was
designed to assess the effectiveness of the Garenne and McCaa (2017) 4-parameter OCM
technique in estimation of fertility rates with the goal of determining its performance for small
geographical areas.
The Stata module by Schoumaker (2013), known as tfr2, implements a regression-based direct
estimation technique utilising birth history data. The use of maternity history data in fertility
estimation is known as the Full Birth History (FBH) approach and is the method used in official
DHS reports. Schoumaker and Hayford (2004) have provided a detailed treatment of the FBH
method. The tfr2 programme was designed to produces fertility estimates similar to those
reported in official DHS reports and therefore can be used as a benchmark to appraise the utility
of the OCM technique as modified by Garenne and McCaa (2017). It has already been
y = 0.0039x + 0.0314
R² = 0.8874
y = 0.0027x + 0.0322
R² = 0.8344
y = 0.0071x - 0.0552
R² = 0.8244
-0.10
-0.05
0.00
0.05
0.10
0.15
0.20
0.25
0.30
15 16 17 18 19 20 21 22 23 24 25 26 27 28 29 30 31 32 33 34 35 36 37 38 39 40 41 42 43 44 45 46 47 48 49
Pro
po
rtio
n w
ho
die
d
Age
Bulawayo Manicaland Zimbabwe
Bulawayo Manicaland Zimbabwe
5
demonstrated that Poisson regression can be used to compute classic fertility indicators
(Powers and Xie, 2008; Schoumaker and Hayford, 2004). Schoumaker (2013) developed a
Stata module tfr2 that executes Poisson regression based on birth history data to compute
ASFRs, total fertility rates (TFRs) and reconstructing annual fertility trends (Schoumaker,
2013). Following a comparative approach, the aim of this study was to conduct a descriptive
appraisal of the Garenne (2011) OCM-variant and the FBH method as implemented using
Schoumaker’s (2013) tfr2 Stata programme.
DATA, METHODS AND ANALYTICAL STRATEGY
Data
This study was based on data extracted from the 2015 Zimbabwe Demographic and Health
Survey (ZDHS2015). The DHS data were obtained from Measure DHS
(www.measuredhs.com) which administers surveys to respondents from nationally
representative samples of households. The collection of DHS data is based on standardised
questionnaires that yield different data files. This study analysed data from the individual and
household data files. The linked nature of the DHS data allowed for consistent selection and
inclusion of the sample from the different data files.
Methods for estimating fertility
Implementing the 4-parameter OCM followed the steps described in Garenne and McCaa
(2017, pp. 9–11). As the name suggests, the 4-parameter OCM involves four main steps needed
to obtain the necessary parameters the allow for ASFRs and TFRs to be estimated for each
year. In the first step, enumerated children in the household file were matched to their mothers
listed in the Individual Recode. Secondly, children were classified by single year and single
year of their mothers. Thirdly, unmatched children were redistributed across the single-year
age groups of enumerated mothers. This eradicates the margin by which fertility would be
underestimated by excluding unmatched children although child mortality is still not yet fully
accounted for in the method. In the fourth step, the female population is reverse-survived by
single-year so that each year has an appropriate denominator for computing the fertility rates.
The mortality-adjusted reverse-survived female population enables for changing age structure
to be controlled thereby ensuring less fluctuations in the yearly estimates (Hosseini-Chavoshi
et al., 2017). Adjusting for adult female mortality was based on the logit transformations of
orphanhood data as suggested by Garenne and McCaa (2017).
6
Computing fertility rates using Poisson regression was executed in Stata using the tfr2
command written by Schoumaker (2013, pp. 1111–1112). The tfr2 command comprises two
components; the first component transforms birth history data into a table of births and
exposure and the second component is a Poisson model that estimates ASFRs, TFRs and
reconstruct trends in TFRs (Schoumaker, 2013). The application of Poisson regression in the
estimation of fertility rates using DHS data was first explored by Schoumaker (2001) in the
analysis of legitimate fertility in rural Morocco although the principle for the method for
analysing count data like births had been addressed before (Powers and Xie, 2000;
Winkelmann and Zimmermann, 1994). Schoumaker and Hayford (2004) applied the Poisson
regression-based person-period approach to the analysis of fertility data from DHS data for
Burkina Faso and Zimbabwe, calculating fertility rates and reconstructing trends of TFRs. To
implement the method, fertility data is first reorganised into person-periods such that the
exposure variable (age/person-years) is based on the age of the mother at the time of birth rather
than age at the time of interview (Schoumaker and Hayford, 2004). This means that a mother
aged 21 years at the time of interview who has had a second birth within the preceding 12
months but four years after her first birth will be considered in two age groups, the 15-19 and
20-24 age groups and not just the 20-24 age group.
Analytical strategy
The analytical strategy for the study involved two main parts. The first part involved national-
level estimation of ASFRs and TFRs. Application of OCM and FBH approaches to obtain
fertility measures at national level has already been demonstrated (Avery et al., 2013; Garenne,
2011; Schoumaker, 2013). It was undertaken in this study to provide a basis for appraising the
utility of the two methods in deriving fertility rates of small localities using DHS data. The
expectation was that each method was to perform similarly at national and sub-national levels.
The second part of data analysis involved applying the OCM and FBH methods to selected
clusters from Bulawayo and Manicaland provinces. These two provinces where chosen because
they represent the two extremes of provincial fertility rates in Zimbabwe with Bulawayo having
the lowest and Manicaland having the highest. According to the ZDHS2015, the TFR for
Bulawayo province is 2.73 while that of Manicaland is 4.96. The clusters selected from
Bulawayo were 235, 239, 246, 247 and 266 while from Manicaland 218, 225, 244, 249, 254
and 256 were selected. This yielded sample sizes of 130 for Bulawayo and 134 for Manicaland.
7
RESULTS
National-level fertility rates
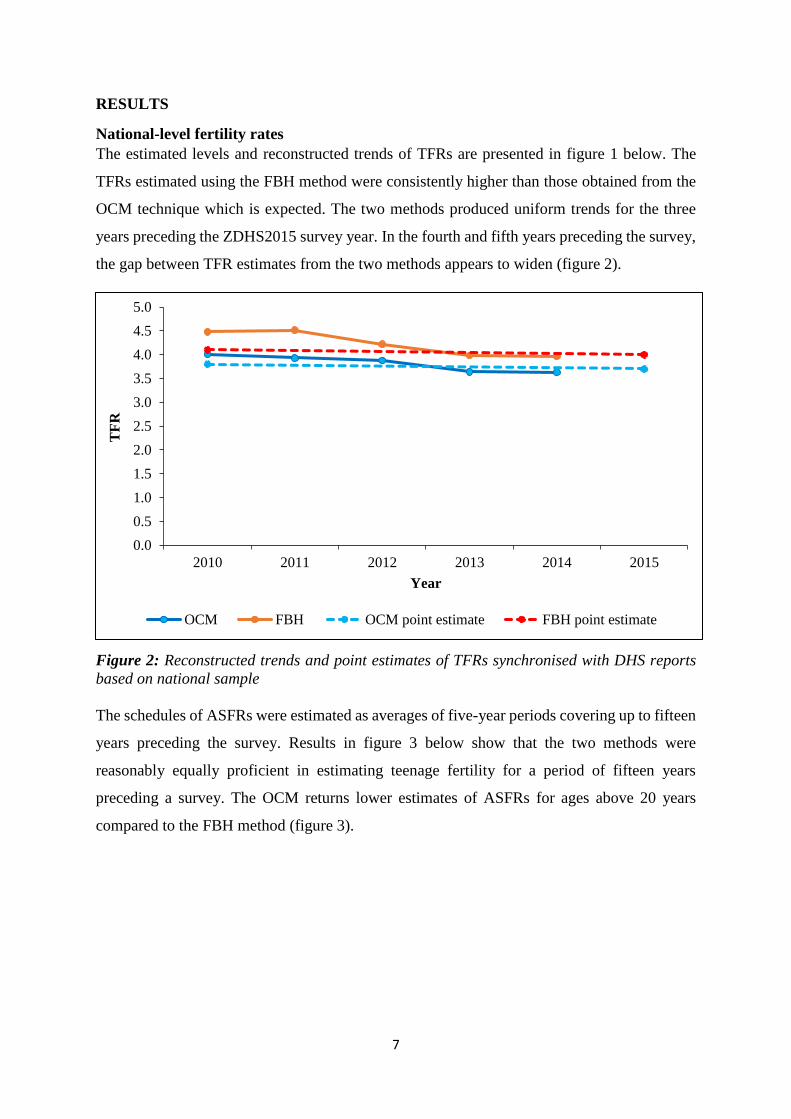
The estimated levels and reconstructed trends of TFRs are presented in figure 1 below. The
TFRs estimated using the FBH method were consistently higher than those obtained from the
OCM technique which is expected. The two methods produced uniform trends for the three
years preceding the ZDHS2015 survey year. In the fourth and fifth years preceding the survey,
the gap between TFR estimates from the two methods appears to widen (figure 2).
Figure 2: Reconstructed trends and point estimates of TFRs synchronised with DHS reports
based on national sample
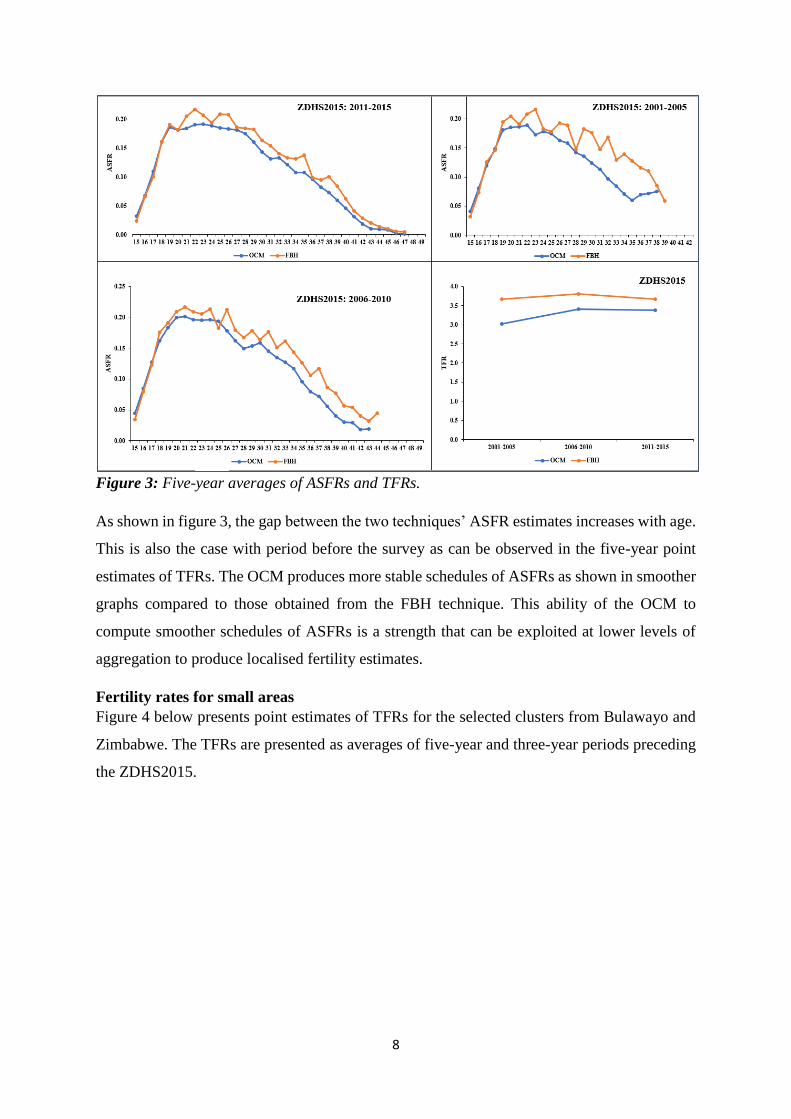
The schedules of ASFRs were estimated as averages of five-year periods covering up to fifteen
years preceding the survey. Results in figure 3 below show that the two methods were
reasonably equally proficient in estimating teenage fertility for a period of fifteen years
preceding a survey. The OCM returns lower estimates of ASFRs for ages above 20 years
compared to the FBH method (figure 3).
0.0
0.5
1.0
1.5
2.0
2.5
3.0
3.5
4.0
4.5
5.0
2010 2011 2012 2013 2014 2015
TF
R
Year
OCM FBH OCM point estimate FBH point estimate
8
Figure 3: Five-year averages of ASFRs and TFRs.
As shown in figure 3, the gap between the two techniques’ ASFR estimates increases with age.
This is also the case with period before the survey as can be observed in the five-year point
estimates of TFRs. The OCM produces more stable schedules of ASFRs as shown in smoother
graphs compared to those obtained from the FBH technique. This ability of the OCM to
compute smoother schedules of ASFRs is a strength that can be exploited at lower levels of
aggregation to produce localised fertility estimates.
Fertility rates for small areas
Figure 4 below presents point estimates of TFRs for the selected clusters from Bulawayo and
Zimbabwe. The TFRs are presented as averages of five-year and three-year periods preceding
the ZDHS2015.

9
Figure 4. Five and three-year point estimates of TFRs
The results in figure 4 show higher TFR estimates computed from the FBH method compared
to those from the OCM technique especially for Bulawayo clusters. In Manicaland, the two
methods produced closely similar estimates of TFRs. The TFR obtained from the FBH
approach for the three years preceding the survey was 4.8 while the OCM produced a TFR of
4.1. The five-year average TFR for the selected clusters from Manicaland was 4.5 based on the
FBH method and 4.2 based on the OCM technique. There were more defined differences in
TFRs obtained from the two methods for Bulawayo clusters the three-year average TFRs were
3.2 and 1.9 based on the FBH and OCM techniques respectively. The five-year average TFR
estimate computed from FBH for clusters from Bulawayo was 4.1 while that obtained from the
OCM technique was 2.3. the point estimates presented in figure 4 were averages of the
reconstructed annual trends which are presented below.
Reconstructing trends in TFRs of the aggregated selected clusters from Bulawayo and
Manicaland revealed sources of biases of the point estimates presented in figure 4. As shown
in figure 5 below, reconstructed fertility based on the FBH method markedly fluctuate,
indicating possible effects of misreporting of births by respondents. Meanwhile, TFR trends
obtained from the OCM technique have less fluctuations and appear to be more reflective of
expected yearly changes in fertility levels. Unlike estimates from FBH method, fertility levels
obtained from OCM require less need for applying smoothing techniques to obtain more
realistic TFR trends.
2.31.9
4.2 4.14.1
3.2
4.54.8
0.0
1.0
2.0
3.0
4.0
5.0
6.0
5-year average 3-year average 5-year average 3-year average
Bulawayo clusters Manicaland clusters
TF
R
Geographic location
OCM FBH

10
Figure 5. Cluster-level reconstructed TFR trends
In figure 4 above, misreporting of births which affected trends reconstructed using FBH
method can be ascribed to the TFR estimates for 2011 and 2012 in Bulawayo and Manicaland
respectively. The FBH method computed a TFR of 7.8 for Bulawayo clusters and 6.9 for
Manicaland clusters. These estimates contributed to potential over exaggeration of the point
estimates of TFRs obtained from the FBH method which are reported in figure 4 especially the
five-year average for the Bulawayo clusters.
The annual TFRs reported in figure 5 above have underlying ASFRs. As previously reported
in figure 3, the schedules of ASFRs for Zimbabwe follow a bell shape. An examination of
ASFRs for the selected clusters from Bulawayo and Manicaland revealed a different picture of
the distribution of ASFRs [figure 6].
0.0
1.0
2.0
3.0
4.0
5.0
6.0
7.0
8.0
9.0
2010 2011 2012 2013 2014
TF
R
Year
Bulawayo OCM Bulawayo FBH Manicaland OCM Manicaland FBH

11
Figure 6. Cluster-level ASFRs
It can be observed in figure 6 above that the schedules of ASFRs obtained from OCM technique
appear to be more stable compared to those from the FBH method. This is true for both five
and three-year periods preceding the ZDHS2015. Consistent with findings shown in previous
sections, estimates of ASFRs from OCM are lower than those obtained from the FBH method.
Estimation of ASFRs for small geographical areas revealed age distributions of fertility that
could not be observed at national level. The fertility schedules of the selected clusters show a
bimodal distribution of ASFRs with differences in age distributions of fertility between the two
provinces. Figure 6 shows that ASFRs for Bulawayo clusters are higher in the 19 to 22 years
group, lower in the 23 to 25 ages and peak in the 27 to 29 age group. Meanwhile, ASFRs for
Manicaland clusters show that most fertility occurs at 22-23 years followed by 27-28 years
according to the OCM-generated age distribution of fertility. The ASFRs for Manicaland
clusters computed from the FBH method appear to also point towards a bimodal age
distribution of fertility but with a less stable curves.
DISCUSSION AND CONCLUSION
This study found that both the OCM and FBH methods can be applied to the examination of
fertility indicators at small areas with limited sample sizes. Consistent with existing literature
(Avery et al., 2013; Krapf and Kreyenfeld, 2015), the fertility rates obtained from the OCM
technique were consistently lower than those obtained from the FBH method. However, the

12
potential underestimation of fertility by the OCM is arguably maintained across age groups and
time periods. It therefore does not negatively affect the validity of inferences about age
distribution of fertility (Stillwell et al., 2009) and nature of trends over time. Underestimation
of fertility by OCM partially arises from the fact that the total number of children used for the
numerator is based on children who are alive matched or unmatched to their mothers. While
dead mothers of surviving children are included in the denominator, it is possible that not all
births of dead mothers are included in the numerator. This problem can have greater weight
when the women who died were in the older age groups and had achieved higher parities before
dying. Furthermore, older women may omit children who died when reporting the total number
of live births thereby biasing down the total number of children born in a specific period.
The problem of underestimation of fertility by the OCM technique can be reduced by taking
into consideration child mortality. This can be done through replacing total number of children
ever born by the sum of children surviving and children who died. However, this will likely
present additional technical challenges especially regarding the determination of the actual
number of children who died if some deaths are not reported. To circumvent this challenge, a
synthetic life table based on actual cohorts of enumerated children can be used to estimate
possible sizes of birth cohorts. These suggested solutions to the problem of underestimation of
fertility by the OCM may however complicate the computational procedure designed by
Garenne (2017).
Results on fertility trends showed that estimates from the FBH method can easily be affected
by errors in maternity histories data. Consequently, smoothing techniques like moving
averages are needed to produce more realistic fertility trends when analysing data using the
FBH method. This also means that careful consideration of underlying annual fertility rates is
needed before one can determine point estimates of TFRs. This is especially important if one
of the annual TFR estimates included in the average point estimate is unusually high or low
due to misplacement of births. For instance, a three-year average TFR covering 2012, 2013 and
2014 can be biased upwards if misreporting resulted in heaping of 2011 births to the year 2012
thereby inflating the total number of children born during the 2012-2014 period.
The study found that the gap between fertility indicators produced by the two toolkits at
national level was largely maintained at lower levels of aggregation. This can be interpreted as
signifying that the two toolkits have the capacity to maintain their computational proficiency
when applied to limited sample sizes. However, decreasing sample size result in a greater need

13
for application of smoothing techniques for trends produced from the FBH method compared
to the those from the OCM. Nonetheless, the two estimation kits proved to be competent in
small area estimation of fertility to enhance understanding of underlying spatial variabilities in
fertility indicators that are masked in national-level estimates. Based on the observed results,
it is concluded that the Garenne (2017) OCM variant provides for a more effective reference
for understanding fertility trends of limited sample sizes despite requiring more computational
steps compared to simply executing one Stata command for tfr2.
References
Abbasi-Shavazi, M.J., 1997. An assessment of the own-children method of estimating
fertility by birthplace in Australia. Journal of Population Research 14, 167–185.
https://doi.org/10.1007/BF03029338
Abbasi-Shavazi, M.J., McDonald, P., 2000. Fertility and Multiculturalism: Immigrant
Fertility in Australia, 1977-1991. The International Migration Review 34, 215–242.
https://doi.org/10.2307/2676018
Avery, C., Clair, T.S., Levin, M., Hill, K., 2013. The ‘Own Children’ fertility estimation
procedure: A reappraisal. Population Studies 67, 171–183.
https://doi.org/10.1080/00324728.2013.769616
Childs, G., 2004. Demographic analysis of small populations using the Own-Children
Method. Field methods 16, 379–395.
Childs, G., 2001. Demographic Dimensions of an Intervillage Land Dispute in Nubri, Nepal.
American Anthropologist 103, 1096–1113.
https://doi.org/10.1525/aa.2001.103.4.1096
Cho, L.-J., Retherford, R., Choe, M., 1986. The own-children method of fertility estimation.
Honolulu, University of Hawaii Press/East-West Centre Population Institute.
Coleman, D.A., Dubuc, S., 2010. The fertility of ethnic minorities in the UK, 1960s-2006.
Population Studies 64, 19–41.
Dubuc, S., 2009. Application of the Own-Children Method for estimating fertility by ethnic
and religious groups in the UK. J Pop Research 26, 207.
https://doi.org/10.1007/s12546-009-9020-7
Garenne, M., McCaa, R., 2017. 4-Parameters Own-Children Method: A spreadsheet for
calculating fertility rates from census microdata: Application to selected African
Countries, in: Children, Mothers and Measuring Fertility: New Perspectives on the
Own Child Method. Presented at the Cambridge Meeting, 18-20 September 2017,
Cambridge, pp. 1–38.
Garenne, M.L., 2011. Testing for fertility stalls in demographic and health surveys.
Population health metrics 1, 18.
Hosseini-Chavoshi, M., Abbasi-Shavazi, M.J., McDonald, P., 2017. Fertility, Marriage, and
Family Planning in Iran: Implications for Future Policy. Population Horizons 13, 31–
40. https://doi.org/10.1515/pophzn-2016-0005
14
Krapf, S., Kreyenfeld, M., 2015. Fertility Assessment with the Own-Children-Method: A
Validation with Data from the German Mikrozensus. MPIDR Technical Report TR-
2015-003. Rostock, Max Planck Institute for Demographic Research.
Powers, D., Xie, Y., 2008. Statistical Methods for Categorical Data Analysis. Emerald Group
Publishing.
Powers, D.A., Xie, Y., 2000. Statistical Methods for Categorical Data Analysis. Academic
Press.
Schoumaker, B., 2013. A Stata module for computing fertility rates and TFRs from birth
histories: tfr2. Demographic Research 28, 1093–1144.
https://doi.org/10.4054/DemRes.2013.28.38
Schoumaker, B., 2001. A dynamic multi-level analysis of legitimate fertility in Morocco
rural, in: Spatial Demographic Analaysis. Presented at the IUSSP General Population
Conference, Brazil.
Schoumaker, B., Hayford, S.R., 2004. A person-period approach to analysing birth histories.
Population (English Edition, 2002-) 59, 689–701.
Stillwell, J., Coast, E., Kneale, D., 2009. Fertility, Living Arrangements, Care and Mobility:
Understanding Population Trends and Processes -. Springer Science & Business
Media.
Winkelmann, R., Zimmermann, K.F., 1994. Count data models for demographic data.
Mathematical Population Studies 4, 205–221.
https://doi.org/10.1080/08898489409525374