Embed Size (px)
Citation preview

Full file at https://FratStock.euSM-Ch02-5e.pdf
Lanen_5e_IM_Ch_02.pdf
Chapter 02 - Solutions.pdf
Lanen_02_Instructor_Final.pdf
Chapter 02.pdf
Full file at https://FratStock.eu
©The McGraw-Hill Companies, Inc., 2017
Solutions Manual, Chapter 2
29
2 Cost Concepts and Behavior
Solutions to Review Questions
2-1.
Cost is a more general term that refers to a sacrifice of resources and may be either an opportunity cost or an outlay cost. An expense is an outlay cost charged against sales revenue in a particular accounting period and usually pertains only to external financial
reports.
2-2.
Product costs are those costs that are attributed to units of production, while period costs are all other costs and are attributed to time periods.
2-3.
Outlay costs are those costs that represent a past, current, or future cash outlay. Opportunity cost is the value of what is given up by choosing a particular alternative.
2-4.
Common examples include the value forgone because of lost sales by producing low quality products or substandard customer service. For another example, consider a firm operating at capacity. In this case, a sale to one customer precludes a sale to another customer.
2-5.
Yes. The costs associated with goods sold in a period are not expected to result in future benefits. They provided sales revenue for the period in which the goods were sold; therefore, they are expensed for financial accounting purposes.
2-6.
The costs associated with goods sold are a product cost for a manufacturing firm. They are the costs associated with the product and recorded in an inventory account until the product is sold.
Full file at https://FratStock.eu
©The McGraw-Hill Companies, Inc., 2017
Fundamentals of Cost Accounting
30
2-7.
Both accounts represent the cost of the goods acquired from an outside supplier, which include all costs necessary to ready the goods for sale (in merchandising) or production (in manufacturing).
The merchandiser expenses these costs as the product is sold, as no additional costs are incurred. The manufacturer transforms the purchased materials into finished goods and charges these costs, along with conversion costs to production (work in process inventory). These costs are expensed when the finished goods are sold.
2-8.
Direct materials: Materials in their raw or unconverted form, which become an integral part of the finished product are considered direct materials. In some
cases, materials are so immaterial in amount that they are considered part of overhead.
Direct labor: Costs associated with labor engaged in manufacturing activities. Sometimes this is considered as the labor that is actually responsible for converting the materials into finished product. Assembly workers,
cutters, finishers and similar ―hands on‖ personnel are classified as direct labor.
Manufacturing overhead:
All other costs directly related to product manufacture. These costs include the indirect labor and materials, costs related to the facilities and equipment required to carry out manufacturing operations, supervisory costs, and all other support activities.
2-9.
Gross margin is the difference between revenue (sales) and cost of goods sold. Contribution margin is the difference between revenue (sales) and variable cost.
2-10.
Contribution margin is likely to be more important, because it reflects better how profits will change with decisions.
2-11.
Step costs change with volume in steps, such as when supervisors are added.
Semivariable or mixed costs have elements of both fixed and variable costs. Utilities and maintenance are often mixed costs.
2-12.
Total variable costs change in direct proportion to a change in volume (within the relevant range of activity). Total fixed costs do not change as volume changes (within the relevant range of activity).
Full file at https://FratStock.eu
©The McGraw-Hill Companies, Inc., 2017
Solutions Manual, Chapter 2
31
2-13.
A value income statement typically uses a contribution margin framework, because the contribution margin framework is more useful for managerial decision-making. In addition, it splits out value-added and non value-added costs. Therefore, it differs in two ways from the gross margin income statement: classifying costs by behavior and highlighting value-added and non value-added costs. It differs from the contribution
margin income statement by highlighting the value-added and non value-added costs.
2-14.
A value income statement is useful to managers, because it provides information that is useful for them in identifying and eliminating non value-added activities.
Full file at https://FratStock.eu
©The McGraw-Hill Companies, Inc., 2017
Fundamentals of Cost Accounting
32
Solutions to Critical Analysis and Discussion Questions
2-15.
The statement is not true. Materials can be direct or indirect. Indirect materials include items such as lubricating oil, gloves, paper supplies, and so on. Similarly, indirect labor
includes plant supervision, maintenance workers, and others not directly associated with the production of the product.
2-16.
No. Statements such as this almost always refer to the full cost per unit, which includes fixed and variable costs. Therefore, multiplying the cost per seat-mile by the number of miles is unlikely to give a useful estimate of flying one passenger. We should multiply the variable cost per mile by 1,980 miles to estimate the costs of flying a passenger from Detroit to Los Angeles.
2-17.
Marketing and administrative costs are treated as period costs and expensed for financial accounting purposes in both manufacturing and merchandising organizations.
However, for decision making or assessing product profitability, marketing and administrative costs that can be reasonably associated with the product (product-specific advertising, for example) are just as important as the manufacturing costs.
2-18.
There is no ―correct‖ answer to this allocation problem. Common allocation procedures would include: (1) splitting the costs equally (25% each), (2) dividing the costs by the miles driven and charging based on the miles each person rides, (3) charging the
incremental costs of the passengers (almost nothing), assuming you were going to drive to Texas anyway.
2-19.
The costs will not change. Your allocation in 2-18 was not ―incorrect,‖ because the purpose of the allocation is not to determine incremental costs.
2-20.
Answers will vary. The major cost categories include servers (mostly fixed), personnel (mostly fixed), and licensing costs (mostly variable).
Full file at https://FratStock.eu
©The McGraw-Hill Companies, Inc., 2017
Solutions Manual, Chapter 2
33
2-21.
Answers will vary. The major cost categories include servers (mostly fixed), personnel (mostly fixed), and legal costs (mostly fixed). There are only small variable costs for Uber or Lyft. For the drivers, the costs of the vehicle and technology are mostly fixed. Vehicle operating expenses (fuel and maintenance) are mostly variable.
2-22.
Direct material costs include the cost of supplies and medicine. One possible direct
labor cost would be nursing staff assigned to the unit. Indirect costs include the costs of hospital administration, depreciation on the building, security costs, and so on.
2-23.
Answers will vary. Common suggestions are number of students in each program, usage (cafeteria: meals; library: study rooms reserved; or career placement: interviews, for example), assuming usage is measured, or revenue (tuition dollars).
2-24.
No, R&D costs are relevant for many decisions. For example, should a program of research be continued? Was a previous R&D project profitable? Should we change our process of approving R&D projects? R&D costs are expensed (currently) for financial reporting, but for managerial decision-making the accounting treatment is not relevant.
2-25.
This question can create a good discussion of the different roles of financial and managerial accounting. An important issue is identifying the activities that are non value-added. These are almost certainly better known to the managers of the firm than to outsiders. These costs are also difficult to measure, meaning there are many different ―reasonable‖ numbers that might be reported. Because managers have an interest in reporting favorable numbers (however favorable is defined), there is a potential for
managerial bias in the reports.
A second reason is that most firms would be concerned about revealing potentially valuable competitive information.
Full file at https://FratStock.eu
©The McGraw-Hill Companies, Inc., 2017
Fundamentals of Cost Accounting
34
Solutions to Exercises
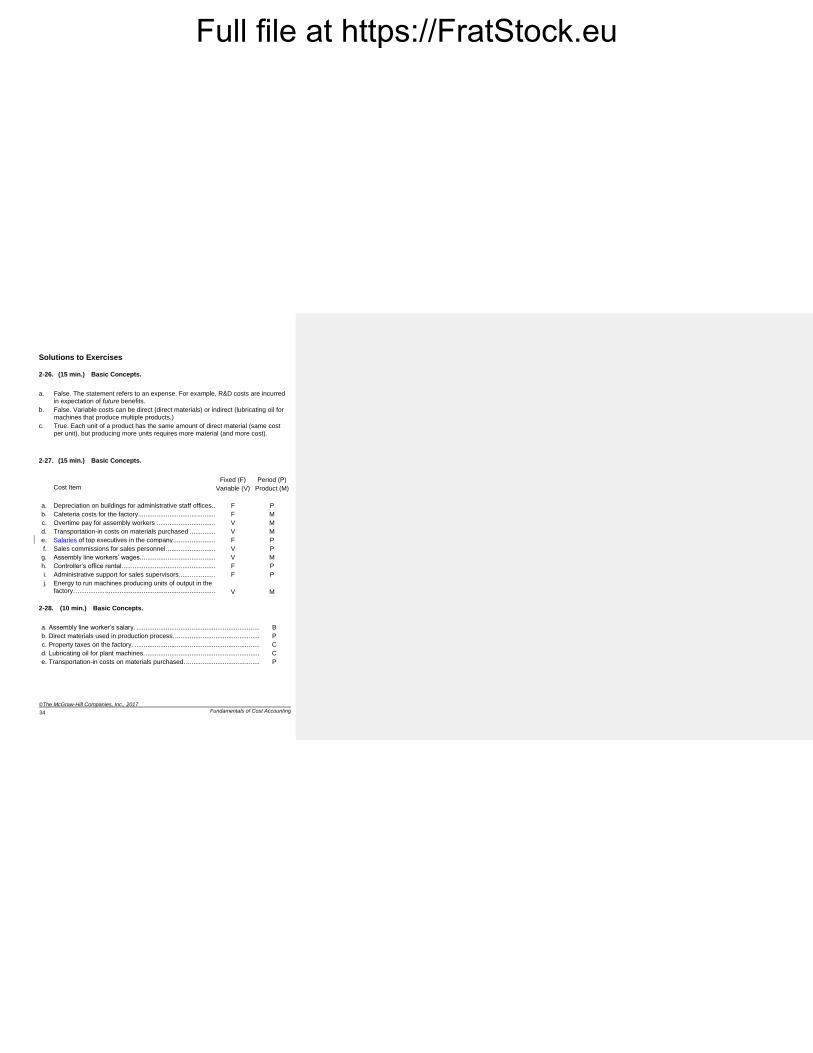
2-26. (15 min.) Basic Concepts.
a. False. The statement refers to an expense. For example, R&D costs are incurred in expectation of future benefits.
b. False. Variable costs can be direct (direct materials) or indirect (lubricating oil for
machines that produce multiple products.)
c. True. Each unit of a product has the same amount of direct material (same cost per unit), but producing more units requires more material (and more cost).
2-27. (15 min.) Basic Concepts.
Cost Item
Fixed (F)
Variable (V)
Period (P)
Product (M)
a. Depreciation on buildings for administrative staff offices ...... F P
b. Cafeteria costs for the factory .............................................. F M
c. Overtime pay for assembly workers .................................... V M
d. Transportation-in costs on materials purchased .................. V M
e. Salaries of top executives in the company ........................... F P
f. Sales commissions for sales personnel ............................... V P
g. Assembly line workers’ wages ............................................. V M
h. Controller’s office rental ....................................................... F P
i. Administrative support for sales supervisors ........................ F P
j. Energy to run machines producing units of output in the factory….............. ................................................................
V
M
2-28. (10 min.) Basic Concepts.
a. Assembly line worker’s salary. .................................................................... B
b. Direct materials used in production process. ............................................... P
c. Property taxes on the factory. ..................................................................... C
d. Lubricating oil for plant machines. ............................................................... C
e. Transportation-in costs on materials purchased. ......................................... P
Full file at https://FratStock.eu
©The McGraw-Hill Companies, Inc., 2017
Solutions Manual, Chapter 2
35
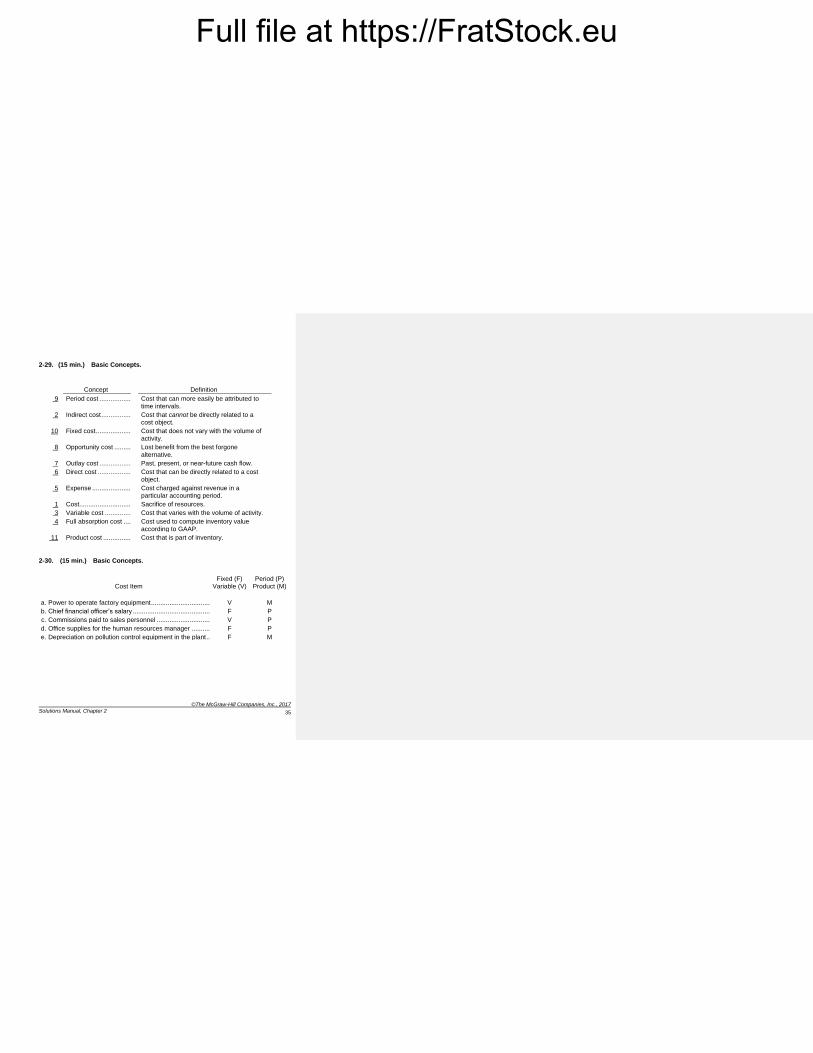
2-29. (15 min.) Basic Concepts.
Concept Definition
9 Period cost ....................... Cost that can more easily be attributed to time intervals.
2 Indirect cost ...................... Cost that cannot be directly related to a cost object.
10 Fixed cost ......................... Cost that does not vary with the volume of activity.
8 Opportunity cost ............... Lost benefit from the best forgone
alternative.
7 Outlay cost ....................... Past, present, or near-future cash flow.
6 Direct cost ........................ Cost that can be directly related to a cost object.
5 Expense ........................... Cost charged against revenue in a particular accounting period.
1 Cost.................................. Sacrifice of resources.
3 Variable cost .................... Cost that varies with the volume of activity.
4 Full absorption cost .......... Cost used to compute inventory value according to GAAP.
11 Product cost ..................... Cost that is part of inventory.
2-30. (15 min.) Basic Concepts.
Cost Item
Fixed (F) Variable (V)
Period (P) Product (M)
a. Power to operate factory equipment ................................ V M
b. Chief financial officer’s salary .......................................... F P
c. Commissions paid to sales personnel ............................. V P
d. Office supplies for the human resources manager .......... F P
e. Depreciation on pollution control equipment in the plant .. F M
Full file at https://FratStock.eu
©The McGraw-Hill Companies, Inc., 2017
Fundamentals of Cost Accounting
36
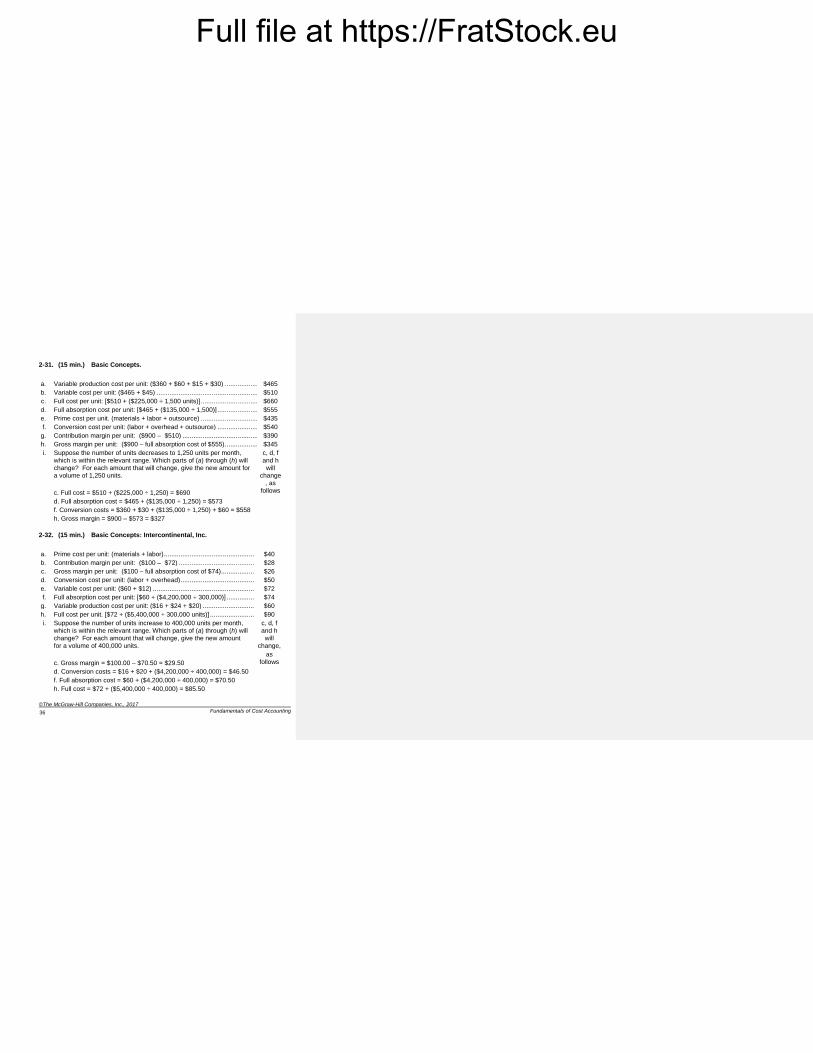
2-31. (15 min.) Basic Concepts.
a. Variable production cost per unit: ($360 + $60 + $15 + $30) ....................... $465
b. Variable cost per unit: ($465 + $45) ............................................................ $510
c. Full cost per unit: [$510 + ($225,000 ÷ 1,500 units)] .................................... $660
d. Full absorption cost per unit: [$465 + ($135,000 ÷ 1,500)] ........................... $555
e. Prime cost per unit. (materials + labor + outsource) .................................... $435
f. Conversion cost per unit: (labor + overhead + outsource) ........................... $540
g. Contribution margin per unit: ($900 – $510) .............................................. $390
h. Gross margin per unit: ($900 – full absorption cost of $555) ....................... $345
i. Suppose the number of units decreases to 1,250 units per month, which is within the relevant range. Which parts of (a) through (h) will change? For each amount that will change, give the new amount for a volume of 1,250 units.
c. Full cost = $510 + ($225,000 ÷ 1,250) = $690
d. Full absorption cost = $465 + ($135,000 ÷ 1,250) = $573
f. Conversion costs = $360 + $30 + ($135,000 ÷ 1,250) + $60 = $558
h. Gross margin = $900 – $573 = $327
c, d, f and h will
change, as
follows
2-32. (15 min.) Basic Concepts: Intercontinental, Inc.
a. Prime cost per unit: (materials + labor) ........................................................ $40
b. Contribution margin per unit: ($100 – $72) ................................................ $28
c. Gross margin per unit: ($100 – full absorption cost of $74) ......................... $26
d. Conversion cost per unit: (labor + overhead) ............................................... $50
e. Variable cost per unit: ($60 + $12) .............................................................. $72
f. Full absorption cost per unit: [$60 + ($4,200,000 ÷ 300,000)] ...................... $74
g. Variable production cost per unit: ($16 + $24 + $20) ................................... $60
h. Full cost per unit. [$72 + ($5,400,000 ÷ 300,000 units)] ............................... $90
i. Suppose the number of units increase to 400,000 units per month, which is within the relevant range. Which parts of (a) through (h) will change? For each amount that will change, give the new amount for a volume of 400,000 units.
c. Gross margin = $100.00 – $70.50 = $29.50
d. Conversion costs = $16 + $20 + ($4,200,000 ÷ 400,000) = $46.50
f. Full absorption cost = $60 + ($4,200,000 ÷ 400,000) = $70.50
h. Full cost = $72 + ($5,400,000 ÷ 400,000) = $85.50
c, d, f and h
will change,
as follows
Full file at https://FratStock.eu
©The McGraw-Hill Companies, Inc., 2017
Solutions Manual, Chapter 2
37
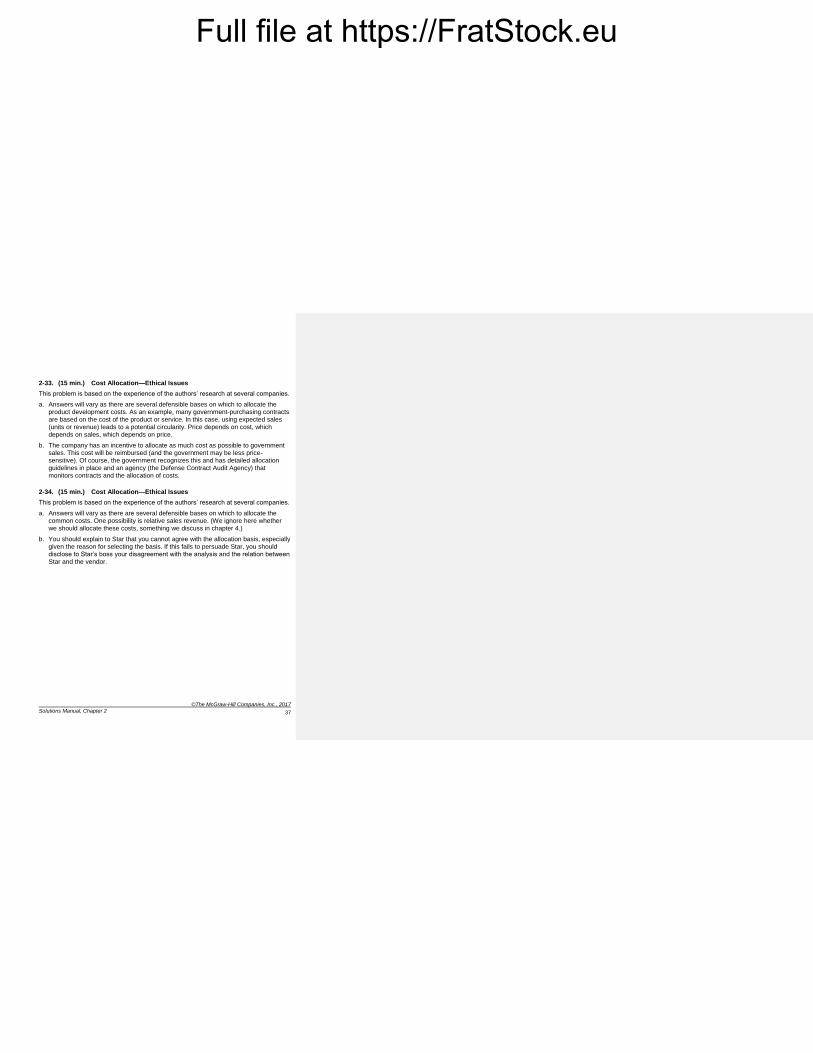
2-33. (15 min.) Cost Allocation—Ethical Issues
This problem is based on the experience of the authors’ research at several companies.
a. Answers will vary as there are several defensible bases on which to allocate the product development costs. As an example, many government-purchasing contracts are based on the cost of the product or service. In this case, using expected sales (units or revenue) leads to a potential circularity. Price depends on cost, which depends on sales, which depends on price.
b. The company has an incentive to allocate as much cost as possible to government sales. This cost will be reimbursed (and the government may be less price-sensitive). Of course, the government recognizes this and has detailed allocation guidelines in place and an agency (the Defense Contract Audit Agency) that monitors contracts and the allocation of costs.
2-34. (15 min.) Cost Allocation—Ethical Issues
This problem is based on the experience of the authors’ research at several companies.
a. Answers will vary as there are several defensible bases on which to allocate the common costs. One possibility is relative sales revenue. (We ignore here whether we should allocate these costs, something we discuss in chapter 4.)
b. You should explain to Star that you cannot agree with the allocation basis, especially given the reason for selecting the basis. If this fails to persuade Star, you should disclose to Star’s boss your disagreement with the analysis and the relation between
Star and the vendor.
Full file at https://FratStock.eu
©The McGraw-Hill Companies, Inc., 2017
Fundamentals of Cost Accounting
38
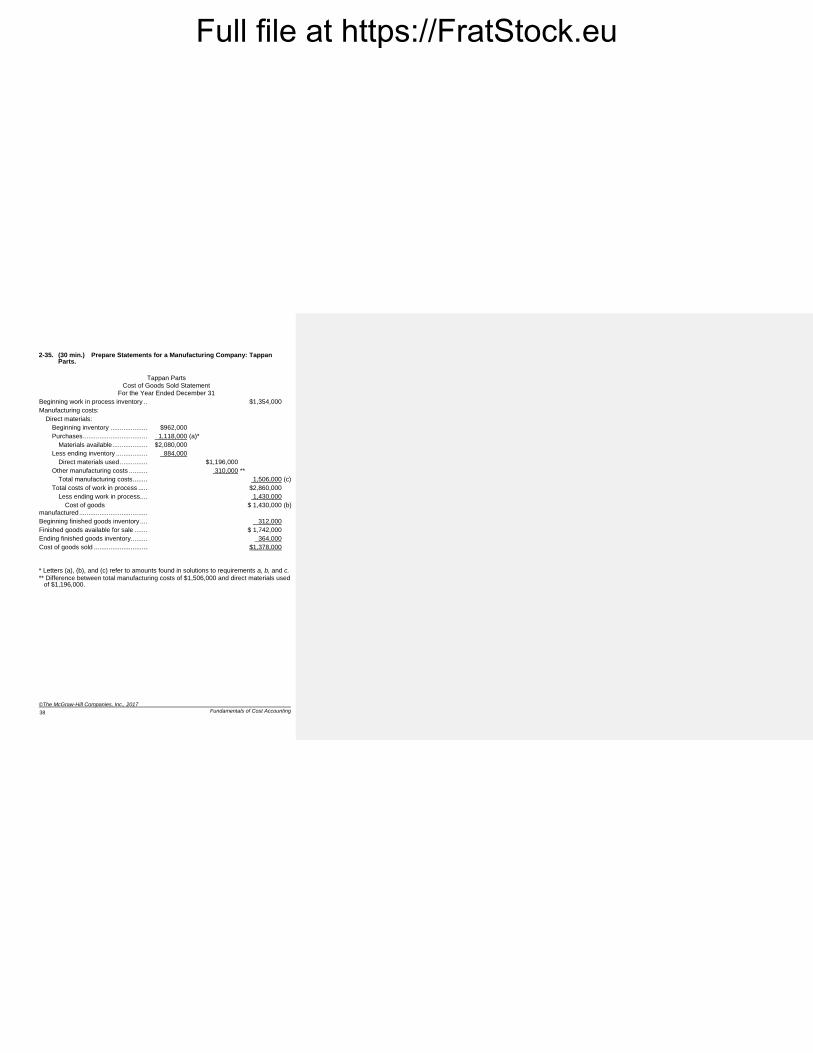
2-35. (30 min.) Prepare Statements for a Manufacturing Company: Tappan Parts.
Tappan Parts Cost of Goods Sold Statement
For the Year Ended December 31
Beginning work in process inventory .............. $1,354,000
Manufacturing costs:
Direct materials:
Beginning inventory ................................ $962,000
Purchases ............................................... 1,118,000 (a)*
Materials available ............................... $2,080,000
Less ending inventory ............................. 884,000
Direct materials used ........................... $1,196,000
Other manufacturing costs ...................... 310,000 **
Total manufacturing costs .................... 1,506,000 (c)
Total costs of work in process ................. $2,860,000
Less ending work in process ................ 1,430,000
Cost of goods manufactured .................................................
$ 1,430,000 (b)
Beginning finished goods inventory ................ 312,000
Finished goods available for sale ................... $ 1,742,000
Ending finished goods inventory ..................... 364,000
Cost of goods sold ......................................... $1,378,000
* Letters (a), (b), and (c) refer to amounts found in solutions to requirements a, b, and c. ** Difference between total manufacturing costs of $1,506,000 and direct materials used
of $1,196,000.
Full file at https://FratStock.eu
©The McGraw-Hill Companies, Inc., 2017
Solutions Manual, Chapter 2
39
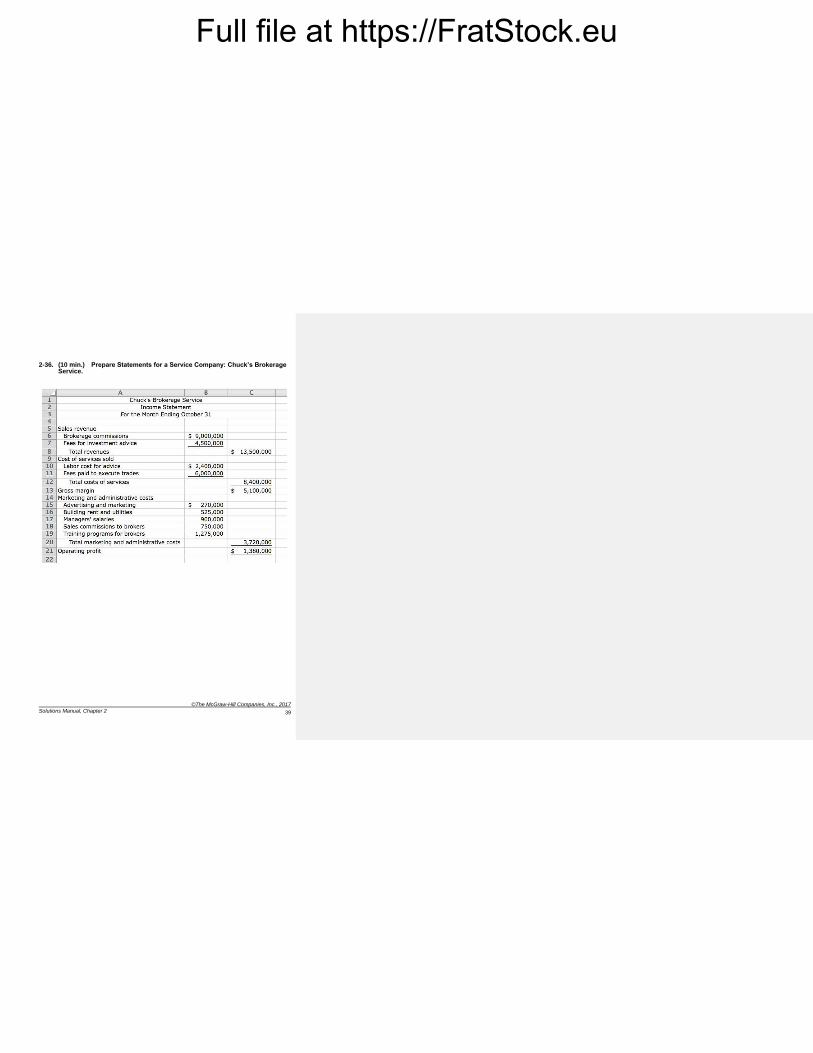
2-36. (10 min.) Prepare Statements for a Service Company: Chuck’s Brokerage Service.
Full file at https://FratStock.eu
©The McGraw-Hill Companies, Inc., 2017
Fundamentals of Cost Accounting
40
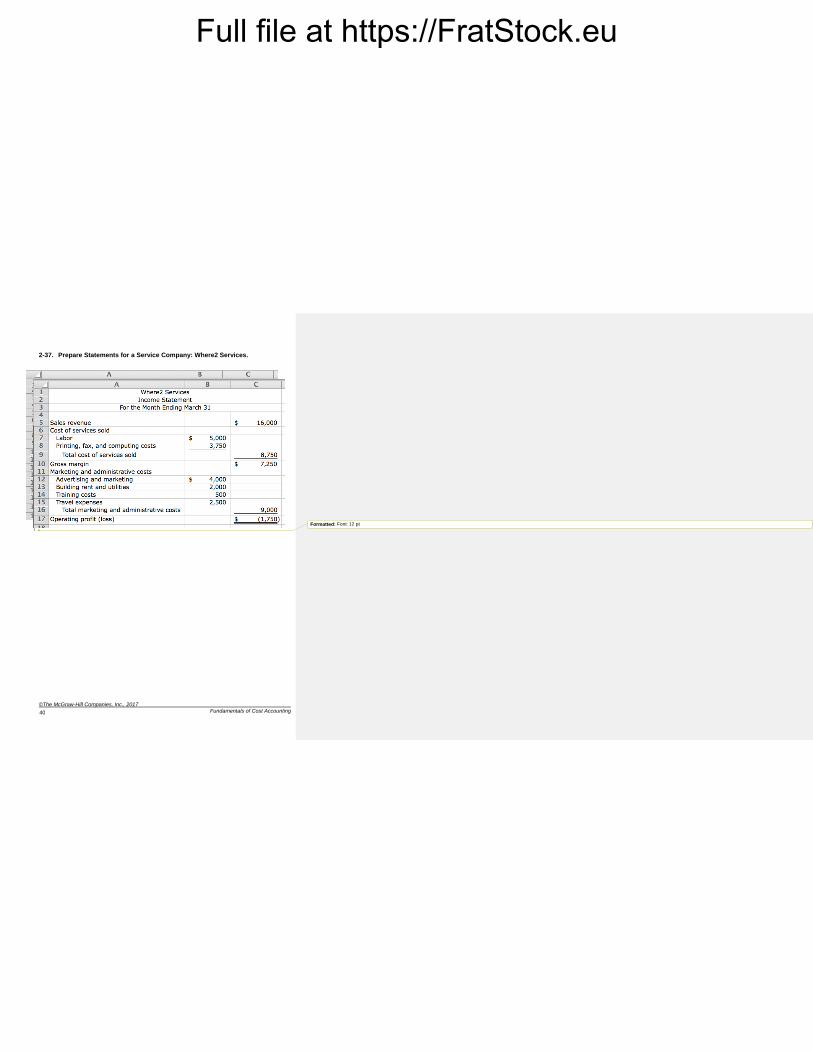
2-37. Prepare Statements for a Service Company: Where2 Services.
Formatted: Font: 12 pt
Full file at https://FratStock.eu
©The McGraw-Hill Companies, Inc., 2017
Solutions Manual, Chapter 2
41
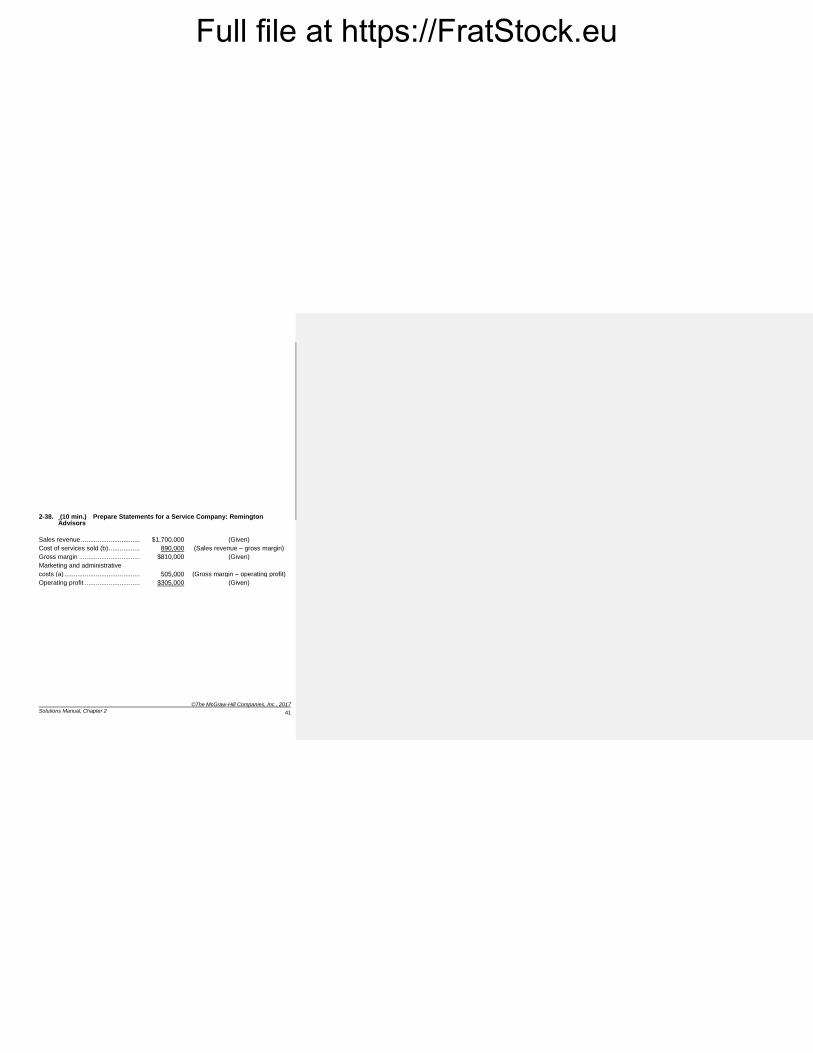
2-38. (10 min.) Prepare Statements for a Service Company: Remington Advisors
Sales revenue .................................. $1,700,000 (Given)
Cost of services sold (b) ................... 890,000 (Sales revenue – gross margin)
Gross margin ................................... $810,000 (Given)
Marketing and administrative
costs (a) ...........................................
505,000
(Gross margin – operating profit)
Operating profit ................................ $305,000 (Given)
Full file at https://FratStock.eu
©The McGraw-Hill Companies, Inc., 2017
Fundamentals of Cost Accounting
42
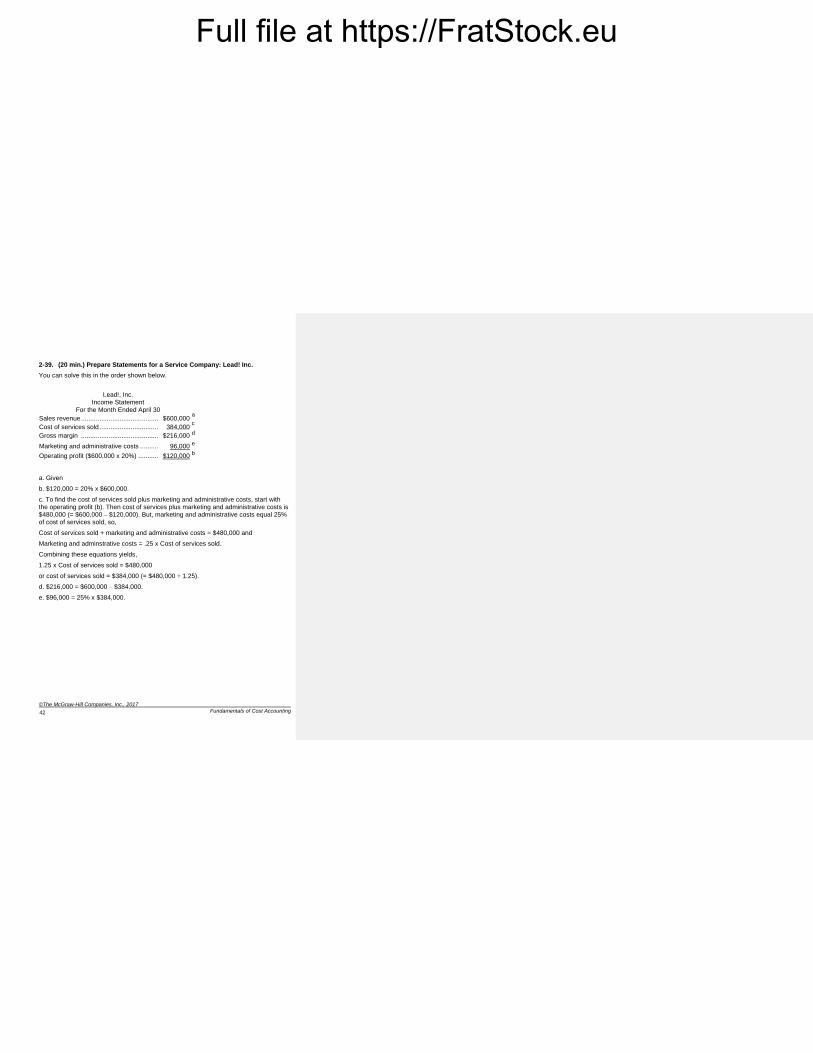
2-39. (20 min.) Prepare Statements for a Service Company: Lead! Inc.
You can solve this in the order shown below.
Lead!, Inc. Income Statement
For the Month Ended April 30
Sales revenue ....................................................................................... $600,000 a
Cost of services sold ............................................................................. 384,000 c
Gross margin ....................................................................................... $216,000 d
Marketing and administrative costs ....................................................... 96,000 e
Operating profit ($600,000 x 20%) ........................................................ $120,000 b
a. Given
b. $120,000 = 20% x $600,000.
c. To find the cost of services sold plus marketing and administrative costs, start with the operating profit (b). Then cost of services plus marketing and administrative costs is $480,000 (= $600,000 – $120,000). But, marketing and administrative costs equal 25% of cost of services sold, so,
Cost of services sold + marketing and administrative costs = $480,000 and
Marketing and adminstrative costs = .25 x Cost of services sold.
Combining these equations yields,
1.25 x Cost of services sold = $480,000
or cost of services sold = $384,000 (= $480,000 ÷ 1.25).
d. $216,000 = $600,000 – $384,000.
e. $96,000 = 25% x $384,000.
Full file at https://FratStock.eu
©The McGraw-Hill Companies, Inc., 2017
Solutions Manual, Chapter 2
43
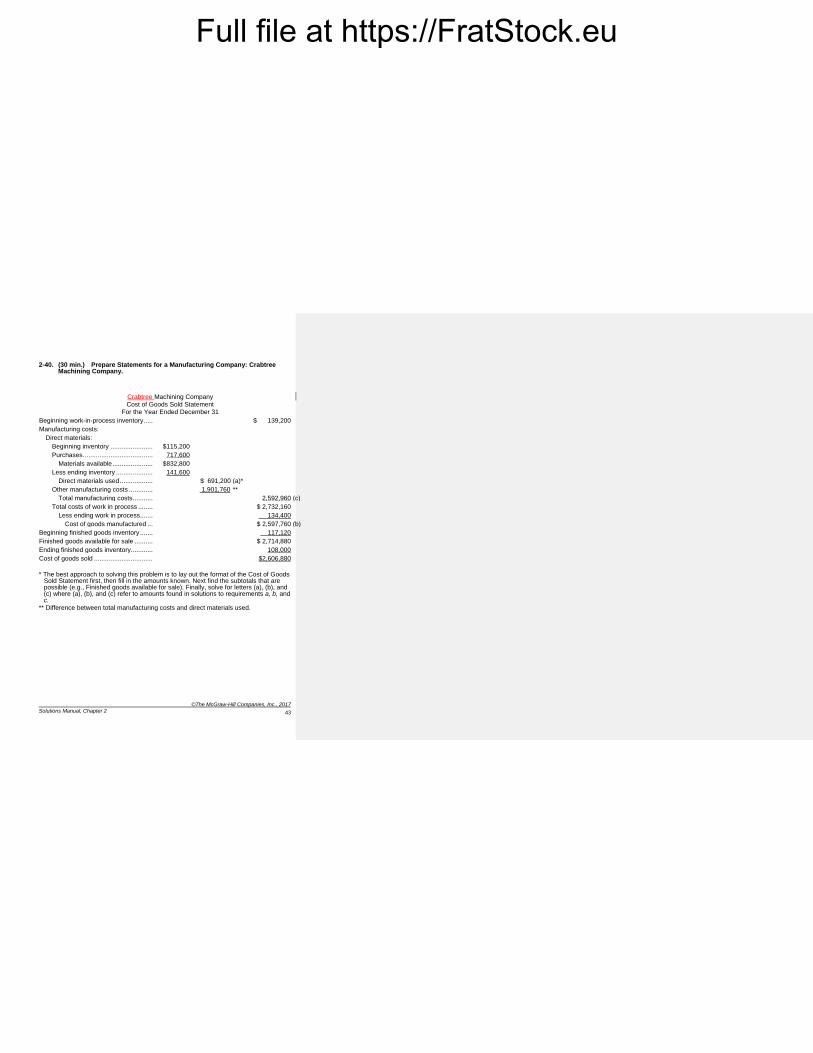
2-40. (30 min.) Prepare Statements for a Manufacturing Company: Crabtree Machining Company.
Crabtree Machining Company Cost of Goods Sold Statement
For the Year Ended December 31
Beginning work-in-process inventory ..... $ 139,200
Manufacturing costs:
Direct materials:
Beginning inventory ....................... $115,200
Purchases ...................................... 717,600
Materials available ...................... $832,800
Less ending inventory .................... 141,600
Direct materials used .................. $ 691,200 (a)*
Other manufacturing costs ............. 1,901,760 **
Total manufacturing costs ........... 2,592,960 (c)
Total costs of work in process ........ $ 2,732,160
Less ending work in process ....... 134,400
Cost of goods manufactured ... $ 2,597,760 (b)
Beginning finished goods inventory ....... 117,120
Finished goods available for sale .......... $ 2,714,880
Ending finished goods inventory ............ 108,000
Cost of goods sold ................................ $2,606,880
* The best approach to solving this problem is to lay out the format of the Cost of Goods Sold Statement first, then fill in the amounts known. Next find the subtotals that are possible (e.g., Finished goods available for sale). Finally, solve for letters (a), (b), and (c) where (a), (b), and (c) refer to amounts found in solutions to requirements a, b, and c.
** Difference between total manufacturing costs and direct materials used.
Full file at https://FratStock.eu
©The McGraw-Hill Companies, Inc., 2017
Fundamentals of Cost Accounting
44
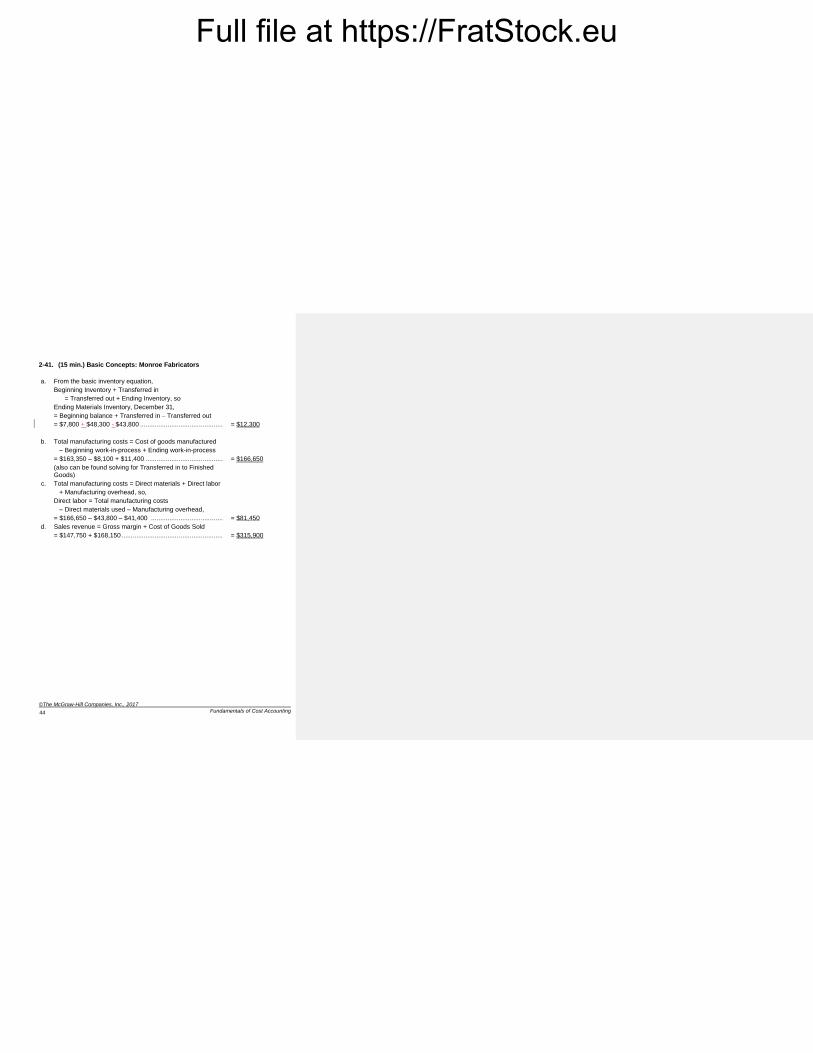
2-41. (15 min.) Basic Concepts: Monroe Fabricators
a. From the basic inventory equation,
Beginning Inventory + Transferred in
= Transferred out + Ending Inventory, so
Ending Materials Inventory, December 31,
= Beginning balance + Transferred in – Transferred out
= $7,800 + $48,300 - $43,800 .............................................
= $12,300
b. Total manufacturing costs = Cost of goods manufactured
– Beginning work-in-process + Ending work-in-process
= $163,350 – $8,100 + $11,400 ..........................................
(also can be found solving for Transferred in to Finished Goods)
= $166,650
c. Total manufacturing costs = Direct materials + Direct labor
+ Manufacturing overhead, so,
Direct labor = Total manufacturing costs
– Direct materials used – Manufacturing overhead,
= $166,650 – $43,800 – $41,400 .......................................
= $81,450
d. Sales revenue = Gross margin + Cost of Goods Sold
= $147,750 + $168,150 .......................................................
= $315,900
Full file at https://FratStock.eu
©The McGraw-Hill Companies, Inc., 2017
Solutions Manual, Chapter 2
45
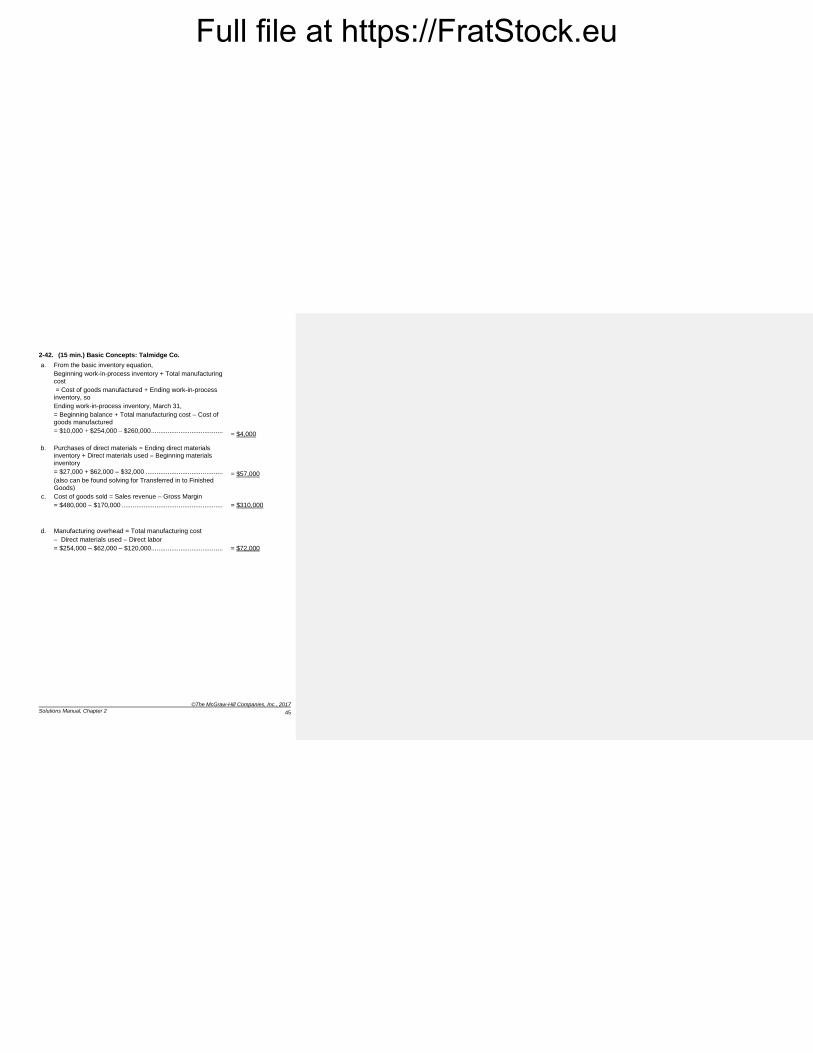
2-42. (15 min.) Basic Concepts: Talmidge Co.
a. From the basic inventory equation,
Beginning work-in-process inventory + Total manufacturing cost
= Cost of goods manufactured + Ending work-in-process inventory, so
Ending work-in-process inventory, March 31,
= Beginning balance + Total manufacturing cost – Cost of goods manufactured
= $10,000 + $254,000 – $260,000 .......................................
= $4,000
b. Purchases of direct materials = Ending direct materials inventory + Direct materials used – Beginning materials
inventory
= $27,000 + $62,000 – $32,000 ..........................................
(also can be found solving for Transferred in to Finished Goods)
= $57,000
c. Cost of goods sold = Sales revenue – Gross Margin
= $480,000 – $170,000 .......................................................
= $310,000
d. Manufacturing overhead = Total manufacturing cost
– Direct materials used – Direct labor
= $254,000 – $62,000 – $120,000.......................................
= $72,000
Full file at https://FratStock.eu
©The McGraw-Hill Companies, Inc., 2017
Fundamentals of Cost Accounting
46
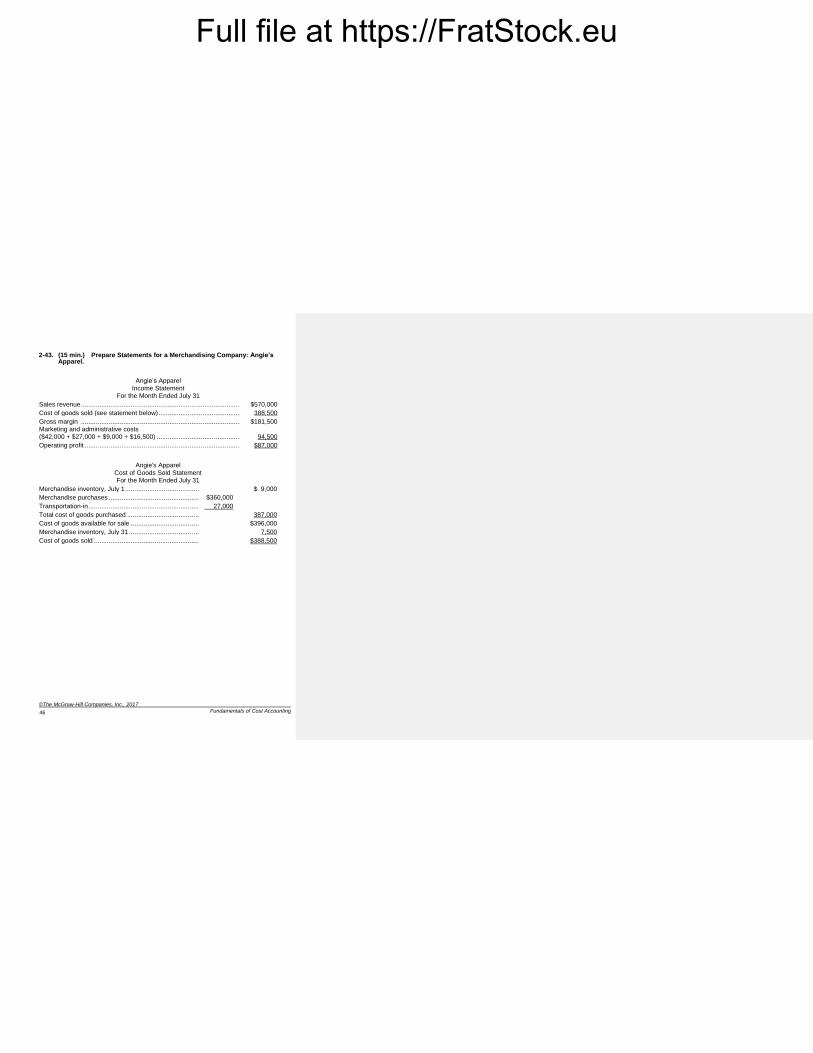
2-43. (15 min.) Prepare Statements for a Merchandising Company: Angie’s Apparel.
Angie’s Apparel Income Statement
For the Month Ended July 31
Sales revenue ....................................................................................... $570,000
Cost of goods sold (see statement below) ............................................. 388,500
Gross margin ....................................................................................... $181,500
Marketing and administrative costs ($42,000 + $27,000 + $9,000 + $16,500) ..............................................
94,500
Operating profit ..................................................................................... $87,000
Angie's Apparel
Cost of Goods Sold Statement For the Month Ended July 31
Merchandise inventory, July 1 ............................................. $ 9,000
Merchandise purchases ...................................................... $360,000
Transportation-in ................................................................. 27,000
Total cost of goods purchased ............................................ 387,000
Cost of goods available for sale .......................................... $396,000
Merchandise inventory, July 31 ........................................... 7,500
Cost of goods sold .............................................................. $388,500
Full file at https://FratStock.eu
©The McGraw-Hill Companies, Inc., 2017
Solutions Manual, Chapter 2
47
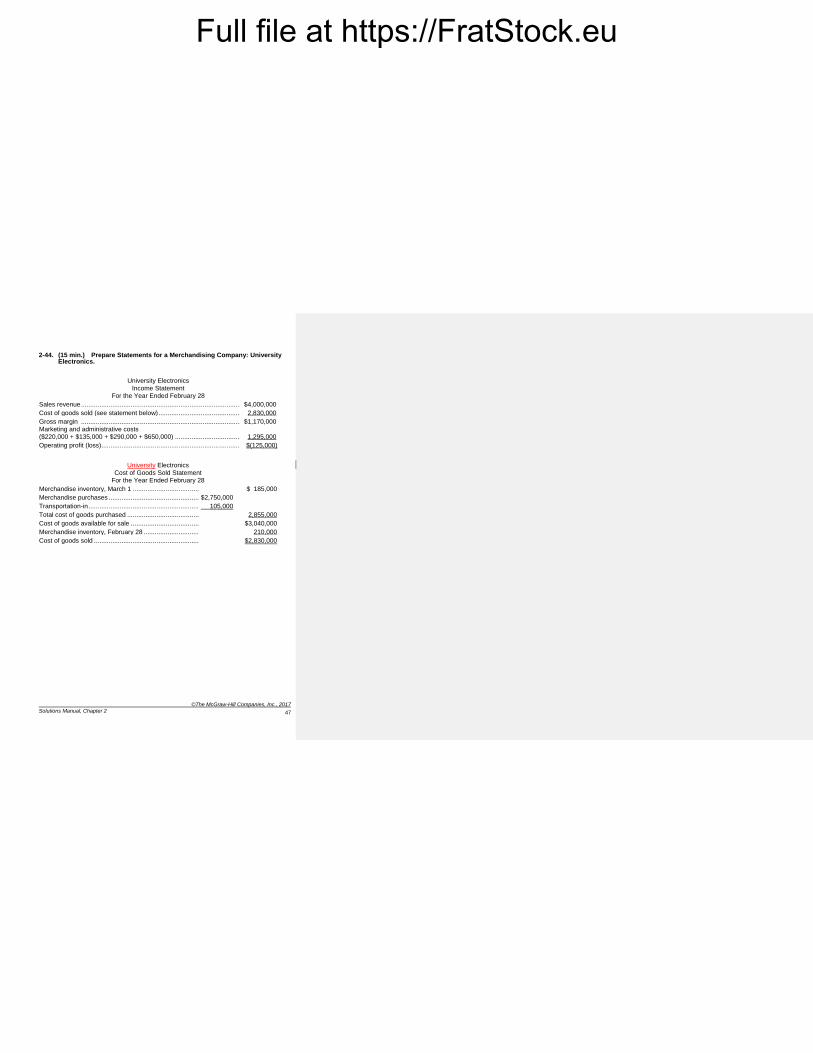
2-44. (15 min.) Prepare Statements for a Merchandising Company: University Electronics.
University Electronics Income Statement
For the Year Ended February 28
Sales revenue ....................................................................................... $4,000,000
Cost of goods sold (see statement below) ............................................. 2,830,000
Gross margin ....................................................................................... $1,170,000
Marketing and administrative costs ($220,000 + $135,000 + $290,000 + $650,000) ....................................
1,295,000
Operating profit (loss) ............................................................................ $(125,000)
University Electronics
Cost of Goods Sold Statement For the Year Ended February 28
Merchandise inventory, March 1 ......................................... $ 185,000
Merchandise purchases ...................................................... $2,750,000
Transportation-in ................................................................. 105,000
Total cost of goods purchased ............................................ 2,855,000
Cost of goods available for sale .......................................... $3,040,000
Merchandise inventory, February 28 ................................... 210,000
Cost of goods sold .............................................................. $2,830,000
Full file at https://FratStock.eu
©The McGraw-Hill Companies, Inc., 2017
Fundamentals of Cost Accounting
48
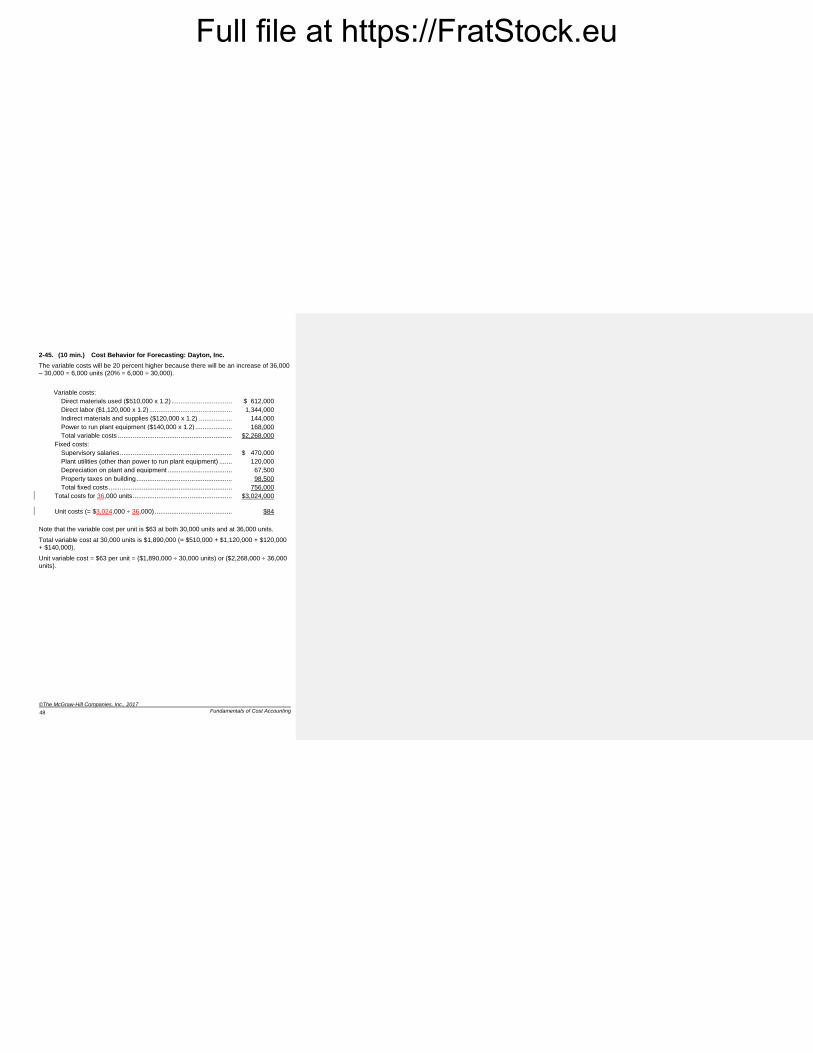
2-45. (10 min.) Cost Behavior for Forecasting: Dayton, Inc.
The variable costs will be 20 percent higher because there will be an increase of 36,000 – 30,000 = 6,000 units (20% = 6,000 ÷ 30,000).
Variable costs:
Direct materials used ($510,000 x 1.2) ................................. $ 612,000
Direct labor ($1,120,000 x 1.2) ............................................. 1,344,000
Indirect materials and supplies ($120,000 x 1.2) .................. 144,000
Power to run plant equipment ($140,000 x 1.2) .................... 168,000
Total variable costs .............................................................. $2,268,000
Fixed costs:
Supervisory salaries ............................................................. $ 470,000
Plant utilities (other than power to run plant equipment) ....... 120,000
Depreciation on plant and equipment ................................... 67,500
Property taxes on building .................................................... 98,500
Total fixed costs ................................................................... 756,000
Total costs for 36,000 units ...................................................... $3,024,000
Unit costs (= $3,024,000 ÷ 36,000) .......................................... $84
Note that the variable cost per unit is $63 at both 30,000 units and at 36,000 units.
Total variable cost at 30,000 units is $1,890,000 (= $510,000 + $1,120,000 + $120,000 + $140,000).
Unit variable cost = $63 per unit = ($1,890,000 30,000 units) or ($2,268,000 36,000 units).
Full file at https://FratStock.eu
©The McGraw-Hill Companies, Inc., 2017
Solutions Manual, Chapter 2
49
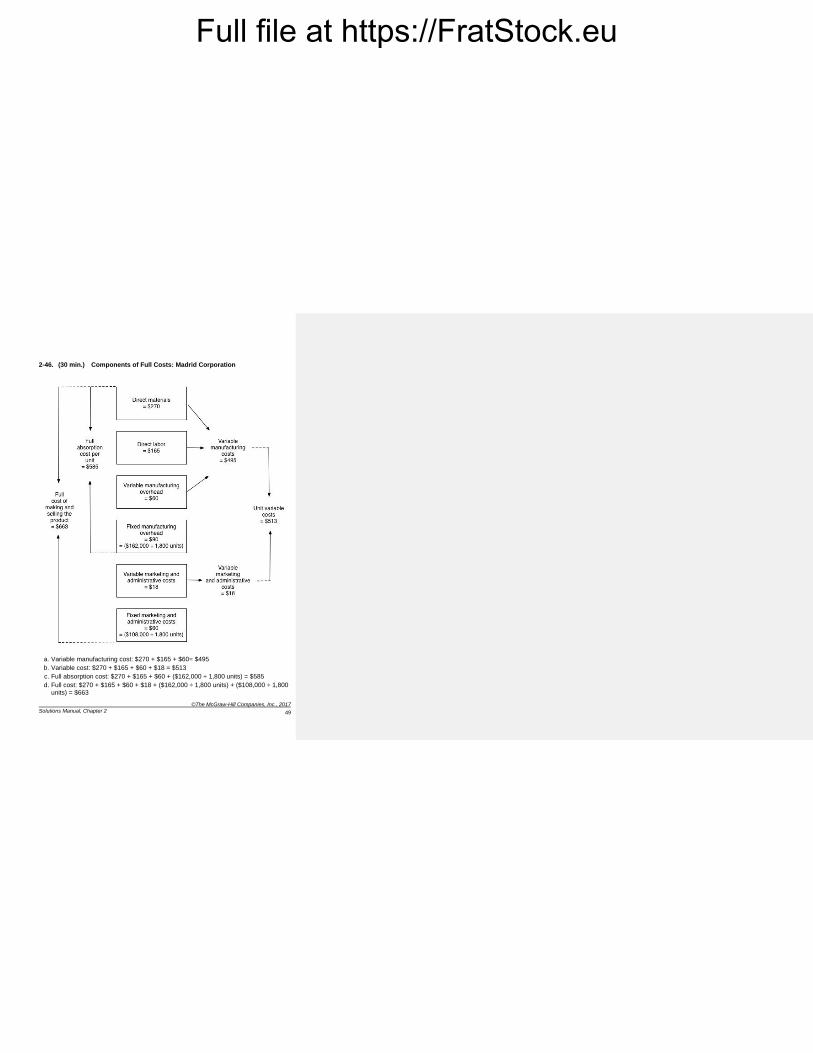
2-46. (30 min.) Components of Full Costs: Madrid Corporation
a. Variable manufacturing cost: $270 + $165 + $60= $495
b. Variable cost: $270 + $165 + $60 + $18 = $513
c. Full absorption cost: $270 + $165 + $60 + ($162,000 ÷ 1,800 units) = $585
d. Full cost: $270 + $165 + $60 + $18 + ($162,000 ÷ 1,800 units) + ($108,000 ÷ 1,800
units) = $663
Full file at https://FratStock.eu
©The McGraw-Hill Companies, Inc., 2017
Fundamentals of Cost Accounting
50
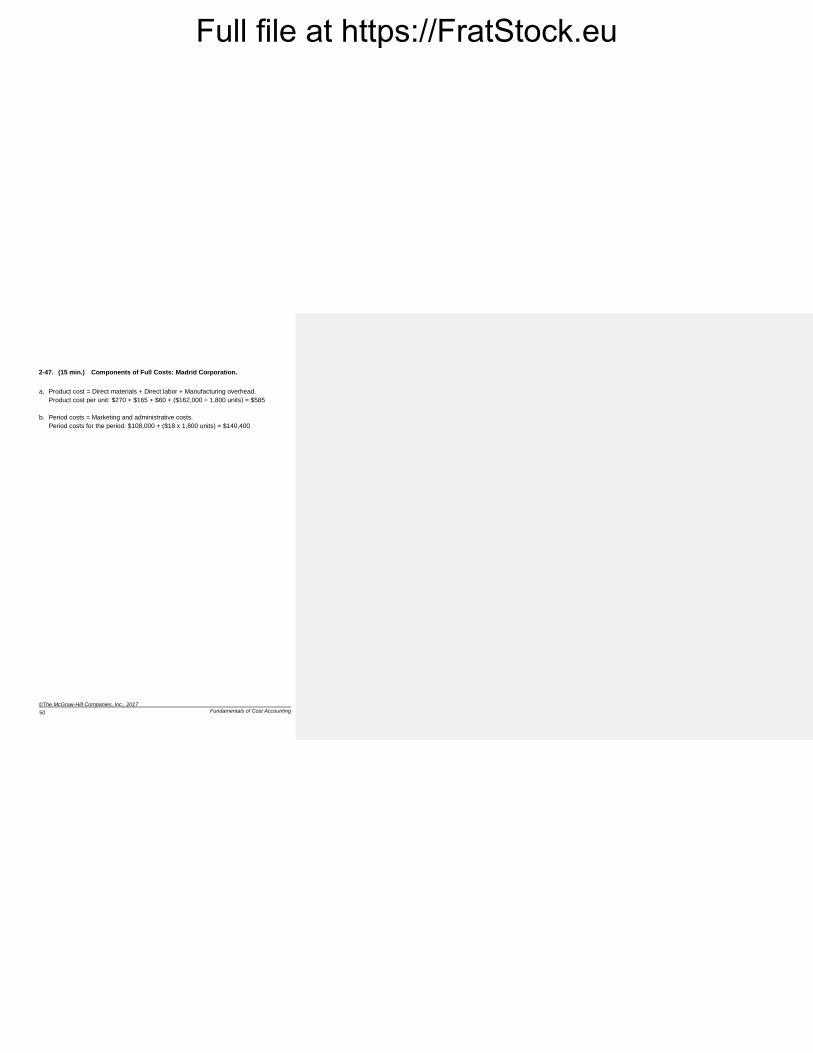
2-47. (15 min.) Components of Full Costs: Madrid Corporation.
a. Product cost = Direct materials + Direct labor + Manufacturing overhead.
Product cost per unit: $270 + $165 + $60 + ($162,000 ÷ 1,800 units) = $585
b. Period costs = Marketing and administrative costs.
Period costs for the period: $108,000 + ($18 x 1,800 units) = $140,400
Full file at https://FratStock.eu
©The McGraw-Hill Companies, Inc., 2017
Solutions Manual, Chapter 2
51
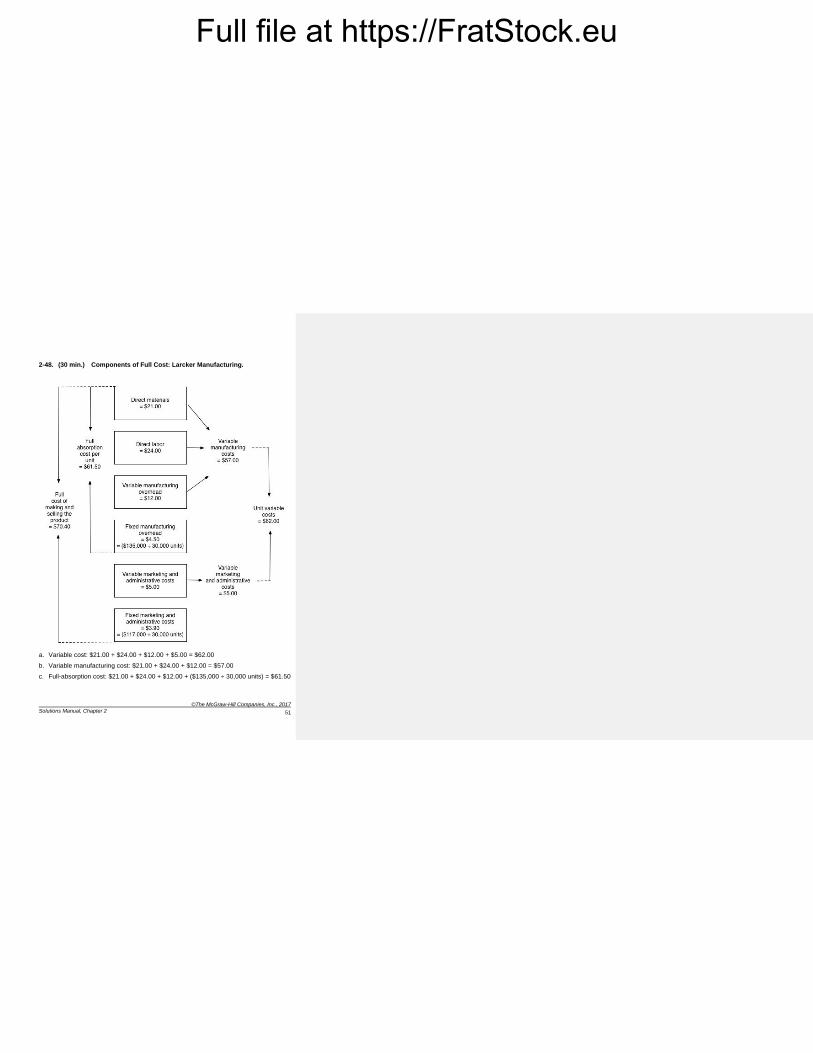
2-48. (30 min.) Components of Full Cost: Larcker Manufacturing.
a. Variable cost: $21.00 + $24.00 + $12.00 + $5.00 = $62.00
b. Variable manufacturing cost: $21.00 + $24.00 + $12.00 = $57.00
c. Full-absorption cost: $21.00 + $24.00 + $12.00 + ($135,000 ÷ 30,000 units) = $61.50
Full file at https://FratStock.eu
©The McGraw-Hill Companies, Inc., 2017
Fundamentals of Cost Accounting
52
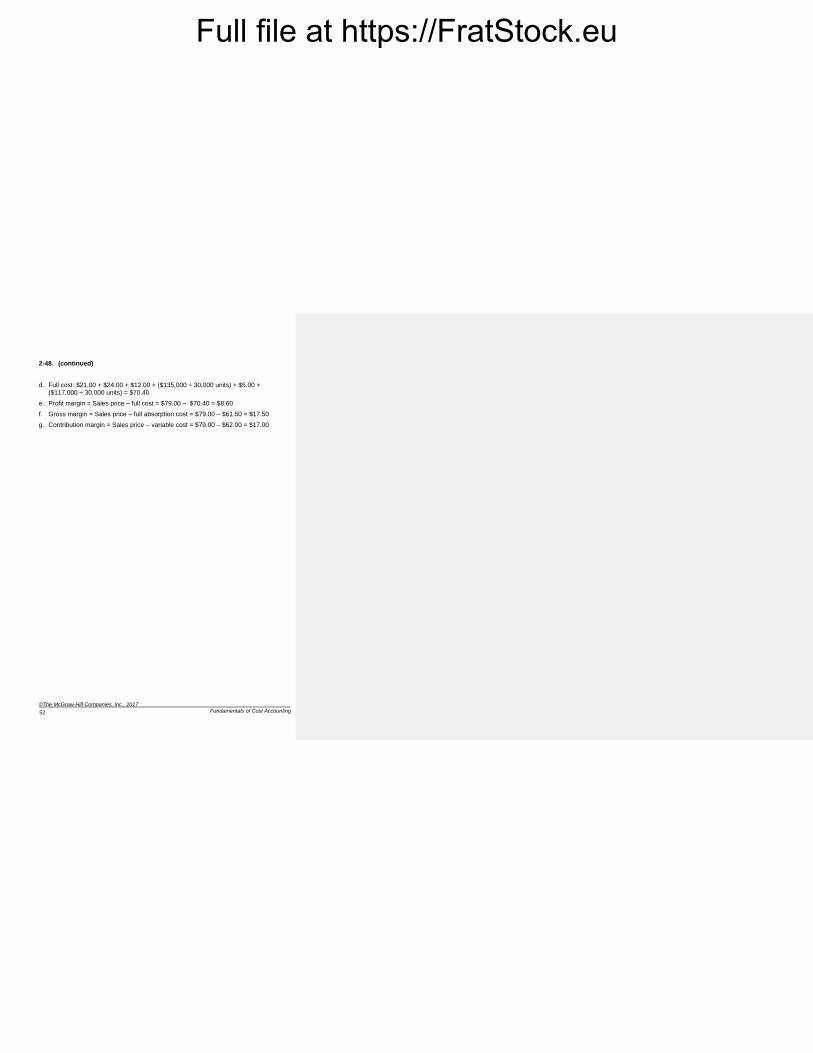
2-48. (continued)
d. Full cost: $21.00 + $24.00 + $12.00 + ($135,000 ÷ 30,000 units) + $5.00 + ($117,000 ÷ 30,000 units) = $70.40
e. Profit margin = Sales price – full cost = $79.00 – $70.40 = $8.60
f. Gross margin = Sales price – full absorption cost = $79.00 – $61.50 = $17.50
g. Contribution margin = Sales price – variable cost = $79.00 – $62.00 = $17.00
Full file at https://FratStock.eu
©The McGraw-Hill Companies, Inc., 2017
Solutions Manual, Chapter 2
53
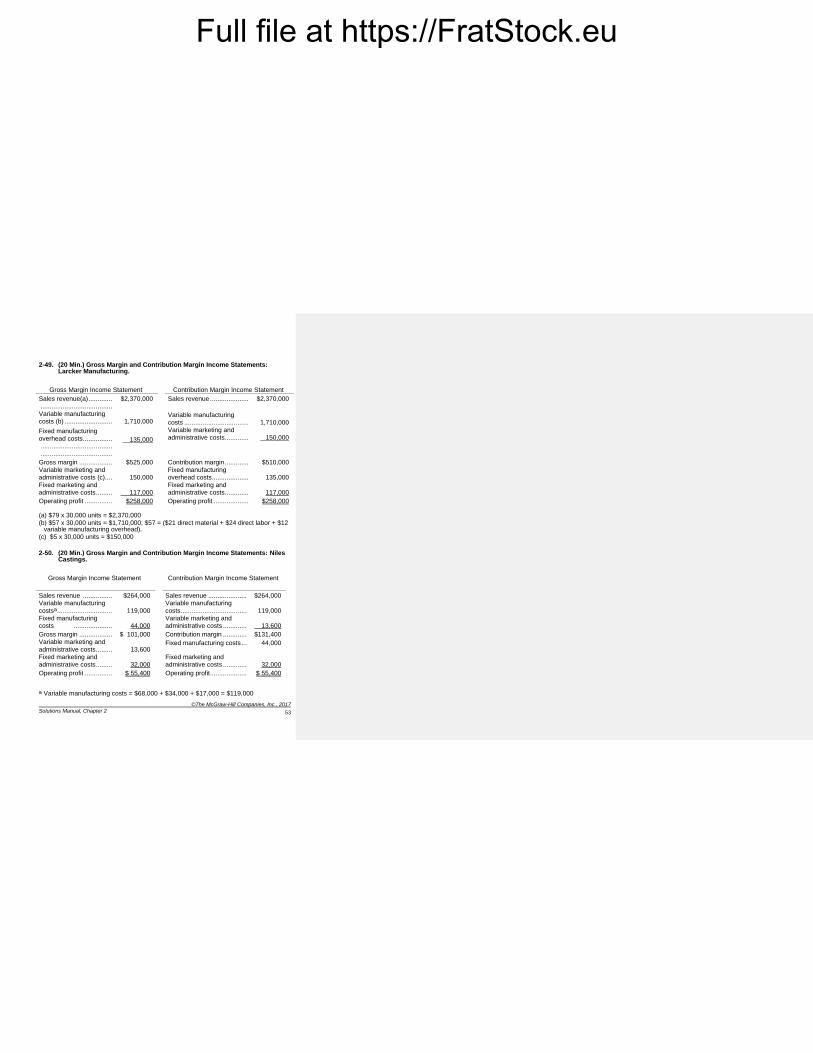
2-49. (20 Min.) Gross Margin and Contribution Margin Income Statements: Larcker Manufacturing.
Gross Margin Income Statement Contribution Margin Income Statement
Sales revenue(a) ............. .......................................
$2,370,000 Sales revenue ..................... $2,370,000
Variable manufacturing costs (b) ..........................
1,710,000
Variable manufacturing costs ...................................
1,710,000
Fixed manufacturing overhead costs ................
....................................... .......................................
135,000
Variable marketing and administrative costs .............
150,000
Gross margin .................. $525,000 Contribution margin ............. $510,000 Variable marketing and administrative costs (c) ....
150,000
Fixed manufacturing overhead costs ....................
135,000
Fixed marketing and administrative costs .........
117,000
Fixed marketing and administrative costs .............
117,000
Operating profit ............... $258,000 Operating profit ................... $258,000
(a) $79 x 30,000 units = $2,370,000
(b) $57 x 30,000 units = $1,710,000; $57 = ($21 direct material + $24 direct labor + $12 variable manufacturing overhead).
(c) $5 x 30,000 units = $150,000
2-50. (20 Min.) Gross Margin and Contribution Margin Income Statements: Niles Castings.
Gross Margin Income Statement
Contribution Margin Income Statement
Sales revenue ................ $264,000 Sales revenue ..................... $264,000 Variable manufacturing
costsa ..............................
119,000
Variable manufacturing
costs ....................................
119,000 Fixed manufacturing costs .....................
44,000
Variable marketing and administrative costs .............
13,600
Gross margin .................. $ 101,000 Contribution margin ............. $131,400 Variable marketing and
administrative costs .........
13,600 Fixed manufacturing costs ... 44,000
Fixed marketing and administrative costs .........
32,000
Fixed marketing and administrative costs .............
32,000
Operating profit ............... $ 55,400 Operating profit .................... $ 55,400
a Variable manufacturing costs = $68,000 + $34,000 + $17,000 = $119,000
Full file at https://FratStock.eu
©The McGraw-Hill Companies, Inc., 2017
Fundamentals of Cost Accounting
54
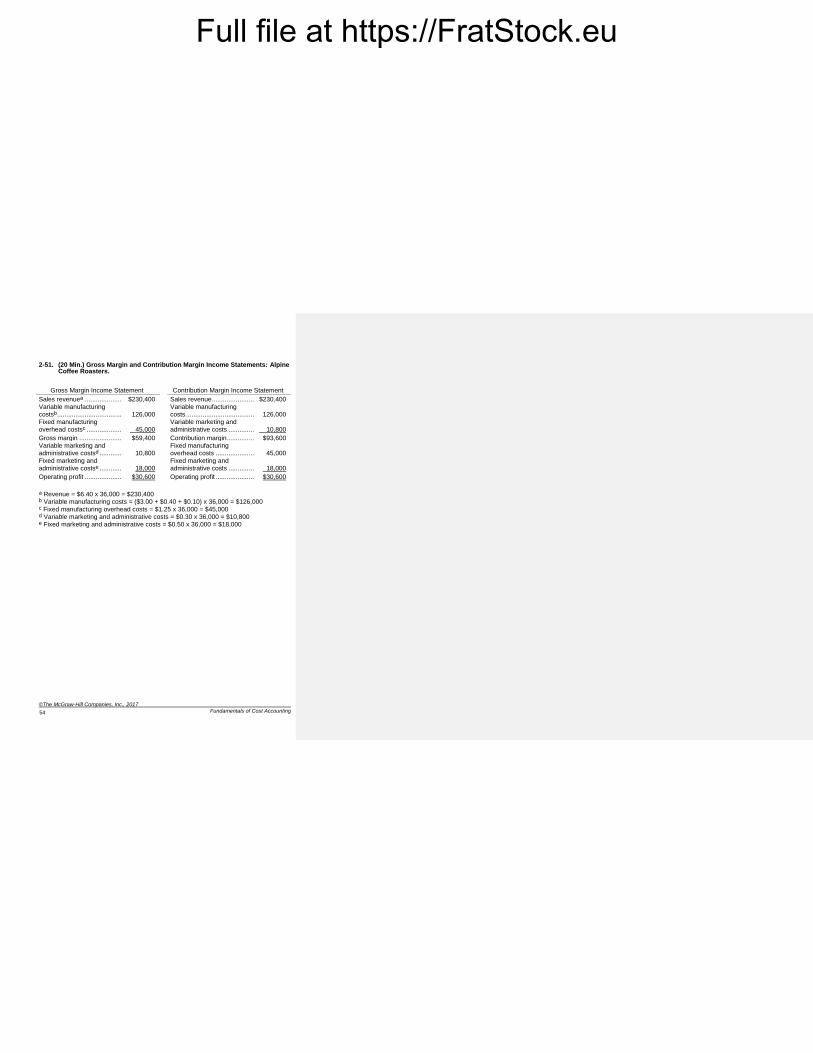
2-51. (20 Min.) Gross Margin and Contribution Margin Income Statements: Alpine Coffee Roasters.
Gross Margin Income Statement Contribution Margin Income Statement
Sales revenuea ..................... $230,400 Sales revenue ....................... $230,400 Variable manufacturing costsb ....................................
126,000
Variable manufacturing costs .....................................
126,000
Fixed manufacturing overhead costsc ....................
45,000
Variable marketing and administrative costs ..............
10,800
Gross margin ........................ $59,400 Contribution margin ............... $93,600 Variable marketing and administrative costsd .............
10,800
Fixed manufacturing overhead costs .....................
45,000
Fixed marketing and administrative costse .............
18,000
Fixed marketing and administrative costs ..............
18,000
Operating profit ..................... $30,600 Operating profit ..................... $30,600
a Revenue = $6.40 x 36,000 = $230,400 b Variable manufacturing costs = ($3.00 + $0.40 + $0.10) x 36,000 = $126,000 c Fixed manufacturing overhead costs = $1.25 x 36,000 = $45,000 d Variable marketing and administrative costs = $0.30 x 36,000 = $10,800 e Fixed marketing and administrative costs = $0.50 x 36,000 = $18,000
Full file at https://FratStock.eu
©The McGraw-Hill Companies, Inc., 2017
Solutions Manual, Chapter 2
55
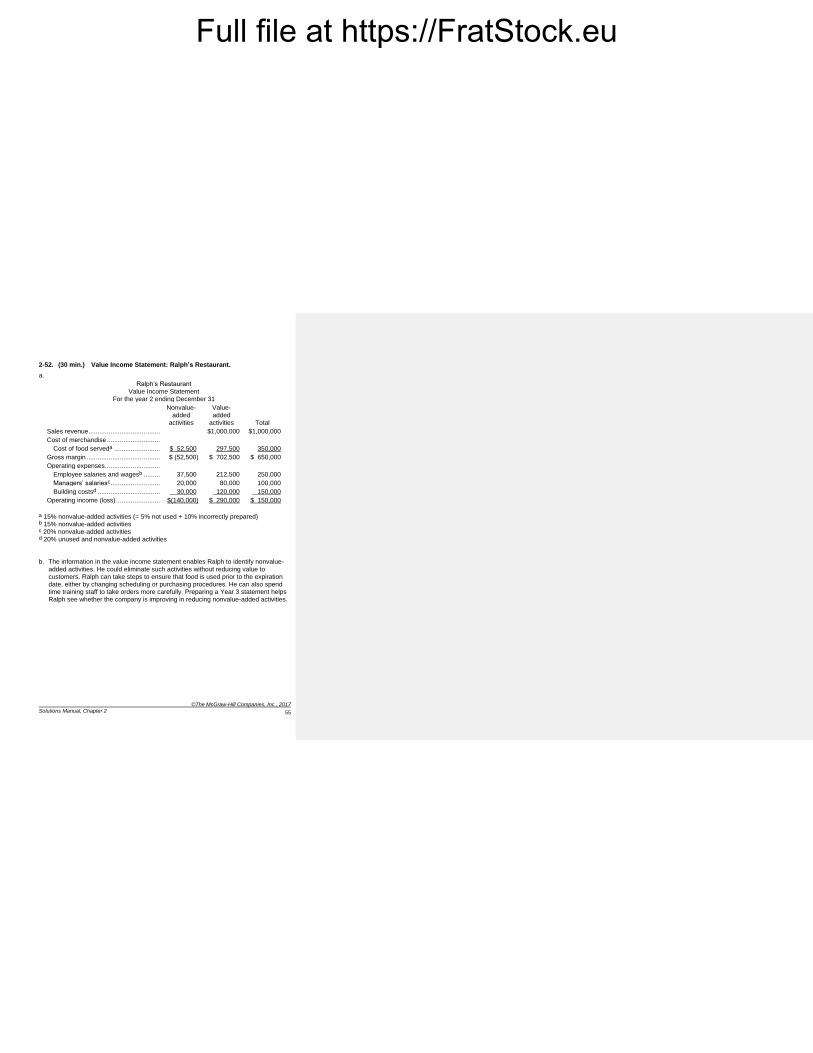
2-52. (30 min.) Value Income Statement: Ralph’s Restaurant.
a.
Ralph’s Restaurant
Value Income Statement For the year 2 ending December 31
Nonvalue-added
activities
Value-added
activities
Total
Sales revenue ....................................... $1,000,000 $1,000,000
Cost of merchandise .............................
Cost of food serveda ......................... $ 52,500 297,500 350,000
Gross margin ........................................ $ (52,500) $ 702,500 $ 650,000
Operating expenses ..............................
Employee salaries and wagesb ......... 37,500 212,500 250,000
Managers’ salariesc ........................... 20,000 80,000 100,000
Building costsd .................................. 30,000 120,000 150,000
Operating income (loss) ........................ $(140,000) $ 290,000 $ 150,000
a 15% nonvalue-added activities (= 5% not used + 10% incorrectly prepared) b 15% nonvalue-added activities c 20% nonvalue-added activities d 20% unused and nonvalue-added activities
b. The information in the value income statement enables Ralph to identify nonvalue-
added activities. He could eliminate such activities without reducing value to customers. Ralph can take steps to ensure that food is used prior to the expiration date, either by changing scheduling or purchasing procedures. He can also spend time training staff to take orders more carefully. Preparing a Year 3 statement helps Ralph see whether the company is improving in reducing nonvalue-added activities.
Full file at https://FratStock.eu
©The McGraw-Hill Companies, Inc., 2017
Fundamentals of Cost Accounting
56
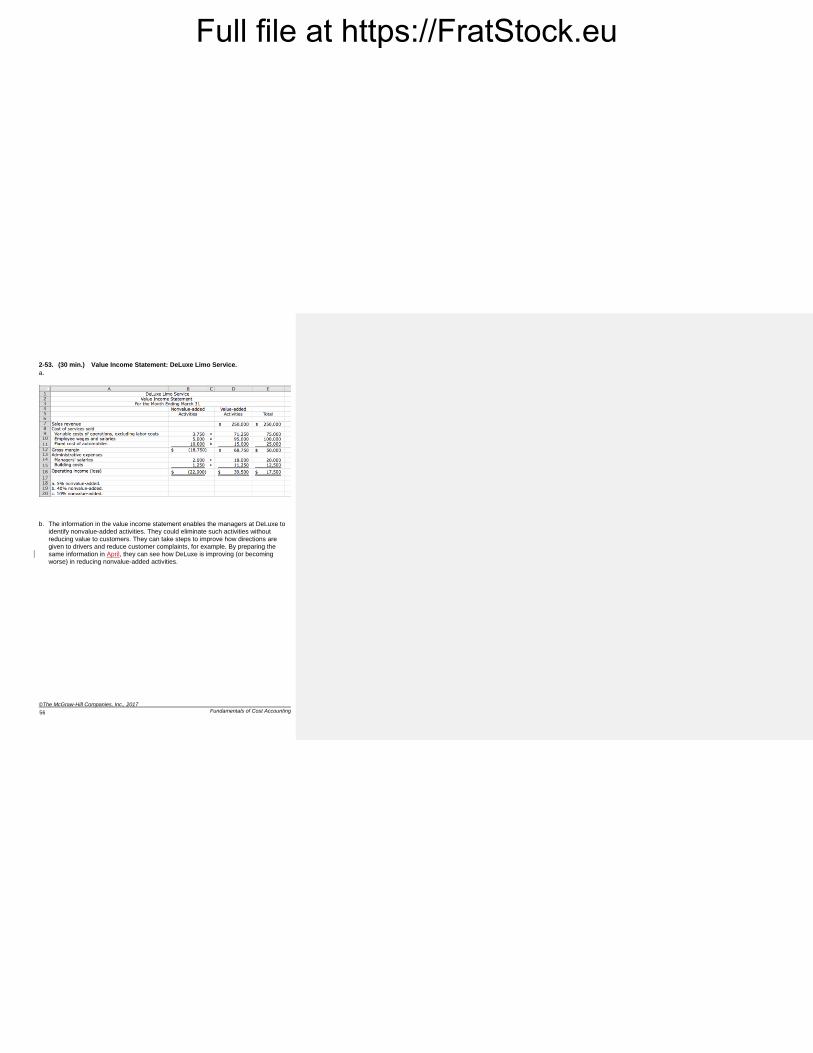
2-53. (30 min.) Value Income Statement: DeLuxe Limo Service.
a.
b. The information in the value income statement enables the managers at DeLuxe to identify nonvalue-added activities. They could eliminate such activities without reducing value to customers. They can take steps to improve how directions are given to drivers and reduce customer complaints, for example. By preparing the same information in April, they can see how DeLuxe is improving (or becoming worse) in reducing nonvalue-added activities.
Full file at https://FratStock.eu
©The McGraw-Hill Companies, Inc., 2017
Solutions Manual, Chapter 2
57
Solutions to Problems
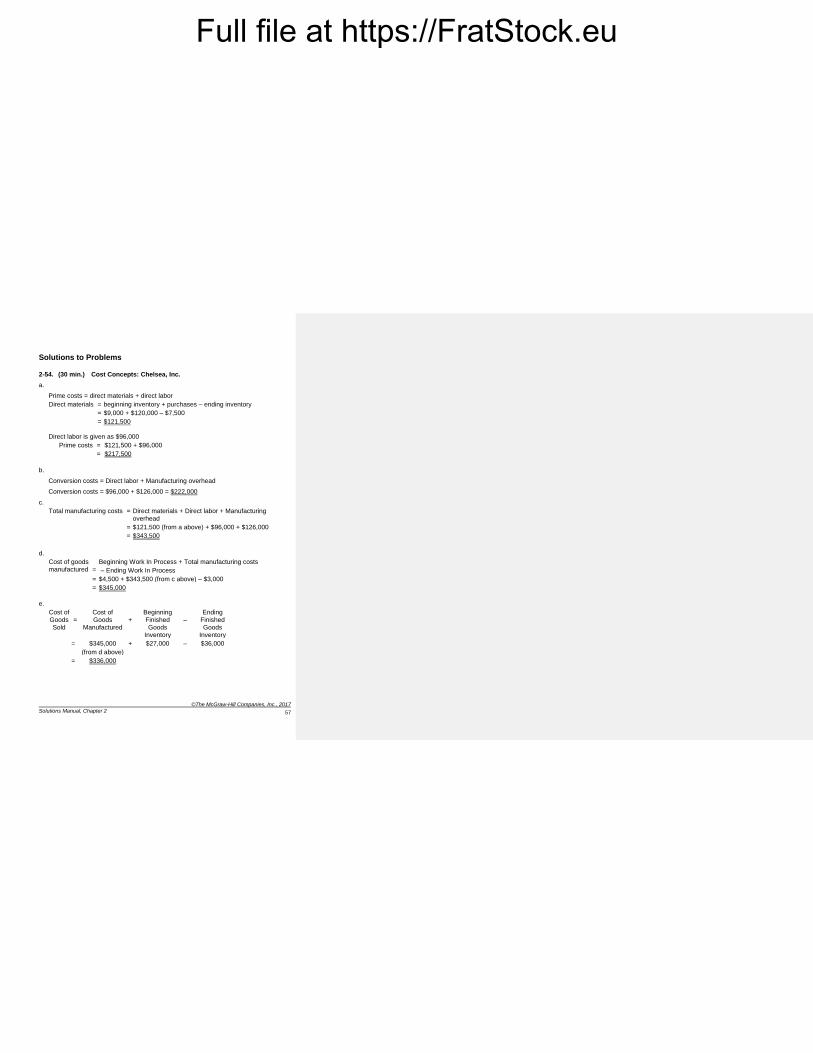
2-54. (30 min.) Cost Concepts: Chelsea, Inc.
a.
Prime costs = direct materials + direct labor
Direct materials = beginning inventory + purchases – ending inventory
= $9,000 + $120,000 – $7,500
= $121,500
Direct labor is given as $96,000
Prime costs = $121,500 + $96,000
= $217,500
b.
Conversion costs = Direct labor + Manufacturing overhead
Conversion costs = $96,000 + $126,000 = $222,000
c.
Total manufacturing costs = Direct materials + Direct labor + Manufacturing
overhead
= $121,500 (from a above) + $96,000 + $126,000
= $343,500
d.
Cost of goods manufactured
=
Beginning Work In Process + Total manufacturing costs
– Ending Work In Process
= $4,500 + $343,500 (from c above) – $3,000
= $345,000
e.
Cost of Goods Sold
=
Cost of Goods
Manufactured
+
Beginning Finished Goods
Inventory
–
Ending Finished Goods
Inventory
= $345,000 + $27,000 – $36,000
(from d above)
= $336,000
Full file at https://FratStock.eu
©The McGraw-Hill Companies, Inc., 2017
Fundamentals of Cost Accounting
58
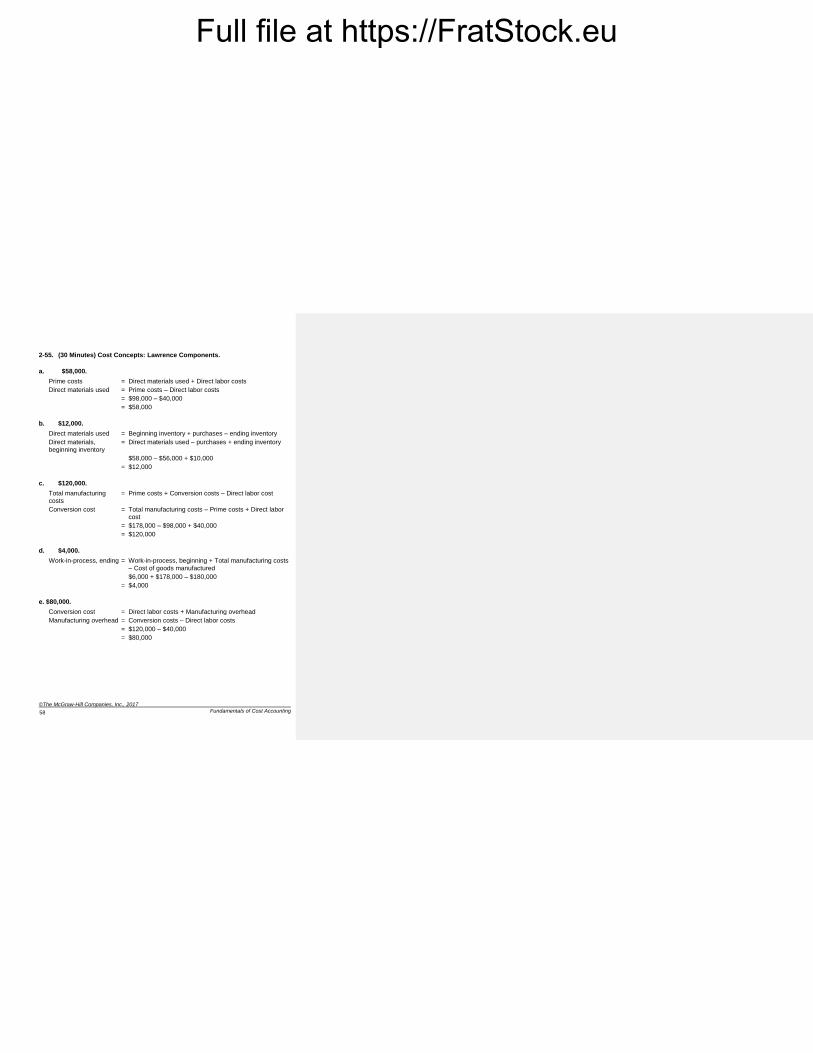
2-55. (30 Minutes) Cost Concepts: Lawrence Components.
a. $58,000.
Prime costs = Direct materials used + Direct labor costs
Direct materials used = Prime costs – Direct labor costs
= $98,000 – $40,000
= $58,000
b. $12,000.
Direct materials used = Beginning inventory + purchases – ending inventory
Direct materials, beginning inventory
= Direct materials used – purchases + ending inventory
$58,000 – $56,000 + $10,000
= $12,000
c. $120,000.
Total manufacturing costs
= Prime costs + Conversion costs – Direct labor cost
Conversion cost = Total manufacturing costs – Prime costs + Direct labor cost
= $178,000 – $98,000 + $40,000
= $120,000
d. $4,000.
Work-in-process, ending = Work-in-process, beginning + Total manufacturing costs
– Cost of goods manufactured
$6,000 + $178,000 – $180,000
= $4,000
e. $80,000.
Conversion cost = Direct labor costs + Manufacturing overhead
Manufacturing overhead = Conversion costs – Direct labor costs
= $120,000 – $40,000
= $80,000
Full file at https://FratStock.eu
©The McGraw-Hill Companies, Inc., 2017
Solutions Manual, Chapter 2
59
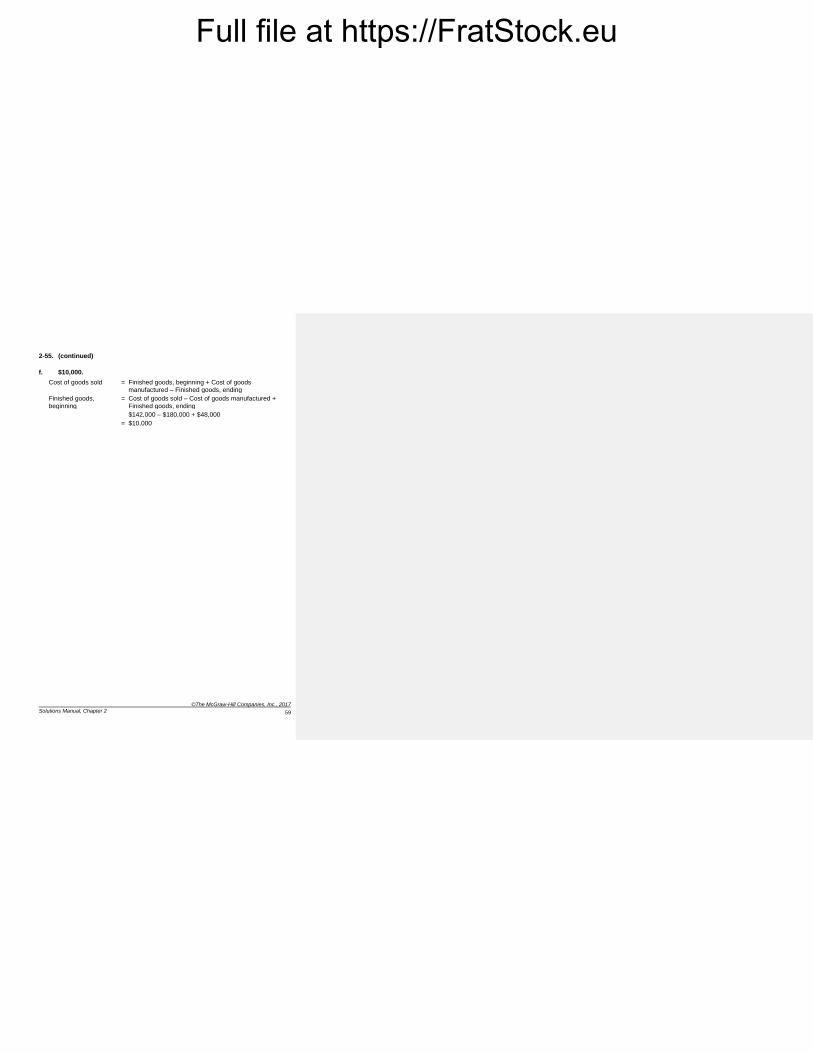
2-55. (continued)
f. $10,000.
Cost of goods sold = Finished goods, beginning + Cost of goods
manufactured – Finished goods, ending
Finished goods,
beginning
= Cost of goods sold – Cost of goods manufactured +
Finished goods, ending
$142,000 – $180,000 + $48,000
= $10,000
Full file at https://FratStock.eu
©The McGraw-Hill Companies, Inc., 2017
Fundamentals of Cost Accounting
60
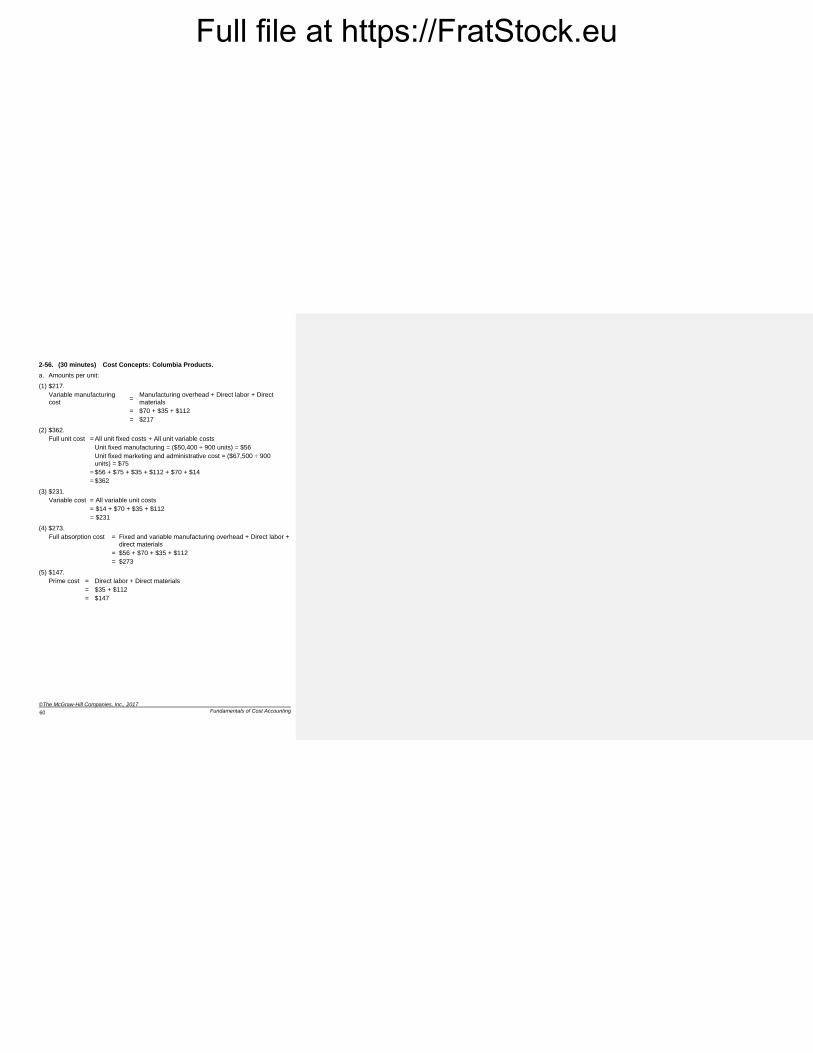
2-56. (30 minutes) Cost Concepts: Columbia Products.
a. Amounts per unit:
(1) $217.
Variable manufacturing cost
= Manufacturing overhead + Direct labor + Direct materials
= $70 + $35 + $112
= $217
(2) $362.
Full unit cost = All unit fixed costs + All unit variable costs
Unit fixed manufacturing = ($50,400 ÷ 900 units) = $56
Unit fixed marketing and administrative cost = ($67,500 ÷ 900 units) = $75
= $56 + $75 + $35 + $112 + $70 + $14
= $362
(3) $231.
Variable cost = All variable unit costs
= $14 + $70 + $35 + $112
= $231
(4) $273.
Full absorption cost = Fixed and variable manufacturing overhead + Direct labor +
direct materials
= $56 + $70 + $35 + $112
= $273
(5) $147.
Prime cost = Direct labor + Direct materials
= $35 + $112
= $147
Full file at https://FratStock.eu
©The McGraw-Hill Companies, Inc., 2017
Solutions Manual, Chapter 2
61
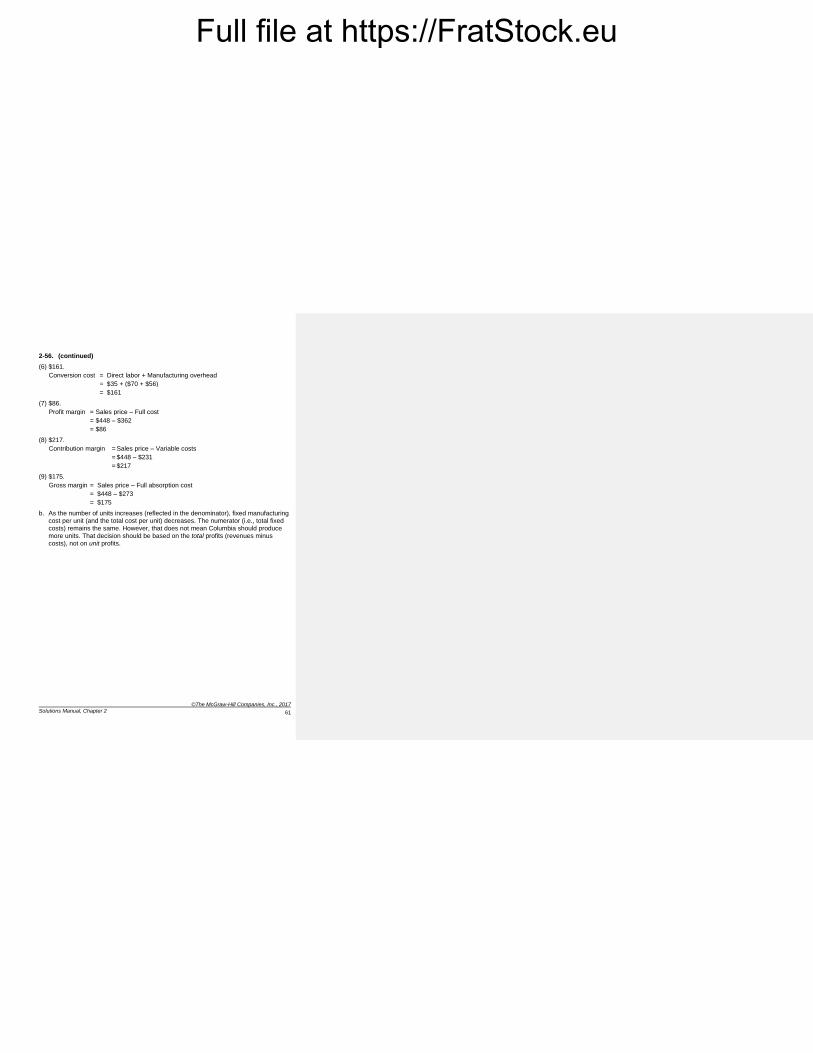
2-56. (continued)
(6) $161.
Conversion cost = Direct labor + Manufacturing overhead
= $35 + ($70 + $56)
= $161
(7) $86.
Profit margin = Sales price – Full cost
= $448 – $362
= $86
(8) $217.
Contribution margin = Sales price – Variable costs
= $448 – $231
= $217
(9) $175.
Gross margin = Sales price – Full absorption cost
= $448 – $273
= $175
b. As the number of units increases (reflected in the denominator), fixed manufacturing cost per unit (and the total cost per unit) decreases. The numerator (i.e., total fixed costs) remains the same. However, that does not mean Columbia should produce
more units. That decision should be based on the total profits (revenues minus costs), not on unit profits.
Full file at https://FratStock.eu
©The McGraw-Hill Companies, Inc., 2017
Fundamentals of Cost Accounting
62
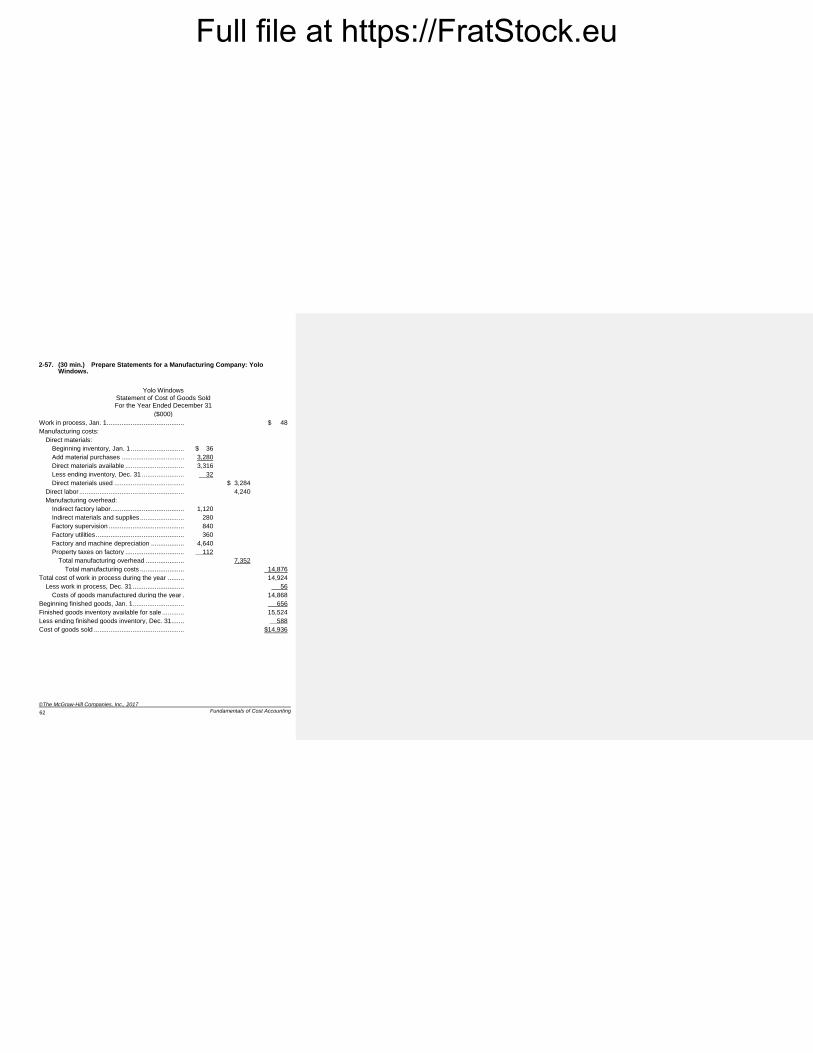
2-57. (30 min.) Prepare Statements for a Manufacturing Company: Yolo Windows.
Yolo Windows
Statement of Cost of Goods Sold For the Year Ended December 31
($000)
Work in process, Jan. 1 .......................................... $ 48
Manufacturing costs:
Direct materials:
Beginning inventory, Jan. 1 ............................. $ 36
Add material purchases .................................. 3,280
Direct materials available ................................ 3,316
Less ending inventory, Dec. 31 ....................... 32
Direct materials used ...................................... $ 3,284
Direct labor ......................................................... 4,240
Manufacturing overhead:
Indirect factory labor........................................ 1,120
Indirect materials and supplies ........................ 280
Factory supervision ......................................... 840
Factory utilities ................................................ 360
Factory and machine depreciation .................. 4,640
Property taxes on factory ................................ 112
Total manufacturing overhead ..................... 7,352
Total manufacturing costs ........................ 14,876
Total cost of work in process during the year ......... 14,924
Less work in process, Dec. 31 ............................ 56
Costs of goods manufactured during the year . 14,868
Beginning finished goods, Jan. 1 ............................ 656
Finished goods inventory available for sale ............ 15,524
Less ending finished goods inventory, Dec. 31 ....... 588
Cost of goods sold ................................................. $14,936

Full file at https://FratStock.eu
©The McGraw-Hill Companies, Inc., 2017
Solutions Manual, Chapter 2
63
2-57. (continued)
Yolo Windows
Income Statement For the Year Ended December 31
($000)
Sales revenue .......................................................................... $18,160
Less: Cost of goods sold .......................................................... 14,936
Gross margin ........................................................................... $3,224
Administrative costs ................................................................. $1,440
Marketing costs ........................................................................ 600
Total marketing and administrative costs ................................. 2,040
Operating profit ........................................................................ $1,184
Full file at https://FratStock.eu
©The McGraw-Hill Companies, Inc., 2017
Fundamentals of Cost Accounting
64
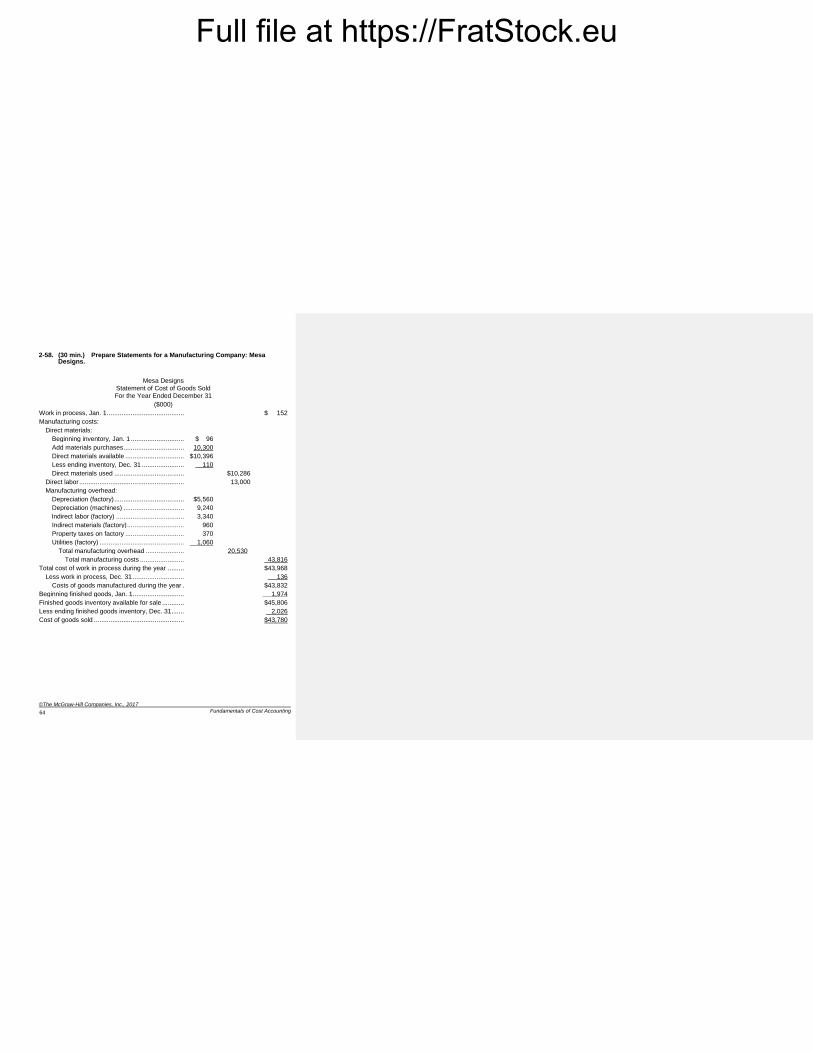
2-58. (30 min.) Prepare Statements for a Manufacturing Company: Mesa Designs.
Mesa Designs Statement of Cost of Goods Sold For the Year Ended December 31
($000)
Work in process, Jan. 1 .......................................... $ 152
Manufacturing costs:
Direct materials:
Beginning inventory, Jan. 1 ............................. $ 96
Add materials purchases ................................. 10,300
Direct materials available ................................ $10,396
Less ending inventory, Dec. 31 ....................... 110
Direct materials used ...................................... $10,286
Direct labor ......................................................... 13,000
Manufacturing overhead:
Depreciation (factory) ...................................... $5,560
Depreciation (machines) ................................. 9,240
Indirect labor (factory) ..................................... 3,340
Indirect materials (factory) ............................... 960
Property taxes on factory ................................ 370
Utilities (factory) .............................................. 1,060
Total manufacturing overhead ..................... 20,530
Total manufacturing costs ........................ 43,816
Total cost of work in process during the year ......... $43,968
Less work in process, Dec. 31 ............................ 136
Costs of goods manufactured during the year . $43,832
Beginning finished goods, Jan. 1 ............................ 1,974
Finished goods inventory available for sale ............ $45,806
Less ending finished goods inventory, Dec. 31 ....... 2,026
Cost of goods sold ................................................. $43,780
Full file at https://FratStock.eu
©The McGraw-Hill Companies, Inc., 2017
Solutions Manual, Chapter 2
65
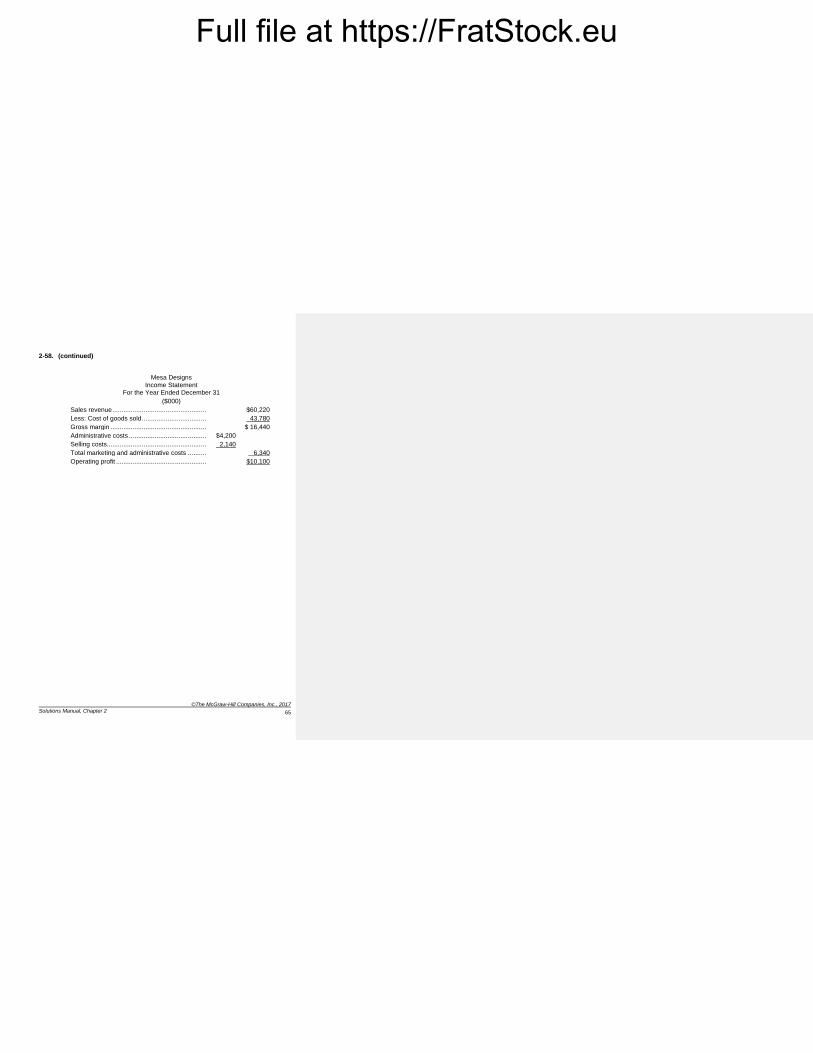
2-58. (continued)
Mesa Designs
Income Statement For the Year Ended December 31
($000)
Sales revenue .......................................................................... $60,220
Less: Cost of goods sold .......................................................... 43,780
Gross margin ........................................................................... $ 16,440
Administrative costs ................................................................. $4,200
Selling costs ............................................................................. 2,140
Total marketing and administrative costs ................................. 6,340
Operating profit ........................................................................ $10,100
Full file at https://FratStock.eu
©The McGraw-Hill Companies, Inc., 2017
Fundamentals of Cost Accounting
66
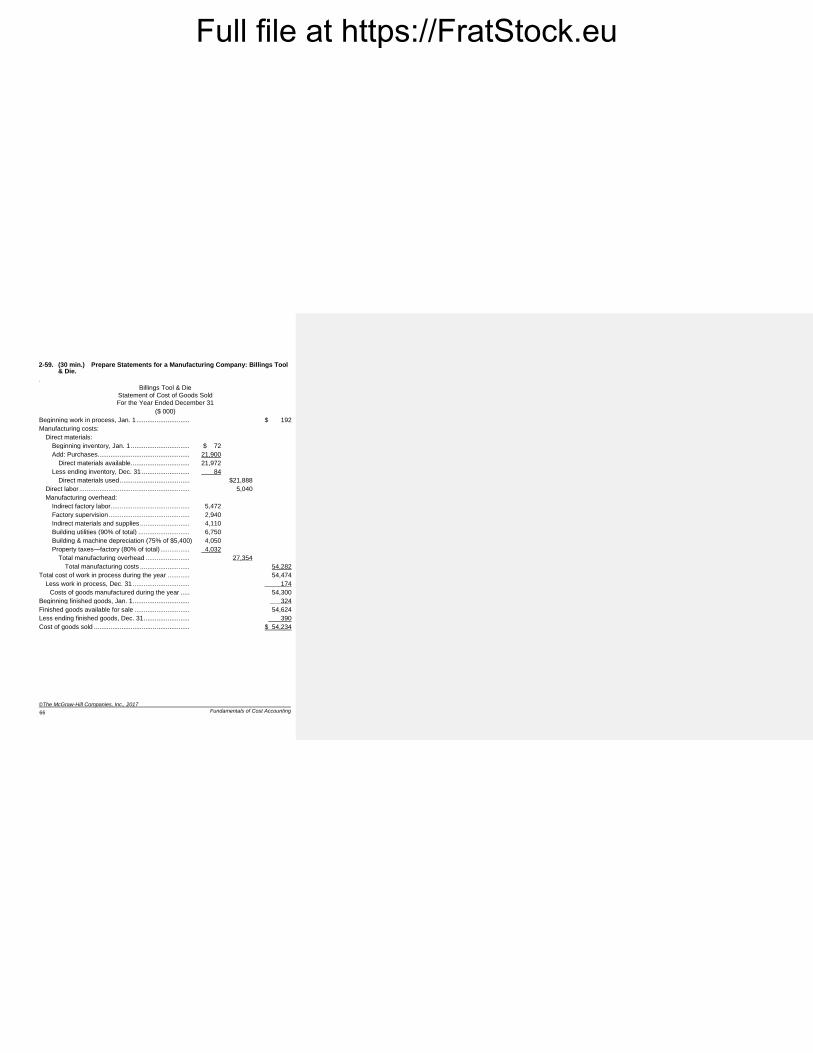
2-59. (30 min.) Prepare Statements for a Manufacturing Company: Billings Tool & Die.
.
Billings Tool & Die Statement of Cost of Goods Sold For the Year Ended December 31
($ 000)
Beginning work in process, Jan. 1 ............................. $ 192
Manufacturing costs:
Direct materials:
Beginning inventory, Jan. 1 ................................ $ 72
Add: Purchases .................................................. 21,900
Direct materials available ................................ 21,972
Less ending inventory, Dec. 31 .......................... 84
Direct materials used ...................................... $21,888
Direct labor ............................................................ 5,040
Manufacturing overhead:
Indirect factory labor........................................... 5,472
Factory supervision ............................................ 2,940
Indirect materials and supplies ........................... 4,110
Building utilities (90% of total) ............................ 6,750
Building & machine depreciation (75% of $5,400) 4,050
Property taxes—factory (80% of total) ................ 4,032
Total manufacturing overhead ........................ 27,354
Total manufacturing costs ........................... 54,282
Total cost of work in process during the year ............ 54,474
Less work in process, Dec. 31 ............................... 174
Costs of goods manufactured during the year ..... 54,300
Beginning finished goods, Jan. 1 ............................... 324
Finished goods available for sale .............................. 54,624
Less ending finished goods, Dec. 31 ......................... 390
Cost of goods sold .................................................... $ 54,234
Full file at https://FratStock.eu
©The McGraw-Hill Companies, Inc., 2017
Solutions Manual, Chapter 2
67
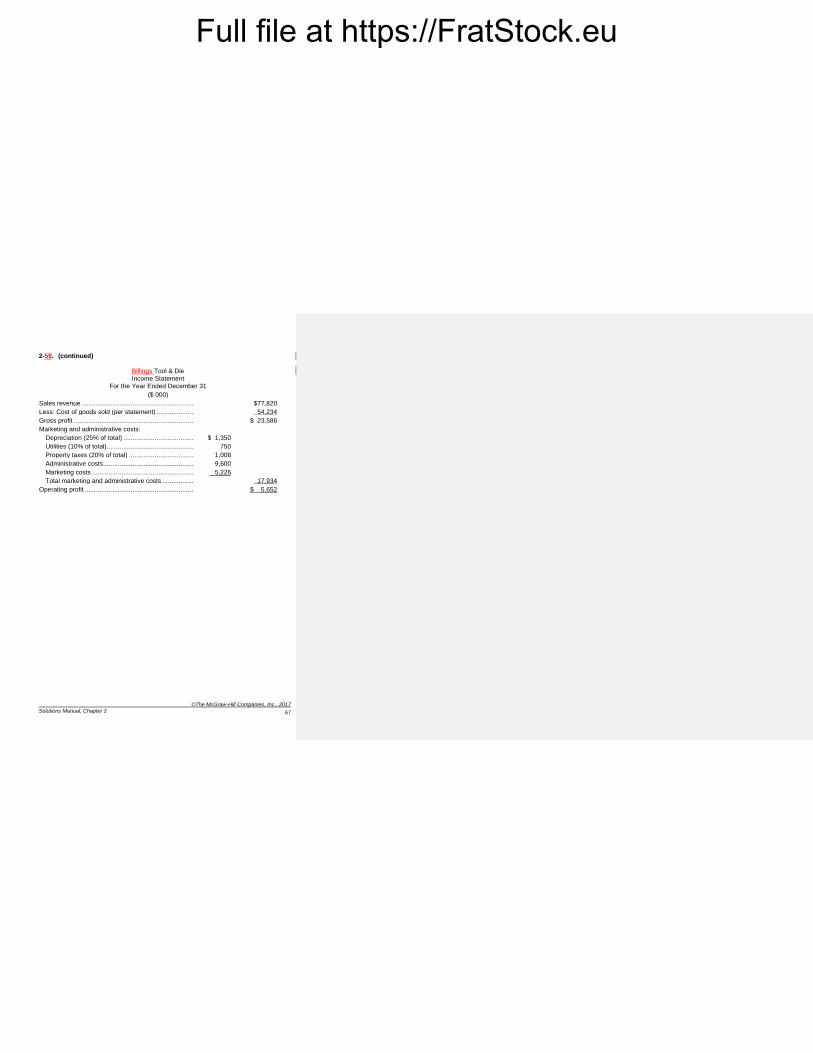
2-59. (continued)
Billings Tool & Die
Income Statement For the Year Ended December 31
($ 000)
Sales revenue ............................................................. $77,820
Less: Cost of goods sold (per statement) .................... 54,234
Gross profit ................................................................. $ 23,586
Marketing and administrative costs:
Depreciation (25% of total) ...................................... $ 1,350
Utilities (10% of total) ............................................... 750
Property taxes (20% of total) ................................... 1,008
Administrative costs ................................................. 9,600
Marketing costs ....................................................... 5,226
Total marketing and administrative costs ................. 17,934
Operating profit ........................................................... $ 5,652
Full file at https://FratStock.eu
©The McGraw-Hill Companies, Inc., 2017
Fundamentals of Cost Accounting
68
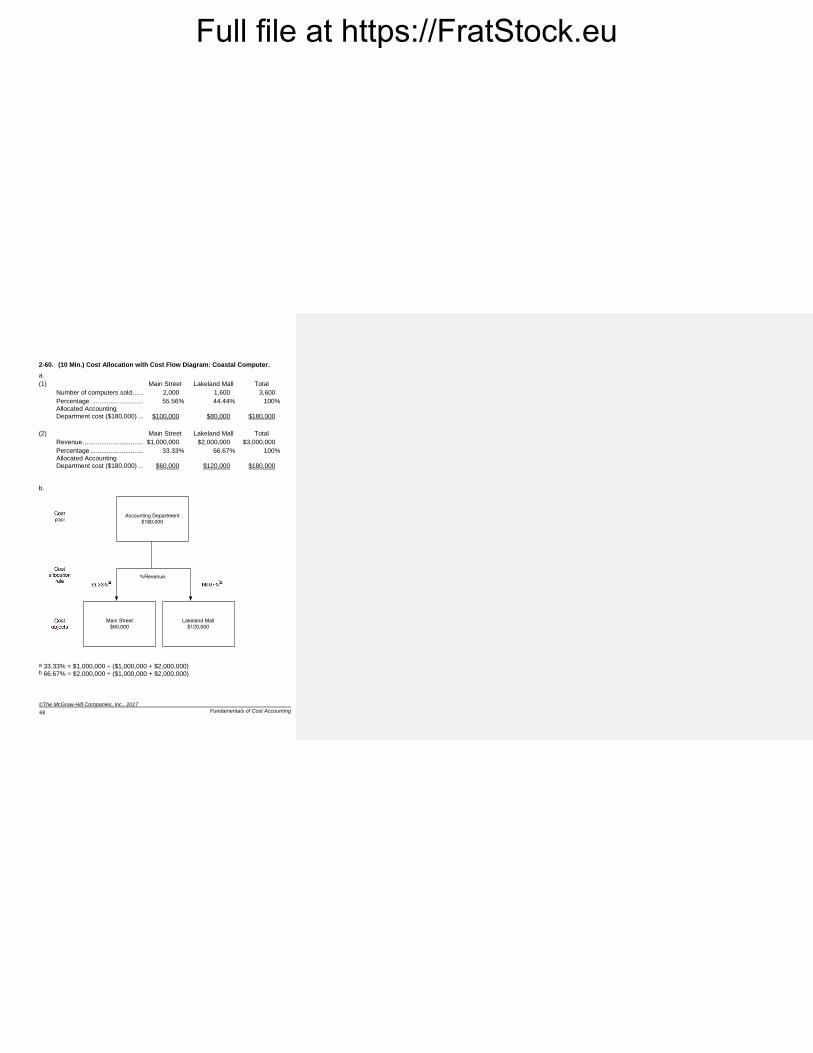
2-60. (10 Min.) Cost Allocation with Cost Flow Diagram: Coastal Computer.
a.
(1) Main Street Lakeland Mall Total
Number of computers sold ........ 2,000 1,600 3,600
Percentage .............................. 55.56% 44.44% 100%
Allocated Accounting
Department cost ($180,000) .....
$100,000
$80,000
$180,000
(2) Main Street Lakeland Mall Total
Revenue ................................... $1,000,000 $2,000,000 $3,000,000
Percentage ............................... 33.33% 66.67% 100%
Allocated Accounting Department cost ($180,000) .....
$60,000
$120,000
$180,000
b.
a 33.33% = $1,000,000 ÷ ($1,000,000 + $2,000,000) b 66.67% = $2,000,000 ÷ ($1,000,000 + $2,000,000)
Full file at https://FratStock.eu
©The McGraw-Hill Companies, Inc., 2017
Solutions Manual, Chapter 2
69
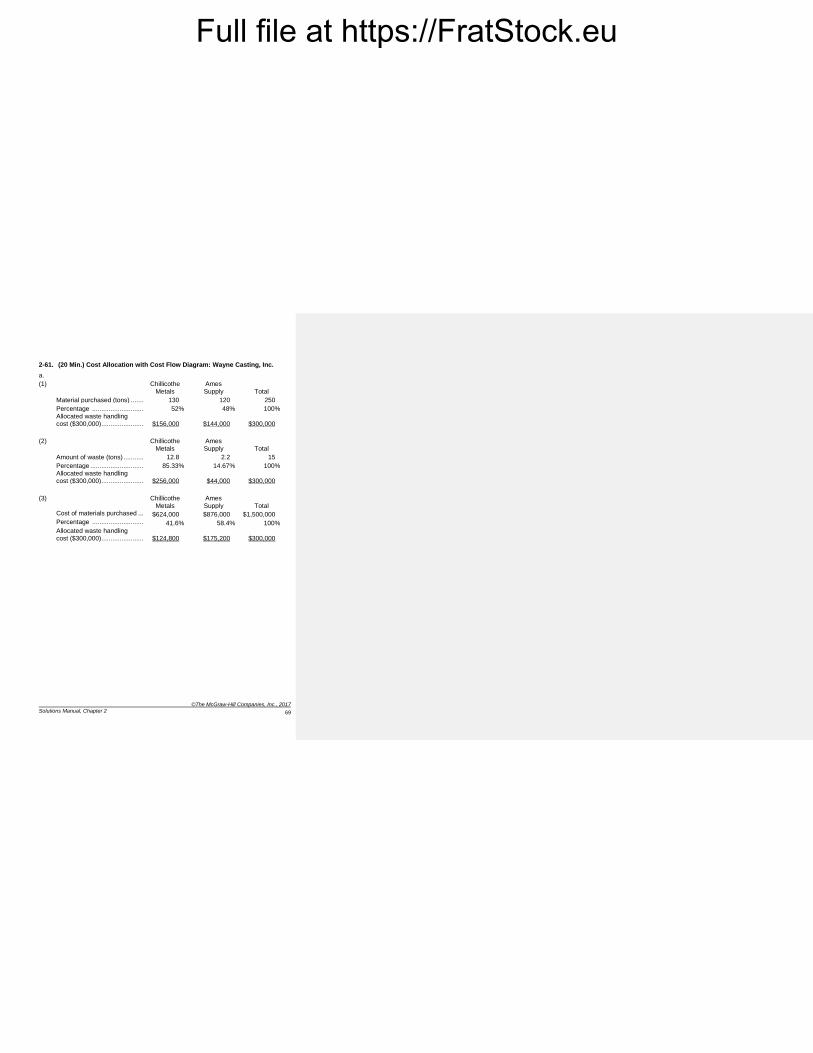
2-61. (20 Min.) Cost Allocation with Cost Flow Diagram: Wayne Casting, Inc.
a.
(1) Chillicothe
Metals
Ames
Supply
Total
Material purchased (tons) ......... 130 120 250
Percentage .............................. 52% 48% 100%
Allocated waste handling cost ($300,000) .........................
$156,000
$144,000
$300,000
(2) Chillicothe Metals
Ames Supply
Total
Amount of waste (tons) ............. 12.8 2.2 15
Percentage ............................... 85.33% 14.67% 100%
Allocated waste handling cost ($300,000) .........................
$256,000
$44,000
$300,000
(3) Chillicothe
Metals
Ames
Supply
Total
Cost of materials purchased ..... $624,000 $876,000 $1,500,000
Percentage .............................. 41.6% 58.4% 100%
Allocated waste handling cost ($300,000) .........................
$124,800
$175,200
$300,000
Full file at https://FratStock.eu
©The McGraw-Hill Companies, Inc., 2017
Fundamentals of Cost Accounting
70
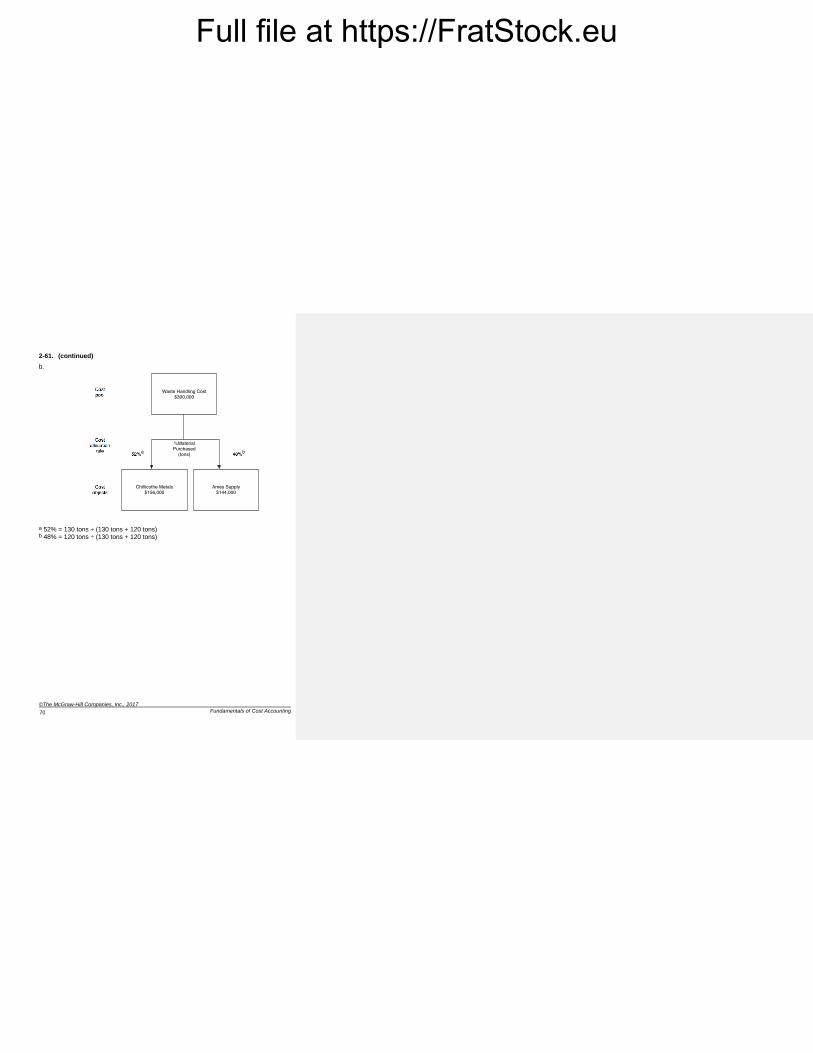
2-61. (continued)
b.
a 52% = 130 tons ÷ (130 tons + 120 tons) b 48% = 120 tons ÷ (130 tons + 120 tons)
Full file at https://FratStock.eu
©The McGraw-Hill Companies, Inc., 2017
Solutions Manual, Chapter 2
71
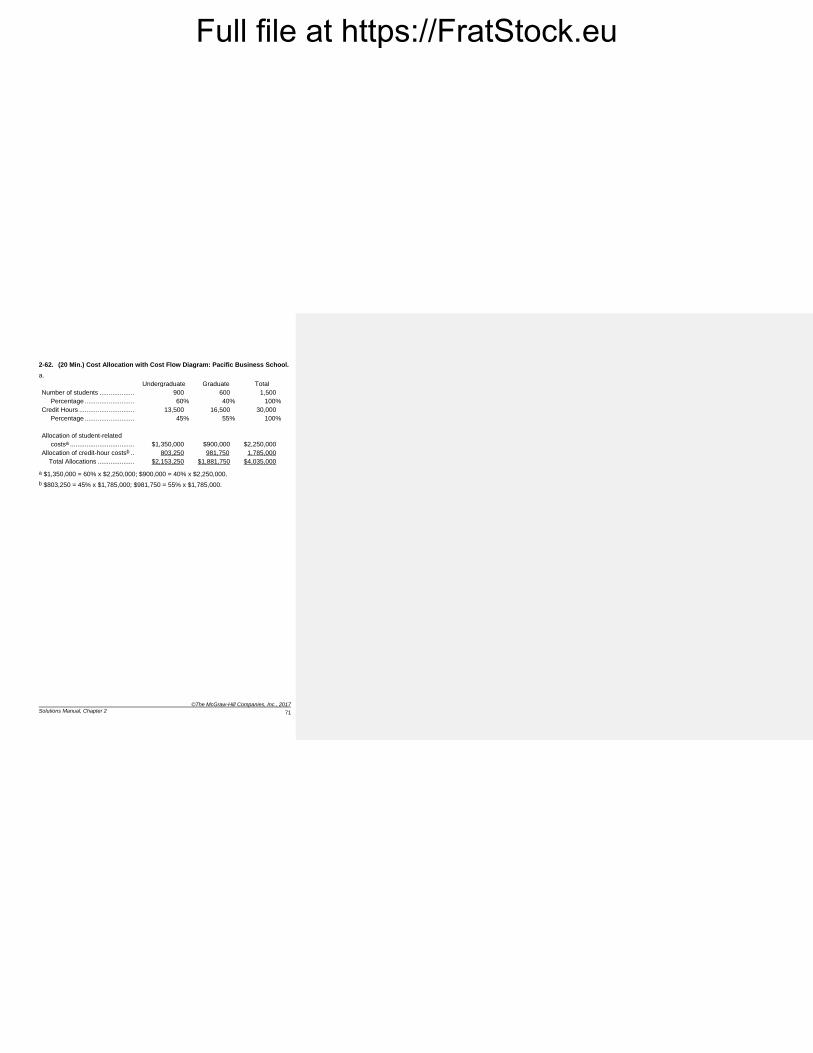
2-62. (20 Min.) Cost Allocation with Cost Flow Diagram: Pacific Business School.
a.
Undergraduate Graduate Total
Number of students ...................... 900 600 1,500
Percentage .............................. 60% 40% 100%
Credit Hours ................................. 13,500 16,500 30,000
Percentage .............................. 45% 55% 100%
Allocation of student-related
costsa ......................................
$1,350,000
$900,000
$2,250,000
Allocation of credit-hour costsb ..... 803,250 981,750 1,785,000
Total Allocations ....................... $2,153,250 $1,881,750 $4,035,000
a $1,350,000 = 60% x $2,250,000; $900,000 = 40% x $2,250,000.
b $803,250 = 45% x $1,785,000; $981,750 = 55% x $1,785,000.
Full file at https://FratStock.eu
©The McGraw-Hill Companies, Inc., 2017
Fundamentals of Cost Accounting
72
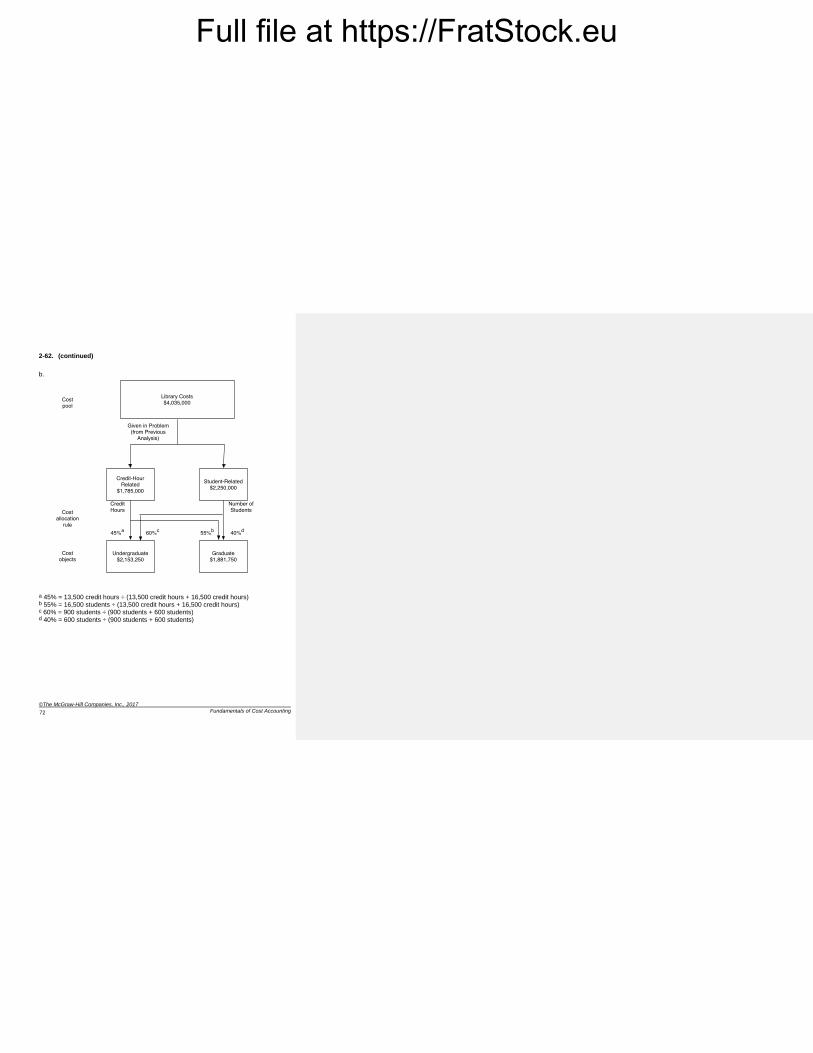
2-62. (continued)
b.
a 45% = 13,500 credit hours ÷ (13,500 credit hours + 16,500 credit hours) b 55% = 16,500 students ÷ (13,500 credit hours + 16,500 credit hours) c 60% = 900 students ÷ (900 students + 600 students) d 40% = 600 students ÷ (900 students + 600 students)
Full file at https://FratStock.eu
©The McGraw-Hill Companies, Inc., 2017
Solutions Manual, Chapter 2
73
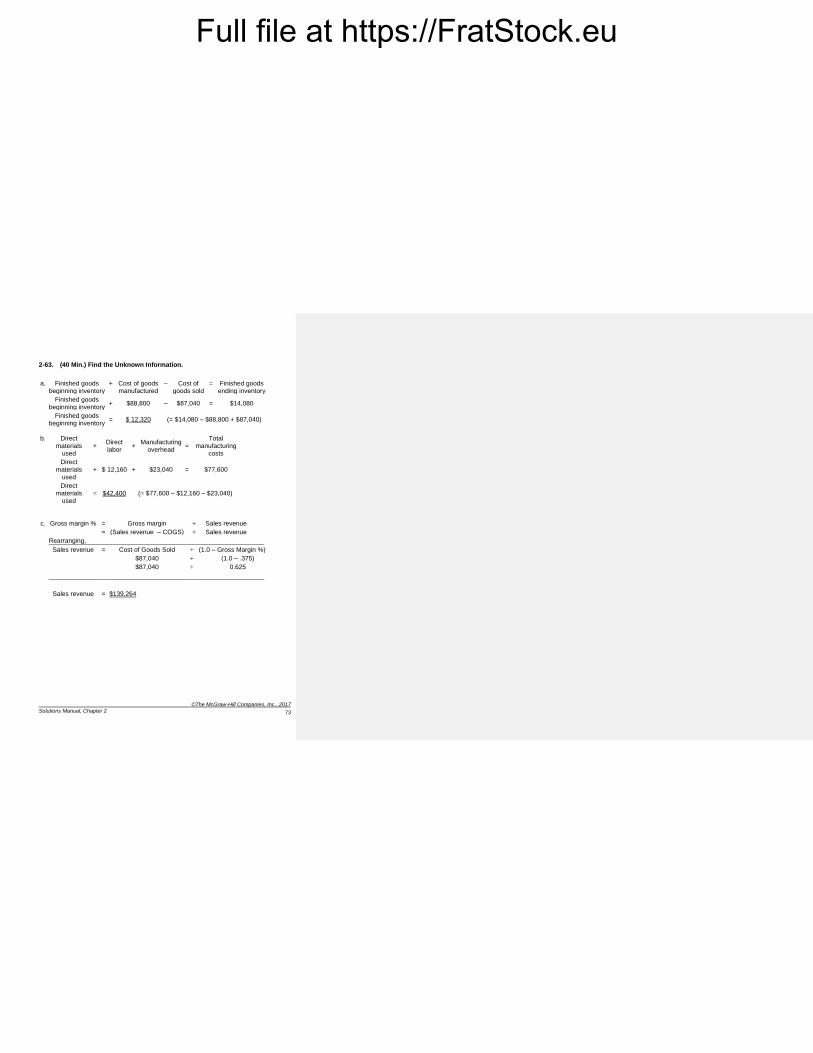
2-63. (40 Min.) Find the Unknown Information.
a. Finished goods beginning inventory
+ Cost of goods manufactured
– Cost of goods sold
= Finished goods ending inventory
Finished goods beginning inventory
+ $88,800 – $87,040 = $14,080
Finished goods beginning inventory
= $ 12,320 (= $14,080 – $88,800 + $87,040)
b. Direct materials
used +
Direct labor
+ Manufacturing
overhead =
Total manufacturing
costs
Direct
materials used
+ $ 12,160 + $23,040 = $77,600
Direct materials
used = $42,400 (= $77,600 – $12,160 – $23,040)
c. Gross margin % = Gross margin ÷ Sales revenue
= (Sales revenue – COGS) ÷ Sales revenue
Rearranging,
Sales revenue = Cost of Goods Sold ÷ (1.0 – Gross Margin %)
$87,040 ÷ (1.0 – .375)
$87,040 ÷ 0.625
Sales revenue = $139,264
Full file at https://FratStock.eu
©The McGraw-Hill Companies, Inc., 2017
Fundamentals of Cost Accounting
74
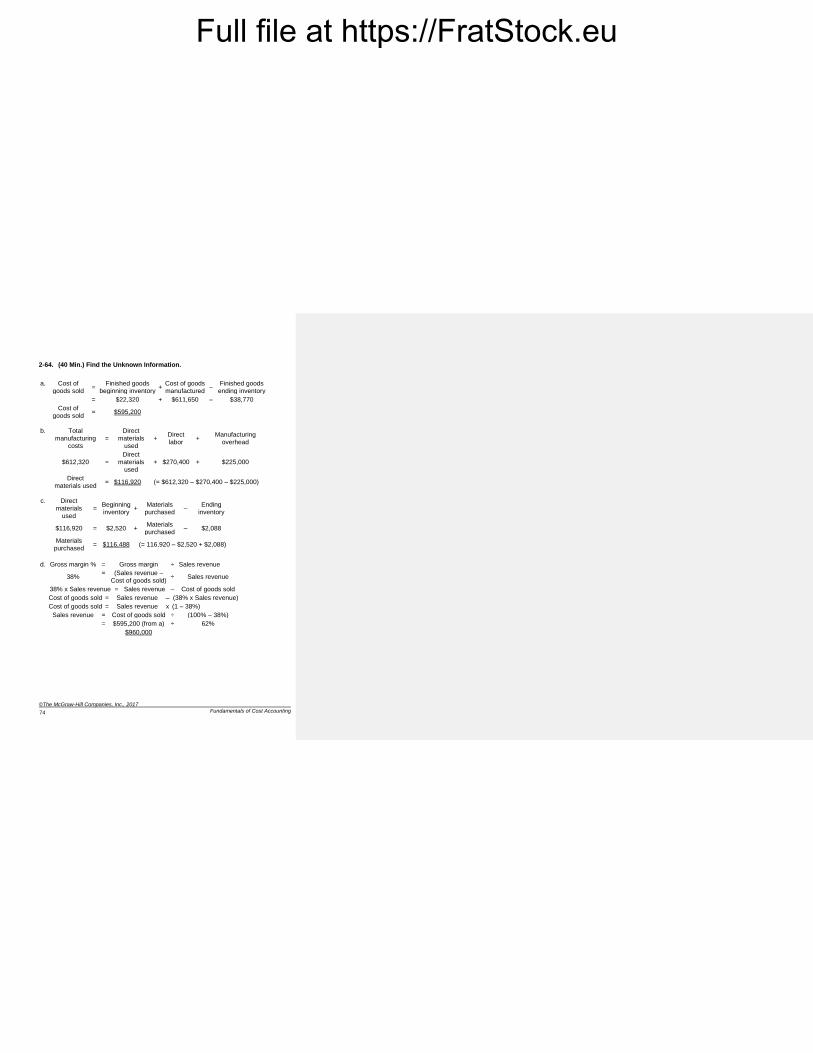
2-64. (40 Min.) Find the Unknown Information.
a. Cost of goods sold
= Finished goods
beginning inventory +
Cost of goods manufactured
– Finished goods
ending inventory
= $22,320 + $611,650 – $38,770
Cost of goods sold
= $595,200
b. Total
manufacturing costs
=
Direct
materials used
+ Direct labor
+ Manufacturing
overhead
$612,320 =
Direct materials
used
+ $270,400 + $225,000
Direct materials used
= $116,920 (= $612,320 – $270,400 – $225,000)
c. Direct
materials used
= Beginning inventory
+ Materials
purchased –
Ending inventory
$116,920 = $2,520 +
Materials purchased
– $2,088
Materials purchased
= $116,488 (= 116,920 – $2,520 + $2,088)
d. Gross margin % = Gross margin ÷ Sales revenue
38%
= (Sales revenue – Cost of goods sold)
÷ Sales revenue
38% x Sales revenue = Sales revenue – Cost of goods sold
Cost of goods sold = Sales revenue – (38% x Sales revenue)
Cost of goods sold = Sales revenue x (1 – 38%)
Sales revenue = Cost of goods sold ÷ (100% – 38%)
= $595,200 (from a) ÷ 62%
$960,000
Full file at https://FratStock.eu
©The McGraw-Hill Companies, Inc., 2017
Solutions Manual, Chapter 2
75
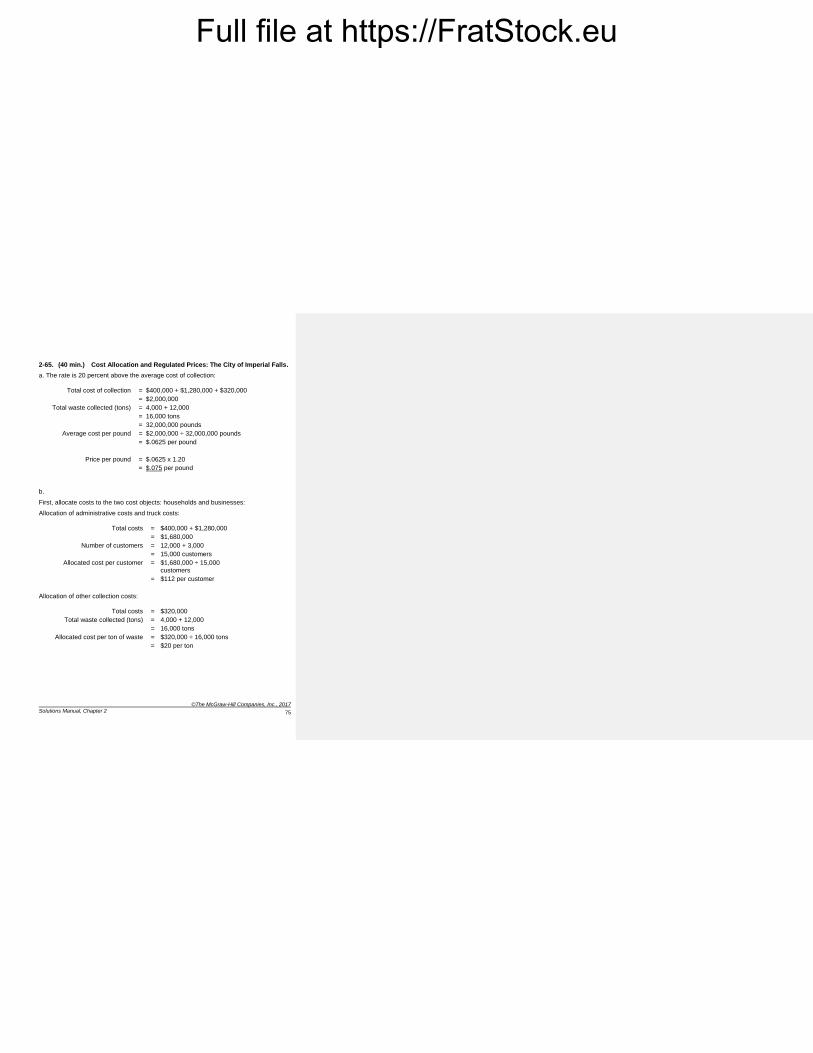
2-65. (40 min.) Cost Allocation and Regulated Prices: The City of Imperial Falls.
a. The rate is 20 percent above the average cost of collection:
Total cost of collection = $400,000 + $1,280,000 + $320,000
= $2,000,000
Total waste collected (tons) = 4,000 + 12,000
= 16,000 tons
= 32,000,000 pounds
Average cost per pound = $2,000,000 ÷ 32,000,000 pounds
= $.0625 per pound
Price per pound = $.0625 x 1.20
= $.075 per pound
b.
First, allocate costs to the two cost objects: households and businesses:
Allocation of administrative costs and truck costs:
Total costs = $400,000 + $1,280,000
= $1,680,000
Number of customers = 12,000 + 3,000
= 15,000 customers
Allocated cost per customer = $1,680,000 ÷ 15,000
customers
= $112 per customer
Allocation of other collection costs:
Total costs = $320,000
Total waste collected (tons) = 4,000 + 12,000
= 16,000 tons
Allocated cost per ton of waste = $320,000 ÷ 16,000 tons
= $20 per ton
Full file at https://FratStock.eu
©The McGraw-Hill Companies, Inc., 2017
Fundamentals of Cost Accounting
76
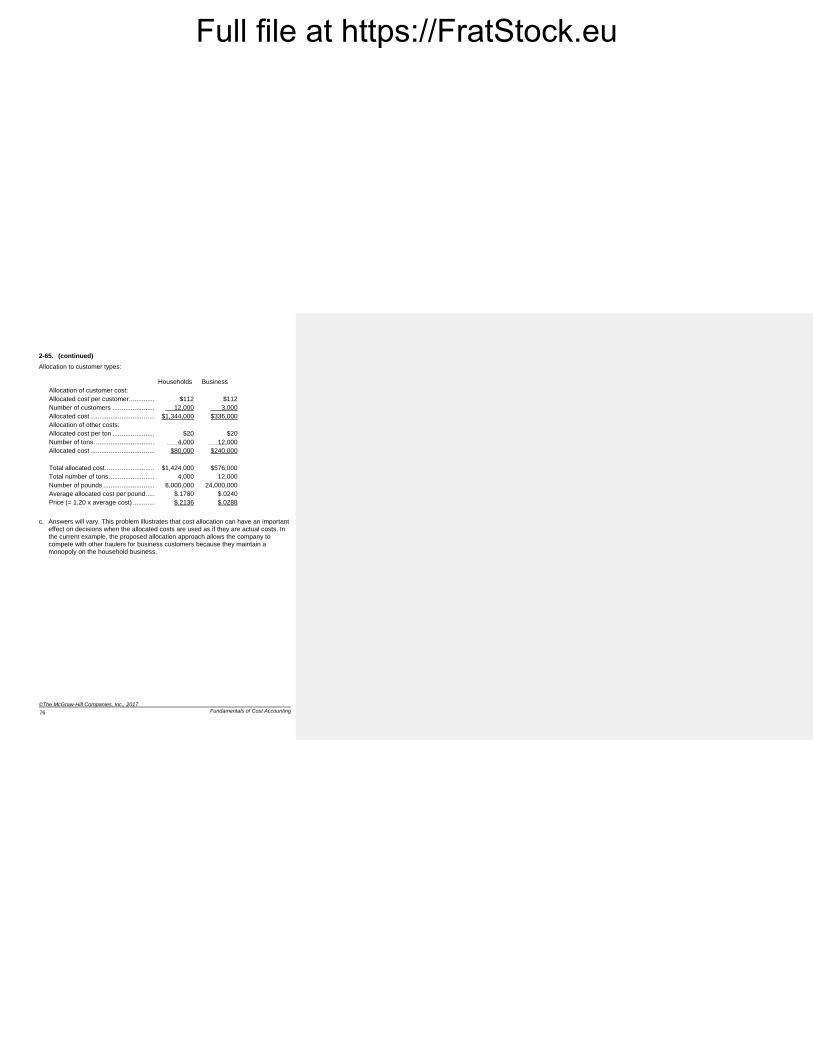
2-65. (continued)
Allocation to customer types:
Households Business
Allocation of customer cost:
Allocated cost per customer ................ $112 $112
Number of customers ......................... 12,000 3,000
Allocated cost ..................................... $1,344,000 $336,000
Allocation of other costs:
Allocated cost per ton ......................... $20 $20
Number of tons ................................... 4,000 12,000
Allocated cost ..................................... $80,000 $240,000
Total allocated cost ............................. $1,424,000 $576,000
Total number of tons ........................... 4,000 12,000
Number of pounds .............................. 8,000,000 24,000,000
Average allocated cost per pound ....... $.1780 $.0240
Price (= 1.20 x average cost) .............. $.2136 $.0288
c. Answers will vary. This problem illustrates that cost allocation can have an important effect on decisions when the allocated costs are used as if they are actual costs. In the current example, the proposed allocation approach allows the company to compete with other haulers for business customers because they maintain a monopoly on the household business.
Full file at https://FratStock.eu
©The McGraw-Hill Companies, Inc., 2017
Solutions Manual, Chapter 2
77
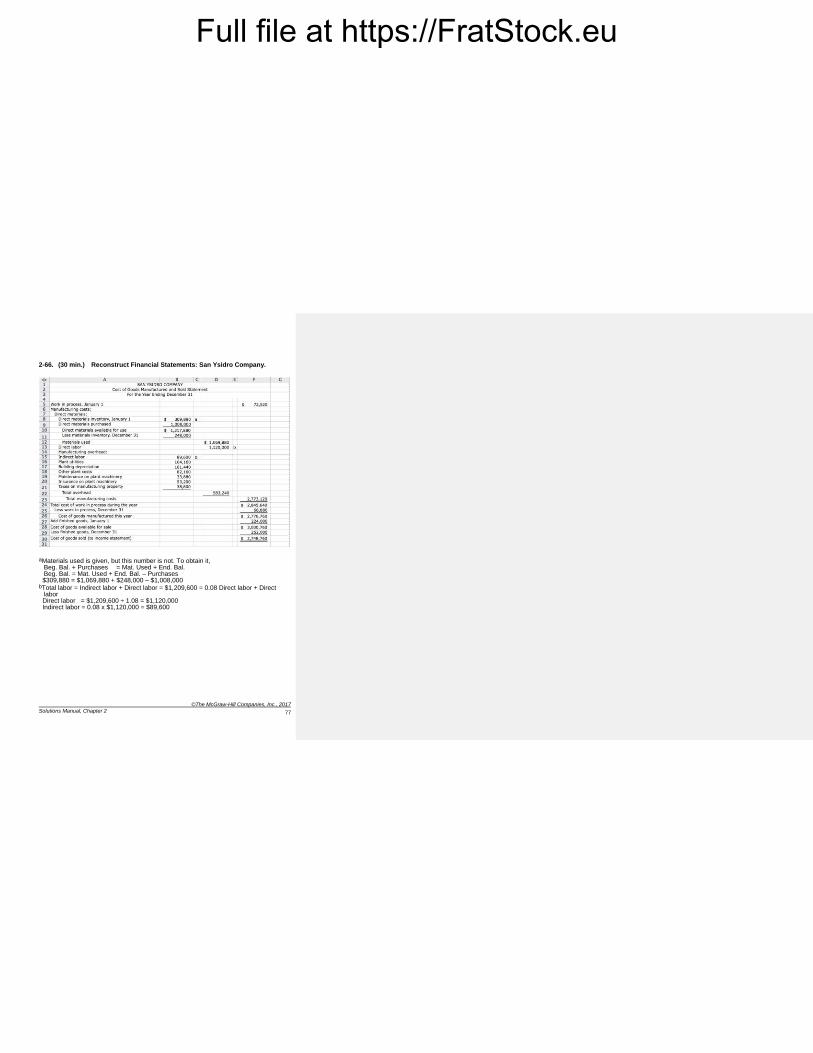
2-66. (30 min.) Reconstruct Financial Statements: San Ysidro Company.
aMaterials used is given, but this number is not. To obtain it, Beg. Bal. + Purchases = Mat. Used + End. Bal. Beg. Bal. = Mat. Used + End. Bal. – Purchases $309,880 = $1,069,880 + $248,000 – $1,008,000 bTotal labor = Indirect labor + Direct labor = $1,209,600 = 0.08 Direct labor + Direct
labor Direct labor = $1,209,600 ÷ 1.08 = $1,120,000 Indirect labor = 0.08 x $1,120,000 = $89,600
Full file at https://FratStock.eu
©The McGraw-Hill Companies, Inc., 2017
Fundamentals of Cost Accounting
78
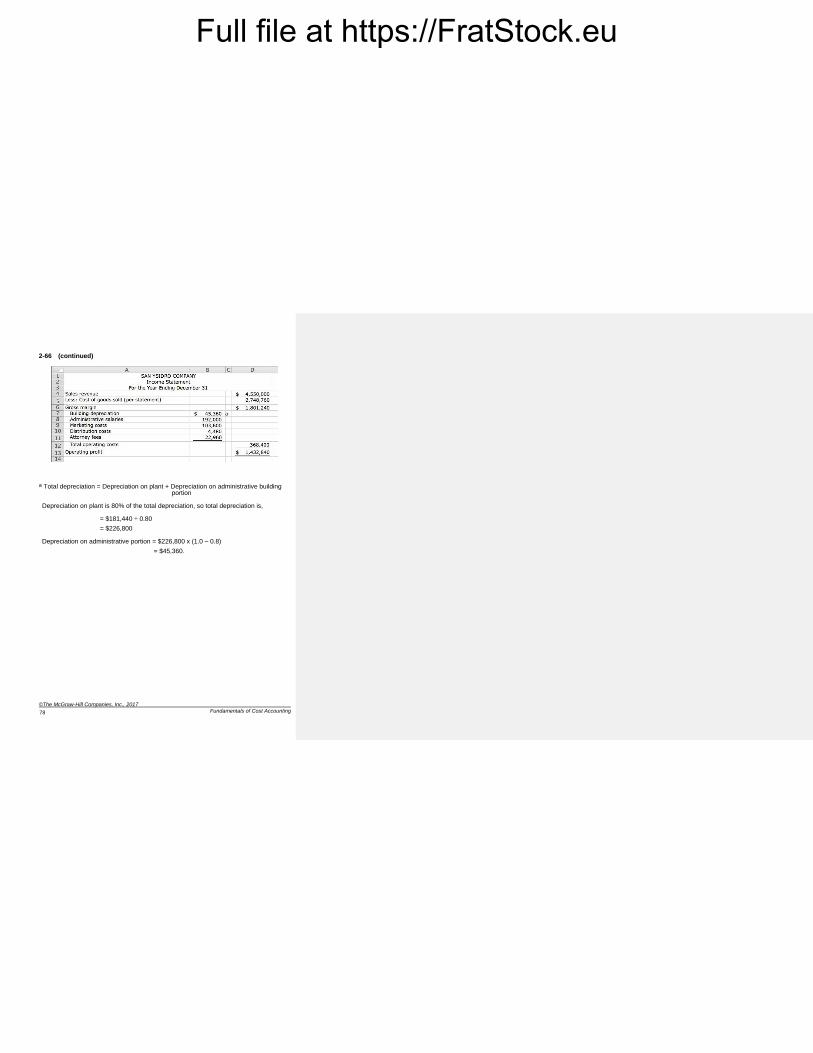
2-66 (continued)
a Total depreciation = Depreciation on plant + Depreciation on administrative building portion Depreciation on plant is 80% of the total depreciation, so total depreciation is, = $181,440 ÷ 0.80
= $226,800 Depreciation on administrative portion = $226,800 x (1.0 – 0.8)
= $45,360.
Full file at https://FratStock.eu
©The McGraw-Hill Companies, Inc., 2017
Solutions Manual, Chapter 2
79
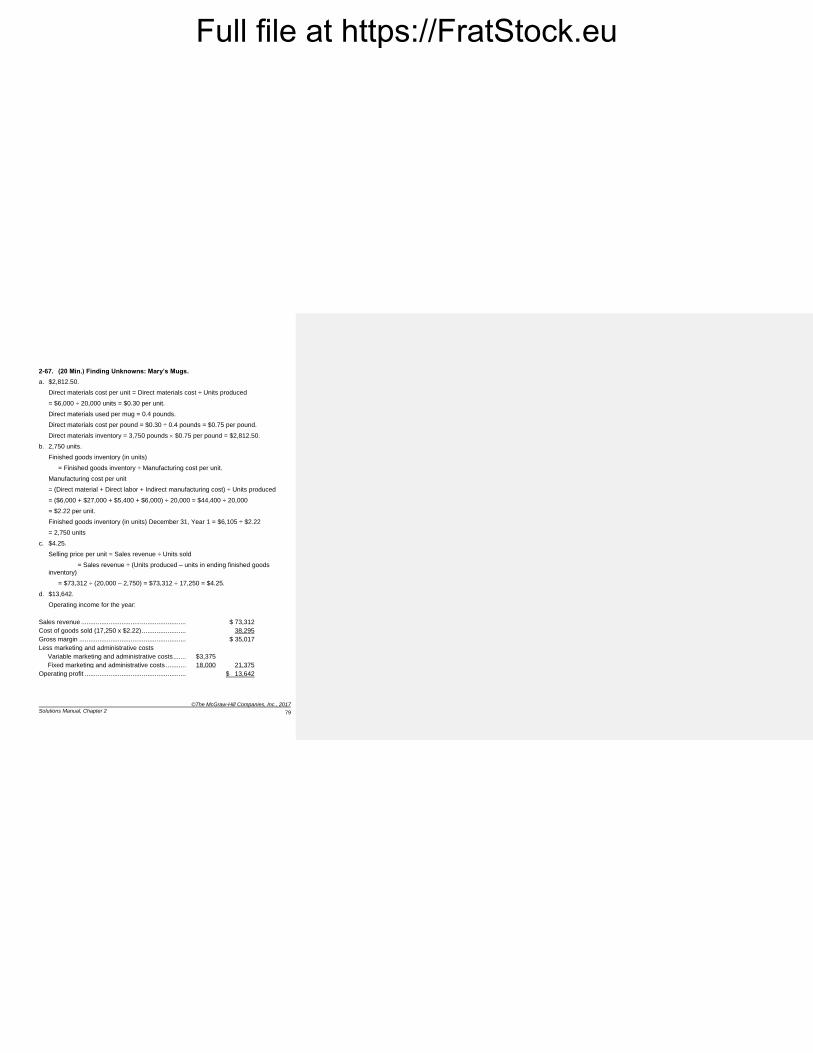
2-67. (20 Min.) Finding Unknowns: Mary’s Mugs.
a. $2,812.50.
Direct materials cost per unit = Direct materials cost ÷ Units produced
= $6,000 ÷ 20,000 units = $0.30 per unit.
Direct materials used per mug = 0.4 pounds.
Direct materials cost per pound = $0.30 ÷ 0.4 pounds = $0.75 per pound.
Direct materials inventory = 3,750 pounds $0.75 per pound = $2,812.50.
b. 2,750 units.
Finished goods inventory (in units)
= Finished goods inventory ÷ Manufacturing cost per unit.
Manufacturing cost per unit
= (Direct material + Direct labor + Indirect manufacturing cost) ÷ Units produced
= ($6,000 + $27,000 + $5,400 + $6,000) ÷ 20,000 = $44,400 ÷ 20,000
= $2.22 per unit.
Finished goods inventory (in units) December 31, Year 1 = $6,105 ÷ $2.22
= 2,750 units
c. $4.25.
Selling price per unit = Sales revenue ÷ Units sold
= Sales revenue ÷ (Units produced – units in ending finished goods inventory)
= $73,312 ÷ (20,000 – 2,750) = $73,312 ÷ 17,250 = $4.25.
d. $13,642.
Operating income for the year:
Sales revenue ......................................................... $ 73,312
Cost of goods sold (17,250 x $2.22) ........................ 38,295
Gross margin .......................................................... $ 35,017
Less marketing and administrative costs
Variable marketing and administrative costs ....... $3,375
Fixed marketing and administrative costs ........... 18,000 21,375
Operating profit ....................................................... $ 13,642
Full file at https://FratStock.eu
©The McGraw-Hill Companies, Inc., 2017
Fundamentals of Cost Accounting
80
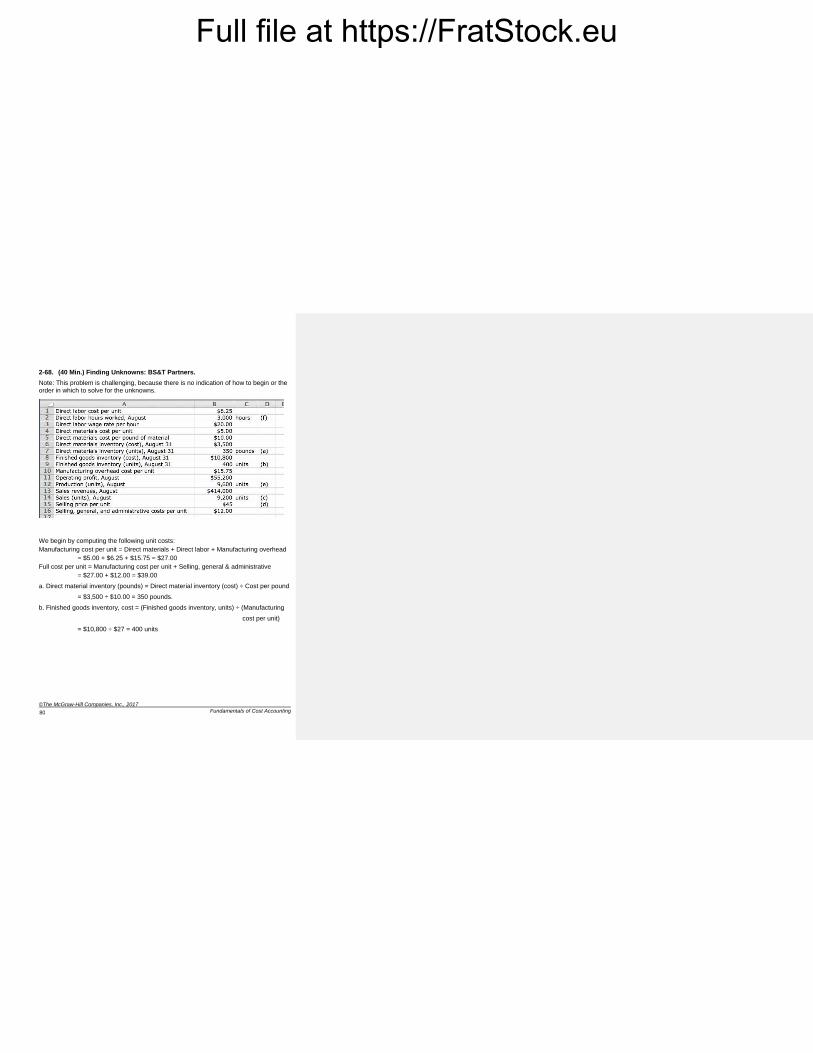
2-68. (40 Min.) Finding Unknowns: BS&T Partners.
Note: This problem is challenging, because there is no indication of how to begin or the
order in which to solve for the unknowns.
We begin by computing the following unit costs:
Manufacturing cost per unit = Direct materials + Direct labor + Manufacturing overhead
= $5.00 + $6.25 + $15.75 = $27.00
Full cost per unit = Manufacturing cost per unit + Selling, general & administrative
= $27.00 + $12.00 = $39.00
a. Direct material inventory (pounds) = Direct material inventory (cost) ÷ Cost per pound
= $3,500 ÷ $10.00 = 350 pounds.
b. Finished goods inventory, cost = (Finished goods inventory, units) ÷ (Manufacturing
cost per unit)
= $10,800 ÷ $27 = 400 units
Full file at https://FratStock.eu
©The McGraw-Hill Companies, Inc., 2017
Solutions Manual, Chapter 2
81
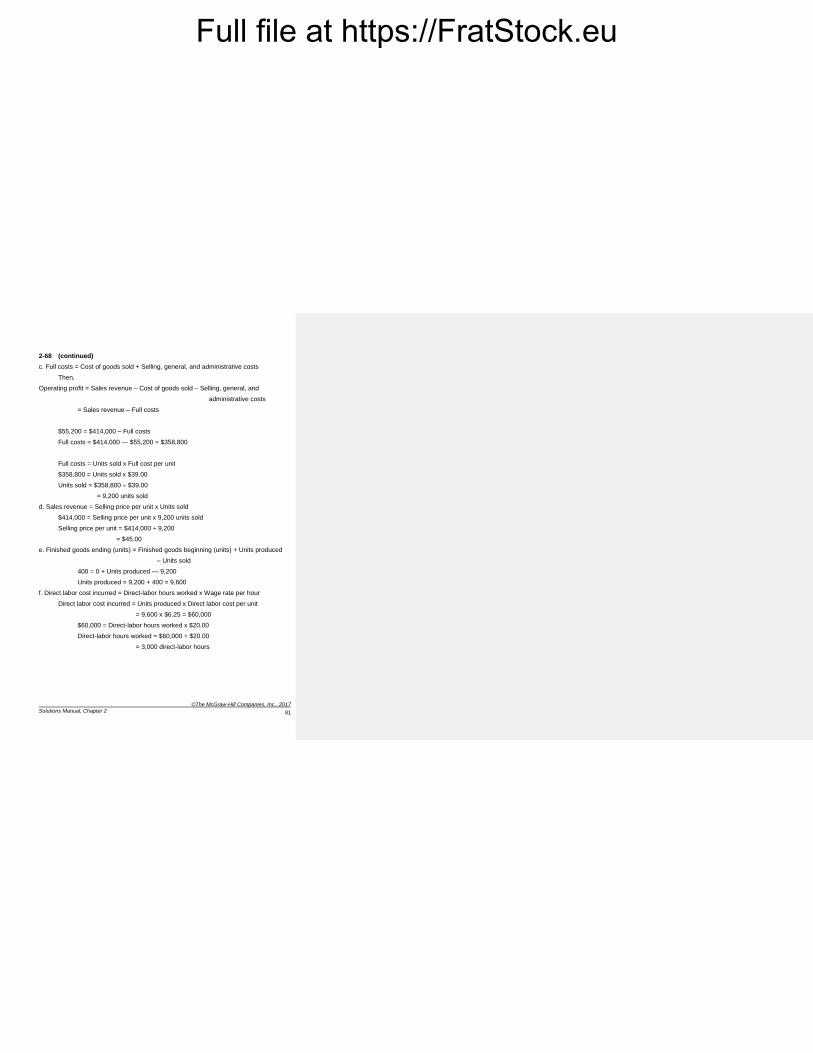
2-68 (continued)
c. Full costs = Cost of goods sold + Selling, general, and administrative costs
Then,
Operating profit = Sales revenue – Cost of goods sold – Selling, general, and
administrative costs
= Sales revenue – Full costs
$55,200 = $414,000 – Full costs
Full costs = $414,000 — $55,200 = $358,800
Full costs = Units sold x Full cost per unit
$358,800 = Units sold x $39.00
Units sold = $358,800 ÷ $39.00
= 9,200 units sold
d. Sales revenue = Selling price per unit x Units sold
$414,000 = Selling price per unit x 9,200 units sold
Selling price per unit = $414,000 ÷ 9,200
= $45.00
e. Finished goods ending (units) = Finished goods beginning (units) + Units produced
– Units sold
400 = 0 + Units produced — 9,200
Units produced = 9,200 + 400 = 9,600
f. Direct labor cost incurred = Direct-labor hours worked x Wage rate per hour
Direct labor cost incurred = Units produced x Direct labor cost per unit
= 9,600 x $6.25 = $60,000
$60,000 = Direct-labor hours worked x $20.00
Direct-labor hours worked = $60,000 ÷ $20.00
= 3,000 direct-labor hours
Full file at https://FratStock.eu
©The McGraw-Hill Companies, Inc., 2017
Fundamentals of Cost Accounting
82
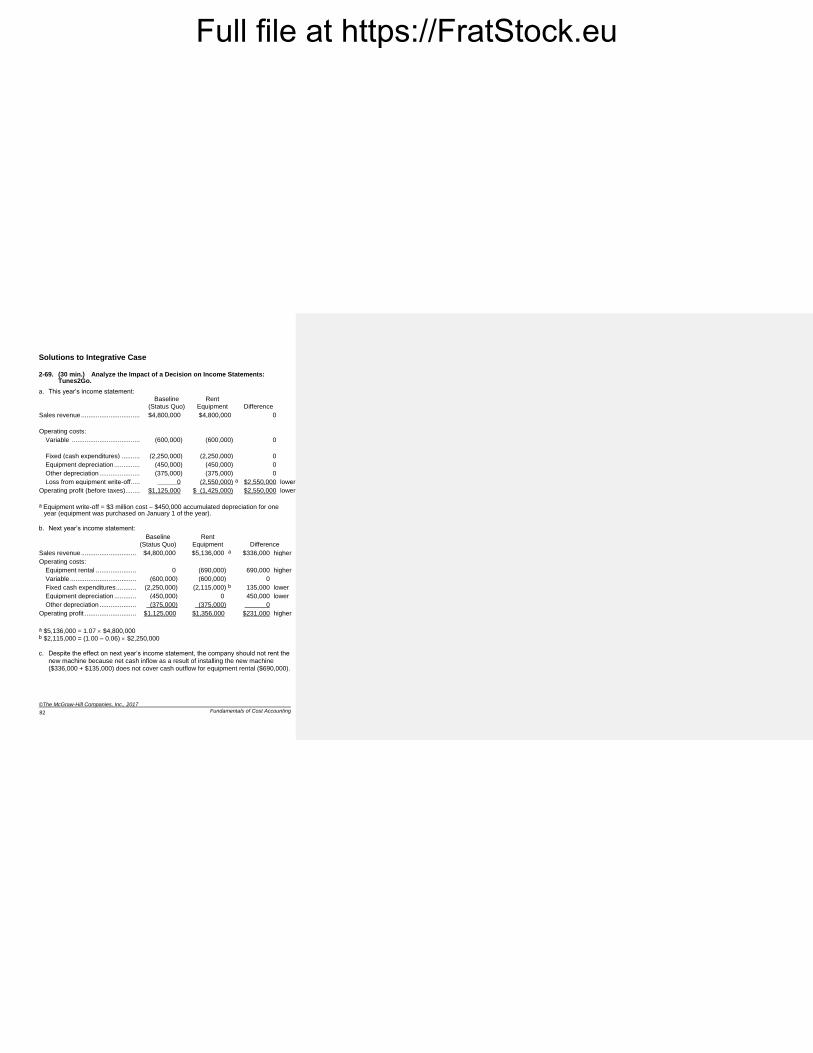
Solutions to Integrative Case
2-69. (30 min.) Analyze the Impact of a Decision on Income Statements: Tunes2Go.
a. This year’s income statement:
Baseline (Status Quo)
Rent Equipment
Difference
Sales revenue ................................
$4,800,000 $4,800,000 0
Operating costs:
Variable .....................................
(600,000) (600,000) 0
Fixed (cash expenditures) .......... (2,250,000) (2,250,000) 0
Equipment depreciation .............. (450,000) (450,000) 0
Other depreciation ...................... (375,000) (375,000) 0
Loss from equipment write-off ..... 0 (2,550,000) a $2,550,000 lower
Operating profit (before taxes)........ $1,125,000 $ (1,425,000) $2,550,000 lower
a Equipment write-off = $3 million cost – $450,000 accumulated depreciation for one year (equipment was purchased on January 1 of the year).
b. Next year’s income statement:
Baseline
(Status Quo)
Rent
Equipment
Difference
Sales revenue ................................ $4,800,000 $5,136,000 a $336,000 higher
Operating costs:
Equipment rental ........................ 0 (690,000) 690,000 higher
Variable ...................................... (600,000) (600,000) 0
Fixed cash expenditures ............. (2,250,000) (2,115,000) b 135,000 lower
Equipment depreciation .............. (450,000) 0 450,000 lower
Other depreciation ...................... (375,000) (375,000) 0
Operating profit .............................. $1,125,000 $1,356,000 $231,000 higher
a $5,136,000 = 1.07 $4,800,000 b $2,115,000 = (1.00 – 0.06) $2,250,000
c. Despite the effect on next year’s income statement, the company should not rent the
new machine because net cash inflow as a result of installing the new machine ($336,000 + $135,000) does not cover cash outflow for equipment rental ($690,000).
Full file at https://FratStock.eu
©The McGraw-Hill Companies, Inc., 2017
Solutions Manual, Chapter 2
83
Full file at https://FratStock.eu
© 2016 by McGraw-Hill Education. This is proprietary material solely for authorized instructor use. Not authorized for sale or
distribution in any manner. This document may not be copied, scanned, duplicated, forwarded, distributed, or posted on a
website, in whole or part. 2-1
Chapter 2
Cost Concepts and Behavior
Learning Objectives
1. Explain the basic concept of “cost.”
2. Explain how costs are presented in financial statements.
3. Explain the process of cost allocation.
4. Understand how material, labor, and overhead costs are added to a product at each stage of
the production process.
5. Define basic cost behaviors, including fixed, variable, semivariable, and step costs.
6. Identify the components of a product’s costs.
7. Understand the distinction between financial and contribution margin income statements.
Full file at https://FratStock.eu
© 2016 by McGraw-Hill Education. This is proprietary material solely for authorized instructor use. Not authorized for sale or
distribution in any manner. This document may not be copied, scanned, duplicated, forwarded, distributed, or posted on a
website, in whole or part. 2-2
Chapter Overview
I. WHAT IS A COST?
Cost versus Expenses
II. PRESENTATION OF COSTS IN FINANCIAL STATEMENTS
Service Organizations
Retail and Wholesale Companies
Manufacturing Companies
Direct and Indirect Manufacturing (Product) Costs
Prime Costs and Conversion Costs
Nonmanufacturing (Period) Costs
III. COST ALLOCATION
Direct versus Indirect Costs
IV. DETAILS OF MANUFACTURING COST FLOWS
V. HOW COSTS FLOW THROUGH THE STATEMENTS
Income Statements
Cost of Goods Manufactured and Sold Statement
VI. COST BEHAVIOR
Fixed Versus Variable Costs
VII. COMPONENTS OF PRODUCT COSTS
Unit Fixed Costs Can Be Misleading for Decision Making
VII. HOW TO MAKE COST INFORMATION MORE USEFUL FOR MANAGERS
Gross Margin versus Contribution Margin Income Statements
Developing Financial Statements for Decision Making
Full file at https://FratStock.eu
© 2016 by McGraw-Hill Education. This is proprietary material solely for authorized instructor use. Not authorized for sale or
distribution in any manner. This document may not be copied, scanned, duplicated, forwarded, distributed, or posted on a
website, in whole or part. 2-3
Chapter Outline
LO 2-1 Explain the basic concept of “cost.”
WHAT IS A COST?
Cost versus Expenses
o The cost accounting system records and maintains the use of economic resources by the
organization.
The financial statements prepared by the firm for external reporting use information
from the cost accounting system.
Cost accounting systems also provide information to help managers make better
decisions. Managers need to understand the common terms used in cost accounting.
Companies are interested in the costs of their products and services for many reasons.
See the Business Application box “Calculating the costs of E-Books versus Paper
Books.”
o Cost represents a sacrifice of resources (typically cash or a line of credit). The price of
each item purchased measures the sacrifice made to acquire it.
Expense is a cost charged against (i.e., deducted from) revenue in an accounting
period.
Cost initially recorded as an asset becomes an expense when the asset has been
consumed (e.g., the prepaid rent becomes rent expense after the office space has been
used for a period of time). Generally accepted accounting principles (GAAP) and
regulations such as tax laws govern when and how costs are to be treated as expenses.
Cost accounting focuses on costs; expenses are referred to only in the context of
external financial reporting (in this text).
o The two major categories of costs are:
Outlay cost: a past, present, or future cash outflow, such as tuition, books, and fees
paid for a college education, and
Opportunity cost: the forgone benefit that could have been realized from the best
forgone alternative course of a resource, such as the time and income sacrificed to get
a college education.
See Demonstration Problem 1
Full file at https://FratStock.eu
© 2016 by McGraw-Hill Education. This is proprietary material solely for authorized instructor use. Not authorized for sale or
distribution in any manner. This document may not be copied, scanned, duplicated, forwarded, distributed, or posted on a
website, in whole or part. 2-4
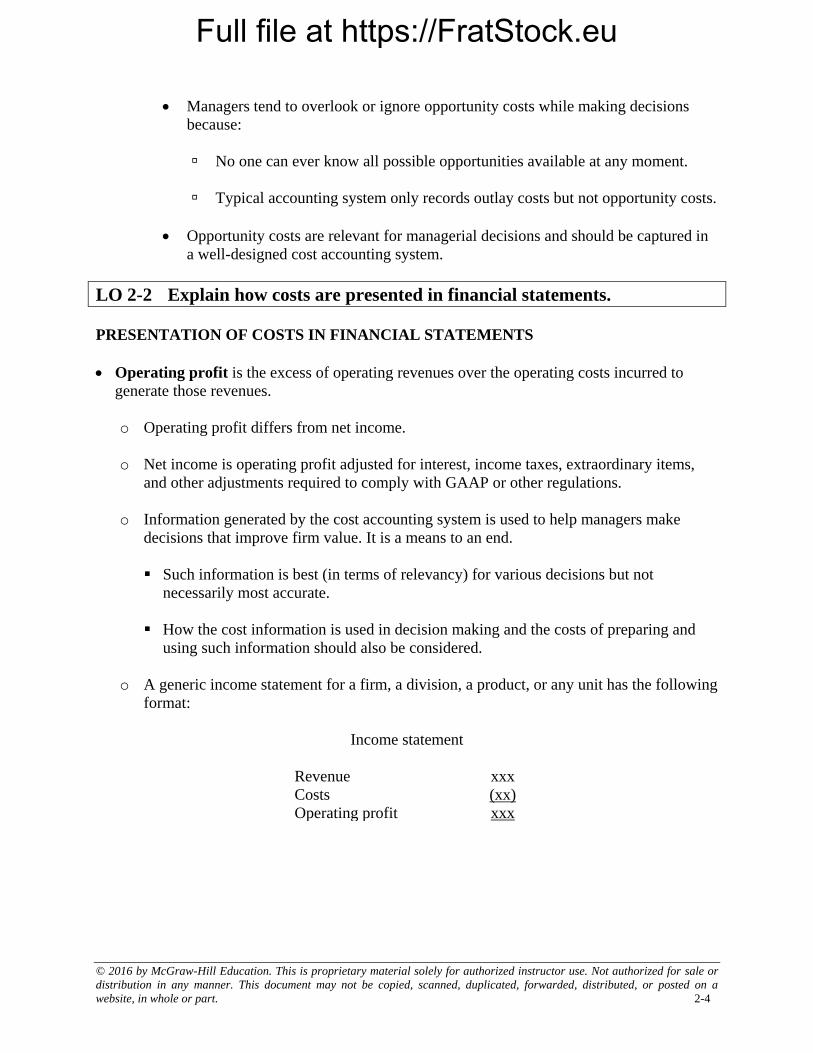
Managers tend to overlook or ignore opportunity costs while making decisions
because:
No one can ever know all possible opportunities available at any moment.
Typical accounting system only records outlay costs but not opportunity costs.
Opportunity costs are relevant for managerial decisions and should be captured in
a well-designed cost accounting system.
LO 2-2 Explain how costs are presented in financial statements.
PRESENTATION OF COSTS IN FINANCIAL STATEMENTS
Operating profit is the excess of operating revenues over the operating costs incurred to
generate those revenues.
o Operating profit differs from net income.
o Net income is operating profit adjusted for interest, income taxes, extraordinary items,
and other adjustments required to comply with GAAP or other regulations.
o Information generated by the cost accounting system is used to help managers make
decisions that improve firm value. It is a means to an end.
Such information is best (in terms of relevancy) for various decisions but not
necessarily most accurate.
How the cost information is used in decision making and the costs of preparing and
using such information should also be considered.
o A generic income statement for a firm, a division, a product, or any unit has the following
format:
Income statement
Revenue xxx
Costs (xx)
Operating profit xxx
Full file at https://FratStock.eu
© 2016 by McGraw-Hill Education. This is proprietary material solely for authorized instructor use. Not authorized for sale or
distribution in any manner. This document may not be copied, scanned, duplicated, forwarded, distributed, or posted on a
website, in whole or part. 2-5
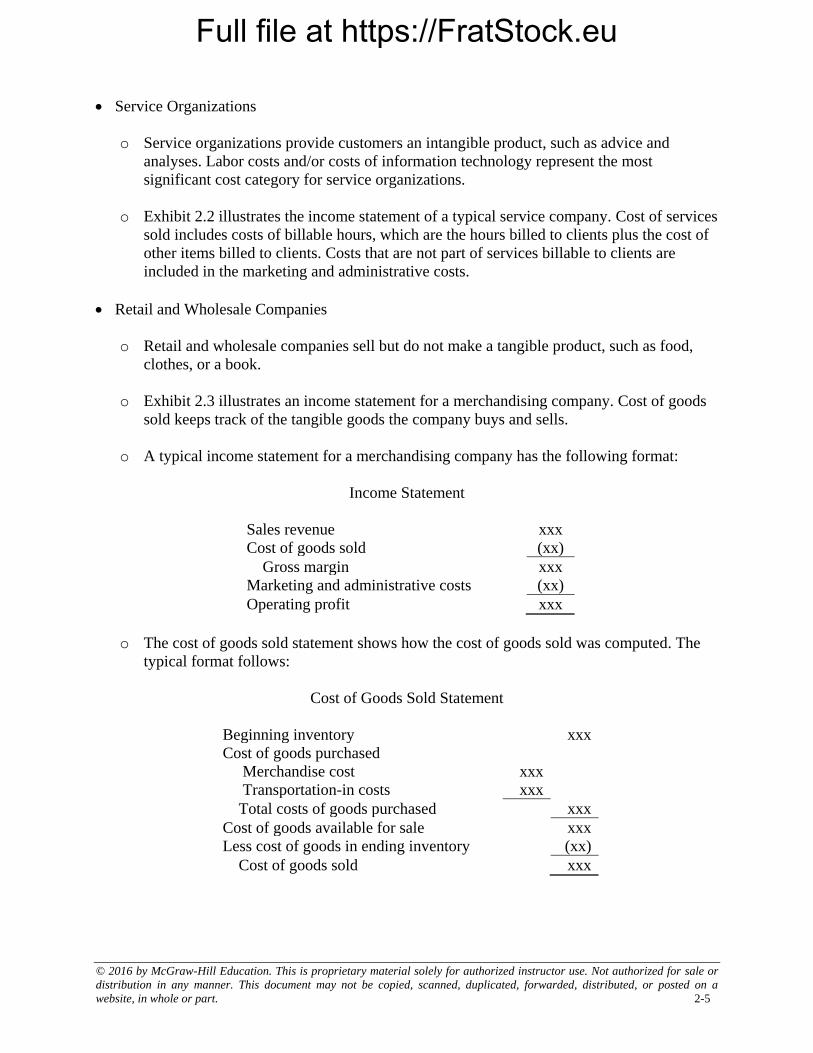
Service Organizations
o Service organizations provide customers an intangible product, such as advice and
analyses. Labor costs and/or costs of information technology represent the most
significant cost category for service organizations.
o Exhibit 2.2 illustrates the income statement of a typical service company. Cost of services
sold includes costs of billable hours, which are the hours billed to clients plus the cost of
other items billed to clients. Costs that are not part of services billable to clients are
included in the marketing and administrative costs.
Retail and Wholesale Companies
o Retail and wholesale companies sell but do not make a tangible product, such as food,
clothes, or a book.
o Exhibit 2.3 illustrates an income statement for a merchandising company. Cost of goods
sold keeps track of the tangible goods the company buys and sells.
o A typical income statement for a merchandising company has the following format:
Income Statement
Sales revenue xxx
Cost of goods sold (xx)
Gross margin xxx
Marketing and administrative costs (xx)
Operating profit xxx
o The cost of goods sold statement shows how the cost of goods sold was computed. The
typical format follows:
Cost of Goods Sold Statement
Beginning inventory xxx
Cost of goods purchased
Merchandise cost xxx
Transportation-in costs xxx
Total costs of goods purchased xxx
Cost of goods available for sale xxx
Less cost of goods in ending inventory (xx)
Cost of goods sold xxx
Full file at https://FratStock.eu
© 2016 by McGraw-Hill Education. This is proprietary material solely for authorized instructor use. Not authorized for sale or
distribution in any manner. This document may not be copied, scanned, duplicated, forwarded, distributed, or posted on a
website, in whole or part. 2-6
The gross margin reflects the amount available to cover marketing and administrative
costs and earn a profit.
Cost of goods sold includes only the actual costs of the goods that were sold. It does
not include the costs required to sell them, such as the salaries of salespeople, which
are marketing costs, or the salaries of top executives, which are administrative costs.
Manufacturing Companies
o Manufacturing companies make the goods for sale and need to know the different costs
associated with making them.
Direct and Indirect Manufacturing (Product) Costs
o Product costs are those costs assigned to units of production and recognized (i.e.,
expensed) when the product is sold. Product costs follow the product through inventory.
Direct manufacturing costs are product costs that can be identified with units (or
batches of units) at relatively low cost, including:
Direct materials are those that can be feasibly identified directly, at relatively low cost,
with the product. (For manufacturers, direct materials are purchased parts, including
transportation-in.) Direct materials are often called raw materials.
Direct labor represents labor costs that can be identified with the product at reasonable
cost. Direct labor of workers transforms the materials into a finished product.
Prime Costs and Conversion Costs
o Prime costs = Direct materials + Direct labor.
Companies with relatively low manufacturing overhead tend to focus on managing
prime costs.
Indirect manufacturing costs are all product costs other than direct
manufacturing costs, often referred to in total as manufacturing overhead.
Manufacturing overhead represents all other costs of transforming the materials
into a finished product, including:
Indirect labor (the cost of workers who do not work directly on the product, yet
are required so that the factory can operate, such as supervisors, maintenance
workers, inventory storekeepers, etc.)
Full file at https://FratStock.eu
© 2016 by McGraw-Hill Education. This is proprietary material solely for authorized instructor use. Not authorized for sale or
distribution in any manner. This document may not be copied, scanned, duplicated, forwarded, distributed, or posted on a
website, in whole or part. 2-7
Indirect materials (materials not a part of the finished product but are necessary
to manufacture it, such as lubricants, polishing and cleaning materials, etc.)
Other manufacturing costs (expenses incurred to keep the factory running, such
as depreciation of the factory building and equipment, taxes and insurance on
the factory assets, heat, light, power, etc.)
In practice, manufacturing overhead is also called factory burden, factory overhead,
burden, factory expense, or just overhead.
o Conversion costs = Direct labor + Manufacturing overhead.
Conversion costs are the costs that convert direct materials into the final product.
Companies with high direct labor and/or manufacturing overhead tend to emphasize
more about conversion costs.
Exhibit 2.4 summarizes the relationship between prime costs, conversion costs,
and the three elements of manufactured product costs: direct materials, direct labor,
and manufacturing overhead.
Nonmanufacturing (Period) Costs
o Period costs (nonmanufacturing costs are all other costs recognized for financial
reporting when incurred, including marketing and administrative costs.
Marketing costs are the costs required to obtain customer orders and provide
customers with finished products, including advertising, sales commissions, and
shipping costs.
Administrative costs are the costs required to manage the organization and provide
staff support, including executive and clerical salaries, costs for legal, financial, data
processing, accounting services, and building space for administrative personnel.
o For financial accounting purposes, nonmanufacturing costs are expensed in the period
incurred; for managerial purposes, however, these costs (especially advertising and
commissions) may be assigned to products.
The distinction between manufacturing and nonmanufacturing costs is not always clear-cut.
Companies usually set their own guidelines and follow them consistently.
o Service companies often have costs that are mostly indirect. Managing indirect costs is
extremely important in these firms if they are to remain profitable. (See Business
Application box “Indirect Costs in Banking.”)
o Most firms are made up of activities that combine features of all three types of activities
(service, retailing, and manufacturing).
Full file at https://FratStock.eu
© 2016 by McGraw-Hill Education. This is proprietary material solely for authorized instructor use. Not authorized for sale or
distribution in any manner. This document may not be copied, scanned, duplicated, forwarded, distributed, or posted on a
website, in whole or part. 2-8
o In many of the firms which are usually considered to be of manufacturing type, virtually
all employees are engaged in service-related activities. (See Business Application box “A
New Manufacturing Mantra.”)
LO 2-3 Explain the process of cost allocation.
COST ALLOCATION
Direct versus Indirect Costs
o Cost allocation is the process of assigning indirect costs to product, services, people,
business units, etc. Cost allocation is necessary when several departments share facilities
or services.
Cost object is any end to which a cost is assigned. Examples include a unit of product
or service, a department, or a customer.
Cost pool is the collection of costs to be assigned to the cost objects. Examples are
department costs, rental costs, or travel costs a consultant incurs to visit multiple
clients.
Cost allocation rule refers to the method or process used to assign costs in the cost
pool to the cost objects.
o Cost flow diagram is a diagram or flowchart illustrating the cost allocation process.
Fundamental approach to cost allocation:
Identify the cost objects
Determine the cost pools
Select a cost allocation rule
Cost flow diagrams help managers understand
How a cost system works
The likely effects on the reported costs of different cost objects from changes in
the cost allocation rule.
Exhibit 2.5 illustrates an example of cost flow diagram.
See Demonstration Problem 2
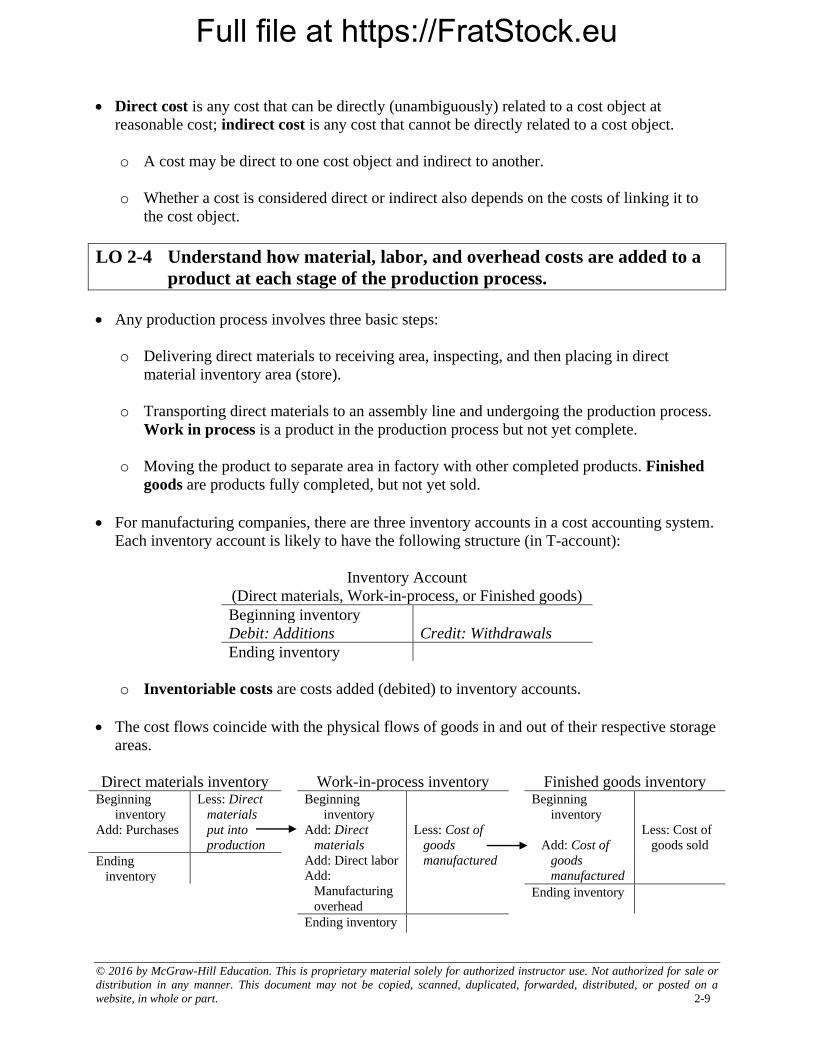
Full file at https://FratStock.eu
© 2016 by McGraw-Hill Education. This is proprietary material solely for authorized instructor use. Not authorized for sale or
distribution in any manner. This document may not be copied, scanned, duplicated, forwarded, distributed, or posted on a
website, in whole or part. 2-9
Direct cost is any cost that can be directly (unambiguously) related to a cost object at
reasonable cost; indirect cost is any cost that cannot be directly related to a cost object.
o A cost may be direct to one cost object and indirect to another.
o Whether a cost is considered direct or indirect also depends on the costs of linking it to
the cost object.
LO 2-4 Understand how material, labor, and overhead costs are added to a
product at each stage of the production process.
Any production process involves three basic steps:
o Delivering direct materials to receiving area, inspecting, and then placing in direct
material inventory area (store).
o Transporting direct materials to an assembly line and undergoing the production process.
Work in process is a product in the production process but not yet complete.
o Moving the product to separate area in factory with other completed products. Finished
goods are products fully completed, but not yet sold.
For manufacturing companies, there are three inventory accounts in a cost accounting system.
Each inventory account is likely to have the following structure (in T-account):
Inventory Account
(Direct materials, Work-in-process, or Finished goods)
Beginning inventory
Debit: Additions Credit: Withdrawals
Ending inventory
o Inventoriable costs are costs added (debited) to inventory accounts.
The cost flows coincide with the physical flows of goods in and out of their respective storage
areas.
Direct materials inventory Work-in-process inventory Finished goods inventory Beginning
inventory
Less: Direct
materials
put into
production
Beginning
inventory
Less: Cost of
goods
manufactured
Beginning
inventory
Less: Cost of
goods sold
Add: Purchases Add: Direct
materials
Add: Direct labor
Add:
Manufacturing
overhead
Add: Cost of
goods
manufactured Ending
inventory
Ending inventory
Ending inventory
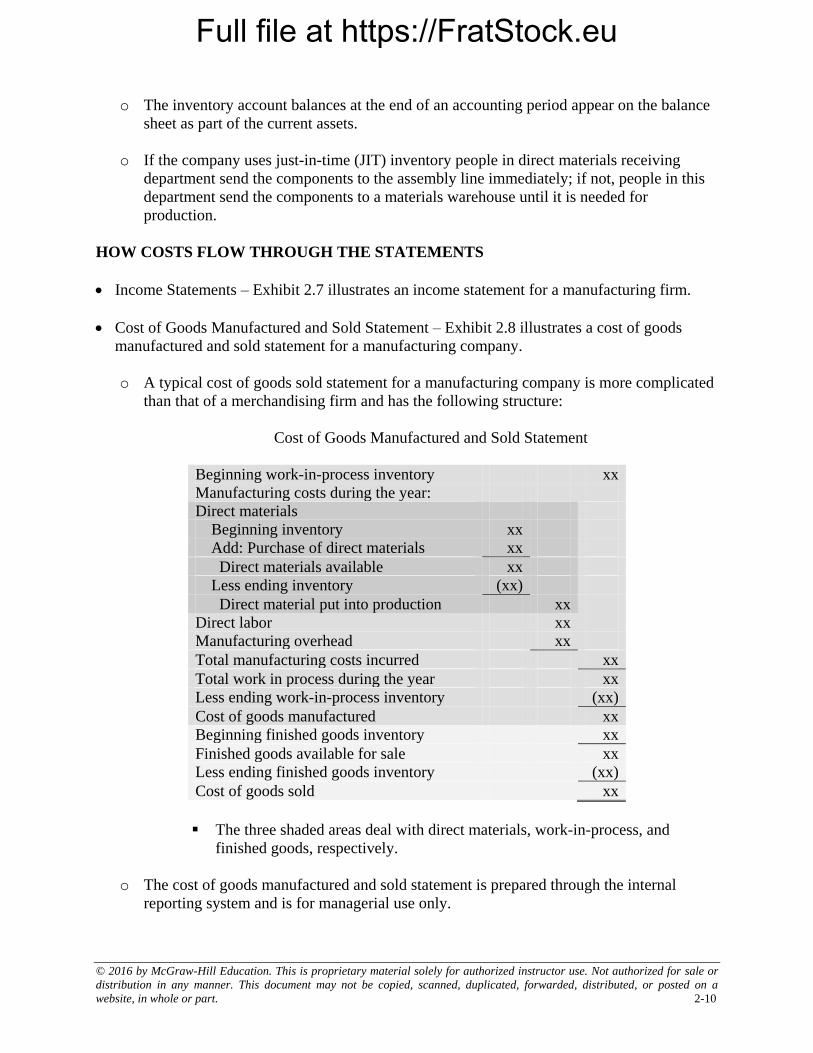
Full file at https://FratStock.eu
© 2016 by McGraw-Hill Education. This is proprietary material solely for authorized instructor use. Not authorized for sale or
distribution in any manner. This document may not be copied, scanned, duplicated, forwarded, distributed, or posted on a
website, in whole or part. 2-10
o The inventory account balances at the end of an accounting period appear on the balance
sheet as part of the current assets.
o If the company uses just-in-time (JIT) inventory people in direct materials receiving
department send the components to the assembly line immediately; if not, people in this
department send the components to a materials warehouse until it is needed for
production.
HOW COSTS FLOW THROUGH THE STATEMENTS
Income Statements – Exhibit 2.7 illustrates an income statement for a manufacturing firm.
Cost of Goods Manufactured and Sold Statement – Exhibit 2.8 illustrates a cost of goods
manufactured and sold statement for a manufacturing company.
o A typical cost of goods sold statement for a manufacturing company is more complicated
than that of a merchandising firm and has the following structure:
Cost of Goods Manufactured and Sold Statement
Beginning work-in-process inventory xx
Manufacturing costs during the year:
Direct materials
Beginning inventory xx
Add: Purchase of direct materials xx
Direct materials available xx
Less ending inventory (xx)
Direct material put into production xx
Direct labor xx
Manufacturing overhead xx
Total manufacturing costs incurred xx
Total work in process during the year xx
Less ending work-in-process inventory (xx)
Cost of goods manufactured xx
Beginning finished goods inventory xx
Finished goods available for sale xx
Less ending finished goods inventory (xx)
Cost of goods sold xx
The three shaded areas deal with direct materials, work-in-process, and
finished goods, respectively.
o The cost of goods manufactured and sold statement is prepared through the internal
reporting system and is for managerial use only.
Full file at https://FratStock.eu
© 2016 by McGraw-Hill Education. This is proprietary material solely for authorized instructor use. Not authorized for sale or
distribution in any manner. This document may not be copied, scanned, duplicated, forwarded, distributed, or posted on a
website, in whole or part. 2-11
o Total manufacturing costs incurred equals the sum of direct material put into production,
direct labor, and manufacturing overhead incurred during the period. Managers in
production and operations give careful attention to these costs.
o The total cost of work in process during the year (i.e., the sum of the beginning work-in-
process inventory and total manufacturing costs incurred) is a measure of the resources
that have gone into production.
o Cost of goods manufactured represents the cost of goods that were finished during the.
Production departments usually have a goal for goods completed each period. Managers
usually compare cost of goods manufactured to that goal to see whether the production
departments are successful in meeting it.
o Beginning finished goods inventory and cost of goods manufactured together determine
the cost of finished goods available for sale. The available finished goods either are sold
and become cost of goods sold, or are still on hand as part of the ending finished goods
inventory.
o The actual formats of financial statements vary a lot in practice. For managerial purposes,
it is important that the format be tailored to what users want.
See Demonstration Problem 3
LO 2-5 Define basic cost behaviors, including fixed, variable, semivariable,
and step costs.
COST BEHAVIOR
Fixed Versus Variable Costs
o Cost behavior deals with the way costs respond to changes in activity levels; a cost driver
is a factor that causes, or “drives,” costs.
Managers need to know how costs behave to make informed decisions about products,
to plan, and to evaluate performance.
Exhibit 2.9 illustrates the four cost behavior patterns to be discussed: fixed costs,
variable costs, semivariable costs, and step costs.
o Fixed costs are costs that are unchanged as volume changes within the relevant range of
activity. Examples: much of manufacturing overhead, many nonmanufacturing costs.
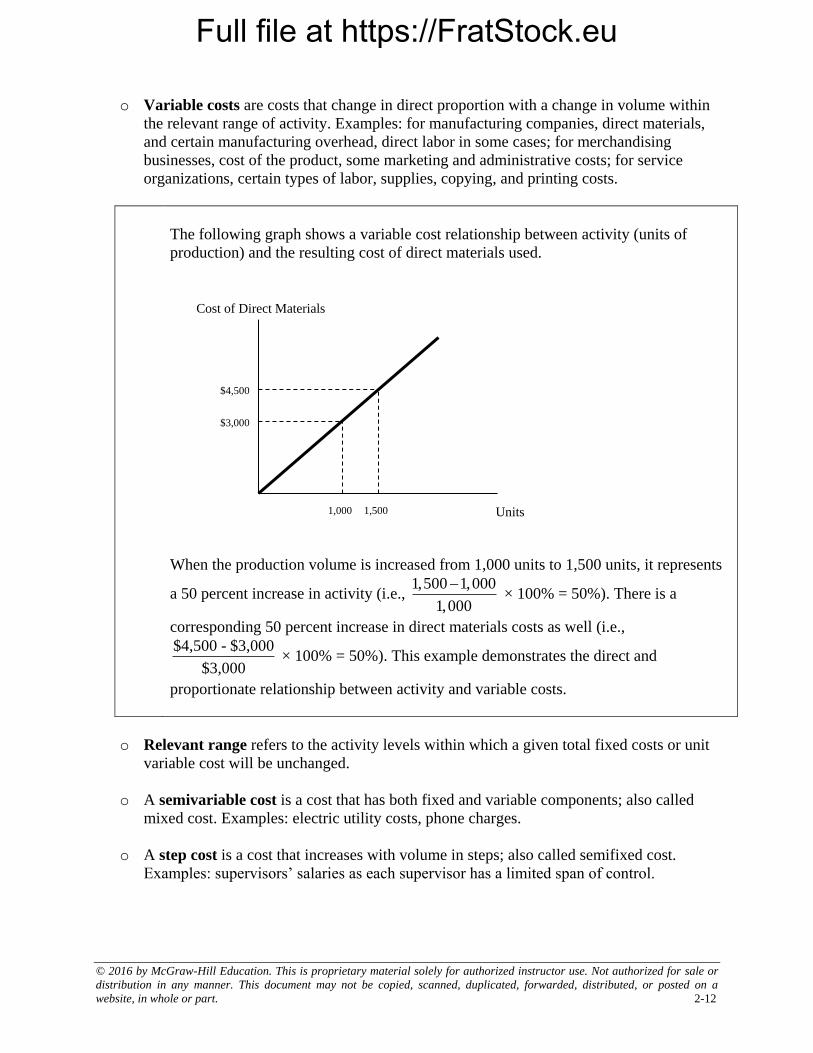
Full file at https://FratStock.eu
© 2016 by McGraw-Hill Education. This is proprietary material solely for authorized instructor use. Not authorized for sale or
distribution in any manner. This document may not be copied, scanned, duplicated, forwarded, distributed, or posted on a
website, in whole or part. 2-12
o Variable costs are costs that change in direct proportion with a change in volume within
the relevant range of activity. Examples: for manufacturing companies, direct materials,
and certain manufacturing overhead, direct labor in some cases; for merchandising
businesses, cost of the product, some marketing and administrative costs; for service
organizations, certain types of labor, supplies, copying, and printing costs.
The following graph shows a variable cost relationship between activity (units of
production) and the resulting cost of direct materials used.
When the production volume is increased from 1,000 units to 1,500 units, it represents
a 50 percent increase in activity (i.e., 1,500 1,000
1,000
× 100% = 50%). There is a
corresponding 50 percent increase in direct materials costs as well (i.e.,
$4,500 - $3,000
$3,000 × 100% = 50%). This example demonstrates the direct and
proportionate relationship between activity and variable costs.
o Relevant range refers to the activity levels within which a given total fixed costs or unit
variable cost will be unchanged.
o A semivariable cost is a cost that has both fixed and variable components; also called
mixed cost. Examples: electric utility costs, phone charges.
o A step cost is a cost that increases with volume in steps; also called semifixed cost.
Examples: supervisors’ salaries as each supervisor has a limited span of control.
Units
Cost of Direct Materials
1,000 1,500
$3,000
$4,500
Full file at https://FratStock.eu
© 2016 by McGraw-Hill Education. This is proprietary material solely for authorized instructor use. Not authorized for sale or
distribution in any manner. This document may not be copied, scanned, duplicated, forwarded, distributed, or posted on a
website, in whole or part. 2-13
o Four aspects of cost behavior complicate the task of classifying costs into fixed or
variable categories.
Not all costs are strictly fixed or variable.
Some costs increase with volume in “steps.”
The cost relations are valid only within a relevant range of activity.
The classification of costs as fixed or variable depends on the measure of activity used.
LO 2-6 Identify the components of a product’s costs.
COMPONENTS OF PRODUCT COSTS
Some cost concepts are determined by the rules of financial accounting. Some are more useful
for managerial decision making.
o Full cost is the sum of all fixed and variable costs of manufacturing and selling a unit of
product.
o Full absorption cost is the sum of all variable and fixed manufacturing costs. Full
absorption cost is used to compute a product’s inventory value under GAAP; as such, it
excludes nonmanufacturing costs.
o Exhibit 2.11 illustrates the product cost components for a company.
o On a per-unit basis:
Full absorption cost = Direct materials + Direct labor + Variable manufacturing
overhead + Fixed manufacturing overhead.
Full cost = Full absorption cost + Variable marketing and administrative costs + Fixed
marketing and administrative costs.
Variable manufacturing cost = Direct materials + Direct labor + Variable
manufacturing overhead.
Variable cost = Variable manufacturing cost + Variable marketing and administrative
cost.
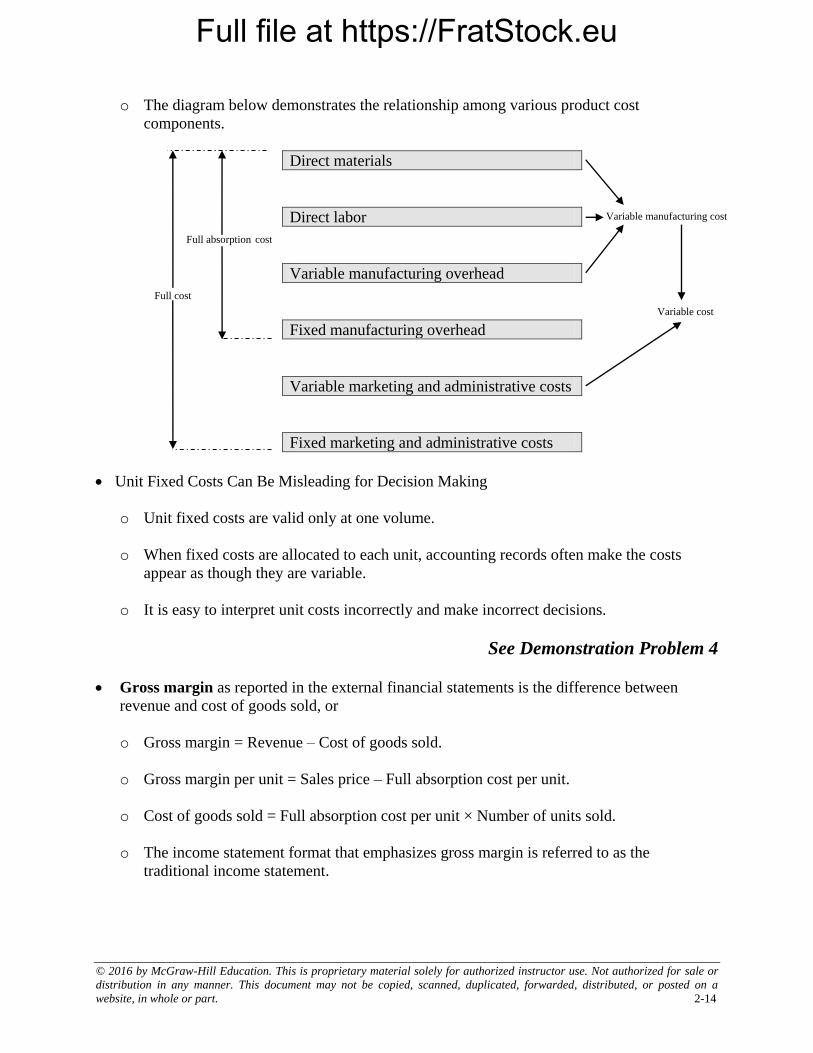
Full file at https://FratStock.eu
© 2016 by McGraw-Hill Education. This is proprietary material solely for authorized instructor use. Not authorized for sale or
distribution in any manner. This document may not be copied, scanned, duplicated, forwarded, distributed, or posted on a
website, in whole or part. 2-14
Full absorption cost
o The diagram below demonstrates the relationship among various product cost
components.
Direct materials
Direct labor
Variable manufacturing overhead
Fixed manufacturing overhead
Variable marketing and administrative costs
Fixed marketing and administrative costs
Unit Fixed Costs Can Be Misleading for Decision Making
o Unit fixed costs are valid only at one volume.
o When fixed costs are allocated to each unit, accounting records often make the costs
appear as though they are variable.
o It is easy to interpret unit costs incorrectly and make incorrect decisions.
See Demonstration Problem 4
Gross margin as reported in the external financial statements is the difference between
revenue and cost of goods sold, or
o Gross margin = Revenue – Cost of goods sold.
o Gross margin per unit = Sales price – Full absorption cost per unit.
o Cost of goods sold = Full absorption cost per unit × Number of units sold.
o The income statement format that emphasizes gross margin is referred to as the
traditional income statement.
Full cost
Variable manufacturing cost
Variable cost
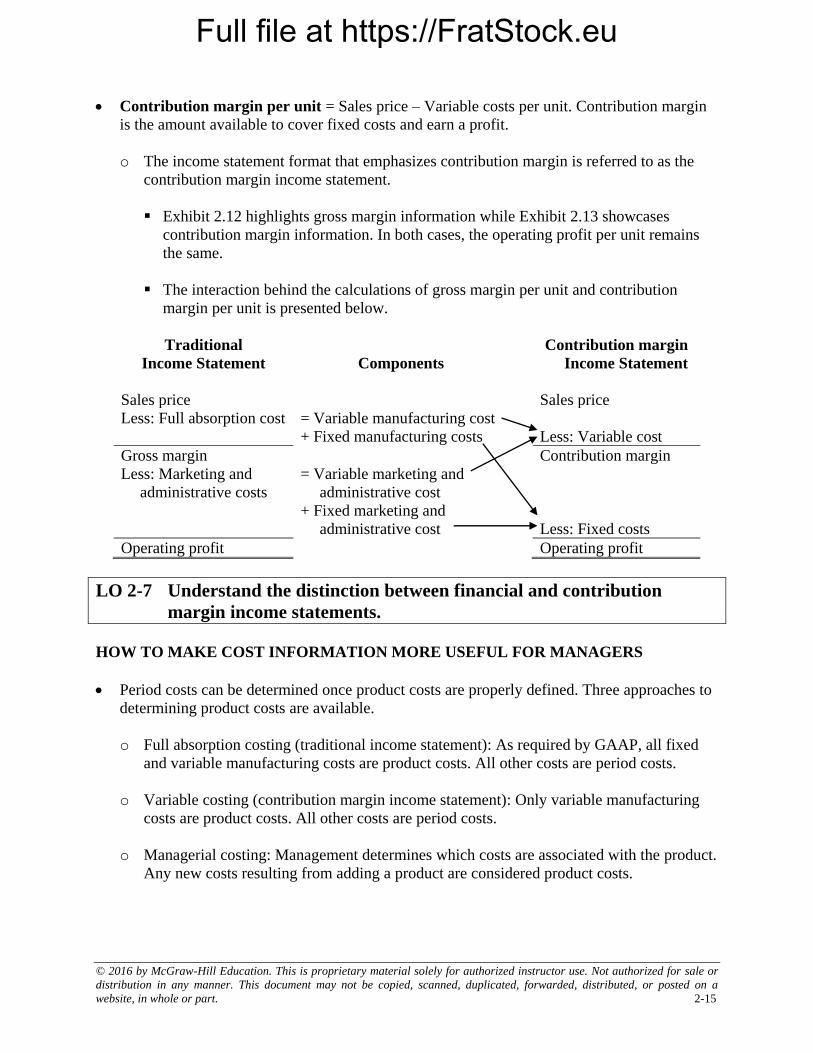
Full file at https://FratStock.eu
© 2016 by McGraw-Hill Education. This is proprietary material solely for authorized instructor use. Not authorized for sale or
distribution in any manner. This document may not be copied, scanned, duplicated, forwarded, distributed, or posted on a
website, in whole or part. 2-15
Contribution margin per unit = Sales price – Variable costs per unit. Contribution margin
is the amount available to cover fixed costs and earn a profit.
o The income statement format that emphasizes contribution margin is referred to as the
contribution margin income statement.
Exhibit 2.12 highlights gross margin information while Exhibit 2.13 showcases
contribution margin information. In both cases, the operating profit per unit remains
the same.
The interaction behind the calculations of gross margin per unit and contribution
margin per unit is presented below.
Traditional
Income Statement
Components
Contribution margin
Income Statement
Sales price Sales price
Less: Full absorption cost = Variable manufacturing cost
+ Fixed manufacturing costs
Less: Variable cost
Gross margin Contribution margin
Less: Marketing and
administrative costs
= Variable marketing and
administrative cost
+ Fixed marketing and
administrative cost
Less: Fixed costs
Operating profit Operating profit
LO 2-7 Understand the distinction between financial and contribution
margin income statements.
HOW TO MAKE COST INFORMATION MORE USEFUL FOR MANAGERS
Period costs can be determined once product costs are properly defined. Three approaches to
determining product costs are available.
o Full absorption costing (traditional income statement): As required by GAAP, all fixed
and variable manufacturing costs are product costs. All other costs are period costs.
o Variable costing (contribution margin income statement): Only variable manufacturing
costs are product costs. All other costs are period costs.
o Managerial costing: Management determines which costs are associated with the product.
Any new costs resulting from adding a product are considered product costs.
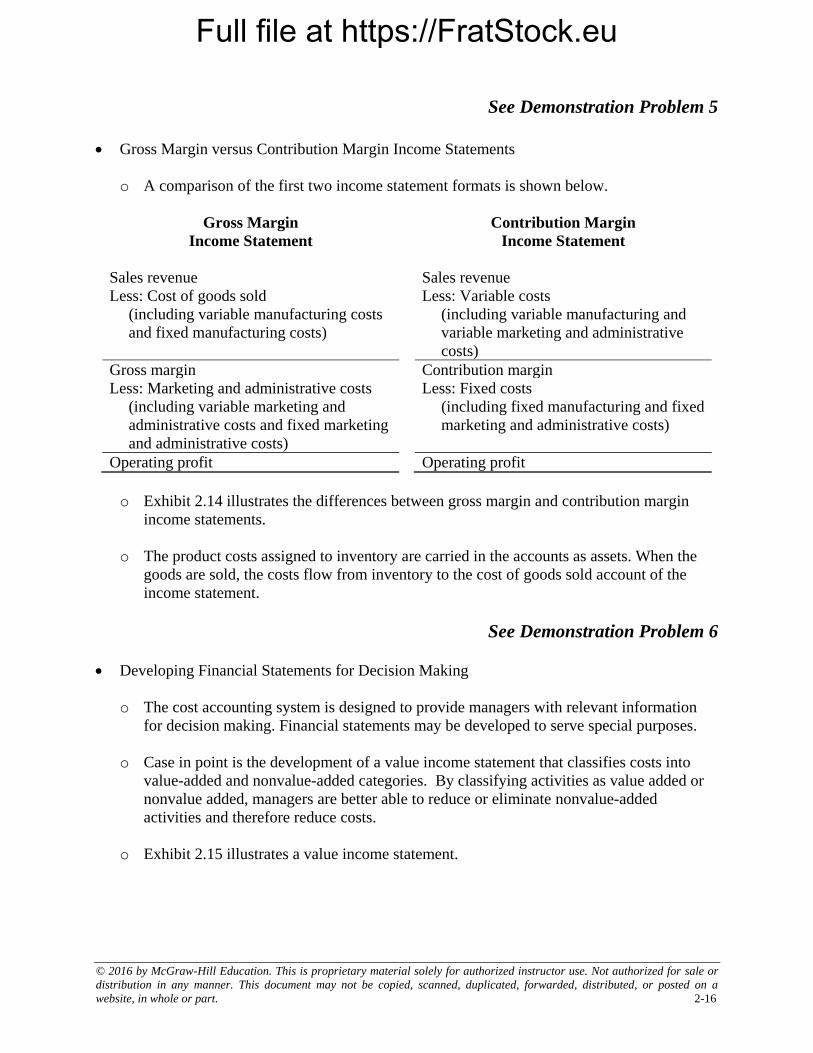
Full file at https://FratStock.eu
© 2016 by McGraw-Hill Education. This is proprietary material solely for authorized instructor use. Not authorized for sale or
distribution in any manner. This document may not be copied, scanned, duplicated, forwarded, distributed, or posted on a
website, in whole or part. 2-16
See Demonstration Problem 5
Gross Margin versus Contribution Margin Income Statements
o A comparison of the first two income statement formats is shown below.
Gross Margin
Income Statement
Contribution Margin
Income Statement
Sales revenue Sales revenue
Less: Cost of goods sold
(including variable manufacturing costs
and fixed manufacturing costs)
Less: Variable costs
(including variable manufacturing and
variable marketing and administrative
costs)
Gross margin Contribution margin
Less: Marketing and administrative costs
(including variable marketing and
administrative costs and fixed marketing
and administrative costs)
Less: Fixed costs
(including fixed manufacturing and fixed
marketing and administrative costs)
Operating profit Operating profit
o Exhibit 2.14 illustrates the differences between gross margin and contribution margin
income statements.
o The product costs assigned to inventory are carried in the accounts as assets. When the
goods are sold, the costs flow from inventory to the cost of goods sold account of the
income statement.
See Demonstration Problem 6
Developing Financial Statements for Decision Making
o The cost accounting system is designed to provide managers with relevant information
for decision making. Financial statements may be developed to serve special purposes.
o Case in point is the development of a value income statement that classifies costs into
value-added and nonvalue-added categories. By classifying activities as value added or
nonvalue added, managers are better able to reduce or eliminate nonvalue-added
activities and therefore reduce costs.
o Exhibit 2.15 illustrates a value income statement.
Full file at https://FratStock.eu
© 2016 by McGraw-Hill Education. This is proprietary material solely for authorized instructor use. Not authorized for sale or
distribution in any manner. This document may not be copied, scanned, duplicated, forwarded, distributed, or posted on a
website, in whole or part. 2-17
o Depending on the business and strategic environment of the firm, it is possible to
construct financial statements around activities related to quality, environmental
compliance, or new product development.
SUMMARY
Exhibit 2.16 provides a summary of cost terms and definitions.
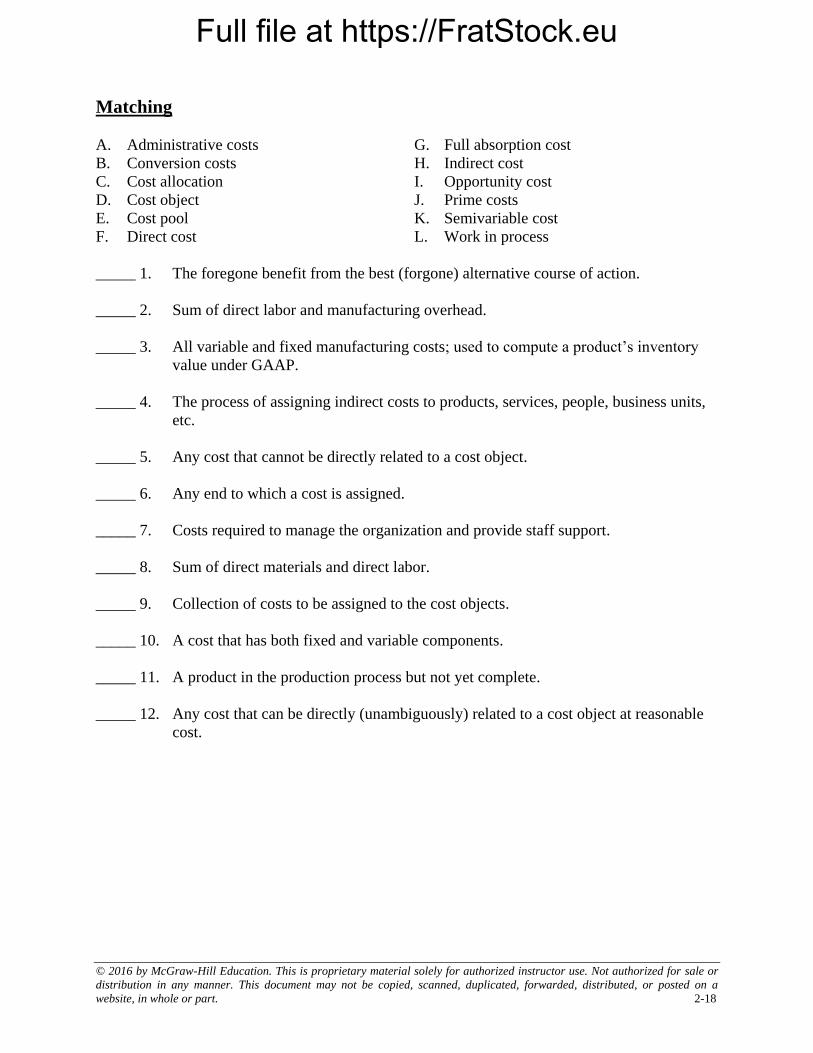
Full file at https://FratStock.eu
© 2016 by McGraw-Hill Education. This is proprietary material solely for authorized instructor use. Not authorized for sale or
distribution in any manner. This document may not be copied, scanned, duplicated, forwarded, distributed, or posted on a
website, in whole or part. 2-18
Matching
A. Administrative costs G. Full absorption cost
B. Conversion costs H. Indirect cost
C. Cost allocation I. Opportunity cost
D. Cost object J. Prime costs
E. Cost pool K. Semivariable cost
F. Direct cost L. Work in process
_____ 1. The foregone benefit from the best (forgone) alternative course of action.
_____ 2. Sum of direct labor and manufacturing overhead.
_____ 3. All variable and fixed manufacturing costs; used to compute a product’s inventory
value under GAAP.
_____ 4. The process of assigning indirect costs to products, services, people, business units,
etc.
_____ 5. Any cost that cannot be directly related to a cost object.
_____ 6. Any end to which a cost is assigned.
_____ 7. Costs required to manage the organization and provide staff support.
_____ 8. Sum of direct materials and direct labor.
_____ 9. Collection of costs to be assigned to the cost objects.
_____ 10. A cost that has both fixed and variable components.
_____ 11. A product in the production process but not yet complete.
_____ 12. Any cost that can be directly (unambiguously) related to a cost object at reasonable
cost.
Full file at https://FratStock.eu
© 2016 by McGraw-Hill Education. This is proprietary material solely for authorized instructor use. Not authorized for sale or
distribution in any manner. This document may not be copied, scanned, duplicated, forwarded, distributed, or posted on a
website, in whole or part. 2-19
Matching Answers
1. I
2. B
3. G
4. C
5. H
6. D
7. A
8. J
9. E
10. K
11. L
12. F
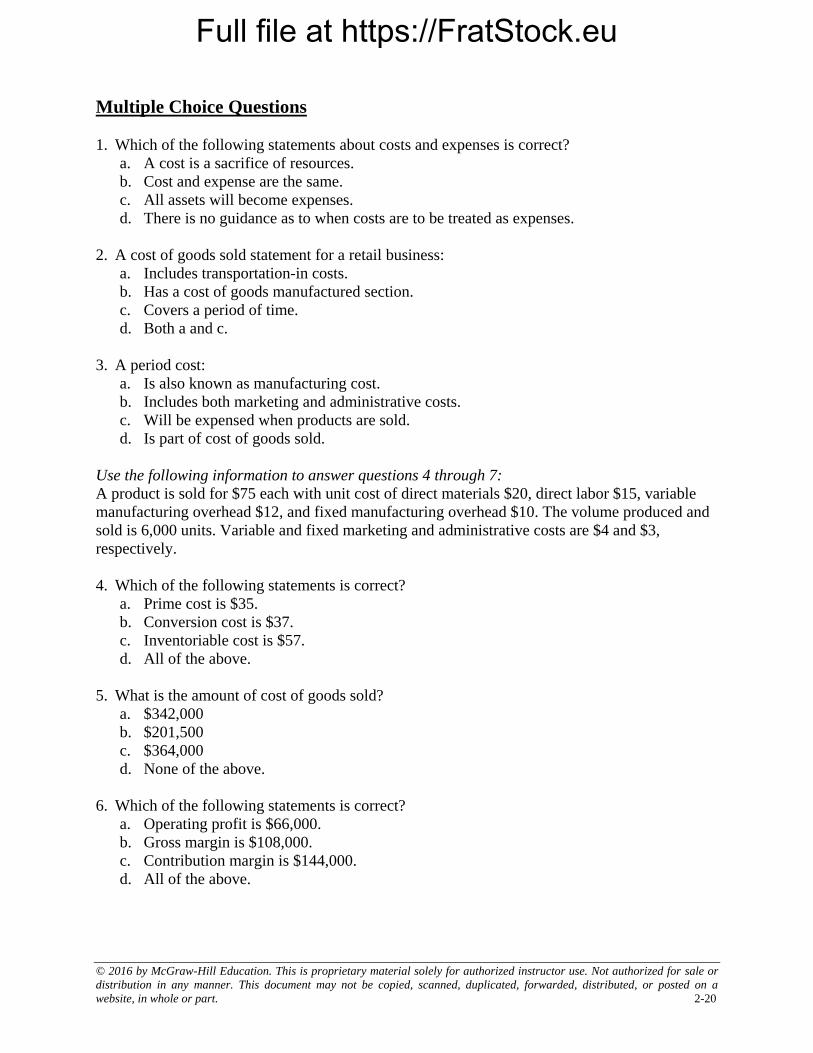
Full file at https://FratStock.eu
© 2016 by McGraw-Hill Education. This is proprietary material solely for authorized instructor use. Not authorized for sale or
distribution in any manner. This document may not be copied, scanned, duplicated, forwarded, distributed, or posted on a
website, in whole or part. 2-20
Multiple Choice Questions
1. Which of the following statements about costs and expenses is correct?
a. A cost is a sacrifice of resources.
b. Cost and expense are the same.
c. All assets will become expenses.
d. There is no guidance as to when costs are to be treated as expenses.
2. A cost of goods sold statement for a retail business:
a. Includes transportation-in costs.
b. Has a cost of goods manufactured section.
c. Covers a period of time.
d. Both a and c.
3. A period cost:
a. Is also known as manufacturing cost.
b. Includes both marketing and administrative costs.
c. Will be expensed when products are sold.
d. Is part of cost of goods sold.
Use the following information to answer questions 4 through 7:
A product is sold for $75 each with unit cost of direct materials $20, direct labor $15, variable
manufacturing overhead $12, and fixed manufacturing overhead $10. The volume produced and
sold is 6,000 units. Variable and fixed marketing and administrative costs are $4 and $3,
respectively.
4. Which of the following statements is correct?
a. Prime cost is $35.
b. Conversion cost is $37.
c. Inventoriable cost is $57.
d. All of the above.
5. What is the amount of cost of goods sold?
a. $342,000
b. $201,500
c. $364,000
d. None of the above.
6. Which of the following statements is correct?
a. Operating profit is $66,000.
b. Gross margin is $108,000.
c. Contribution margin is $144,000.
d. All of the above.
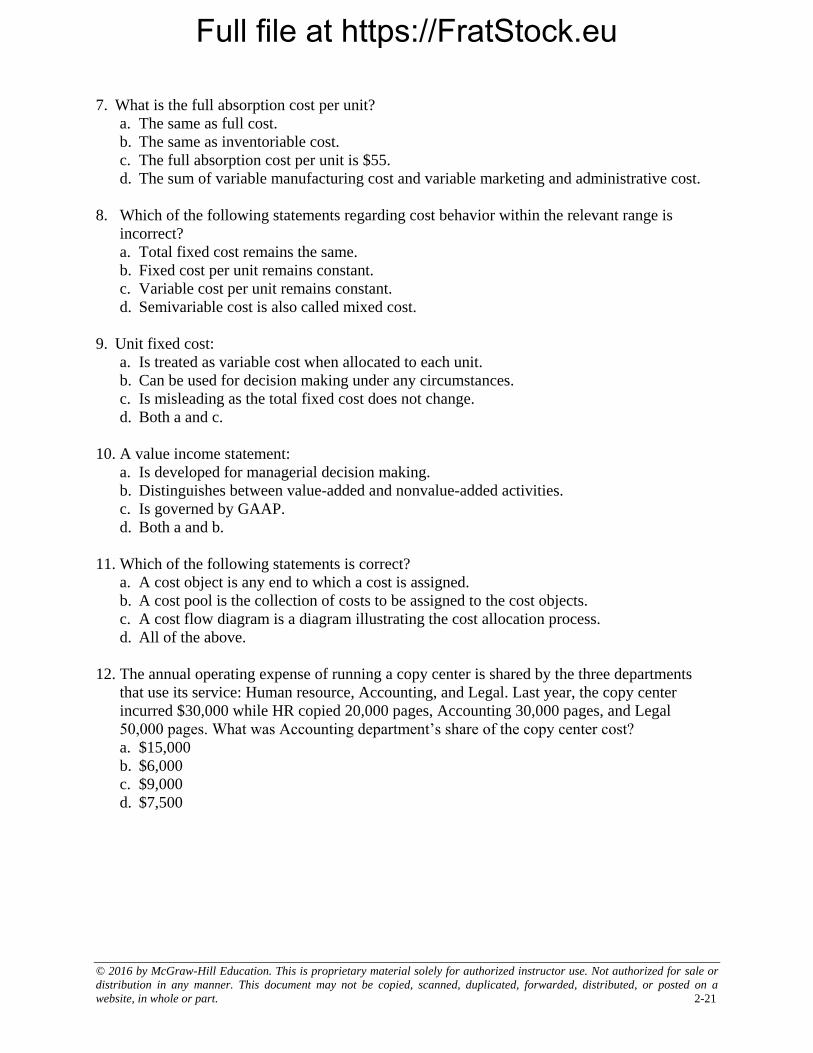
Full file at https://FratStock.eu
© 2016 by McGraw-Hill Education. This is proprietary material solely for authorized instructor use. Not authorized for sale or
distribution in any manner. This document may not be copied, scanned, duplicated, forwarded, distributed, or posted on a
website, in whole or part. 2-21
7. What is the full absorption cost per unit?
a. The same as full cost.
b. The same as inventoriable cost.
c. The full absorption cost per unit is $55.
d. The sum of variable manufacturing cost and variable marketing and administrative cost.
8. Which of the following statements regarding cost behavior within the relevant range is
incorrect?
a. Total fixed cost remains the same.
b. Fixed cost per unit remains constant.
c. Variable cost per unit remains constant.
d. Semivariable cost is also called mixed cost.
9. Unit fixed cost:
a. Is treated as variable cost when allocated to each unit.
b. Can be used for decision making under any circumstances.
c. Is misleading as the total fixed cost does not change.
d. Both a and c.
10. A value income statement:
a. Is developed for managerial decision making.
b. Distinguishes between value-added and nonvalue-added activities.
c. Is governed by GAAP.
d. Both a and b.
11. Which of the following statements is correct?
a. A cost object is any end to which a cost is assigned.
b. A cost pool is the collection of costs to be assigned to the cost objects.
c. A cost flow diagram is a diagram illustrating the cost allocation process.
d. All of the above.
12. The annual operating expense of running a copy center is shared by the three departments
that use its service: Human resource, Accounting, and Legal. Last year, the copy center
incurred $30,000 while HR copied 20,000 pages, Accounting 30,000 pages, and Legal
50,000 pages. What was Accounting department’s share of the copy center cost?
a. $15,000
b. $6,000
c. $9,000
d. $7,500
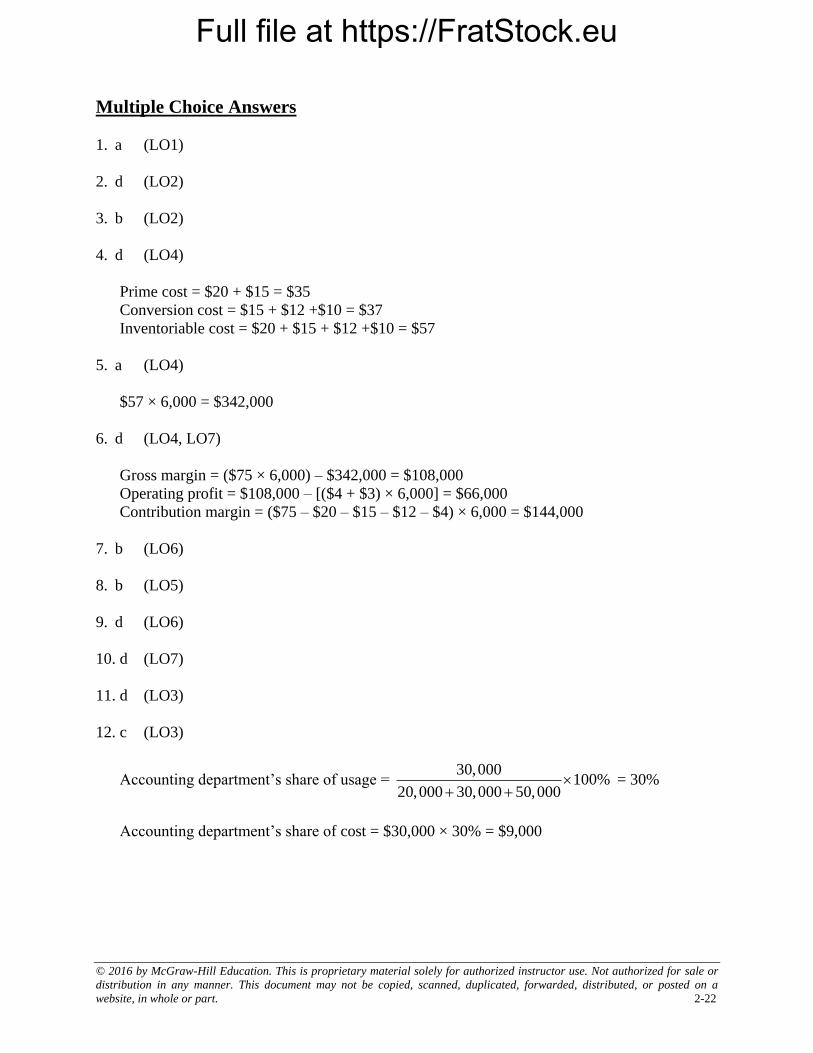
Full file at https://FratStock.eu
© 2016 by McGraw-Hill Education. This is proprietary material solely for authorized instructor use. Not authorized for sale or
distribution in any manner. This document may not be copied, scanned, duplicated, forwarded, distributed, or posted on a
website, in whole or part. 2-22
Multiple Choice Answers
1. a (LO1)
2. d (LO2)
3. b (LO2)
4. d (LO4)
Prime cost = $20 + $15 = $35
Conversion cost = $15 + $12 +$10 = $37
Inventoriable cost = $20 + $15 + $12 +$10 = $57
5. a (LO4)
$57 × 6,000 = $342,000
6. d (LO4, LO7)
Gross margin = ($75 × 6,000) – $342,000 = $108,000
Operating profit = $108,000 – [($4 + $3) × 6,000] = $66,000
Contribution margin = ($75 – $20 – $15 – $12 – $4) × 6,000 = $144,000
7. b (LO6)
8. b (LO5)
9. d (LO6)
10. d (LO7)
11. d (LO3)
12. c (LO3)
Accounting department’s share of usage = 30,000
100%20,000 30,000 50,000
= 30%
Accounting department’s share of cost = $30,000 × 30% = $9,000
Full file at https://FratStock.eu
© 2016 by McGraw-Hill Education. This is proprietary material solely for authorized instructor use. Not authorized for sale or
distribution in any manner. This document may not be copied, scanned, duplicated, forwarded, distributed, or posted on a
website, in whole or part. 2-23
Demonstration Problem 1
A developer plans to buy a parcel of land and construct an office building on top of it. He
narrows his search to two possible lots in adjacent states with convenient access to highways.
The expected returns from Lots C and D are $190,000 and $210,000, respectively.
Required:
What is the opportunity cost of funds the developer uses to purchase Lot D?
Full file at https://FratStock.eu
© 2016 by McGraw-Hill Education. This is proprietary material solely for authorized instructor use. Not authorized for sale or
distribution in any manner. This document may not be copied, scanned, duplicated, forwarded, distributed, or posted on a
website, in whole or part. 2-24
Demonstration Problem 1 – Solution
The opportunity cost of funds the developer uses to purchase Lot D is the forgone return the
developer could have earned from purchasing Lot C, assuming that both investments are equal in
risk and liquidity
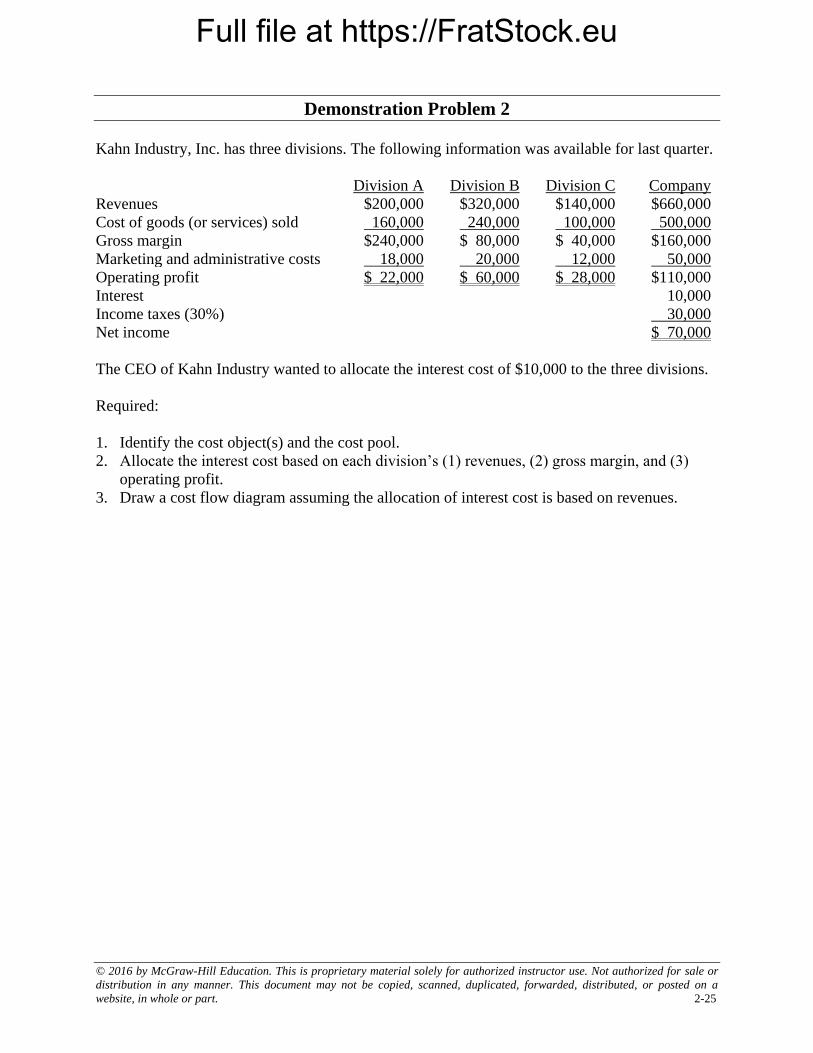
Full file at https://FratStock.eu
© 2016 by McGraw-Hill Education. This is proprietary material solely for authorized instructor use. Not authorized for sale or
distribution in any manner. This document may not be copied, scanned, duplicated, forwarded, distributed, or posted on a
website, in whole or part. 2-25
Demonstration Problem 2
Kahn Industry, Inc. has three divisions. The following information was available for last quarter.
Division A Division B Division C Company
Revenues $200,000 $320,000 $140,000 $660,000
Cost of goods (or services) sold 160,000 240,000 100,000 500,000
Gross margin $240,000 $ 80,000 $ 40,000 $160,000
Marketing and administrative costs 18,000 20,000 12,000 50,000
Operating profit $ 22,000 $ 60,000 $ 28,000 $110,000
Interest 10,000
Income taxes (30%) 30,000
Net income $ 70,000
The CEO of Kahn Industry wanted to allocate the interest cost of $10,000 to the three divisions.
Required:
1. Identify the cost object(s) and the cost pool.
2. Allocate the interest cost based on each division’s (1) revenues, (2) gross margin, and (3)
operating profit.
3. Draw a cost flow diagram assuming the allocation of interest cost is based on revenues.
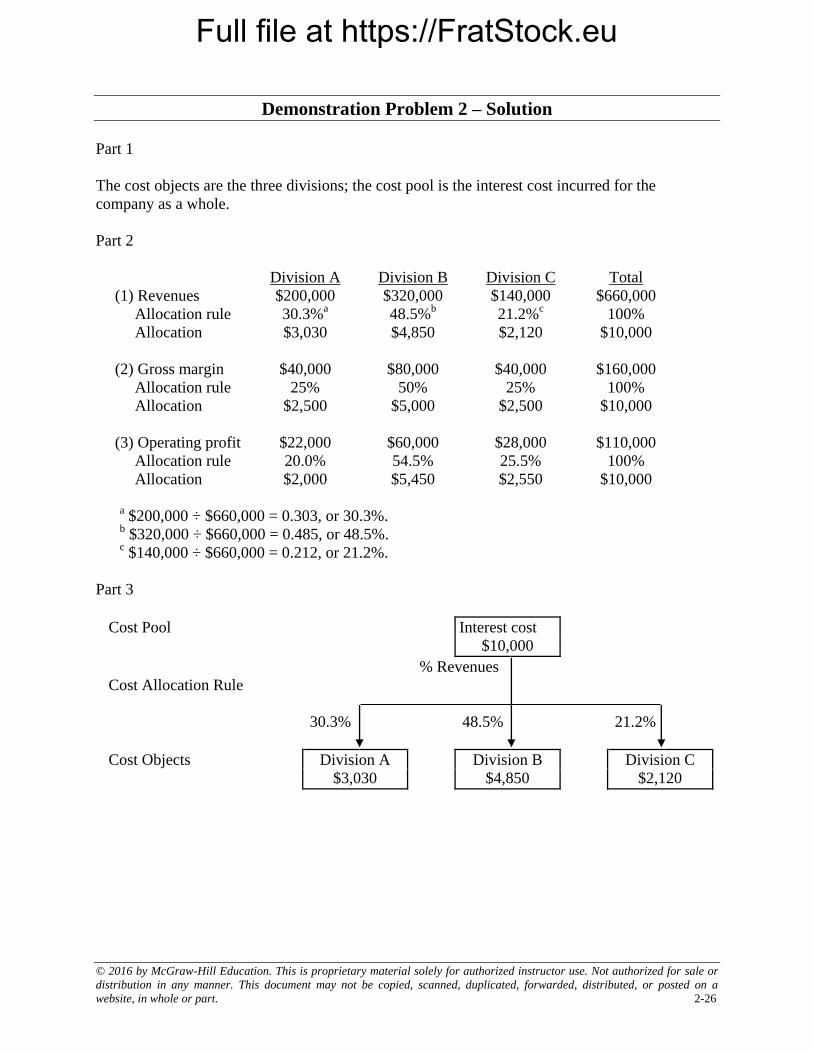
Full file at https://FratStock.eu
© 2016 by McGraw-Hill Education. This is proprietary material solely for authorized instructor use. Not authorized for sale or
distribution in any manner. This document may not be copied, scanned, duplicated, forwarded, distributed, or posted on a
website, in whole or part. 2-26
Demonstration Problem 2 – Solution
Part 1
The cost objects are the three divisions; the cost pool is the interest cost incurred for the
company as a whole.
Part 2
Division A Division B Division C Total
(1) Revenues $200,000 $320,000 $140,000 $660,000
Allocation rule 30.3%a
48.5%b
21.2%c
100%
Allocation $3,030 $4,850 $2,120 $10,000
(2) Gross margin $40,000 $80,000 $40,000 $160,000
Allocation rule 25% 50% 25% 100%
Allocation $2,500 $5,000 $2,500 $10,000
(3) Operating profit $22,000 $60,000 $28,000 $110,000
Allocation rule 20.0% 54.5% 25.5% 100%
Allocation $2,000 $5,450 $2,550 $10,000
a $200,000 ÷ $660,000 = 0.303, or 30.3%.
b $320,000 ÷ $660,000 = 0.485, or 48.5%.
c $140,000 ÷ $660,000 = 0.212, or 21.2%.
Part 3
Cost Pool Interest cost
$10,000
% Revenues
Cost Allocation Rule
30.3%
48.5%
21.2%
Cost Objects Division A
$3,030
Division B
$4,850
Division C
$2,120
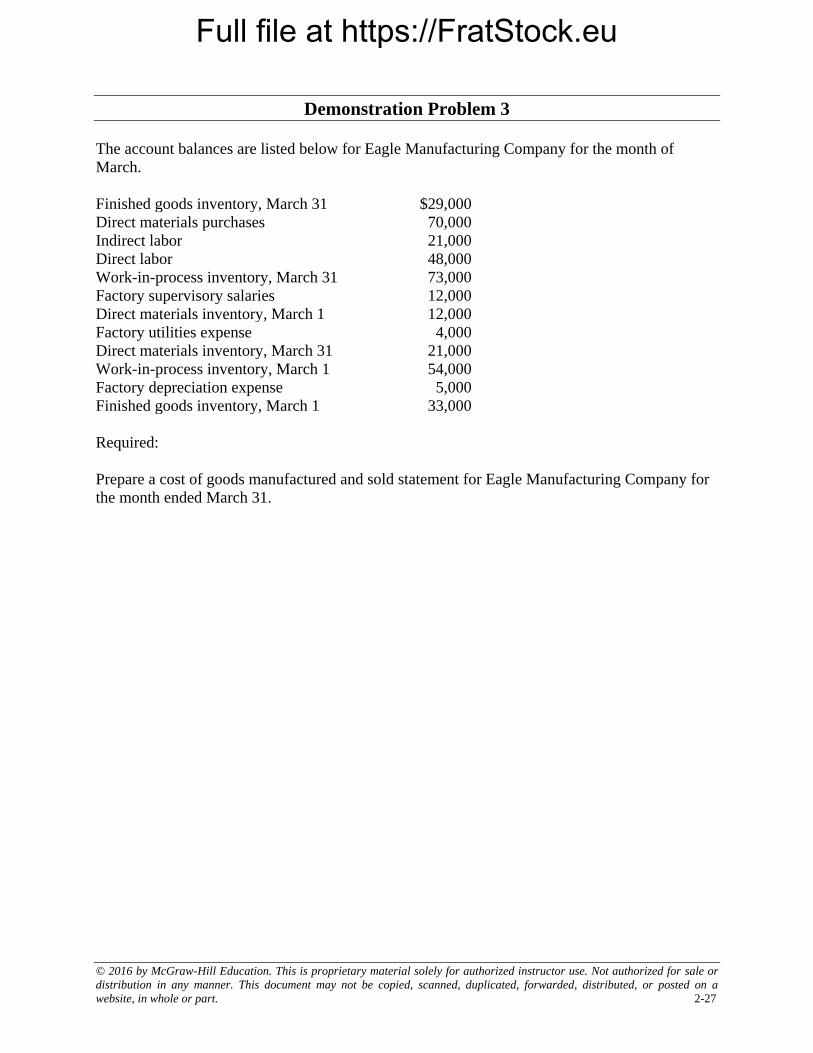
Full file at https://FratStock.eu
© 2016 by McGraw-Hill Education. This is proprietary material solely for authorized instructor use. Not authorized for sale or
distribution in any manner. This document may not be copied, scanned, duplicated, forwarded, distributed, or posted on a
website, in whole or part. 2-27
Demonstration Problem 3
The account balances are listed below for Eagle Manufacturing Company for the month of
March.
Finished goods inventory, March 31 $29,000
Direct materials purchases 70,000
Indirect labor 21,000
Direct labor 48,000
Work-in-process inventory, March 31 73,000
Factory supervisory salaries 12,000
Direct materials inventory, March 1 12,000
Factory utilities expense 4,000
Direct materials inventory, March 31 21,000
Work-in-process inventory, March 1 54,000
Factory depreciation expense 5,000
Finished goods inventory, March 1 33,000
Required:
Prepare a cost of goods manufactured and sold statement for Eagle Manufacturing Company for
the month ended March 31.
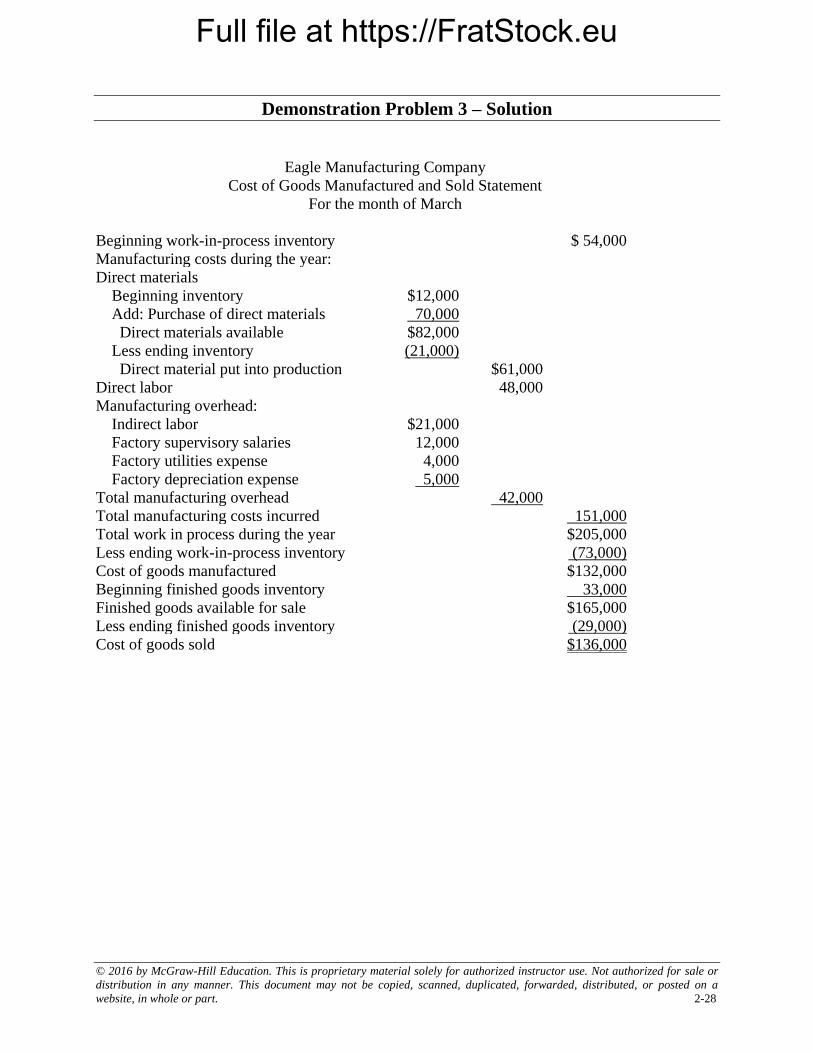
Full file at https://FratStock.eu
© 2016 by McGraw-Hill Education. This is proprietary material solely for authorized instructor use. Not authorized for sale or
distribution in any manner. This document may not be copied, scanned, duplicated, forwarded, distributed, or posted on a
website, in whole or part. 2-28
Demonstration Problem 3 – Solution
Eagle Manufacturing Company
Cost of Goods Manufactured and Sold Statement
For the month of March
Beginning work-in-process inventory $ 54,000
Manufacturing costs during the year:
Direct materials
Beginning inventory $12,000
Add: Purchase of direct materials 70,000
Direct materials available $82,000
Less ending inventory (21,000)
Direct material put into production $61,000
Direct labor 48,000
Manufacturing overhead:
Indirect labor $21,000
Factory supervisory salaries 12,000
Factory utilities expense 4,000
Factory depreciation expense 5,000
Total manufacturing overhead 42,000
Total manufacturing costs incurred 151,000
Total work in process during the year $205,000
Less ending work-in-process inventory (73,000)
Cost of goods manufactured $132,000
Beginning finished goods inventory 33,000
Finished goods available for sale $165,000
Less ending finished goods inventory (29,000)
Cost of goods sold $136,000
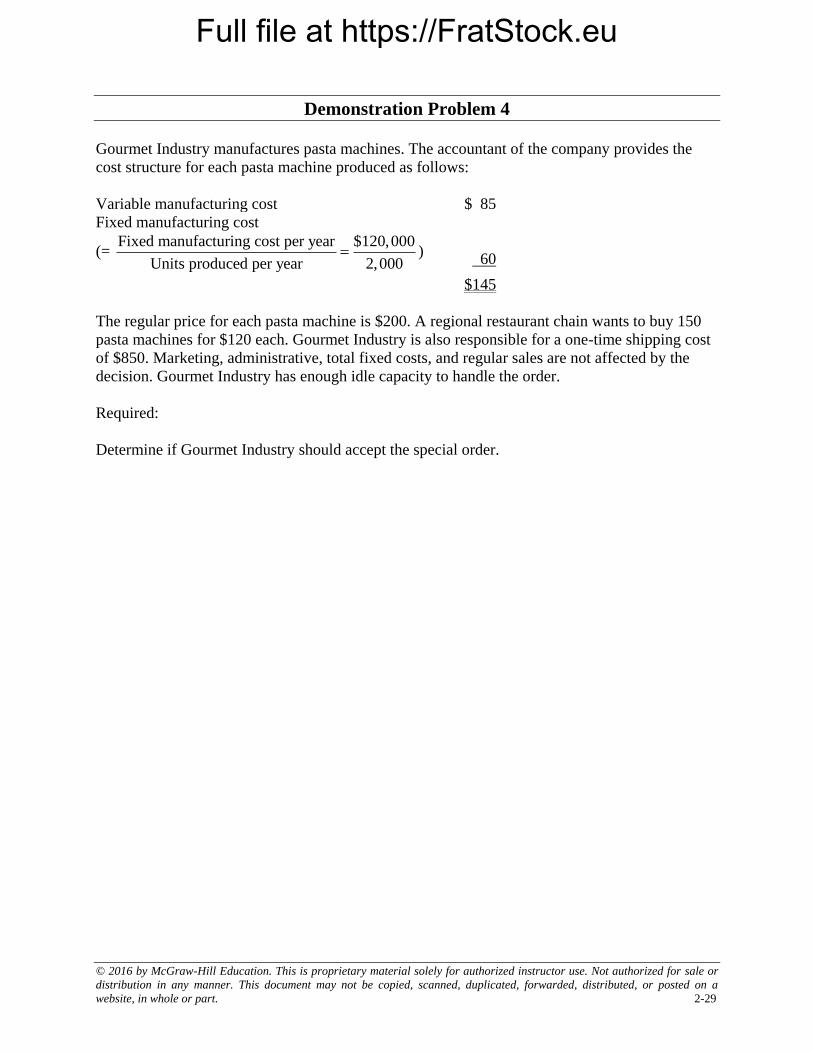
Full file at https://FratStock.eu
© 2016 by McGraw-Hill Education. This is proprietary material solely for authorized instructor use. Not authorized for sale or
distribution in any manner. This document may not be copied, scanned, duplicated, forwarded, distributed, or posted on a
website, in whole or part. 2-29
Demonstration Problem 4
Gourmet Industry manufactures pasta machines. The accountant of the company provides the
cost structure for each pasta machine produced as follows:
Variable manufacturing cost $ 85
Fixed manufacturing cost
(= Fixed manufacturing cost per year $120,000
Units produced per year 2,000 )
60
$145
The regular price for each pasta machine is $200. A regional restaurant chain wants to buy 150
pasta machines for $120 each. Gourmet Industry is also responsible for a one-time shipping cost
of $850. Marketing, administrative, total fixed costs, and regular sales are not affected by the
decision. Gourmet Industry has enough idle capacity to handle the order.
Required:
Determine if Gourmet Industry should accept the special order.
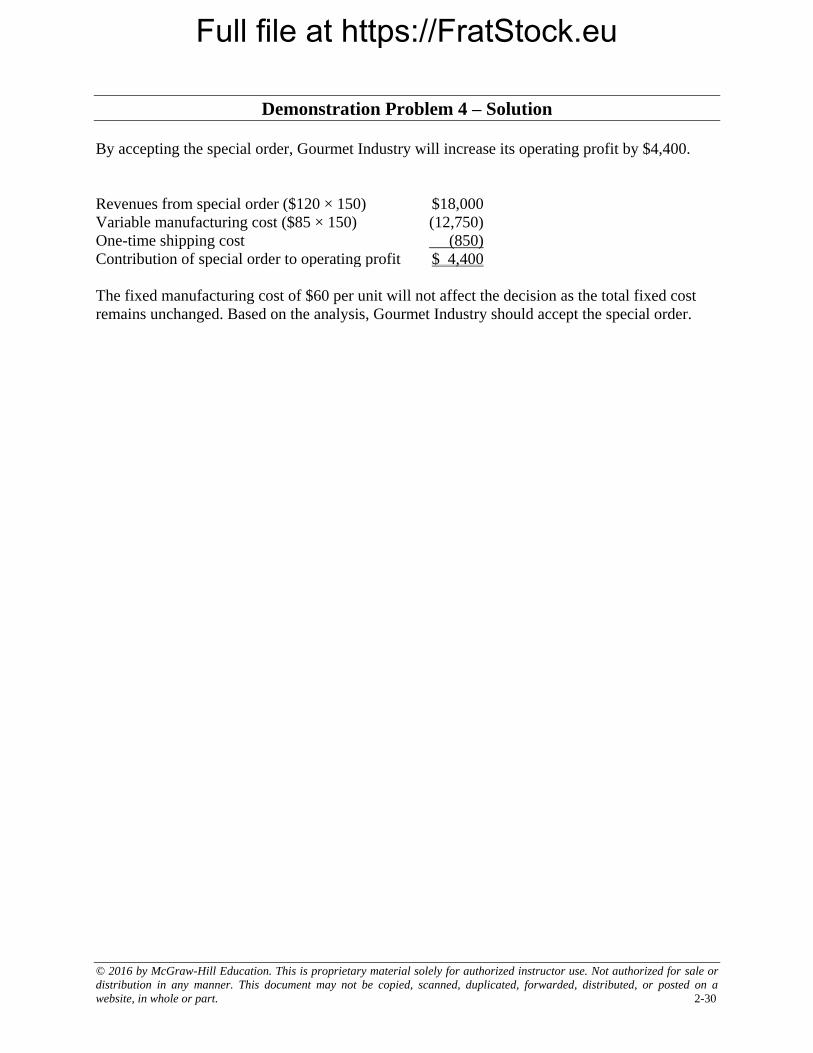
Full file at https://FratStock.eu
© 2016 by McGraw-Hill Education. This is proprietary material solely for authorized instructor use. Not authorized for sale or
distribution in any manner. This document may not be copied, scanned, duplicated, forwarded, distributed, or posted on a
website, in whole or part. 2-30
Demonstration Problem 4 – Solution
By accepting the special order, Gourmet Industry will increase its operating profit by $4,400.
Revenues from special order ($120 × 150) $18,000
Variable manufacturing cost ($85 × 150) (12,750)
One-time shipping cost (850)
Contribution of special order to operating profit $ 4,400
The fixed manufacturing cost of $60 per unit will not affect the decision as the total fixed cost
remains unchanged. Based on the analysis, Gourmet Industry should accept the special order.
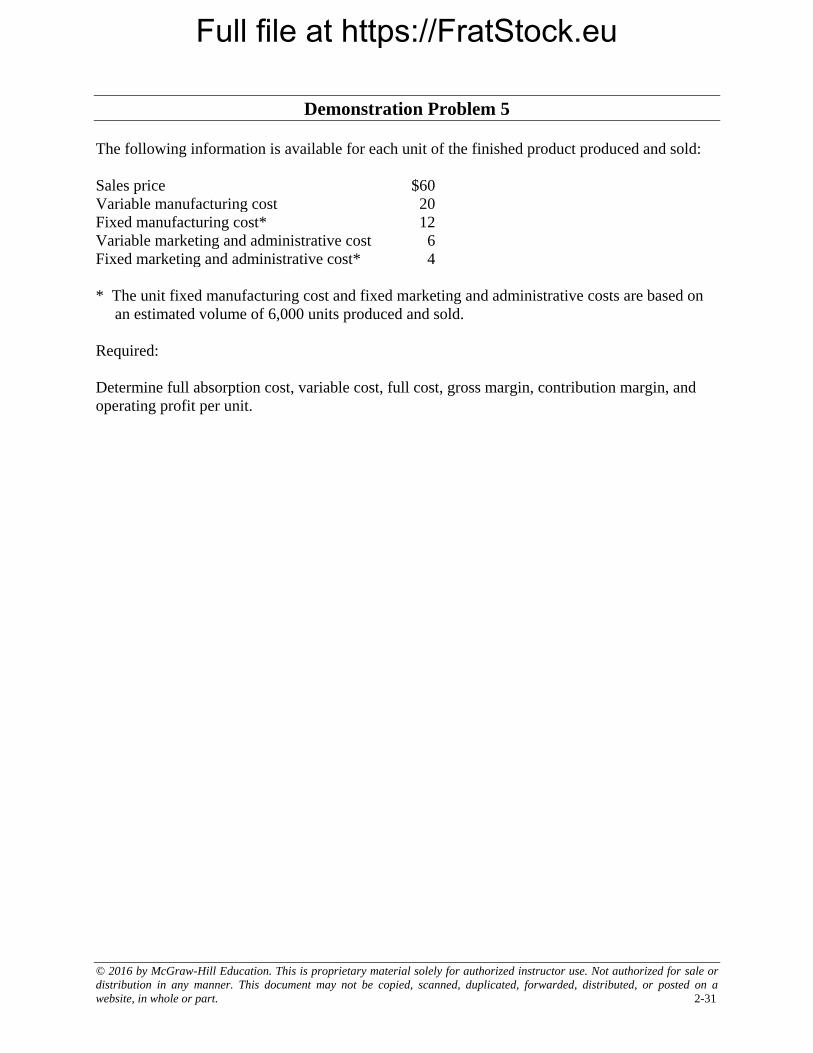
Full file at https://FratStock.eu
© 2016 by McGraw-Hill Education. This is proprietary material solely for authorized instructor use. Not authorized for sale or
distribution in any manner. This document may not be copied, scanned, duplicated, forwarded, distributed, or posted on a
website, in whole or part. 2-31
Demonstration Problem 5
The following information is available for each unit of the finished product produced and sold:
Sales price $60
Variable manufacturing cost 20
Fixed manufacturing cost* 12
Variable marketing and administrative cost 6
Fixed marketing and administrative cost* 4
* The unit fixed manufacturing cost and fixed marketing and administrative costs are based on
an estimated volume of 6,000 units produced and sold.
Required:
Determine full absorption cost, variable cost, full cost, gross margin, contribution margin, and
operating profit per unit.
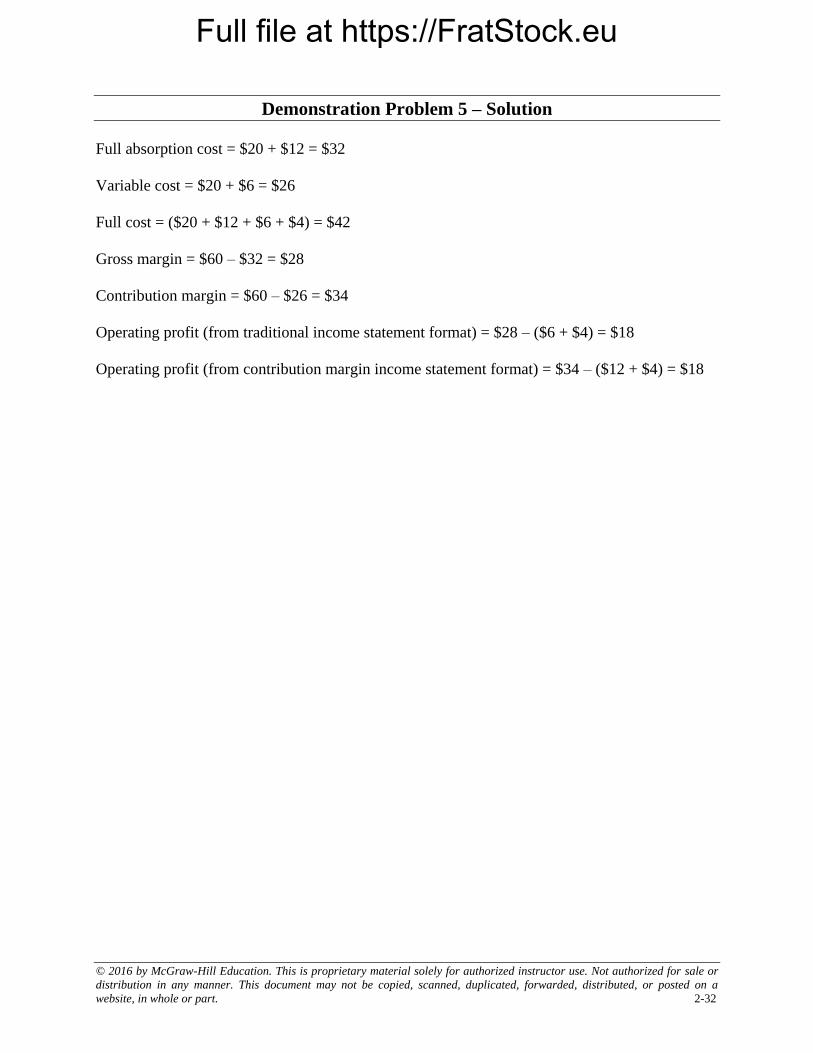
Full file at https://FratStock.eu
© 2016 by McGraw-Hill Education. This is proprietary material solely for authorized instructor use. Not authorized for sale or
distribution in any manner. This document may not be copied, scanned, duplicated, forwarded, distributed, or posted on a
website, in whole or part. 2-32
Demonstration Problem 5 – Solution
Full absorption cost = $20 + $12 = $32
Variable cost = $20 + $6 = $26
Full cost = ($20 + $12 + $6 + $4) = $42
Gross margin = $60 – $32 = $28
Contribution margin = $60 – $26 = $34
Operating profit (from traditional income statement format) = $28 – ($6 + $4) = $18
Operating profit (from contribution margin income statement format) = $34 – ($12 + $4) = $18
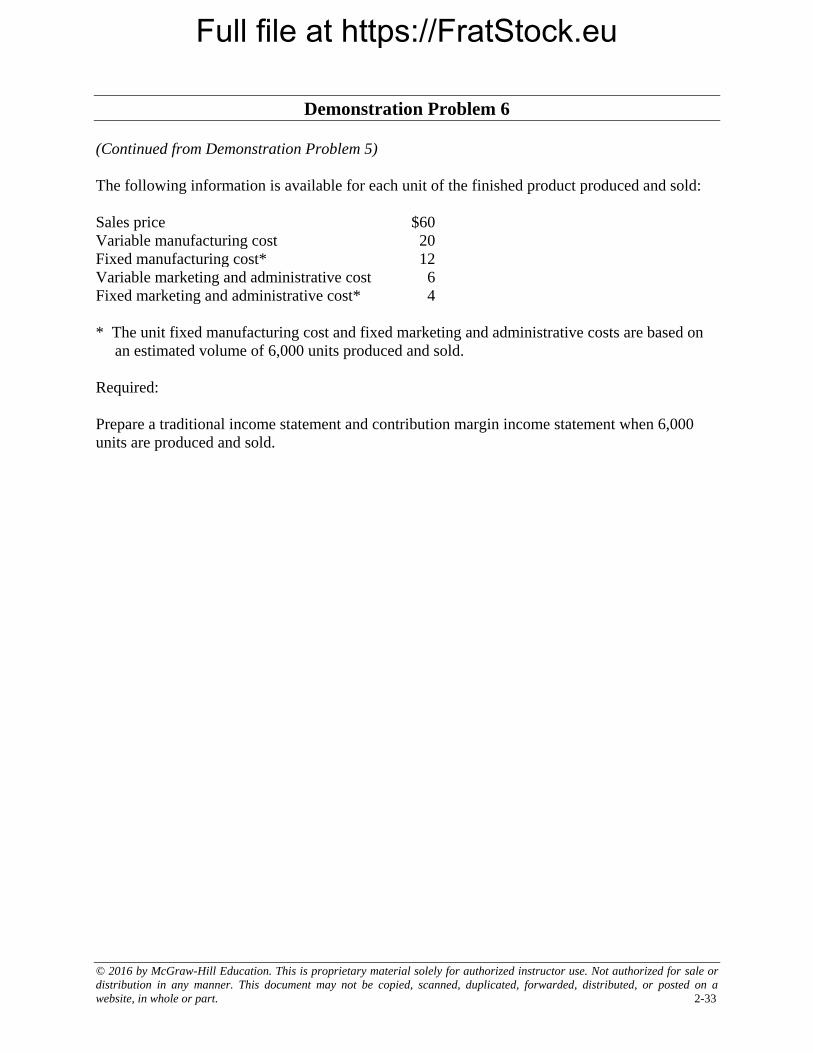
Full file at https://FratStock.eu
© 2016 by McGraw-Hill Education. This is proprietary material solely for authorized instructor use. Not authorized for sale or
distribution in any manner. This document may not be copied, scanned, duplicated, forwarded, distributed, or posted on a
website, in whole or part. 2-33
Demonstration Problem 6
(Continued from Demonstration Problem 5)
The following information is available for each unit of the finished product produced and sold:
Sales price $60
Variable manufacturing cost 20
Fixed manufacturing cost* 12
Variable marketing and administrative cost 6
Fixed marketing and administrative cost* 4
* The unit fixed manufacturing cost and fixed marketing and administrative costs are based on
an estimated volume of 6,000 units produced and sold.
Required:
Prepare a traditional income statement and contribution margin income statement when 6,000
units are produced and sold.
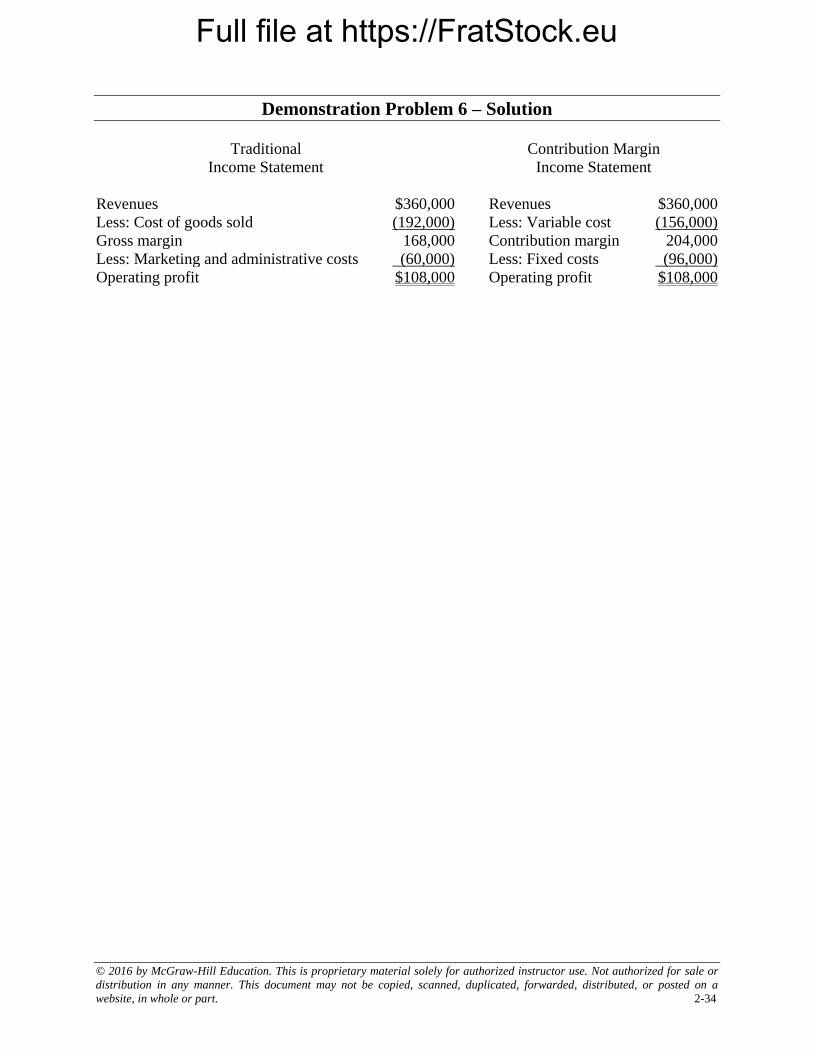
Full file at https://FratStock.eu
© 2016 by McGraw-Hill Education. This is proprietary material solely for authorized instructor use. Not authorized for sale or
distribution in any manner. This document may not be copied, scanned, duplicated, forwarded, distributed, or posted on a
website, in whole or part. 2-34
Demonstration Problem 6 – Solution
Traditional
Income Statement
Contribution Margin
Income Statement
Revenues $360,000 Revenues $360,000
Less: Cost of goods sold (192,000) Less: Variable cost (156,000)
Gross margin 168,000 Contribution margin 204,000
Less: Marketing and administrative costs (60,000) Less: Fixed costs (96,000)
Operating profit $108,000 Operating profit $108,000
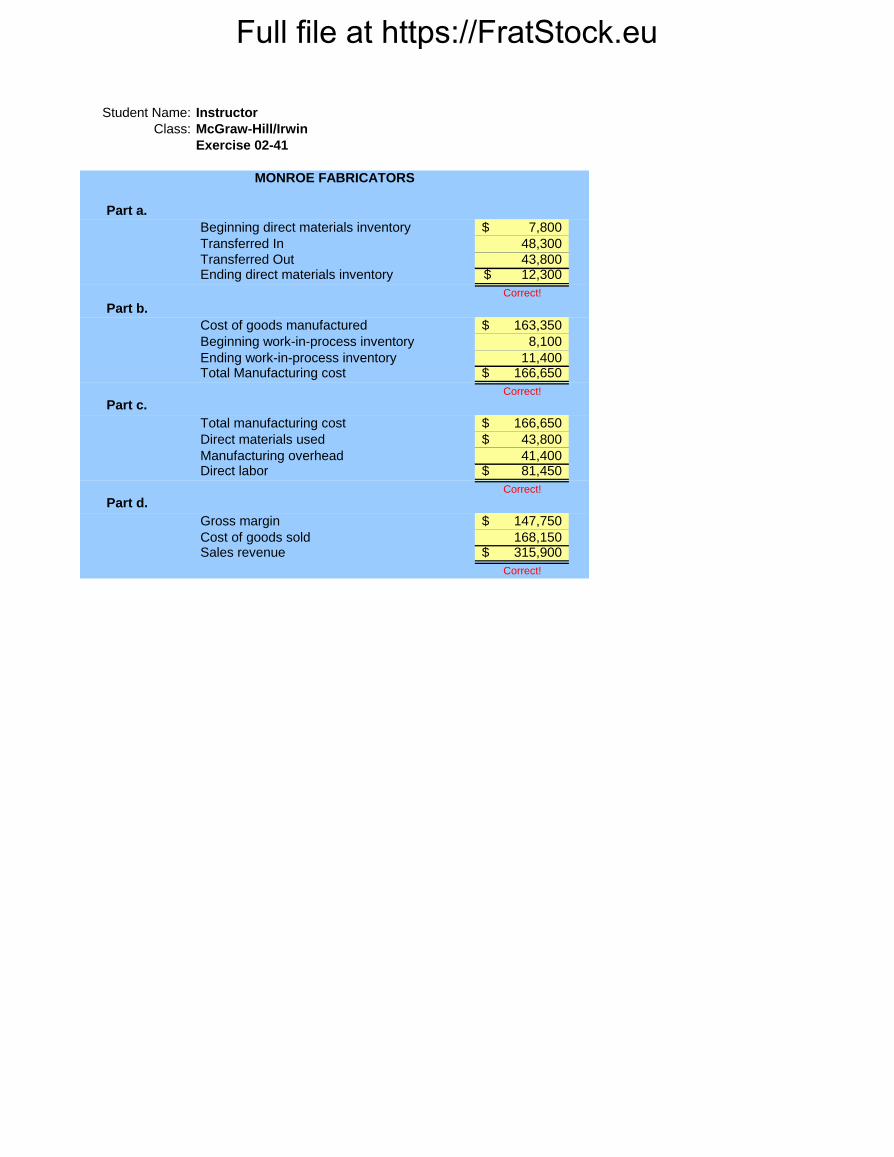
Full file at https://FratStock.eu
Student Name:
Class:
Part a.
7,800$
48,300
43,800 12,300$
Correct!
Part b.
163,350$
8,100
11,400 166,650$
Correct!
Part c.
166,650$
Direct materials used 43,800$
41,400 81,450$
Correct!
Part d.
147,750$
168,150 315,900$
Correct!
Instructor
McGraw-Hill/Irwin
Exercise 02-41
Beginning direct materials inventory
MONROE FABRICATORS
Ending work-in-process inventory
Cost of goods soldSales revenue
Transferred Out
Transferred In
Direct laborManufacturing overhead
Total manufacturing cost
Total Manufacturing cost
Beginning work-in-process inventory
Cost of goods manufactured
Ending direct materials inventory
Gross margin
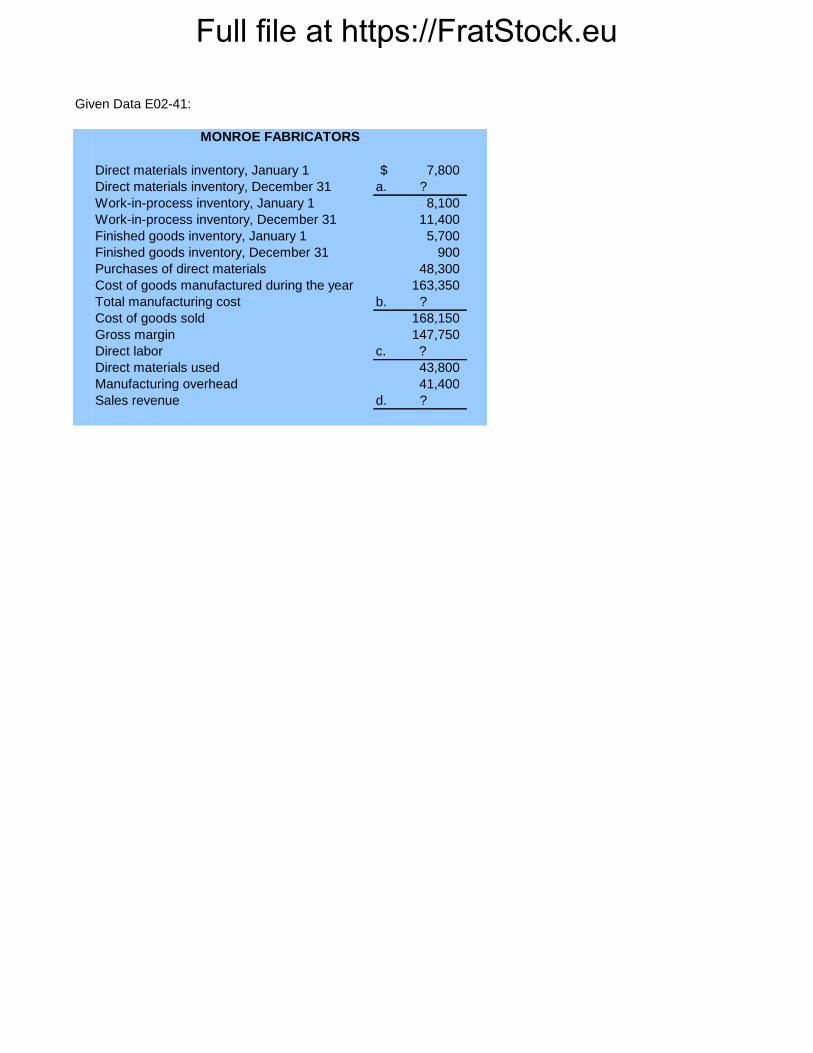
Full file at https://FratStock.eu
7,800$
a. ?
8,100
11,400
5,700
900
48,300
163,350
b. ?
168,150
147,750
c. ?
43,800
41,400
d. ?
Work-in-process inventory, December 31
Given Data E02-41:
MONROE FABRICATORS
Direct materials inventory, January 1
Sales revenue
Manufacturing overhead
Direct materials used
Direct labor
Gross margin
Cost of goods sold
Total manufacturing cost
Cost of goods manufactured during the year
Work-in-process inventory, January 1
Direct materials inventory, December 31
Purchases of direct materials
Finished goods inventory, December 31
Finished goods inventory, January 1
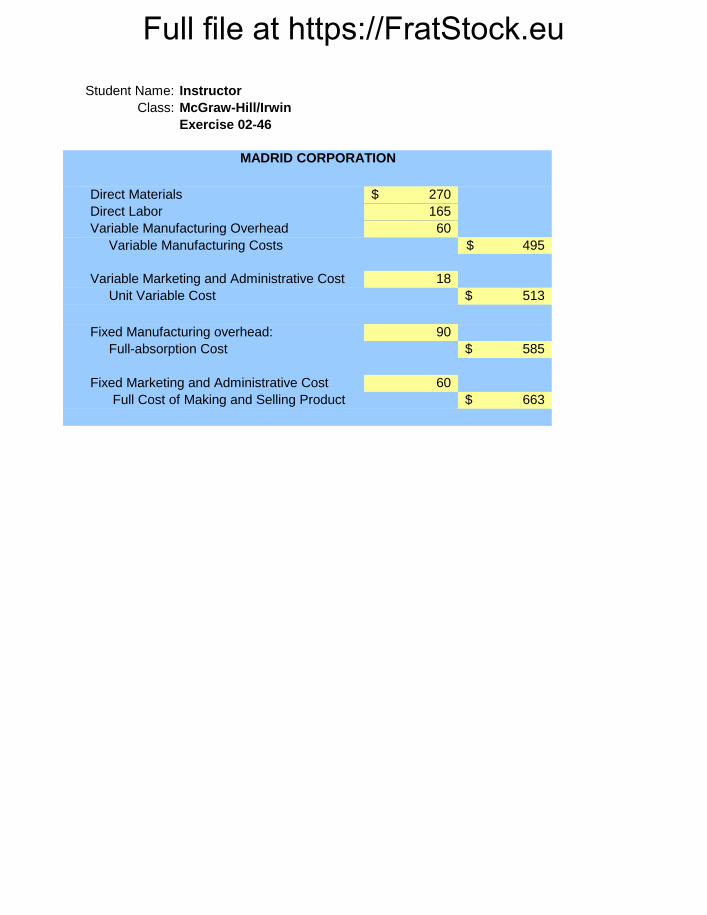
Full file at https://FratStock.eu
Student Name:
Class:
270$
165
60
495$
18
513$
90
585$
60
663$
Fixed Manufacturing overhead:
Full-absorption Cost
Fixed Marketing and Administrative Cost
Full Cost of Making and Selling Product
MADRID CORPORATION
Instructor
McGraw-Hill/Irwin
Exercise 02-46
Direct Materials
Direct Labor
Variable Manufacturing Overhead
Variable Manufacturing Costs
Variable Marketing and Administrative Cost
Unit Variable Cost
Full file at https://FratStock.eu
«- Correct!
«- Correct!
«- Correct!
«- Correct!
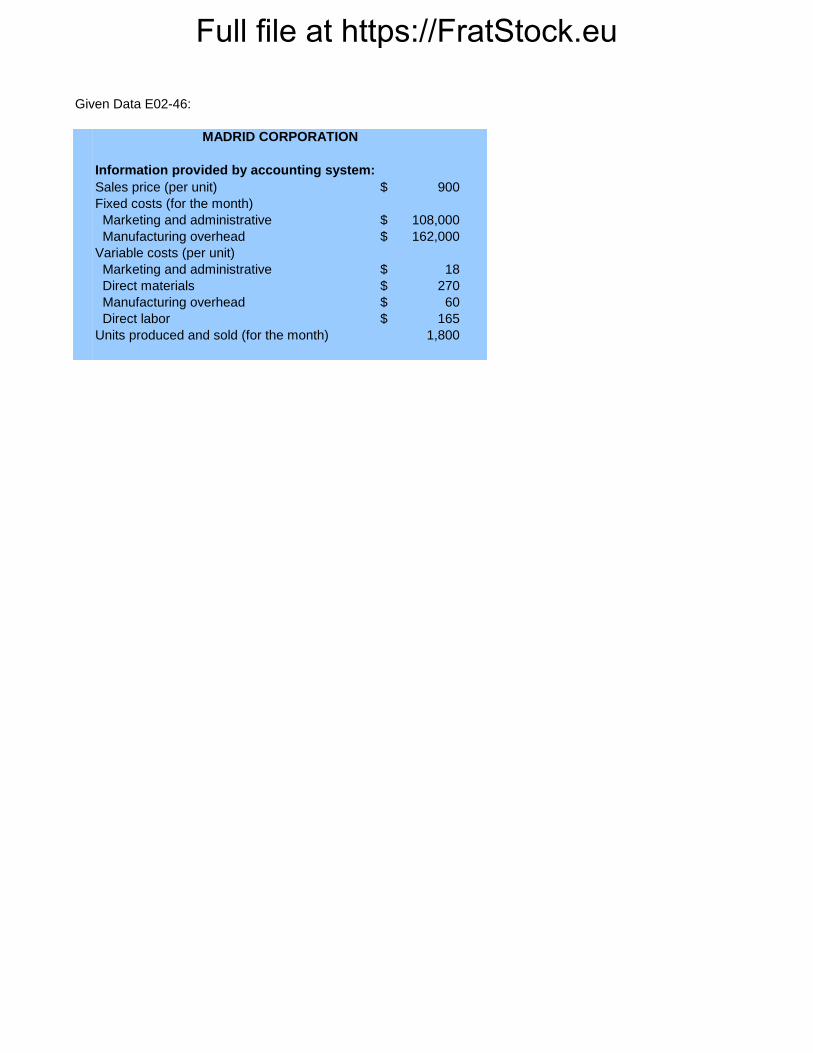
Full file at https://FratStock.eu
900$
108,000$
162,000$
18$
270$
60$
165$
1,800 Units produced and sold (for the month)
Direct labor
Manufacturing overhead
Direct materials
Given Data E02-46:
Information provided by accounting system:
Fixed costs (for the month)
Sales price (per unit)
Marketing and administrative
MADRID CORPORATION
Variable costs (per unit)
Manufacturing overhead
Marketing and administrative
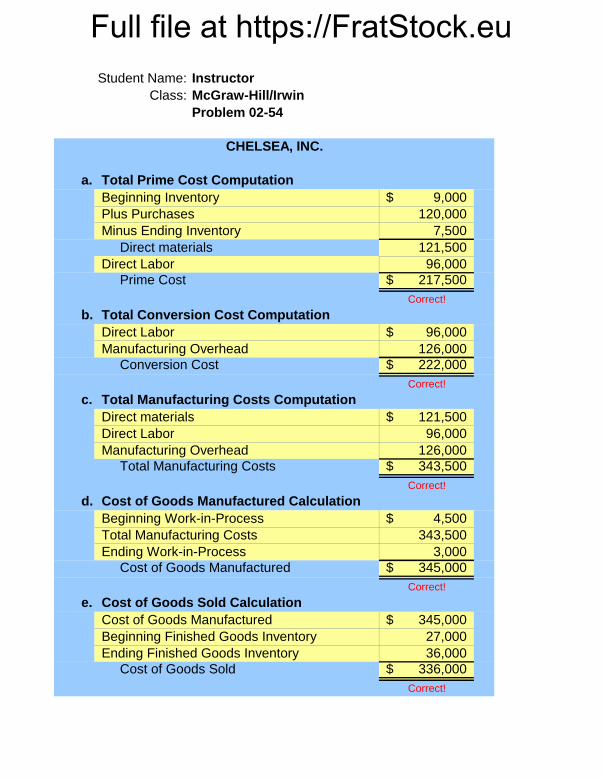
Full file at https://FratStock.euStudent Name:
Class:
a.
9,000$
120,000
7,500
121,500
96,000
217,500$
Correct!
b.
96,000$
126,000
222,000$
Correct!
c.
121,500$
96,000
126,000
343,500$
Correct!
d.
4,500$
343,500
3,000
345,000$
Correct!
e.
345,000$
27,000
36,000
336,000$
Correct!
Problem 02-54
McGraw-Hill/Irwin
Instructor
Total Manufacturing Costs
Manufacturing Overhead
CHELSEA, INC.
Total Prime Cost Computation
Direct Labor
Direct materials
Conversion Cost
Manufacturing Overhead
Total Manufacturing Costs Computation
Minus Ending Inventory
Plus Purchases
Beginning Inventory
Direct Labor
Prime Cost
Direct Labor
Direct materials
Total Conversion Cost Computation
Cost of Goods Sold
Ending Finished Goods Inventory
Beginning Finished Goods Inventory
Cost of Goods Manufactured
Cost of Goods Manufactured Calculation
Cost of Goods Sold Calculation
Cost of Goods Manufactured
Ending Work-in-Process
Total Manufacturing Costs
Beginning Work-in-Process
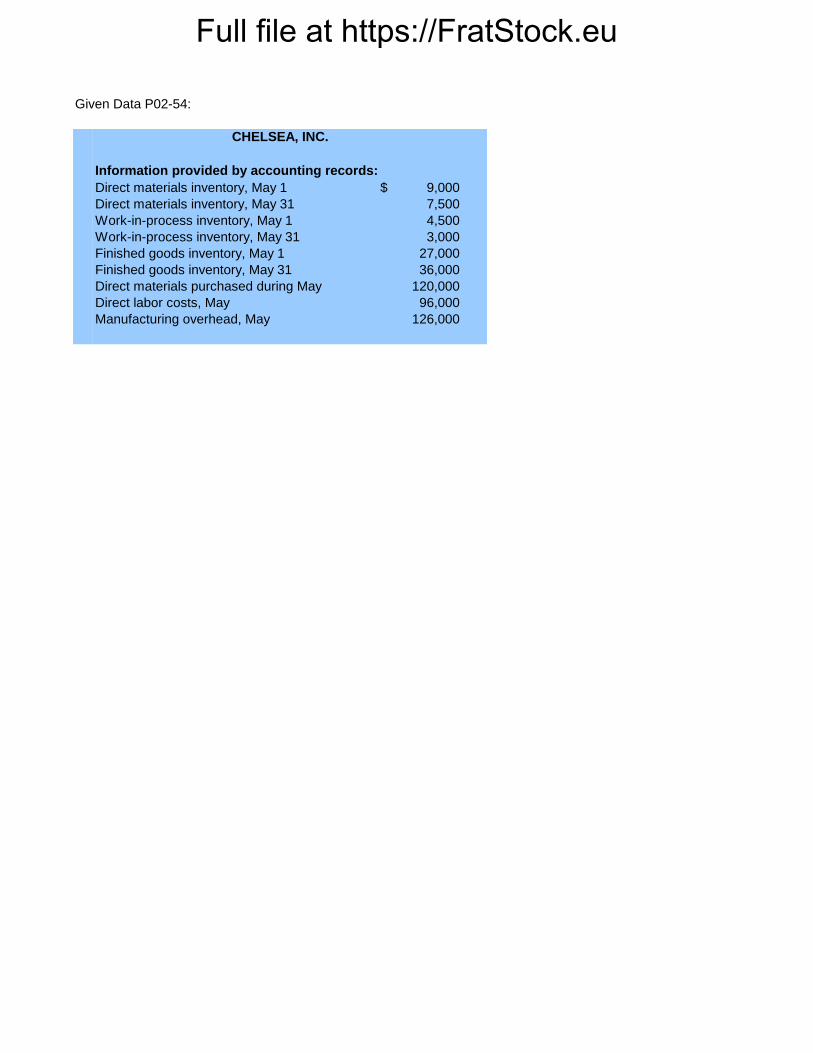
Full file at https://FratStock.eu
9,000$
7,500
4,500
3,000
27,000
36,000
120,000
96,000
126,000
Given Data P02-54:
Information provided by accounting records:
Manufacturing overhead, May
Direct materials purchased during May
Direct labor costs, May
Work-in-process inventory, May 1
Work-in-process inventory, May 31
Finished goods inventory, May 1
Finished goods inventory, May 31
CHELSEA, INC.
Direct materials inventory, May 1
Direct materials inventory, May 31
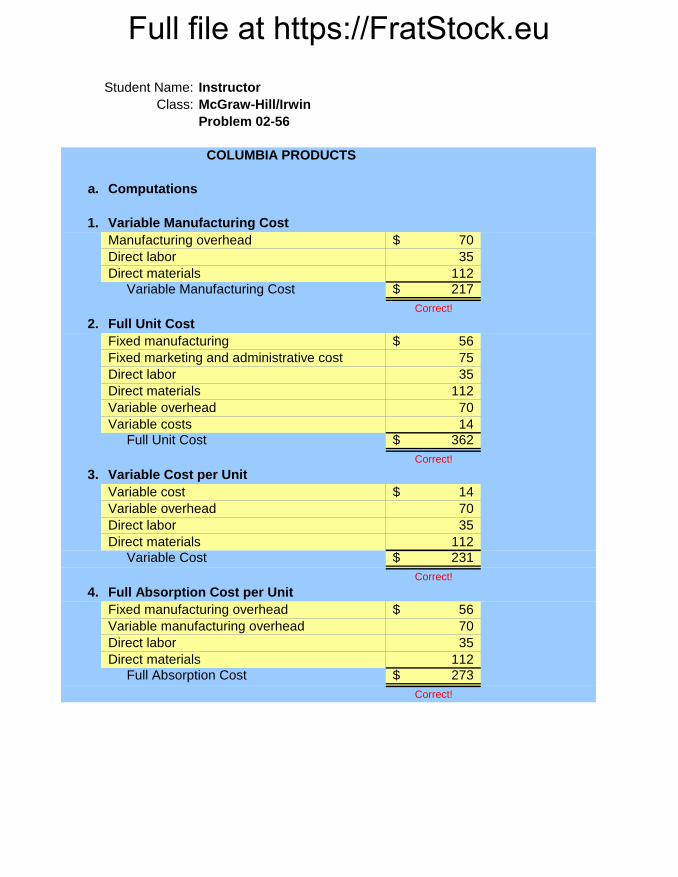
Full file at https://FratStock.euStudent Name:
Class:
a. Computations
1.
70$
35
112
217$
Correct!
2.
56$
75
35
112
70
14
362$
Correct!
3.
14$
70
35
112
231$
Correct!
4.
56$
70
35
112
273$
Correct!
Problem 02-56
McGraw-Hill/Irwin
Instructor
COLUMBIA PRODUCTS
Direct materials
Direct labor
Variable manufacturing overhead
Direct labor
Variable overhead
Variable cost
Variable Cost per Unit
Fixed manufacturing overhead
Full Absorption Cost per Unit
Variable Cost
Direct materials
Variable Manufacturing Cost
Full Absorption Cost
Variable Manufacturing Cost
Direct materials
Direct labor
Manufacturing overhead
Direct labor
Fixed marketing and administrative cost
Fixed manufacturing
Full Unit Cost
Full Unit Cost
Variable costs
Variable overhead
Direct materials
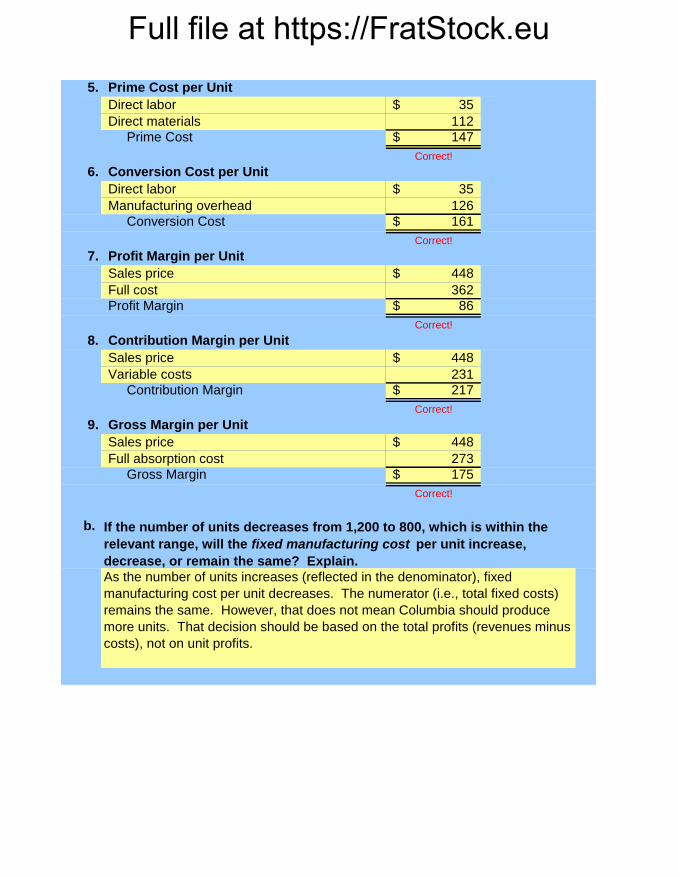
Full file at https://FratStock.eu5.
35$
112
147$
Correct!
6.
35$
126
161$
Correct!
7.
448$
362
86$
Correct!
8.
448$
231
217$
Correct!
9.
448$
273
175$
Correct!
b.
Gross Margin
Full absorption cost
Sales price
Gross Margin per Unit
Contribution Margin
Variable costs
Sales price
Profit Margin per Unit
Conversion Cost
Manufacturing overhead
Direct labor
Contribution Margin per Unit
Profit Margin
Full cost
Sales price
Conversion Cost per Unit
Prime Cost
Direct materials
Direct labor
Prime Cost per Unit
If the number of units decreases from 1,200 to 800, which is within the
relevant range, will the fixed manufacturing cost per unit increase,
decrease, or remain the same? Explain.
As the number of units increases (reflected in the denominator), fixed
manufacturing cost per unit decreases. The numerator (i.e., total fixed costs)
remains the same. However, that does not mean Columbia should produce
more units. That decision should be based on the total profits (revenues minus
costs), not on unit profits.

Full file at https://FratStock.eu
448$
Manufacturing costs:
50,400$
35
112
70
67,500$
14
Information provided by accounting system:
Variable overhead (per unit)
Given Data P02-56:
Fixed costs (for the month)
Variable costs (per unit)
Direct labor (per unit)
Direct materials (per unit)
Marketing and administrative costs:
COLUMBIA PRODUCTS
Sales price (per unit)
Fixed overhead (for the month)
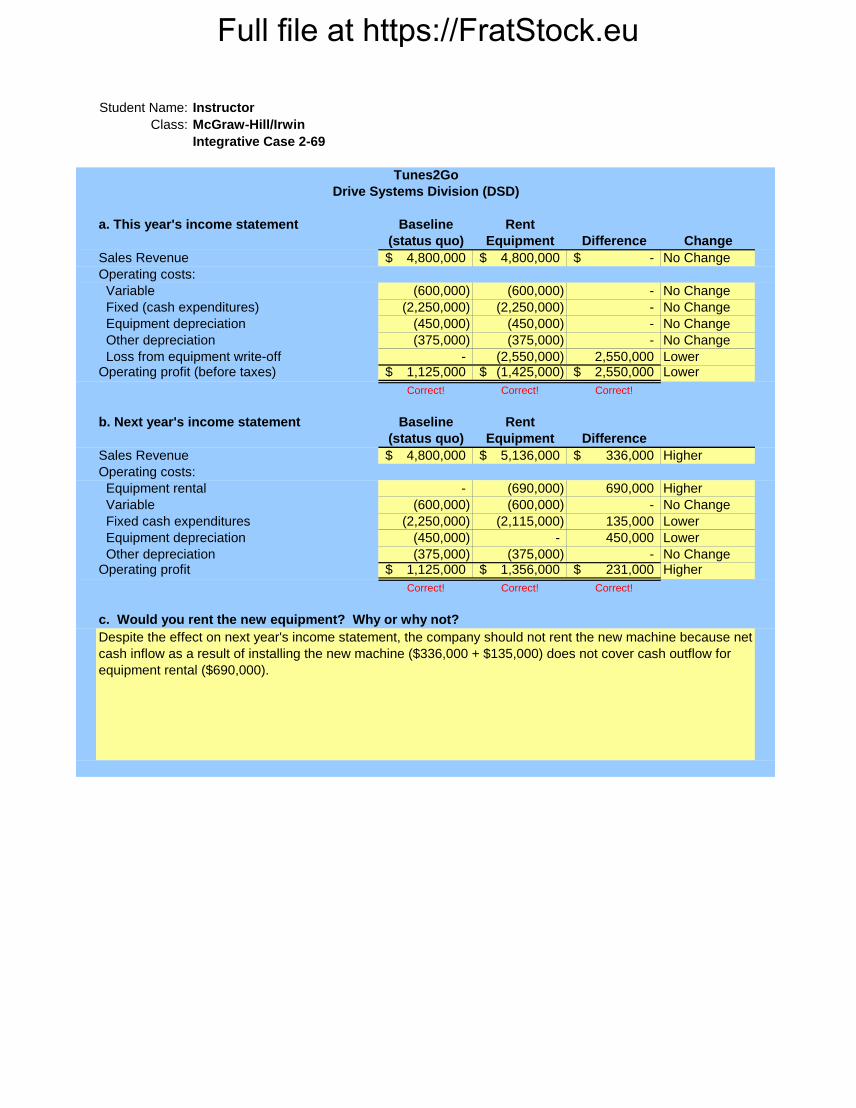
Full file at https://FratStock.eu
Student Name:
Class:
Baseline Rent
(status quo) Equipment Difference Change
4,800,000$ 4,800,000$ -$ No Change
(600,000) (600,000) - No Change
(2,250,000) (2,250,000) - No Change
(450,000) (450,000) - No Change
(375,000) (375,000) - No Change
- (2,550,000) 2,550,000 Lower1,125,000$ (1,425,000)$ 2,550,000$ Lower
Correct! Correct! Correct!
Baseline Rent
(status quo) Equipment Difference
4,800,000$ 5,136,000$ 336,000$ Higher
- (690,000) 690,000 Higher
(600,000) (600,000) - No Change
(2,250,000) (2,115,000) 135,000 Lower
(450,000) - 450,000 Lower
(375,000) (375,000) - No Change1,125,000$ 1,356,000$ 231,000$ Higher
Correct! Correct! Correct!
Instructor
McGraw-Hill/Irwin
Loss from equipment write-off
Other depreciation
Equipment depreciation
Fixed (cash expenditures)
Variable
Operating costs:
Sales Revenue
Integrative Case 2-69
a. This year's income statement
Despite the effect on next year's income statement, the company should not rent the new machine because net
cash inflow as a result of installing the new machine ($336,000 + $135,000) does not cover cash outflow for
equipment rental ($690,000).
Drive Systems Division (DSD)
Tunes2Go
Other depreciation
Equipment depreciation
Fixed cash expenditures
Variable
Equipment rental
Operating costs:
Sales Revenue
c. Would you rent the new equipment? Why or why not?
b. Next year's income statement
Operating profit
Operating profit (before taxes)
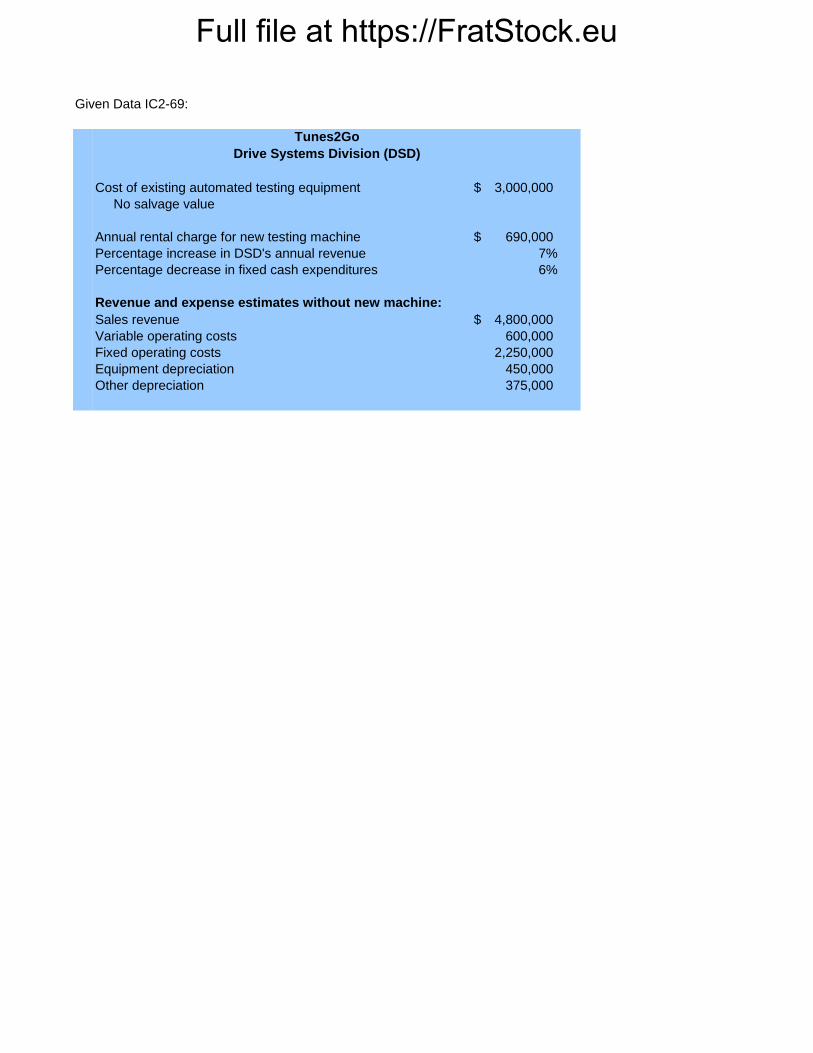
Full file at https://FratStock.eu
3,000,000$
690,000$
7%
6%
4,800,000$
600,000
2,250,000
450,000
375,000
No salvage value
Given Data IC2-69:
Revenue and expense estimates without new machine:
Sales revenue
Tunes2Go
Percentage decrease in fixed cash expenditures
Percentage increase in DSD's annual revenue
Annual rental charge for new testing machine
Cost of existing automated testing equipment
Drive Systems Division (DSD)
Variable operating costs
Fixed operating costs
Equipment depreciation
Other depreciation
Full file at https://FratStock.eu
© 2017 by McGraw-Hill Education. This is proprietary material solely for authorized instructor use. Not authorized for sale or distribution in any
manner. This document may not be copied, scanned, duplicated, forwarded, distributed, or posted on a website, in whole or part.
Full file at https://FratStock.eu
Copyright © 2017 by The McGraw-Hill Companies, Inc. All rights reserved.
PowerPoint Authors:
Susan Coomer Galbreath, Ph.D., CPA
Jon A. Booker, Ph.D., CPA, CIA
Cynthia J. Rooney, Ph.D., CPA
Cost Concepts and Behavior
Chapter 2
Full file at https://FratStock.eu 2-3
Learning Objectives
LO 2-1 Explain the basic concept of “cost.”
LO 2-2 Explain how costs are presented in financial statements.
LO 2-3 Explain the process of cost allocation.
LO 2-4 Understand how material, labor, and overhead costs are
added to a product at each stage of the production process.
LO 2-5 Define basic cost behaviors, including fixed, variable,
semivariable, and step costs.
LO 2-6 Identify the components of a product’s costs.
LO 2-7 Understand the distinction between financial and
contribution margin income statements.
Full file at https://FratStock.eu 2-4
What is a Cost?
Cost is a sacrifice of resources.
LO 2-1 Explain the basic concept of “cost.”
LO
2-1
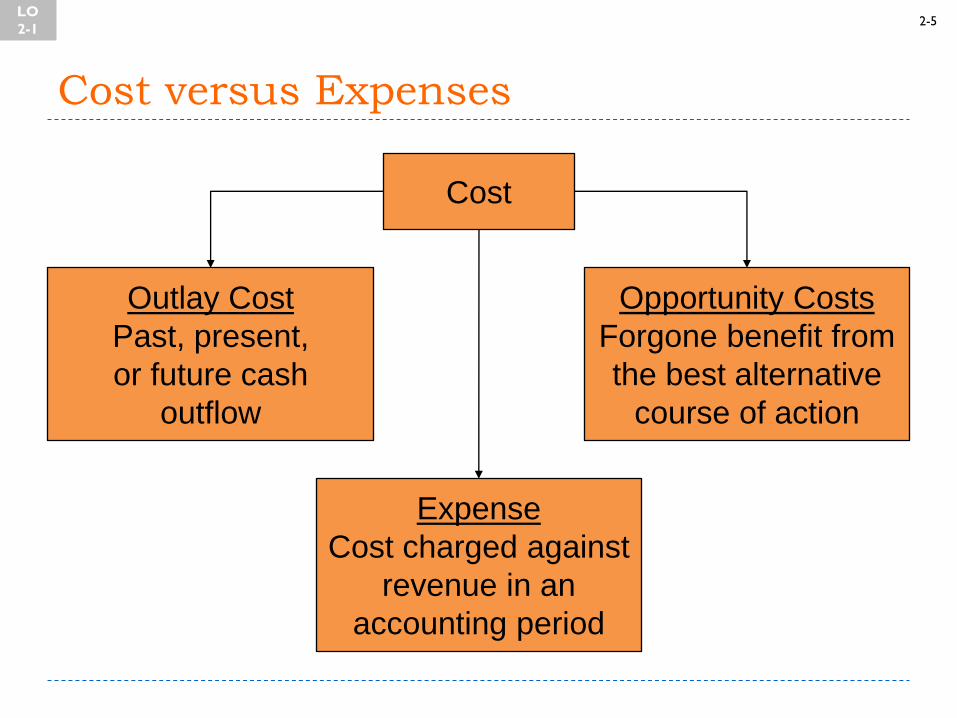
Full file at https://FratStock.eu 2-5
Cost versus Expenses
Cost
Outlay Cost
Past, present,
or future cash
outflow
Opportunity Costs
Forgone benefit from
the best alternative
course of action
Expense
Cost charged against
revenue in an
accounting period
LO
2-1
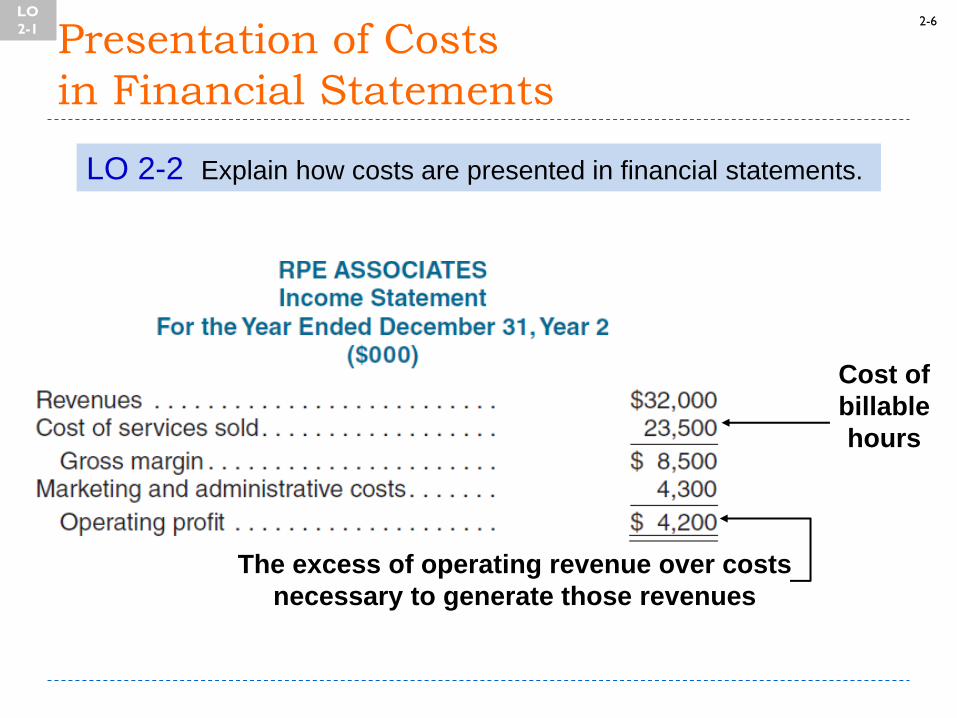
Full file at https://FratStock.eu 2-6
Presentation of Costs
in Financial Statements
LO 2-2 Explain how costs are presented in financial statements.
The excess of operating revenue over costs
necessary to generate those revenues
Cost of
billable
hours
LO
2-1
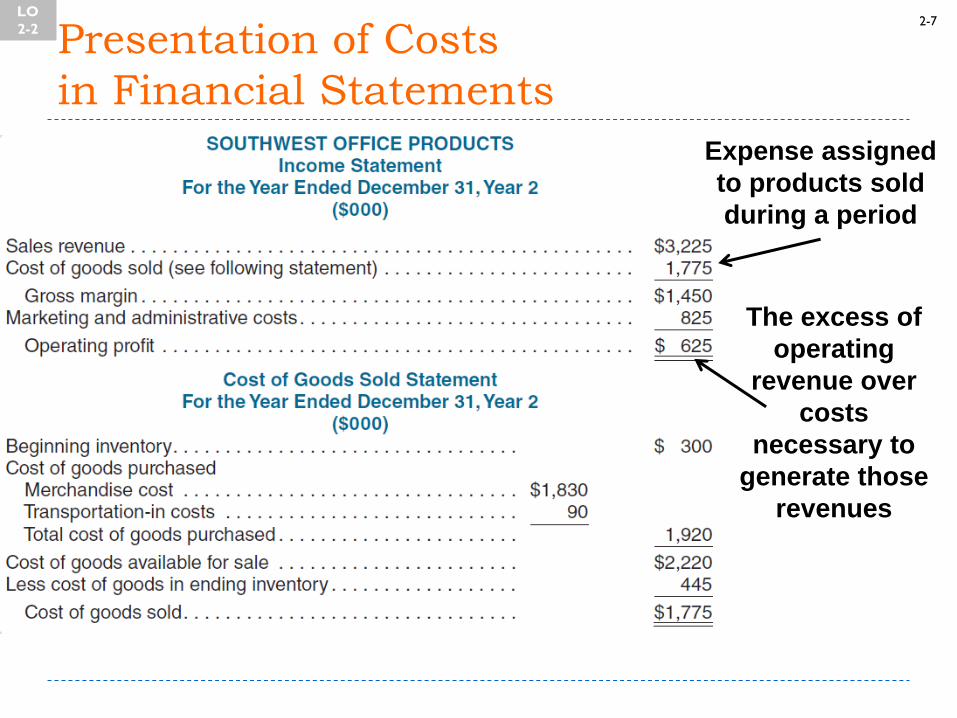
Full file at https://FratStock.eu 2-7
Presentation of Costs
in Financial Statements
The excess of
operating
revenue over
costs
necessary to
generate those
revenues
Expense assigned
to products sold
during a period
LO
2-2
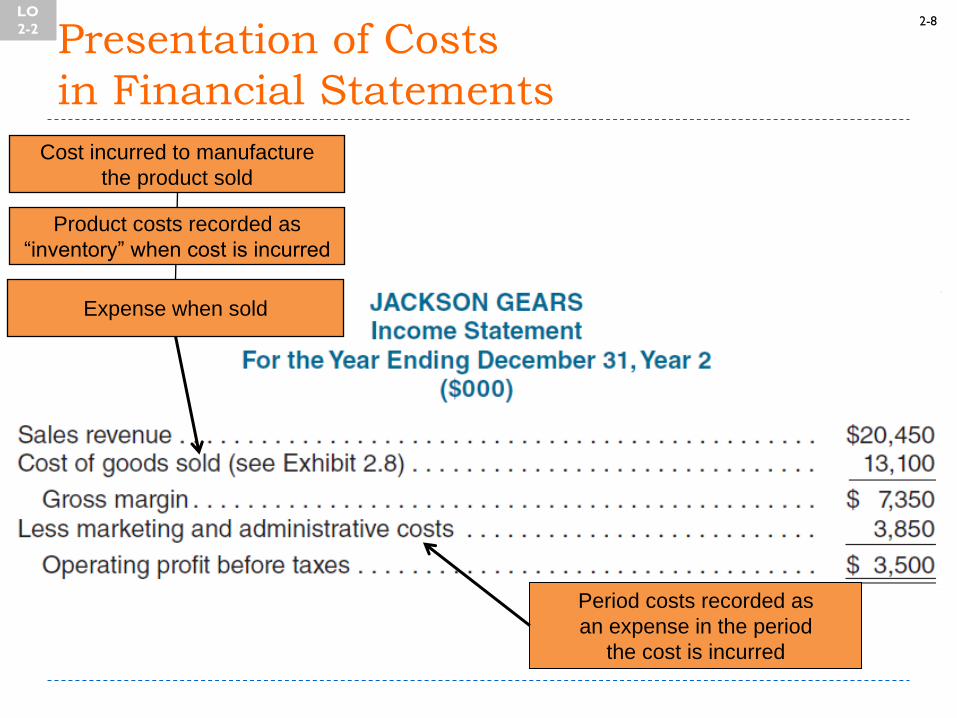
Full file at https://FratStock.eu 2-8
Presentation of Costs
in Financial Statements
Cost incurred to manufacture
the product sold
LO
2-2
Expense when sold
Product costs recorded as
“inventory” when cost is incurred
Period costs recorded as
an expense in the period
the cost is incurred
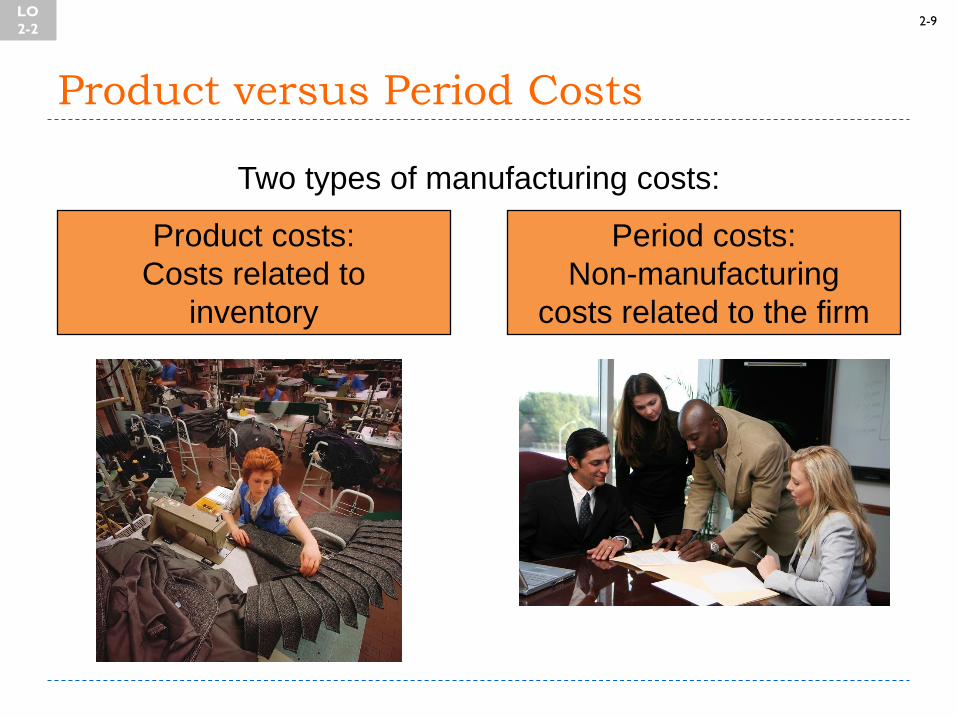
Full file at https://FratStock.eu 2-9
Product versus Period Costs
Two types of manufacturing costs:
Product costs:
Costs related to
inventory
Period costs:
Non-manufacturing
costs related to the firm
LO
2-2
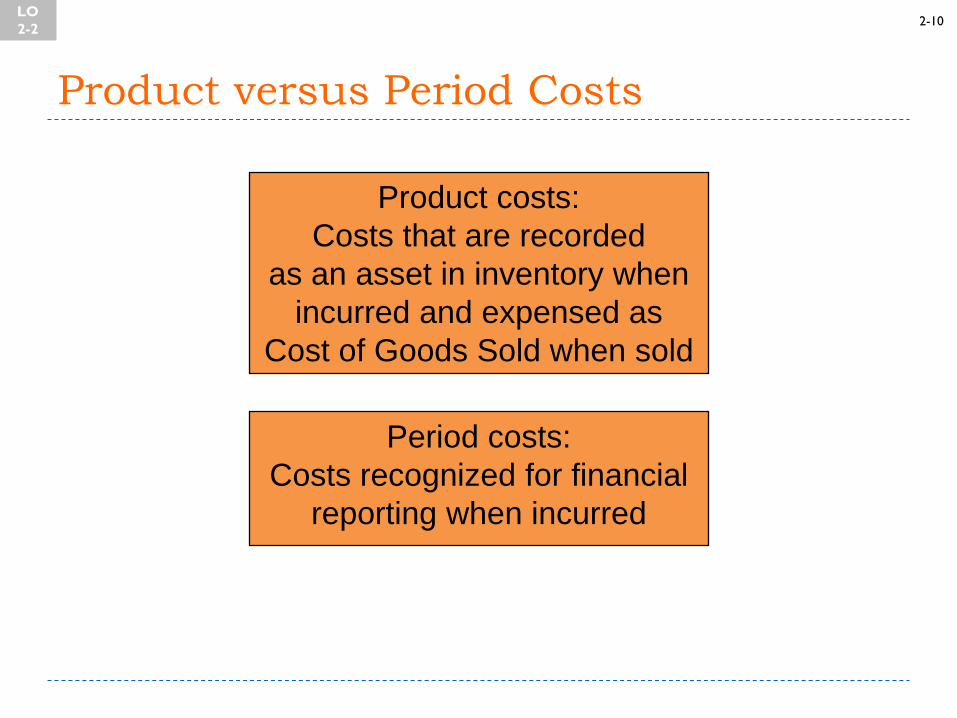
Full file at https://FratStock.eu 2-10
Product versus Period Costs
Product costs:
Costs that are recorded
as an asset in inventory when
incurred and expensed as
Cost of Goods Sold when sold
Period costs:
Costs recognized for financial
reporting when incurred
LO
2-2
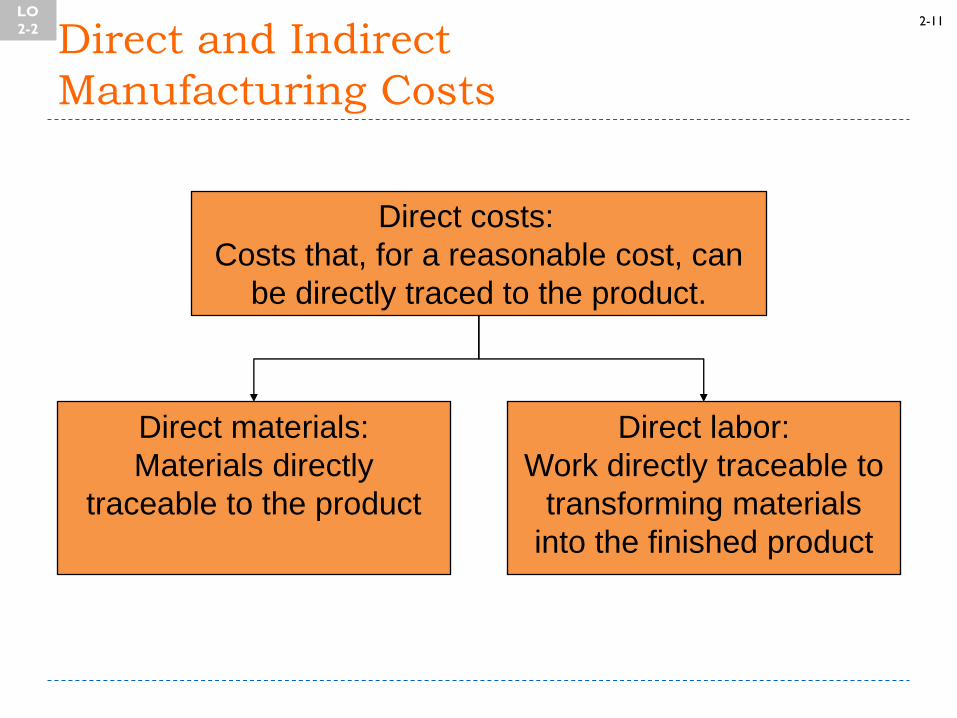
Full file at https://FratStock.eu 2-11
Direct and Indirect
Manufacturing Costs
Direct costs:
Costs that, for a reasonable cost, can
be directly traced to the product.
Direct materials:
Materials directly
traceable to the product
Direct labor:
Work directly traceable to
transforming materials
into the finished product
LO
2-2
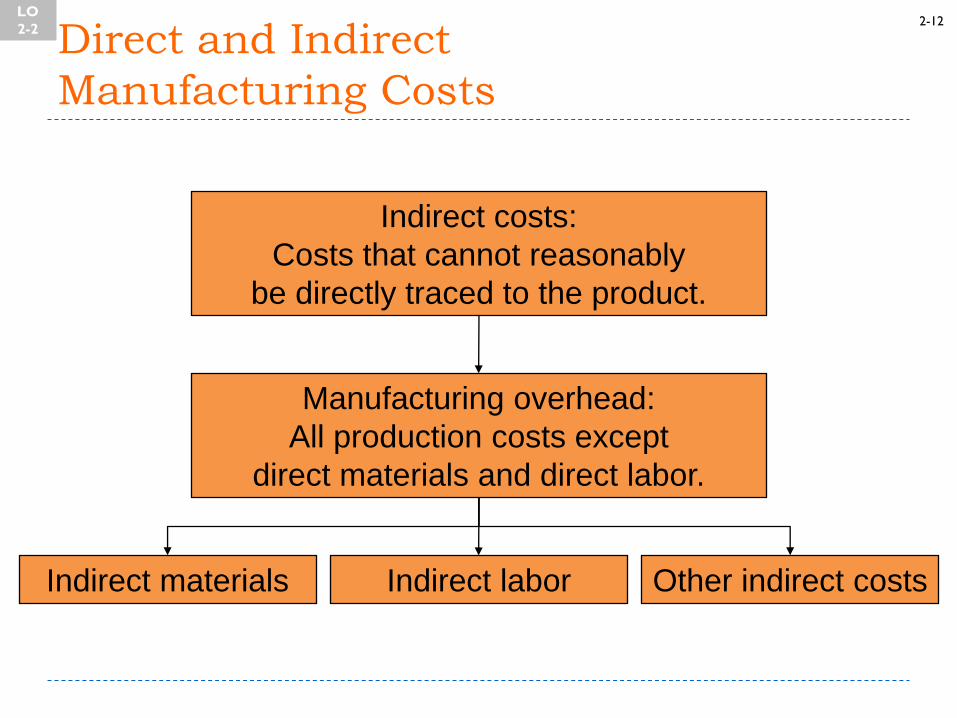
Full file at https://FratStock.eu 2-12
Direct and Indirect
Manufacturing Costs
Indirect costs:
Costs that cannot reasonably
be directly traced to the product.
Manufacturing overhead:
All production costs except
direct materials and direct labor.
Indirect materials Other indirect costs Indirect labor
LO
2-2
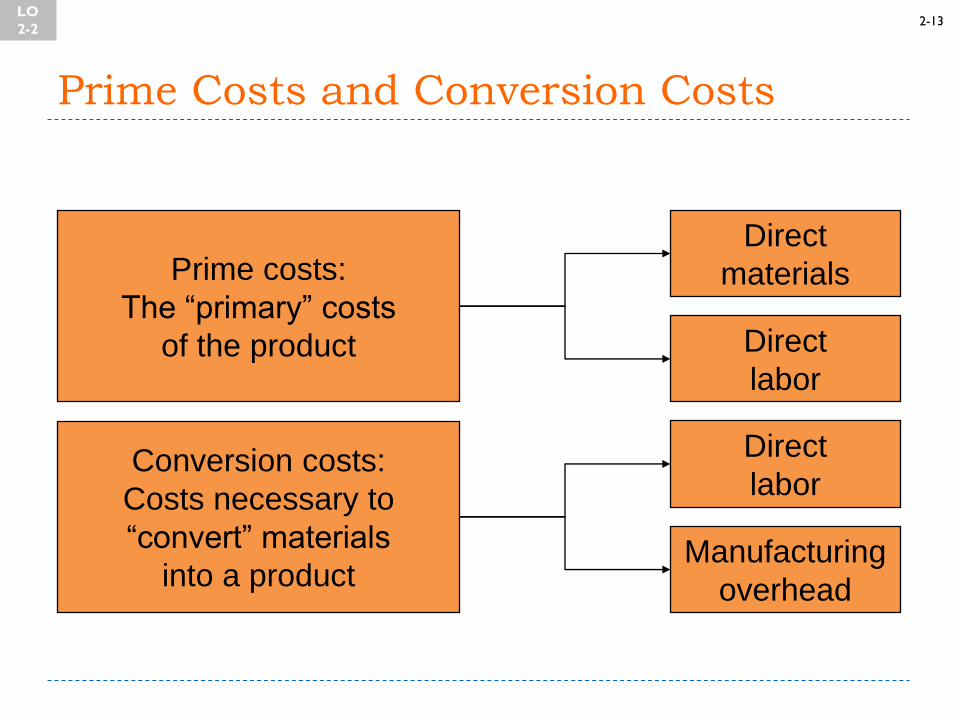
Full file at https://FratStock.eu 2-13
Prime Costs and Conversion Costs
Prime costs:
The “primary” costs
of the product
Conversion costs:
Costs necessary to
“convert” materials
into a product
Direct
materials
Direct
labor
Direct
labor
Manufacturing
overhead
LO
2-2
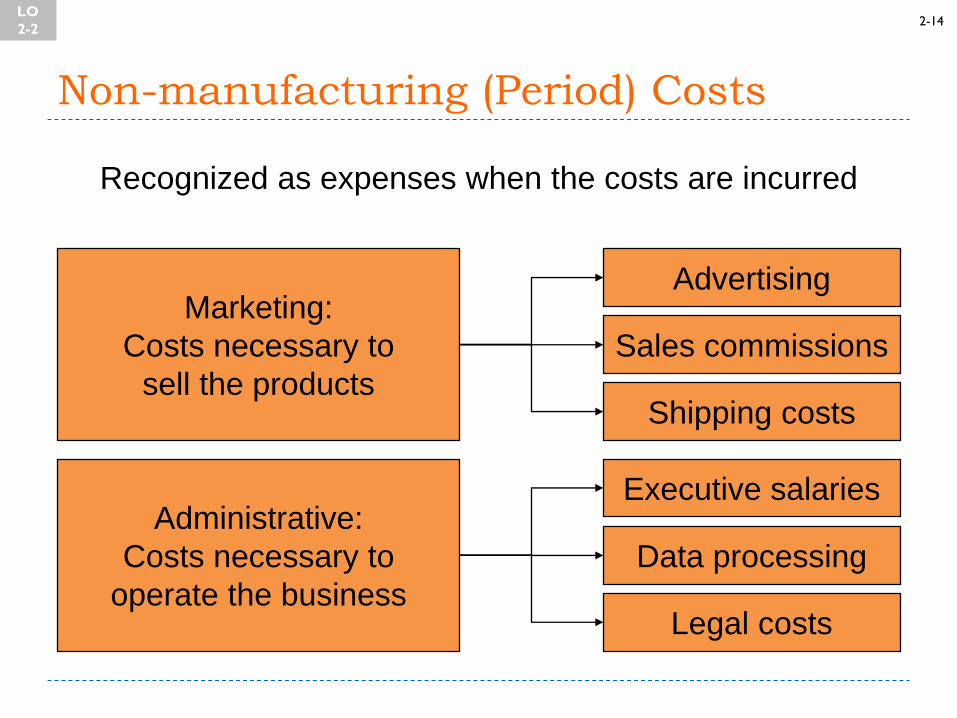
Full file at https://FratStock.eu 2-14
Non-manufacturing (Period) Costs
Recognized as expenses when the costs are incurred
Marketing:
Costs necessary to
sell the products
Administrative:
Costs necessary to
operate the business
Advertising
Sales commissions
Shipping costs
Executive salaries
Data processing
Legal costs
LO
2-2
Full file at https://FratStock.eu 2-15
Cost Allocation
LO 2-3 Explain the process of cost allocation.
It is the process of assigning indirect costs to
products, services, business units, etc.
LO
2-3
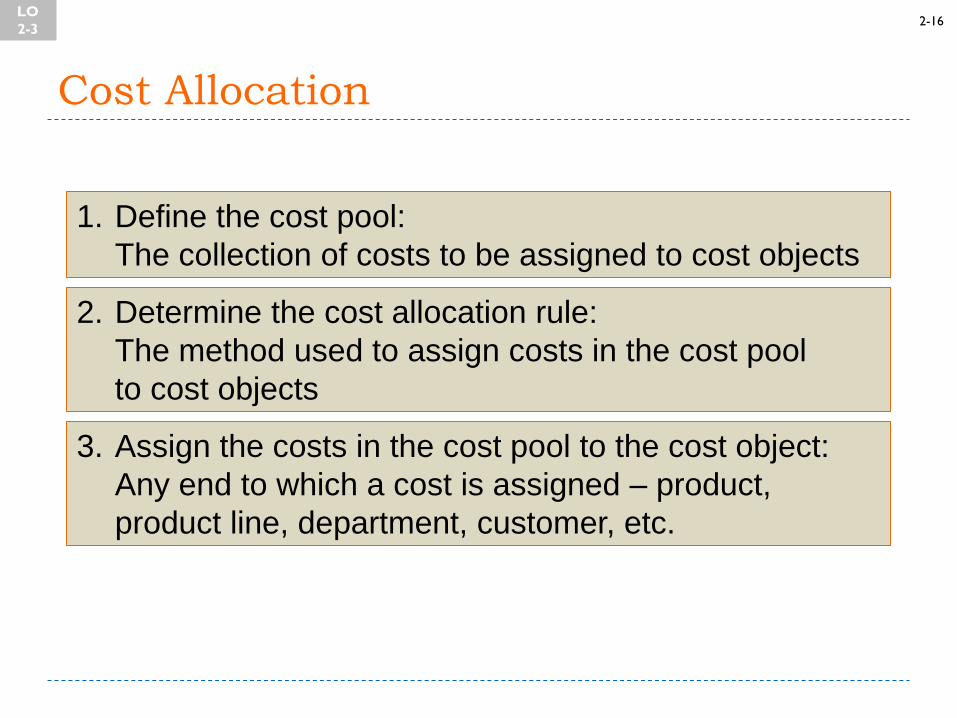
Full file at https://FratStock.eu 2-16
Cost Allocation
1. Define the cost pool:
The collection of costs to be assigned to cost objects
2. Determine the cost allocation rule:
The method used to assign costs in the cost pool
to cost objects
3. Assign the costs in the cost pool to the cost object:
Any end to which a cost is assigned – product,
product line, department, customer, etc.
LO
2-3
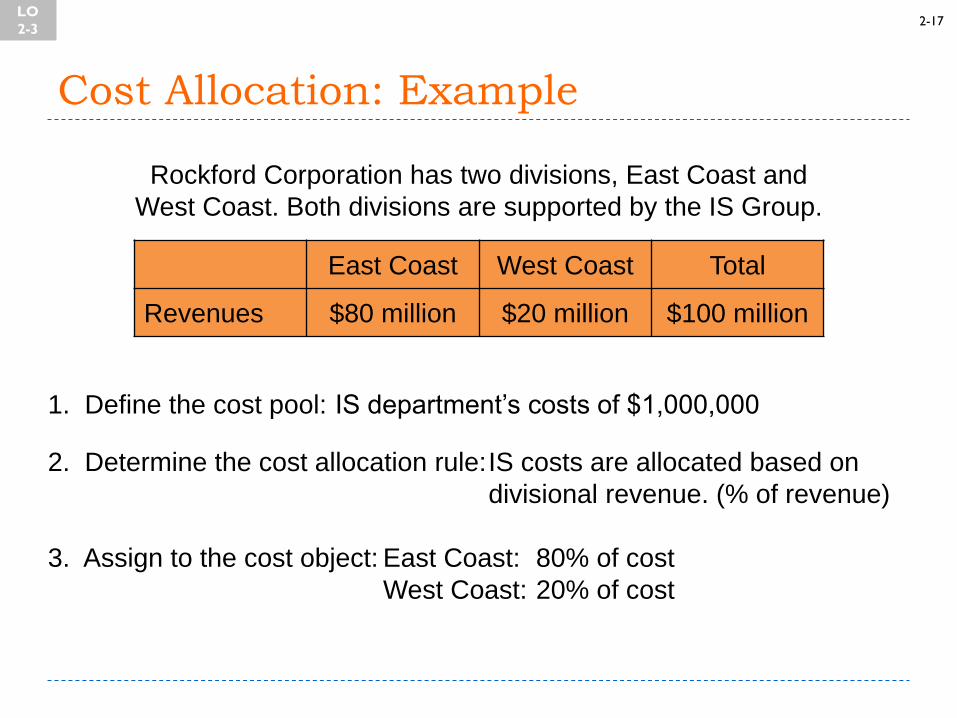
Full file at https://FratStock.eu 2-17
Cost Allocation: Example
Rockford Corporation has two divisions, East Coast and
West Coast. Both divisions are supported by the IS Group.
East Coast West Coast Total
Revenues $80 million $20 million $100 million
1. Define the cost pool: IS department’s costs of $1,000,000
2. Determine the cost allocation rule: IS costs are allocated based on
divisional revenue. (% of revenue)
3. Assign to the cost object: East Coast: 80% of cost
West Coast: 20% of cost
LO
2-3
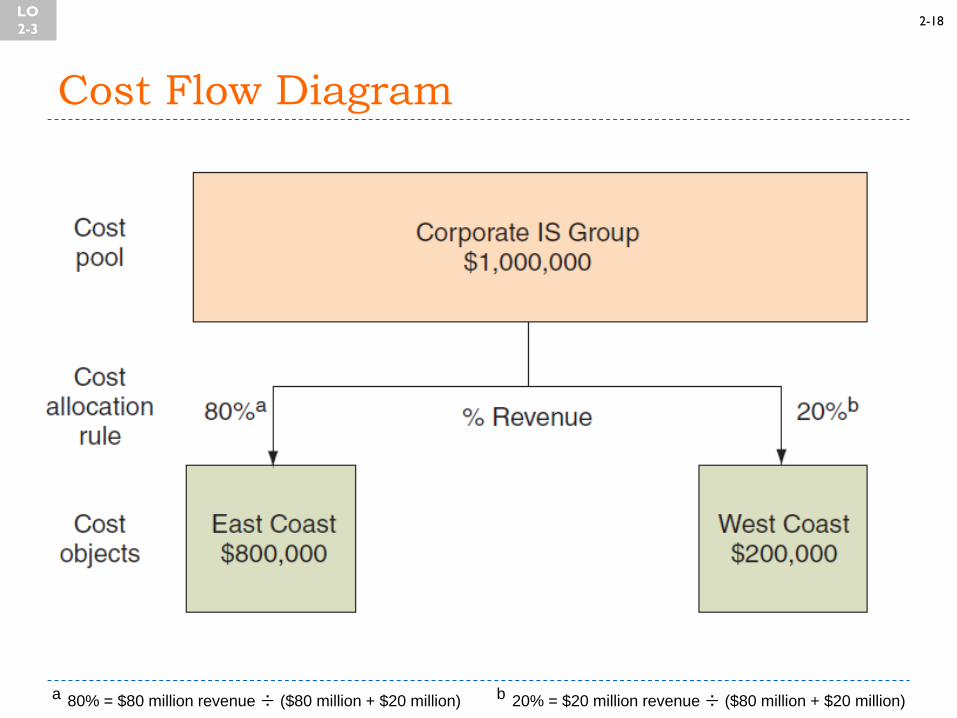
Full file at https://FratStock.eu 2-18
Cost Flow Diagram
LO
2-3
a 80% = $80 million revenue ÷ ($80 million + $20 million) b 20% = $20 million revenue ÷ ($80 million + $20 million)
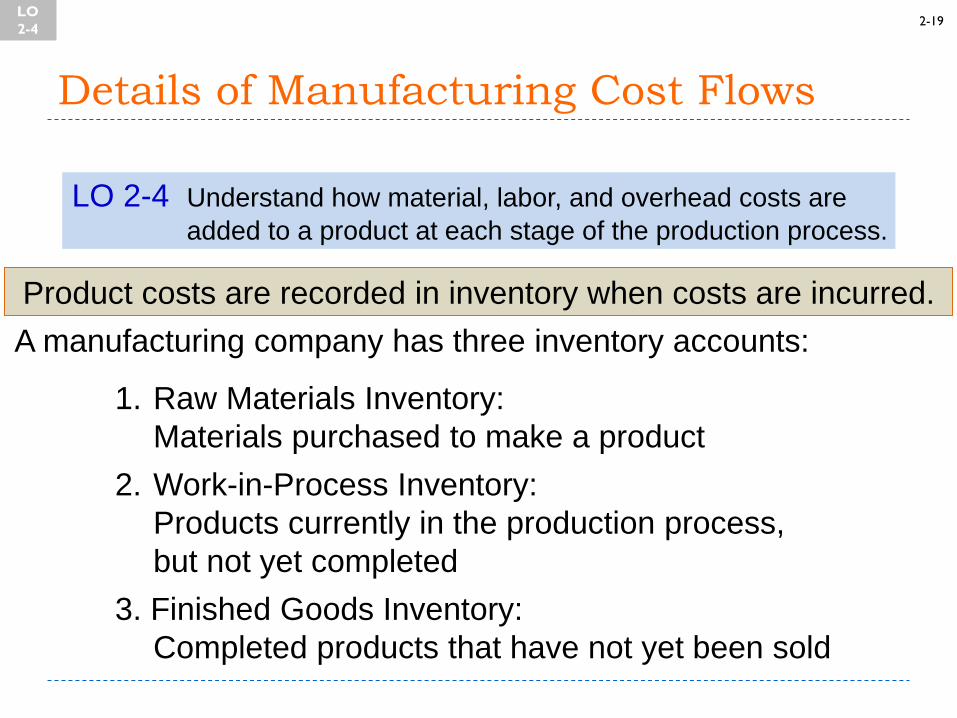
Full file at https://FratStock.eu 2-19
Details of Manufacturing Cost Flows
LO 2-4 Understand how material, labor, and overhead costs are
added to a product at each stage of the production process.
Product costs are recorded in inventory when costs are incurred.
A manufacturing company has three inventory accounts:
1. Raw Materials Inventory:
Materials purchased to make a product
2. Work-in-Process Inventory:
Products currently in the production process,
but not yet completed
3. Finished Goods Inventory:
Completed products that have not yet been sold
LO
2-4
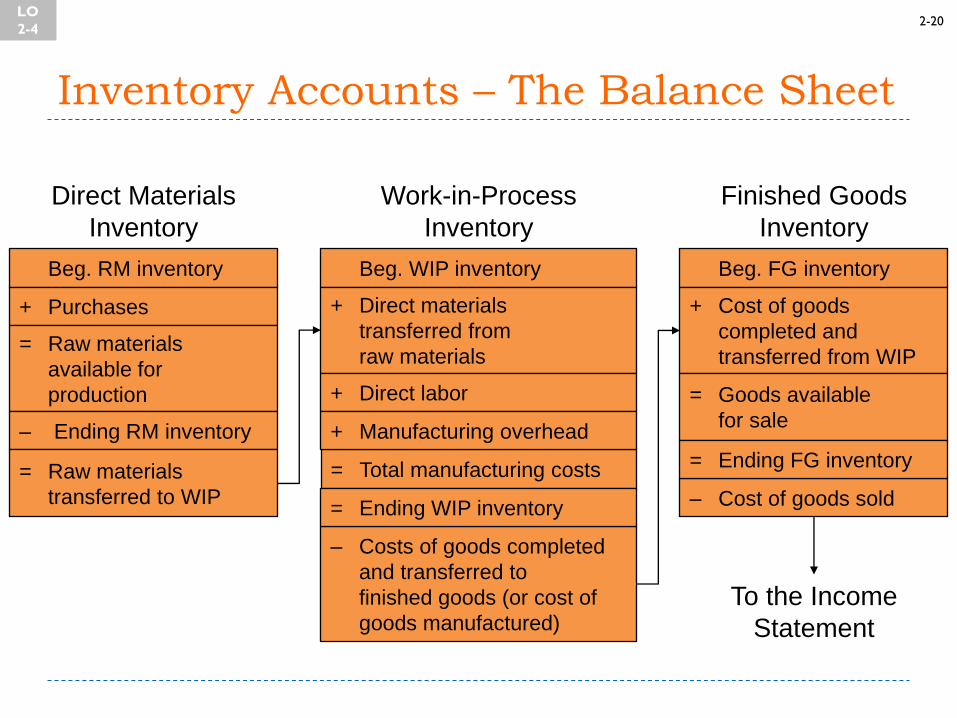
Full file at https://FratStock.eu 2-20
Inventory Accounts – The Balance Sheet
Beg. RM inventory
+ Purchases
= Raw materials
available for
production
– Ending RM inventory
= Raw materials
transferred to WIP
Direct Materials
Inventory
Beg. WIP inventory
+ Direct materials
transferred from
raw materials
+ Direct labor
= Total manufacturing costs
– Costs of goods completed
and transferred to
finished goods (or cost of
goods manufactured)
+ Manufacturing overhead
= Ending WIP inventory
Work-in-Process
Inventory
Beg. FG inventory
+ Cost of goods
completed and
transferred from WIP
= Goods available
for sale
– Cost of goods sold
= Ending FG inventory
Finished Goods
Inventory
To the Income
Statement
LO
2-4
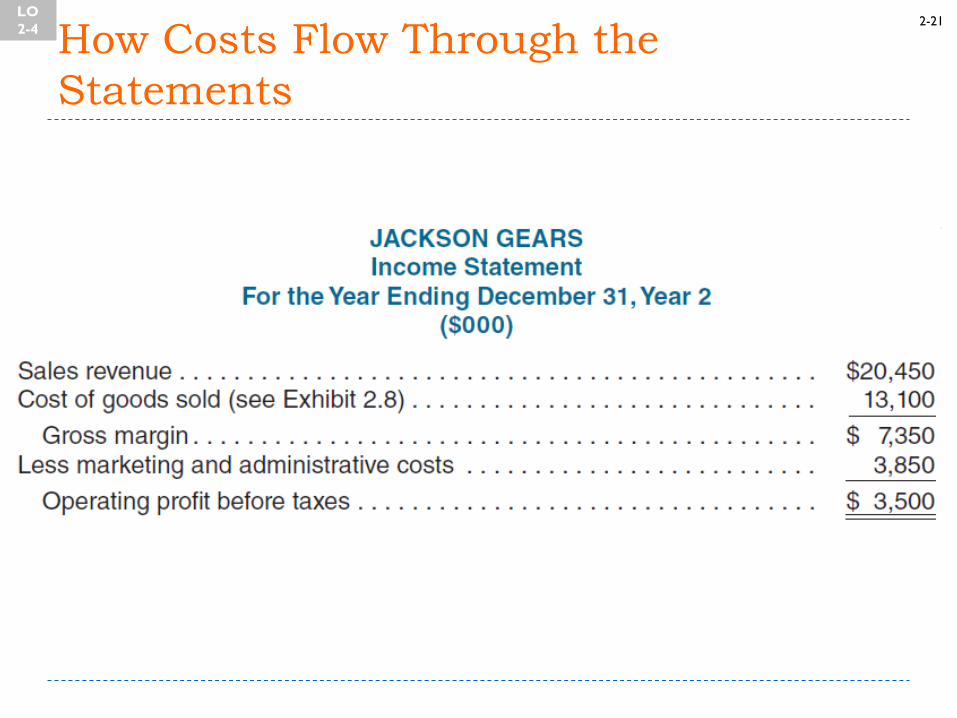
Full file at https://FratStock.eu 2-21
How Costs Flow Through the
Statements
LO
2-4
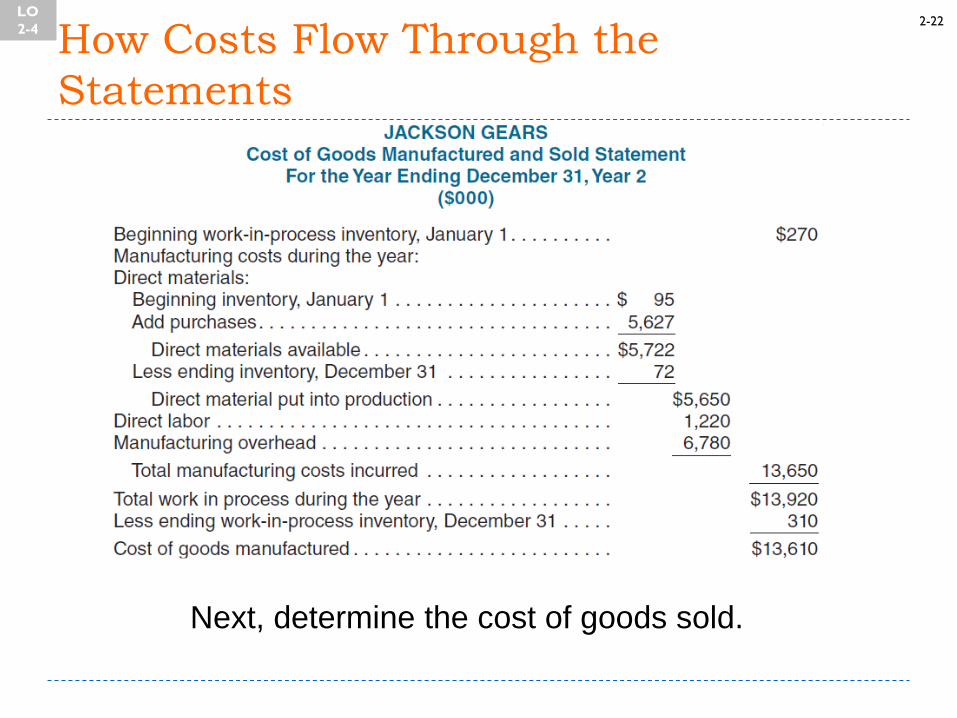
Full file at https://FratStock.eu 2-22
How Costs Flow Through the
Statements
LO
2-4
Next, determine the cost of goods sold.
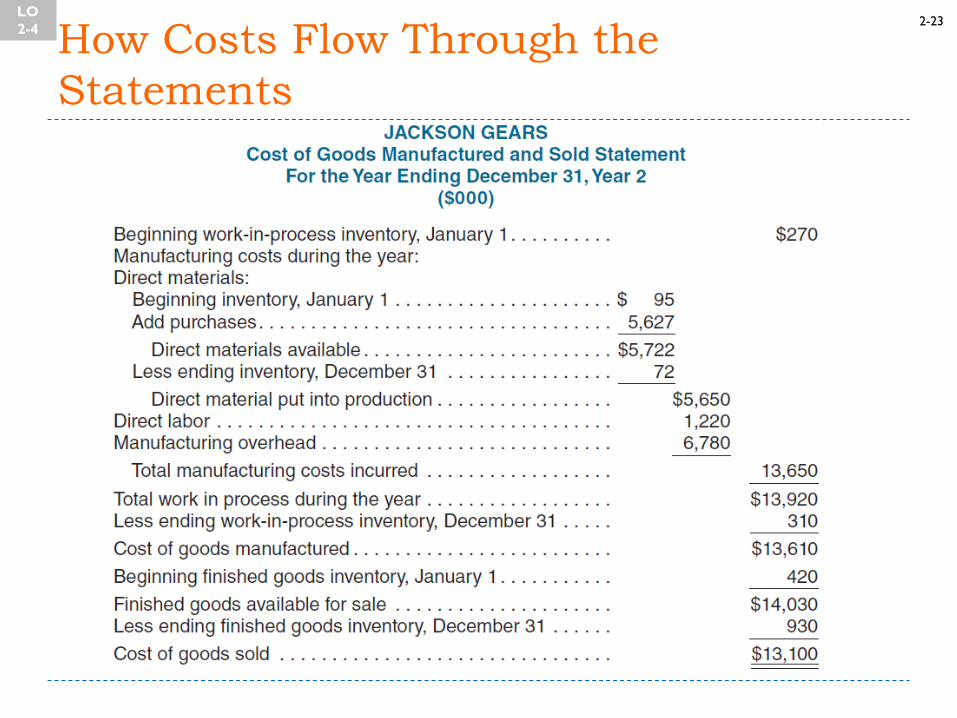
Full file at https://FratStock.eu 2-23
How Costs Flow Through the
Statements
LO
2-4
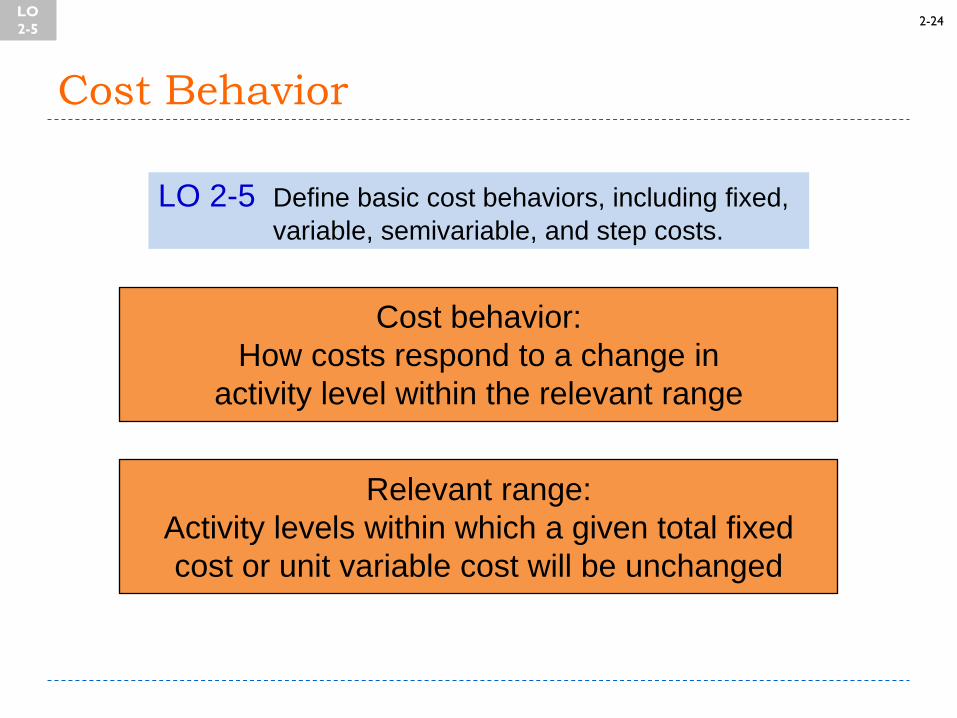
Full file at https://FratStock.eu 2-24
Cost Behavior
LO 2-5 Define basic cost behaviors, including fixed,
variable, semivariable, and step costs.
Cost behavior:
How costs respond to a change in
activity level within the relevant range
Relevant range:
Activity levels within which a given total fixed
cost or unit variable cost will be unchanged
LO
2-5
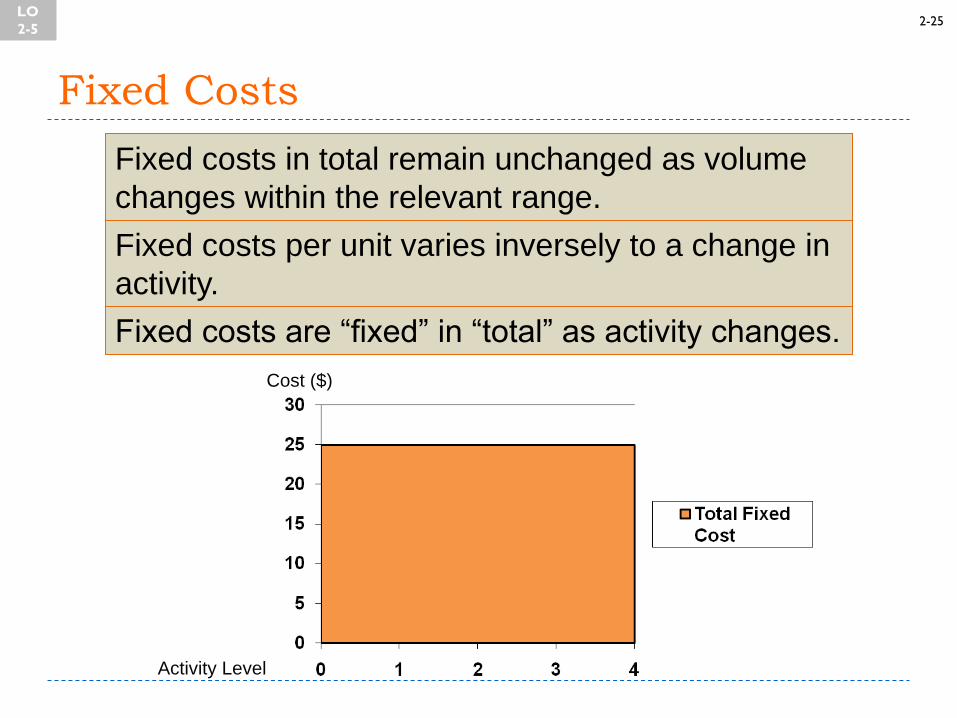
Full file at https://FratStock.eu 2-25
Fixed Costs
Cost ($)
Activity Level
Fixed costs in total remain unchanged as volume
changes within the relevant range.
Fixed costs per unit varies inversely to a change in
activity.
Fixed costs are “fixed” in “total” as activity changes.
LO
2-5
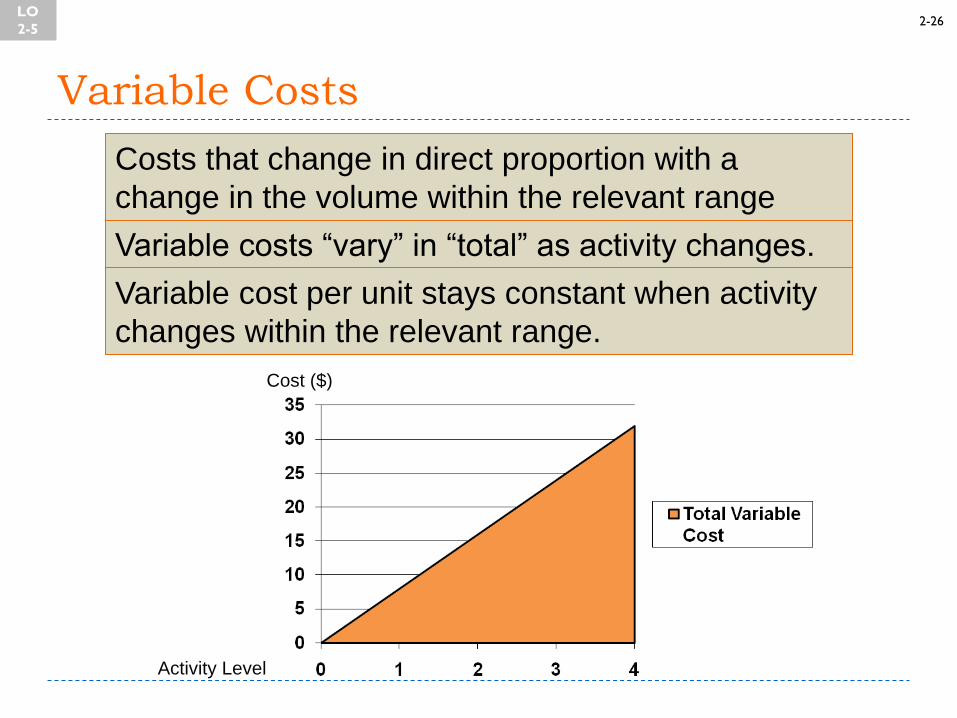
Full file at https://FratStock.eu 2-26
Variable Costs
Costs that change in direct proportion with a
change in the volume within the relevant range
Variable costs “vary” in “total” as activity changes.
Variable cost per unit stays constant when activity
changes within the relevant range.
Cost ($)
Activity Level
LO
2-5
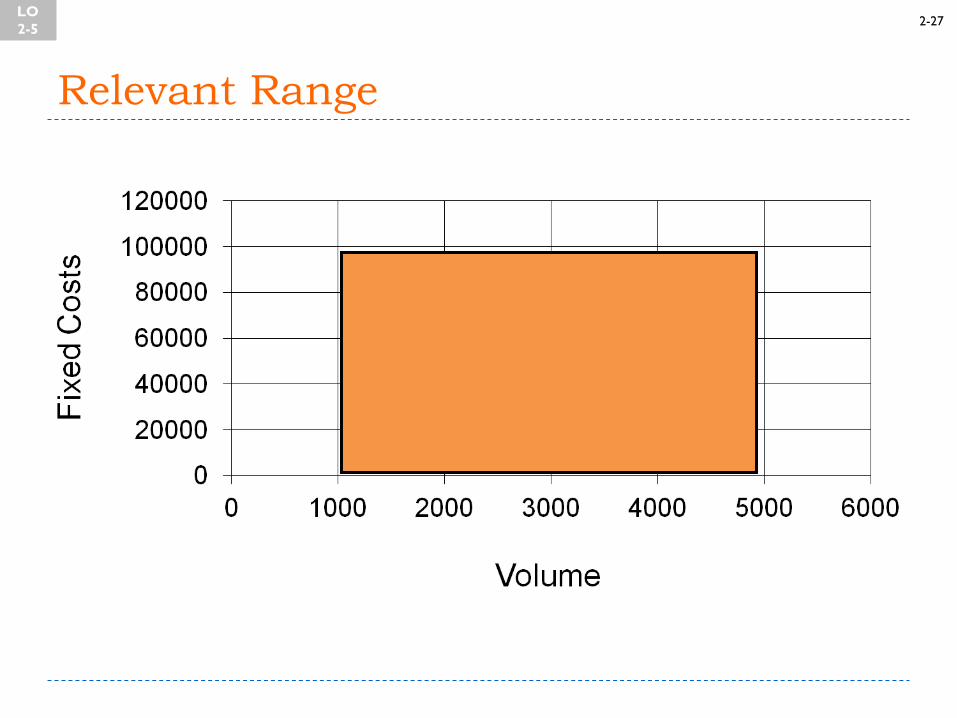
Full file at https://FratStock.eu 2-27
Relevant Range
LO
2-5
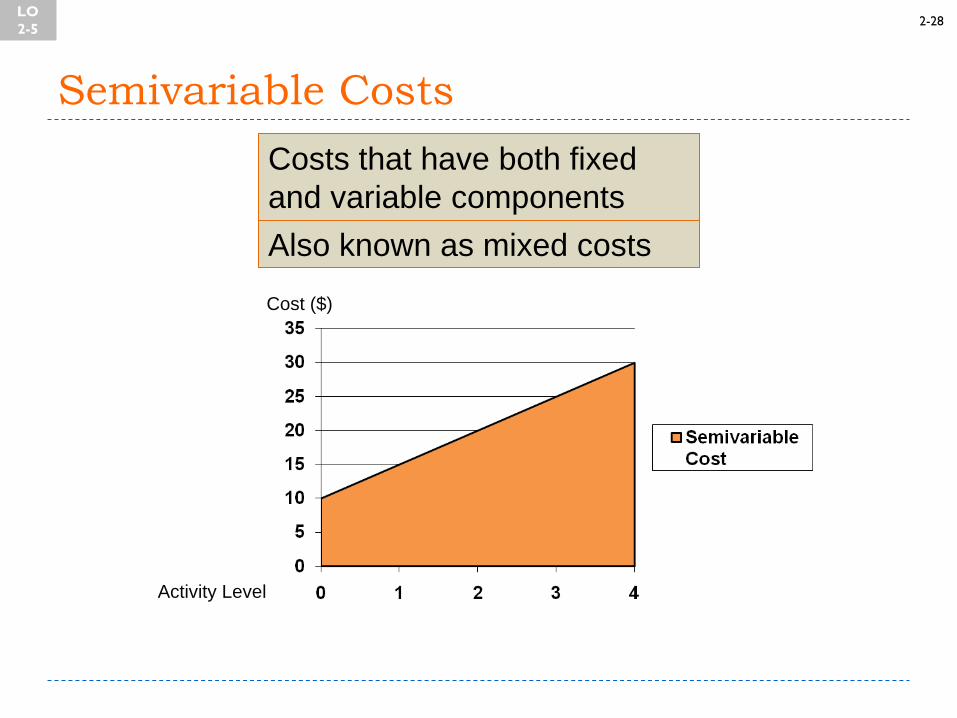
Full file at https://FratStock.eu 2-28
Semivariable Costs
Cost ($)
Activity Level
Costs that have both fixed
and variable components
Also known as mixed costs
LO
2-5
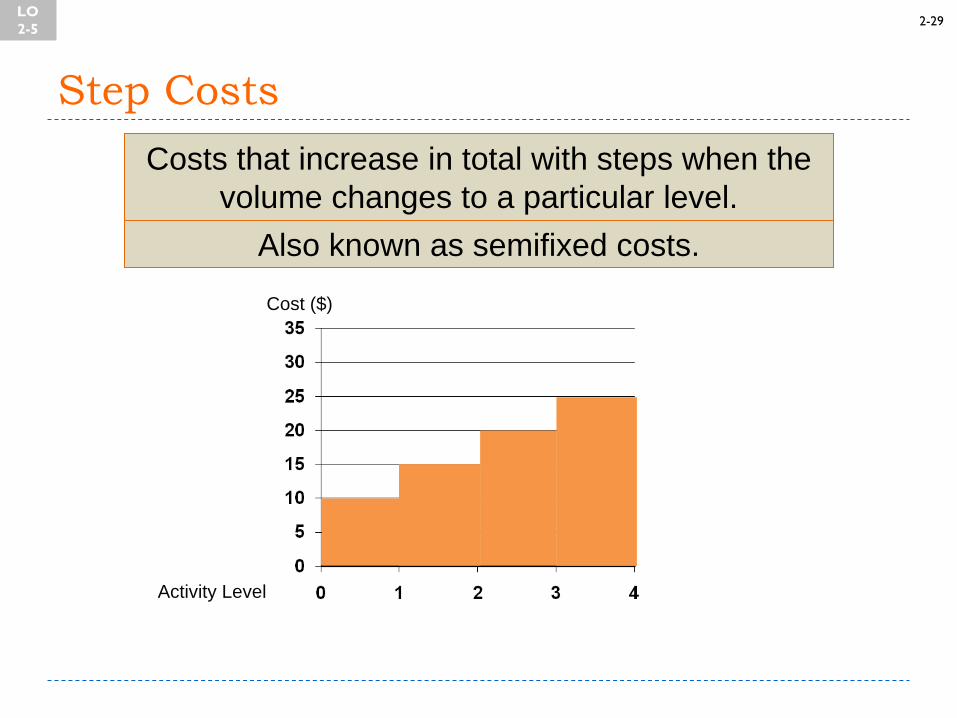
Full file at https://FratStock.eu 2-29
Step Costs
Costs that increase in total with steps when the
volume changes to a particular level.
Also known as semifixed costs.
Cost ($)
Activity Level
LO
2-5
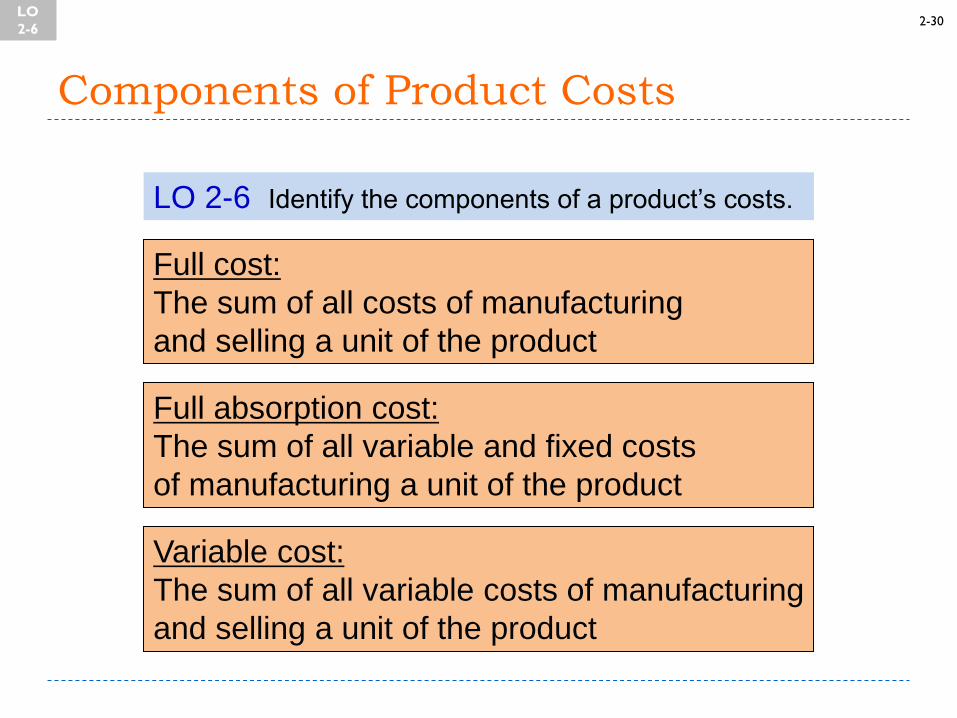
Full file at https://FratStock.eu 2-30
Components of Product Costs
LO 2-6 Identify the components of a product’s costs.
Full cost:
The sum of all costs of manufacturing
and selling a unit of the product
Full absorption cost:
The sum of all variable and fixed costs
of manufacturing a unit of the product
Variable cost:
The sum of all variable costs of manufacturing
and selling a unit of the product
LO
2-6
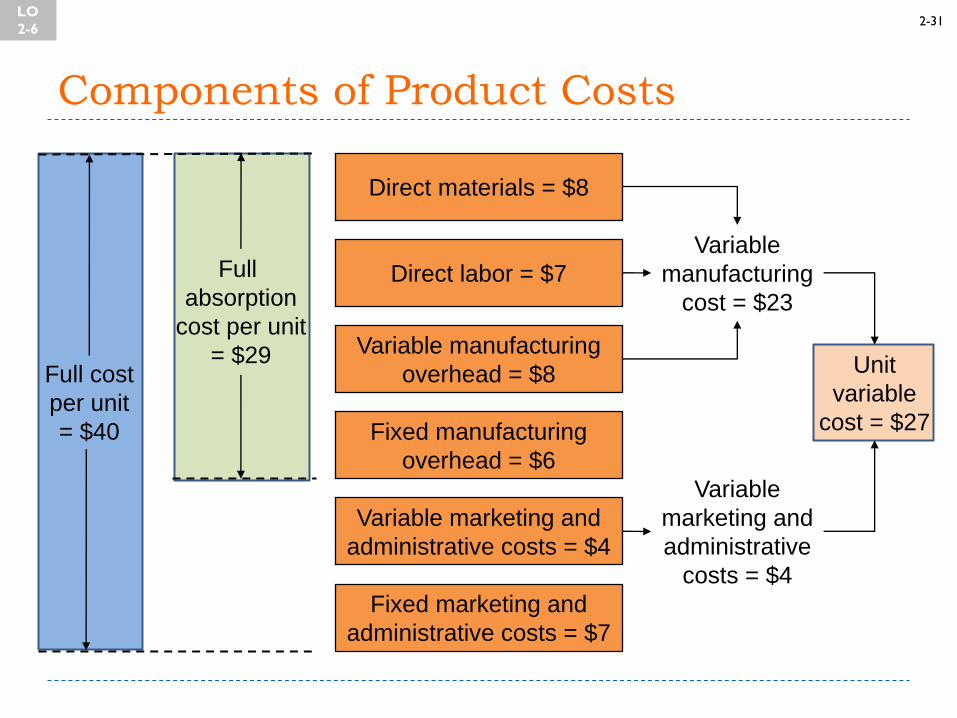
Full file at https://FratStock.eu 2-31
Components of Product Costs
Direct materials = $8
Direct labor = $7
Variable manufacturing
overhead = $8
Fixed manufacturing
overhead = $6
Variable marketing and
administrative costs = $4
Fixed marketing and
administrative costs = $7
Full cost
per unit
= $40
Full
absorption
cost per unit
= $29
Variable
manufacturing
cost = $23
Unit
variable
cost = $27
Variable
marketing and
administrative
costs = $4
LO
2-6
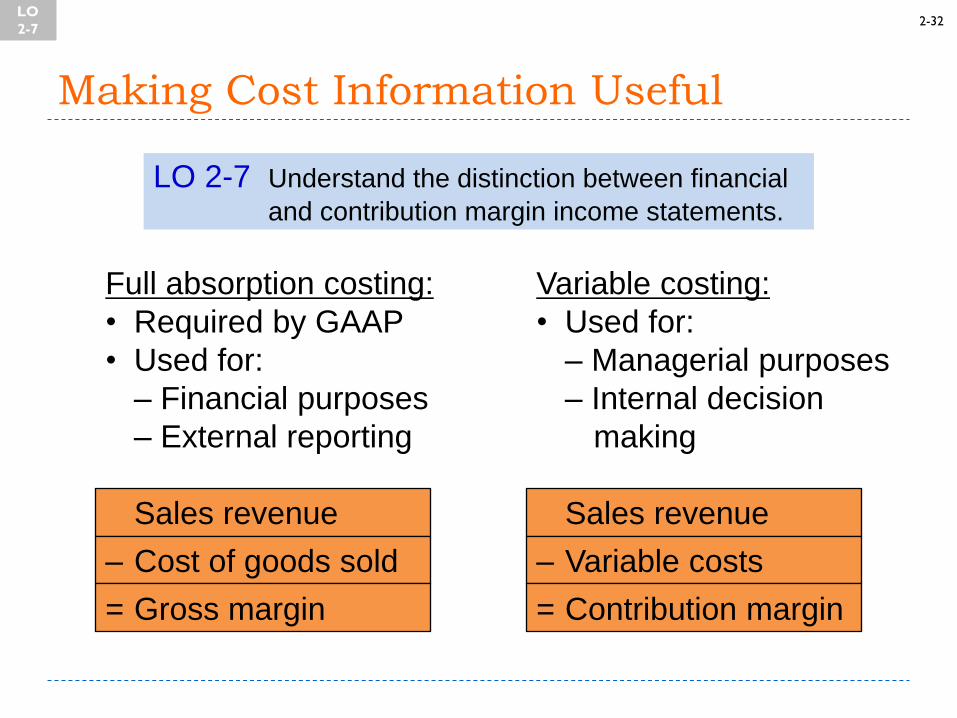
Full file at https://FratStock.eu 2-32
Making Cost Information Useful
LO 2-7 Understand the distinction between financial
and contribution margin income statements.
Full absorption costing:
• Required by GAAP
• Used for:
– Financial purposes
– External reporting
Variable costing:
• Used for:
– Managerial purposes
– Internal decision
making
Sales revenue
– Cost of goods sold
= Gross margin
Sales revenue
– Variable costs
= Contribution margin
LO
2-7
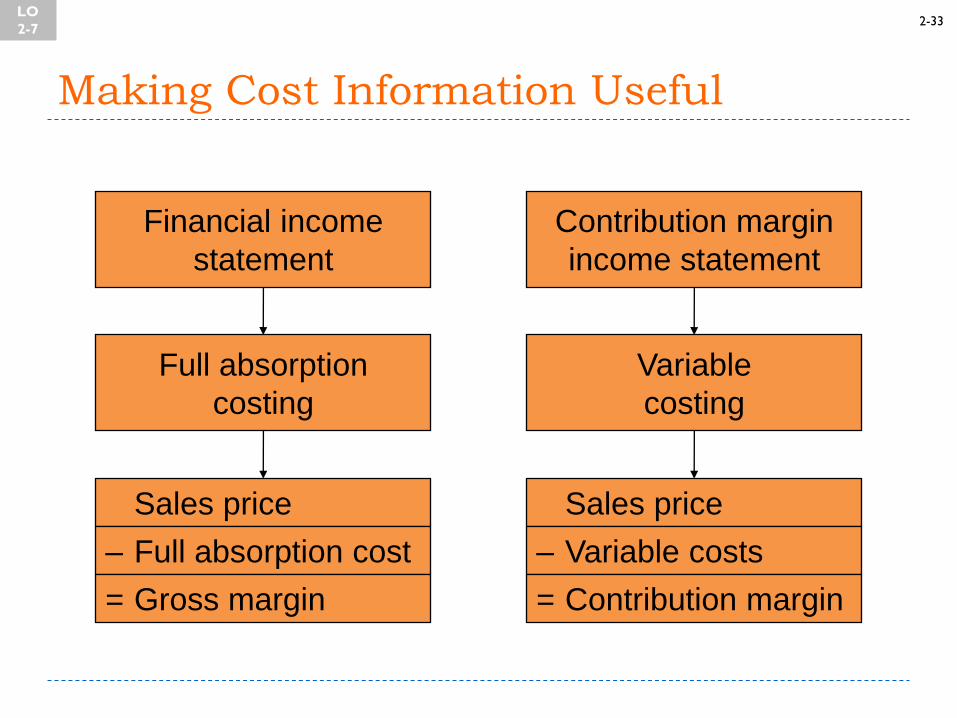
Full file at https://FratStock.eu 2-33
Making Cost Information Useful
Financial income
statement
Full absorption
costing
Sales price
– Full absorption cost
= Gross margin
Variable
costing
Contribution margin
income statement
Sales price
– Variable costs
= Contribution margin
LO
2-7
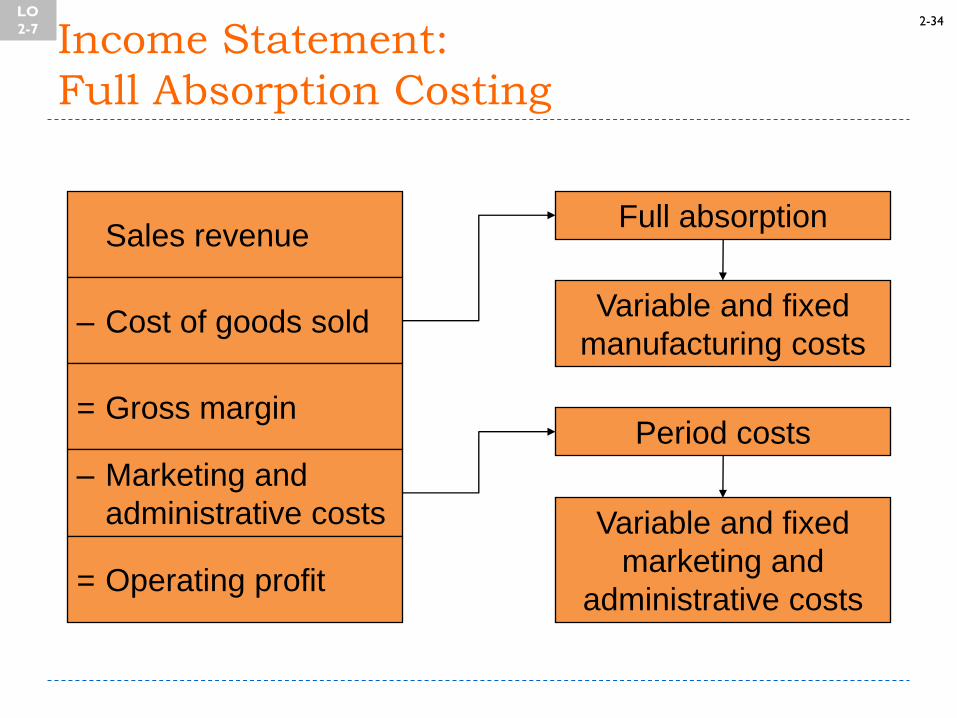
Full file at https://FratStock.eu 2-34
Income Statement:
Full Absorption Costing
Sales revenue
– Cost of goods sold
= Gross margin
– Marketing and
administrative costs
= Operating profit
Full absorption
Variable and fixed
manufacturing costs
Period costs
Variable and fixed
marketing and
administrative costs
LO
2-7
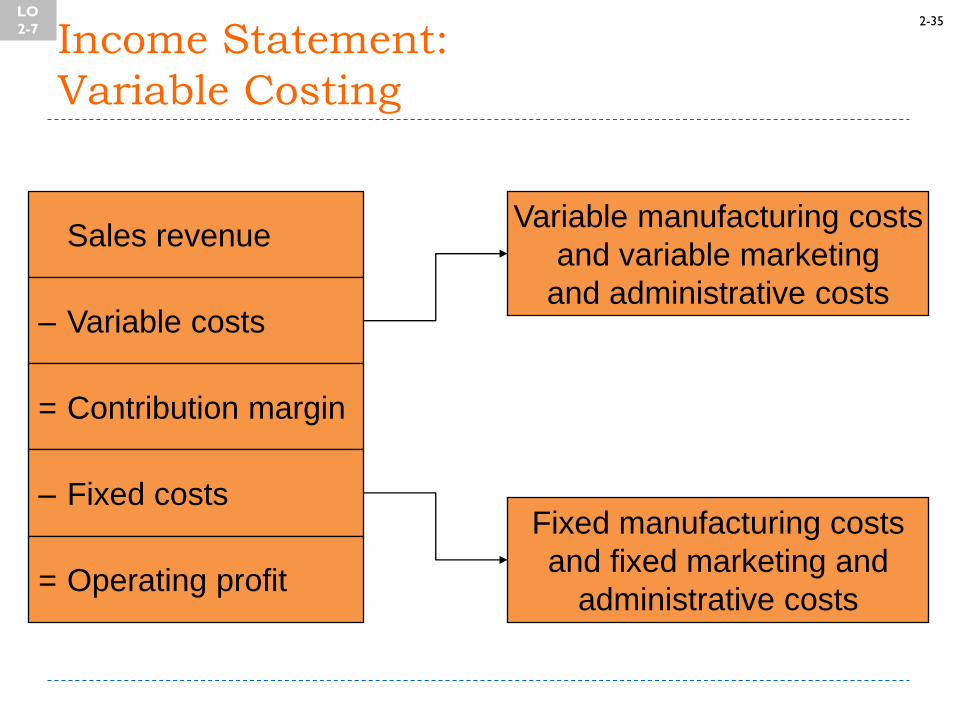
Full file at https://FratStock.eu 2-35
Income Statement:
Variable Costing
Sales revenue
– Variable costs
= Contribution margin
– Fixed costs
= Operating profit
Variable manufacturing costs
and variable marketing
and administrative costs
Fixed manufacturing costs
and fixed marketing and
administrative costs
LO
2-7
Full file at https://FratStock.eu 2-36
End of Chapter 2
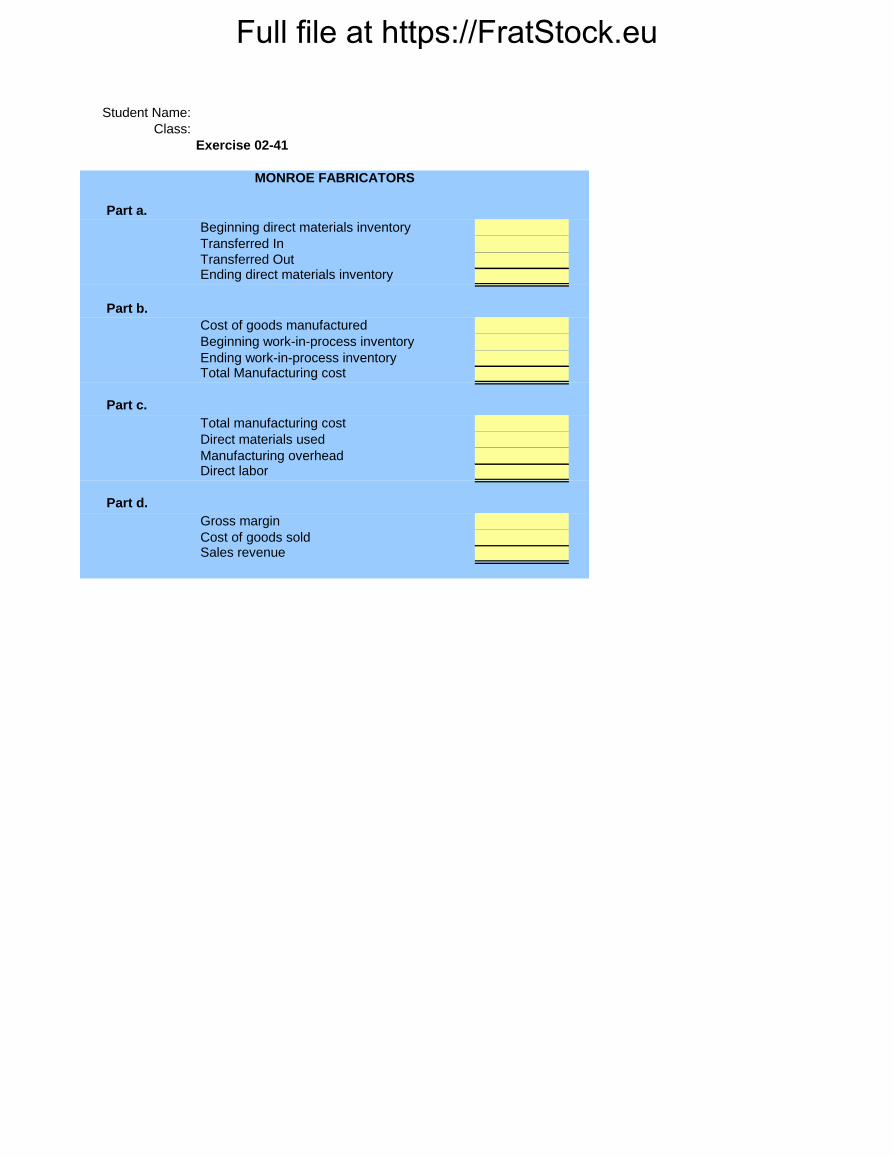
Full file at https://FratStock.eu
Student Name:
Class:
Part a.
Part b.
Part c.
Direct materials used
Part d.
Cost of goods soldSales revenue
Transferred Out
Transferred In
Direct laborManufacturing overhead
Total manufacturing cost
Total Manufacturing cost
Beginning work-in-process inventory
Cost of goods manufactured
Ending direct materials inventory
Gross margin
Beginning direct materials inventory
MONROE FABRICATORS
Ending work-in-process inventory
Exercise 02-41

Full file at https://FratStock.eu
7,800$
a. ?
8,100
11,400
5,700
900
48,300
163,350
b. ?
168,150
147,750
c. ?
43,800
41,400
d. ?
Given Data E02-41:
MONROE FABRICATORS
Direct materials inventory, January 1
Sales revenue
Manufacturing overhead
Direct materials used
Direct labor
Gross margin
Cost of goods sold
Total manufacturing cost
Cost of goods manufactured during the year
Work-in-process inventory, January 1
Direct materials inventory, December 31
Purchases of direct materials
Finished goods inventory, December 31
Finished goods inventory, January 1
Work-in-process inventory, December 31
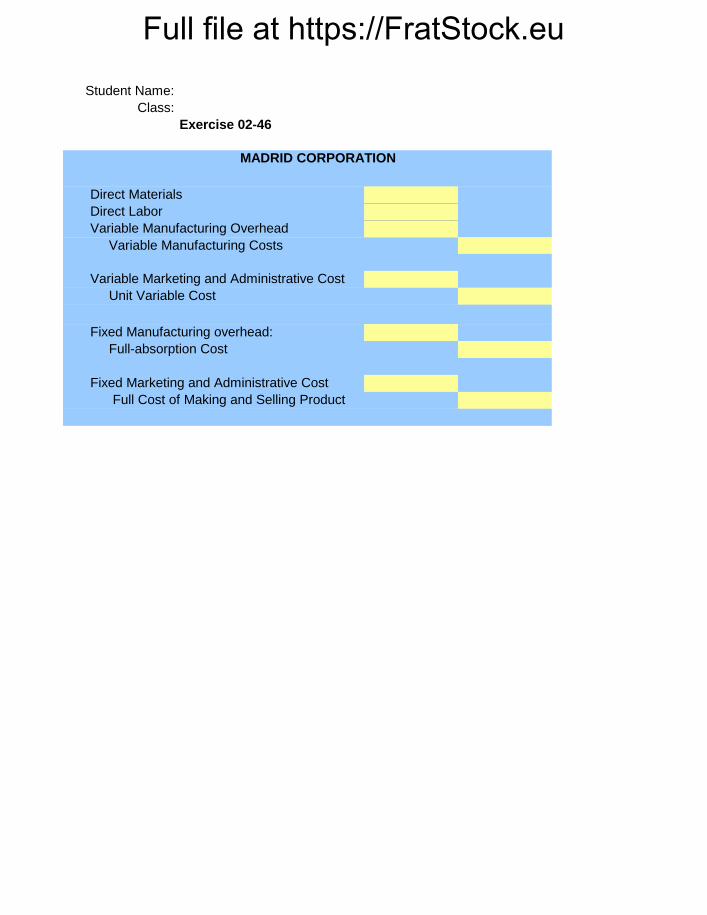
Full file at https://FratStock.eu
Student Name:
Class:
MADRID CORPORATION
Exercise 02-46
Direct Materials
Direct Labor
Variable Manufacturing Overhead
Variable Manufacturing Costs
Variable Marketing and Administrative Cost
Unit Variable Cost
Fixed Manufacturing overhead:
Full-absorption Cost
Fixed Marketing and Administrative Cost
Full Cost of Making and Selling Product

Full file at https://FratStock.eu

Full file at https://FratStock.eu
900$
108,000$
162,000$
18$
270$
60$
165$
1,800 Units produced and sold (for the month)
Direct labor
Manufacturing overhead
Direct materials
Given Data E02-46:
Information provided by accounting system:
Fixed costs (for the month)
Sales price (per unit)
Marketing and administrative
MADRID CORPORATION
Variable costs (per unit)
Manufacturing overhead
Marketing and administrative
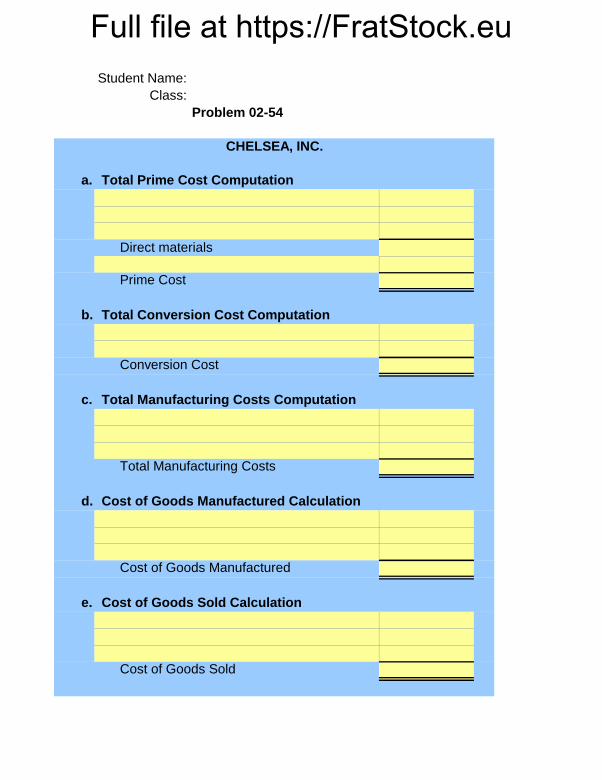
Full file at https://FratStock.euStudent Name:
Class:
a.
b.
c.
d.
e.
Prime Cost
Direct materials
Total Conversion Cost Computation
Cost of Goods Sold
Cost of Goods Manufactured Calculation
Cost of Goods Sold Calculation
Cost of Goods Manufactured
Problem 02-54
Total Manufacturing Costs
CHELSEA, INC.
Total Prime Cost Computation
Conversion Cost
Total Manufacturing Costs Computation

Full file at https://FratStock.eu
9,000$
7,500
4,500
3,000
27,000
36,000
120,000
96,000
126,000
Given Data P02-54:
Information provided by accounting records:
Manufacturing overhead, May
Direct materials purchased during May
Direct labor costs, May
Work-in-process inventory, May 1
Work-in-process inventory, May 31
Finished goods inventory, May 1
Finished goods inventory, May 31
CHELSEA, INC.
Direct materials inventory, May 1
Direct materials inventory, May 31
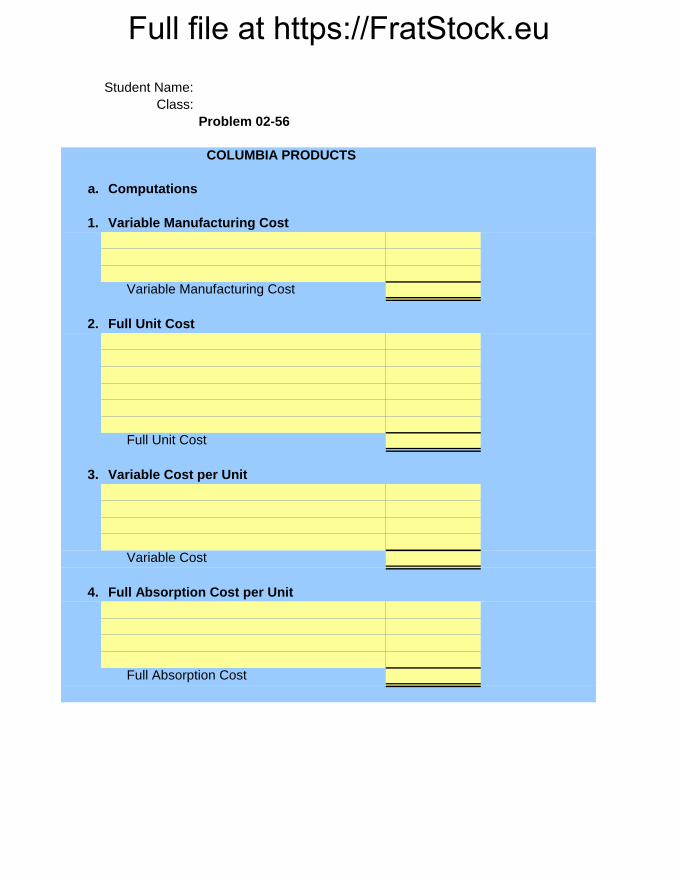
Full file at https://FratStock.euStudent Name:
Class:
a. Computations
1.
2.
3.
4.
Variable Manufacturing Cost
Full Absorption Cost
Variable Manufacturing Cost
Full Unit Cost
Full Unit Cost
Variable Cost per Unit
Full Absorption Cost per Unit
Variable Cost
Problem 02-56
COLUMBIA PRODUCTS
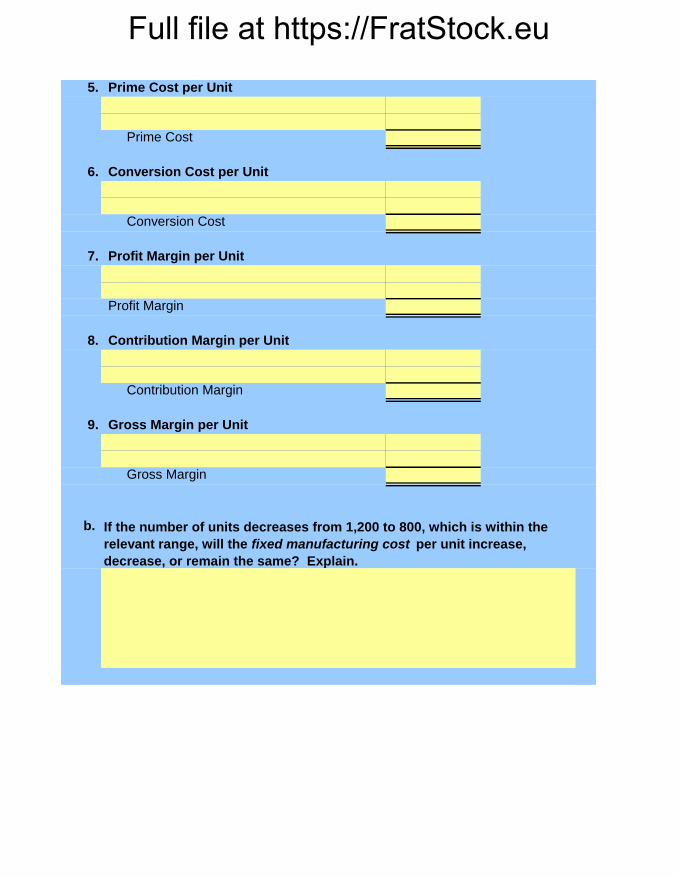
Full file at https://FratStock.eu5.
6.
7.
8.
9.
b. If the number of units decreases from 1,200 to 800, which is within the
relevant range, will the fixed manufacturing cost per unit increase,
decrease, or remain the same? Explain.
Prime Cost
Prime Cost per Unit
Profit Margin
Conversion Cost per Unit
Gross Margin
Gross Margin per Unit
Contribution Margin
Profit Margin per Unit
Conversion Cost
Contribution Margin per Unit
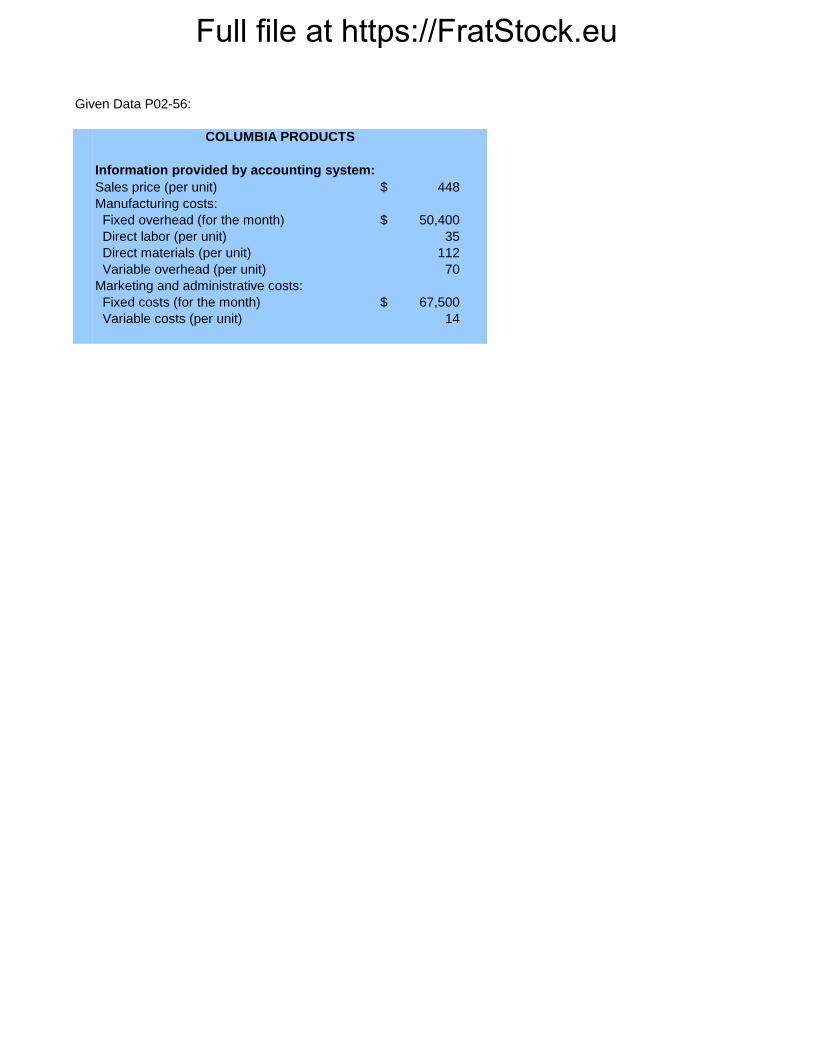
Full file at https://FratStock.eu
448$
Manufacturing costs:
50,400$
35
112
70
67,500$
14
Information provided by accounting system:
Variable overhead (per unit)
Given Data P02-56:
Fixed costs (for the month)
Variable costs (per unit)
Direct labor (per unit)
Direct materials (per unit)
Marketing and administrative costs:
COLUMBIA PRODUCTS
Sales price (per unit)
Fixed overhead (for the month)
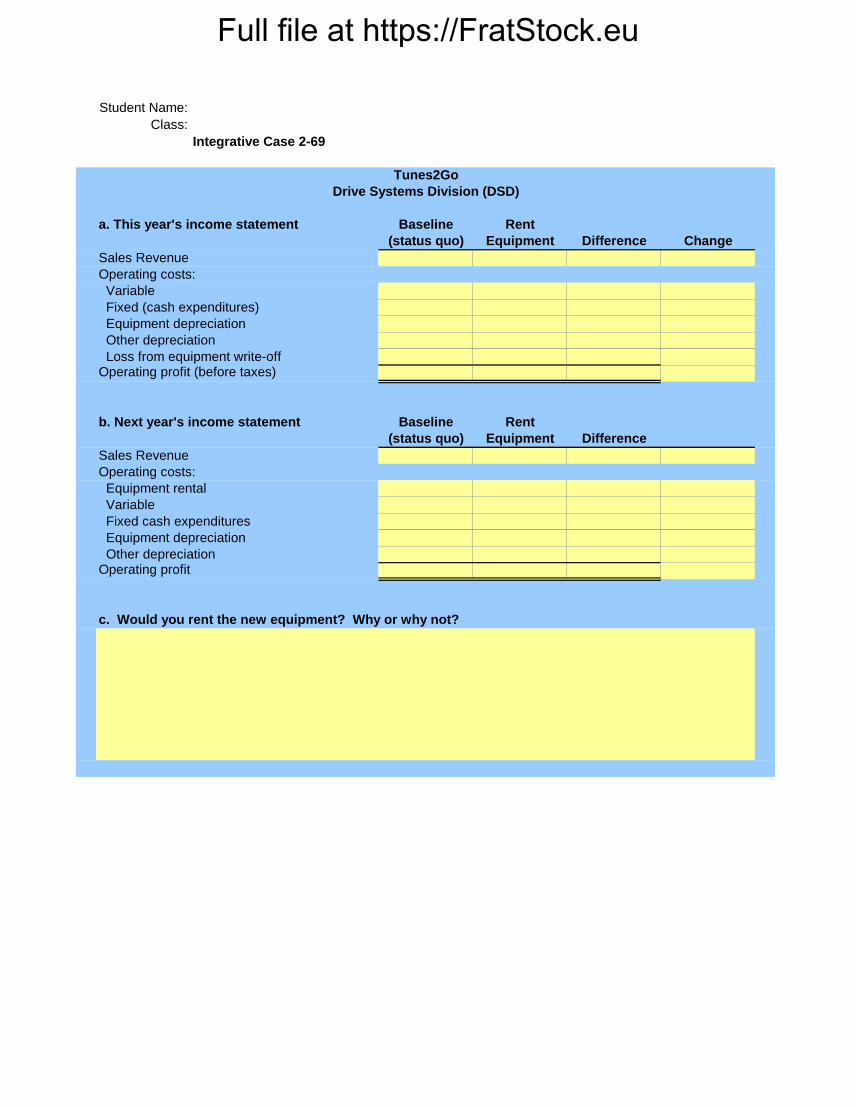
Full file at https://FratStock.eu
Student Name:
Class:
Baseline Rent
(status quo) Equipment Difference Change
Baseline Rent
(status quo) Equipment Difference
Drive Systems Division (DSD)
Tunes2Go
Other depreciation
Equipment depreciation
Fixed cash expenditures
Variable
Equipment rental
Operating costs:
Sales Revenue
c. Would you rent the new equipment? Why or why not?
b. Next year's income statement
Operating profit
Operating profit (before taxes) Loss from equipment write-off
Other depreciation
Equipment depreciation
Fixed (cash expenditures)
Variable
Operating costs:
Sales Revenue
Integrative Case 2-69
a. This year's income statement

Full file at https://FratStock.eu
3,000,000$
690,000$
7%
6%
4,800,000$
600,000
2,250,000
450,000
375,000
Variable operating costs
Fixed operating costs
Equipment depreciation
Other depreciation
No salvage value
Given Data IC2-69:
Revenue and expense estimates without new machine:
Sales revenue
Tunes2Go
Percentage decrease in fixed cash expenditures
Percentage increase in DSD's annual revenue
Annual rental charge for new testing machine
Cost of existing automated testing equipment
Drive Systems Division (DSD)