Embed Size (px)
DESCRIPTION
Slug flow in S-shaped risers . Studies on slug flow in S-risers: LedaFlow simulations and experiments. Mahnaz Esmaeilpour. Supervisor: Sigurd Skogestad Co-supervisor: Esmaeil Jahansahi. Overview. 1- Introduction - PowerPoint PPT Presentation
Citation preview
Slug flow in S-shaped risers
Supervisor: Sigurd Skogestad
Co-supervisor: Esmaeil Jahansahi
Studies on slug flow in S-risers: LedaFlow simulations and
experimentsMahnaz Esmaeilpour

Overview1- Introduction
2- Experiments
3- LedaFlow Simulations
4- Comparing Simulations and Experiments

1. IntroductionSlug flow in S-shaped risers
4 different flow regimes
Stable flow Transitional flow (TTS)
Severe Slugging II Severe Slugging I (SSI)

2. ExperimentsSetup
SensorsPressure sensors Acoustic sensor

2. Experiments (contd)
• Step change test in stable region
• Series of tests with different Usl’s and Usg’s to make related flow regime map
• Series of tests with different valve positions to make the bifurcation diagram

Usl = 0.2 [m/s] Usg = 1 [m/s]
2. Experiments (contd)
Step change test in stable region

Step change test in stable regionFFT of acoustic signal
2. Experiments (contd)

2. Experiments (contd)
Flow regime map
• 70 points of different gas & liquid superficial velocities
• Choke valve was fully open (100 % of valve opening)
0 1 2 3 4 5 60
0.1
0.2
0.3
0.4
0.5
0.6
0.7
0.8
0.9Experimental Flow Regime Map
SS1
SS2
TTS
STABLE
Usg[m/s]
Usl [
m/s
]

2. Experiments (contd)
Bifurcation diagram
10 20 30 40 50 60 70 80 90 100 1100
0.5
1
1.5
2
2.5
3Experimental Bifurcation Diagram
Average pressureMax oscillationsMin oscillations
Valve opening [%]
Pres
sure
[bar
]
Usl= 0.2 [m/s] Usg= 1 [m/s]

3. Simulations• Simulating slug flow in S-riser with LedaFlow
• Make the same flow regime map as experimental one
• Making the same bifurcation diagram as
experimental one by changing valve position in different simulations with a fixed Usl and Usg

3. Simulations (contd)
Simulating slug flow in S-riser with LedaFlow

Severe Slugging I (SSI)Usl=0.1 [m/s] Usg= 1 [m/s]
Transfer region (TTS) Usl=0.1 [m/s] Usg= 4 [m/s]
Stable region Usl=0.2 [m/s] Usg=19 [m/s]
3. Simulations (contd)

Flow regime map based on LedaFlow simulations
4 6 8 10 12 14 16 18 20 220
0.1
0.2
0.3
0.4
0.5
0.6
0.7
0.8
0.9LedaFlow Simulations, Flow Regime map
SS1SS2TTSSTABLE
Usg [m/s]
Usl [
m/s
]
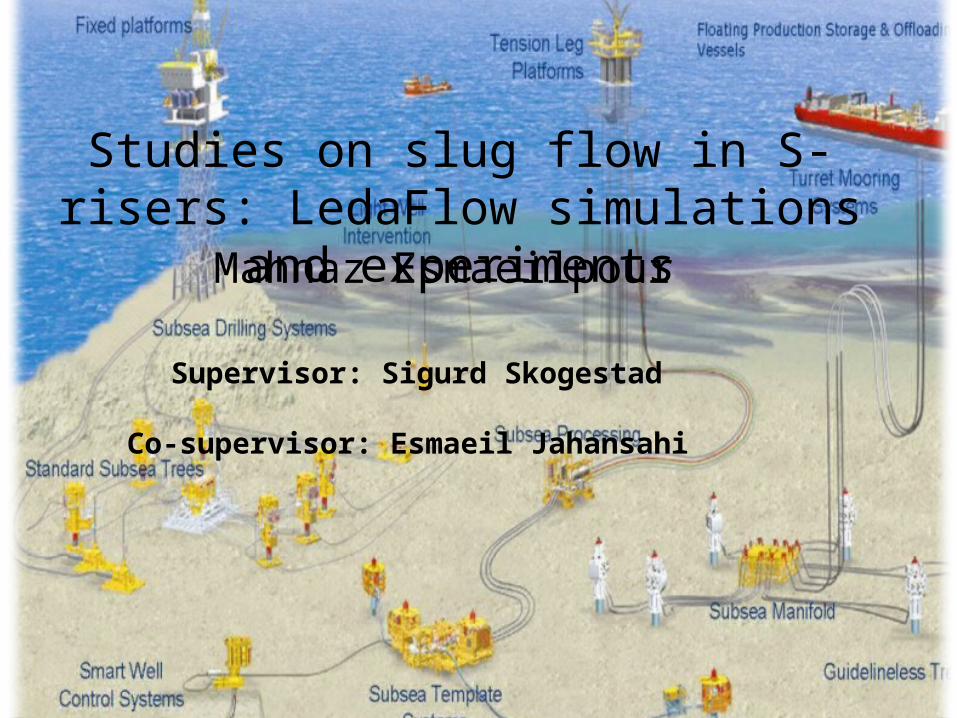
3. Simulations (contd)
Bifurcation diagram
0 20 40 60 80 100 1200
0.5
1
1.5
2
2.5
3
3.5
4
4.5
5LedaFlow Bifurcation Diagram
Average pressureMax. OscillationsMin. Oscillations
Valve opening [%]
Pres
sure
[bar
]
3. Simulations (contd)
Usl= 0.2 [m/s] Usg= 1 [m/s]

4. Comparing simulations & experiments
4 6 8 10 12 14 16 18 20 220
0.1
0.2
0.3
0.4
0.5
0.6
0.7
0.8
0.9
Simulated Flow Regime map
SS1SS2TTSSTABLE
Usg [m/s]
Usl [
m/s
]
0 1 2 3 4 5 60
0.1
0.2
0.3
0.4
0.5
0.6
0.7
0.8
0.9
Experimental Flow Regime Map
SS1SS2TTSSTABLE
Usg[m/s]
Usl [
m/s
]

4. Comparing simulations & experiments (contd)

Thank you!
![[PPT]Slug · Web viewSlug flow in S-shaped risers Simulating S-riser in OLGA Extending the simplified MATLAB model for L-riser to S-riser Comparing the results from OLGA and MATLAB](https://img.pdfslide.us/doc/110x75/5aad95117f8b9a9c2e8e7f2d/pptslug-viewslug-flow-in-s-shaped-risers-simulating-s-riser-in-olga-extending.jpg)