Embed Size (px)
Citation preview
A CPI Report
Morgan Hervé-MignucciXueying WangDavid NelsonUday Varadarajan
December 2015
Slowing the Growth of Coal Power in China: the Role of Finance in State-Owned Enterprises
Copyright © 2015 Climate Policy Initiative www.climatepolicyinitiative.org
All rights reserved. CPI welcomes the use of its material for noncommercial purposes, such as policy discussions or educational activities, under a Creative Commons Attribution-NonCommercial-ShareAlike 3.0 Unported License. For commercial use, please contact [email protected].
About CPIClimate Policy Initiative works to improve the most important energy and land use policies around the world, with a particular focus on finance. An independent organization supported in part by a grant from the Open Society Foundations, CPI works in places that provide the most potential for policy impact including Brazil, China, Europe, India, Indonesia, and the United States.
Our work helps nations grow while addressing increasingly scarce resources and climate risk. This is a complex challenge in which policy plays a crucial role.
DescriptorsSector Energy Finance
Region Global
Keywords China, coal finance, State finance, state-owned enterprises, corporate finance, coal power
Related CPI Reports Slowing the Growth of Coal Power Outside China: The Role of Chinese Finance
Contact Morgan Hervé-Mignucci [email protected]
Xueying Wang [email protected]
AcknowledgementsWe would like to give special thanks to Fredrich Kahrl and Alvin Lin for their valuable expertise and significant contributions in reviewing this paper. We would also like to thank Gang He, Shan Li, Fei Teng, Jianliang Wang, Xuehua Zhang, and Hansong Zhu for their thoughtful insights and feedback.
We extend our sincere thanks to CPI staff members Ruby Barcklay, Amira Hankin, Tom Heller, David Nelson, Elysha Rom-Povolo, Uday Varadarajan, Tim Varga, and Maggie Young, who provided guidance and support throughout the course of this project.
CPI would like to thank Children’s Investment Fund Foundation, without whose generous support this project would not have been possible.
Slowing the Growth of Coal Power in China: the Role of Finance in State-Owned Enterprises
IA CPI Report
December 2015
Executive SummaryIn the past few decades, China has experienced rapid growth in coal power, which has played a key role in supporting China’s economic and industrial structure, as well as in achieving its infrastructure-led GDP growth targets. On the other hand, coal-fired power has also become a significant contributor to the country’s CO2 emissions, which reached 8.25 billion tons in 2012 (IEA).
Climate Policy Initiative is examining the financing of Chinese coal power plants, beginning with an overview of the current state of the coal power sector, with the aim of exploring financing levers which could optimize electric power growth while also greening the system. In particular, we focus on state-owned enterprises (SOEs), the state-owned and state-controlled companies which dominate the coal power industry.
Our analysis finds the following:
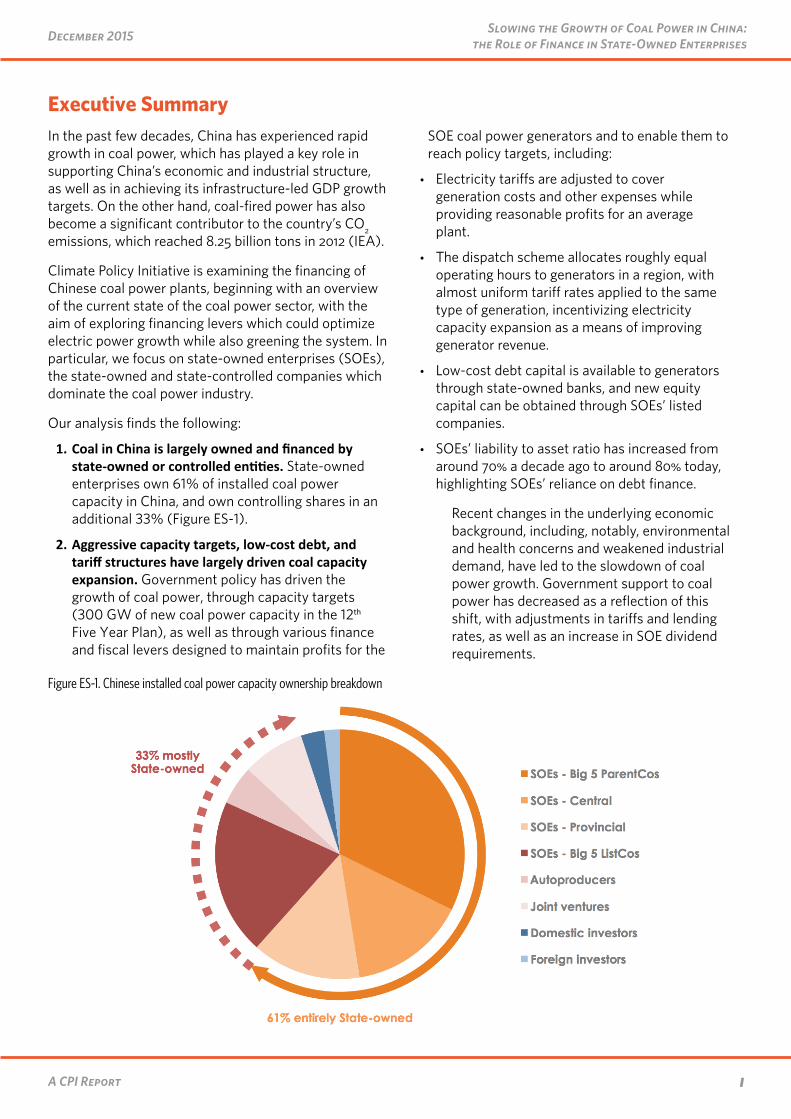
1. Coal in China is largely owned and financed by state-owned or controlled entities. State-owned enterprises own 61% of installed coal power capacity in China, and own controlling shares in an additional 33% (Figure ES-1).
2. Aggressive capacity targets, low-cost debt, and tariff structures have largely driven coal capacity expansion. Government policy has driven the growth of coal power, through capacity targets (300 GW of new coal power capacity in the 12th Five Year Plan), as well as through various finance and fiscal levers designed to maintain profits for the
SOE coal power generators and to enable them to reach policy targets, including:
• Electricity tariffs are adjusted to cover generation costs and other expenses while providing reasonable profits for an average plant.
• The dispatch scheme allocates roughly equal operating hours to generators in a region, with almost uniform tariff rates applied to the same type of generation, incentivizing electricity capacity expansion as a means of improving generator revenue.
• Low-cost debt capital is available to generators through state-owned banks, and new equity capital can be obtained through SOEs’ listed companies.
• SOEs’ liability to asset ratio has increased from around 70% a decade ago to around 80% today, highlighting SOEs’ reliance on debt finance.
Recent changes in the underlying economic background, including, notably, environmental and health concerns and weakened industrial demand, have led to the slowdown of coal power growth. Government support to coal power has decreased as a reflection of this shift, with adjustments in tariffs and lending rates, as well as an increase in SOE dividend requirements.
Figure ES-1. Chinese installed coal power capacity ownership breakdown
IIA CPI Report
Slowing the Growth of Coal Power in China: the Role of Finance in State-Owned EnterprisesDecember 2015
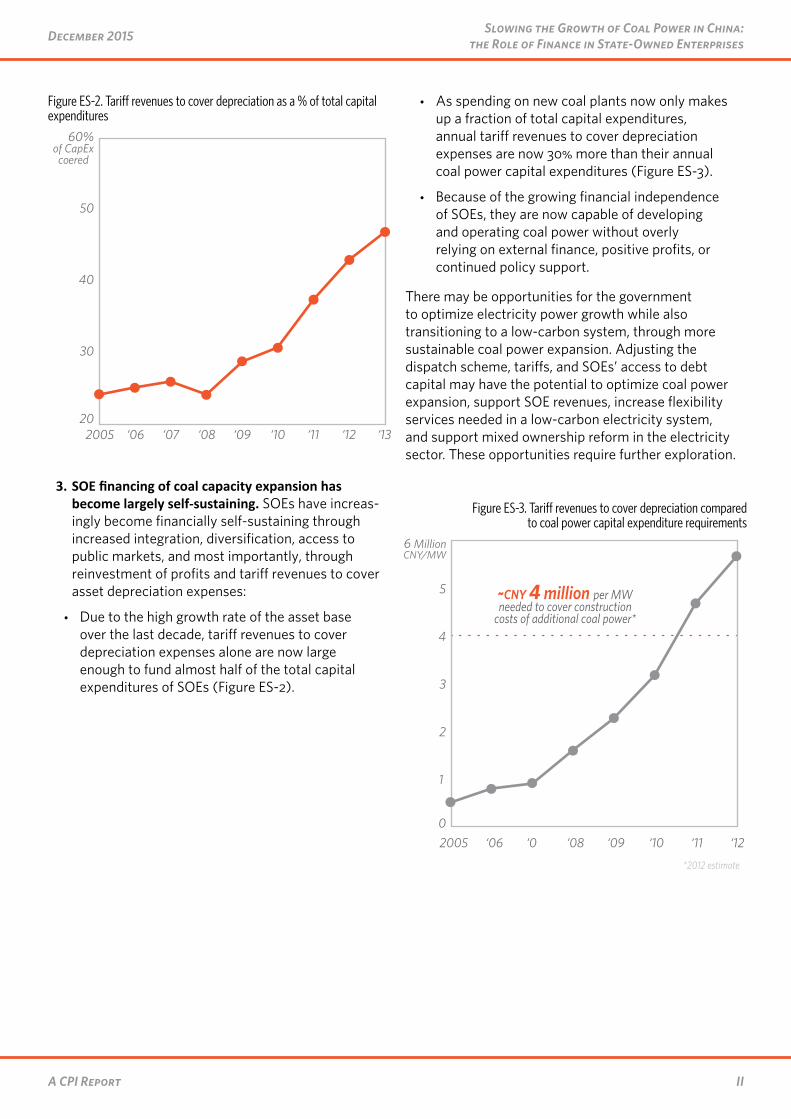
3. SOE financing of coal capacity expansion has become largely self-sustaining. SOEs have increas-ingly become financially self-sustaining through increased integration, diversification, access to public markets, and most importantly, through reinvestment of profits and tariff revenues to cover asset depreciation expenses:
• Due to the high growth rate of the asset base over the last decade, tariff revenues to cover depreciation expenses alone are now large enough to fund almost half of the total capital expenditures of SOEs (Figure ES-2).
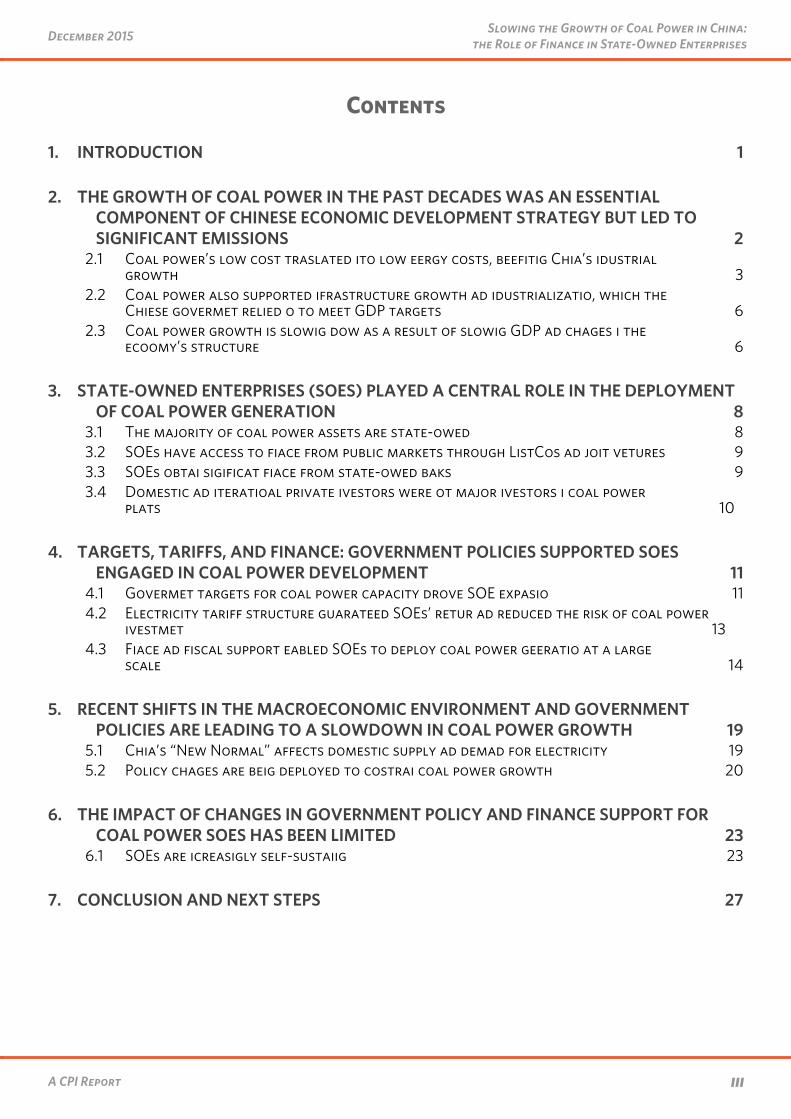
• As spending on new coal plants now only makes up a fraction of total capital expenditures, annual tariff revenues to cover depreciation expenses are now 30% more than their annual coal power capital expenditures (Figure ES-3).
• Because of the growing financial independence of SOEs, they are now capable of developing and operating coal power without overly relying on external finance, positive profits, or continued policy support.
There may be opportunities for the government to optimize electricity power growth while also transitioning to a low-carbon system, through more sustainable coal power expansion. Adjusting the dispatch scheme, tariffs, and SOEs’ access to debt capital may have the potential to optimize coal power expansion, support SOE revenues, increase flexibility services needed in a low-carbon electricity system, and support mixed ownership reform in the electricity sector. These opportunities require further exploration.
Figure ES-2. Tariff revenues to cover depreciation as a % of total capital expenditures ParentCo ListCo
‘13‘12‘11‘10‘09‘08‘07‘062005 ‘14‘13‘12‘11‘10‘09‘08‘07‘06200520
30
40
50
60%of CapEx covered
20
30
40
50
60%of CapEx covered
Figure ES-3. Tariff revenues to cover depreciation compared to coal power capital expenditure requirements
0
1
2
3
4
5
6 Million CNY/MW
‘12‘11‘10‘09‘08‘07‘062005
~CNY 4 million per MW needed to cover construction
costs of additional coal power*
*2012 estimate
IIIA CPI Report
December 2015 Slowing the Growth of Coal Power in China: the Role of Finance in State-Owned Enterprises
Contents
1. INTRODUCTION 1
2. THE GROWTH OF COAL POWER IN THE PAST DECADES WAS AN ESSENTIAL COMPONENT OF CHINESE ECONOMIC DEVELOPMENT STRATEGY BUT LED TO SIGNIFICANT EMISSIONS 2
2.1 Coal power’s low cost translated into low energy costs, benefiting China’s industrial growth 3
2.2 Coal power also supported infrastructure growth and industrialization, which the Chinese government relied on to meet GDP targets 6
2.3 Coal power growth is slowing down as a result of slowing GDP and changes in the economy’s structure 6
3. STATE-OWNED ENTERPRISES (SOES) PLAYED A CENTRAL ROLE IN THE DEPLOYMENT OF COAL POWER GENERATION 8
3.1 The majority of coal power assets are state-owned 83.2 SOEs have access to finance from public markets through ListCos and joint ventures 93.3 SOEs obtain significant finance from state-owned banks 93.4 Domestic and international private investors were not major investors in coal power
plants 10
4. TARGETS, TARIFFS, AND FINANCE: GOVERNMENT POLICIES SUPPORTED SOES ENGAGED IN COAL POWER DEVELOPMENT 11
4.1 Government targets for coal power capacity drove SOE expansion 114.2 Electricity tariff structure guaranteed SOEs’ return and reduced the risk of coal power
investment 134.3 Finance and fiscal support enabled SOEs to deploy coal power generation at a large
scale 14
5. RECENT SHIFTS IN THE MACROECONOMIC ENVIRONMENT AND GOVERNMENT POLICIES ARE LEADING TO A SLOWDOWN IN COAL POWER GROWTH 19
5.1 China’s “New Normal” affects domestic supply and demand for electricity 195.2 Policy changes are being deployed to constrain coal power growth 20
6. THE IMPACT OF CHANGES IN GOVERNMENT POLICY AND FINANCE SUPPORT FOR COAL POWER SOES HAS BEEN LIMITED 23
6.1 SOEs are increasingly self-sustaining 23
7. CONCLUSION AND NEXT STEPS 27
1A CPI Report
December 2015 Slowing the Growth of Coal Power in China: the Role of Finance in State-Owned Enterprises
1. IntroductionThe rise in coal power has played an important role in enabling Chinese economic development by providing industrial firms with a competitive advantage due to low energy costs. In the last decade, however, coal-fired power generation in China has become one of the largest contributors to global carbon emissions and air pollution from the energy sector.1 To address this, governments, philanthropies, and civil society organizations have tested and employed multiple approaches to curb coal power growth in China: helping to bust “dirty” projects (such as tracking and “naming and shaming”), supporting policymakers to develop better policy packages to accelerate alternative low-carbon power generation, assessing the social cost of coal power, and modeling alternative scenarios as a way to influence decision-making in China. However, despite its critical role in infrastructure development, the financing of Chinese coal power remains one of the least explored angles.
Crucial questions around the financing of Chinese coal power plants are: which actors (i.e. owners, lenders, policymakers) have played a major role in the deployment of coal-fired plants in China? What combination of economic and policy factors gave rise to the deployment of close to 1 TW of thermal capacity (mostly coal-fired power) by 2015? What is the financing structure that supports these coal-fired plants and how is it evolving? How do the dominant actors in this system benefit from coal power build-outs? How could the government best rein in these actors? What is the role of domestic and foreign private capital in power plant financing? And can the increased participation of private capital change incentives to slow the growth of coal power?
1 CPI The Policy Climate, 2013, http://climatepolicyinitiative.org/publication/the-policy-climate/
This project begins to explore these questions. In Section 2, we look into the instrumental role that low-cost coal power generation has played in helping fuel China’s infrastructure-led economic development. In Section 3, we identify the owners of coal-fired power generation capacity in China and highlight the critical role that SOEs have played in the deployment of coal power. In Section 4, we turn to the three government policy drivers that have supported SOEs: top-down targets from China’s National Development and Reform Commission (NDRC), government-set electricity tariffs that ensure relative long-term profitability, and the provision of almost unlimited, cheap government finance to SOEs so that they do not need to rely solely on pure corporate or project finance. In Section 5, we look into macroeconomic changes that have occurred recently in China and how government support is evolving under this changing economic landscape. Section 6 looks into the complex relationship between state-owned enterprises and the central government – making the case that SOEs are gradually evolving into self-sustaining entities that are incentivized to continue expanding their coal-fired power generation assets on which external finance and policy support have limited impact.
2A CPI Report
Slowing the Growth of Coal Power in China: the Role of Finance in State-Owned EnterprisesDecember 2015
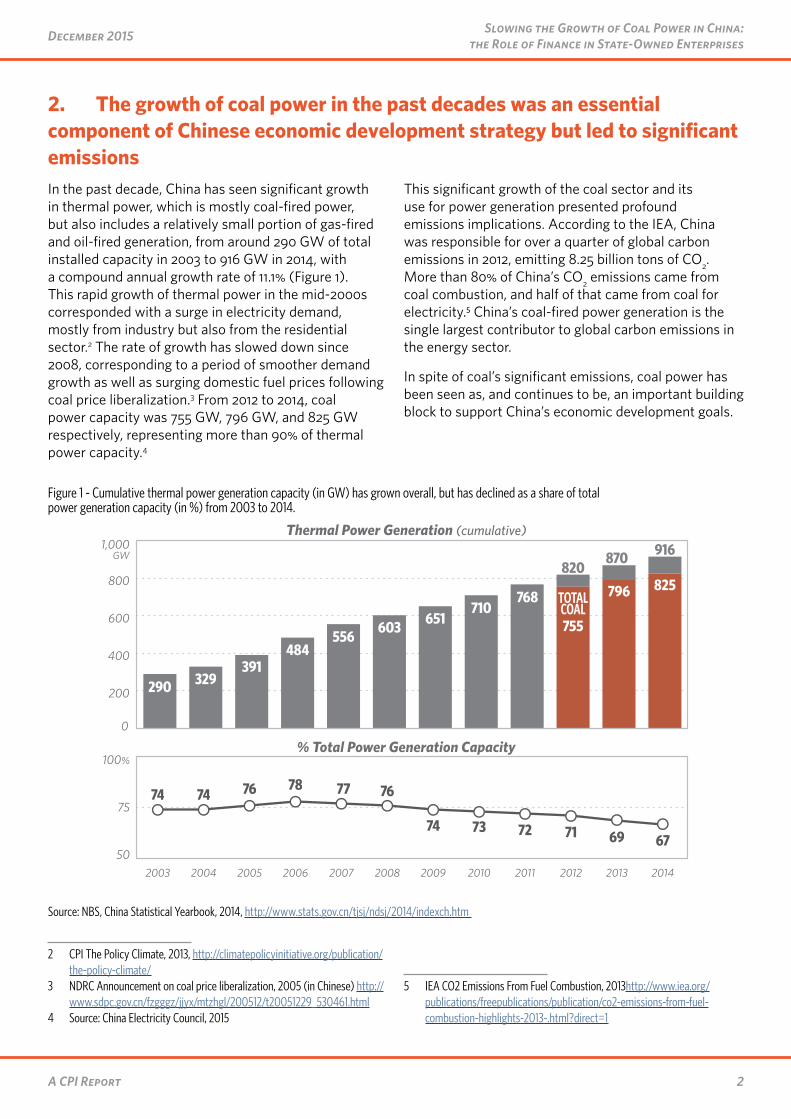
2. The growth of coal power in the past decades was an essential component of Chinese economic development strategy but led to significant emissions In the past decade, China has seen significant growth in thermal power, which is mostly coal-fired power, but also includes a relatively small portion of gas-fired and oil-fired generation, from around 290 GW of total installed capacity in 2003 to 916 GW in 2014, with a compound annual growth rate of 11.1% (Figure 1). This rapid growth of thermal power in the mid-2000s corresponded with a surge in electricity demand, mostly from industry but also from the residential sector.2 The rate of growth has slowed down since 2008, corresponding to a period of smoother demand growth as well as surging domestic fuel prices following coal price liberalization.3 From 2012 to 2014, coal power capacity was 755 GW, 796 GW, and 825 GW respectively, representing more than 90% of thermal power capacity.4
2 CPI The Policy Climate, 2013, http://climatepolicyinitiative.org/publication/the-policy-climate/
3 NDRC Announcement on coal price liberalization, 2005 (in Chinese) http://www.sdpc.gov.cn/fzgggz/jjyx/mtzhgl/200512/t20051229_530461.html
4 Source: China Electricity Council, 2015
This significant growth of the coal sector and its use for power generation presented profound emissions implications. According to the IEA, China was responsible for over a quarter of global carbon emissions in 2012, emitting 8.25 billion tons of CO2. More than 80% of China’s CO2 emissions came from coal combustion, and half of that came from coal for electricity.5 China’s coal-fired power generation is the single largest contributor to global carbon emissions in the energy sector.
In spite of coal’s significant emissions, coal power has been seen as, and continues to be, an important building block to support China’s economic development goals.
5 IEA CO2 Emissions From Fuel Combustion, 2013http://www.iea.org/publications/freepublications/publication/co2-emissions-from-fuel-combustion-highlights-2013-.html?direct=1
Figure 1 - Cumulative thermal power generation capacity (in GW) has grown overall, but has declined as a share of total power generation capacity (in %) from 2003 to 2014.
Source: NBS, China Statistical Yearbook, 2014, http://www.stats.gov.cn/tjsj/ndsj/2014/indexch.htm
0
200
400
600
800
1,000GW
50
75
100%
201420132012201120102009200820072006200520042003
Thermal Power Generation (cumulative)
% Total Power Generation Capacity
290 329391
484556
603 651710
768
820870 916
755
TOTALCOAL
796 825
74 74 76 78 77 76
74 73 72 71 69 67
3A CPI Report
December 2015 Slowing the Growth of Coal Power in China: the Role of Finance in State-Owned Enterprises
2.1 Coal power’s low cost translated into low energy costs, benefiting China’s industrial growthCoal is China’s most abundant energy source. With 13% of the world’s total recoverable coal reserves, China has the third largest coal reserves in the world behind the U.S. and Russia.6 In 2011, raw coal production in China was 3.52 billion metric tons, or 2.51 billion tons of coal equivalent in energy units. Around half of that was used for coal-fired electricity.7
Chinese coal power plants have huge cost advantages compared to the rest of the world, especially for the larger boilers and generating units. It is not entirely clear why construction costs in China are much lower, but economies of scale are probably one of the main causes. Since 2006, China has installed around 500 GW of coal-fired power capacity, and two-thirds of these new builds have unit sizes of 600 MW or larger, making most of the domestic coal-fired power generating fleet cost-competitive.8 These massive build-outs have led to expertise in construction and economies of scale, which together with factors such as low labor cost, low commodity prices,9 and taxes have decreased the construction costs of Chinese coal-fired plants to an average of CNY 3,900-5,000/kW (USD 624-800/kW).10 By comparison, globally, this cost ranges from CNY4,400 – 15,800/kW (USD 700-2530/kW),11 almost two to three times that of China.12
China’s coal power plants, at least those that have permits to operate, are among the most efficient in the world, again contributing to low energy costs. Around 60% of capacity added since 2006 are supercritical and ultra-supercritical units, which are even larger and more
6 Based on 2011 data. EIA, n.d. International Energy Statistics: Total Recoverable Coal. Available at: http://www.eia.gov/cfapps/ipdbproject/IEDIndex3.cfm?tid=1&pid=7&aid=6
7 LBNL China Energy Databook version 8.0, 2013, Table 2A1.1 http://china.lbl.gov/research-projects/china-energy-databook. Tons of coal metrics lead to better comparisons with non-China consumption but tons of coal equivalent are better understood within China.
8 Platts database.9 ILAR, What does it cost to build a power plant?, 2012, http://ilar.ucsd.edu/
assets/001/503883.pdf10 For supercritical and ultra supercritical plants. BNP Research, 2014, http://
www.bnppresearch.com/ResearchFiles/31905/Huadian%20Fuxin%20Energy-020614.pdf IEA, Projected cost of generating electricity, 2010, http://www.iea.org/publications/freepublications/publication/projected_costs.pdf
11 IEA, Technology Roadmap - High-Efficiency, Low-Emissions Coal-Fired Power Generation, 2012, http://bit.ly/1IKk7M4
12 IEA, 2012; BNP Paribas 2013; IEA, 2011
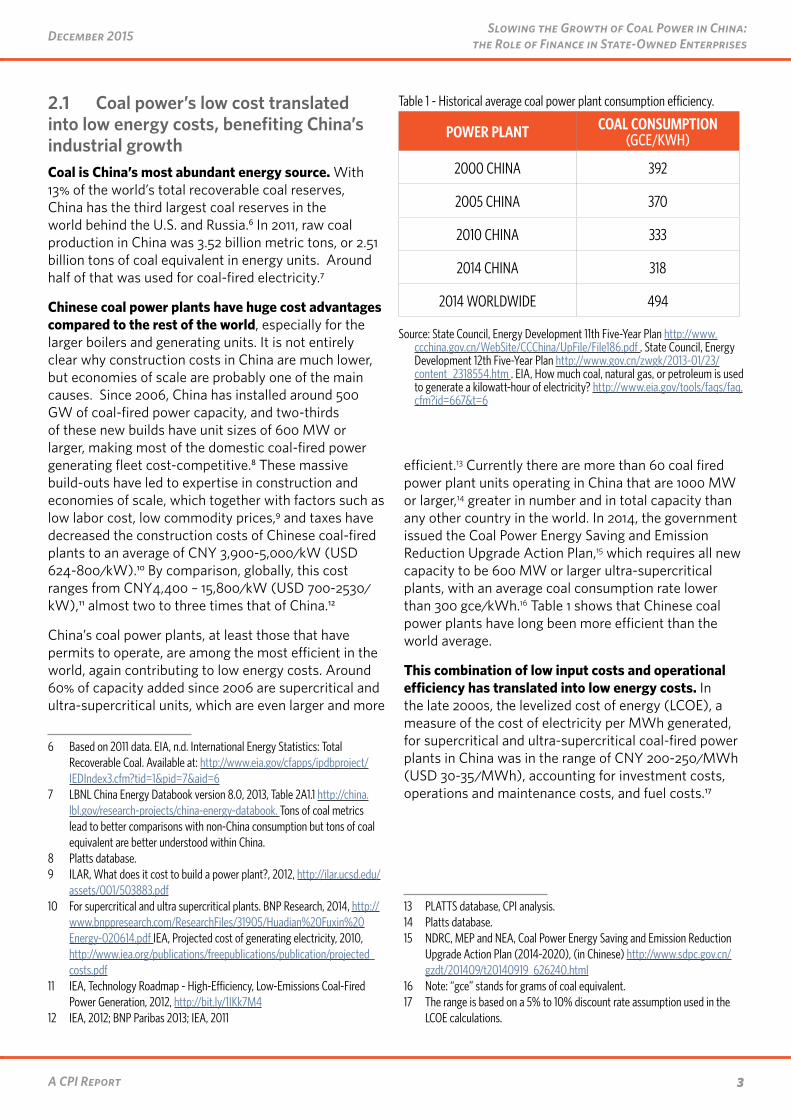
efficient.13 Currently there are more than 60 coal fired power plant units operating in China that are 1000 MW or larger,14 greater in number and in total capacity than any other country in the world. In 2014, the government issued the Coal Power Energy Saving and Emission Reduction Upgrade Action Plan,15 which requires all new capacity to be 600 MW or larger ultra-supercritical plants, with an average coal consumption rate lower than 300 gce/kWh.16 Table 1 shows that Chinese coal power plants have long been more efficient than the world average.
This combination of low input costs and operational efficiency has translated into low energy costs. In the late 2000s, the levelized cost of energy (LCOE), a measure of the cost of electricity per MWh generated, for supercritical and ultra-supercritical coal-fired power plants in China was in the range of CNY 200-250/MWh (USD 30-35/MWh), accounting for investment costs, operations and maintenance costs, and fuel costs.17
13 PLATTS database, CPI analysis.14 Platts database.15 NDRC, MEP and NEA, Coal Power Energy Saving and Emission Reduction
Upgrade Action Plan (2014-2020), (in Chinese) http://www.sdpc.gov.cn/gzdt/201409/t20140919_626240.html
16 Note: “gce” stands for grams of coal equivalent. 17 The range is based on a 5% to 10% discount rate assumption used in the
LCOE calculations.
Table 1 - Historical average coal power plant consumption efficiency.
POWER PLANT COAL CONSUMPTION (GCE/KWH)
2000 CHINA 392
2005 CHINA 370
2010 CHINA 333
2014 CHINA 318
2014 WORLDWIDE 494
Source: State Council, Energy Development 11th Five-Year Plan http://www.ccchina.gov.cn/WebSite/CCChina/UpFile/File186.pdf . State Council, Energy Development 12th Five-Year Plan http://www.gov.cn/zwgk/2013-01/23/content_2318554.htm . EIA, How much coal, natural gas, or petroleum is used to generate a kilowatt-hour of electricity? http://www.eia.gov/tools/faqs/faq.cfm?id=667&t=6
4A CPI Report
Slowing the Growth of Coal Power in China: the Role of Finance in State-Owned EnterprisesDecember 2015
By comparison, major OECD countries’ LCOE was in the range of CNY 500-800/MWh (USD 70-110/MWh).18 The LCOE increased in the early 2010s, due to a significant fuel price increase, but Chinese coal-fired electricity still presents a price advantage compared to its international counterparts.
The low cost of coal power combined with its wide availability has scaled up Chinese electricity supply rapidly. This has enabled the growth of industry end-users, who are major consumers of electricity. In China,
18 CEC, China Electric Power Industry Current Status, 2015, http://www.cec.org.cn/yaowenkuaidi/2015-03-10/134972.html IEA, Projected Costs of Generating Electricity, 2010, http://www.iea.org/publications/freepublications/publication/projected_costs.pdf
consumer electricity prices vary depending on end use, province or location, and transformer capacity. There is a great amount of cross-subsidization in the pricing system with some groups of consumers subsidizing the others. In general, large industrial users pay for electricity with a lower cost per KWh of electricity than small industrial users, combined with a fixed cost associated with transformer capacity.19
19 For examples, see current consumer electricity prices of Guangzhou city (http://www.gdpi.gov.cn/dfjg/85649.jhtml) and Shanghai city (http://www.sheitc.gov.cn/dfjf/637315.htm)
Box 1: High emissions from non-electricity coal end uses, and carbon capture and seques-tration deployment: opportunities for emissions reduction
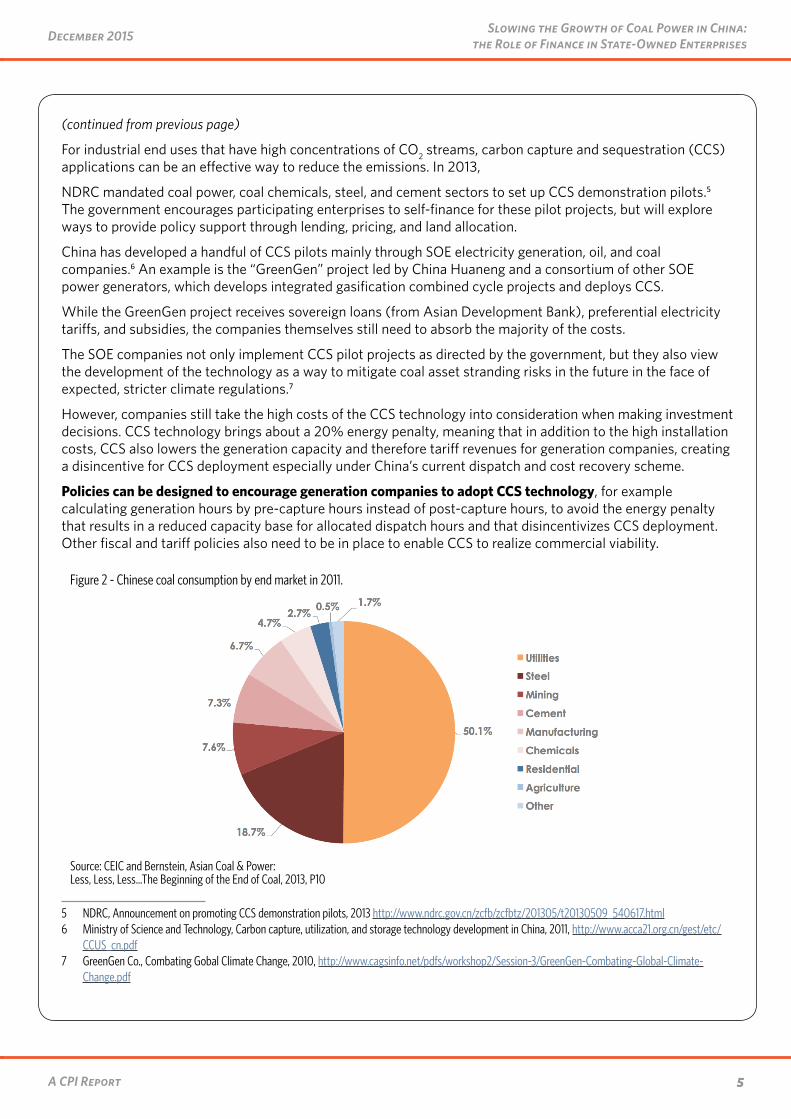
With the growth in coal for electricity generation slowing significantly, the use of coal in sectors outside of the electricity industry, including steel, chemicals, other industrial uses and heating, merit attention. Figure 2 shows Chinese coal consumption by its end market in 2011. Coal power makes up half of coal consumption, but steel, mining, cement, other manufacturing, and chemicals are also notable.
Some of these industrial end uses are highly emissions intensive, for example the coal chemicals industry. China has a large demand for base chemicals such as methanol, polypropylene, and polyethylene as inputs to the manufacturing sector, and traditionally these chemicals are produced from crude oil. However, with the country’s shortage of oil and around 60% of oil consumption imported in 2013,1 coal as an abundant native fuel source has become increasingly important in replacing oil in chemical production, and developments in coal conversion, including coal chemicals, coal to gas, and coal to liquids, have been encouraged in the Coal Industry Development 12th Five-Year Plan.2 The downside of coal conversion processes, in addition to the high construction costs, is that the conversion of coal to gas for power can be 36-82% more carbon intensive than burning coal directly in a power plant,3 and the situation is even worse for coal to liquids, with emissions twice as intensive as conventional petroleum derived fuel.4 Due to their high emissions intensity, the non-power uses of coal offer potential opportunities for emissions reduction.
(continued on next page)
1 EIA data, http://www.eia.gov/countries/country-data.cfm?fips=CH2 NDRC, Coal Industry Development 12th Five-Year Plan, 2012, http://bit.ly/1EJ4ssf3 Chi-Jen Yang et al, China’s Synthetic National Gas Revolution, 2013, http://www.nature.com/nclimate/journal/v3/n10/full/
nclimate1988.html?WT.ec_id=NCLIMATE-2013104 NRDC, Why Liquid Coal Is Not a Viable Option to Move America Beyond Oil, 2011, http://www.nrdc.org/energy/files/
liquidcoalnotviable_fs.pdf
5A CPI Report
December 2015 Slowing the Growth of Coal Power in China: the Role of Finance in State-Owned Enterprises
(continued from previous page)
For industrial end uses that have high concentrations of CO2 streams, carbon capture and sequestration (CCS) applications can be an effective way to reduce the emissions. In 2013,
NDRC mandated coal power, coal chemicals, steel, and cement sectors to set up CCS demonstration pilots.5 The government encourages participating enterprises to self-finance for these pilot projects, but will explore ways to provide policy support through lending, pricing, and land allocation.
China has developed a handful of CCS pilots mainly through SOE electricity generation, oil, and coal companies.6 An example is the “GreenGen” project led by China Huaneng and a consortium of other SOE power generators, which develops integrated gasification combined cycle projects and deploys CCS.
While the GreenGen project receives sovereign loans (from Asian Development Bank), preferential electricity tariffs, and subsidies, the companies themselves still need to absorb the majority of the costs.
The SOE companies not only implement CCS pilot projects as directed by the government, but they also view the development of the technology as a way to mitigate coal asset stranding risks in the future in the face of expected, stricter climate regulations.7
However, companies still take the high costs of the CCS technology into consideration when making investment decisions. CCS technology brings about a 20% energy penalty, meaning that in addition to the high installation costs, CCS also lowers the generation capacity and therefore tariff revenues for generation companies, creating a disincentive for CCS deployment especially under China’s current dispatch and cost recovery scheme.
Policies can be designed to encourage generation companies to adopt CCS technology, for example calculating generation hours by pre-capture hours instead of post-capture hours, to avoid the energy penalty that results in a reduced capacity base for allocated dispatch hours and that disincentivizes CCS deployment. Other fiscal and tariff policies also need to be in place to enable CCS to realize commercial viability.
5 NDRC, Announcement on promoting CCS demonstration pilots, 2013 http://www.ndrc.gov.cn/zcfb/zcfbtz/201305/t20130509_540617.html6 Ministry of Science and Technology, Carbon capture, utilization, and storage technology development in China, 2011, http://www.acca21.org.cn/gest/etc/
CCUS_cn.pdf7 GreenGen Co., Combating Gobal Climate Change, 2010, http://www.cagsinfo.net/pdfs/workshop2/Session-3/GreenGen-Combating-Global-Climate-
Change.pdf
Figure 2 - Chinese coal consumption by end market in 2011.
Source: CEIC and Bernstein, Asian Coal & Power: Less, Less, Less…The Beginning of the End of Coal, 2013, P10
6A CPI Report
Slowing the Growth of Coal Power in China: the Role of Finance in State-Owned EnterprisesDecember 2015
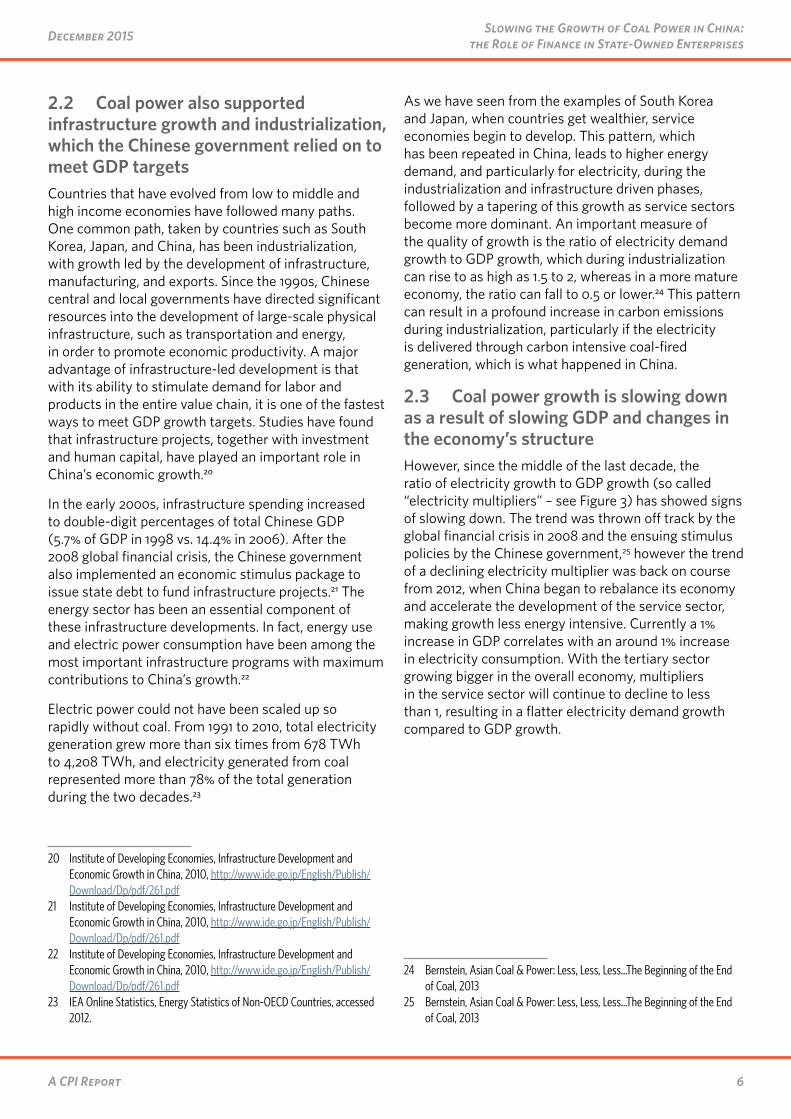
2.2 Coal power also supported infrastructure growth and industrialization, which the Chinese government relied on to meet GDP targetsCountries that have evolved from low to middle and high income economies have followed many paths. One common path, taken by countries such as South Korea, Japan, and China, has been industrialization, with growth led by the development of infrastructure, manufacturing, and exports. Since the 1990s, Chinese central and local governments have directed significant resources into the development of large-scale physical infrastructure, such as transportation and energy, in order to promote economic productivity. A major advantage of infrastructure-led development is that with its ability to stimulate demand for labor and products in the entire value chain, it is one of the fastest ways to meet GDP growth targets. Studies have found that infrastructure projects, together with investment and human capital, have played an important role in China’s economic growth.20
In the early 2000s, infrastructure spending increased to double-digit percentages of total Chinese GDP (5.7% of GDP in 1998 vs. 14.4% in 2006). After the 2008 global financial crisis, the Chinese government also implemented an economic stimulus package to issue state debt to fund infrastructure projects.21 The energy sector has been an essential component of these infrastructure developments. In fact, energy use and electric power consumption have been among the most important infrastructure programs with maximum contributions to China’s growth.22
Electric power could not have been scaled up so rapidly without coal. From 1991 to 2010, total electricity generation grew more than six times from 678 TWh to 4,208 TWh, and electricity generated from coal represented more than 78% of the total generation during the two decades.23
20 Institute of Developing Economies, Infrastructure Development and Economic Growth in China, 2010, http://www.ide.go.jp/English/Publish/Download/Dp/pdf/261.pdf
21 Institute of Developing Economies, Infrastructure Development and Economic Growth in China, 2010, http://www.ide.go.jp/English/Publish/Download/Dp/pdf/261.pdf
22 Institute of Developing Economies, Infrastructure Development and Economic Growth in China, 2010, http://www.ide.go.jp/English/Publish/Download/Dp/pdf/261.pdf
23 IEA Online Statistics, Energy Statistics of Non-OECD Countries, accessed 2012.
As we have seen from the examples of South Korea and Japan, when countries get wealthier, service economies begin to develop. This pattern, which has been repeated in China, leads to higher energy demand, and particularly for electricity, during the industrialization and infrastructure driven phases, followed by a tapering of this growth as service sectors become more dominant. An important measure of the quality of growth is the ratio of electricity demand growth to GDP growth, which during industrialization can rise to as high as 1.5 to 2, whereas in a more mature economy, the ratio can fall to 0.5 or lower.24 This pattern can result in a profound increase in carbon emissions during industrialization, particularly if the electricity is delivered through carbon intensive coal-fired generation, which is what happened in China.
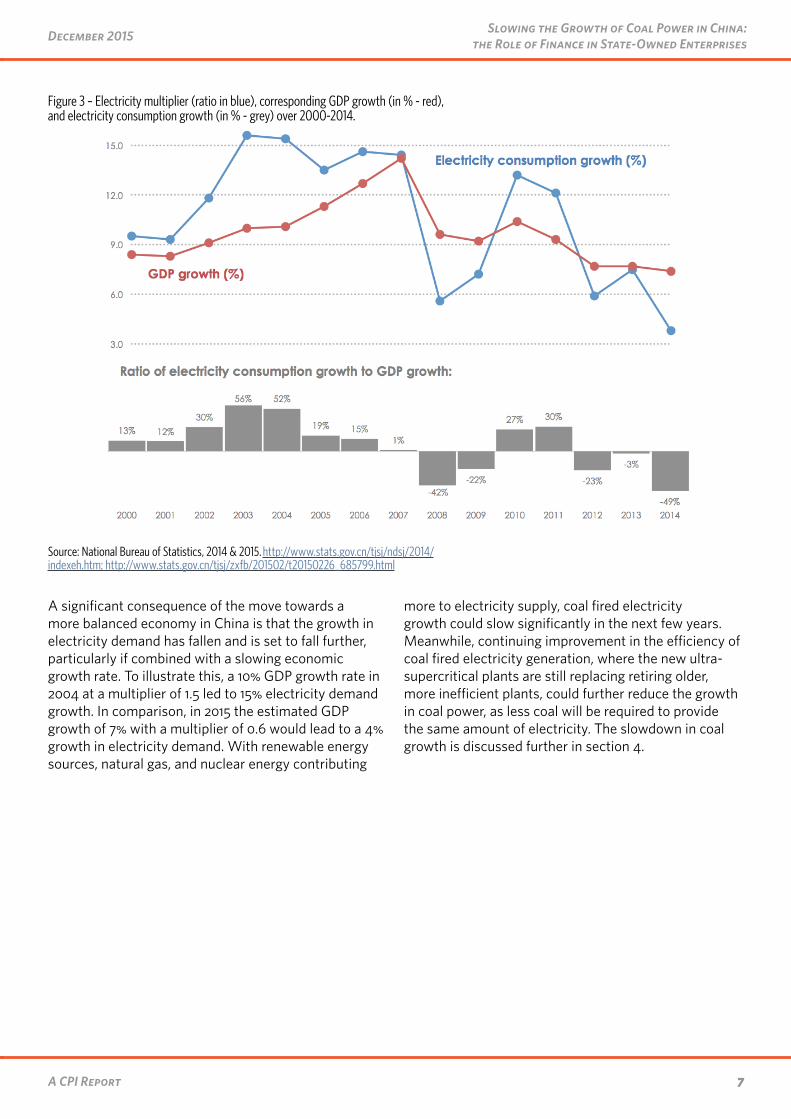
2.3 Coal power growth is slowing down as a result of slowing GDP and changes in the economy’s structureHowever, since the middle of the last decade, the ratio of electricity growth to GDP growth (so called “electricity multipliers” – see Figure 3) has showed signs of slowing down. The trend was thrown off track by the global financial crisis in 2008 and the ensuing stimulus policies by the Chinese government,25 however the trend of a declining electricity multiplier was back on course from 2012, when China began to rebalance its economy and accelerate the development of the service sector, making growth less energy intensive. Currently a 1% increase in GDP correlates with an around 1% increase in electricity consumption. With the tertiary sector growing bigger in the overall economy, multipliers in the service sector will continue to decline to less than 1, resulting in a flatter electricity demand growth compared to GDP growth.
24 Bernstein, Asian Coal & Power: Less, Less, Less…The Beginning of the End of Coal, 2013
25 Bernstein, Asian Coal & Power: Less, Less, Less…The Beginning of the End of Coal, 2013
7A CPI Report
December 2015 Slowing the Growth of Coal Power in China: the Role of Finance in State-Owned Enterprises
A significant consequence of the move towards a more balanced economy in China is that the growth in electricity demand has fallen and is set to fall further, particularly if combined with a slowing economic growth rate. To illustrate this, a 10% GDP growth rate in 2004 at a multiplier of 1.5 led to 15% electricity demand growth. In comparison, in 2015 the estimated GDP growth of 7% with a multiplier of 0.6 would lead to a 4% growth in electricity demand. With renewable energy sources, natural gas, and nuclear energy contributing
more to electricity supply, coal fired electricity growth could slow significantly in the next few years. Meanwhile, continuing improvement in the efficiency of coal fired electricity generation, where the new ultra-supercritical plants are still replacing retiring older, more inefficient plants, could further reduce the growth in coal power, as less coal will be required to provide the same amount of electricity. The slowdown in coal growth is discussed further in section 4.
Figure 3 – Electricity multiplier (ratio in blue), corresponding GDP growth (in % - red), and electricity consumption growth (in % - grey) over 2000-2014.
Source: National Bureau of Statistics, 2014 & 2015. http://www.stats.gov.cn/tjsj/ndsj/2014/indexeh.htm; http://www.stats.gov.cn/tjsj/zxfb/201502/t20150226_685799.html
8A CPI Report
Slowing the Growth of Coal Power in China: the Role of Finance in State-Owned EnterprisesDecember 2015
3. State-owned enterprises (SOEs) played a central role in the deployment of coal power generationPreviously, we discussed how the Chinese government relied on growing the electricity supply and lowering electricity prices to support economic development. It is also important to understand the critical role that state-owned enterprises played in delivering these goals. These government-backed institutions played, and continue to play, a critical role in the growth of the electricity sector, and their continuing role must not be overlooked in current government efforts to shift towards a lower carbon growth path.
In this section, we examine the owners and lenders behind the direct deployment of coal-fired power generation in China up to 2013, which provides a very recent complete dataset on Chinese coal power generation (total coal power generation capacity in China at the end of 2013 was 796 GW).26
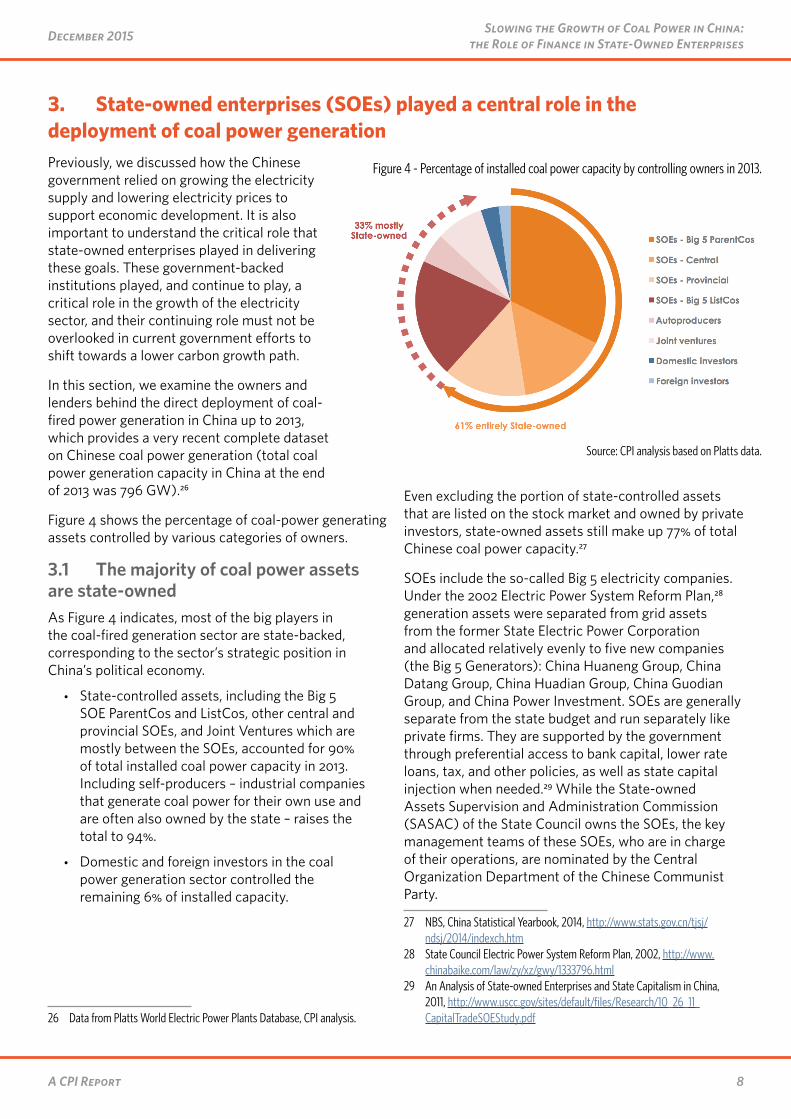
Figure 4 shows the percentage of coal-power generating assets controlled by various categories of owners.
3.1 The majority of coal power assets are state-ownedAs Figure 4 indicates, most of the big players in the coal-fired generation sector are state-backed, corresponding to the sector’s strategic position in China’s political economy.
• State-controlled assets, including the Big 5 SOE ParentCos and ListCos, other central and provincial SOEs, and Joint Ventures which are mostly between the SOEs, accounted for 90% of total installed coal power capacity in 2013. Including self-producers – industrial companies that generate coal power for their own use and are often also owned by the state – raises the total to 94%.
• Domestic and foreign investors in the coal power generation sector controlled the remaining 6% of installed capacity.
26 Data from Platts World Electric Power Plants Database, CPI analysis.
Even excluding the portion of state-controlled assets that are listed on the stock market and owned by private investors, state-owned assets still make up 77% of total Chinese coal power capacity.27
SOEs include the so-called Big 5 electricity companies. Under the 2002 Electric Power System Reform Plan,28 generation assets were separated from grid assets from the former State Electric Power Corporation and allocated relatively evenly to five new companies (the Big 5 Generators): China Huaneng Group, China Datang Group, China Huadian Group, China Guodian Group, and China Power Investment. SOEs are generally separate from the state budget and run separately like private firms. They are supported by the government through preferential access to bank capital, lower rate loans, tax, and other policies, as well as state capital injection when needed.29 While the State-owned Assets Supervision and Administration Commission (SASAC) of the State Council owns the SOEs, the key management teams of these SOEs, who are in charge of their operations, are nominated by the Central Organization Department of the Chinese Communist Party.
27 NBS, China Statistical Yearbook, 2014, http://www.stats.gov.cn/tjsj/ndsj/2014/indexch.htm
28 State Council Electric Power System Reform Plan, 2002, http://www.chinabaike.com/law/zy/xz/gwy/1333796.html
29 An Analysis of State-owned Enterprises and State Capitalism in China, 2011, http://www.uscc.gov/sites/default/files/Research/10_26_11_CapitalTradeSOEStudy.pdf
Figure 4 - Percentage of installed coal power capacity by controlling owners in 2013.
Source: CPI analysis based on Platts data.
9A CPI Report
December 2015 Slowing the Growth of Coal Power in China: the Role of Finance in State-Owned Enterprises
Other central SOEs (such as the coal mining company Shenhua Group, and grid company State Grid) and SOEs at a subnational level (provincial SOEs) also have a significant share of ownership in coal-fired plants. They own coal power assets as a part of their industrial value chain or investment portfolios.
Self-producers are mainly industrial companies, which produce coal-fired electricity for their own use in production. Examples include Bao Steel and Aluminum Corporation of China. Self-producers can be more or less state-owned.
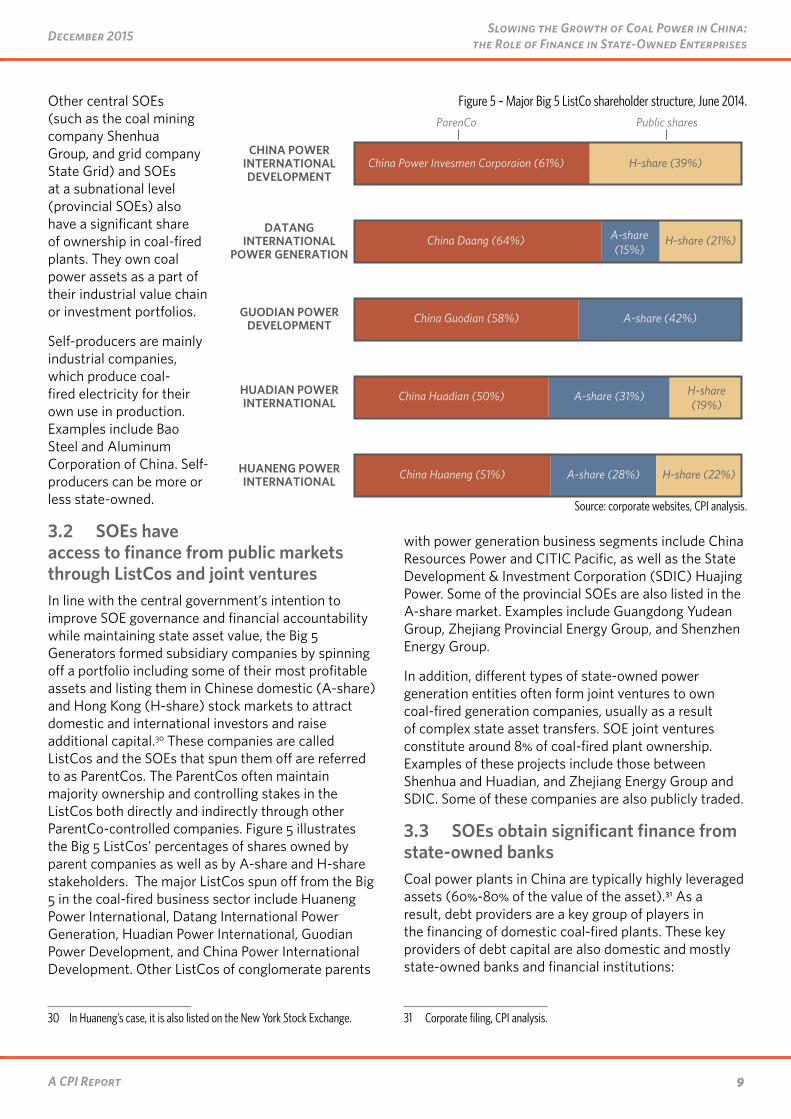
3.2 SOEs have access to finance from public markets through ListCos and joint venturesIn line with the central government’s intention to improve SOE governance and financial accountability while maintaining state asset value, the Big 5 Generators formed subsidiary companies by spinning off a portfolio including some of their most profitable assets and listing them in Chinese domestic (A-share) and Hong Kong (H-share) stock markets to attract domestic and international investors and raise additional capital.30 These companies are called ListCos and the SOEs that spun them off are referred to as ParentCos. The ParentCos often maintain majority ownership and controlling stakes in the ListCos both directly and indirectly through other ParentCo-controlled companies. Figure 5 illustrates the Big 5 ListCos’ percentages of shares owned by parent companies as well as by A-share and H-share stakeholders. The major ListCos spun off from the Big 5 in the coal-fired business sector include Huaneng Power International, Datang International Power Generation, Huadian Power International, Guodian Power Development, and China Power International Development. Other ListCos of conglomerate parents
30 In Huaneng’s case, it is also listed on the New York Stock Exchange.
with power generation business segments include China Resources Power and CITIC Pacific, as well as the State Development & Investment Corporation (SDIC) Huajing Power. Some of the provincial SOEs are also listed in the A-share market. Examples include Guangdong Yudean Group, Zhejiang Provincial Energy Group, and Shenzhen Energy Group.
In addition, different types of state-owned power generation entities often form joint ventures to own coal-fired generation companies, usually as a result of complex state asset transfers. SOE joint ventures constitute around 8% of coal-fired plant ownership. Examples of these projects include those between Shenhua and Huadian, and Zhejiang Energy Group and SDIC. Some of these companies are also publicly traded.
3.3 SOEs obtain significant finance from state-owned banksCoal power plants in China are typically highly leveraged assets (60%-80% of the value of the asset).31 As a result, debt providers are a key group of players in the financing of domestic coal-fired plants. These key providers of debt capital are also domestic and mostly state-owned banks and financial institutions:
31 Corporate filing, CPI analysis.
Figure 5 – Major Big 5 ListCo shareholder structure, June 2014.
H-share (39%)China Power Investment Corporation (61%)
H-share (21%)China Datang (64%)
A-share (42%)China Guodian (58%)
A-share (31%) H-share (19%)
China Huadian (50%)
A-share (28%) H-share (22%)China Huaneng (51%)
DATANG INTERNATIONAL
POWER GENERATION
GUODIAN POWER DEVELOPMENT
HUADIAN POWER INTERNATIONAL
CHINA POWER INTERNATIONAL DEVELOPMENT
HUANENG POWER INTERNATIONAL
ParentCo Public shares
A-share (15%)
Source: corporate websites, CPI analysis.
10A CPI Report
Slowing the Growth of Coal Power in China: the Role of Finance in State-Owned EnterprisesDecember 2015
• State-owned policy banks, especially China Development Bank, provided around 3% of total bank finance to coal-fired electricity companies in China from the years 2005-2011;32
• Major state-owned commercial banks, including Bank of China, China Construction Bank, Agricultural Bank of China, Industrial and Commercial Bank of China, and Bank of Communications provided around 70% of bank finance in the same period;
• Smaller joint-stock commercial banks mostly owned by the state sector, such as China Everbright Bank and China Merchants Bank, provided another 10% of bank finance;
Because the state relies on these banks to realize policy goals and also holds a significant portion of the bank assets, the banks often have implicit state backing which lowers their lending risks.
Another channel of debt financing is through enterprise bonds (for SOE ParentCos) and corporate bonds (for SOE ListCos).
In addition to direct lending to SOE ParentCos and ListCos, debt capital can be provided to special purpose vehicles through financial entities associated with the SOEs. Special purpose vehicles’ debt capital can come from bank borrowing and bond issuances from the parent companies.
32 Urgewald, groundWork, Earthlife Africa Johannesburg and BankTrack, Bankrolling Climate Change, 2011, http://www.banktrack.org/download/bankrolling_climate_change/climatekillerbanks_final_0.pdf
3.4 Domestic and international private investors were not major investors in coal power plantsDomestic and international private investors have also invested in Chinese coal power, but their presence has been limited.
Private (not state-owned) domestic investors account for only 3% of the ownership of total coal-fired plant installed capacity. One example is Xinjiang Tianfu Thermal Electric Corporation.
Foreign investors in Chinese coal power account for only 2% of ownership of total coal-fired plant installed capacity. Examples of these companies include Hong Kong-based China Light & Power (CLP) and France-based EDF. When foreign investors enter the Chinese electricity market, they often participate through a joint venture structure with Chinese partners in the initial phase, and in most cases their SOE partners take the majority ownership of the projects. For example, in a joint venture formed between China Guodian Corporation and foreign investors CLP and EDF, Guodian owns a 51% share.
In addition, as mentioned earlier, both domestic and international private investors can also own Chinese power assets through investing in publicly traded shares of ListCos.
In short, non-government investors, both Chinese and foreign, have played a limited role in coal-fired generation development. Rather, SOEs, backed by the Chinese government, have driven coal power capacity growth.
11A CPI Report
December 2015 Slowing the Growth of Coal Power in China: the Role of Finance in State-Owned Enterprises
4. Targets, Tariffs, and Finance: Government policies supported SOEs engaged in coal power developmentAs described above, the Chinese government has relied on coal power to meet economic development goals, and on SOEs to achieve these goals. A network of policies – from targets to tariffs to finance – has facilitated this coal power development and explains the resulting ownership and financing structures detailed in the previous section.
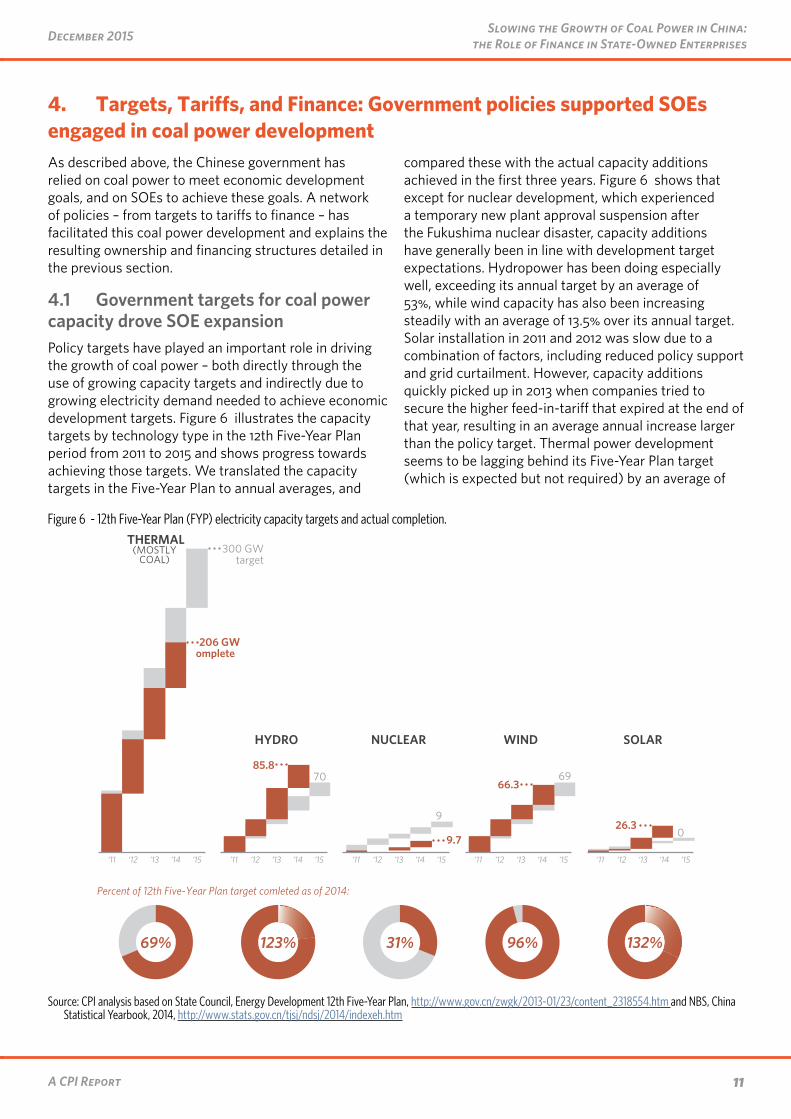
4.1 Government targets for coal power capacity drove SOE expansionPolicy targets have played an important role in driving the growth of coal power – both directly through the use of growing capacity targets and indirectly due to growing electricity demand needed to achieve economic development targets. Figure 6 illustrates the capacity targets by technology type in the 12th Five-Year Plan period from 2011 to 2015 and shows progress towards achieving those targets. We translated the capacity targets in the Five-Year Plan to annual averages, and
compared these with the actual capacity additions achieved in the first three years. Figure 6 shows that except for nuclear development, which experienced a temporary new plant approval suspension after the Fukushima nuclear disaster, capacity additions have generally been in line with development target expectations. Hydropower has been doing especially well, exceeding its annual target by an average of 53%, while wind capacity has also been increasing steadily with an average of 13.5% over its annual target. Solar installation in 2011 and 2012 was slow due to a combination of factors, including reduced policy support and grid curtailment. However, capacity additions quickly picked up in 2013 when companies tried to secure the higher feed-in-tariff that expired at the end of that year, resulting in an average annual increase larger than the policy target. Thermal power development seems to be lagging behind its Five-Year Plan target (which is expected but not required) by an average of
Figure 6 - 12th Five-Year Plan (FYP) electricity capacity targets and actual completion.
HYDRO
THERMAL (MOSTLY
COAL)
NUCLEAR WIND SOLAR
300 GW target
70
29
69
20
206 GW complete
96%31%123%69% 132%
85.8
9.7
66.3
26.3
Percent of 12th Five-Year Plan target completed as of 2014:
‘14‘13‘12‘11 ‘15‘14‘13‘12‘11 ‘15‘14‘13‘12‘11 ‘15‘14‘13‘12‘11 ‘15 ‘14‘13‘12‘11 ‘15
Source: CPI analysis based on State Council, Energy Development 12th Five-Year Plan, http://www.gov.cn/zwgk/2013-01/23/content_2318554.htm and NBS, China Statistical Yearbook, 2014, http://www.stats.gov.cn/tjsj/ndsj/2014/indexeh.htm
12A CPI Report
Slowing the Growth of Coal Power in China: the Role of Finance in State-Owned EnterprisesDecember 2015
9% annually, but considering the three-year average construction period for coal power plants, and the fact that from 2008-2010 generators had to operate at a loss under soaring coal prices, capacity additions in 2011-2013 were significant achievements. The lag may also be due to the 2014 State Council Energy Development Strategy Action Plan which limits coal use by 2020 while encouraging renewable energy development, sending the signal for generators to shift away from coal power.33
Increasing market share sustains SOE revenues
The main reason SOEs strive to reach electricity capacity targets is that doing so sustains SOEs’ revenues. Simply stated, coal power generators’ annual revenues and profitability depend on three main variables: (1) a plant’s hourly margin, (2) the number of hours each plant operates each year, and (3) the number of plants in the coal power generator’s portfolio. As plant hourly margins (on average) are largely determined by the tariff structure, and as the hours of operation are roughly uniformly distributed across generators in a given region, the first two variables provide few opportunities for increasing profitability in the long-term.34 However, an SOE can increase total profits (though not necessarily profit margins) in this market configuration by increasing their share of total capacity in a given region. By striving to deploy more large-scale coal power units than their competitors, generators are able to maintain their profits in the long run. Even in the situation of overcapacity which penalizes overall profits by decreasing average dispatch hours among all generators, generators will still take the same capacity expansion strategy, because by increasing market share, they become relatively better-off and in a stronger political position than their competitors. Also, reinvesting profits in new plants makes it easier for SOEs to defend themselves against calls from the central government to give the money from past cash injections back to the State.
The risk of this aggressive capital expenditure corporate strategy is that Chinese electricity generating markets could end up facing overcapacity and reduced profit margins for the industry. This effect is already severe in northeastern provinces where utilization hours are low.35
33 State Council, Energy Development Strategy Action Plan (2014-2020), http://www.gov.cn/zhengce/content/2014-11/19/content_9222.htm
34 Even cost reductions could eventually be passed through to customers through future tariff reductions as they will reduce average plant operating costs
35 Spilled Wind: An Update on China’s Wind Integration Challenges, Michael Davidson, 2014, http://theenergycollective.com/michael-davidson/346951/spilled-wind-update-china-s-wind-integration-challenges
Periodic overcapacity problems have existed in China for decades, but rapid growth in electricity demand has corrected these temporary mismatches in supply and demand. However, with the slow-down of electricity demand growth in coming years, this overcapacity may become permanent, posing a larger risk for state assets and the banking system that lends to these projects, especially when implied guarantees on SOE lending have often understated the need for banks to assess risks properly.
SOE managers’ evaluation scheme encourages companies to reach growth targets
The way SOEs’ executives and top managers are evaluated have also created incentives for SOE leaders to undertake massive new builds. SOE executives and top managers are nominated by the Chinese Communist Party (jointly with SASAC). Implementing capacity targets is important for SOE managers, as target achievements are often included in the performance evaluations which determine their benefits and promotion. However, the most important criterion for the evaluation of SOE manager performance is the measure of total profits and economic value added (net income minus capital cost).36 Given the similar profit margins for different plants, as regulated dispatch hours and regional tariff prices tend to be uniform for plants in the same region, big SOE generation companies often focus on expansion as their main business strategy. They have incentive to not only reach policy targets on installed capacity, but also exceed these targets when possible.
Loss compensation arrangements ensure SOEs stay with the government’s long term goals
Since SOE generation companies are directly owned and monitored by the State-owned Assets Supervision and Administration Commission (SASAC), these companies have been naturally incentivized to reach government targets in electricity capacity, efficiency retrofits, and small-plant shutdowns. In fact, SOEs have sometimes sacrificed short term profit goals to meet government installation goals. China Datang Group lost CNY 6.022 billion (USD 727 million) in 2008, while capital expenditure was at least CNY 26.292 billion (USD 3,175 million) that year, including investment in
36 State Council SASAC, Central SOE Director Performance Evaluation Temporary Methods, 2012, http://www.gov.cn/flfg/2013-02/01/content_2324949.htm
13A CPI Report
December 2015 Slowing the Growth of Coal Power in China: the Role of Finance in State-Owned Enterprises
new generation capacity.37 This endurance of loss often comes with the expectation of being compensated eventually by government policy adjustment.
Early retirement of plants is another example where SOEs gave up economic benefits to accommodate government priorities, but were compensated in the long run. In order to increase power plant efficiency and reduce pollution, China started promoting the closure of small and inefficient coal-fired plants to conserve energy since the late 1990s, and resumed this effort in 2007 after a temporary halt due to power shortages.38 During the 11th Five-Year Plan from 2006 to 2010, China closed 77 GW of plants39 whose size and efficiency levels didn’t reach government specified targets.40 To ensure the closure of plants did not conflict with the companies’ desire for expansion, the government compensated for the closures with administrative approvals for companies to build larger, more efficient plants to replace the closed plants. The so-called “building big units to substitute small units” policy proved to be successful, as the 77 GW small plants closed over the course of the 11th Five-Year Plan exceeded the 50 GW target established by the government by 54%. The temporary financial losses borne by the SOEs earned them the opportunity to increase installed capacity by up to 1.7 times the amount of retired capacity.41
4.2 Electricity tariff structure guaranteed SOEs’ return and reduced the risk of coal power investment The Chinese government has also used tariffs to support electricity generation. Different types of coal power tariffs have evolved over time based on the cost of generation, from price setting at a single unit and plant level, to today’s benchmark tariffs at the provincial level. Benchmark tariffs are designed to provide adequate economic incentives for power companies to generate electricity, while also encouraging them to
37 Data from Bloomberg38 CPI, The Policy Climate, 2013 http://climatepolicyinitiative.org/publication/
the-policy-climate/39 IEA, Policy Options for Low-Carbon Power Generation in China, 2012
http://www.iea.org/publications/insights/Insight_PolicyOptions_LowCarbon_China.pdf
40 NDRC, Opinions toward speeding up the small coal-fired plants shut-down, 2007, http://www.gov.cn/zwgk/2007-01/26/content_509911.htm
41 NDRC Website, Q&A of “Building big units to substitute small” measures, 2007, (In Chinese) http://www.sdpc.gov.cn/zcfb/jd/200701/t20070131_133213.html
control costs. When costs change significantly, these tariffs are adjusted to maintain power plant profit margins within a reasonable range and prevent excess profit or loss.
Coal power development in China has enjoyed relatively cheap and unconstrained inputs, with cost advantages in construction, land use rights, and labor, compared to other countries. A dual-pricing system for thermal coal, which enabled power generation companies to sign contracts with coal companies to access fuel at a price more favorable than the market price, was in effect until 2013, but was discontinued in the last few years.42
In addition to low development and operation costs, coal power plants have also benefited from relatively transparent and stable revenue expectations as a result of the electricity dispatch and tariff scheme that aimed at giving these companies a regulated and reasonable return. In this scheme, the local governments and the grid companies forecast annual electricity demand, then mandate hours of operation to generators across different types of coal-fired technology, with limited dispatch advantages to more efficient plants. In 2010, large 1 GW units in China generated electricity for 5,100 hours on average, while less efficient 600 MW and 300 MW units operated for similar lengths of time, at 5,050 and 4,900 hours respectively.43
Like the mandates for hours of operation, on-grid tariffs for coal power plants are stable, almost uniform for the same type of plants in the same province, at the levels of benchmark tariffs established by NDRC for each province, with additional compensation only when deploying pollution removal equipment.44 While profit margins are in a way guaranteed, they are also limited. When coal power prices are expected to result in abnormal profits or losses, tariffs are adjusted to make sure profit margins return to a reasonable level. Currently, coal-fired electricity tariffs, in theory, are adjusted if the coal price fluctuation exceeds 5% for
42 State Council, Guidance Opinion on Deepening the Thermal Coal Market Reform, 2012, (in Chinese), http://www.gov.cn/zwgk/2012-12/25/content_2298187.htm. A dual price system allows State-owned enterprises to sell production in excess of quotas at market prices – similar goods and services could this be sold at different prices.
43 IEA, Policy Options for Low-Carbon Power Generation in China, 2012, http://www.iea.org/publications/insights/Insight_PolicyOptions_LowCarbon_China.pdf
44 NDRC, Announcement on Solving Environmental Tariff Problems, 2014, (in Chinese) http://www.sdpc.gov.cn/fzgggz/jggl/zcfg/201408/t20140827_623688.html
14A CPI Report
Slowing the Growth of Coal Power in China: the Role of Finance in State-Owned EnterprisesDecember 2015
a consecutive period.45 This policy was put in place to ensure generators do not need to bear too much of the coal price increase burden that they had in prior years. Although the implementation process is slower than the policy mandate, tariffs have still been adjusted once a year on average in the past few years. Historically, increases in tariffs for generators have been accompanied by an increase in retail rates. By doing so, the government and society have borne the risks from price fluctuations in lieu of asset owners in order to motivate economic growth. As a result of lower risks, coal power companies require lower returns from their development and operation of coal power facilities; the government thus compensates the electricity generation industry as a whole with relatively low tariffs for low risks.
45 State Council, Guidance Opinion on Deepening the Thermal Coal Market Reform, 2012, (in Chinese) http://www.gov.cn/zwgk/2012-12/25/content_2298187.htm
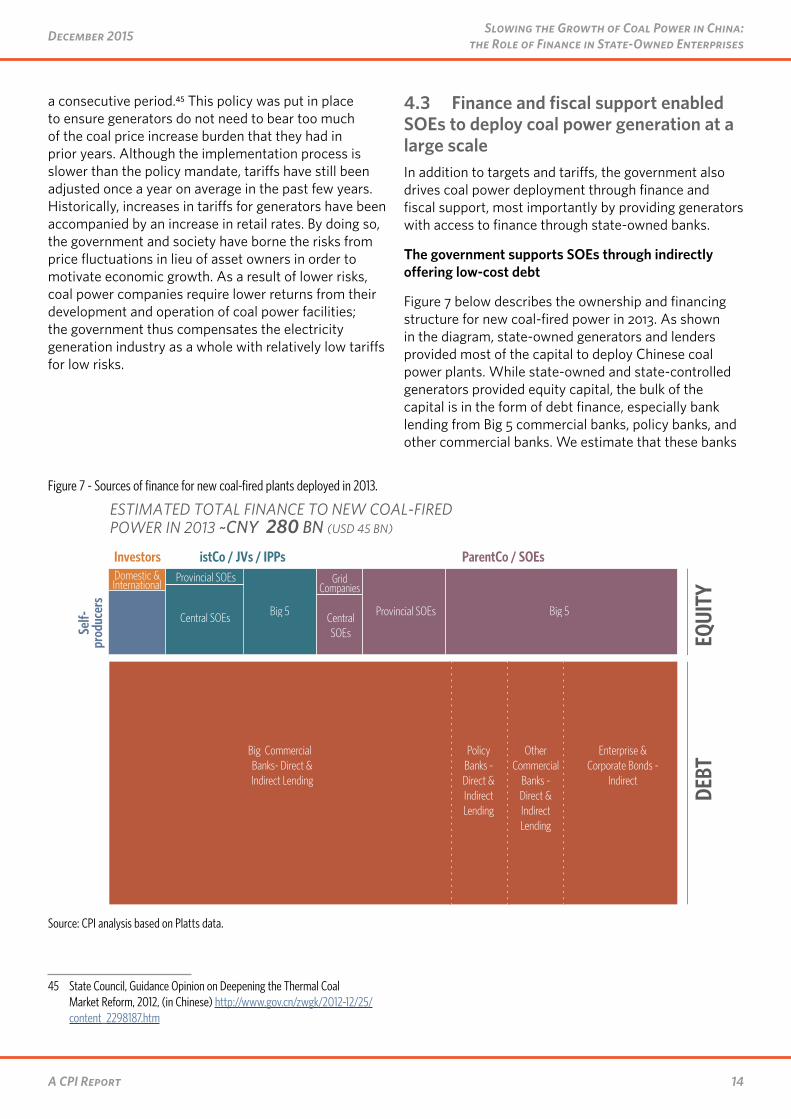
4.3 Finance and fiscal support enabled SOEs to deploy coal power generation at a large scaleIn addition to targets and tariffs, the government also drives coal power deployment through finance and fiscal support, most importantly by providing generators with access to finance through state-owned banks.
The government supports SOEs through indirectly offering low-cost debt
Figure 7 below describes the ownership and financing structure for new coal-fired power in 2013. As shown in the diagram, state-owned generators and lenders provided most of the capital to deploy Chinese coal power plants. While state-owned and state-controlled generators provided equity capital, the bulk of the capital is in the form of debt finance, especially bank lending from Big 5 commercial banks, policy banks, and other commercial banks. We estimate that these banks
Figure 7 - Sources of finance for new coal-fired plants deployed in 2013.
Domestic & International
Big 5Central SOEs
Provincial SOEs
Central SOEs
Grid Companies
Provincial SOEs Big 5
DEBT
EQUI
TY
ParentCo / SOEsListCo / JVs / IPPsInvestors
Self-
prod
ucer
s
Big 5 Commercial Banks- Direct & Indirect Lending
Policy Banks - Direct & Indirect Lending
Other Commercial
Banks - Direct & Indirect Lending
Enterprise & Corporate Bonds -
Indirect
ESTIMATED TOTAL FINANCE TO NEW COAL-FIRED POWER IN 2013: ~CNY 280 BN (USD 45 BN)
Source: CPI analysis based on Platts data.
15A CPI Report
December 2015 Slowing the Growth of Coal Power in China: the Role of Finance in State-Owned Enterprises
together provided around CNY 200 billion (~USD 30 billion) worth of debt capital to domestic coal power development in 2013 alone. The lending rates to state-owned enterprises were often at a discount to People’s Bank of China benchmark rate.46 Access to finance has enabled coal power deployment at a large scale.
46 The Economist, Interest rates in China - A small step forward, 2013, http://www.economist.com/news/finance-and-economics/21582290-chinas-central-bank-has-liberalised-lending-rates-does-it-matter-small-step
Coal power plants are highly leveraged assets. As much as 60-80% of the capital is comprised of project-level debt, from state-owned banks (the major commercial banks and policy banks) but more interestingly also from a secondary source of SOEs’ in-house financing units — wholly-owned lending and leasing entities in charge of recycling the debt capital obtained at the corporate level to projects, at competitive rates.
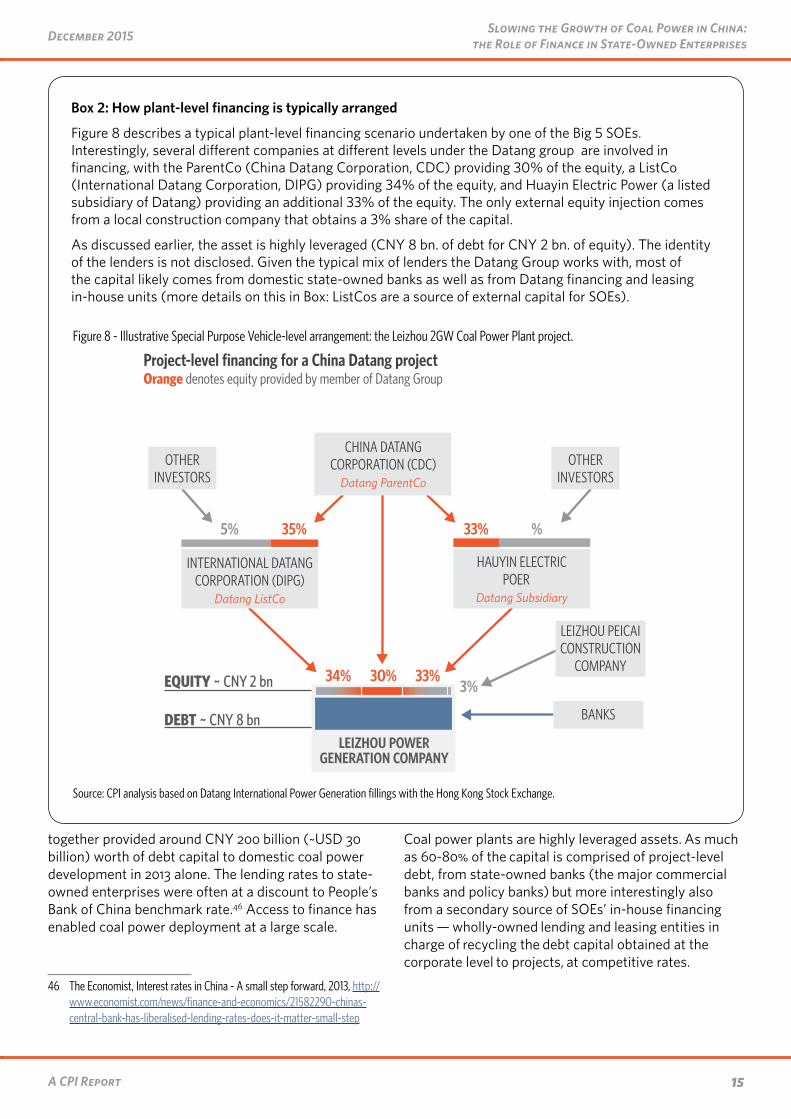
Box 2: How plant-level financing is typically arranged
Figure 8 describes a typical plant-level financing scenario undertaken by one of the Big 5 SOEs. Interestingly, several different companies at different levels under the Datang group are involved in financing, with the ParentCo (China Datang Corporation, CDC) providing 30% of the equity, a ListCo (International Datang Corporation, DIPG) providing 34% of the equity, and Huayin Electric Power (a listed subsidiary of Datang) providing an additional 33% of the equity. The only external equity injection comes from a local construction company that obtains a 3% share of the capital.
As discussed earlier, the asset is highly leveraged (CNY 8 bn. of debt for CNY 2 bn. of equity). The identity of the lenders is not disclosed. Given the typical mix of lenders the Datang Group works with, most of the capital likely comes from domestic state-owned banks as well as from Datang financing and leasing in-house units (more details on this in Box: ListCos are a source of external capital for SOEs).
Figure 8 - Illustrative Special Purpose Vehicle-level arrangement: the Leizhou 2GW Coal Power Plant project.
LEIZHOU PEICAI CONSTRUCTION
COMPANY
LEIZHOU POWER GENERATION COMPANY
INTERNATIONAL DATANG CORPORATION (DIPG)
Datang ListCo
HAUYIN ELECTRIC POWER
Datang Subsidiary
CHINA DATANG CORPORATION (CDC)
Datang ParentCo
OTHERINVESTORS
OTHERINVESTORS
35%65% 33% 66%
34% 30% 33%3%
Orange denotes equity provided by member of Datang Group Project-level financing for a China Datang project
EQUITY ~ CNY 2 bn
DEBT ~ CNY 8 bn BANKS
Source: CPI analysis based on Datang International Power Generation fillings with the Hong Kong Stock Exchange.
16A CPI Report
Slowing the Growth of Coal Power in China: the Role of Finance in State-Owned EnterprisesDecember 2015
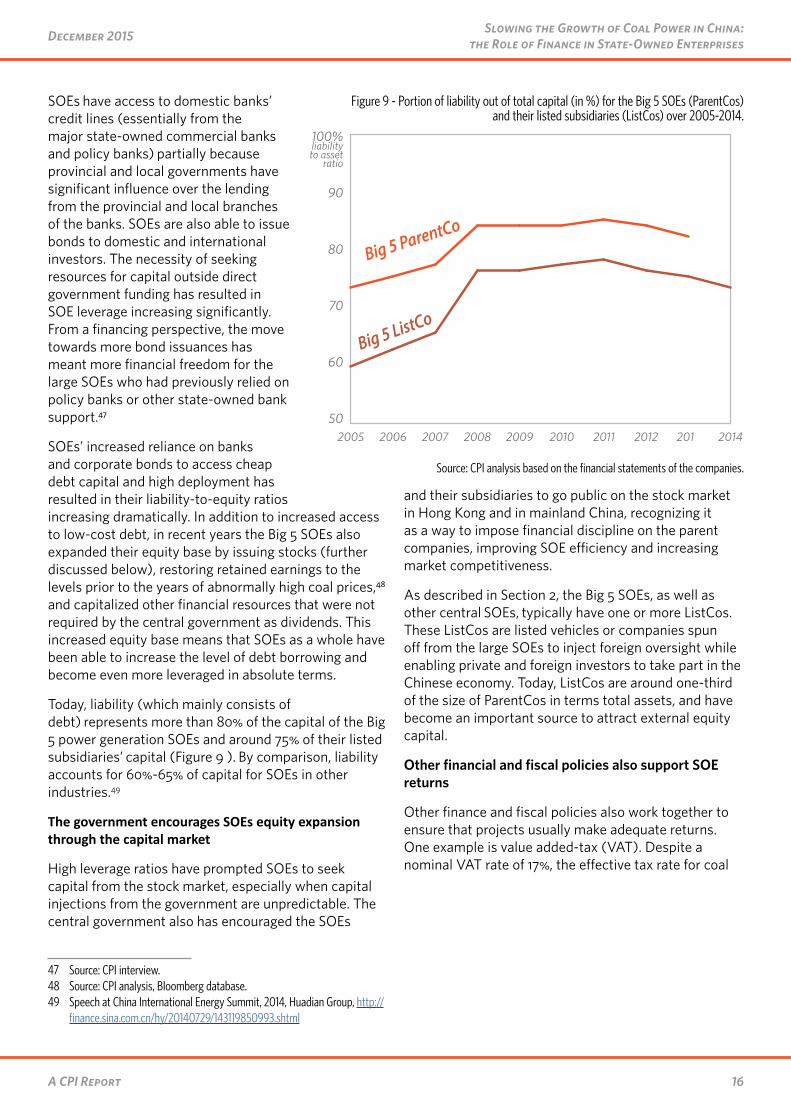
SOEs have access to domestic banks’ credit lines (essentially from the major state-owned commercial banks and policy banks) partially because provincial and local governments have significant influence over the lending from the provincial and local branches of the banks. SOEs are also able to issue bonds to domestic and international investors. The necessity of seeking resources for capital outside direct government funding has resulted in SOE leverage increasing significantly. From a financing perspective, the move towards more bond issuances has meant more financial freedom for the large SOEs who had previously relied on policy banks or other state-owned bank support.47
SOEs’ increased reliance on banks and corporate bonds to access cheap debt capital and high deployment has resulted in their liability-to-equity ratios increasing dramatically. In addition to increased access to low-cost debt, in recent years the Big 5 SOEs also expanded their equity base by issuing stocks (further discussed below), restoring retained earnings to the levels prior to the years of abnormally high coal prices,48 and capitalized other financial resources that were not required by the central government as dividends. This increased equity base means that SOEs as a whole have been able to increase the level of debt borrowing and become even more leveraged in absolute terms.
Today, liability (which mainly consists of debt) represents more than 80% of the capital of the Big 5 power generation SOEs and around 75% of their listed subsidiaries’ capital (Figure 9 ). By comparison, liability accounts for 60%-65% of capital for SOEs in other industries.49
The government encourages SOEs equity expansion through the capital market
High leverage ratios have prompted SOEs to seek capital from the stock market, especially when capital injections from the government are unpredictable. The central government also has encouraged the SOEs
47 Source: CPI interview.48 Source: CPI analysis, Bloomberg database.49 Speech at China International Energy Summit, 2014, Huadian Group, http://
finance.sina.com.cn/hy/20140729/143119850993.shtml
and their subsidiaries to go public on the stock market in Hong Kong and in mainland China, recognizing it as a way to impose financial discipline on the parent companies, improving SOE efficiency and increasing market competitiveness.
As described in Section 2, the Big 5 SOEs, as well as other central SOEs, typically have one or more ListCos. These ListCos are listed vehicles or companies spun off from the large SOEs to inject foreign oversight while enabling private and foreign investors to take part in the Chinese economy. Today, ListCos are around one-third of the size of ParentCos in terms total assets, and have become an important source to attract external equity capital.
Other financial and fiscal policies also support SOE returns
Other finance and fiscal policies also work together to ensure that projects usually make adequate returns. One example is value added-tax (VAT). Despite a nominal VAT rate of 17%, the effective tax rate for coal
Figure 9 - Portion of liability out of total capital (in %) for the Big 5 SOEs (ParentCos) and their listed subsidiaries (ListCos) over 2005-2014.
50
60
70
80
90
100%liabilityto asset
ratio
2014201320122011201020092008200720062005
Big 5 ParentCo
Big 5 ListCo
Source: CPI analysis based on the financial statements of the companies.
17A CPI Report
December 2015 Slowing the Growth of Coal Power in China: the Role of Finance in State-Owned Enterprises
power could be as low as 6%-8% due to large amounts of input tax deduction for items such as equipment purchases,50 benefiting coal-fired generation. 51
The dividend payments for power generation SOEs have also been favorable compared to international levels. Up until 2007, SOEs didn’t pay dividends back to the government, giving them substantial advantages in utilizing capital. In 2007, the government began
50 State Administration of Taxation, Leizhou City Branch, Leizhou-Datang coal power project tax analysis, 2014, (in Chinese) http://www.gd-n-tax.gov.cn/pub/11805/ssxc/swyd/201401/t20140107_449944.html
51 People net, Mistry of Finance VAT concession to hydro enterprises, 2014, (in Chinese) http://energy.people.com.cn/n/2014/0313/c71661-24622330.html Jiangsu Provincial Electric Power Design Institute, Studies on the Economic Evaluation of Thermal Power Projects Based on the VAT Transformation Reform, 2010, (in Chinese) http://nyjsjj.chinaero.com.cn/nyjsjj/ch/reader/create_pdf.aspx?file_no=20100707&flag=1&journal_id=dqkx
to mandate power SOEs to pay 10% of their profit as dividends, and this ratio was gradually increased to 20% in 2014. However, the vast majority of the dividends was refunded back to SOEs through the State Asset Management Budget.52 As a result, the impact of dividend payout requirement changes on SOEs may not be as significant as expected, and dividend requirements for electricity SOEs remained relatively low.
52 NDRC, Announcement on SOE Dividends Measures, 2007 (in Chinese) http://www.mof.gov.cn/zhengwuxinxi/caizhengwengao/caizhengbuwengao2008/caizhengbuwengao20081/200805/t20080519_29015.html . NDRC, Increase of SOE Dividends, 2012, (In Chinese) http://yss.mof.gov.cn/2012zhongyangyusuan/201203/t20120322_637096.html . NDRC, Further Increase of SOE Dividends, 2014, (in Chinese) http://www.mof.gov.cn/pub/qiyesi/zhengwuxinxi/zhengcefabu/201405/t20140506_1075478.html
Box 3: ListCos are a source of external capital for SOEs
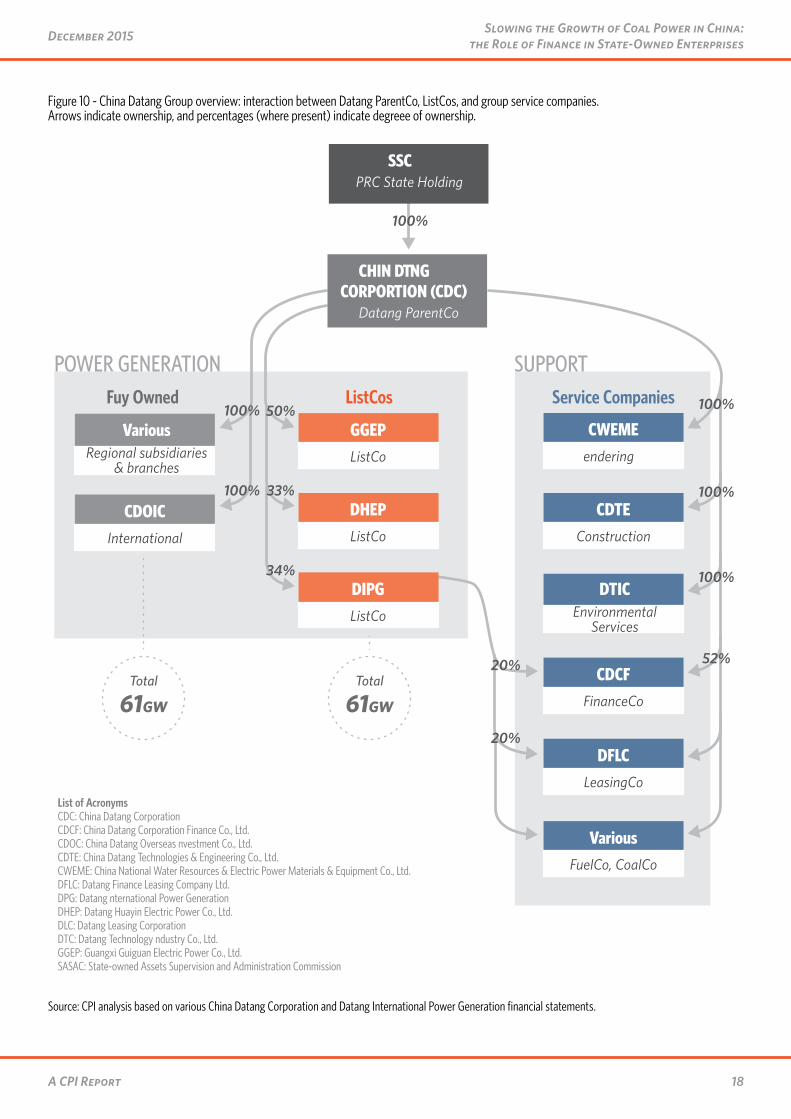
ListCos are controlled by their parent SOEs, with foreign oversight limited to increased transparency and reporting requirements. In fact, ListCos have become a vehicle of choice for the large SOEs to pursue their slow but steady independence from the central government. Notably, they have become a source of capital to monetize growth, by enabling SOE leaders to sell existing assets at market value (rather than just receiving cash flow from the assets), thus facilitating further investments. In particular, this has translated into:
• Injections of high quality assets, or the most attractive plants, from an SOE asset portfolio to its publicly traded subsidiary. These are arranged through arm’s length negotiations between the ParentCo and the ListCo. In principle, negotiations are fair, but in practice the valuations are rather opaque to external investors;
• A complex set of interconnected transactions between the ListCo, the ParentCo, and service companies working for the group, making it hard for external investors to understand how much money goes to projects, where the money is actually from, what the money is used for, the fairness of the valuation/negotiations, etc.
The diagram on the next page (Figure 10 ) illustrates the complex organization of the Datang group. The service companies on the right part of the diagram illustrate projects funded by the ListCos: fuel acquisitions from FuelCos (a subsidiary in the group that specializes in the fuel business), power plant construction from a dedicated subsidiary, provision of finance from the FinanceCo (a subsidiary that specializes in providing financial services to the group).
18A CPI Report
Slowing the Growth of Coal Power in China: the Role of Finance in State-Owned EnterprisesDecember 2015
Figure 10 - China Datang Group overview: interaction between Datang ParentCo, ListCos, and group service companies. Arrows indicate ownership, and percentages (where present) indicate degreee of ownership.
CDTEConstruction
DTICEnvironmental
Services
DFLCLeasingCo
VariousFuelCo, CoalCo
List of AcronymsCDC: China Datang CorporationCDCF: China Datang Corporation Finance Co., Ltd.CDOIC: China Datang Overseas Investment Co., Ltd.CDTE: China Datang Technologies & Engineering Co., Ltd.CWEME: China National Water Resources & Electric Power Materials & Equipment Co., Ltd.DFLC: Datang Finance Leasing Company Ltd.DIPG: Datang International Power GenerationDHEP: Datang Huayin Electric Power Co., Ltd.DLC: Datang Leasing CorporationDTIC: Datang Technology Industry Co., Ltd.GGEP: Guangxi Guiguan Electric Power Co., Ltd.SASAC: State-owned Assets Supervision and Administration Commission
CWEMETendering
GGEPListCo
DHEPListCo
CDCFFinanceCo
ListCos Service CompaniesFully Owned
CDOICInternational
VariousRegional subsidiaries
& branches
POWER GENERATION SUPPORT
61GW
Total
61GW
Total
DIPGListCo
CHINA DATANG CORPORATION (CDC)
Datang ParentCo
SASACPRC State Holding
100%
100%
100%
100%
100%
52%20%
20%
50%
33%
34%
100%
Source: CPI analysis based on various China Datang Corporation and Datang International Power Generation financial statements.
19A CPI Report
December 2015 Slowing the Growth of Coal Power in China: the Role of Finance in State-Owned Enterprises
5. Recent shifts in the macroeconomic environment and government policies are leading to a slowdown in coal power growthCoal power has developed at a very fast pace over the past few decades in China. However, several recent macroeconomic and policy changes which affect coal-fired generation demand and supply are causing this growth to slow down.
5.1 China’s “New Normal” affects domestic supply and demand for electricityAs we mentioned earlier, China has experienced a slowdown in GDP growth in the past few years, with GDP growth slowing to 7.4% in 2014 (see Figure 3). This trend is expected to continue as China adjusts from high to medium-high GDP growth rates. Chinese President Xi Jinping has dubbed this slowdown “The New Normal.”53 The slowdown in economic growth will slow electricity demand and subsequently, growth in demand for coal power. In addition, China’s growth model is shifting from a capital-intensive, export-driven approach to a service-oriented one, which is less energy-intensive and will further slow coal power growth.
Figure 3 (in section 1) shows China’s GDP growth rates and electricity multipliers from 2000 to 2013. Except for 2008 and 2009, China’s electricity multiplier was greater than 1 in the 2000s, meaning that more than 1% of additional electricity was required to produce an additional 1% of GDP. During this time, the growth of the electricity sector supported the development of infrastructure and manufacturing sectors across China.
We are already seeing the slowdown of electricity demand growth. At the beginning of 2014, the China Electricity Council forecasted that the electricity demand growth for the year would be around 7%,54 while the actual growth by the end of 2014 was only 3.8%.55 The effects of slower growth in demand for coal power generation are expected to continue under the “New Normal” phase of Chinese economic transformation.
53 Xinhuanet, Xi’s “new normal” theory, 2014, http://news.xinhuanet.com/english/china/2014-11/09/c_133776839.htm
54 CEC, National Electricity Demand and Supply Forecast, 2014, (in Chinese) http://www.cec.org.cn/guihuayutongji/gongxufenxi/dianligongxufenxi/2014-02-25/117272.html
55 CEC, Annual Electric Power Industry Operation Review, 2014, (in Chinese) http://www.cec.org.cn/guihuayutongji/gongxufenxi/dianliyunxingjiankuang/2015-02-02/133565.html
On the supply side of coal-fired generation, China is increasingly moving toward multiple development goals that give weight to non-GDP factors, including environmental and social concerns. Balancing these targets requires tradeoffs in coal power development. Researchers found that the external cost of coal production and consumption in terms of damage to water, the ecosystem, and human health, as well as emissions of greenhouse gases, amounted to CNY 420 per ton (USD 67 per ton), based on data from 2012. If this cost were to be included in the market cost of coal, its price would almost double.56
The harm to the environment and human health associated with coal power has prompted the State Council to issue the Air Pollution Prevention and Control Action Plan in 2013,57 restricting coal use in coastal provinces.
In addition to environmental and health concerns, wealth distribution considerations are also restraining the growth in supply for coal power from SOEs. SOE companies and their near-monopoly positions have created inefficiencies in various markets. In the past decade, the government has undertaken several rounds of reforms in the SOE sector to encourage more competition; they have allowed SOE companies to trade on the public market, required them to pay more dividends, and reduced loans to them as a percentage of total loans. In the electricity sector in particular, there has also been a resumed effort to conduct market reform since the State Power Corporation was separated into grid companies and generation companies in 2002, this time with a focus on the distribution and retail side. The effects may eventually spill over to the transmission and generation fronts.58 Some of these measures, which are intended to reduce the monopoly position of SOEs and ensure more equitable wealth distribution, will have substantial impacts on the Chinese coal power supply and on SOEs.
56 Teng Fei, The True Cost of Coal, 2014, http://bit.ly/1NSOYSA57 State Council, Air Pollution Prevention and Control Action Plan, 2013,
http://www.cleanairchina.org/product/6349.html58 For example, see NDRC, Shenzhen City Electricity Pricing Reform Pilot,
2014, (in Chinese) http://jgs.ndrc.gov.cn/zcfg/201411/t20141104_639639.html
20A CPI Report
Slowing the Growth of Coal Power in China: the Role of Finance in State-Owned EnterprisesDecember 2015
Lastly, concern over China’s depleting coal reserve is also driving change in how the government views coal power growth. Despite its massive coal reserves, rising coal production is rapidly decreasing the amount of coal remaining for the future. In 2011, China’s reserves-to-production ratio for coal was 34 years, 59 meaning China would exhaust its coal reserve by 2045 if it continued to produce coal at the current rate, whereas merely a decade ago in 2002, this number was 82 years.60 Long aware of the danger coal reserve depletion could pose to the economy, China became a net importer of coal back in 2009 to fund its ever-increasing coal demand,61 and the country is now the top coal importer in the world. Increased dependence on foreign energy sources, however, is risky from an energy security point of view. The State Council’s most recent energy strategy plan stated that the country’s energy self-sufficiency ratio62 should be limited to no less than 85%,63 (the current level is 90%), in order to limit China’s dependency on foreign energy, indicating that energy security is a factor under consideration in the development of energy sources, including coal.
From both supply and demand standpoints, coal power growth going forward will slow. In November 2014, the U.S. and China made a joint announcement of cooperation on climate change and clean energy. China declared its target of peak CO2 emissions by 2030 or sooner.64 In the State Council Energy Development Strategy Plan (2014-2020), China also stated goals to limit coal consumption to 4.2 billion tons, and to reduce coal consumption as a portion of total primary energy consumption to below 62% by 2020.
59 World Energy Council, World Energy Resources 2013 Survey, http://www.worldenergy.org/wp-content/uploads/2013/09/Complete_WER_2013_Survey.pdf
60 World Energy Council, World Energy Resources 2004 Survey, http://www.worldenergy.org/wp-content/uploads/2012/10/PUB_Survey-of-Energy-Resources_2004_WEC.pdf
61 Understanding China’s Rising Coal Imports, Carnegie Endowment, 2012, http://carnegieendowment.org/files/china_coal.pdf
62 Energy self-sufficiency ratio = (Total energy production / Total energy consumption) * 100%
63 State Council, Energy Development Strategy Action Plan (2014-2020), (in Chinese) http://www.gov.cn/zhengce/content/2014-11/19/content_9222.htm
64 The White House, FACT SHEET: U.S.-China Joint Announcement on Climate Change and Clean Energy Cooperation, 2013, http://www.whitehouse.gov/the-press-office/2014/11/11/fact-sheet-us-china-joint-announcement-climate-change-and-clean-energy-c
However, this does not necessarily imply a decline in coal use in the near future. In the 12th Five-Year Plan (2011-2015), the government set the target of adding 300 GW of incremental thermal coal capacity by 2015, representing a 7.8% compound annual growth rate. Moreover, in the latest Energy Development Strategy Action Plan, the State Council declared the “efficient and clean use of fossil energy” is at the same priority level as non-fossil energy deployment, naming coal as a strategic energy resource.65
In addition, alternative energy technologies have not yet reached enough capacity to replace coal growth. For renewable energy technologies, given an average 25% capacity factor for wind and 15% for solar, growth needs to double or triple in order to substitute for the targeted coal power capacity increase.66 For hydro energy, limited river resources are the biggest concern, as current deployed hydro capacity accounts for 70% of the economically exploitable amount.67 Nuclear energy is potentially a meaningful energy source to provide an alternative to coal; however, long construction periods as well as safety concerns could hamper nuclear power’s ability to significantly replace coal. For natural gas, China has prioritized non-power uses such as transportation, heating, and cooking over power generation, given limited supplies.68 The government also allows differential pricing for gas generators, instead of providing a benchmark tariff as it does with other energy technologies, which reduces the electricity price risk for investors. Given the various concerns and constraints of alternative energy capacity development and the need to ensure electricity supply meets demand, significant effort will still be required to ensure China is on the right track to meet its low-carbon energy transition goals.
5.2 Policy changes are being deployed to constrain coal power growthTo meet these changing priorities, the central government has pulled back on some of its support for SOEs. More broadly, this effort has translated into a multi-pronged set of changes affecting the SOEs’ cash flows and profitability (see Table 3 for a summary of the major changes).
65 State Council, Energy Development Strategy Action Plan, 2014, (in Chinese) http://www.gov.cn/zhengce/content/2014-11/19/content_9222.htm
66 Source: CPI interviews67 UBS, Chinese Independent Power Producers report, 2014, http://www.
adaro.com/wp-content/uploads/2014/04/uep05373.pdf68 NRDC, Announcement on Natural Gas Power On-grid Tariff Management,
2014 http://www.sdpc.gov.cn/zcfb/zcfbtz/201501/t20150114_660176.html
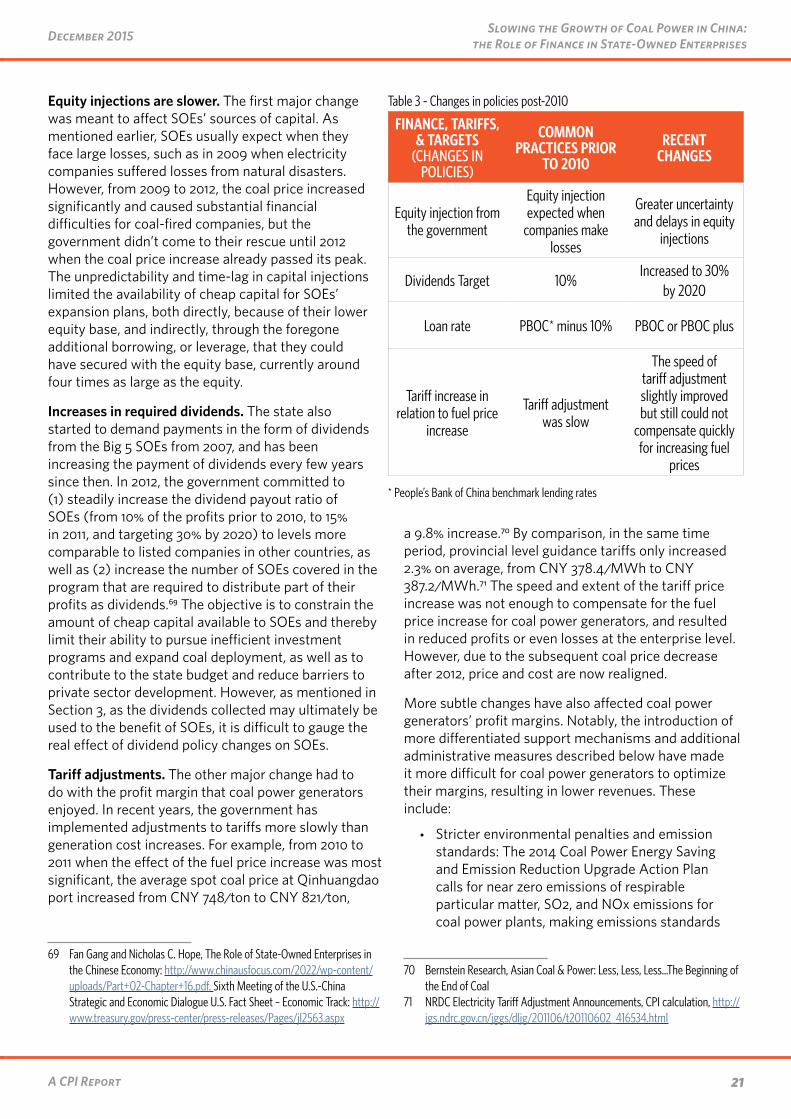
21A CPI Report
December 2015 Slowing the Growth of Coal Power in China: the Role of Finance in State-Owned Enterprises
Equity injections are slower. The first major change was meant to affect SOEs’ sources of capital. As mentioned earlier, SOEs usually expect when they face large losses, such as in 2009 when electricity companies suffered losses from natural disasters. However, from 2009 to 2012, the coal price increased significantly and caused substantial financial difficulties for coal-fired companies, but the government didn’t come to their rescue until 2012 when the coal price increase already passed its peak. The unpredictability and time-lag in capital injections limited the availability of cheap capital for SOEs’ expansion plans, both directly, because of their lower equity base, and indirectly, through the foregone additional borrowing, or leverage, that they could have secured with the equity base, currently around four times as large as the equity.
Increases in required dividends. The state also started to demand payments in the form of dividends from the Big 5 SOEs from 2007, and has been increasing the payment of dividends every few years since then. In 2012, the government committed to (1) steadily increase the dividend payout ratio of SOEs (from 10% of the profits prior to 2010, to 15% in 2011, and targeting 30% by 2020) to levels more comparable to listed companies in other countries, as well as (2) increase the number of SOEs covered in the program that are required to distribute part of their profits as dividends.69 The objective is to constrain the amount of cheap capital available to SOEs and thereby limit their ability to pursue inefficient investment programs and expand coal deployment, as well as to contribute to the state budget and reduce barriers to private sector development. However, as mentioned in Section 3, as the dividends collected may ultimately be used to the benefit of SOEs, it is difficult to gauge the real effect of dividend policy changes on SOEs.
Tariff adjustments. The other major change had to do with the profit margin that coal power generators enjoyed. In recent years, the government has implemented adjustments to tariffs more slowly than generation cost increases. For example, from 2010 to 2011 when the effect of the fuel price increase was most significant, the average spot coal price at Qinhuangdao port increased from CNY 748/ton to CNY 821/ton,
69 Fan Gang and Nicholas C. Hope, The Role of State-Owned Enterprises in the Chinese Economy: http://www.chinausfocus.com/2022/wp-content/uploads/Part+02-Chapter+16.pdf. Sixth Meeting of the U.S.-China Strategic and Economic Dialogue U.S. Fact Sheet – Economic Track: http://www.treasury.gov/press-center/press-releases/Pages/jl2563.aspx
a 9.8% increase.70 By comparison, in the same time period, provincial level guidance tariffs only increased 2.3% on average, from CNY 378.4/MWh to CNY 387.2/MWh.71 The speed and extent of the tariff price increase was not enough to compensate for the fuel price increase for coal power generators, and resulted in reduced profits or even losses at the enterprise level. However, due to the subsequent coal price decrease after 2012, price and cost are now realigned.
More subtle changes have also affected coal power generators’ profit margins. Notably, the introduction of more differentiated support mechanisms and additional administrative measures described below have made it more difficult for coal power generators to optimize their margins, resulting in lower revenues. These include:
• Stricter environmental penalties and emission standards: The 2014 Coal Power Energy Saving and Emission Reduction Upgrade Action Plan calls for near zero emissions of respirable particular matter, SO2, and NOx emissions for coal power plants, making emissions standards
70 Bernstein Research, Asian Coal & Power: Less, Less, Less…The Beginning of the End of Coal
71 NRDC Electricity Tariff Adjustment Announcements, CPI calculation, http://jgs.ndrc.gov.cn/jggs/dljg/201106/t20110602_416534.html
Table 3 - Changes in policies post-2010
FINANCE, TARIFFS, & TARGETS
(CHANGES IN POLICIES)
COMMON PRACTICES PRIOR
TO 2010
RECENT CHANGES
Equity injection from the government
Equity injection expected when
companies make losses
Greater uncertainty and delays in equity
injections
Dividends Target 10%Increased to 30%
by 2020
Loan rate PBOC* minus 10% PBOC or PBOC plus
Tariff increase in relation to fuel price
increase
Tariff adjustment was slow
The speed of tariff adjustment slightly improved but still could not
compensate quickly for increasing fuel
prices
* People’s Bank of China benchmark lending rates
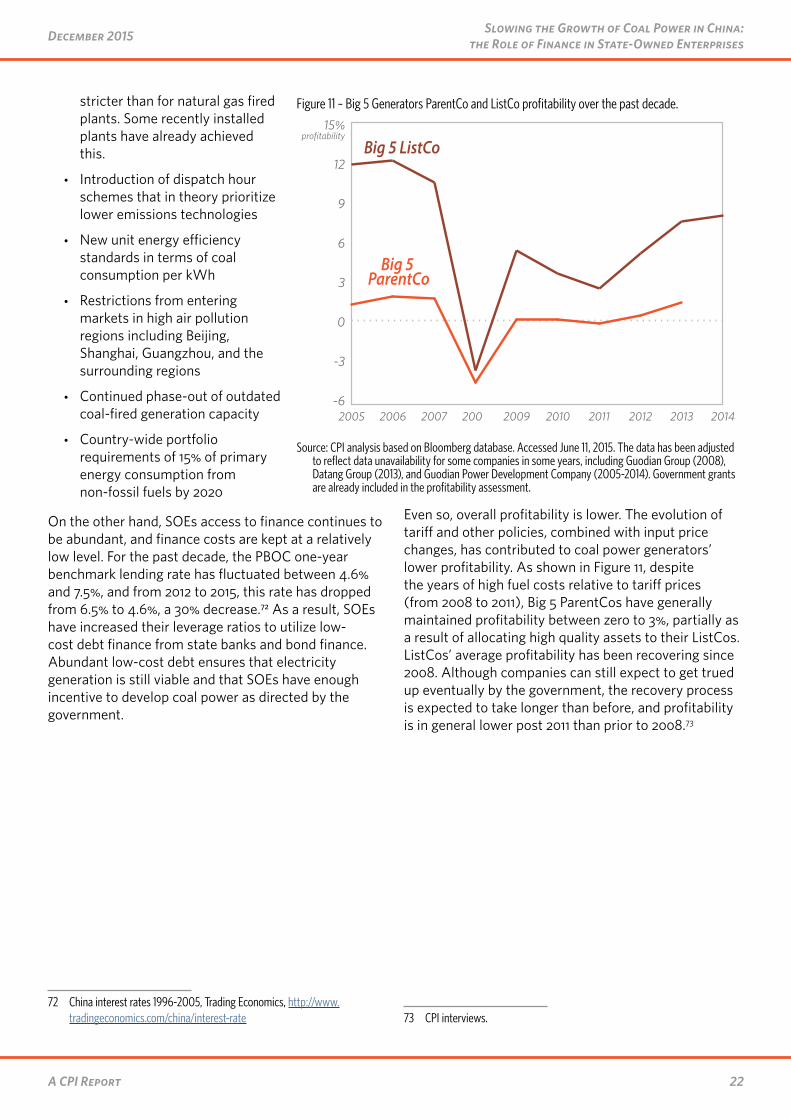
22A CPI Report
Slowing the Growth of Coal Power in China: the Role of Finance in State-Owned EnterprisesDecember 2015
stricter than for natural gas fired plants. Some recently installed plants have already achieved this.
• Introduction of dispatch hour schemes that in theory prioritize lower emissions technologies
• New unit energy efficiency standards in terms of coal consumption per kWh
• Restrictions from entering markets in high air pollution regions including Beijing, Shanghai, Guangzhou, and the surrounding regions
• Continued phase-out of outdated coal-fired generation capacity
• Country-wide portfolio requirements of 15% of primary energy consumption from non-fossil fuels by 2020
On the other hand, SOEs access to finance continues to be abundant, and finance costs are kept at a relatively low level. For the past decade, the PBOC one-year benchmark lending rate has fluctuated between 4.6% and 7.5%, and from 2012 to 2015, this rate has dropped from 6.5% to 4.6%, a 30% decrease.72 As a result, SOEs have increased their leverage ratios to utilize low-cost debt finance from state banks and bond finance. Abundant low-cost debt ensures that electricity generation is still viable and that SOEs have enough incentive to develop coal power as directed by the government.
72 China interest rates 1996-2005, Trading Economics, http://www.tradingeconomics.com/china/interest-rate
Even so, overall profitability is lower. The evolution of tariff and other policies, combined with input price changes, has contributed to coal power generators’ lower profitability. As shown in Figure 11, despite the years of high fuel costs relative to tariff prices (from 2008 to 2011), Big 5 ParentCos have generally maintained profitability between zero to 3%, partially as a result of allocating high quality assets to their ListCos. ListCos’ average profitability has been recovering since 2008. Although companies can still expect to get trued up eventually by the government, the recovery process is expected to take longer than before, and profitability is in general lower post 2011 than prior to 2008.73
73 CPI interviews.
Figure 11 – Big 5 Generators ParentCo and ListCo profitability over the past decade.
-6
-3
0
3
6
9
12
15% profitability
2014201320122011201020092008200720062005
Big 5 ParentCo
Big 5 ListCo
Source: CPI analysis based on Bloomberg database. Accessed June 11, 2015. The data has been adjusted to reflect data unavailability for some companies in some years, including Guodian Group (2008), Datang Group (2013), and Guodian Power Development Company (2005-2014). Government grants are already included in the profitability assessment.
23A CPI Report
December 2015 Slowing the Growth of Coal Power in China: the Role of Finance in State-Owned Enterprises
6. The impact of changes in government policy and finance support for coal power SOEs has been limitedThe government has been attempting to slow down the expansion of coal power and to impose greater financial discipline on SOEs through increasing dividend requirements and encouraging the use of ListCos to raise further equity. However, in spite of the reductions in government support for coal-fired power, the impact on SOEs’ ability to invest in coal-fired generation to date has been limited, as power generators are becoming increasingly autonomous and financially self-sustaining.
6.1 SOEs are increasingly self-sustainingIn order to maintain profitability levels, SOEs have been aggressive in building new coal power plants over the years. In the past, their expansion targets have required significant financing from external sources, including the government, for their massive capital expenditures. Recently, however, SOEs’ asset base has grown large enough to allow them to fund their coal capital expenditures internally and SOEs are becoming increasingly independent of external capital support. Our analysis indicates that in recent years, tariff revenue to cover depreciation expenses has become large enough to cover SOEs’ coal power construction costs.
For the Big 5 SOEs, financing for capital expenditures can come from three sources:
• Cash from operating activities: SOEs can use retained earnings (after paying the dividends required by the government) as well as tariff revenues meant to cover depreciation expenses.
• Cash from financing activities: SOEs may take on additional debt by borrowing from banks or issuing bonds, or obtain equity injections from the government and as well as from public equity markets through issuance of new ListCo shares.
• Cash from investment and divestment activities: SOEs can generate positive cash flow from divesting stakes in affiliates and assets. They have only engaged in asset sales to a limited extent.
Previously, we have illustrated how SOEs have financed growing capital expenditures largely through increasing levels of debt which have been enabled both through increased allowed leverage as well as a growing equity base coming from retained earnings, the issuance of ListCo shares, and capital injections from the government as needed. We have also seen that recent changes in government policy have resulted in lower profitability, though SOEs still have access to low-cost debt for capital expenditures.
SOE tariff revenues have grown large enough so they can finance coal capital expenditures from operating cash flows alone.
The government sets coal power tariffs at a level sufficient to cover average generation costs (including fuel and labor), taxes, depreciation expenses, and to provide investors (both debt and equity) a return on invested capital. Tariff revenues provided to cover depreciation expenses – which amount to between 2-5% of total asset value each year – and provide a return on capital are now a significant source of cash for SOE capital expenditures.
If the SOEs were privately owned, these revenues represent a return of – and on – invested capital which could either be distributed to investors or reinvested to drive earnings growth. However, as discussed earlier, the state has historically demanded very modest distributions for its equity stake in the SOEs. Instead, the state has set incentives to focus SOE management on achieving policy targets, and SOE management is incentivized in particular to focus on maximizing firm asset value and achieve capacity targets. As a result, the tariff revenues have largely been reinvested to grow their portfolios of generation assets in order to meet the asset and capacity targets set by the state. This has enabled the SOEs to support sustained capacity growth in the near to mid-term, and allow for a sustained level of self-financed capacity over the long-term.74
74 The ideas here is that in the near term (before many of the initial assets are retired), when these cash flows are invested in capital assets, they further increase the asset base, and thereby increase cash flows from tariffs to cover asset depreciation and returns available for capital investments. This process repeats and sustains the growth of assets, contributing to the virtuous circle from which SOEs are now benefiting. In the long-term (after the initial assets are retired), capacity growth will be offset by asset retirement, and cash from tariffs to cover depreciation expenses alone can only be used to sustain some level of capacity. Retained earnings from profits are also needed for capacity growth.
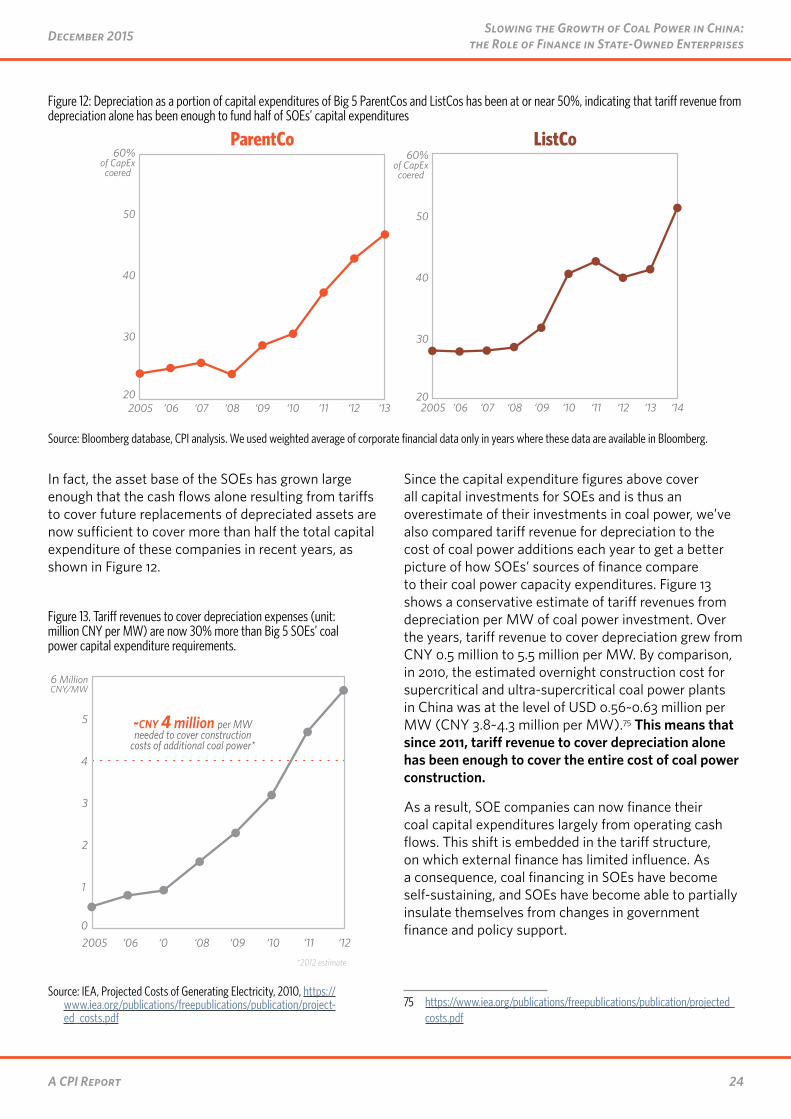
24A CPI Report
Slowing the Growth of Coal Power in China: the Role of Finance in State-Owned EnterprisesDecember 2015
In fact, the asset base of the SOEs has grown large enough that the cash flows alone resulting from tariffs to cover future replacements of depreciated assets are now sufficient to cover more than half the total capital expenditure of these companies in recent years, as shown in Figure 12.
Since the capital expenditure figures above cover all capital investments for SOEs and is thus an overestimate of their investments in coal power, we’ve also compared tariff revenue for depreciation to the cost of coal power additions each year to get a better picture of how SOEs’ sources of finance compare to their coal power capacity expenditures. Figure 13 shows a conservative estimate of tariff revenues from depreciation per MW of coal power investment. Over the years, tariff revenue to cover depreciation grew from CNY 0.5 million to 5.5 million per MW. By comparison, in 2010, the estimated overnight construction cost for supercritical and ultra-supercritical coal power plants in China was at the level of USD 0.56~0.63 million per MW (CNY 3.8~4.3 million per MW).75 This means that since 2011, tariff revenue to cover depreciation alone has been enough to cover the entire cost of coal power construction.
As a result, SOE companies can now finance their coal capital expenditures largely from operating cash flows. This shift is embedded in the tariff structure, on which external finance has limited influence. As a consequence, coal financing in SOEs have become self-sustaining, and SOEs have become able to partially insulate themselves from changes in government finance and policy support.
75 https://www.iea.org/publications/freepublications/publication/projected_costs.pdf
Figure 12: Depreciation as a portion of capital expenditures of Big 5 ParentCos and ListCos has been at or near 50%, indicating that tariff revenue from depreciation alone has been enough to fund half of SOEs’ capital expenditures
ParentCo ListCo
‘13‘12‘11‘10‘09‘08‘07‘062005 ‘14‘13‘12‘11‘10‘09‘08‘07‘06200520
30
40
50
60%of CapEx covered
20
30
40
50
60%of CapEx covered
Source: Bloomberg database, CPI analysis. We used weighted average of corporate financial data only in years where these data are available in Bloomberg.
Figure 13. Tariff revenues to cover depreciation expenses (unit: million CNY per MW) are now 30% more than Big 5 SOEs’ coal power capital expenditure requirements.
0
1
2
3
4
5
6 Million CNY/MW
‘12‘11‘10‘09‘08‘07‘062005
~CNY 4 million per MW needed to cover construction
costs of additional coal power*
*2012 estimate
Source: IEA, Projected Costs of Generating Electricity, 2010, https://www.iea.org/publications/freepublications/publication/project-ed_costs.pdf
25A CPI Report
December 2015 Slowing the Growth of Coal Power in China: the Role of Finance in State-Owned Enterprises
Other adaptations have also ensured SOEs’ ability to grow despite reduced government support
The Big 5 SOEs have grown into integrated and diversified players, allowing them to better manage the major risks in the coal power industry (such as fuel price risk, revenue risk, construction risk, etc.). At one point, SOEs even went against the will of the central government when they integrated coal mining companies in order to offset the impact of increased input prices.76 Their more diversified role has also allowed SOEs to pursue profitable business opportunities in related domestic sectors (such as maritime transportation, port services, finance, railways, nuclear, etc.). As a result, a significant portion of the revenues and costs are now from activities other than coal power generation. For example, in 2013, around 21% of China Power International Development Corporation’s revenue came from non-coal power businesses, and around 15% of Guodian Power Development Company’s revenue came from non-electricity businesses. If accounting for electricity generation from non-coal sources, this number would be even higher.77 SOEs have also pursued profitable business opportunities outside of China, or outside of their typical set of activities, for example acquiring shares from financial institutions to increase profitability.
In addition, the Big 5 SOEs have more political clout than other domestic players. Interviews with stakeholders suggested that as owners of state assets, SOEs have enjoyed quicker permitting for coal power plants than non-SOEs. Likewise, SOEs have been able to exercise negotiating power in their dealings with upstream input prices through methods such as signing contracts for long-term coal supplies at lower than market prices, allowing them to maintain relatively high operating margins and insulating them to a certain extent from unfavorable market conditions.
Today, only SOEs have the financing capacity to deploy ultra-supercritical coal-fired plants with high upfront costs. Building ultra-supercritical units of 600 MW or larger, which will be required to reach government installed capacity and efficiency targets, is capital intensive and requires high up-front costs. Large SOEs
76 New trends in electricity generation companies’ capital strategies, China Electric Power News Net, 2010, (in Chinese) http://www.chinaero.com.cn/yjgc/jygl/05/19132.shtml
77 CPI analysis, Bloomberg database.
not only have the capability to develop these projects, but also can channel government resources, such as low-cost equity and debt, to finance them.
Foreign and external investors have little potential to impact SOE investment decisions
As discussed earlier, SOEs account for most investment in coal power, with non-SOE capital representing only a small fraction of total coal power financing, with minority stakes in joint-venture generation assets, or non-controlling shares of ListCos listed in Hong-Kong or Shanghai.
ListCos are owned mostly by SOEs (sometimes by multiple SOEs), rather than foreign or domestic private investors. These ListCos help the SOEs secure additional capital to fuel continued growth while allowing state-owned actors ensure that they maintain control of the entities. Similarly, foreign and/or private partners (if any) in joint ventures are always limited to a minority stake. Power plant construction companies often own less than 5% of the power plant special purpose vehicle which remunerate them for their work, but they do not exercise any significant control over the asset. Foreign investors such as the French energy group EDF are more interested in cementing a longer-term relationship with a big Chinese electricity player than in ownership.
Some pure private players have been able to deploy assets and investments relatively independently thanks to carefully orchestrated management of their relationships with the central government. However, the bulk of the foreign and external capital secured is injected into SOE-controlled vehicles; this arrangement makes sense for SOEs because these external actors don’t have control over the assets or representation among management and directors. Until recently, foreign investors in coal power projects were driven out of the country (including notably AES in 2012) because projects were not meeting the required rates of return.78 Compared to their SOE counterparts, domestic and foreign private investors typically have less of a financial cushion, and are under greater pressure and scrutiny from their investors. 2014 saw a resurgence of related inward foreign direct investment (see box on the case study of a joint venture between EDF and Datang).
78 Reuters (07/05/2012): http://www.reuters.com/article/2012/05/07/us-aes-idUSBRE8460J420120507
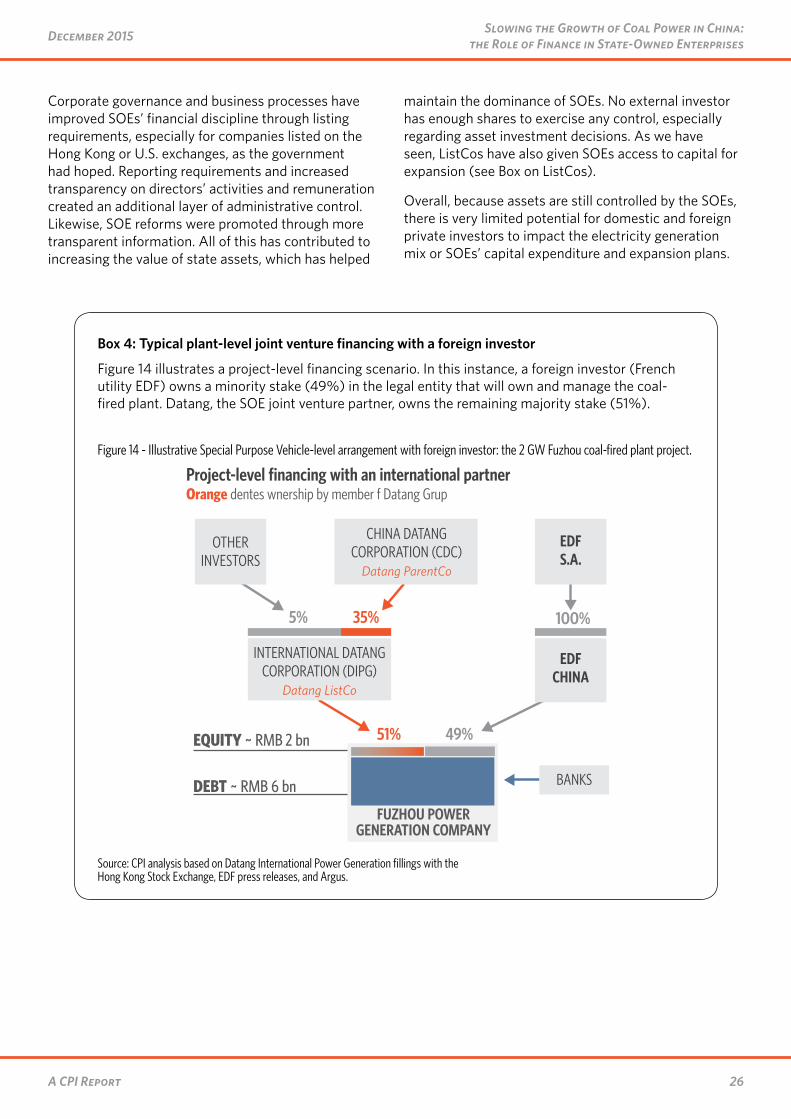
26A CPI Report
Slowing the Growth of Coal Power in China: the Role of Finance in State-Owned EnterprisesDecember 2015
Corporate governance and business processes have improved SOEs’ financial discipline through listing requirements, especially for companies listed on the Hong Kong or U.S. exchanges, as the government had hoped. Reporting requirements and increased transparency on directors’ activities and remuneration created an additional layer of administrative control. Likewise, SOE reforms were promoted through more transparent information. All of this has contributed to increasing the value of state assets, which has helped
maintain the dominance of SOEs. No external investor has enough shares to exercise any control, especially regarding asset investment decisions. As we have seen, ListCos have also given SOEs access to capital for expansion (see Box on ListCos).
Overall, because assets are still controlled by the SOEs, there is very limited potential for domestic and foreign private investors to impact the electricity generation mix or SOEs’ capital expenditure and expansion plans.
Box 4: Typical plant-level joint venture financing with a foreign investor
Figure 14 illustrates a project-level financing scenario. In this instance, a foreign investor (French utility EDF) owns a minority stake (49%) in the legal entity that will own and manage the coal-fired plant. Datang, the SOE joint venture partner, owns the remaining majority stake (51%).
Figure 14 - Illustrative Special Purpose Vehicle-level arrangement with foreign investor: the 2 GW Fuzhou coal-fired plant project.
FUZHOU POWER GENERATION COMPANY
INTERNATIONAL DATANG CORPORATION (DIPG)
Datang ListCo
CHINA DATANG CORPORATION (CDC)
Datang ParentCo
OTHERINVESTORS
35%65%
51% 49%
Orange denotes ownership by member of Datang Group Project-level financing with an international partner
EQUITY ~ RMB 2 bn
DEBT ~ RMB 6 bn BANKS
EDFS.A.
EDFCHINA
100%
Source: CPI analysis based on Datang International Power Generation fillings with the Hong Kong Stock Exchange, EDF press releases, and Argus.
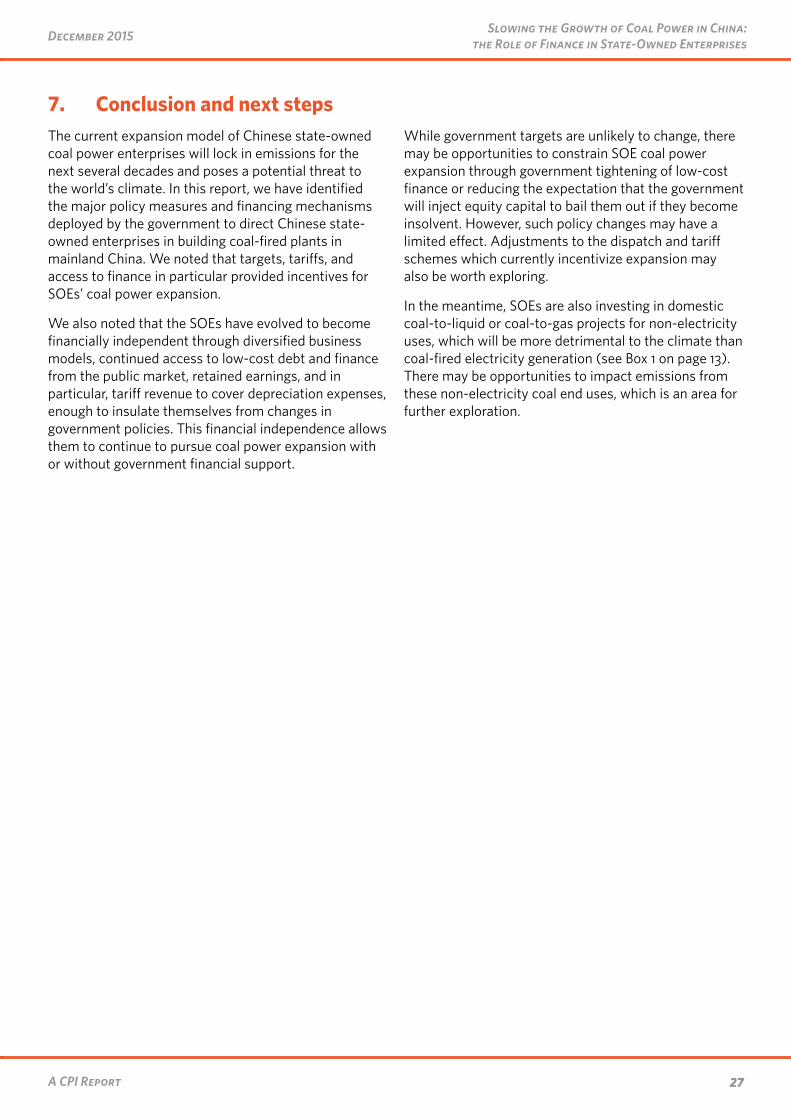
27A CPI Report
December 2015 Slowing the Growth of Coal Power in China: the Role of Finance in State-Owned Enterprises
7. Conclusion and next stepsThe current expansion model of Chinese state-owned coal power enterprises will lock in emissions for the next several decades and poses a potential threat to the world’s climate. In this report, we have identified the major policy measures and financing mechanisms deployed by the government to direct Chinese state-owned enterprises in building coal-fired plants in mainland China. We noted that targets, tariffs, and access to finance in particular provided incentives for SOEs’ coal power expansion.
We also noted that the SOEs have evolved to become financially independent through diversified business models, continued access to low-cost debt and finance from the public market, retained earnings, and in particular, tariff revenue to cover depreciation expenses, enough to insulate themselves from changes in government policies. This financial independence allows them to continue to pursue coal power expansion with or without government financial support.
While government targets are unlikely to change, there may be opportunities to constrain SOE coal power expansion through government tightening of low-cost finance or reducing the expectation that the government will inject equity capital to bail them out if they become insolvent. However, such policy changes may have a limited effect. Adjustments to the dispatch and tariff schemes which currently incentivize expansion may also be worth exploring.
In the meantime, SOEs are also investing in domestic coal-to-liquid or coal-to-gas projects for non-electricity uses, which will be more detrimental to the climate than coal-fired electricity generation (see Box 1 on page 13). There may be opportunities to impact emissions from these non-electricity coal end uses, which is an area for further exploration.