Embed Size (px)
Citation preview
REPUBLIC OF SLOVENIA
SLOVENIA’S FOURTH BIENNIAL REPORT
UNFCCC
MARCH, 2020
2
LIST OF ABBREVIATIONS
AEA Annual emission allocation
AN sNES National Action Plan for Nearly Zero-Energy Buildings Up to 2020
AN URE Energy Efficiency Action Plan
EARS Slovenian Environment Agency
BAT Best available techniques
GDP Gross domestic product
BEV Battery electric vehicle
CCU Carbon capture and utilisation
CDM Clean Development Mechanism
CER Certified Emission Reductions
CLRTAP Convention on Long-Range Transboundary Air Pollution
CH4 Methane
CO2 Carbon dioxide
CRF Common Reporting Format
CŠOD Centre for School and Outdoor Education
DH District heating
DRI DRI Investment Management, Company for the Development of
Infrastructure
DRSI Slovenian Infrastructure Agency
DSEPS Long-Term Strategy for Promoting Investments in the Energy Renovation of
Buildings
EC European Commission
EEA European Environment Agency
EED EU Directive on Energy Efficiency (2012/27/EU)
Eco Fund Slovenian environmental public fund
EKS Energy Concept of Slovenia
EAFRD European Agricultural Fund for Rural Development
ELENA joint initiative by the EIB and the European Commission providing grants
for technical assistance
ELKO Light fuel oil
ENSVET Energy counselling for citizens
ERU Emission reduction units
ERTMS European Railway Traffic Management System
ESD Decisions 4006/2009/EC on the efforts of Member States to reduce
greenhouse gas emissions to meet the Community’s greenhouse gas
emission reduction commitments up to 2020
ERDF European Regional Development Fund
ETCS European train control system
ETS (EU-ETS) EU Emission Trading System
EU European Union
EUREM The education for European Energy Manager
EUROSTAT Statistical Office of the European Communities
EZ Energy Act
GIS Slovenian Forestry Institute

3
GWP Global-warming potential
HPP Hydropower plants
HFC Hydrofluorocarbons
HWP Harvested wood products
IJPP Integrated public passenger transport
IJS-CEU Institute Jožef Stefan – Energy Efficiency Centre
IPCC Intergovernmental Panel on Climate Change
IT Information technology
ITI Integrated territorial investments
ITS Integrated Transport Strategy
JE Nuclear power plant
PPT Public passenger transport
JZP Public-Private Partnership
KIS Slovenian Agriculture Institute
KOPOP Agri-environment-climate payments
LEC Local Energy Concept
LIFE LIFE is a European financial mechanism intended exclusively for measures
in the field of environmental protection, nature conservation and mitigation
and adaptation to climate change
LULUCF Land Use, Land-Use Change and Forestry
MMR Monitoring Mechanism Regulation for GHG emissions
MESP Ministry of the Environment and Spatial Planning
SME Medium and small enterprises
MzI Ministry of Infrastructure
neETS devices, emissions or sectors outside the EU-ETS scheme (see also ESD)
NECP National Energy and Climate Plan
LCS Low carbon society
NOx Nitrogen oxides
NGO Non-governmental organisations
OP ECP Operational Programme for the Implementation of the EU Cohesion Policy
OP NGP Operational Programme for the implementation of the National Forest
Programme 2017-2021
OP GHG-2020 Operational Programme for Reducing Greenhouse Gas Emissions by 2020
OPZG Framework Programme for the Transition to a Green Economy
PDCA Plan – Do – Check – Act
PFC Per-fluorocarbons
PM Particulate matter
PN Production device
RDP Rural Development Programme
PURES Rules on Efficient Energy Use in Buildings (Official Gazette of the Republic
of Slovenia, Nos. 52/10 and 61/17 – GZ)
PV photovoltaic (solar) power plant
ReNGP Resolution on National Forest Programme
ReNPRP30 Resolution on the National Programme for the Development of Transport of
the Republic of Slovenia until 2030
ReNPURSK Resolution on the National Programme on Strategic Orientations for the
Development of Slovenian Agriculture and Food Industry “Our Food, Rural
and Natural Resources 2021”

4
ReNPVO20–30 Resolution on the National Environment Protection Programme for the 2020-
2030 period
RES Renewable energy sources
RS Republic of Slovenia
SF6 Sulfur hexafluoride
CHP Cogeneration
TDS Transport Development Strategy
SRS Development Strategy of Slovenia
SORS Statistical Office of the Republic of Slovenia
HP Heat pumps
TEB Brestanica Thermal Power Plant
TEN-T Trans-European Transport Network
TEŠ Šoštanj Thermal Power Plant
TE-TOL Ljubljana Heat and Power Plant
GHG Greenhouse gases
UNFCCC United Nations Framework Convention on Climate Change
LPG Liquefied Petroleum Gas
EEU Energy Efficiency (Efficient energy use)
WLTP Worldwide Harmonised Light Vehicles Test Procedure
NG Natural Gas
ZVO Environment Protection Act

5
1 EXECUTIVE SUMMARY ............................................................................................................... 7
2 INFORMATION ON GHG EMISSIONS AND TRENDS, GHG INVENTORY INCLUDING INFORMATION ON NATIONAL INVENTORY SYSTEM ......................................................................................... 12
2.1 GREENHOUSE GAS EMISSIONS FROM 1986 TO 2017 ......................................................................... 12 2.1.1 Description and Interpretation of Emission Trends for Aggregated GHG emissions ........ 12 2.1.2 Description and Interpretation of Emission Trends for by Gas ......................................... 12 2.1.3 Description and Interpretation of Emission Trends by Sector ........................................... 13 2.2 THE NATIONAL SYSTEM ................................................................................................................ 18 2.2.1 Summary information on National Inventory Arrangements ........................................... 18 2.2.2 Overview of inventory planning, preparation and management ..................................... 19 2.2.3 Quality assurance, quality control and verification plan .................................................. 20 2.2.4 Summary information on Changes to National Inventory Arrangements ........................ 20
3 QUANTIFIED ECONOMY-WIDE EMISSIONS REDUCTION TARGET .............................................. 21
3.1 THE EU TARGET UNDER THE CONVENTION ....................................................................................... 21 3.2 THE EU TARGET COMPLIANCE ARCHITECTURE ................................................................................... 22 3.2.1 The 2020 Climate and Energy Package ............................................................................. 22 3.2.2 Monitoring progress towards the 2020 ESD targets......................................................... 24 3.2.3 The Slovenian reduction targets under the ESD (non-ETS) and its progress until 2017 .... 24
4 PROGRESS IN THE ACHIEVEMENT OF QUANTIFIED ECONOMY-WIDE EMISSION REDUCTION TARGETS AND RELEVANT INFORMATION ................................................................................. 26
4.1 BACKGROUND AND RECENT POLICY DEVELOPMENT ............................................................................ 26 4.2 REGIONAL AND LOCAL ACTIVITIES IN THE FIELD OF CLIMATE CHANGE...................................................... 29 4.3 MULTI-SECTORAL INSTRUMENTS .................................................................................................... 31 4.4 ENERGY SUPPLY .......................................................................................................................... 44 4.5 ENERGY USE .............................................................................................................................. 50 4.6 USE OF ENERGY IN TRANSPORT ...................................................................................................... 60 4.7 INDUSTRIAL PROCESSES ............................................................................................................... 68 4.8 AGRICULTURE ............................................................................................................................ 69 4.9 WASTE ..................................................................................................................................... 71 4.10 FORESTRY ................................................................................................................................. 74 4.11 ASSESSMENT OF THE ECONOMIC AND SOCIAL CONSEQUENCES OF RESPONSE MEASURES ............................ 75 4.12 POLICIES AND MEASURES NO LONGER IN PLACE ................................................................................. 76 4.13 MONITORING AND EVALUATION OF PROGRESS IN CLIMATE CHANGE MEASURES ....................................... 76 4.14 PROCEDURES FOR PUBLIC PARTICIPATION ........................................................................................ 77 4.15 USE OF UNITS FROM MARKET MECHANISMS AND LAND USE, CHANGES IN LAND USE AND FOREST MANAGEMENT ............................................................................................................................................... 78
5 PROJECTIONS ........................................................................................................................... 79
5.1 DEFINITION OF SCENARIOS ........................................................................................................... 79 5.2 DEFINITION OF SECTORS IN PROJECTIONS ......................................................................................... 81 5.3 PROJECTION RESULTS .................................................................................................................. 82 5.3.1 Total Emissions of Greenhouse Gases ............................................................................... 82 5.3.2 Carbon Dioxide .................................................................................................................. 83 5.3.3 Methane ........................................................................................................................... 84 5.3.4 Nitrous Oxide .................................................................................................................... 85 5.3.5 F-gases .............................................................................................................................. 86 5.3.6 Emissions by Sector ........................................................................................................... 87 5.3.7 International bunkers ....................................................................................................... 94 5.3.8 Projections of CO2 Sinks .................................................................................................... 95 5.4 EU-ETS IN THE PROJECTIONS ....................................................................................................... 96 5.5 NON-ETS IN PROJECTIONS ........................................................................................................... 98 5.6 THE TOTAL EFFECT OF MEASURES ................................................................................................ 103

6
5.7 COMPARISON WITH THE PROJECTIONS IN PREVIOUS REPORTS ........................................................... 104 5.8 UNCERTAINTY IN PROJECTIONS .................................................................................................... 105 5.9 SENSITIVITY OF PROJECTIONS ...................................................................................................... 107 5.10 CHANGE IN THE PROJECTION METHODOLOGY ................................................................................. 109

7
1 Executive summary
INFORMATION ON GHG EMISSIONS AND TRENDS, GHG INVENTORY INCLUDING
INFORMATION ON NATIONAL INVENTORY SYSTEM
Total emissions of GHG in 2017, sinks not considered, amounted to 17,453 kt CO2 eq.,
which represents a 14.5% decrease of emissions compared to the year 1986. In 2009,
emissions from fuel used and from industrial processes started to decrease due to the
global financial crisis. In 2010 and 2011, emissions stayed almost the same as in 2009.
Since 2012 emissions started to decrease until 2014, while in the last three years a
slow increase has been observed.
CO2 emissions are dominant and in 2017 represented 81.7% of overall emissions of
greenhouse gases, followed by CH4 with 12.0 %, N2O with 4.0 % and F-gases with
2.2 %.
Energy is by far the most important sector accounting 80.2 % in 2017, with transport
being the largest source representing 31.7 % in total emissions. Agriculture
accounted 9.7 % of all emissions.
QUANTIFIED ECONOMY-WIDE EMISSION REDUCTION TARGETS
In 2010, the EU submitted a pledge to reduce its GHG emissions by 2020 by 20%
compared to 1990 levels, in order to contribute to achieving the ultimate objective of
the UNFCCC: 'to stabilise GHG concentrations at a level that would prevent
dangerous anthropogenic (human-induced) interference with the climate system', or,
in other words, to limit the global temperature increase to less than 2°C compared to
temperature levels before industrialization. The definition of the Convention target
for 2020 is documented in the revised note provided by the UNFCCC Secretariat on
the ‘Compilation of economy-wide emission reduction targets to be implemented by
Parties included in Annex I to the Convention’. EU provided additional information
relating to its quantified economy wide emission reduction target in a submission as
part of the process of clarifying the developed country Parties' targets in 2012.
In 2009, the EU established internal rules under its 2020 Climate and Energy Package.
These rules underpin the EU implementation of the target under the Convention. The
package introduced a clear approach to achieving the 20 % reduction of total GHG
emissions from 1990 levels, reduction that is equivalent to a 14 % reduction
compared to 2005 levels. This 14 % reduction objective is divided between the ETS
and ESD sectors. These two sub-targets are: a 21% reduction target compared to 2005
for emissions covered by the ETS (including domestic and international aviation) and
a 10% reduction target compared to 2005 for ESD sectors, shared between the 28
Member States (MS) through individual national GHG targets.

8
Slovenia is committed to increase its emissions in sectors covered by the ESD (non-
ETS) by less than 4% compared to 2005. The quantified annual reduction targets for
Slovenia, as set by EU Decisions and expressed as annual emission allocations
(AEAs) in tonnes CO2-equivalent, are 12.3 million in 2013, increasing to 12.4 million
in 2016 and after correction in 2017 12.2 million increasing to 12.3 million in 2020
(according to AR4 GWPs). The cumulative amount of AEAs for the period 2013–2020
is set at 98.5 Mton CO2 equivalents.
In the period 2013-2017 Slovenian ESD emissions were lower than the target values.
Considering projections it is expected that Slovenia will meet its reduction targets for
the period up to 2020.
PROGRESS IN ACHIEVEMENT OF QUANTIFIED ECONOMY-WIDE EMISSION
REDUCTION TARGETS AND RELEVANT INFORMATION
Until recently, the Operational Programme for Reducing GHG Emissions until 2020
with a View to 2030 (OP GHG-2020) was a key implementation document in the field
of reducing GHG emissions in Slovenia for sources not included in the ETS
(emissions under the Decision 2009/406/EC). In 2020, the National Energy and
Climate Plan (NECP) was adopted in accordance with the Regulation on the
Governance of the Energy Union (2018/1999/EU), which assumes the role of the
implementation document in the field of mitigating the climate change from OP
GHG-2020. The NECP is a broader document than the OP GHG-2020, as it covers all
emission sources, including ETS, integrates two action plans in the field of energy
efficiency and renewable energy sources, and further covers the security of supply,
internal energy markets and research and development. Both documents are built on
sectoral strategic documents.
The EU-ETS is the most important multisectoral instrument which encourages
companies included in this system to reduce GHG emissions through reducing the
amount of emission allowances in the market and thus having an impact on the
allowance prices. In Slovenia, 38% of GHG emissions are covered in the EU-ETS. The
environmental tax for air pollution with CO2 emissions also significantly contributes
to reducing emissions in Slovenia through an energy price supplement. Instruments
derived from European legislation (use of best available techniques, minimum
requirements and labelling of energy-using products, obligation to achieve savings
for energy suppliers) limit the use of technologies producing higher emissions or
consume more energy, and promote the implementation of EEU and RES measures.
The necessary condition for successful implementation of measures is a high level of
awareness and information of users and decision-makers and qualification of
operators and managers, which is also complemented by integrating content into the
education process.
In terms of transformations, effect of technological modernisation of the thermal
energy sector will be significant and will have an impact on reducing coal
consumption for producing electricity as well as promoting the production of

9
electricity from RES and in CHP with higher efficiency. Additionally, RES and CHP
are also promoted in district heating.
Instruments in the energy consumption sectors intensively promote the
implementation of EEU measures and RES use (in the industry also waste heat in
combination with district heating), to the greatest extent through financial incentives
in the form of subsidies and loans with favourable interest rates (Eco Fund, European
funds, funds of ministries, Climate Change Fund). There is also an important
instrument in the field of buildings, i.e. the energy efficiency code in buildings, and
great emphasis is placed on creating a stimulating environment for renovating multi-
apartment buildings. In implementing measures, it is also important to support
socially disadvantaged households. Very important instrument especially in public
buildings is also energy contracting.
Transport is a sector where in the past the trend of emissions was reversed compared
to other sectors, which is why it has a special emphasis in the NECP. The instruments
are divided into four sections – promotion of public passenger transport (PPT) which
can be associated with promoting non-motorised transport modes for sustainable
mobility. To this end, a very large amount of funds is provided to improve
infrastructure (in particular, railway infrastructure), while a single ticket and
connecting different modes of PPT with passenger vehicle transport through P+R are
also important. The measure of sustainable freight transport is divided into two
sections – promoting railway freight transport (through investments in the railway
infrastructure) and improving the efficiency of road freight transport. The third set of
measures concerns the increase in transport efficiency and promotion of using fuels
with low CO2 emissions, which will contribute most to reducing emissions in
transport. The last set includes transport planning.
Today, agriculture represents just under 10%, but it is seen as a sector where the
reduction in emissions will be difficult to achieve. Therefore it is important to strive
for reducing emissions in this sector. The measures focus on increasing the efficiency
of animal breeding through consultancy and financial incentives, promoting
breeding with low emissions (grazing and producing biogas from livestock manure)
and rational fertilising of crops with nitrogen.
In industrial processes it is important to implement European legislation in the field
of F-gases which will significantly contribute to reducing emissions through
substituting substances. In the field of waste, a reduction in the quantity of landfilled
biodegradable waste has already been achieved, the collection of landfill gas has
been arranged; measures now focus on reducing the volume of waste generated in
the light of reducing the need for resources, while urban waste water management
must also be arranged to contribute to reducing emissions from urban waste water
treatment. Slovenia is rich in forests, so sustainable management of forests and CO2
sinks has an important place among the climate change mitigation measures.
10
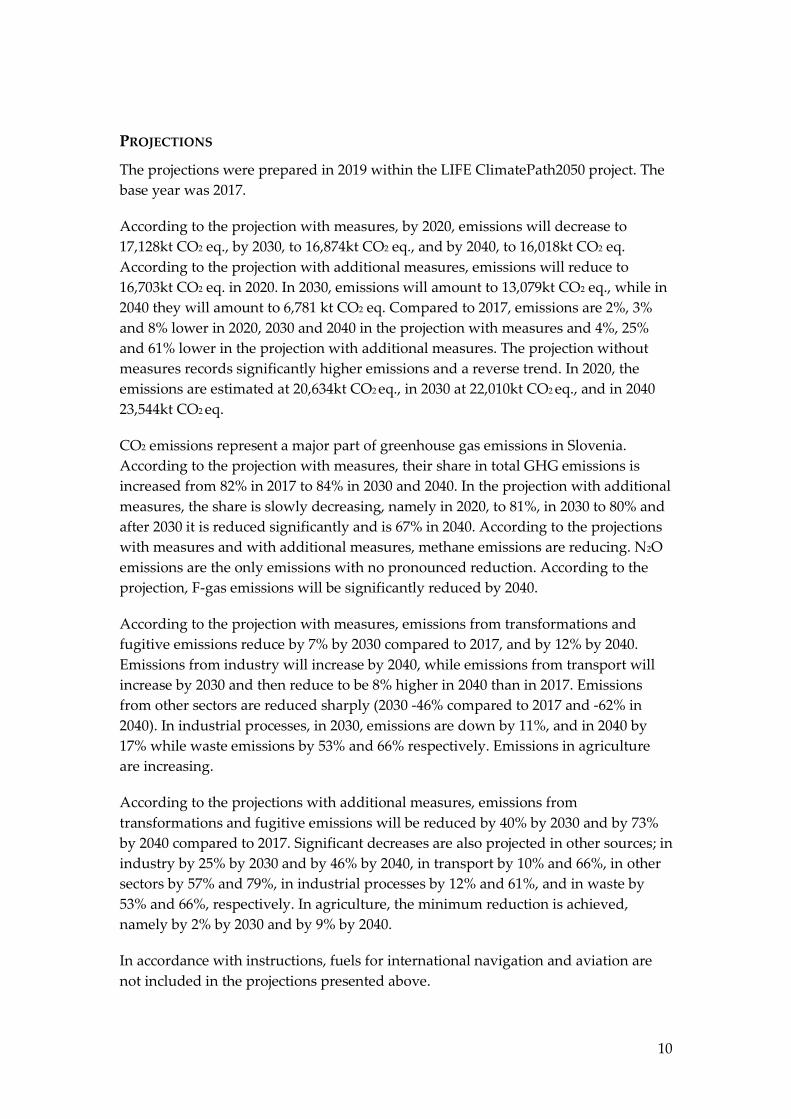
PROJECTIONS
The projections were prepared in 2019 within the LIFE ClimatePath2050 project. The
base year was 2017.
According to the projection with measures, by 2020, emissions will decrease to
17,128kt CO2 eq., by 2030, to 16,874kt CO2 eq., and by 2040, to 16,018kt CO2 eq.
According to the projection with additional measures, emissions will reduce to
16,703kt CO2 eq. in 2020. In 2030, emissions will amount to 13,079kt CO2 eq., while in
2040 they will amount to 6,781 kt CO2 eq. Compared to 2017, emissions are 2%, 3%
and 8% lower in 2020, 2030 and 2040 in the projection with measures and 4%, 25%
and 61% lower in the projection with additional measures. The projection without
measures records significantly higher emissions and a reverse trend. In 2020, the
emissions are estimated at 20,634kt CO2 eq., in 2030 at 22,010kt CO2 eq., and in 2040
23,544kt CO2 eq.
CO2 emissions represent a major part of greenhouse gas emissions in Slovenia.
According to the projection with measures, their share in total GHG emissions is
increased from 82% in 2017 to 84% in 2030 and 2040. In the projection with additional
measures, the share is slowly decreasing, namely in 2020, to 81%, in 2030 to 80% and
after 2030 it is reduced significantly and is 67% in 2040. According to the projections
with measures and with additional measures, methane emissions are reducing. N2O
emissions are the only emissions with no pronounced reduction. According to the
projection, F-gas emissions will be significantly reduced by 2040.
According to the projection with measures, emissions from transformations and
fugitive emissions reduce by 7% by 2030 compared to 2017, and by 12% by 2040.
Emissions from industry will increase by 2040, while emissions from transport will
increase by 2030 and then reduce to be 8% higher in 2040 than in 2017. Emissions
from other sectors are reduced sharply (2030 -46% compared to 2017 and -62% in
2040). In industrial processes, in 2030, emissions are down by 11%, and in 2040 by
17% while waste emissions by 53% and 66% respectively. Emissions in agriculture
are increasing.
According to the projections with additional measures, emissions from
transformations and fugitive emissions will be reduced by 40% by 2030 and by 73%
by 2040 compared to 2017. Significant decreases are also projected in other sources; in
industry by 25% by 2030 and by 46% by 2040, in transport by 10% and 66%, in other
sectors by 57% and 79%, in industrial processes by 12% and 61%, and in waste by
53% and 66%, respectively. In agriculture, the minimum reduction is achieved,
namely by 2% by 2030 and by 9% by 2040.
In accordance with instructions, fuels for international navigation and aviation are
not included in the projections presented above.

11
CO2 sinks increase by 2030 and then reduce. According to the projection with
measures, sinks will amount to -5,721kt CO2 eq. in 2030, while according to the
projection with additional measures they will amount to -6,421kt CO2 eq.
According to the projection with measures, non-ETS emissions will amount to
10,946kt CO2 eq. in 2020, while according to the projection with additional measures
they will be 10,727kt CO2 eq. According to the projection with measures, emissions
amount to 10,621kt CO2 eq. in 2030, which is 10% lower than in 2005. According to
the projection with additional measures, emissions will reduce by 26%. It follows that
Slovenia will achieve the target for 2020 according to both projections, while the
target for 2030, which is 15% reduction in emissions for Slovenia, will be achieved
according to the projection with additional measures. By far the biggest source of
non-ETS emissions is transport that represents more than half of the emissions.

12
2 Information on GHG emissions and trends, GHG inventory including information on national inventory system
2.1 Greenhouse gas emissions from 1986 to 2017
2.1.1 Description and Interpretation of Emission Trends for Aggregated GHG emissions
Total emissions of GHG in 2017, sinks not considered, amounted to 17,453 kt CO2 eq.,
which represents a 14.5% decrease of emissions compared to the year 1986. In the period
1986-1991, a reduction of emissions was recorded due to the economic conditions at that
time and the fact that the Republic of Slovenia was gaining its independence. In the period
1992-1997, a strong increase of emissions was recorded, which was a consequence of
increasing economic growth and revival of industrial production. In the second half of that
period, the increased emissions were a consequence of “gasoline tourism” (25% of the total
sale of motor fuels in the Republic of Slovenia), since the prices of motor fuels in the
Republic of Slovenia were appreciably lower than in the neighbouring countries.
In the period 1998-1999, emission decreased due to the measures undertaken by the
neighbouring countries to curb the ”gasoline tourism” and due to the increased supply of
electrical energy from the Krško Nuclear Power Plant. In the period 2000-2002, the
emission kept increasing again due to the renewal of the obligatory export of electrical
energy from the Krško Nuclear Power Plant to the Republic of Croatia. After joining the EU
in 2004 and after acceptance of Romania and Bulgaria into EU in 2007, emissions from road
transport have increased drastically and have prevailed over the decrease in other sectors
which has occurred due to the policies and measures in manufacturing industry,
agriculture and waste sector.
In 2009, emissions from fuel used in industry and from industrial processes started to
decrease due to the global financial crisis. In 2010 and 2011, emissions stayed almost the
same as in 2009. Since 2012 emissions started to decrease until 2014, while in the last three
years a slow increase has been observed.
2.1.2 Description and Interpretation of Emission Trends for by Gas
CO2 emissions in 2017 represented 81.7% of overall emissions of greenhouse gases. CO2
emissions excluding LULUCF followed the consumption of energy and with regard to their
fraction exerted a major impact on total emissions. Compared to 1986, they decreased by
14.5% in 2017. CH4 emissions represented 12.0% of total emissions in 2017 (13.1% in 1986)
13
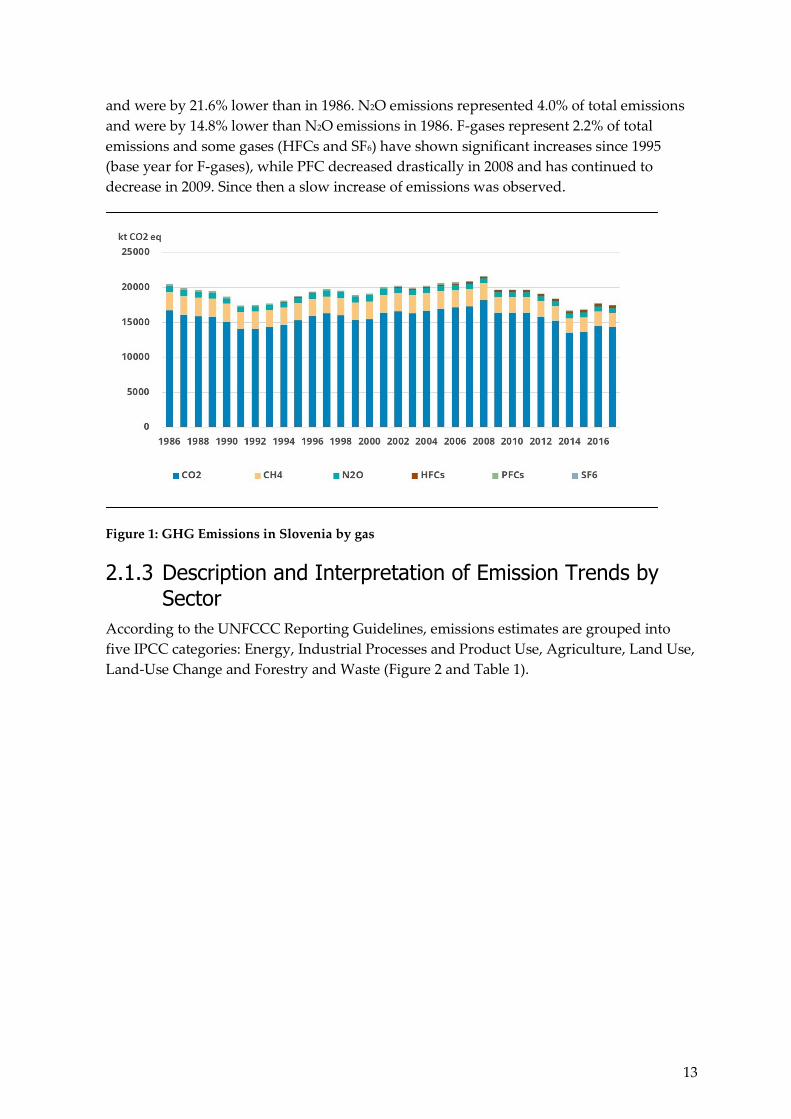
and were by 21.6% lower than in 1986. N2O emissions represented 4.0% of total emissions
and were by 14.8% lower than N2O emissions in 1986. F-gases represent 2.2% of total
emissions and some gases (HFCs and SF6) have shown significant increases since 1995
(base year for F-gases), while PFC decreased drastically in 2008 and has continued to
decrease in 2009. Since then a slow increase of emissions was observed.
Figure 1: GHG Emissions in Slovenia by gas
2.1.3 Description and Interpretation of Emission Trends by Sector
According to the UNFCCC Reporting Guidelines, emissions estimates are grouped into
five IPCC categories: Energy, Industrial Processes and Product Use, Agriculture, Land Use,
Land-Use Change and Forestry and Waste (Figure 2 and Table 1).

14
Figure 2: GHG Emissions in Slovenia by sector
By far the most important sector is Energy, which in 2017 accounted for 80.2% of total GHG
emissions. In this sector emissions have decreased by 14.5%, compared to the 1986. Within
this sector, in the period 1986–2017, GHG emissions from the Energy Industry, as the
biggest sub-sector, decreased by 28.1%. In the period 1999–2007, steep growth (+27.2%) has
been recorded due to the increased consumption of electrical energy.
Undoubtedly the greatest increase in GHG emissions was observed in the transport sector,
by as much as 203.6% until 2008, due to the increase in road transportation, while
emissions from other kinds of traffic slightly declined. In 2009 GHG emissions from
transport decreased by 13.5% compared to 2008. The traffic emissions have further
decreased by 1.1% in 2010, but increased again in 2011 by 8.2% and by 1.3% in 2012. Since
then emissions started to decrease: in 2013 by 5.4%, in 2014 by 1.4% and in 2015 by 0.5%,
while in 2016 a sharp increase by 6.9% was observed. In 2017 emissions decreased again by
3.4%. In the total, emissions from transport sector have increased since 1986 by 174%.
There was an appreciable reduction of GHGs from Manufacturing industry between 1986
and 2001 (-50.3%). After 2001, a stabilisation of emissions was observed until 2008. Due to
the global financial crisis, emissions from Manufacturing industry and construction
decreased in 2009 by 15.6%, in 2010 by 2.1%, in 2011 by 10.3%, in 2012 by 4.0%, in 2013 by
0.4%, and in 2015 by 3.6% compared to the previous year while in 2014, 2016 and 2017 an
increase has been recorded. Altogether since 2008 due to the economic crises emissions
from manufacturing industries and construction have decreased by 31.2%. In 2017
emissions increased by 5.0% from previous year but were 62.6% lower compared to 1986.
Emissions from other sectors fluctuate a lot from year to year and are mostly influenced by
air temperature in winter time. In 2017 they were by 40.1% lower than in 1986 and by 8.2%
lower than in the previous year.

15
Fugitive emissions from fuel represent only 2.9% of emissions in the sector and have
decreased by 31.1% compared to the emissions in 1986.
Since 1986, GHG emissions from Industrial Processes at first fell sharply to reach their
lowest value in 1993, but then started to rise again and were in 2007 6.0% above 1986 level.
Due to the global financial crises and lower industrial production, emissions in 2009 were
28.2% below the 1986 emissions but in the period 2010 – 2017 slowly increased by 20%. The
most important GHG of this sector was carbon dioxide, with 66.0% of emissions from this
category, followed by HFCs with 29.6%, N2O with 1.7%, and PFC and SF6 with 1.4% and
1.3%, respectively. In this sector, no CH4 emissions have occurred since 2011. The main
source is Mineral industry, of which the production of cement and lime alone contributed
almost 40% of the GHG emissions in this sector.
In Agriculture as the second most important sector, emissions in 2017 amounted to 1,688
Gg CO2 eq, which represents 9.7% of all emissions. Agriculture represents the main source
of methane and N2O emissions, namely 56.5% of all methane emissions and 68.7% of all
N2O emissions. In the agricultural sector, N2O emissions accounted for 28.6% of emissions,
and CH4 emissions accounted for 70.3% of emissions while CO2 emissions accounted for
1.1%. GHG emissions from agriculture sector show small oscillations but the general trend
is on the decrease. In 2017, emissions were 11.8% below the base year. The most important
sub-sector is emissions from enteric fermentation, which contributes 55.2% of all emissions
from agriculture, followed by emissions from agricultural soils, with 25.8; the rest is
contributed by emissions of methane and N2O from animal manure (17.8%) while CO2
emissions due to the liming and urea applications represent only 1.1% of emissions in this
sector.
In the LULUCF sector, the CO2 sink was estimated at 1,524 Gg CO2 eq in 2017, which is
68.6% less than in 1986. The decrease in sinks was primarily the result of a decrease in
timber growing stock in existing forests also due to natural disasters in the recent years.
Methane emissions from the Waste sector are the second largest source of methane and
represent 23.1% of all methane emissions in Slovenia in 2017. The fraction of methane
emissions in this sector amounts to 87.1%, while the remaining part represent N2O (8.0%)
and CO2 emissions (4.9%). Solid waste handling contributes 61.2% to the total emissions
from this sector, wastewater handling 30.8 %, incineration of waste 4.9% and composting
3.0%. Emissions in 2017 were 21.6% lower than in 1986 which is mainly due to the decrease
in emissions from waste waters which are 49% lower than in the base year what is mostly
due to recovery of gas in wastewater treatment plants and the decrease in industrial
production. Emissions from solid waste disposal started decreasing in 2005 and since then
emissions have decreased by 42.6%. In 2013 the emissions were for the first time lower
compared to the base year and in 2017 they were lower by 8.3%.
16
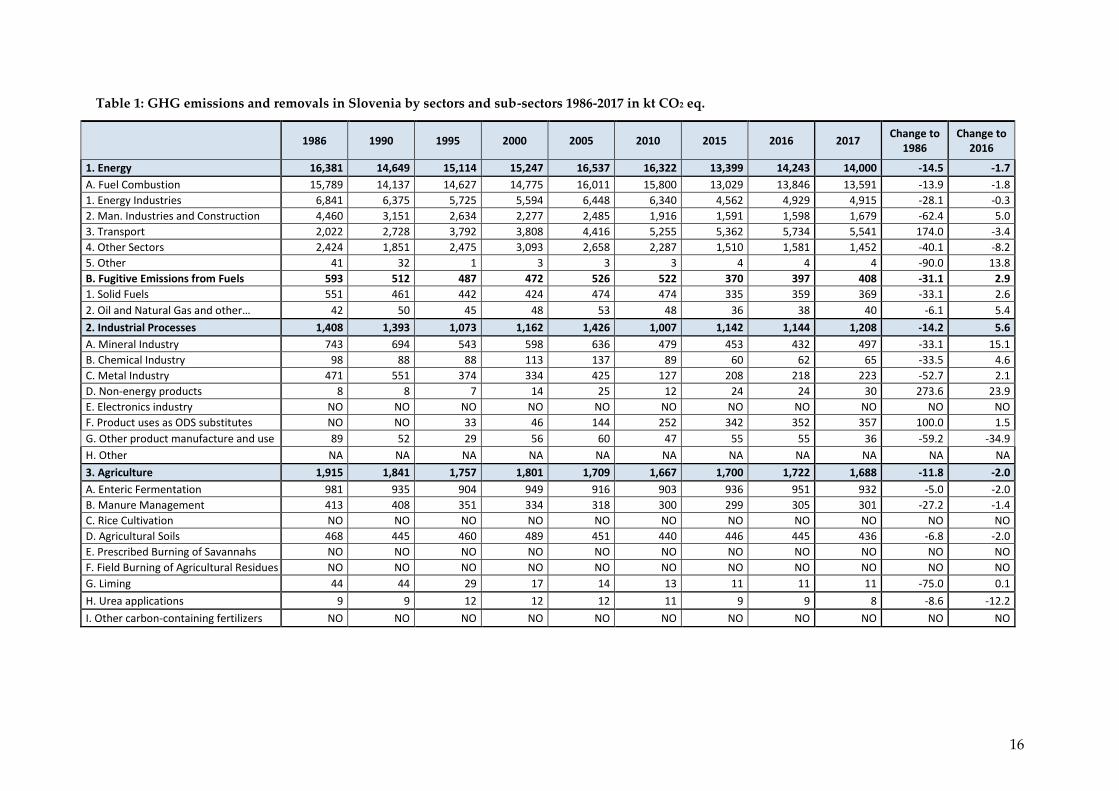
Table 1: GHG emissions and removals in Slovenia by sectors and sub-sectors 1986-2017 in kt CO2 eq.
1986 1990 1995 2000 2005 2010 2015 2016 2017 Change to
1986 Change to
2016
1. Energy 16,381 14,649 15,114 15,247 16,537 16,322 13,399 14,243 14,000 -14.5 -1.7
A. Fuel Combustion 15,789 14,137 14,627 14,775 16,011 15,800 13,029 13,846 13,591 -13.9 -1.8
1. Energy Industries 6,841 6,375 5,725 5,594 6,448 6,340 4,562 4,929 4,915 -28.1 -0.3
2. Man. Industries and Construction 4,460 3,151 2,634 2,277 2,485 1,916 1,591 1,598 1,679 -62.4 5.0
3. Transport 2,022 2,728 3,792 3,808 4,416 5,255 5,362 5,734 5,541 174.0 -3.4
4. Other Sectors 2,424 1,851 2,475 3,093 2,658 2,287 1,510 1,581 1,452 -40.1 -8.2
5. Other 41 32 1 3 3 3 4 4 4 -90.0 13.8
B. Fugitive Emissions from Fuels 593 512 487 472 526 522 370 397 408 -31.1 2.9
1. Solid Fuels 551 461 442 424 474 474 335 359 369 -33.1 2.6
2. Oil and Natural Gas and other… 42 50 45 48 53 48 36 38 40 -6.1 5.4
2. Industrial Processes 1,408 1,393 1,073 1,162 1,426 1,007 1,142 1,144 1,208 -14.2 5.6
A. Mineral Industry 743 694 543 598 636 479 453 432 497 -33.1 15.1
B. Chemical Industry 98 88 88 113 137 89 60 62 65 -33.5 4.6
C. Metal Industry 471 551 374 334 425 127 208 218 223 -52.7 2.1
D. Non-energy products 8 8 7 14 25 12 24 24 30 273.6 23.9
E. Electronics industry NO NO NO NO NO NO NO NO NO NO NO
F. Product uses as ODS substitutes NO NO 33 46 144 252 342 352 357 100.0 1.5
G. Other product manufacture and use 89 52 29 56 60 47 55 55 36 -59.2 -34.9
H. Other NA NA NA NA NA NA NA NA NA NA NA
3. Agriculture 1,915 1,841 1,757 1,801 1,709 1,667 1,700 1,722 1,688 -11.8 -2.0
A. Enteric Fermentation 981 935 904 949 916 903 936 951 932 -5.0 -2.0
B. Manure Management 413 408 351 334 318 300 299 305 301 -27.2 -1.4
C. Rice Cultivation NO NO NO NO NO NO NO NO NO NO NO
D. Agricultural Soils 468 445 460 489 451 440 446 445 436 -6.8 -2.0
E. Prescribed Burning of Savannahs NO NO NO NO NO NO NO NO NO NO NO
F. Field Burning of Agricultural Residues NO NO NO NO NO NO NO NO NO NO NO
G. Liming 44 44 29 17 14 13 11 11 11 -75.0 0.1
H. Urea applications 9 9 12 12 12 11 9 9 8 -8.6 -12.2
I. Other carbon-containing fertilizers NO NO NO NO NO NO NO NO NO NO NO
17
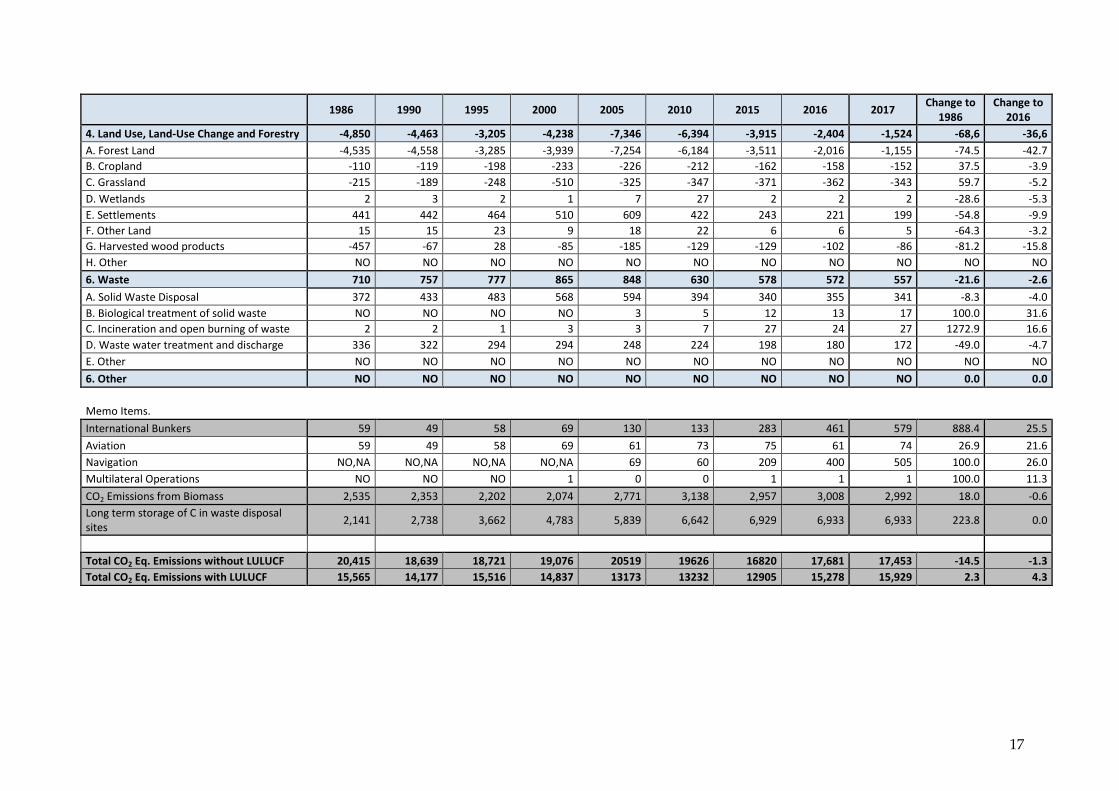
1986 1990 1995 2000 2005 2010 2015 2016 2017 Change to
1986 Change to
2016
4. Land Use, Land-Use Change and Forestry -4,850 -4,463 -3,205 -4,238 -7,346 -6,394 -3,915 -2,404 -1,524 -68,6 -36,6
A. Forest Land -4,535 -4,558 -3,285 -3,939 -7,254 -6,184 -3,511 -2,016 -1,155 -74.5 -42.7
B. Cropland -110 -119 -198 -233 -226 -212 -162 -158 -152 37.5 -3.9
C. Grassland -215 -189 -248 -510 -325 -347 -371 -362 -343 59.7 -5.2
D. Wetlands 2 3 2 1 7 27 2 2 2 -28.6 -5.3
E. Settlements 441 442 464 510 609 422 243 221 199 -54.8 -9.9
F. Other Land 15 15 23 9 18 22 6 6 5 -64.3 -3.2
G. Harvested wood products -457 -67 28 -85 -185 -129 -129 -102 -86 -81.2 -15.8
H. Other NO NO NO NO NO NO NO NO NO NO NO
6. Waste 710 757 777 865 848 630 578 572 557 -21.6 -2.6
A. Solid Waste Disposal 372 433 483 568 594 394 340 355 341 -8.3 -4.0
B. Biological treatment of solid waste NO NO NO NO 3 5 12 13 17 100.0 31.6
C. Incineration and open burning of waste 2 2 1 3 3 7 27 24 27 1272.9 16.6
D. Waste water treatment and discharge 336 322 294 294 248 224 198 180 172 -49.0 -4.7
E. Other NO NO NO NO NO NO NO NO NO NO NO
6. Other NO NO NO NO NO NO NO NO NO 0.0 0.0
Memo Items.
International Bunkers 59 49 58 69 130 133 283 461 579 888.4 25.5
Aviation 59 49 58 69 61 73 75 61 74 26.9 21.6
Navigation NO,NA NO,NA NO,NA NO,NA 69 60 209 400 505 100.0 26.0
Multilateral Operations NO NO NO 1 0 0 1 1 1 100.0 11.3
CO2 Emissions from Biomass 2,535 2,353 2,202 2,074 2,771 3,138 2,957 3,008 2,992 18.0 -0.6
Long term storage of C in waste disposal sites
2,141 2,738 3,662 4,783 5,839 6,642 6,929 6,933 6,933 223.8 0.0
Total CO2 Eq. Emissions without LULUCF 20,415 18,639 18,721 19,076 20519 19626 16820 17,681 17,453 -14.5 -1.3
Total CO2 Eq. Emissions with LULUCF 15,565 14,177 15,516 14,837 13173 13232 12905 15,278 15,929 2.3 4.3
18
2.2 The national system
2.2.1 Summary information on National Inventory Arrangements
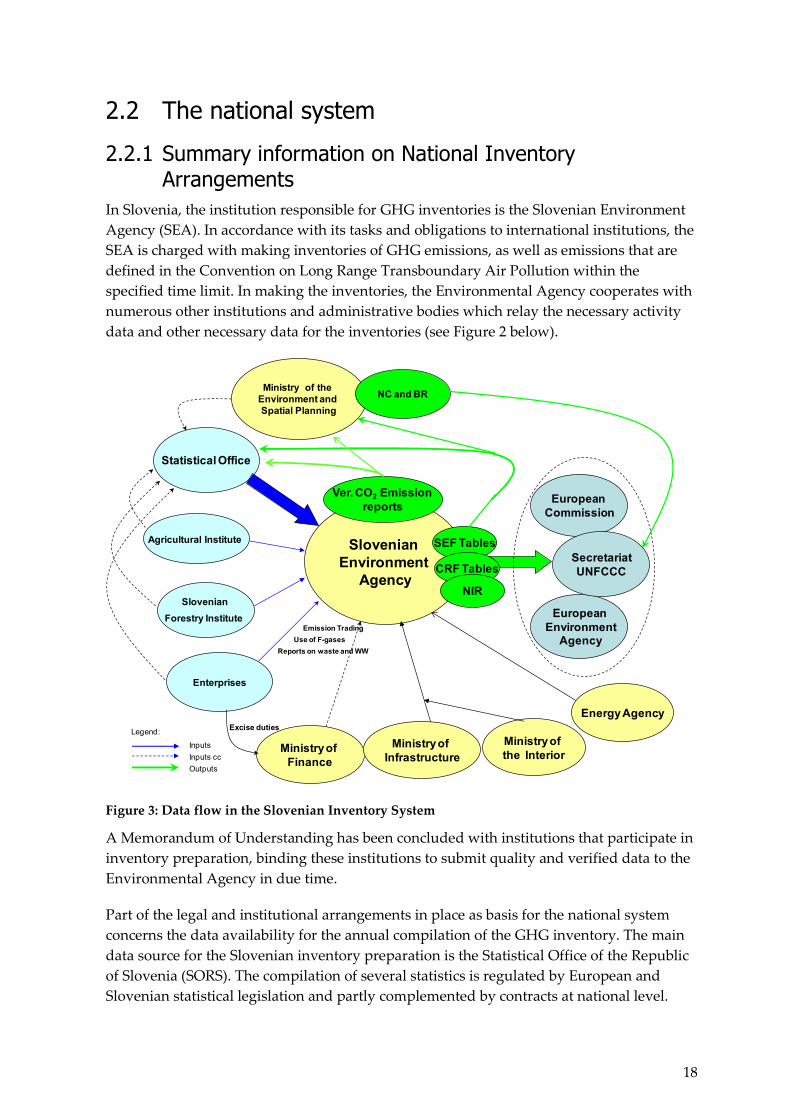
In Slovenia, the institution responsible for GHG inventories is the Slovenian Environment
Agency (SEA). In accordance with its tasks and obligations to international institutions, the
SEA is charged with making inventories of GHG emissions, as well as emissions that are
defined in the Convention on Long Range Transboundary Air Pollution within the
specified time limit. In making the inventories, the Environmental Agency cooperates with
numerous other institutions and administrative bodies which relay the necessary activity
data and other necessary data for the inventories (see Figure 2 below).
Figure 3: Data flow in the Slovenian Inventory System
A Memorandum of Understanding has been concluded with institutions that participate in
inventory preparation, binding these institutions to submit quality and verified data to the
Environmental Agency in due time.
Part of the legal and institutional arrangements in place as basis for the national system
concerns the data availability for the annual compilation of the GHG inventory. The main
data source for the Slovenian inventory preparation is the Statistical Office of the Republic
of Slovenia (SORS). The compilation of several statistics is regulated by European and
Slovenian statistical legislation and partly complemented by contracts at national level.
Statistical Office
Agricultural Institute
Slovenian
Forestry Institute
Enterprises
Ministry of the
Environment and
Spatial Planning
Slovenian
Environment
Agency
SEF Tables
CRF Tables
European
EnvironmentAgency
European
Commission
NC and BR
Secretariat
UNFCCC
Reports on waste and WW
Use of F-gases
Ministry of
Finance
Excise duties
Emission Trading
Ministry of
Infrastructure
Ministry of
the Interior
NIR
Inputs
Inputs cc
Outputs
Legend:
Ver. CO2 Emission
reports
Energy Agency
19
At the beginning of 2007, the agreement between Statistical Office of the Republic of
Slovenia (SORS) and the Environmental Agency came into force. Accordingly, all statistical
data necessary for preparing GHG inventories are available each year by October 30 at the
latest. In exchange, ETS data and emission estimates are reported to the Statistical Office
within a defined time frame. In 2014 the new agreement has been signed which includes
more data sets and updated time lines.
Other data sources include reporting obligations under national and European regulations
and reports of companies and associations. Experts from the Slovenian Forestry Institute
and the Agricultural Institute of Slovenia work on GHG inventories according to the
standing rules of institutes (ordinance). Financing is assured by governmental institutions
according to the yearly work plan. All data from external institutions are submitted to the
Slovenian Environmental Agency, where they are archived.
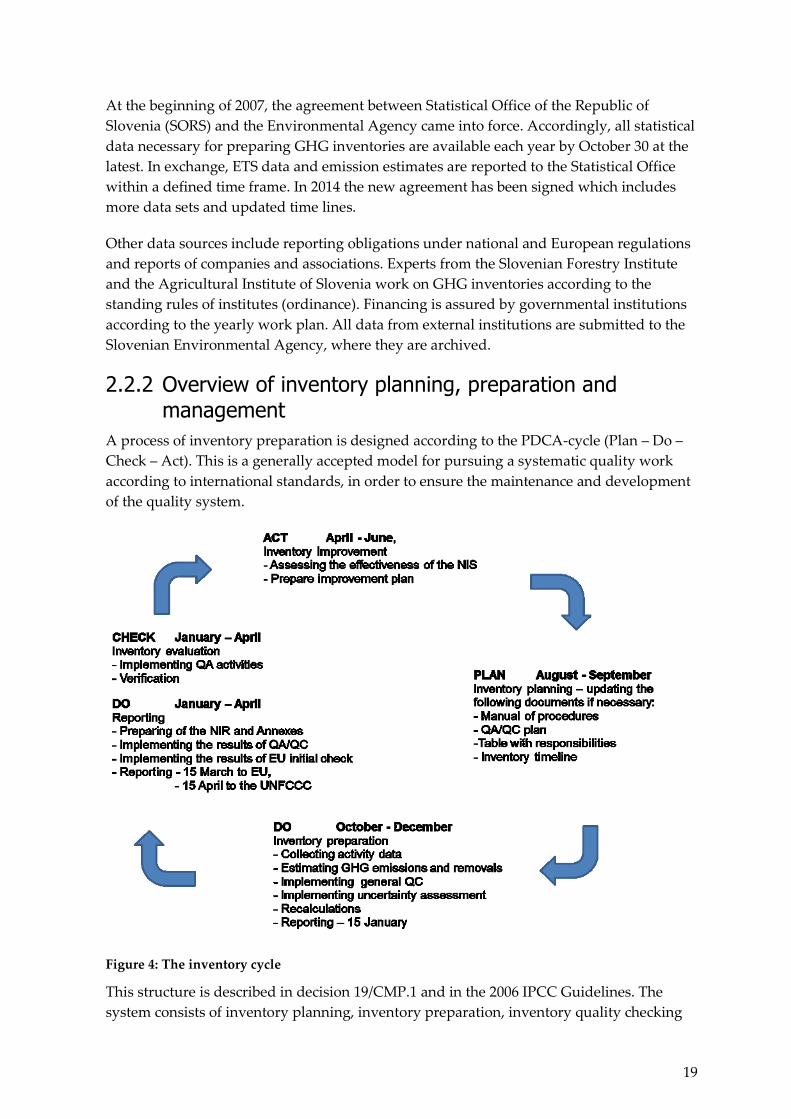
2.2.2 Overview of inventory planning, preparation and management
A process of inventory preparation is designed according to the PDCA-cycle (Plan – Do –
Check – Act). This is a generally accepted model for pursuing a systematic quality work
according to international standards, in order to ensure the maintenance and development
of the quality system.
Figure 4: The inventory cycle
This structure is described in decision 19/CMP.1 and in the 2006 IPCC Guidelines. The
system consists of inventory planning, inventory preparation, inventory quality checking

20
and follow-up improvements which are integrated into the annual cycle and preparation as
illustrated in the Figure 3.
Owing to the ever-increasing obligations of Slovenia with regard to reporting, the SEA has
decided to implement a unified system of data collection for the purposes of making
inventories, as well as secure reliable financing in accordance with the annual program of
its work.
For submitting reports to different institutions, various report formats have been devised,
since the same data are used to report to the UNFCCC, EEA, EC, and CLRTAP. All external
reports of the SEA are prepared in accordance with ISO 9001 via the Agency's reporting
service, which keeps inventories of reports. Parallel to this, emissions data are submitted to
the SORS, which makes them available in its publications and submits them to EUROSTAT
and the IEA.
Before the inventory is reported to the EU, EEA or UNFCCC Secretariat, it goes through an
approval process. The institution designated for approval is the Ministry of the
Environment and Spatial Planning.
2.2.3 Quality assurance, quality control and verification plan
In 2014, Slovenia developed and implemented a new Quality Assurance and Quality
Control Plan as recommended by the IPCC Guidelines (IPCC 2000 and 2006). The QA/QC
plan is part of the Manual of Procedures, elaborated in 2005 and updated in 2014. This
update was necessary due to the new methodology guidance (IPCC, 2006), which became
official guidance for GHG reporting since 2015. The manual is improved and updated
regularly.
The inventory management as part of the quality management system includes a control
system for data and calculations, for records and their archiving as well as documentation
on QA/QC activities. This ensures the necessary documentation and archiving for future
reconstruction of the inventory and for the timely response to requests during the review
process.
More detailed information on inventory data and inventory arrangements can be found in
Section 1 of the Slovenian National Inventory Report 2019.
2.2.4 Summary information on Changes to National Inventory Arrangements
There were no significant changes of the inventory system since the last Biennial Report.
21
3 Quantified economy-wide emissions reduction target
3.1 The EU target under the Convention In 2010, the EU submitted a pledge to reduce its GHG emissions by 2020 by 20%
compared to 1990 levels, in order to contribute to achieving the ultimate objective of
the UNFCCC: 'to stabilise GHG concentrations at a level that would prevent
dangerous anthropogenic (human-induced) interference with the climate system', or,
in other words, to limit the global temperature increase to less than 2°C compared to
temperature levels before industrialization (FCCC/CP/2010/7/Add.1). The definition
of the Convention target for 2020 is documented in the revised note provided by the
UNFCCC Secretariat on the ‘Compilation of economy-wide emission reduction
targets to be implemented by Parties included in Annex I to the Convention’
(FCCC/SB/2011/INF.1/Rev.1 of 7 June 2011). EU provided additional information
relating to its quantified economy wide emission reduction target in a submission as
part of the process of clarifying the developed country Parties' targets in 2012
(FCCC/AWGLCA/2012/MISC.1).
The EU’s accounting rules for the target under the UNFCCC are more ambitious than
the rules under the Kyoto Protocol, for example, including outgoing flights, and
adding an annual compliance cycle for emissions under the Effort Sharing Decision
(ESD; non-ETS) or higher Clean Development Mechanism (CDM) quality standards
under the EU Emissions Trading System (EU ETS) (FCCC/TP/2013/7). Accordingly,
the following assumptions and conditions apply to the EU's -20% commitment under
the UNFCCC:
The EU Convention pledge does not include emissions/removals from Land
Use, Land Use Change and Forestry; however this sector is estimated to be a
net sink over the relevant period. EU GHG inventories include information
on emissions and removals from LULUCF in accordance with relevant
reporting commitments under the UNFCCC. Accounting for LULUCF
activities only takes place under the Kyoto Protocol1;
The target covers the gases CO2, CH4, N2O, HFCs, PFCs and SF6;
The target refers to 1990 as a single base year for all covered gases and all
Member States. Emissions from outgoing flights are included in the target;,
A limited number of CERs, ERUs and units from new market-based
mechanisms may be used to achieve the target: in the ETS, the use of
international credits was allowed up to specific levels set in the EU ETS
Directive, amounting to over 1500 million CER and ERU entitlements in the
period up to 2020). Quality standards also apply to the use of international
1 The LULUCF Decision (Decision 529/2013) requires to prepare and maintain annual LULUCF accounts according to the rules set out in the Kyoto Protocol; however, these accounts do not contribute to the achievement of the EU Convention pledge
22
credits in the EU ETS, including not allowing the use of credits from LULUCF
projects and certain industrial gas projects. International credits will no
longer be used for EU ETS compliance in the system’s fourth trading period
(2021-2030). In the ESD sectors, the annual use of international credits is
currently limited to up to 3% of each Member State's ESD emissions in 2005,
with a limited number of Member States being permitted to use an additional
1% from projects in Least Developed Countries (LDCs) or Small Island
Developing States (SIDS), subject to conditions; from 2021 onwards, as with
the EU ETS, international credits will no longer be used for compliance under
the ESD.
The Global Warming Potentials (GWPs) used to aggregate GHG emissions up
to 2020 under EU legislation were those based on the Second Assessment
Report of the IPCC when the target was submitted. For the implementation
until 2020, GWPs from the IPCC AR4 will be used consistently with the
UNFCCC reporting guidelines for GHG inventories.
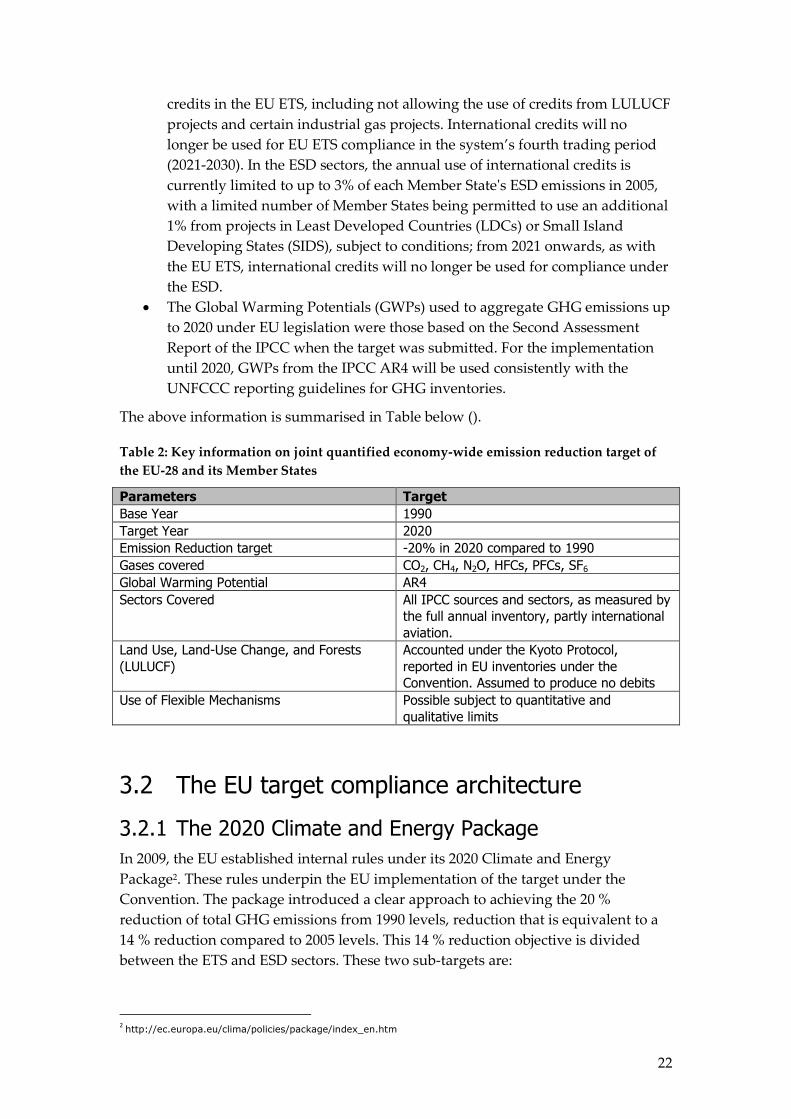
The above information is summarised in Table below ().
Table 2: Key information on joint quantified economy-wide emission reduction target of
the EU-28 and its Member States
Parameters Target
Base Year 1990
Target Year 2020
Emission Reduction target -20% in 2020 compared to 1990
Gases covered CO2, CH4, N2O, HFCs, PFCs, SF6
Global Warming Potential AR4
Sectors Covered All IPCC sources and sectors, as measured by
the full annual inventory, partly international
aviation.
Land Use, Land-Use Change, and Forests
(LULUCF)
Accounted under the Kyoto Protocol,
reported in EU inventories under the
Convention. Assumed to produce no debits
Use of Flexible Mechanisms Possible subject to quantitative and
qualitative limits
3.2 The EU target compliance architecture
3.2.1 The 2020 Climate and Energy Package
In 2009, the EU established internal rules under its 2020 Climate and Energy
Package2. These rules underpin the EU implementation of the target under the
Convention. The package introduced a clear approach to achieving the 20 %
reduction of total GHG emissions from 1990 levels, reduction that is equivalent to a
14 % reduction compared to 2005 levels. This 14 % reduction objective is divided
between the ETS and ESD sectors. These two sub-targets are:
2 http://ec.europa.eu/clima/policies/package/index_en.htm
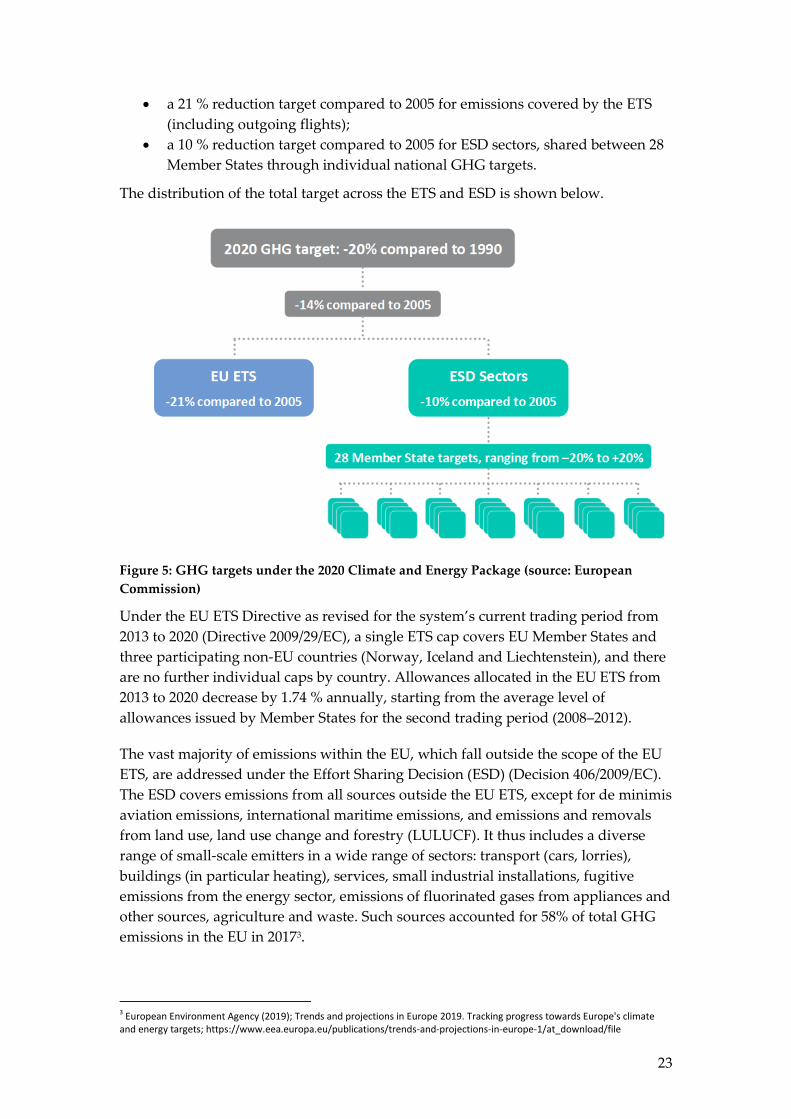
23
a 21 % reduction target compared to 2005 for emissions covered by the ETS
(including outgoing flights);
a 10 % reduction target compared to 2005 for ESD sectors, shared between 28
Member States through individual national GHG targets.
The distribution of the total target across the ETS and ESD is shown below.
Figure 5: GHG targets under the 2020 Climate and Energy Package (source: European
Commission)
Under the EU ETS Directive as revised for the system’s current trading period from
2013 to 2020 (Directive 2009/29/EC), a single ETS cap covers EU Member States and
three participating non-EU countries (Norway, Iceland and Liechtenstein), and there
are no further individual caps by country. Allowances allocated in the EU ETS from
2013 to 2020 decrease by 1.74 % annually, starting from the average level of
allowances issued by Member States for the second trading period (2008–2012).
The vast majority of emissions within the EU, which fall outside the scope of the EU
ETS, are addressed under the Effort Sharing Decision (ESD) (Decision 406/2009/EC).
The ESD covers emissions from all sources outside the EU ETS, except for de minimis
aviation emissions, international maritime emissions, and emissions and removals
from land use, land use change and forestry (LULUCF). It thus includes a diverse
range of small-scale emitters in a wide range of sectors: transport (cars, lorries),
buildings (in particular heating), services, small industrial installations, fugitive
emissions from the energy sector, emissions of fluorinated gases from appliances and
other sources, agriculture and waste. Such sources accounted for 58% of total GHG
emissions in the EU in 20173.
3 European Environment Agency (2019); Trends and projections in Europe 2019. Tracking progress towards Europe's climate and energy targets; https://www.eea.europa.eu/publications/trends-and-projections-in-europe-1/at_download/file
24
While the EU ETS target is to be achieved by the EU as a whole, the ESD target was
divided into national targets to be achieved individually by each Member State (see
Figure 5). Under the Effort Sharing Decision, national emission targets for 2020 are
set, expressed as percentage changes from 2005 levels. These changes have been
transferred into binding quantified annual emission limits for the period from 2013
to 2020 (Commission Decisions 2013/162/EU and 2013/634/EU), denominated in
annual emission allocations (AEAs). At country level, 2020 targets under the ESD
range from -20% to +20%, compared to 2005 levels.
The target levels have been set on the basis of Member States’ relative Gross
Domestic Product (GDP) per capita. Up to certain limitations, the ESD allows
Member States to make use of flexibility provisions for meeting their annual targets:
carry-over of over-achievements to subsequent years within each Member State,
transfers of AEAs between Member States and use of international credits (credits
from Joint Implementation and Clean Development Mechanism).
3.2.2 Monitoring progress towards the 2020 ESD targets
Monitoring, reporting and verification of the ESD targets mainly takes place through
the submission of national GHG inventories by Member States. Chapter III of
Commission Implementing Regulation 749/2014 sets out strict criteria on the basis of
which the national GHG inventories and GHG emissions of Member States are
reviewed annually at the EU level. Based on this review, the European Commission
issues an implementing decision on Member States' ESD emissions in the given year,
which might lead to Member States facing penalties or other consequences.
The ESD and the MMR have introduced an annual compliance cycle, requiring a
review of Member States' greenhouse gas inventories to ensure compliance with their
obligations under the ESD in the period 2013–2020. These reviews are carried out
within a shorter time frame than the current UNFCCC inventory review so as to
enable using flexibility provisions and taking corrective action, where necessary, at
the end of each relevant year.
3.2.3 The Slovenian reduction targets under the ESD (non-ETS) and its progress until 2017
The quantified annual reduction targets 2013-2020 of Slovenia were set to 12.324
Million AEAs in 2013, and to 12.533 Million AEAs in 2020. Targets for intermittent
years follow the linear interpolation between the listed values. Thus, Slovenia
committed not to increase emissions in sectors covered under the ESD by more than
4% by 2020 compared to 2005 levels.
In accordance with Article 27 of Regulation (EU) No 525/2013 and on the basis of the
GHG inventory data as reviewed under Article 19 of that Regulation, the
Commission examined the impact of the use of the 2006 IPCC Guidelines – and of the
changes to the UNFCCC methodologies used – on Member States' GHG inventories.
The difference in the total greenhouse gas emissions relevant to Article 3 of the

25
Decision No 406/2009/EC exceeded 1% for most Member States. In the light of this
outcome, all Member States' annual emission allocations for the years 2017 to 2020 as
contained in Annex II to Decision 2013/162/EU should be revised in order to take into
account the updated inventory data reported and reviewed pursuant to Article 19 of
Regulation (EU) No 525/2013 in 2016. Valid AEAs for the period 2013-2020 are
presented in the table below.
Table 3: AEAs for the period 2013-2020 for Slovenia
Year Annual emission
allocations
[kt CO2 eq]
Year Annual emission
allocations
[kt CO2 eq]
2013 12,324 2017 12,203
2014 12,354 2018 12,238
2015 12,384 2019 12,273
2016 12,413 2020 12,307
In the year 2017, verified emissions from stationary installations covered under the
EU-ETS in Slovenia amounted to 6.57 million tonnes of CO2 equivalents. With total
GHG emissions of 17.45 Mt CO2 equivalent (without LULUCF) the share of EU-ETS
emissions is 48 %.
Figure 6: Trends in greenhouse gas emissions and the division to EU-ETS and ESD for
Slovenia
ESD emissions in 2017 of Slovenia amounted to 10.88 Mt CO2 eq, being 11 % below
the target for that year. ESD emissions in 2013 amounted to 10.97 Mt CO2 eq.
Emissions have been lower that the target values every year from 2013-2017.
Considering projections it is expected that Slovenia will meet its reduction target for
the period up to 2020 (Figure 6).
0
5.000
10.000
15.000
20.000
25.000
GH
G e
mis
sio
ns
[kt C
O2
eq
]
ESD emissions
ETS emissions
Total GHG (LULUCFexcluded)
ESD target

26
4 Progress in the achievement of quantified economy-wide emission reduction targets and relevant information
4.1 Background and recent policy development Until recently, the Operational Programme for Reducing GHG Emissions until 2020
with a View to 2030 (OP GHG-2020) was a key implementation document in the field
of reducing GHG emissions in Slovenia for sources not included in the ETS
(emissions under Decision 2009/406/EC). It aims to change Slovenia into a resource-
efficient, green and competitive low-carbon economy. The Government of Slovenia
adopted it in December 2014.
In 2020, Slovenia adopted the National Energy and Climate Plan (NECP) in
accordance with the Regulation on the Governance of the Energy Union
(2018/1999/EU), which assumes the role of the implementation document in the field
of mitigating the climate change from the OP GHG-2020. The NEPC is a broader
document than the OP GHG-2020, as it covers all emission sources, including ETS,
and also integrates two action plans in the field of energy efficiency and renewable
energy sources, and further covers the security of supply, internal energy markets
and research and development.
Most of the measures already being implemented today are pursuing several
objectives at the same time and in this respect, the costs of implementing measures
decrease significantly and they maximise the benefits due to synergy and
multiplicative effects. Examples of this are the EEU and RES measures, which
simultaneously reduce air pollution from SO2, NOx pollutants and dust particles, and
reduce GHG emissions and also contribute to other sectoral objectives (e.g. security
of energy supply). In the future, these efforts will be intensified in the
implementation of climate policy.
The NECP takes over existing measures from action and operational programmes,
reshapes them, upgrades them and adds new measures necessary to achieve more
ambitious emission reduction targets by 2030. The NECP is based on strategic
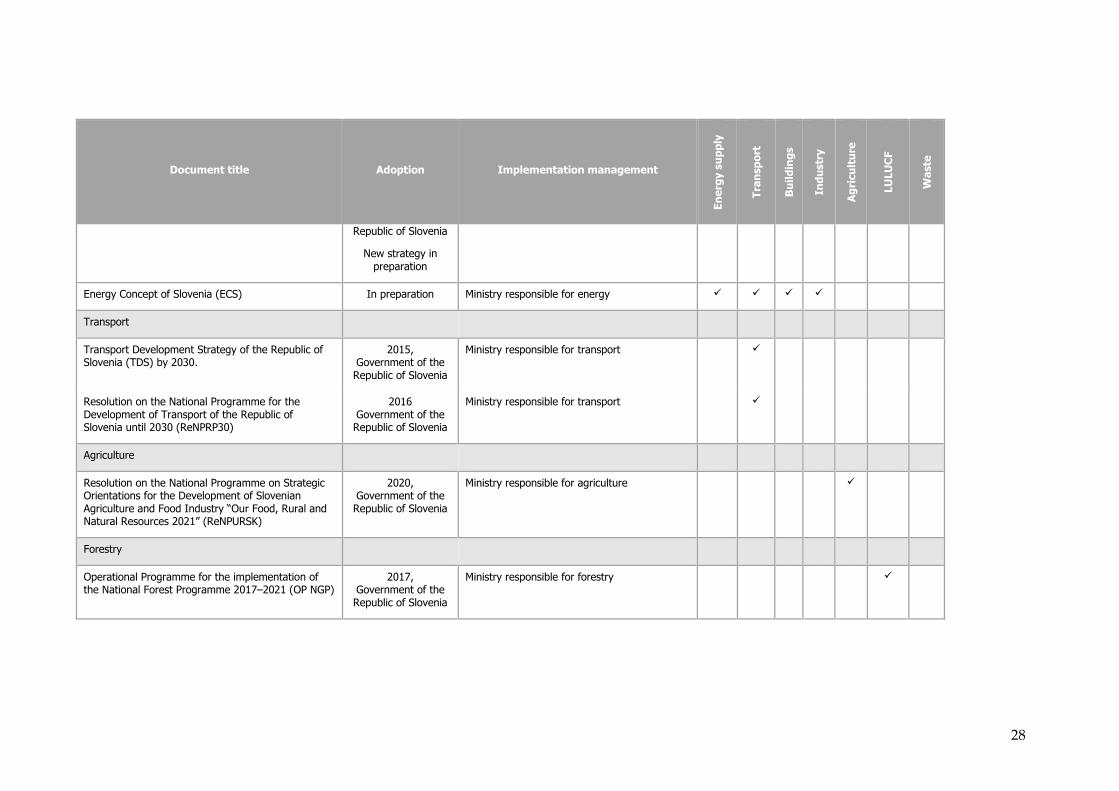
documents covering various sectors contributing to GHG emissions (Table 2).

27
Table 4: Strategic documents of the Republic of Slovenia relevant to the mitigation of climate change.
Document title Adoption Implementation management
En
erg
y s
up
ply
Tra
nsp
ort
Bu
ild
ing
s
Ind
ustr
y
Ag
ricu
ltu
re
LU
LU
CF
Wa
ste
General
Slovenian Development Strategy 2030 (SRS) 2017, Government of the Republic of Slovenia
Government Office for Development
Climate change
National Energy and Climate Plan (NECP) 2020, Government of the Republic of Slovenia
Ministry responsible for energy
Resolution on the National Environment Protection Programme for the 2020–2030 period (ReNPVO20–30)
2020 Government of the Republic of Slovenia
Ministry responsible for environmental protection
Waste
Waste Management Plan and Waste Prevention Programme of the Republic of Slovenia
2016, Government of the Republic of Slovenia
Ministry responsible for environmental protection
Energy
National Action Plan for Nearly Zero-Energy Buildings Up to 2020, (AN sNES).
2015, Government of the Republic of Slovenia
Ministry responsible for energy
Long-term Strategy for Promoting Investments in the Energy Renovation of Buildings, (LTSERB).
2015, Government of the
Ministry responsible for energy
28
Document title Adoption Implementation management
En
erg
y s
up
ply
Tra
nsp
ort
Bu
ild
ing
s
Ind
ustr
y
Ag
ricu
ltu
re
LU
LU
CF
Wa
ste
Republic of Slovenia
New strategy in preparation
Energy Concept of Slovenia (ECS) In preparation Ministry responsible for energy
Transport
Transport Development Strategy of the Republic of Slovenia (TDS) by 2030.
2015, Government of the Republic of Slovenia
Ministry responsible for transport
Resolution on the National Programme for the Development of Transport of the Republic of Slovenia until 2030 (ReNPRP30)
2016 Government of the Republic of Slovenia
Ministry responsible for transport
Agriculture
Resolution on the National Programme on Strategic Orientations for the Development of Slovenian Agriculture and Food Industry “Our Food, Rural and Natural Resources 2021” (ReNPURSK)
2020, Government of the Republic of Slovenia
Ministry responsible for agriculture
Forestry
Operational Programme for the implementation of the National Forest Programme 2017–2021 (OP NGP)
2017, Government of the Republic of Slovenia
Ministry responsible for forestry

29
4.2 Regional and local activities in the field of climate change
Administratively, Slovenia is divided into 212 municipalities, 11 of which have the
status of urban municipality. There is no regional level of governance in Slovenia.
This is why the majority of programmes and measures are implemented at the
national level and all subsidies dedicated for the reduction of GHG emissions are
allocated at the national level. However, municipalities have several obligations
related to the planning of measures for the reduction of GHG emissions and an
important role in the preparation of projects and monitoring their impacts.
A local energy concept is mandatory for all municipalities in accordance with the
Energy Act (EZ-1). On the basis of the local energy concepts (LECs), the use of RES is
planned in the territory of a local community. Objectives and measures for achieving
these objectives are defined in LECs and they must be compliant with action plans in
the area of EEU and RES and the national umbrella energy policy, in the future with
NECP. An LEC is an important basis for development planning at the level of a local
community as it presents the mandatory expert basis for the preparation of spatial
plans of the local community. Bodies of a local community and providers of energy-
related activities in the area covered by an individual LEC are obliged to align the
respective development programmes and related activities with objectives and
measures envisaged in the LEC. The local energy concept is a mandatory document
which must be prepared by a local community (possibly in cooperation with other
communities) at least every ten years. The methodology for the preparation of LEC is
set by the Ministry responsible for energy. Practically all municipalities have adopted
an LEC. Important decisions for reducing GHG emissions are also adopted by
municipalities within the scope of municipal spatial plans.
Environment protection programmes have been adopted by all Slovenian urban
municipalities; these programmes also include objectives for reducing emissions of
air pollutants for the improvement of the air quality, and for reducing GHG
emissions and air pollutants emissions. They also include EEU measures for
achieving objectives set in regard to light pollution. Air quality plans have been
adopted by all municipalities with excessive particle pollution (PM10 particles). The
EEU measures, simultaneously also being measures for reducing GHG emissions,
hold an important role. The implementation of measures is promoted by the State by
providing additional subsidies financed from the Climate Change Fund.
Within the framework of the Operational Programme for Implementing the
European Cohesion Policy for 2014−2020 under investment priority no. 4: Sustainable
use and production of energy and smart networks, the municipalities were able to
apply for financial resources to construct an integrated transport strategy (ITS). The
specific objective of the co-financing of operations was development of urban
mobility and improvement of the air quality in the cities. Integrated transport
strategies enable the establishment of a sustainable transport system, contributing to
reduced energy consumption, greenhouse gas emissions, and pollution. Through ITS

30
municipalities include reducing GHG emissions in the transport sector. The
municipalities have begun to cooperate at the regional and international levels and
engage in developing regional integrated transport strategies. The latter are not
mandatory, nor are any guidelines given on the part of the State.
In 2019, the Gorenjska region was the first to draw up a sustainable energy and
climate plan completely on its own initiative. Through other projects (e.g. LIFE), the
municipalities have also drawn up other documents/strategies, e.g. Adaptation
strategy for agriculture in the municipality of Ajdovščina.
On a voluntary basis, municipalities have joined various international initiatives,
such as, for example the “Covenant of Mayors Committed to Local Sustainable
Energy”. These municipalities have set the target of reducing GHG emissions by
more than 20% by 2020, which has been defined in their Sustainable Energy Action
Plans. In 2015, the Covenant of Mayors set new objectives for 2030, which are
reducing CO2 emissions of greenhouse gases by at least 40% and a merger of climate
change mitigation and adaptation under a common framework. The newly initiated
“Covenant of Mayors for Climate and Energy” was presented by the European
Commission on 15 October 2015 during an event at the European Parliament in
Brussels. The signatories also support the joint vision for 2050: promoting the
decarbonisation of territories, strengthening the ability to adapt to the inevitable
effects of climate change, and ensuring access to safe, sustainable and affordable
energy for citizens. The signatories are committed to submit an action plan for
sustainable energy and climate change within two years from the date of the local
council’s decision adoption. The plan will outline the key measures the signatories
intend to take. In 2019, there were 30 Slovenian municipalities included, of which 29
submitted their action plans for sustainable energy.
Seven local energy agencies, created by municipalities with the support of the state
and European programmes in 2006, are highly active in the preparation of local
energy concepts, the implementation of efficient energy use measures and use of
renewable resources in municipalities. Every agency connects the municipalities that
have established it with the wider geographical area, and acts as a promoter of
projects and supports local communities in preparing their projects. With their
assistance, municipalities also get united with applications for international tenders
regarding technical assistance for the implementation of EEU and RES measures.
They play an important role in the implementation of new instruments in practice,
such as energy contracting, energy management, etc. They are an important element
in the cross-border and cross-regional cooperation of municipalities in the field of
sustainable energy and mitigation of climate change.
Municipalities are also cooperating when it comes to the implementation of climate
change mitigation measures, especially in the construction of waste management
infrastructure and sustainable mobility, including infrastructure for the development
of public passenger transport, non-motorised forms of transport and the introduction
of alternative fuels into transport. The Association of Municipalities and Towns of

31
Slovenia is becoming increasingly active in the field of climate change and is
considering establishing a commission for the climate crisis within its organisation.
Within the LIFE IP Care4Climate project, an action is also carried out to integrate
local communities into the transition to a low-carbon society (LCS). The purpose of
the activities is to empower local communities, in particular municipalities, to
contribute to the goal of reducing GHG emissions through the implementation of
community-based projects in the field of energy, mobility, local circular economy
and food supply.
4.3 Multi-sectoral instruments
(M-1) GHG EMISSION TRADING SYSTEM (EU ETS)
Sectors affected by the implementation of the measure: energy industries,
manufacturing industries and construction, industrial processes
The objectives of GHG emission trading system are the following: to support the
commitments to reduce emissions; to enable lower costs for corporate entities by
enabling a decrease in emissions where this is the cheapest; to equalise the costs of
the reduction of GHG emissions in the entire EU area by permitting trading between
member states – this will minimise the restriction of competition and discrimination
of the position of corporate entities (operators of plants responsible for GHG
emissions) in the common internal EU market, and facilitate the reduction of GHG
emissions in the future by rewording innovation contributing to the reduction of
GHG emissions.
A decision was made at the EU level that the market stability reserve mechanism will
be crucial for reaching the objective of the EU ETS sector by 2030.. It was defined by
Decision (EU) 2015/1814, and was put into practice at the beginning of 2019. In 2018,
the legal framework was adopted for the fourth stage of the EU-ETS, i.e. from 2021 to
2030, with the following amendments:
After 2021, the scope of emission allowances in the market will be reduced by
2.2% annually (and not 1.74% as in the period from 2013 to 2020);
There was a decrease in the number of industries involved in the so-called
carbon leakage, and the number of allowances allocated free of charge will
thus be reduced compared to the previous period.
Innovation promotion through revenue from EU ETS auctions will increase;
this will also facilitate the modernisation of the energy system and
improvement of the energy efficiency in the Member States.
The level of free allocations given to installations the operation of which is
estimated to increase or decrease by more than 15% on the basis of a moving
average of two years compared to the baseline level is being adjusted.
In the third phase, after 2013, 49 installations in Slovenia were included in the GHG
emission trading system and these represented 38% of total GHG emissions in 2017.
Installations are distributed in the following IPCC sectors: Energy industries, where
32
majority of the emissions are included in the EU ETS; fuel use in Manufacturing
industries and construction, where 63% of GHG emissions of this sector are included
in the EU ETS; and Industrial processes, where 57% of GHG emissions are included
in the EU ETS. Since 2013, the EU ETS also includes aviation.
Since 2013, Member States may, at the request of the operator, exclude the so-called
small installations from EU ETS, the emissions of which are less than 25,000 tonnes of
carbon dioxide equivalent and having a rated thermal input power during
combustion below 35MW without emissions from biomass in each of the previous
three years prior to the next period (2016−2018 for the 2021−2025 period). Excluded
installations are required to implement the so-called alternative measures to achieve
an equivalent contribution to emissions reduction. The Ministry of the Environment
and Spatial Planning imposed that the equivalent measure is the payment of
environmental tax due to CO2 (CO2 tax), taking into account that the respective tax is
not paid to the level of free-granted emission allowance. If the average price of
allowances is more than 30% higher than the environmental tax, the operator must
pay the environmental tax in the amount of the average price of allowances.
In the 2005−2018 period, emissions of the EU ETS sector decreased, i.e. by 27% in the
energy industries sector, by 22% in manufacturing industries and by 25% in
industrial processes.
At the EU level, the legally binding objective of reducing GHG emissions from this
sector by 21% by 2020 compared to the 2005 level has been adopted and is the
common goal for the EU-28 and is not further differentiated to each Member State.
Although without a legally binding national objective, Slovenia exceeds this level.
For the period until 2030, the objective of reducing emissions by 43% was set.
The Ministry of the Environment and Spatial Planning (MOP) is responsible for its
implementation, while the tasks encompass implementation of the provisions of the
Environmental Protection Act referring to trading with emission allowances. The
establishment of the system falls within the competence of the EU.
(M-2) ENVIRONMENTAL TAX ON AIR POLLUTION DUE TO CO2 EMISSIONS
Sectors affected by the implementation of the measure: manufacturing industries and
construction, other sectors (energy use in households, the service sector and agriculture) and
transport
The legal basis addressing environmental tax for air pollution due to CO2 include the
Environmental Protection Act4 and the Decree on environmental tax on carbon
dioxide emissions5.
4 Environmental Protection Act (Official Gazette of the Republic of Slovenia, No. 39/06 – official consolidated text, 49/06 – ZMetD, 66/06 – Constitutional Court Decision, 33/07 – ZPNačrt, 57/08 – ZFO-1A, 70/08, 108/09, 108/09 – ZPNačrt-A, 48/12, 57/12, 92/13, 56/15, 102/15, 30/16, 61/17 – GZ, 21/18 – ZNOrg and 84/18 – ZIURKOE) 5 Decree on environmental tax on carbon dioxide emissions (Official Gazette of the Republic of Slovenia, No. 48/18)

33
The Environmental Protection Act, which presents the umbrella document and
addresses the fundamental prerequisite for sustainable development, protection
against environmental stress. Within this scope, the Act lays down a framework: the
fundamental principles and measures of environmental protection, environmental
monitoring, economic and financial instruments of environmental protection, as well
as public services for environmental protection and other issues related to
environmental protection.
The environmental tax instrument has been introduced in order to internalise the
external costs of air pollution due to CO2 emissions and, being an economic
instrument, was aimed at reducing CO2 emission through the fuel price and therefore
aimed at reducing environmental pollution. The CO2 tax improves the
competitiveness of renewable energy sources and of other energy products with
lower specific emissions and the competitiveness of energy efficiency measures. The
Decree on environmental tax on carbon dioxide emissions6, which imposes an
obligation to pay environmental tax for air pollution due to CO2 emissions was
updated in 2018. The updated decree does not bring major changes and relates in
particular to effective implementation and harmonisation with the Excise Duty Act
and the minimum level of taxation applicable to fuel. The unit of air pollution with
CO2 emission remains €17.3 €/t of CO2. It is planned that CO2 tax will increase (at
least 5% per year) and approach the ETS coupon price7 by 2030. The measure has
effects simultaneously with other measures for promoting improvements in energy
efficiency and fuel substitution in transport and in buildings. Companies included in
the EU ETS system (holders of permits to emit greenhouse gases) are exempt from
environmental tax.
(M-3) USE OF BEST AVAILABLE TECHNIQUES – ENVIRONMENTAL PERMITS
Sectors affected by the implementation of the measure: industrial processes,
manufacturing industries and construction, energy industries, waste, agriculture
The Directive 2010/75/EU on industrial emissions is the key instrument regulating
the emissions of harmful substances, while the most important instrument in regard
to emissions from fuel use or for the promotion of energy efficiency and substitution
of fuels in industry is the emissions trading, EU ETS (measure (M-1)), with the
Directive 2010/75/EU merely complementing it. The aim of the directive is the
introduction and the promotion of the best available technologies (BAT) through
environmental permits for installations and their control. In this manner, the
selection of new installation is influenced and the replacement of existing installation
is encouraged so that the equipment must meet the conditions and provisions from
the directive or standards from the reference documents. The Directive also specifies
the emission limit values for large combustion plants. The Directive is also
6 Decree on environmental tax on carbon dioxide emissions (Official Gazette of the Republic of Slovenia, No. 48/18) 7 The current economic situation is very unstable due to the COVID-19 pandemic and is also reflected in the field of the emission allowance market. In the recent period, a large decline in the ETS allowance price was recorded (on 5/3/2020, the ETS allowance was €23.90/t of CO2, on 19/3/2020, the ETS allowance price was €16.03/t of CO2). The uncertainty in this area is therefore profound.

34
complemented with other EU measures, such as Directive on the reduction of
national emissions of certain atmospheric pollutants (“NEC Directive”) (2016/2284).
In Slovenia, this instrument contributed to important reduction of GHG emissions in
industrial processes, when the old electrolysis unit was stopped since it failed to
meet the standards of the best available technologies. Consequently, PFC emissions
were reduced by approximately 85%. This measure also contributed to the
technological modernisation of the thermal power sector.
(M-4) TAXES AND CHARGES
Sectors affected by the implementation of the measure: manufacturing industries and
construction, other sectors (households, the service sector, agriculture) and transport
The primary role of public finances is to ensure stable sources of revenue, including
energy taxation (environmental tax for air pollution due to CO2 emissions, excise
duty, contribution to support EEU and contribution to support the production of
electricity from renewable energy sources (RES) and high-efficiency cogenerations
(CHP)). The State is limited with requirements on the minimum energy taxation
imposed by the Directive on restructuring the Community framework for the
taxation of energy products and electricityNapaka! Zaznamek ni definiran.. Duties
and taxes are also an important instrument with which a state can influence the price
of final energy and also the price ratio between energy products and thereby attain
the objectives of environmental and energy policy. The contribution to support EEU
is expected to increase gradually by 2030.
The Excise Duty Act of 2016 remains in force and regulates the system and
introduces an obligation to pay excise duty on alcohol and alcoholic beverages and
tobacco products as well as energy products and electricity. Excise duties for self-
supply of electricity from renewable energy sources remain to be charged only for
net electricity consumed, which encourages the exploitation of renewable energy
sources. The excise duties on electricity according to the volume of consumption also
remain chargeable – large consumers pay less – which, however, does not support
climate energy targets. Contrary to the objectives to reduce GHG emissions, a system
of excise duty exemption also remains applicable, which is regulated in detail by the
Rules on the Conditions and Procedures for Excise Duty Exemptions For Energy
Intensive Companies (Official Gazette of the Republic of Slovenia, No. 83/16).
The excise duties on petroleum products increased in the period from 2008 to 2019:
petrol by 33%, the highest excise duty in 2013, when it amounted to 0.53
€/litre
diesel fuel by 29%, the highest in recent years was in 2016 and 2017, when it
amounted to 0.43 €/litre;
extra light fuel oil by 578%, the highest excise duty has not changed since
2016; it amounts to 0.16 €/litre.

35
The Slovenian excise duty policy allows certain suspensions from payment, partial
reimbursements and exemption of excise duty. In accordance with European
legislation (i.e. Directive No. 2003/96/EC on taxation of energy products), the
exemptions of the excise duties identical in all EU Member States have been enforced
in Slovenia, specifically, for energy products used for electricity generation, co-
generation of thermal and electric power, and for fuel use in diplomatic vehicles.
Some other exemptions have also been enforced which are optional at the EU level,
and the reimbursement is calculated as a difference to the regulated minimum excise
duty applicable in the EU. The possibility of a partial reimbursement of excise duty
paid for gas oil has been in place since April 2009, if it is demonstrated that it is
applied for powering commercial vehicles. A partial reimbursement of excise duty is
envisaged for the use of energy products in industrial commercial applications (static
working machinery, construction machinery, motor vehicles on rails, cable ways and
ski lifts) and in the use of energy products applied in agricultural and forestry
machinery. In 2014, a new measure was adopted within the scope of the OP GHG-
2020 for progressive reduction of reimbursement of excise duty, which is contrary to
the objectives of reducing GHG emissions. This should not jeopardise the
competitiveness of the agricultural sector and the achievement of the objectives of the
agricultural and food policy. The report on the implementation of the OP GHG-2020
notes that these reimbursements have been increasing over the years and that the
value of the indicator moves away from the intended target.
The Green Budget Reform project closed in 2019 provided an overview of the
incentives influencing the environment. The continuation of work in the field of
green budget policy – greening the taxation and budgetary policy will also take place
in Slovenia within the framework of the EU Green Deal. Measures are planned at the
EU level: revision of the Energy Tax Directive, promoting green budgets of Member
States, etc. The objective is to refocus public investment, consumption and taxation,
and create a supporting environment to promote and finance private investments,
while also adequately addressing the exemption from excise duties on fossil fuels,
which are in contradiction with the objectives of OP GHG and are not decreasing.
The formulated changes will follow the principles of a just transition for all and
promotion of sustainable behaviour of all sectors of the economy.
(M-5) EDUCATION, TRAINING, AWARENESS-RAISING, COMMUNICATION AND
PROMOTION
Sectors affected by the implementation of the measure: all sectors
Various players in Slovenia (government and the non-governmental sector, media,
business sector, professional institutions etc.) have been carrying out activities for
education, training, communication and awareness-raising in regard to mitigating
climate change. The activities are financed from different sources, including the state
budget, EU funds and various international sources. Currently, the activities are
carried out individually and there is no coordination between them. In accordance
with the OP GHG-2020, the targets for the period up to 2020 have been oriented

36
towards education and training for the transition to a competitive low-carbon
society, the strengthening of human resources for opening new green jobs and for
communicating about the benefits of mitigating climate change and practical aspects
of implementing measures.
An eight-year project IP LIFE Care4Climate will significantly contribute to a more
harmonised approach in the field of awareness-raising and education (also training)
that will promote measures through awareness-raising, education and training of
key stakeholders and help Slovenia achieve its targets for reducing GHG emissions
from 2020 to 2030. In addition to the Ministry of the Environment and Spatial
Planning (MOP) acting as a leading partner, there are 15 partners of public, non-
governmental and also private sector participating in the project. The project will last
from 1/1/2019 to 31/12/2026. It includes the following activities, which will be the
cornerstone of a future integrated training and education system in the field of
adapting to and mitigating the effects of climate change:
Drawing up a training plan for transition to a low-carbon society and
establishing a national qualification platform;
Preparation, implementation and monitoring of training programmes in the
field of energy efficiency, renewable energy sources and green technologies
and confirmation of knowledge obtained;
Integration of local communities into the transition to a low-carbon society;
Strengthening the capacity for the transition to a low-carbon society in higher
education;
Strengthening the capacity of the public administration (national and local
authorities) for the transition to a low-carbon society and the implementation
of participative processes.
The National Energy and Climate Plan adopted on 27 February 2020 envisages
several instruments in the field of training, education, communication and energy
and climate literacy in a total value of approximately EUR 17 million per year.
Measures are foreseen to raise awareness and literacy of the public with regard to the
expected effects of climate change and the reduction of exposure to the impact of
climate change, sensitivity and vulnerability of Slovenia, adaptation to climate
change and enhancing resistance. In addition, in order to reduce impacts on air
quality, the promotion of energy use from biomass will be complemented by
awareness-raising and education of users for the proper use of wood biomass
systems, suitable conditions for the technical functioning of chimney sweeping
services will be established and workshops on sustainable forest management for
forest owners will be prepared. The funds of the Climate Fund are also an important
source for the implementation of the activities mentioned above.
AWARENESS RAISING, COMMUNICATION AND PROMOTION
Articles 351, 352 and 353 of EZ-1 refer to the programmes for communication,
awareness-raising and training of the subject matter. The main change in the
established practice is the transfer of the development and implementation regarding
communication, training and awareness raising programmes for various target

37
groups (households, SMEs, public sector) to the Centre for RES/CHP Support under
Borzen company. The Borzen company is promoting awareness-raising,
communication and training activities on renewable energy sources and efficient
energy use under its own trademark “Trajnostna energija” (in English: “Sustainable
Energy”). A web portal under the same name was also established.
In addition to the portal, Borzen also organised the “Sustainable Energy – Locally
019” conference in 2019 (also in 2017, 2018), the first student hackathon (2018) on
sustainable energy, a media campaign on the radio also addressing the field of EEU,
the prize contests "Moja zelena dežela" (in English: "My Green Country"), an
advertising campaign of EEU measures, new episodes of the environmental cartoon
series “Lepši svet 2” (in English: “Better World 2”) in cooperation with RTV
Slovenija, "Trajnostna energija 018; Naša obljuba za lepši svet" (In English:
"Sustainable Energy 018; Our Promise for a Better World"); the company also made
an invitation to tender for a partial reimbursement of costs for carrying out education
projects in the field of EEU and RES for the young, created a board game - two packs
of cards on the topic of RES and EEU, and prepared a pilot project in collaboration
with the Slovenian Philanthropy - self-sufficient power plant.
The provision of information to households continues to be conducted through the
network of Energy Consulting Network for Citizens (ENSVET), which has been
active since 1993. In 2018, there were 58 qualified independent energy consultants
operating in 55 offices of the ENSVET network. Altogether, they participated in 9,546
activities (providing advice in the form of written reports, online advising, articles,
broadcasts on national television, lectures, schools, etc.). Among these activities,
there were 7879 pieces of written advice, which is only 2% less than planned 8000
pieces of advice from the annual work programme and the most in the history of the
ENSVET network. This norm will increase on a yearly basis with the purpose of
achieving the objective pursued, i.e. 10,000 pieces of advice in 2020. In the field, the
consultants addressed and evaluated the quality of the implementation of 148
projects supported by the Eco Fund. The Eco Fund also completed the
implementation of the new corporate identity. A week of energy consultancy was
also organised and took place in 10 shopping centres.
In 2017, the Eco Fund issued an invitation to tender for co-funding non-
governmental organisations (NGOs) in the amount of EUR 600,000 (EUR 300,000
from the Climate Change Fund and EUR 300,000 from the Eco Fund), and co-funded
projects were implemented in 2018 and early 2019. 28 applications were received; 10
projects were awarded in the total amount of EUR 553,000 including the awareness-
raising and communication projects. In 2018, a new invitation to tender was
published for co-funding nongovernmental organisations, and the funds in the
amount of EUR 550,000 were provided from the Climate CFund. The awarded
projects will be implemented in the 2019−2021 period.
Information on EEU measures and exploitation of RES continue to be submitted to
consumers by other players in the energy service market, such as energy companies,
Eco Fund, local energy agencies, NGOs and others.
38
In 2018, Umanotera finished the "Slovenia is lowering its CO2 emissions" project. The
project identified good practices in Slovenia, which aim to significantly reduce CO2
emissions and contribute to promoting the principles of sustainable development. 20
good practice examples were compiled and presented in a catalogue. In 2017/2018,
the Ministry of the Environment and Spatial Planning financed the relocation of the
website www.slovenija-co2.si to a new infrastructure, update and refreshment of
content. The LIFE ClimatePath2050 project continued with a number of events and
activities (including a photo contest, climate scoreboard for municipalities) that
contributed to communication and raised the awareness on climate change.
The EN-LITE Society for Strengthening Energy Literacy continued its activities in the
field of iENERGY: digital, interactive, education and awareness-raising platform. The
handbook called Transition to a Green Economy (Fit media) was published
representing global trends of sustainable development in Slovenia and fundamental
strategic directions of EU by 2020.
In 2018, the Climate Change Fund also financed the project Climate file-articles on
the subject of climate change published in EOL magazine; the magazine was also
distributed to Slovenian schools. Climate content was also highlighted in EOL
magazine in 2019.
In 2018, the Climate Change Fund provided EUR 700,000 for non-governmental
organisations for content including awareness-raising, education, and training.
Awareness-raising campaigns in the field of transport are also not being monitored
systematically. Promotional activities have been implemented in the framework of
the Integrated Public Passenger Transport (IJPP) project and other projects, which is
also planned for the future.
One of the most visible promotional events was again the European Mobility Week,
which included 77 municipalities in 2018.
Within the OP ECP (in 2019), the Soft Measures of Sustainable Mobility project has
been introduced and will last until 2021. The project encompasses the
implementation of five measures promoting sustainable mobility including also
awareness-raising campaign and promotion of sustainable mobility, and providing
education on sustainable mobility in nursery schools and primary schools. The
awareness-raising campaign is worth 1.8 million euros.
FOCUS is also involved in the IDEA project to develop innovative approaches in the
field of energy poverty. The main objective is to improve the existing and develop
new innovative education methods and training materials on energy poverty for
adults. In 2019, the project continued. Cycling breakfasts were also organised to raise
awareness of the use and importance of the bicycle as a means of transport. In 2018, 5
breakfasts were organised.
The Clear 2.0 project (Slovenian Consumer's Association with partners) also
continued by promoting the transition to a low-carbon society within the scope of
39
which the awareness of consumers is raised of the importance of using local
renewable sources in households, advantages of low-carbon technologies, guidance
on the choice/purchase and use of heating and cooling technologies in households.
EDUCATION
By way of the NECP, the measure regarding the inclusion of climate contents into a
broader education process for sustainable development in Slovenia at all educational
levels continues. The content related to the EEU and use of RES are included in
various educational programmes (for example, the Energy Technology study
programme pursued by the University of Maribor, the Eco-School programme for
nursery schools and elementary and secondary schools, optional subjects regarding
the environmental protection in general upper secondary schools and elementary
schools, etc.). The Framework Programme for the Transition to a Green Economy
foresees the establishment of an Expert Working Group for education and training
on climate change and sustainable development which will also address the need for
an integrated review of the situation and the planning of the development of the
area. Within the measure of education and training on climate change and
sustainable development, the Partnership for a Green Economy, a working group of
the Ministry of Education, Science and Sport, was established in 2016. The task of
developing a set of knowledge and competences important for achieving the
objectives of the green economy has also been fulfilled. The task will be fully
implemented by 2021 with the completion of all the projects.
The Soft Measures of Sustainable Mobility project also includes the measure to
provide education on sustainable mobility in nursery schools and primary schools.
The project is implemented in three school years from 2018–2019 and ends on
31/7/2021. All nurseries and schools received revised handbooks "Sustainable
Mobility – Handbook for nursery school teachers" and "Sustainable Mobility –
Handbook for primary school teachers". The handbooks contain a series of
instructions, materials and examples of activities on sustainable mobility. The
materials for parents (leaflets) and a travel diary for children in primary schools were
also published. In the 2019/2020 school year, more than 120 primary schools (26,545
students) and 111 nursery schools (14,949 children) are participating in the project
through activities.
In the 2018/2019, a new category of topic, i.e. climate change, was added to the
programme of Eco Schools. The topic of climate change is also included in
conferences and education courses organised for headteachers and others included in
the education system by the competent ministry.
In the annual programme of education for the elderly for 2018, the Ministry of the
Environment and Spatial Planning prioritised the education of the elderly on the
sustainable development and climate change, for which EUR 20,000 was earmarked
from the Climate Change Fund in 2018. Within the scope of the same programme, the
education of various target groups on climate change and measures for the transition
40
to a low-carbon society was also highlighted, for which the Climate Change Fund
planned to earmark (2018) EUR 129,500.
Slovenia is also involved in the Climate Kic network (www.climate-kic); Innovation
for climate action, which also includes education.
The 2020–2030 National Environmental Action Programme (NEAP) expects that the
principle of sustainable development is established as one of the key principles of
education process in Slovenia.
In 2019–2020, the updating of the national guidelines of education - training and
education for sustainable development (ESD) from 2017 is foreseen, whereby the
points of view of climate change must be updated.
The systematic review of the field of tertiary education, professional education and
training and university education are planned to be made within the framework of
the LIFE Care4Climate project. Within this project, international summer schools of
the political ecology and four research camps on the topic of transition to a low-
carbon society and climate change mitigation are also envisaged.
TRAINING
In terms of development, energy and material efficiency in conjunction with
sustainable use and local energy supply are the most important segments of modern
society. The accelerated development of these fields, based on the growth in the
quality of energy services along with a smaller energy input, is one of the
fundamental elements of the transition to a climate neutral society and will have a
key effect on the competitiveness of Slovenian society in the future. Therefore, it is
crucial that we continue to strengthen the already highly developed competences of
Slovenian companies in this area. Article 341 of the Energy Act (EZ-1) regulates the
implementation of training programmes for independent experts carrying out
inspections of air-conditioning and heating systems, and independent experts
providing energy performance certificates. Training for regular inspections of air-
conditioning systems has been conducted by the Laboratory for Heating, Sanitary,
Solar and Air-Conditioning Engineering of the Faculty of Mechanical Engineering
since 2014. Since 2012, training for experts providing energy performance certificates
is also taking place and consists of 4 days of lectures and individual production and
presentation of two certificates (calculated and measured).
Since 2008, education for energy managers is carried out in Slovenia under the
"European Energy Manager – EUREM" international programme. In terms of the
number of energy managers that have completed the EUREM on a per capita basis,
Slovenia is the leading country in the European Union. Education activities and
training programmes were also conducted (some of them are still being performed)
including within the scope of various projects and programmes — for example, the
education for engineers and architects in the field of sustainable construction, energy
efficiency, and green public procurement are held by the Slovenian Chamber of
Engineers and Slovenian Chamber of Architecture and Spatial Planning and the
41
Green Building Council Slovenia – GBC, training programmes financed by the
Climate Change Fund (training programmes for elementary school teachers, chimney
sweepers, energy advisers operating within the ENSVET network etc.) and other
training programmes.
In agriculture, within the Rural Development Programme (RDP), which also includes
the transfer of knowledge and information activities in the field of agri-environment-
climate content, several different training programmes in the field of Agri-
Environment-Climate Payments (AECP), ecological farming and animal welfare have
been conducted in recent years. Under the M01.1 submeasure, three public
procurement contracts were successfully carried out in 2018 to conduct training in
the field of animal welfare, one public procurement for regular education in the field
of agri-environment-climate payments and one public procurement for the training
within the measure Ecological farming. Since the start of implementing the 2014–
2020 RDP, 20,115 participants have joined the training in the field of agri-
environment-climate payments (preliminary and regular training), 9,753 participants
have joined the training in the field of ecological farming, and 14,828 in the field of
animal welfare (up to 31 December 2018). Programmes for animal welfare, plans for
conversion to organic farming and programmes of activities for farms were also
prepared in the ecological farming and agri-environment-climate payments
measures.
(M-6) GREEN ECONOMIC GROWTH
Sectors affected by the implementation of the measure: manufacturing industries and
construction, other sectors and transport
One of the objectives of the OP GHG-2020 is to support the transition to an economy
with growth which is not based on the increased use of natural resources and energy
but on economy which is reducing GHG emissions by way of efficiency and
innovation, improving competitiveness and promoting higher security of the energy
supply. It therefore includes measures for increasing domestic demand for green
solutions and represents a great opportunity for green economic growth, being
oriented towards the sectors of buildings, transport, agriculture, waste and industry
and supported by incentives for research and technological development and eco-
innovation. The OP GHG-2020 in particular focuses on issues of sustainable
consumption and production, supporting innovation and research and reducing
subsidies which are contrary to the objectives of reducing GHG emissions.
OP GHG objectives also include the transition of economy based on energy efficiency
and reduction of GHG emissions supported by research and innovations. The
transition represents an opportunity for green economic growth across sectors:
buildings, transport, agriculture, industry and waste. The OP GHG-2020 in particular
focuses on issues of sustainable consumption and production, supporting innovation
and research and reducing subsidies which are contrary to the objectives of reducing
GHG emissions.
42
The transition to a low-carbon economy in all sectors is a high priority objective in
the OP ECP for 2014−2020 period, together with the strengthening of research,
technological development and innovation. Financial incentives within the scope of
the OP ECP, which support the transition to a low-carbon economy – reducing the
impact on climate change and the reduction of GHG emissions, which have not been
adequately targeted in the past:
EUR 53 million was earmarked for research and innovations (financial
breakdown 2018).
EUR 86.4 million was earmarked to promote the development of
entrepreneurship (financial breakdown 2018)
A new programme for the use of European structural and investment funds for the
2021–2027 period is also being prepared, but has not yet been finalised.
With the help and through close cooperation of all EU members, the EU is seeking a
new Green Deal to intensify ambition in the field of reducing the impact on climate
change and achieve net-zero emissions through measures and by:
Forming a more ambitious climate policy;
Developing a new industrial strategy with an emphasis on clean industry
based on the circular economy;
Providing smart sustainable mobility;
Greening of agricultural policies;
Preserving and protecting biodiversity;
Increasing ambition in the field of achieving zero emissions;
Providing a sustainable mindset in all EU policies.
At the same time, it is necessary to address energy poverty and ensure clean, safe
and accessible energy for all. The Green Deal envisages the implementation of a
series of measures based on development and research, which will enable the
creation of a net-zero carbon society. In the field of taxes and fees, the greening of tax
reforms as well as within the entire public financial system is expected.
(M-7) ENERGY LABELLING AND MINIMUM STANDARDS FOR PRODUCTS AND
DEVICES
Sectors affected by the implementation of the measure: other sectors (energy use in
the public sector, service sector and households), transport
Eco-design requirements for energy related products are defined in Article 327 of the
EZ-1; they come from Directive No. 2009/125/EC establishing a framework for the
setting of eco-design requirements for energy-related products. The requirements are
transposed to the Slovenian legal order directly with Commission Regulations.
Currently there are 28 regulations for products covering a wide range of products
and horizontal technologies: electric motors, ventilation units, heating installations,
air conditioning units, processes chillers, transformers, commercial refrigerators,
household appliances, televisions, lamps and energy consumption in stand-by mode.
43
The regulations lay down minimum requirements for energy efficiency, and for
certain products also other environmental parameters, such as noise, NOx emissions.
The regulations are updated regularly. The last adopted regulations also focus on the
efficiency of resource use, e.g. through the request for the accessibility of spare parts
and information on the repair for minimum number of years, etc.
The requirements for energy labelling of products are defined in Article 328 of the
EZ-1, stemming from the Energy Labelling Directive, which was last updated
through the Regulation (EU) 2017/1369 establishing a framework for energy
labelling8. This regulation introduces a gradual transition to the labelling of products
with a simpler scale from A to G, as the lowest categories from the previous scale
(from A+++ to G) will no longer be necessary due to the development of more energy
efficient products. The first five regulations for products have been renewed recently
based on the directive and will enter into force in 2021. Regulations will be updated
regularly. Labelling is in force for 16 products. These requirements are also
transposed directly to the Slovenian legislation.
In Slovenia, favourable loans granted by the Eco Fund are available to purchase large
energy-efficient household appliances, specifically, for stoves, refrigerators, freezers
or their combinations, for washing machines, drying machines and dishwashers
classified into A+ energy class or higher in terms of energy consumption. The
purchase of energy-efficient household appliances is also one of the measures by
which the obligated parties can achieve necessary savings under the mandatory end-
use energy-savings scheme.
(M-8) ENERGY SAVINGS ACHIEVED AT END-USERS THROUGH THE NATIONAL
ENERGY EFFICIENCY OBLIGATION SCHEME FOR ENERGY SUPPLIERS
Sectors affected by the implementation of the measure: other sectors (energy use in
the public sector, service sector and households), manufacturing industries and construction,
transport
The scheme of the mandatory final energy savings for companies selling energy,
established in accordance with Article 7 of the Energy Efficiency Directive (EED)9, is
governed by the Decree on Energy Savings Requirements adopted in 201410. Obliged
parties, i.e. all suppliers of electricity, gas, liquid and solid fuels to end-customers,
had to achieve energy savings of 0.5% in 2017, and in the following years 0.75% of
the energy sold in the previous year.
In 2018, obliged parties achieved a reduction in energy use by 281.9 GWh, which is
12% more than in the previous year. 38% of all savings were achieved in industry,
20% in transport and 18% in the energy transformation, distribution and
transmission sectors. The most savings were achieved through the installation of heat
8 Regulation (EU) 2017/1369 of the European Parliament and of the Council of 4 July 2017 setting a framework for energy labelling and repealing Directive 2010/30/EU, OJ L 198, 28/7/2017 9 Directive 2012/27/EU of the European Parliament and of the Council of 25 October 2012 on energy efficiency, amending Directives 2009/125/EC and 2010/30/EU and repealing Directives 2004/08/EC and 2006/32/EC, OJ L 315, 14. 11. 2012. 10 Official Gazette of the Republic of Slovenia, No. 96/14

44
and electricity co-generation systems (22%), followed by adding additives to motor
fuel (19%), installation of energy-efficient lighting in buildings (15%) and the
exploitation of waste heat in industry (8%). Together, these measures accounted for
almost two-thirds of all the savings achieved. Obliged parties exceeded the
requirement from AN URE and the Decree by 12.5%. The reduction of CO2 emissions
achieved through the implemented measures was estimated at 86kt CO2/year in 2018.
The implementation of the measure will continue in the future. The requirement of
achieving energy savings will continue in the 2021–2030 period in accordance with
the Directive (EU) 2018/2002 amending Directive 2012/27/EU on energy efficiency11
adopted in December 2018.
4.4 Energy supply
(M-9) TECHNOLOGICAL MODERNISATION OF THE THERMAL POWER SECTOR
Sectors affected by the implementation of the measure: energy industries and fugitive
emissions
In the past, measures have already been taken to modernise the thermal power sector
in terms of technology. By 2014, Units 1–3 were permanently shut down in the
Šoštanj Thermal Power Plant (TEŠ), in 2015 a new Unit 6 started to operate and will
gradually replace the production of all other existing units of the power plant. In
2018, TEŠ Unit 4 also stopped operating. In 2014, the coal unit stopped its operation
at the Trbovlje Thermal Power Plant and in 2012 also the Trbovlje Hrastnik Mine,
which was the main fuel supplier. In 2008, the Ljubljana Thermal Power Plant (TE-
TOL) started co-firing wood biomass and coal (wood biomass replaced 20% of coal).
In 2018, Unit 6 was installed at the Brestanica Thermal Power Plant, and Unit 7
started to be constructed in 2019 to replace old Units 1–3. For further reduction of
GHG emissions, the following planned measures are crucial:
TEŠ: The Contract on the Arrangement of Mutual Relations between the
Government of Republic of Slovenia and Šoštanj Thermal Power Plant from
2012 defines a gradual reduction of GHG emissions, stating an emissions
ceiling of annual CO2 emissions from the units 5 and 6 for the 2016–2054
period. The upper ceiling will be reduced, considering the initial value; it will
be 28% lower by 2030, 40% lower by 2035 and 52% lower by 2040. TEŠ Unit 5
is expected to operate until 2030. The NECP envisages gradual abandonment
of the use of domestic and imported coal for energy purposes or its reduction
by at least - 30% by 2030. The precise timetable for abandoning the use of coal
in Slovenia, including shutting down the Velenje Mine and Unit 6 will be
determined by the strategy for the abandonment of coal use and restructuring
of coal regions according to the principle of fair transition, which will be
adopted by 2021.
11 Directive 2012/27/EU of the European Parliament and of the Council of 25 October 2012 on energy efficiency, amending Directives 2009/125/EC and 2010/30/EU and repealing Directives 2004/08/EC and 2006/32/EC, OJ L 315, 14. 11. 2012.
45
TE-TOL: In 2019, the contract was signed for the performance of an
investment in the gas steam unit which will replace coal units 1 and 2 in 2022.
Unit 3, where co-firing of wood biomass and coal is carried out, will
gradually be replaced by the unit on wood biomass.
The main mechanisms for achieving the implementation of the above measures are:
GHG emissions trading system (EU ETS), efficient operation of electricity markets,
environmental permit requirements relating to air pollutant emissions, support
scheme for electricity produced in co-generation of heat and electricity with high
efficiency and from RES, ensuring the reliability of electricity supply (the NECP lays
down a target that at least 75% of electricity required must be generated in Slovenia)
and the possibility of State guarantees in taking long-term loans.
(M-10) PROMOTION OF ELECTRICITY GENERATION FROM RES AND HIGH
EFFICIENT ELECTRICITY AND HEAT CO-GENERATION
Sectors affected by the implementation of the measure: energy industries,
manufacturing industries and constructions, other sectors (energy use in the service
sector, public sector, agriculture and households)
The promotion scheme for high efficiency co-generation of electricity and heat (CHP)
and renewable energy sources was introduced by Slovenia in 2002. In 2009, some
important modifications were introduced in the scheme in order to promote too slow
a development in CHP. As it has been shown over time that the majority of all new
entrants into the scheme are represented by the most expensive technologies, the
amended Energy Act (EZ-1)12 in 2014 introduced a full renewal of the support
scheme with the goal of managing its costs. Amendments to the 200913 support
scheme and support for energy-intensive companies in the form of reduced
contributions to the support scheme were notified to the European Commission as
State aid in May 2015. Until October 2016, when the Republic of Slovenia waited for
the decision of the European Commission on notification of the State aid, no support
was provided for electricity from the new RES generation unit and CHP generation
unit, and consequently there were no investments in such devices14. On 10 October
2016, the European Commission authorised Slovenia to provide State aid to
electricity producers from RES and CHP generation units15. Since the notification of
the support scheme expired on 31 December 2019, Slovenia asked for and in August
2019 obtained the consent of the European Commission for extending the operation
of support scheme16 for 6 years, i.e. until the end of 2025.
12 Official Gazette of the Republic of Slovenia, Nos. 17/2014 and 81/2015, prior Energy Act, Official Gazette of the Republic of
Slovenia Nos. 27/07–Official Consolidated Text, 70/08, 22/10, 37/11– Constitutional Court Decision, 10/12 and 94/12–ZDoh-2L.
13 Commission decision SA.28799 Support for production of electricity from renewable energy sources and in co-generation installations, OJ C 285, 26.11.2009.
14 The last entry of the generation units into the “old support scheme” was realised with the conclusion of a contract on the use of the system between the electricity producer and the electricity system operator prior to 22 September 2014, which, according to the provisions of the EZ-1, was a requirement for listing in the old support scheme.
15 Decision State aid SA.41998 (2015/N) – Slovenia, of 10/10/2016, No. C(2016) 6592 final. 16 Decision State aid SA.54949 (2019/N) – Slovenia, of 9/8/2019, No. C (2019) 5983 final
46
Since the entry into force of EZ-1, support has been limited to installations with
lower thresholds of the nominal capacity (10MW for RES generation units, with the
exception of generation units utilising wind power (50MW) and 20MW for CHP
generation units). The renewal of the scheme provides support in the form of
guaranteed purchase only to installations with a power up to 500kW, while larger
installations can only receive operating premium. The duration of support for
electricity from RES generation units is further limited to 15 years and support for
electricity from CHP generation units to 10 years. For the installation to enter the
scheme, it must be selected on the basis of an open public call by the Energy Agency
(Article 373). The Centre for RES/CHP Support is responsible for implementing the
scheme; said centre operates within the organisation of the market organiser, Borzen.
In accordance with the EZ-1, the Energy Agency selects projects and decides on their
acceptance or refusal to enter the scheme.
EZ-1 also encourages co-generation by introducing the mandatory use of RES, CHP
and waste heat in district heating systems (Article 322) (M-11). The high efficiency
co-generation represents one of potential alternative systems for energy supply for
which a feasibility study must be produced when constructing a new building and
during greater renovation of a building or its individual part (Article 332).
Additional support for co-generation is also found in Guarantees of origin for
electricity which are supposed to make the trading of electricity generated from RES
and CHP easier; they are defined in detail in Articles 366 and 367 of the EZ-1. In
addition, fuels used for electricity and heat co-generation are exempt from the
payment of excise duty, in accordance to the Excise Duty Act (ZTro-1)17.
The installation of high-efficiency CHP units is also promoted by the Rules on
Efficient Use of Energy in Buildings18, which defines that the energy performance of a
building is met if at least 50% of end-use energy for the heating and cooling of the
building and for providing hot water is obtained from such systems or if at least 50%
of a building is supplied from an energy efficient district heating or cooling system.
The efficient co-generation of electricity from RES is also promoted by Guarantees of
origin.
In 2017, the CHP support scheme system included installations with the total of
82.4MW of electric power installed, which generate a total of 295GWh of electricity.
According to the previous year, the installed power was reduced by 7.9%, primarily
as the scheme did not allow new installations to enter. In 2018, the installed power of
the included installations was slightly decreased and amounted to 80.8MW while
they produced 320GWh of electricity. The reduction in GHG emissions due to the
operation of CHP systems on fossil fuels is estimated at 224.3kt CO2 eq. in 2017 and
at 216.3kt CO2 eq. in 2018.
In 2017, the RES support scheme syste
17 Official Gazette of the Republic of Slovenia, No. 47/16. 18 Official Gazette of the Republic of Slovenia, Nos. 52/2010 and 61/17-GZ.

47
m included RES installations with a total of 342.2MW of electric power, which
generated a total of 650GWh of electricity, or only 4.9% more than a year before. In
2018, electric power of installations amounted to 329.8MW, which generated 4.8%
more than in 2017, i.e. 618GWh. These installations include by far the most solar
power plants, with their number having increased dramatically in the 2011–2013
period. In total, in 2017, the installations on RES included in the support scheme
contributed to the reduction of GHG emissions by 190.5, and by 183.7kt CO2 eq in
2018.
According to the EZ-1 (Article 373), the Energy Agency shall, each year before 1
October, issue a public call inviting investors to submit projects for RES or CHP
generation units that are applying to enter the support scheme. Within the public call
framework, the projects will be chosen according to the allowed increase in funds
providing support over the next year, compliance of the project with the plan for the
operation of the support scheme with a view to achieving the targets, and the price
offered for the production of electricity. From the start of the new support scheme in
2016, the Energy Agency announced 5 public calls for the application of projects of
electricity generating plants from RES and in CHP for entry into the support scheme,
namely in December 2016, September 2017, February and December 2018 and June
2019. Within the scope of each of these public calls, 10 million euros were put in
place, i.e. a total of EUR 50 million. 285 projects with a total rated electric power of
325.9MW were selected. The largest number of projects have been selected for the
installation of internal combustion engines (30%), followed by solar and wind power
plants with 25% or 22%. The maximum rated electrical power foreseen, i.e. two-
thirds, fell to wind power plants, followed by internal combustion engines with 15%.
With projects to build wind power plants selected under a public call in February
2018, it is planned to install nearly 108MW of new rated electrical power,
representing one third of the total power of all validated projects. Due to problems in
terms of geographical location, it is hard to expect all these projects to be actually
launched.
In addition to funds from the support scheme, investment incentives for the
installation of co-generation units can also be obtained through calls under Energy
efficiency obligation scheme for energy suppliers. The installation of CHP units is
also encouraged by the public Eco Fund by providing loans for investments with
favourable interest rates.
In 2017, investment subsidies were tendered to promote the construction of new
smaller installations for the production of electricity from RES (wind energy and
small hydroelectric power plants with a maximum power of 10MW) amounting to
EUR 4 million, while in 2019 there were subsidies for the installation of solar power
plants amounting to EUR 10 million. The last call will finance operations until 2022
within the scope of the Operational Programme for the Implementation of the
European Cohesion Policy 2014–2020 (OP ECP).
In order to increase RES-generated heat and electricity in the 2015−2020 period, there
will be funds available within the scope of the Rural Development Programme 2014–
48
2020 (RDP), specifically, within the scope of the support instruments for investments
in agricultural holdings, support for investments in processing, marketing and/or
development of agricultural products and support for investments in the
establishment and development of non-agricultural activities. Support instruments
will be partially dedicated to the production of electricity and heat from RES for the
purpose of production, processing or marketing of agricultural products, and the
other part will be used for the production of electricity and heat from RES for the
purpose of sale.
In Slovenia, there is also potential for further construction of hydropower plants
(HPP), e.g. on the lower Sava River (HPP Mokrice) and the middle Sava River. Large
HPP have a major impact on the environment, and that is why the NECP plans to
implement the following activities in this field: supplementing the regulations for
more efficient and sustainable spatial placement of plants, preparing analysis of
alternatives and the specificity of hydropower and the necessity of its exploitation to
achieve the objective of GHG emission neutrality and ensuring the implementation
of applicable programmes, harmonising and supplementing the rules governing and
facilitating the implementation of the public benefit procedure in protected areas.
The Decree on Self-supply of Electricity from the Renewable Energy Sources19
entered into force on 15 January 2016. For households and small business consumers
and through the amendment from 2019, including consumer groups and not only
owners but also tenants, it enables self-supply of electricity from RES for the entire or
partial coverage of their own electricity consumption with a self-supply device based
on net-metering. The maximum rated power of the self-sufficient installation must
not exceed the 0.8-times the power the of the installed fuses . Electricity consumption
of the owners of self-supply devices will be charged at the end of the calendar year:
the difference between the received and the delivered electricity (kWh) will be read
at the same measuring point at the end of the accounting period.
In 2018, 1,302 installations were newly connected to with a total rated power of
13.12MW according to the data of distribution system operator, which is twice as
many as in 2017. Together, there are 2,156 installations connected with a total rated
power exceeding 20MW. The large majority of connected installations are solar
power plants, there are 9 small hydropower plants, and the first wind power plant
was also connected in 2018.
(M-11) PROMOTING THE PRODUCTION OF DISTRICT HEAT FROM RENEWABLE
ENERGY SOURCES AND HIGH EFFICIENCY CHP
Sectors affected by the implementation of the measure: energy industries,
manufacturing industries and constructions, other sectors (energy use in the service
sector, public sector, agriculture and households)
19 Official Gazette of the Republic of Slovenia, No. 97/2015.
49
Promoting the production of district heat from renewable energy sources (RES) and
high-efficiency co-generation of heat and electricity (CHP) involves the
implementation of two instruments, namely efficient district heating systems and the
promotion of the development of district heating systems on RES under the
Operational Programme for the Implementation of the European Cohesion Policy
(OP ECP)20 and the Rural Development Programme (RDP)21.
EFFICIENT DISTRICT HEATING SYSTEMS – MANDATORY SHARE OF RES, CHP AND
WASTE HEAT IN DISTRICT HEATING SYSTEMS
Mandatory heat share values from RES, which all district heating systems must
achieve, are defined in Article 322 of the EZ-1. In 2019, there was a change in the
respective Article, namely the requirements were harmonised with the Directive
2012/27/EU on energy efficiency. Heat distributors must ensure that heat is provided
from at least one of the following sources on an annual basis: (i) at least 50% of heat
is generated from RES, (ii) at least 50% from waste heat, (iii) at least 75% of heat from
high efficiency CHP or (iv) at least 50% of heat combination generated from at least
two sources referred to in the first three indents. Distributors must meet this
obligation no later than by 31 December 2020.
The National Energy and Climate Plan sets out the objective of increasing the share
of RES and waste heat and cold in district heating and cooling systems per year by
1% in accordance with the Directive (EU) 2018/2001.
For 2018, the Energy Agency, in terms of energy efficiency, analysed 90 district
heating systems still in line with the initial requirements of Article 322 of the EZ-1.
There were 52 energy-efficient district heating systems or 58%, which is 3 percentage
points less than a year before. Data for 2019 are not yet available.
PROMOTING DEVELOPMENT OF THE DISTRICT HEATING SYSTEM ON RES WITHIN
THE SCOPE OF OP ECP AND RDP
Grants for district heating systems on RES are planned in the scope of the OP ECP,
the “Sustainable consumption and production of energy and smart grids” priority
axis, for the construction of new and reconstruction of existing heating systems;
grants for connecting new users to pre-existing capacities are also planned. Within
the scope of the calls RES district heating systems 2016 (DO OVE 2016) and RES
district heating systems 2017 (DO OVE 2017), 14 projects were completed by the end
of 2019, 4 projects are in progress, for which 5.9 million euros of grants were
earmarked. The total increase in RES production is projected to amount to 21.4GWh.
In September 2019, the Ministry of Infrastructure published the third call (DO OVE
2019) for financial incentives to invest in the RES district heating systems (with the
maximum power of 10MW) and RES district heating microsystems (with the
maximum power of 1MW). The total funds approximately amount to 20 million
euros.
20 Operational Programme for the Implementation of the European Cohesion Policy 2014−2020, Government of the Republic of
Slovenia, December 2014, http://www.eu-skladi.si/sl/dokumenti/kljucni-dokumenti/op_slo_web.pdf 21 Rural Development Programme, https://www.program-podezelja.si/sl/kaj-je-program-razvoja-podezelja-2014-2020

50
In the Rural Development Programme, investments are planned for the
establishment and development of non-agricultural activities. Financial resources are
intended for agricultural holdings and micro and small businesses in settlements of
up to 5,000 inhabitants, including for investments in the production of electricity and
heat from renewable energy sources such as wood mass, biomass, manure and liquid
manure, water, wind, sun (sub-measure M06.4). Funding will be available in 2020.
The funds to promote the development of systems will also be provided by 2030 in
line with the National Energy and Climate Plan. In addition to existing purposes,
funds will also be earmarked for the integration of sectors (energy storage devices,
"power2heat", etc.)
The Eco Fund provides the possibility to obtain a loan with favourable rates for the
establishment or restructuring of installations for CHP and also for construction of a
district heating and cooling system.
4.5 Energy Use
(M-12) PROMOTION OF EFFICIENT ENERGY USE IN INDUSTRY
Sectors affected by the implementation of the measure: manufacturing industries
and construction
At the beginning of 2020, the National Energy and Climate Action Plan22 was
adopted which envisages both sectoral and multi-sectoral measures for the efficient
use of energy, the reduction of GHG emissions and the increase in the use of
renewable energy sources. The measures provided below are in line with the time
frame set by NECP, namely by 2030 with a view to 2040.
Focusing on targeted sectoral measures to encourage EEU and RES measures in
industry in general, the following measures may be highlighted: financial incentives
in the form of reimbursable grants and non-reimbursable grants.
In the context of financial incentives in the form of reimbursable grants, further
strengthening of the promotion of measures in industry (use of best available
techniques) and the preparation of targeted support mechanisms, also for promoting
energy performance contracting, are envisaged.
Non-reimbursable financial incentives for the EEU and RES in industry are foreseen
within the Eco Fund and EU cohesion funding scheme. The expansion of the range of
measures, an increase in funds and support activities are foreseen. Financial
incentives for EEU and RES for small and medium-sized enterprises, incentives for
introducing the energy management systems and loans with subsidised interest rate
for environmental investments are also envisaged. In order to reduce process
emissions in industry, non-reimbursable financial incentives and the preparation of
22 Integrated National Energy and Climate Plan of the Republic of Slovenia, the Government of the Republic of Slovenia, February 2020

51
support schemes in connection with incentives for demonstration projects are
foreseen; the measure is aimed at the ETS and non-ETS sector and envisaged from
2021 onwards.
Non-reimbursable incentives also include incentives for measures to reduce GHG
emissions in industry through the measures of circular economy. The NECP
envisages the preparation of a non-reimbursable incentive scheme for measures
enabling a transition to a low-carbon circular economy. The existing measures and
instruments need to include conditions and criteria of circular management, which is
envisaged in 2020. Support for the implementation of pilot projects of circular
economy and other incentives to reduce emissions in industry, in line with the new
European Green Deal, is foreseen in 2021. New incentives for measures that reduce
GHG emissions through a transition to production by introducing new products
(lighter products, products with longer life cycle, reuse of products or materials,
waste reduction and recycling, replacement of natural gas with synthetic gas or H2)
are also foreseen to be implemented in 2023.
The State promotes energy efficiency and the exploitation of renewable energy
sources in industry including within the scope of other fees for energy products,
notably through tax policy and different incentives (multi-sectoral or horizontal
measures). In 2021, the plan provides for an upgrade of the energy efficiency
obligation scheme and the gradual increase of the energy-efficiency contribution for
the provision of necessary special-purpose assets for implementing EEU and RES
measures. Fiscal incentives for enterprises in the form of relief to carry out
investments are envisaged in 2022. An exemption scheme will also be upgraded for
the payment of the contribution to provide support for the production of electricity
from RES and CHP. Since 2024, only undertakings having their own production of
electricity or heat from RES (e.g. at least 5% of the annual electricity demand) will be
eligible for this.
In the context of tax policy and standards and regulations, a gradual reduction and
abolition of incentives for fossil fuels and thus environmentally harmful incentives
are envisaged. To this end, the impact of the abolition of incentives to various sectors
(including industry) and public finance will be examined. It is also envisaged to
reduce the reimbursement of excise duties on energy products in industry by 2030 (in
accordance with the EU legislation) – the condition for reimbursement from 2022
onwards will be the certificate obtained in accordance with ISO 50.001 or ISO 14.001.
Appropriations of current incentives will be reallocated to introducing effective
green technologies, development of business solutions and creation of new jobs.
Industry will have, and partially already has, a significant role in providing system
services, such as provision of heat in the local environment (the exploitation of waste
heat) and adaptation of electricity production and consumption. To this end,
incentives for efficient district heating systems (the use of waste heat in district
heating systems) and incentives for the integration of RES and local adaptation of
production and consumption are foreseen.
52
The NECP is planning at least a 30% share of RES in industry, taking into account the
use of waste heat, whereby it also envisages 1.3% of the annual increase in the share
of RES in heating and cooling in industry, including waste heat and cold, which is in
line with the requirements of Article 23 of the recast Directive (EU) 2018/2001 on the
promotion of the use of RES.
The establishment of appropriate incentives or economic signals is essential for the
network integration of RES and the local adaptation of production and consumption
and the participation of industrial undertakings in system services. Such incentives
are foreseen in 2021. In addition to the aforementioned, incentives (technical and
personnel support) are also foreseen to promote local energy communities and RES
communities in which the industry may also be involved. In 2021, analysis and
removal of legislative barriers for the development of energy and RES communities,
development of financial instruments and support for the preparation of major joint
projects at locations with greater use of electricity are foreseen. The promotion of
investments in technologies for the conversion of excess electricity generated from
RES and the integration of energy storage networks with transformation is envisaged
in 2022, namely within the framework of the European Regional Development Fund.
Provision of energy suppliers' obligations to achieve final energy savings at end
consumers continues, while the upgrade of the instrument implementation is
foreseen. To this end, it is necessary to continue improving the monitoring of the
implementation of the scheme and ensure the conditions for its stable operation. The
revision of the method for calculating energy savings is also planned in order to
eliminate irregularities which could cause unrealistic high savings and therefore low
price on the market.
Industry is an important consumer of natural gas, since it uses more than 75% of the
total final use of natural gas in Slovenia. To decarbonise gas supply, the NECP
foresees developmental incentives for early implementation of pilot projects for the
following technologies: Power 2 gas, injecting biogas and for the construction of units
for the production of gases of renewable origin in the natural gas network. To this
end, it will be necessary to analyse and enforce the incentive tax and excise duty
policies to promote decarbonisation in gas supply (foreseen in 2021); prepare a
regulatory and supporting environment for the gases of renewable origin (foreseen
in 2022) and set out the target shares of gas from RES in the network by 2030
(foreseen in 2024).
The NECP envisages development support for the introduction of new green
technologies and technological restructuring of enterprises through incentives for a
transition to a climate neutral society. The key will be to increase the volume of funds
and ensure the predictability and continuity of instruments also in the future
financial period.
Financial incentives for demonstration projects will represent a fundamental
framework for promoting innovation in industry. According to the NECP,
demonstration projects in the field of EEU, RES, the solution for the transition to the
53
climate neutral and circular economy and other measures of reducing GHG
emissions in industry will be supported. It is planned to prioritise the promotion of
projects for exploiting waste heat, production and use of low-carbon fuels (synthetic
gas, H2, recycled carbon fuels etc.), production of geothermal electricity, cascading
use of heat and cold, EEU measures, smart networks and communities, measures to
improve material efficiency and exploitation of RES in industry.
Some industrial sectors will also play an important role in the energy exploitation of
waste in accordance with the Waste Management Plan and the Waste Prevention
Programme. In 2020, the NECP envisages the production of more detailed energy
balance of waste in Slovenia and waste energy potential and to carry out at least two
pilot projects of processing waste into synthetic fuel. A review of the classification of
waste from the wood-processing industry and waste from wood-cutting products is
also planned in order to use the waste as energy material and exploit these materials
in Slovenia.
The necessary public financial resources to implement measures are one of the key
conditions for achieving the targets for renewable energy sources and efficient use of
energy in industry. The total scope of the necessary incentives for industry (without
additional funds for research and innovation) is estimated to be around 0.4 billion
euros according to the NECP.
(M-13) PROMOTION OF EFFICIENT ENERGY USE AND RENEWABLE ENERGY
SOURCES IN BUILDINGS IN GENERAL
Sectors affected by the implementation of the measure: other sectors (energy use in
the public sector, service sector and households)
Two important documents were adopted in 2015 for the promotion of energy
efficiency and use of renewable energy resources in buildings: The Action Plan for
Nearly Zero-Energy Buildings Up to 2020 (AN sNES)23 that includes targets in regard
to nearly-zero construction of new buildings, renovation and programmes and
measures for achieving these targets, and the Long-Term Strategy for Promoting
Investments in the Energy Renovation of Buildings (LTSERB)24 by way of which
Slovenia has set a goal to significantly improve the energy efficiency of buildings. In
February 2018, the Amendment to the Long-Term Strategy for Promoting
Investments in the Energy Renovation of Buildings25 was adopted and identified the
fields which are already addressed in the existing LTSERB, but in the course of the
implementation of the strategy it has been found that they need to be more
specifically addressed and upgraded. The areas of quality management, financial
instruments design and the issue of a moderately developed energy contracting
market were exposed as critical.
23 Action Plan for Nearly Zero-Energy Buildings Up to 2020 (AN sNES), Government of the Republic of Slovenia, April 2015 24 Long-Term Strategy for Promoting Investments in the Energy Renovation of Buildings, Government of the Republic of Slovenia, October 2015 25 Amendment to the Long-Term Strategy for Promoting Investments in the Energy Renovation of Buildings, Government of the
Republic of Slovenia, February 2018

54
In May 2015, the Energy Efficiency Action Plan 2014–2020 (AN URE 2020)26 was
adopted in which measures for more efficient use of energy in residential and public
buildings are defined. In accordance with the implementation of the activities in the
interim period, the plan was additionally updated and supplemented with new
measures in 2017. The amended document was adopted in December 2017 and is
valid for the 2017–2020 period (AN URE 2020)27. A renewal of the Rules on Efficient
Use of Energy in Buildings with a Technical Guideline (PURES) is planned for 2020,
together with the accompanying technical guidelines.
In February 2020, the Integrated National Energy and Climate Plan of the Republic of
Slovenia28 was adopted which lays down objectives, policies and measures in the
field of buildings by 2030 (with a view to 2040). At the end of 2019, the Republic of
Slovenia has started to prepare the Long-Term Climate Strategy, which provides the
main guidelines and vision in individual sectors by 2050. The vision of both
documents is approximately net-zero emissions in the buildings sector by 2050 by
maintaining a high level of energy renovations of buildings, by converting the
heating systems to centralised heating systems and RES technologies. The
renovations and new constructions are directed towards achieving almost zero
emissions in their life cycle and other construction and renovation objectives.
Sustainable renovations of buildings will be encouraged, i.e. to renovate a building
from other aspects as well (e.g. earthquakes, fire, radon). The NECP sets the objective
of reducing the use of final energy in buildings by 20% by 2030 compared to 2005
and reducing the emissions by at least 70% in the same period.
One of the supporting documents of the NECP is the Long-Term Strategy for
Supporting the Renovation of Buildings by 2050, where a more detailed timeline
with measures and progress indicators at the national level will be defined, namely
to ensure a long-term reduction in GHG emissions to provide a high energy efficient
and decarbonised national building stock and to contribute to the cost-effective
transformation of existing buildings into almost zero-energy buildings. The timeline
will contain framework milestones for 2030, 2040 and 2050 and explain how these
milestones contribute to the achievement of the Union's energy efficiency targets in
accordance with the Directive 2012/27/EU. The document is expected to be adopted
in the second half of 2020.
In addition to the above-mentioned statutory measures and programme documents
supporting EEU and RES, the following measures are also important for buildings in
general. At least partially, these measures are already being implemented:
taking into account energy efficiency and exploitation of RES in the integrated
planning of buildings, residential quarters and settlements within the scope
of spatial planning;
26 Energy Efficiency Action Plan 2014−2020, Government of the Republic of Slovenia, May 2015 27 Energy Efficiency Action Plan 2017−2020, Government of the Republic of Slovenia, December 2017 28 Integrated National Energy and Climate Plan of the Republic of Slovenia, the Government of the Republic of Slovenia, February 2020

55
mandatory preparation of feasibility study regarding alternative energy
supply systems (decentralised systems on the basis of RES, high-efficiency co-
generation, district or collective heating and cooling, heat pumps) when
constructing a new building and a larger renovation of existing building or its
individual part;
implementation of pilot projects for comprehensive energy renovation of
different building types in the public and residential sector according to the
criteria of nearly zero-energy renovation under the OP ECP (buildings of
central government, cultural heritage buildings, multi-apartment buildings).
In the field of buildings, 2 pilot projects were completed by the end of 2018
within the OP ECP, namely the pilot project of energy renovation of a public
building with characteristics of almost zero-energy building (Energy retrofit
of the Bohinj Centre for School and Outdoor Education) and the pilot project
involving a larger number of buildings or a complex of buildings (Energy
retrofit of a complex of three court facilities in Celje, Slovenj Gradec and
Murska Sobota). In the period 2019–2020, 2 pilot projects are being carried
out, namely the pilot project of integrated energy retrofits with several
operators following the principle of public-private partnerships (JZP) (Šmarje
pri Jelšah) and the pilot project of energy retrofits of five buildings of the
cultural heritage of the Ministry of Culture.;
a support scheme for the renovation of cultural heritage buildings and other
specific building groups, including the preparation of criteria for the
renovation and implementation of pilot projects;
promotion of energy contracting for the implementation of comprehensive
energy-saving renovation projects for public as well as multi-apartment
buildings (details under the measure (M-15));
(M-14) PROMOTION OF EFFICIENT ENERGY USE AND RENEWABLE ENERGY
SOURCES IN HOUSEHOLDS
Sectors affected by the implementation of the measure: other sectors (energy use in
households)
The main measure for promoting energy efficiency and use of renewable energy
sources in households continue to remain financial grants allocated by the Eco Fund
for such investments in one-apartment and two-apartment buildings since 2008, and
since 2009 for multi-apartment buildings. The set of measures funded by grants
differ in regard to the invitation to tender and in regard to the amount of the received
grant. Funds for grants are collected by means of a contribution paid per energy use
in order to increase energy efficiency, and from 2014 onwards, funds from the
Climate Change Fund are also made available by the Eco Fund in said tenders. The
set of calls for EEU and RES measures in households has been extended slightly over
the last period by the Eco Fund, namely with a call to replace old combustion
installations in joint boiler rooms of multi-apartment buildings in 2017, calls for new
joint investments in higher energy efficiency of old multi-apartment buildings or
buildings with three or more individual parts in 2016 and 2019 and a call for almost

56
zero-energy buildings in 2019. In total, EUR 41.3 million of Eco Fund grants in the
2017–2018 period funded investments in households with a value of EUR 216.3
million, which resulted in an annual reduction in final energy consumption by
303GWh, and CO2 emissions by 38kt.
Moreover, favourable Eco Fund loans can also be obtained for the implementation of
the EEU measures and the use of RES, while household measures are also
implemented under the energy efficiency obligation scheme for energy suppliers
(details under the measure (M-8)). Grants for investments in RES are also available
for households under the Rural Development Programme, where funds are drawn
from the European Agricultural Fund for Rural Development (EAFRD).
Implementation of all the mentioned measures will continue in the future. In 2019, 5
calls under the Eco Fund were opened for households, namely for EEU measures and
RES use (74SUB-OB19), for almost zero-emission buildings (73SUB-sNESOB19), for
new joint investments in higher energy efficiency of older buildings with three or
more individual parts (67SUB-OBPO19), for socially disadvantaged citizens for the
replacement of combustion devices on wood biomass with new ones (69SUB-
SOCO19) and for the replacement of old combustion devices in joint boiler rooms of
multi-apartment buildings (48SUB-SKOB17). In total, 28.8 million euros of grants
were provided for within these calls. In 2020, the Eco Fund provides for up to EUR 15
million of grants from contributions to implement EEU and RES measures in
residential buildings, while drawing funds from the Climate Change Fund available
from the previous year29. In addition, some of the sources to increase efficient energy
use in households are also envisaged in the framework of the OP ECP. Within the
scope of the invitation to co-finance the energy retrofits of residential buildings
under the integrated territorial investment (ITI) from 2017, more than EUR 1.5
million of grants were allocated for 8 projects, and approximately EUR 400,000 will
be allocated for the same purpose in 2020. Initially, 11.8 million euros was earmarked
for this measure, and with a change in the ECP OP, the remainder of the funds,
approximately 9.8 million euros, was transferred to the sustainable mobility measure,
also within the scope of implementing ITI. In order to implement measures in 500
households facing the problem of energy poverty, EUR 5 million of funds are
foreseen in the OP ECP. The initial pilot call for the implementation of EEU measures
in 100 households with low income amounting to EUR 1 million will be made in
2020. Within the scope of the OP ECP, the implementation of a pilot project for
integrated energy retrofits of multi-apartment buildings according to the criteria of
nearly zero-energy renovation is also planned. Annual energy savings are projected
to increase by more than 100GWh by 2023 due to the implementation of these
measures.
Other important measures for promoting EEU and RES in residential buildings
which are already being implemented include the energy consulting network for
citizens (ENSVET; see details under measure (M-5)) and a scheme for energy
29 Business and Financial Plan of the Eco Fund for the year 2020, January 2020 (https://www.ekosklad.si/informacije/o-
skladu/poslovni-nacrt/poslovni-in-financni-nacrt-za-leto-2020)

57
renovation projects for vulnerable groups of population. Under this scheme, the Eco
Fund has earmarked EUR 100,000 from the Climate Change Fund for reducing
energy poverty in 2019Napaka! Zaznamek ni definiran., and will start to implement
the already mentioned project within the scope of OP ECP in 2020.
In addition to the NECP and LTSERB, further legislative measures are planned that
should facilitate the implementation of energy renovations in buildings with
multiple owners and/or tenants, and provide for the credit insurance, obtained in the
scope of the reserve fund of a certain multi-apartment building.
(M-15) PROMOTION OF EFFICIENT ENERGY USE AND RENEWABLE ENERGY
SOURCES IN THE PUBLIC SECTOR
Sectors affected by the implementation of the measure: other sectors (energy use in
the public sector)
In the 2017–2018 period, EEU and RES use in the public sector was promoted mostly
by grants for energy renovation of buildings provided from the Cohesion Fund
within the scope of the OP ECP. By the end of 2018, a total of 9 tenders for energy
efficiency improvements in building, in particular those used by municipalities,
buildings of the wider and narrower public sector. In total, almost EUR 113 million
were available within these tenders, while almost EUR 42 million were approved for
69 projects. By the end of 2018, 37 projects were carried out, with which a reduction
in final energy use was achieved by 18GWh, and CO2 emissions by 5.4kt. At the same
time, pilot projects in the field of public buildings are also carried out within the
scope of the OP ECP. By the end of 2018, two projects were completed, which
contributed to a reduction in the final energy use by 0.9GWh, and CO2 emissions by
0.3kt per year, while 2 projects are in progress.
In 2019, new calls for energy retrofits of buildings were published within the OP
ECP. EUR 17.6 million of grants are provided for co-financing energy retrofits of
buildings owned and used by municipalities. EUR 3.7 million was allocated to six
projects. EUR 14.1 million was provided for the energy retrofitting of buildings of the
wider public sector owned by the State, and a total of EUR 1.8 million was allocated
to two projects and EUR 7.6 million for the buildings of the narrower public sector. In
the context of all tenders, private funding may be provided by beneficiaries
themselves or in combination with a private partner in the event of energy
contracting and projects must be completed by the end of September 2021. New
tenders or calls to tender for these purposes will also be published in 2020. In order
to improve the drawing of cohesion funds for the energy renovation of buildings of
the wider and narrower public sector, the call for co-financing of the preparation of
documentation for the renovation from the funds of ELENA technical assistance was
published in 2019. Almost 1.6 million euros of grants were available. A new call will
be published in 2020. The OP ECP envisages that the annual use of primary energy in
58
buildings of the public sector by 2023 is reduced by 113.7GWh due to energy
renovation of 1.27 million m2 of area surface30.
The funds for EEU measures and RES use in the public sector in the 2017–2018 period
were also earmarked by the Eco Fund. In the framework of the public call for tenders
for municipalities for new investments in the construction of almost zero-energy
buildings of general social interest from 2016, EUR 5.6 million was earmarked for 11
investments in the 2017–2018 period. At the end of 2017, the public call for new
investments in RES use and higher energy efficiency of buildings owned by the
public sector was published. In 2018, 15 projects were supported by the EUR 159,000
of grants. In total, projects within the scope of both calls achieved a reduction in
energy use by 2.6 GWh and in CO2 emissions of 0.7 kt annually.
In 2019, two calls of the Eco Fund were opened for the public sector. Within the
scope of the first call, EUR 17 million in the form of grants has been allocated again to
municipalities for constructing almost zero-energy buildings of general social
interest, while the other call is intended for new investments in EEU measures and
RES use, which are also implemented by legal persons in addition to local
communities. EUR 7 million of grants is provided. It is planned that similar
invitations to tender will be also published in 2020, namely EUR 6 million of grants
will be earmarked for constructing almost zero-energy buildings, and EUR 5 million
for EEU measures and RES use including legal persons31. Grants for these calls are
provided from a contribution paid per energy use in order to increase energy
efficiency. Moreover, the public sector can also obtain favourable Eco Fund loans for
the implementation of the EEU measures and the use of RES, while the measures in
this sector are also implemented under the energy efficiency obligation scheme.
In the period up to 2020, the Eco Fund, in the scope of energy efficient obligation
scheme, and ERDF programmes will continue to provide the public sector with
subsidised loans and grants. Increasing energy efficiency in the public sector is also
envisaged within the scope of the OP ECP, specifically, funds intended for energy-
saving renovation of public buildings owned and used by direct and indirect budget
users and local communities, funds for projects regarding energy renovation of
public buildings, which will be implemented within the scope of energy performance
contracting, and the implementation of demonstration projects for integrated energy
renovation of various types of public buildings following the criteria of nearly zero-
energy renovation. As a result of the measures envisaged in the OP ECP and owing
to the renovation of 1.8 million m2 of surface area, the annual energy consumption on
the part of the public sector is expected to reduce by 240GWh by 2023. In order to
achieve this goal, in the 2016–2023 period, the annual volume of investment activities
amounting to EUR from 51 to 53 million will have to be provided for, totalling EUR
415 million of funds for the said period. As a result of an increase of RES in the final
30 OP ECP, 3rd Amendment, 4.1 (https://www.eu-skladi.si/sl/dokumenti/kljucni-dokumenti/programme_2014si16maop001_4_1_sl.pdf) 31 Business and Financial Plan of the Eco Fund for the year 2020, January 2020 (https://www.ekosklad.si/informacije/o-skladu/poslovni-nacrt/poslovni-in-financni-nacrt-za-leto-2020)
59
energy consumption, funds from the OP ECP have been planned to be granted for
wood-biomass-fuelled boilers in the public sector, service sector and industry.
For achieving a greater effect of public funds invested in energy renovation of public
buildings in the period leading to 2030, an important measure will be promoting
energy-performance contracting, ensuring the distribution of risks and a suitable
leverage in the financing of such projects, which is highlighted already in NECP, and
even more by the new LTSERB. The LTSERB promotes the establishment of a
broader supporting environment for the development of energy contracting which,
in the long-term, will ensure a stable and foreseeable flow of projects suitable for
energy contracting – for the broader and narrower public sector. For assuring the
quality of public sector projects, financial support is expected to be made available
for the preparation of investment projects; the Project Office will play an important
role in the preparation and implementation of projects related to the energy
renovation of governmental buildings. In December 2014, the Guidelines for
Implementing Measures Aiming at Energy Efficiency of Public Sector Buildings
Following the Principle of Energy Performance Contracting were published by the
Ministry of Infrastructure32.
In accordance with the EED33, it is mandatory to renovate 3% of total floor surface of
buildings owned and used by the core Government Offices. The potential for energy
renovation at the level of nearly-zero energy building in case of public buildings was
assessed to 6.857 million m2 in 2015, representing 66% of total surface area of public
buildings.
Two important measures for reducing energy consumption in the public sector are
energy management and green public procurement. The energy management system
in public buildings is defined by Article 324 of the EZ-1; a decree where the
Government defines who has to setup energy management system and minimal
content of it was adopted in 201634. The energy management system is obligatory for
buildings with a useful floor area of more than 250m2, which is used by the
Government, self-governing local communities or government bodies founded by
the Republic of Slovenia or the local community. The decree also lays down
minimum requirements regarding the energy efficiency of buildings that were newly
acquired by purchasing or hiring by the Government administration. In the 2017–
2018 period, the Ministry of Infrastructure established a system of energy accounting
for public sector buildings, where energy suppliers send reports by the end of March
for the previous year. The field of green public procurement is governed by the
Decree on Green Public Procurement35, which was revised in 2017. The green public
procurement is mandatory for 20 subject-matters of public procurement, e.g.
electricity, heating installations, lighting equipment, road design and construction,
etc. The Decree does not set out environmental requirements but determines the
32
Guidelines for Implementing Measures Aiming at Energy Efficiency of Public Sector Buildings Following the Principle of
Energy Performance Contracting, Ministry of Infrastructure, December 2013. 33 EU Directive on Energy Efficiency (2012/27/EU) 34 Decree on energy management in the public sector (Official Gazette of the Republic of Slovenia, No. 52/16) 35 Decree on green procurement: Official Gazette of the Republic of Slovenia No. 51/17, 64/19
60
environmental aspects that must be taken into account when awarding public
contracts and objectives to be achieved in each public procurement procedure for
certain subject-matters.
4.6 Use of energy in transport
(M-16) PROMOTION OF PUBLIC PASSENGER TRANSPORT
Sectors affected by the implementation of the measure: transport
Policies and measures for the promotion of public passenger transport are included
in the following documents: Strategy36, Programme for the Development of
Transport in the Republic of Slovenia37 and NECP.
Public passenger transport (PPT) in Slovenia is governed by the Road Transport Act38
and Railway Transport Act39. In 2019, there were amendments introduced to the
Road Transport Act governing the conditions for introducing a single ticket, free
transport for students with disabilities, the inclusion of categorised athletes to the
subsidised ticket system, the determination of dedicated funds for single ticket and
an extension of the existing system of concessions for the implementation of public
passenger transport. Slovenia provides the basic needs for connectivity and the
mobility of the population in its territory through an economic public service for
regular public transport. The State provides financial compensation for providers if
the costs of transport are not covered by the sale of tickets. At the same time, the
State provides subsidies for pupils and students.
The Ministry responsible for transport has introduced an electronic single ticket
under the Integrated Public Passenger Transport project (IJPP). The electronic single
ticket enables the use of one electronic card for different modes of public transport
and different carriers throughout Slovenia. Important for combining these services
was the coordination of timetables between different carriers and modes of transport.
The system was introduced in 2016 for pupils and students, and extended to all users
in 2019, namely by introducing monthly anonymous single tickets and daily and
weekly single tickets. In 2020, the introduction of a personal monthly single ticket is
also planned, which will be more affordable. In 2019, the new fast lines between large
cities in the country were introduced. The establishment of a public passenger
transport system operator is envisaged to take care of the coordinated development
of the PPT. A website or mobile app is also foreseen which will enable the purchase
and validation of tickets, as well as obtaining information on PPT in one place, as
well as other possible modes of transport.
36 Transport Development Strategy of the Republic of Slovenia by 2030 37 Resolution on the National Programme for the Development of Transport of the Republic of Slovenia until 2030 (ReNPRP30) 38
Official Gazette of the Republic of Slovenia, Nos. 131/06, 5/07 – correction, 123/08, 28/10, 49/11, 40/12 – ZUJF, 57/12,
39/13, 92/15, 6/16, 67/19 39
Railway Transport Act (Official Gazette of the Republic of Slovenia, Nos. 92/1999, 11/2001, 33/2001, 110/2002, 56/2003,
86/2004, 29/2005, 15/2007, 58/2009, 106/2010, 63/2013, 84/2015, 99/2015– official consolidated text)
61
Within the framework of the Operational Programme for the Implementation of the
European Cohesion Policy for the period 2014–2020 (OP-ECP), the funds were
earmarked for the construction of the park and ride parking lots at the personal
vehicle-public transport transfer points. In 2019 and 2020, the funds will be
earmarked for improving the PPT infrastructure, and additional funds will be
awarded through the Integrated Territorial Investments mechanism (ITI). To
encourage municipalities in establishing an effective public passenger transport
system and promote its use, calls will be aimed to arrange infrastructure covering
renovation, upgrade and new construction in the field of railway and bus systems
and multimodal passenger nodes involving the integration of micro-mobility. The
NECP provides further incentives for the introduction of new public passenger
transport services, modernisation of concepts and urban passenger transport
schemes, and also foresees drawing up a strategy for the development of public
passenger transport.
Improvement of public passenger transport will also be influenced by the measure of
improving public railway infrastructure, for which EUR 153 million is available
within the OP ECP programme, in particular by reducing the travel time. In 2019, a
study of regional railway lines was introduced laying down measures to improve rail
passenger transport. Among its measures, the NECP envisages upgrading regional
lines for passenger transport, development of stations, introducing a digital platform
to link all possibilities of public transport, and fleet renewal. A major step in the fleet
renewal will be made in 2020 and 2021 when 54 new passenger carriages will be put
into operation.
Within the ministry responsible for transport, a directorate for sustainable mobility
and transport policy was established with the aim of carrying out professional and
administrative tasks in the field of public passenger transport, sustainable mobility
and transport policy.
The Ministry prepares a new sustainable mobility act to also regulate the area of
public passenger transport, namely from the perspective of PPT management and
planning, integration with other modes of sustainable mobility, a stable source of
financing measures to promote PPT, the harmonisation of timetables, defining
standards of PPT accessibility, arrangement of PPT lines, legalisation of yellow lanes.
(M-17) SUSTAINABLE FREIGHT TRANSPORT
Sectors affected by the implementation of the measure: transport
In regard to sustainable freight transport, the emphasis is placed on co-modality, for
which the construction and modernisation of the existing transport infrastructure
(especially, the railway) is of essential importance. The measure is additionally
supported by the Transport Development Strategy and Programme for the
Development of Transport in the Republic of Slovenia and also in the NECP. The
strategy has the following objectives: to establish efficient railway transport (the
electrification of the whole Slovenian railway network, modernisation, upgrades and
newly-built facilities for higher speeds and load capacities) and efficient road freight
62
transport (the introduction of electronic tolling for cargo vehicles, the introduction of
IT for higher capacity utilisation of existing roads). The following measures for
shifting transit cargo from the roads to the railways were accepted by the Transport
Development Strategy in the RS: the inclusion of external costs into tolls and other
taxes for freight transport, the promotion of the use of intermodal transport units, the
modernisation of intermodal terminals, the modernisation of the railway network
and elimination of bottlenecks.
The following priority activities on railway infrastructure were included in the
Programme for the Development of Transport:
Elimination of bottlenecks in all railway subsystems. Priority is given to the
provision of TEN-T standards in the Slovenian corridor network.
Implementation of the key upgrade projects on the railway network (upgrade
of the Maribor–Šentilj line, Zidani Most–Celje line, Pragersko railway node,
etc.).
Additional track construction (Divača–Koper).
Introduction of the ETCS/ERTMS system, system of railway network voltage,
electrification of regional lines, optimisation of the structure of the railway
system, etc.
Providing documentation for medium-term solutions to relieve the burden on
the Ljubljana railway node
The most recent 6-year plan of investment in transport and infrastructure as an
implementing document of the programme envisages additional activities in the field
of railway infrastructure in relation to the transport development programme,
particularly in the area of regional lines, urban nodes and upgrading stations. In the
2020–2025 period, an estimate of EUR 1,669 million is foreseen to be spent in the
railway infrastructure.
The NECP also contains the measure to improve railway infrastructure and the
measure to improve road freight transport (increase the load capacity of goods
vehicles, provision of road infrastructure standards, use of e-tolling system as a tool
for transport management), and other measures promoting co-modality (inclusion of
external costs into tolls and other taxes, modernisation and development of
intermodal transport units, studying and introduction of tolling policy with a view to
redirect transport flows to railway).
Foreseen measures on railways by 2030 will allow railway freight and passenger
transport to almost double.
Slovenia is highly exposed to transit transport due to its position at the crossroads
between the V. and X. European corridor which, for the main part, represents a
section of the TEN-T core network and corridors of the core network. Since Slovenia
is also small, with an attractive price offer for oil derivatives in Slovenia as compared
to neighbouring countries, the increase in transit transport has a significant impact
on the sale of liquid motor fuels in the country and, thus, on GHG emissions. A long-
term solution to the problem is possible only by redirecting goods transport from the

63
roads to the railways; however, a precondition for this is a modern and reliable
railway, the construction of which has commenced. In 2008, when energy use in
transport reached its peak, the portion of fuels sold to transit transport amounted to
30% of the total volume of fuels sold in the country. This was followed by a decrease
in the portion due to economic crisis and changes in price ratios. In recent years, the
share is around one quarter.
(M-18) PROMOTION OF INCREASE IN VEHICLE EFFICIENCY, ENERGY-EFFICIENT
DRIVING, HIGHER VEHICLE OCCUPANCY AND PROMOTION OF THE USE OF
FUELS WITH LOW CO2 EMISSIONS
Sectors affected by the implementation of the measure: transport
INCREASE IN THE EFFICIENCY OF VEHICLES
The measure is based on three pillars:
the obligation of the automotive industry to reduce CO2 emissions per
kilometre for new vehicles,
awareness raising regarding fuel consumption and vehicle emissions and
promotion of the fuel consumption efficiency of vehicles through tax
measures.
In 2009, the European Commission adopted the first binding targets for average CO2
emission for new cars. Pursuant to the Regulation 443/200940, emissions should not
exceed 95g/km after 2021. Pursuant to the Regulation 2019/631, CO2 emission of new
cars must be reduced by 15% by 2025, and by 37.5% by 2030 compared to 2021. This
Regulation also introduces targets for light goods vehicles, namely reducing their
emissions by 15% by 2025 and by 31% by 2030 compared to 2020. By 2020, the targets
for light goods vehicles have been set out in the Regulation 510/2011. The target of
147 gCO2/km applies for 2020. In 2018, average emissions from new passenger
vehicles in Slovenia amounted to 120g CO2/km. Due to a large difference between
factory data regarding emissions and fuel consumption and real life values, a new
measurement standard has been introduced, i.e. WLTP. The new standard entered
into force in September 2018 for all newly registered vehicles. From 2021, the
European Commission will collect data on actual emissions and compare them to
measurements in laboratories.
For heavy goods vehicles, the EU also adopted targets for CO2 emissions in
Regulation 2019/242 in 2019. The target for 2025 is to reduce emissions by 15%
relative to the reference emissions in the period 1 July 2019 - 1 June 2020, and by 30%
in 2030. Pursuant to the regulation, the targets currently apply for large lorries, while
in 2022 the Commission will propose, along with the assessment of the measure, the
extension to other heavy goods vehicles, including buses.
40 Regulation (EC) No. 443/2009 setting emission performance standards for new passenger cars as part of the Community's integrated approach to reduce CO2 emissions from light-duty vehicles.

64
Informing and awareness raising is mostly carried out through labelling the fuel
consumption of passenger vehicles. Slovenia transposed Directive 1999/94/EC41
relating to the availability of consumer information on efficient fuel consumption
and CO2 emissions into the Slovenian legal order through the Decree on consumer
information on fuel economy and CO2 emissions of ambient air pollutants in respect
of new passenger cars (Official Gazette of the Republic of Slovenia, No. 24/2011),
which replaced the applicable decree from 2010. In accordance with the Decree, the
suppliers of passenger vehicles must provide data on fuel consumption and vehicle
emissions at the point of sale and in promotional leaflets. In addition to the above-
mentioned, they must also prepare a manual on efficient fuel consumption and CO2
emissions.
The Decree on Green Public Procurement (Official Gazette of the Republic of
Slovenia, No. 51/2017/64/2019) transposed the provisions of Directive 2009/33/EC on
the promotion of clean and energy-efficient road transport vehicles into the
Slovenian legal order. According to the Decree, in public procurements, the costs of
CO2 emissions will be taken into account in the mandatory vehicle life-cycle cost
estimate. As a recommendation, the Decree lays down the minimal EURO emission
standards. The Decree also defines environmental criteria for public procurement of
tyres.
The third pillar concerns tax measures. In 2010, the Act Amending the Motor
Vehicles Tax Act (Official Gazette of the Republic of Slovenia, No. 9/2010) was put
into effect, and it introduced progressive tax rates for motor vehicles linked to CO2
emissions42,43. The proposal of a new Act has been submitted to public discussion, but
so far a progressive taxation is too mild. The annual duty for the use of road vehicles
is determined by the vehicle’s engine capacity, whereby electric vehicles are
exempted from duty. The NECP envisages a change in the Motor Vehicles Tax Act to
include more progressive taxation with regard to CO2 emissions, as well as to
introduce progressivity according to CO2 in the annual road use charges.
PROMOTION OF ENERGY-EFFICIENT DRIVING AND HIGHER VEHICLE OCCUPANCY
RATE
Training of drivers and managers of the vehicle fleet is carried out in accordance
with Directive 2003/59/EC (driver training) and Regulation 1071/2009/EC (education
of transport managers), including in terms of energy-efficient driving and logistics,
by authorised transport operators.
Tips for energy efficient driving are already included in driving lessons. The NECP
envisages the development of new innovative approaches to promote energy
efficient driving: new mobile apps monitoring efficiency, examination of the
41 DIRECTIVE 1999/94/EC OF THE EUROPEAN PARLIAMENT AND OF THE COUNCIL of 13 December 1999 relating to the availability of consumer information on fuel economy and CO2 emissions in respect of the marketing of new passenger cars. 42 After the adoption of the Act, new tax rates entered into force, except for passenger motor vehicles with CO2 emissions between 150 and 210 grams per kilometre, for which a transitional period was valid until 1/1/2011. Additional taxation has also been imposed on diesel vehicles with a particulate matter emissions of more than 0.005g/km and motor vehicles with a lower emission rate than Euro 4 and, since 1/1/2010, lower than Euro 5. 43 Taxation applies to vehicles designed primarily for the transport of people (up to 10 people).
65
possibilities for lowering the permitted speed on motorways, and incentives for
insurance or deletion of penalty points.
In comprehensive transport strategies, municipalities have also identified measures
to encourage greater occupancy of passenger cars. In bigger cities, commuters
represent a major problem, since most of them use their own car to drive to work.
The following measures were identified: management of the parking policy in order
to reduce car traffic in the cities, introducing new car mobile services for optimisation
of the passenger transport (“carsharing”, “carpooling”), and introducing entry fees
for cities. These measures are also stated in the NECP in addition to providing
system support for car-pooling. The measures in this field should also be included in
the new Sustainable Mobility Act.
PROMOTION OF FUELS WITH LOW CO2 EMISSIONS
In 2017, the Government of the Republic of Slovenia adopted a strategy regarding
market development for the establishment of adequate infrastructure related to
alternative fuels in the country’s transport sector. The strategy proposes groups of
measures for each alternative fuel (electricity, liquefied petroleum gas, liquefied
natural gas, compressed natural gas, biofuels and hydrogen). Measures are
envisaged to provide the appropriate charging infrastructure for electric vehicles,
and compressed or liquefied natural gas vehicles. The measures will be implemented
in various areas: in the field of financial incentives and co-financing the construction
of adequate infrastructure for alternative fuels, changes in regulations, promotion of
innovative solutions and elimination of administrative barriers. One of the key
measures will be financial incentives for purchasing electric and plug-in hybrid
vehicles, exemptions from certain charges for electric vehicles, free parking and other
similar measures.
The purchase of electric or hybrid vehicles is facilitated by the Eco Fund, which is a
public fund offering favourable loans to legal entities, sole proprietors and citizens,
and by providing subsidies for buying a vehicle. In 2020, the Eco Fund reduced the
amount of the subsidy from EUR 7,500 for the battery electric vehicle (BEV) to EUR
6,000, while the subsidy for a light goods vehicle is EUR 4,500. Subsidies are also
available for vehicles of L category. The NECP foresees that subsidies will gradually
decrease until 2025, when they are supposed to be abolished. In addition, the NECP
envisages to introduce higher subsidies if an old car is deregistered. In 2020, EUR 3
million of assets are available for subsidies to citizens.
The Eco Fund also encourages the purchase of buses that run on alternative fuels. In
2019, the Eco Fund opened a tender on grants for the purchase of electric and hybrid
buses and buses on compressed or liquefied natural gas from the budget of the
Climate Change Fund.
The Eco Fund also opens a tender for the purchase of new public works vehicles that
run on electricity or use a combination of diesel and electricity (plug-in hybrid) and
liquefied or compressed natural gas.

66
In addition, the Eco Fund also encourages the establishment of charging stations for
electric vehicles in protected nature areas and Natura 2000 areas. The co-financing of
smart charging stations is also envisaged as part of the OP ECP.
The Decree on green public procurement also defines the criteria used in public
procurement for the purchase of buses and hiring bus transport services. In
accordance with Directive 2009/33/EC, the vehicle life-cycle cost estimate must take
into account the costs of the emissions of carbon dioxide, nitrogen oxides, non-
methane hydrocarbons and solid particles.
In Slovenia, the Decree on renewable energy sources in transport (Official Gazette of
the Republic of Slovenia, No. 64/16) has been in force since 2016. The Decree defines
the obligations of fuel suppliers who have to achieve an energy share of renewable
energy in a calendar year – at least 6.2% in 2017, at least 7.0% in 2018, minimum 8.4%
in 2019, and a minimum of 10.0% in 2020. A portion of renewable energy sources is
obtained by the energy supplier through the sale of biofuels compatible with criteria
of sustainability, electricity from renewable energy sources, hydrogen from
renewable energy sources and a combination of these fuels. The Decree, in
accordance with the EU Directive 2015/1513, limits the maximum contribution of
biofuels, which are produced from cereals and other field crops with a high content
of starch, plants for the production of sugar, oilseeds and crops, which are grown on
agricultural land as main crops specifically for energy purposes, in 2020 to 7% of
final transport energy consumption in the country. The NECP sets an objective for
biofuels in transport for 2030 at 11%44, whereby the share of advanced biofuels must
be increased in accordance with the EU Directive 2018/2001. The target share of RES
in transport equals 21% according to the NECP. In 2018, the share of RES in transport
was 5.5% in Slovenia.
(M-19) PROMOTION OF NON-MOTORISED MODES OF TRANSPORT
Sectors affected by the implementation of the measure: transport
The Programme for the Development of Transport envisages measures for
promotion of greater inter-modality, where cycling is considered an important
means of mobility (bike & ride), and an improvement of the cycling network is
foreseen (establishment of the national cycling network and local cycling networks.
Its priority is to connect the already constructed bicycle sections to larger sections.)
Technical designs for implementing the national cycle connections have been
implemented within the framework of the budgetary funds allocated by the Republic
of Slovenia to the Slovenian Infrastructure Agency . Incentives for the arrangement
of cycling infrastructure (stands and canopies for bicycles, cycling routes, etc.) are
planned from the European Cohesion Policy funds in the 2014–2020 period through
calls for sustainable mobility measures (2017-2020), the CTN mechanism (2017–2023)
and agreement for the development of regions (2017–2023). Since 2018, funds for
cycling infrastructure are also earmarked from the Climate Change Fund. Measures
44 The share of biofuels in the consumption of liquid fuels in road and railway transport without LPG

67
that encourage cycling have also been defined in comprehensive transport strategies
that are a condition to receive grants. The Ministry of Infrastructure, Slovenian
Infrastructure Agency and Company for the Development of Infrastructure are
implementing a project for marking the cycling network based on the Rules on
bicycle connections adopted in 2018 (Official Gazette of the Republic of Slovenia, No.
29/18).
The NECP envisages further promotion of the construction of the cycling
infrastructure and preparation of a national cycling strategy.
In 2011, the bicycle rental system called BicikeLJ was introduced in Ljubljana, the
capital of Slovenia. At the end of 2019, the system provided 790 bicycles to be rented
from 79 bicycle stations. On average, every bicycle in the BicikeLJ system was used 8
times in one day. Smaller bicycle rental systems also operate in towns such as
Velenje, Šoštanj, Ravne na Koroškem, Jesenice, Kranj, Piran, Murska Sobota and Ptuj.
The Programme for the Development of Transport also promotes walking; a national
strategy for promotion of walking and pedestrian standards will also be developed.
Within the scope of public tenders for the award of funds, the funds are also
intended for pedestrians, namely for sidewalks, footpaths, joint traffic area, mixed
paths for pedestrians and cyclists, footbridges, elevators. Funds are available within
the scope of the OP ECP, CTN and also the Climate Change Fund. The NECP
envisages the implementation of this measure in the future financial period.
(M-20) DEVELOPING INTEGRATED TRANSPORT STRATEGIES IN MUNICIPALITIES
Sectors affected by the implementation of the measure: transport
An Integrated Transport Strategy (ITS) is a strategic document, in which the
municipality develops effective sequence of transport actions that, during its
implementation, help to achieve comprehensive changes in mobility and
consequently a higher quality of life.
For drawing up integrated transport strategies, resources were available within the
framework of the OP ECP and also through the Eco Fund. In 2017 and 2018, 80
municipalities drafted the respective strategies.
A platform for sustainable mobility has been established, which is the support
service to the Slovenian municipalities, regions and institutions for disseminating
content/information/publications for an integrated transport planning, cycling,
walking, P + R hubs, etc.
Further activities in the field of transport planning in municipalities take place within
the framework of the LIFE IP Care4Climate project, under which the platform for
sustainable mobility will be upgraded, and the guidelines for the preparation of
integrated transport strategies will be reviewed and potential sources for financing

68
the ITS measures will also be examined. Municipalities must have an adopted ITS to
receive State or EU funds for other measures of sustainable mobility.
The Sustainable Mobility Act is being prepared and will also cover the field of
planning and drawing up strategies of sustainable mobility (e.g. ITS). The respective
act could prescribe a mandatory ITS preparation for large
cities/municipalities/regions and incentives for small municipalities, the obligation to
implement long-term sustainable urban mobility measures for municipalities, a
commitment to regional transport planning (regional ITS) and inter-municipal
cooperation in preparing strategies and measures.
4.7 Industrial Processes
(M-21) REDUCTION IN THE EMISSIONS OF F-GASES FROM STATIONARY
EQUIPMENT
Sectors affected by the implementation of the measure: industrial processes
The implementation of the provisions of the Regulation (EU) No. 517/2014 relating to
fluorinated greenhouse gases from 2014 affects the reduction of F-gases emissions
from the stationary equipment. The Regulation’s impact will mainly be achieved
through limiting the placement of F-gas onto the EU market by means of a quantity
cap and by limiting the use of F-gases with high greenhouse potential. The
Regulation and implementing regulations also regulate the handling the devices
containing F-gases for reducing leakage and safe handling of F-gases.
In Slovenia, the implementation is regulated by way of the Decree on the use of
fluorinated greenhouse gases and ozone-depleting substances (Official Gazette of the
Republic of Slovenia, No. 60/2016).
Implementation of this measure will contribute to substantially lower emissions.
(M-22) REDUCTION IN EMISSIONS OF F-GASES FROM MOBILE AIR-
CONDITIONING SYSTEMS
Sectors affected by the implementation of the measure: industrial processes
Directive 2006/40/EC of the European Parliament and of the Council relating to
emissions from air-conditioning systems in motor vehicles and amending Council
Directive 70/156/EEC (OJ L No. 161 of 14/6/2006) was transposed into the Slovenian
legal order by the technical specification TSV – 161 (issue 01) on air-conditioning
systems in motor vehicles regulating the area of emissions from air-conditioning
systems in vehicles of category M1 and N1 (passenger motor vehicles and goods
vehicles up to a total mass of 3.5 t). The Directive was implemented in three phases.
The last phase entered into force on 1 January 2017, by prohibiting the registration of
all vehicles with a built-in air conditioning system containing fluorinated greenhouse
gases with a global warming potential above 150.

69
4.8 Agriculture In January 2020, the Resolution on the National Programme on Strategic Orientations
for the Development of Slovenian Agriculture and Food Industry “Our Food, Rural
and Natural Resources 2021” (ReNPURSK) was adopted by the National Assembly
of the Republic of Slovenia. Four harmonised fields in terms of content include the
Sustainable and competitive production and processing of food and Sustainable
management of natural resources and the provision of public goods. Within the
framework of the field Sustainable and competitive production and processing of
food, priority topics are determined that provide food safety and production of safe,
quality and affordable food. Sustainable management of natural resources and the
provision of public goods also includes prioritising the mitigation of climate change
and respective adaptation. Achieving two important objectives of the resolution,
namely ensuring food safety and reducing greenhouse gas emissions, can only be
achieved by reducing emissions per unit of produced food. Other environmental and
socio-economic objectives must also be taken into account. In order to achieve the
objectives of the resolution, an effective transfer of knowledge into practice and
quicker implementation of modern farming processes with low greenhouse gas
emissions are important. The "Our Food, Rural and Natural Resources 2021"
resolution recognised a weakness in the agricultural system of knowledge and
innovation. In order to improve the situation, a horizontal objective called
Strengthening of knowledge building and transport was formed.
(M-23) INCREASE IN THE EFFICIENCY OF DOMESTIC ANIMAL PRODUCTION
Sectors affected by the implementation of the measure: agriculture
An improvement in the efficiency of animal production can significantly contribute
to a reduction in the amount of methane and nitrogen released per unit of milk and
meat produced. Since methane and nitrous oxide emissions represent a loss of
energy and nitrogen, animal producers have a direct economic interest in the
reduction of emissions. There is still quite a large area for improvement in this sector,
and these possibilities can only be used by training producers about the ways of
improving the efficiency of animal production. Due to the specific structure of
Slovenian agriculture (high number of small farms), this is a special challenge for
agricultural policy. The agricultural policy contributes to the reduction of emissions
in this regard through measures provided for by the Rural Development Programme
(mostly through investments in physical assets), by financing breeding programmes
for breeds of cattle and small ruminants, by financing public advisory services for
farmers in regard to forage production, animal nutrition and general cattle
production. The maintenance of the existing “Govedo” (Cattle) Information System is
ensured within the scope of breeding programmes; said system provides support to
dairy cow breeders in making decisions that lead to a reduction in GHG emissions,
and it provides information on emissions status at their farms.
70
(M-24) PROMOTING BREEDING METHODS WITH LOW EMISSIONS
Sectors affected by the implementation of the measure: agriculture
Greenhouse gas emissions can be reduced through breeding methods. This includes
mainly pasture grazing of grass-feeding animals and the production of biogas from
livestock manure. Both breeding methods reduce emissions from the storage of
livestock manure.
By cattle pasture grazing, emissions of methane generated by the storage of livestock
manure are avoided. Pasture grazing also contributes to a reduction in emissions due
to the use of fossil gases in the harvesting and transport of foodstuffs for animals in
indoor animal production. Due to the dispersion of agricultural plots of land, due to
traditional siting of farms in closely-settled villages and due to the indoor housing
tradition, animal grazing is very rarely used in Slovenia. The Ministry of Agriculture,
Forestry and Food has contributed to an increase in grazing management by
financing the public agricultural advisory service. The Ministry also encourages use
of pasture grazing through the Animal Welfare Programme of the Rural
Development Programme, which, with financial assistance, encourages farmers to
exceed the standard farming methods, including grazing. In the framework of the
Agri-Environment-Climate Payment (AECP) the “Planina paša” project is being
carried out, which directly stimulates above-standard forms of summer pasture on
the mountains. In terms of reducing GHG emissions, it is also important to
adequately address the problem of spreading large carnivores to areas that are
suitable for grazing, and in the framework of the AECP, the operation of “Taking
care of domestic animals” in the area of large carnivores is also being implemented.
The goals of increasing the proportion of grazing animals at the expense of reducing
animals in farmland are very ambitious. With the proposal of the first amendment to
the Rural Development Programme 2014–2020, the Ministry of Agriculture, Forestry
and Food decided to promote pasture of cattle and sheep through the entire pasture
season as part of the “Dobrobit živali” measure (Animal Welfare).
By producing biogas from livestock manure, we avoid emissions of methane from
the storage of livestock manure and reduce ammonia emissions and thereby indirect
emissions of nitrous oxide. Within the framework of the Investments in Physical
Assets of the Rural Development Programme, it is possible to co-fund the
construction of biogas plants, but the option has not been exploited so far.
(M-25) RATIONAL FERTILISATION OF AGRICULTURAL PLANTS WITH NITROGEN
Sectors affected by the implementation of the measure: agriculture
Efforts in this area are directed into more efficient use of mineral and livestock
manure. In this manner, with reduced use of nitrogen, the quantity of agricultural
production is maintained or even increased, and the direct nitrous oxide emissions
from agricultural land and indirect nitrous oxide emissions are reduced. The
agricultural policy contributes to reducing emissions in this area through measures
provided by the Rural Development Programme (Investments in Physical Assets,
71
Agri-Environment-Climate Payments (AECP), Organic Farming etc.) and through
financing public advisory services for farmers. All farms entering the AECP must
have a programme of activities, which includes record-keeping on the use of mineral
and livestock manure. If mineral fertilisers are used, they must make fertilisation
plans based on soil analyses. In addition to general conditions, specific requirements
which are implemented within the scope of individual AECP operations contribute
to the more efficient use of fertilisers. These are requirements about crop rotation,
fertilisation based on analysis of mineral nitrogen in the soil, low-emission
fertilisation, greening of arable land and other similar requirements.
Climate change mitigation and adaptation to climate change represents a significant
horizontal objective of the Rural Development Programme (RDP 2014–2020), as the
process of adaptation to climate change and mitigation of these associated with
structural changes in rural areas and agriculture, precisely because of this reason this
content (in addition to already mentioned measures) are also involved in measure
Sodelovanje (in English Cooperation).
4.9 Waste
(M-26) REDUCTION OF LANDFILLED BIODEGRADABLE WASTE
Sectors affected by the implementation of the measure: waste management
The quantity of biodegradable waste in Slovenia was almost zero in 2017.
In 2018, the European Commission adopted a new legislative package in the field of
waste, which contains five directives. The package also includes amended legislative
proposals on waste with ambitious targets: the EU's common goal in the field of
recycled municipal waste by 2025 is 55%, 60% by 2030 and 65% by 2035, and a
binding target of reducing the amount of waste that ends up at landfills to a
maximum of 10% of municipal waste by 2035. The EU has also taken important steps
in the introduction of the circular economy. According to the action plan in 2015, a
new strategy for plastic within the circular economy was adopted in 2018, and, in
2019, the Directive 2019/904 on the reduction of the impact of certain plastic products
on the environment, which sets the targets regarding recycling bottles (30% by 2030)
and 25% by 2025 for PET bottles. It also lays down the objective that 90% of bottles
should be collected separately up to 2029. The biodegradable waste collection will be
mandatory from 2025.
The main measures, which in the past contributed to reducing the quantities of
landfilled biodegradable waste, are waste separation at source and mechanical
biological treatment of mixed municipal waste. The share of separately collected
waste increased from 18% to 69% in 2009–2015 period. In most municipalities, door-
to-door collection systems are used for waste packaging, bio-waste, and in some
cases also for paper. However, the differences in the share of separately collected
waste between municipalities are large; that is why the aim here would be to transfer
the good practices of municipalities with good results to less successful
72
municipalities. The separate collection of biodegradable waste has been compulsory
since July 2011. Since 2016, the mechanical biological treatment of mixed municipal
waste prior to disposal in municipal waste management centres has been mandatory.
That is why facilities for mechanical and biological treatment of mixed municipal
waste in Slovenia had to be upgraded in order to meet the country’s needs.
In 2016, Slovenia adopted the Waste Management Plan as well as the Waste
Prevention Programme, which serve as a basis for achieving ambitious EU objectives.
In addition to the separate collection of waste and the mechanical biological
treatment of mixed waste, the following measures of the waste management
programme will contribute to minimum quantities of deposited biodegradable
waste:
raising taxes on disposing of waste on landfills and other changes to the
environmental tax for the final establishment of the waste hierarchy
(prevention, preparation for reuse, recycling, other recovery operations, waste
disposal);
improving the collection and management system for waste packaging by
promoting packaging reuse systems;
introduction of payment for a public service according to the “Pay as you
throw” principle in order to encourage users to reduce waste generation;
harmonisation of the prescribed limit values for compost used in agriculture,
with limit values in other EU countries in order to promote the use of
compost for agricultural purposes.
(M-27) WASTE PREVENTION
Sectors affected by the implementation of the measure: waste management
The Waste Prevention Programme, adopted in 2016, addresses eight content sets,
namely, waste prevention in enterprises, households and the public sector, and the
following waste streams: construction waste, light plastic waste bags, bulk waste,
food waste, textile and clothing waste. The main objective of the programme is to
reduce the volume of waste and to minimise its negative effect on the environment.
By reducing the need to produce new materials and products, the measure indirectly
influences the reduction of GHG emissions. Special instruments were prepared for
each set. The programme includes 34 instruments. The instruments that appear for
most of the content sets, are awareness-raising, information and educational
activities, while other instruments include: green public procurement, recording of
generated waste in the public sector, increasing the number of companies involved in
environmental management systems, launching identification and implementation
programmes for potential waste prevention in companies, introduction of techniques
and technologies that extend the life of buildings, etc.
(M-28) COLLECTION OF LANDFILL GAS
Sectors affected by the implementation of the measure: waste management

73
All landfill operators were obliged to build landfill gas capture facilities by the end of
2005. In 2017, 4.0kt of methane was captured, which is 21% of the methane generated
by landfills. Landfill gas is mostly used for generation of electricity.
(M-29) IMPROVEMENT OF WASTE WATER MANAGEMENT
Sectors affected by the implementation of the measure: waste management
The Directive 91/271/EEC concerning urban waste-water treatment binds Slovenia to
arrange the urban waste-water management. For this purpose, the Republic of
Slovenia is adopting the Operational programme for the discharge and treatment of
urban waste water (hereinafter: Operational Programme), which is in the final stage
of adoption and it is foreseen to enter into force in 2020. The Operational Programme
is one of the key implementing acts for achieving targets of water protection against
pollution through discharge of the urban waste water. The Operational Programme
lays down measures to comply with the fitting requirements and to improve the
level of infrastructure equipment for the discharge and treatment of urban waste
water. The main objective of the measures set out in the Operational Programme is
the gradual reduction in methane emissions from urban waste water. The
programme envisages various measures to achieve the necessary objectives, namely:
Gradual increase in the population's connection to well-operated public
sewage systems.
Due to the expansion of the public sewage system, the number of septic tank
systems that have a significant impact on methane emissions and surface and
underground water pollution is reduced.
The extension and improvement of the public sewage system helps to
eliminate poorly managed sewage systems; the greatest emphasis in the
concrete measure is on the last element of the sewage system, i.e. the urban
waste water treatment plant. The measure provides for improvements and
upgrading of wastewater treatment plants.
In the 2018–2028 period (period of the Operational Programme), the above-
mentioned measures could increase the number of connections to well-operated
public sewage systems from 61% in 2017 to 100% by 2028. At the same time, the share
of septic tanks will gradually decrease from ~33% (2017) towards 0% (by 2028). Septic
tanks that will "drop off" from the measures due to unjustified investment will be
dealt with by an individual small urban wastewater treatment plant (complying with
the regulation and therefore qualifying as well-managed systems). The final aim of
the measures is that the majority of urban wastewater is collected and properly
processed in urban wastewater treatment plants, where all methane emissions
generated in the treatment of urban waste water is captured and then used in co-
generation plants for the production of electricity and heat or flared.

74
4.10 Forestry
(M-30) SUSTAINABLE FOREST MANAGEMENT AND CO2 EMISSIONS SINKS
Sectors affected by the implementation of the measure: sinks/forestry
Slovenia is pursuing an active policy in the area of sustainable forest management
according to the principles of sustainability, environmental friendliness and
multi-functionality. Forests provide sinks of carbon dioxide emissions and also
other important ecosystem services. The accumulation of wood stock in the past
period is the result of low logging intensity, which has gradually been increasing
since 2000. Storage of CO2 in recovered wood products (HWP) also contributes to the
reduction of emissions. energy through substitution effect.
In 2017, the Government adopted a five-year Operational Programme for the
Implementation of the National Forest Programme 2017–2021 (OP NGP), which is
the implementation document of the Resolution on the National Forest Programme
(ReNGP) adopted in 2007. One of the ReNGP’s main objectives is sustainable
development as an eco-system in the sense of its biodiversity and all its ecologic,
economic and social functions.
In 2012, the Action plan to increase competitiveness of forest-wood chain in Slovenia
by the year 202045 was adopted, which plans measures to promote the felling of trees
in accordance with the forest management plans in force.
The Slovenian Forest Service also plays an important role in the management and
restriction of the felling of trees in forests; namely, it prepares forest management
plans, and issues decisions on the felling of trees and authorisations for other
interventions in forests. The Slovenian Forest Service directs the management of all
forests in Slovenia – irrespective of ownership. The largest permitted felling of trees
in Slovenia is defined in the Forest Management Plans for Forest Management Areas,
with a validity of 10 years (the recent plans are valid for the period 2011–202046).
According to these plans and in order to follow sustainable and environment-
friendly forest management, which has been carried out in Slovenia for more than 50
years, 7.5 million m3 of wood may be felled (75% forest growth per year), without
endangering the stability of the forests, their habitats and other functions.
Most forests in Slovenia are privately owned (around 76%), which in terms of their
management represents a great challenge. Private owners receive subsidies from the
State for the implementation of forestry and conservation works and for the
maintenance of the environment of wild animals, in accordance with forestry plans
prepared by the Forest Service.
45
Action plan to increase competitiveness of forest-wood chain in Slovenia by the year 2020, adopted by the Government of the Republic of Slovenia, July 2012. 46
Forest-management and game-management plans for the period 2011–2020, Summary for Slovenia prepared by the Slovenian Forest Service, adopted by the Government of the Republic of Slovenia, August 2012.
75
The Slovenian Forest Service is also responsible for the education and training of
forest owners and for advising them in the scope of the public forestry service.
Individual counselling is done through personal contact and through various
communication channels, while group training covers a variety of topics (for
example, workshops on forest protection). Implementation of the measures is legally
based on the Act on Forests and the Resolution on National Forest Programme
(Official Gazette of the Republic of Slovenia, No. 111/07).
Within the scope of the LIFE Care4Climate project, a single system for monitoring
emissions and sinks in the LULUCF sector is being established, which will enable
better quality monitoring of the situation and the basis for better decision-making.
4.11 Assessment of the economic and social consequences of response measures
Annex I countries, including Slovenia, implement measures in the framework of the
Kyoto Protocol, aimed at substantially reducing greenhouse gas emissions and
contributing to climate change mitigation. The implementation of increasingly
stringent environmental legislation and other measures aimed at fulfilling this
obligation might be associated with a range of side effects. It is not excluded that
potentially associated adverse economic effects could affect some developing and
least developed countries having less capacity for adequate remedial response
measures. The magnitude of these potential impacts is conditioned by the selection of
the policy measures, their stringency, the size of the economy implementing the
measures, as well as the characteristics of the possibly affected developing countries.
As a Member State of the European Union, Slovenia, designs and implements most
of its policies in the framework of EU directives, regulations, decisions and
recommendations. To ensure that all relevant possible impacts are taken into
account, the EU has established processes that assess the economic and social
consequences of climate policy measures. For the development of new policy
initiatives through legislative proposals by the European Commission, an impact
assessment system has been established in which all proposals are examined before
any legislation is passed. It is based on an integrated approach which analyses both
benefits and costs, and addresses all significant economic, social and environmental
impacts of possible new initiatives.
When adopting national measure Slovenia is mindful of the principle that its policies
and measures to reduce greenhouse gas emissions are designed in a way to have no,
or minimum, adverse impacts on developing countries, particularly on the least
developed ones. One of the examples in this regard is the possibility of carbon
leakage which would entail higher greenhouse gas emissions in countries which
have lower environmental standards. Slovenia is promoting the implementation of
measures that ensure that carbon leakage would not take place. As regards fiscal
policy instruments, no significant impact on third countries is expected from the
already implemented fiscal policies and therefore no specific policies to offset any
negative effects have been considered. Negative effects are also potentially linked

76
with the increased promotion of biofuels, as increased demand and subsequent
production of biofuels may be linked to rising commodity prices and potentially
induced land use change. All biofuels on the market in Europe and Slovenia must
comply with the sustainability criteria laid down in the Renewable Energy Directive
(2009/28/EC) and its revision (2018/2001/EU). Only sustainable biofuels are allowed
to be used for fulfilling the blending target.
4.12 Policies and measures no longer in place No significant measure which helps reduce emissions by 2020 has not ceased to be
implemented since the previous two-year report.
4.13 Monitoring and evaluation of progress in climate change measures
The trend of total GHG emissions is to be monitored through the GHG emissions
records prepared by the Environmental Agency of the Republic of Slovenia. The
Environmental Agency of the Republic of Slovenia also monitors ETS emissions. ETS
and non-ETS emissions are reported annually to the European Commission in
accordance with the implementing regulation EU 749/2014. Since 2015, the EU
Member States have been obliged to provide the European Commission with all
information on national measures and instruments for the mitigation of climate
change by 15 March every two years in accordance with Regulations 525/2013 and
2018/1999.
On the basis of the OP GHG-2020, the implementation of the measures referred to in
this programme is monitored annually through the report on implementing
measures. The report contains an analysis of the emission trend, an analysis of trends
in indicators by sector and measures and analysis of the implementation of
measures. Within the scope of the LIFE ClimatePath2050 project, monitoring of the
implementation of measures through the Climate Mirror has been upgraded, so that
it is now covering all emission sources (including ETS) and is content enriched. The
Climate Mirror is prepared on a yearly basis. The Climate Mirror consists of several
papers covering indicators, a detailed description of the implementation of the
measures in view of the intended implementation referred to in OP GHG-2020 or
other action documents, more detailed analysis of three problematic measures and a
review of the implementation of measures in ETS sectors. On the basis of the findings
on the implementation of the measures, recommendations are made in the Climate
Mirror concerning the improvement of measures and additional measures to achieve
the necessary reduction in emissions. The Climate Mirror represents the basis for the
Ministry responsible for the environment for the preparation of the report on the
implementation of the OP GHG. The report on implementing the OP GHG is
adopted by the Government of the Republic of Slovenia. All the reports of the LIFE
ClimatePath2050 project are available on the project's website, while reports on
implementing the OP GHG-2020 on the websites of the Government of the Republic
of Slovenia and the Ministry responsible for the environment.
77
The Environmental Protection Act plays an important legislative role in achieving
the climate objectives. The Environmental Protection Act (ZVO) provides a legal
basis for all other legislation in the area of environmental protection that indirectly or
directly influences GHG emissions; for instance, in the areas of waste, environmental
certificates, comprehensive assessment of environmental influences, ecolabels,
environmental management of organisations, economic and financial environmental
instruments (e.g. the environmental tax on environmental pollution, GHG emissions
allowance trading), etc.
The environmental inspection service is responsible for supervision of the
implementation of the Environmental Protection Act and all relevant implementing
regulations; the competences of the environmental inspection service also include
authorisation to prohibit the operation of plants or equipment, the revocation of
environmental certificates, etc. In case of infringement, the Act stipulates the
payment of fines.
Other important legislative frameworks for the implementation of the measures for
the reduction of GHG emissions include the Construction Act, the Energy Act and
the Agriculture Act; the latter two Acts provide the basis for the preparation,
adoption and implementation of sectoral policies for the two above-mentioned areas.
The area of transport is regulated by many acts.
4.14 Procedures for Public Participation The Environmental Protection Act (ZVO) provides for the participation of the public
in the preparation of all programmes regarding environmental protection. In
compliance with the international conventions (Espoo and Aarhus), the participation
of the public in the decision-making process regarding plans (within the framework
of a comprehensive environmental impact assessment) is provided for all plans and
projects with known environmental impacts, among others, for spatial planning,
water management, forest management, agriculture, energy, industry, transport,
waste treatment and wastewater treatment. Owing to their size, extent, location or
other characteristics that may have an impact on the environment, the environmental
impact assessment is obligatory for projects which include certain types of spatial
planning.
Implementation of the principle of partnership with social and regional partners and
civil society and the inclusion of the expert public in document preparation
procedures is mandatory for the preparation of all planning documents.
The Environmental Protection Act (ZVO) provides for access to environmental
information by all interested persons. In accordance with the Environmental
Protection Act, the Ministry will prepare a report on the state of the environment
every four years. Environmental data are available on the websites of the
Environmental Agency of the Republic of Slovenia and the programmes and
legislation are available on the websites of the competent ministries.

78
4.15 Use of units from market mechanisms and land use, changes in land use and forest management
Slovenia currently does not plan to implement Kyoto Protocol mechanisms and
intends to fulfil its obligations by 2020 with implementation of domestic measures.
The latest projection of GHG emissions shows that Slovenia will meet its objectives in
accordance with Decision 2009/406/EC without using the Kyoto Protocol
mechanisms.
Slovenia has decided to report on the situation in the LULUCF sector for
transparency and consistency reasons, although the LULUCF sector is not included
in the EU 2020 target.
CTF Table 4 contains the annotation Not Applicable (NA), as LULUCF is excluded in
the target and so the contribution of LULUCF is irrelevant to the mitigation actions
involved. It contains no values, as no Kyoto Protocol units or other units are used for
meeting the target.
CTF Table 4(a)I contains no values, as LULUCF is excluded in the target and so the
net emissions/removals from activities under Articles 3.3 and 3.4 of the Kyoto
Protocol as well as the related accounting quantities for the years since 2008 are
irrelevant to mitigation actions involved.
CTF Table 4(b) contains no values, as no Kyoto Protocol units or other units are used
for meeting the target.
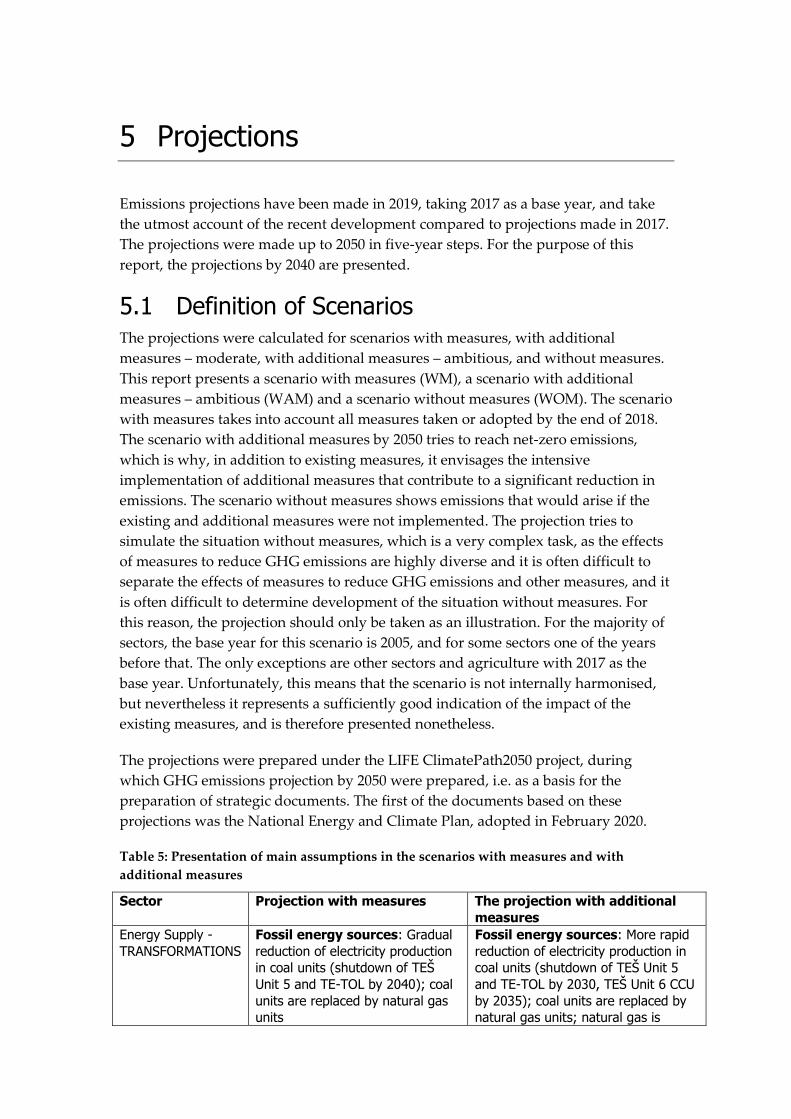
5 Projections
Emissions projections have been made in 2019, taking 2017 as a base year, and take
the utmost account of the recent development compared to projections made in 2017.
The projections were made up to 2050 in five-year steps. For the purpose of this
report, the projections by 2040 are presented.
5.1 Definition of Scenarios The projections were calculated for scenarios with measures, with additional
measures – moderate, with additional measures – ambitious, and without measures.
This report presents a scenario with measures (WM), a scenario with additional
measures – ambitious (WAM) and a scenario without measures (WOM). The scenario
with measures takes into account all measures taken or adopted by the end of 2018.
The scenario with additional measures by 2050 tries to reach net-zero emissions,
which is why, in addition to existing measures, it envisages the intensive
implementation of additional measures that contribute to a significant reduction in
emissions. The scenario without measures shows emissions that would arise if the
existing and additional measures were not implemented. The projection tries to
simulate the situation without measures, which is a very complex task, as the effects
of measures to reduce GHG emissions are highly diverse and it is often difficult to
separate the effects of measures to reduce GHG emissions and other measures, and it
is often difficult to determine development of the situation without measures. For
this reason, the projection should only be taken as an illustration. For the majority of
sectors, the base year for this scenario is 2005, and for some sectors one of the years
before that. The only exceptions are other sectors and agriculture with 2017 as the
base year. Unfortunately, this means that the scenario is not internally harmonised,
but nevertheless it represents a sufficiently good indication of the impact of the
existing measures, and is therefore presented nonetheless.
The projections were prepared under the LIFE ClimatePath2050 project, during
which GHG emissions projection by 2050 were prepared, i.e. as a basis for the
preparation of strategic documents. The first of the documents based on these
projections was the National Energy and Climate Plan, adopted in February 2020.
Table 5: Presentation of main assumptions in the scenarios with measures and with
additional measures
Sector Projection with measures The projection with additional
measures
Energy Supply -
TRANSFORMATIONS
Fossil energy sources: Gradual
reduction of electricity production
in coal units (shutdown of TEŠ
Unit 5 and TE-TOL by 2040); coal
units are replaced by natural gas
units
Fossil energy sources: More rapid
reduction of electricity production in
coal units (shutdown of TEŠ Unit 5
and TE-TOL by 2030, TEŠ Unit 6 CCU
by 2035); coal units are replaced by
natural gas units; natural gas is

80
RES: Construction of one new
hydropower plant, current
dynamics of development in other
RES (PV, wind, etc.)
Nuclear power: Operation of the
existing unit up to 2043, no new
unit foreseen
District heating systems:
current dynamics of development
– energy product structure
changes in order to meet the
requirement of the Energy Act
regarding the share of heat from
RES and/or CHP
gradually replaced by synthetic gas
RES: Construction of the last
hydropower plant on the lower Sava
River and majority of hydropower
plants on the middle Sava River,
intensive dynamics of development in
other RES (PV, wind, etc.)
Nuclear power: Operation of the
existing unit to 2043, scenario
without a new unit47
District heating systems: intensive
dynamics of development – energy
product structure accelerated to a
higher share of RES (including waste
heat) and/or CHP on synthetic gas
Energy use -
INDUSTRY
EEU: Improving the energy
efficiency of the processes in line
with developments so far
Fossil fuels: Transition to natural
gas, reducing the use of light fuel
oil, liquefied petroleum gas,
abandonment of coal by 2035
CHP: Preserving the existing
installations
RES: Increasing use in line with
the current dynamics
Waste heat: Minimum use
Material efficiency: Individual
measures that have a minimal
impact on the energy demand are
introduced
EEU: Intensive improvement of the
energy efficiency of processes with a
more rapid replacement of inefficient
technologies
Fossil fuels: The replacement of
natural gas with electricity, with RES
and also hydrogen where possible,
synthetic gas replaces natural gas by
2050
CHP: Increase in volume
RES: Intensive increase in use
Waste heat: Significant increase in
use
Material efficiency: Measures that
have an impact on the reduction of
energy demand for the production of
new materials and products are
introduced
CCU: For cement production
Energy use -
BUILDINGS
EEU: Maintaining the current level
of renovations. Increasing the
share of deep renovations.
Fossil fuels: Transition to natural
gas – expansion of the network,
phasing-out of other fossil fuels
(light fuel oil, liquefied petroleum
gas)
District heating: Expanding the
existing network and construction
of new networks where
economically viable
RES: Used where there are no
alternatives (excluding natural gas
and district heating networks)
EEU: Increase in the current level of
renovations, intensive removal of
obstacles. High share of deep
renovations.
Fossil fuels: Gradual phasing-out of
natural gas. By 2050, the remainder
(in particular floor heating and CHP)
is replaced by synthetic gas.
Prohibition on the purchase of boilers
on light fuel oil.
District heating: More intensive
expansion of the existing network
and construction of new networks
RES: Intensive increase in use (heat
pumps and wood)
Energy use -
TRANSPORT
Infrastructure: Construction of
all road network axes,
modernisation of the railway
network (TEN-T and certain
Infrastructure: Accelerated
investments in rail infrastructure –
construction of all planned
connections (including regional), and
47 Scenarios with and without new nuclear power plant were analysed in the LIFE ClimatePath2050 project. This report presents a scenario without a new nuclear power plant, but this does not prejudge the decision on the second unit of nuclear power plant. The scenario is selected for the demonstration because emissions are slightly higher.

81
regional connections),
improvement of the existing
cycling infrastructure
Change in modes of transport:
implementing measures that lead
to an increased share of PPT, but
the car pkm are still increasing.
The share of railway freight
transport is maintained in freight
transport.
Implementation of the transport
development strategy.
Vehicle fleet: Compliance with
EU legislation on average CO2
emissions for new vehicles.
Biofuels: The increase in biofuels
to a technically acceptable share
(7% diesel, 5% gasoline). The
introduction of biofuels of the
second generation in line with EU
RES directive.
in cycling infrastructure
Change in modes of transport:
decline of the concept of passenger
car ownership, intensive
implementation of measures that lead
to an increased PPT share (stop car
transport growth). The share of
railway freight transport is increased
in freight transport
Vehicle fleet: More rapid
electrification of the passenger car
and light duty vehicle fleet, higher
shares of alternative powertrains also
for heavy duty vehicles and buses,
replacement of liquid fossil fuels with
synthetic fuels.
Biofuels: The increase in biofuels to
11%. The introduction of biofuels of
the second generation in line with EU
RES directive.
Industrial Processes Implementation of the F-gas
Regulation and the Directive on
the use of F-gases in mobile air
conditioning systems
CCU for cement production, reduction
of F-gases as in the projection with
measures
Agriculture Implementation of the Strategy for
Implementation of the Resolution
on Strategic Directions of the
Slovenian Agriculture and Food
Industry until 2040.
Measures to enhance the efficiency of
breeding, accelerated construction of
anaerobic digesters, fertilisation with
low emissions.
Waste Solid waste disposal:
Projections of waste flows in the
operational programme for
municipal waste management
from 2016. No biodegradable
waste being landfilled.
Wastewater: Expansion of
sewage network and replacement
of septic tanks with biological
wastewater treatment plants.
The same as in the projection with
measures.
5.2 Definition of sectors in projections The projections use a sectoral breakdown as appears in Slovenian strategic
documents to reduce GHG emissions (e.g. Operational Programme for the Reduction
of GHG Emissions by 2020, National Energy and Climate Plan) that differs from the
CRF classification. The link between the sectors used in the projections with CRF
classification is shown in the table below.

82
Table 6: Comparing sectors in projections with CRF sectors
Sector in projections CRF sector
Transformations and Fugitive
Emissions
1.A.1 Energy industries
1.B Fugitive emissions
Industry and construction 1.A.2 Manufacturing Industries and Construction
Transport 1.A.3 Transport
General use 1.A.4 Other Sectors
1.A.5 Other
Industrial Processes 2. Industrial Processes
Agriculture 3. Agriculture
Waste 5. Waste
Sinks 4. LULUCF
5.3 Projection results
5.3.1 Total Emissions of Greenhouse Gases
According to the projection with measures, by 2020, emissions will decrease to
17,128kt CO2 eq., by 2030, to 16,874kt CO2 eq., and by 2040, to 16,018kt CO2 eq.
According to the projection with additional measures, emissions will reduce to
16,703 kt CO2 eq. in 2020. In 2030, emissions will amount to 13,079 kt CO2 eq., while
in 2040 they will amount to 6,781 kt CO2 eq. Compared to 2017, emissions are 2%, 3%
and 8% lower in 2020, 2030 and 2040 in the projection with measures and 4%, 25%
and 61% lower in the projection with additional measures. Compared to 2005,
emissions were down by 17% and by 18% in 2020 and 2030 according to the
projection with measures and by 19% and 36% according to the projection with
additional measures. The projection without measures records significantly higher
emissions and a reverse trend. In 2020, emissions are estimated at 20,634 kt CO2 eq.,
in 2030 at 22,010 kt CO2 eq., and in 2040 23,544 kt CO2 eq.
Figure 7: Current emissions trend up to and including 2017, and emissions trend according
to projections with measures, with additional measures and without measures from 2020 to
2040 (source: EARS, IJS-CEU, KIS)
0
5.000
10.000
15.000
20.000
25.000
1980 1990 2000 2010 2020 2030 2040 2050
GH
G e
mis
sio
ns
[kt C
O2
eq
]
Year
Actual emissions
Projection with measures
Projection with additional measures
Projection without measures
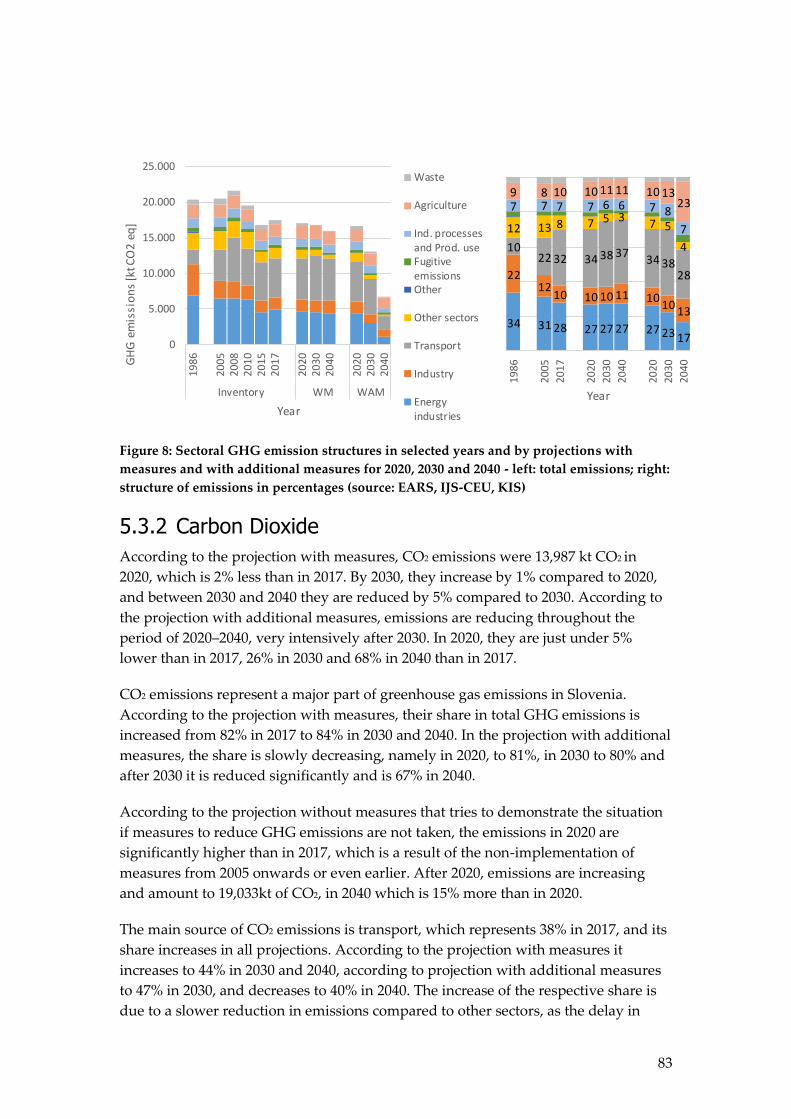
83
Figure 8: Sectoral GHG emission structures in selected years and by projections with
measures and with additional measures for 2020, 2030 and 2040 - left: total emissions; right:
structure of emissions in percentages (source: EARS, IJS-CEU, KIS)
5.3.2 Carbon Dioxide
According to the projection with measures, CO2 emissions were 13,987 kt CO2 in
2020, which is 2% less than in 2017. By 2030, they increase by 1% compared to 2020,
and between 2030 and 2040 they are reduced by 5% compared to 2030. According to
the projection with additional measures, emissions are reducing throughout the
period of 2020–2040, very intensively after 2030. In 2020, they are just under 5%
lower than in 2017, 26% in 2030 and 68% in 2040 than in 2017.
CO2 emissions represent a major part of greenhouse gas emissions in Slovenia.
According to the projection with measures, their share in total GHG emissions is
increased from 82% in 2017 to 84% in 2030 and 2040. In the projection with additional
measures, the share is slowly decreasing, namely in 2020, to 81%, in 2030 to 80% and
after 2030 it is reduced significantly and is 67% in 2040.
According to the projection without measures that tries to demonstrate the situation
if measures to reduce GHG emissions are not taken, the emissions in 2020 are
significantly higher than in 2017, which is a result of the non-implementation of
measures from 2005 onwards or even earlier. After 2020, emissions are increasing
and amount to 19,033kt of CO2, in 2040 which is 15% more than in 2020.
The main source of CO2 emissions is transport, which represents 38% in 2017, and its
share increases in all projections. According to the projection with measures it
increases to 44% in 2030 and 2040, according to projection with additional measures
to 47% in 2030, and decreases to 40% in 2040. The increase of the respective share is
due to a slower reduction in emissions compared to other sectors, as the delay in
0
5.000
10.000
15.000
20.000
25.000
19
86
20
05
20
08
20
10
20
15
20
17
20
20
20
30
20
40
20
20
20
30
20
40
Inventory WM WAM
GH
G e
mis
sio
ns
[kt C
O2
eq
]
Year
Waste
Agriculture
Ind. processesand Prod. useFugitiveemissionsOther
Other sectors
Transport
Industry
Energyindustries
34 31 28 27 27 27 27 23 17
2212
10 10 10 11 1010
13
1022 32 34 38 37
34 3828
12 13 8 7 5 37 5
4
7 7 7 7 6 6 7 8
7
9 8 10 10 11 11 10 1323
19
86
20
05
20
17
20
20
20
30
20
40
20
20
20
30
20
40
Year

84
implementing measures in this sector is the largest. In addition, the implementation
of measures requires greater efforts. This is followed by transformations with
approximately one-third share, followed by industry with approximately 12%, other
sectors, where the share is reduced the most, i.e. from 9% to 5% in the projection with
additional measures, and industrial processes representing between 6 and 8%
according to the projection.
Figure 9: The development of CO2 emissions without sinks up to and including 2017 and
projections up to 2040 (EARS, IJS-CEU, KIS)
5.3.3 Methane
According to the projections with measures and with additional measures, methane
emissions are reducing. By 2030 they are reduced by 15% according to the projection
with measures and by 22% according to the projection with additional measures. By
2040, they reduce by 21% or 32% respectively. The main contributor to the reduction
in emissions is the waste sector, where emissions are reduced by 14.8kt CH4
according to both projections. In the projection with additional measures, agriculture
significantly contributes to the reduction in emissions since it is the biggest source of
methane emissions, while according to the projection with measures the emissions
from agriculture increase. Two important sources of methane emissions are
combustion of wood, where emissions are reduced due to the reduction in wood
consumption, and fugitive emissions, where the emissions are also reducing due to
the phasing-out of coal.
According to the projection without measures, emissions are significantly higher
than in other two projections, indicating a reverse trend. In 2030, they are 113.7kt
CH4 and, in 2040, 115.9 kt CH4.
In total emissions, methane represents 12% in 2017. In projections with measures, the
share is slowly decreasing and is 11% in 2030, and 10% in 2040. In projections with
0
2.000
4.000
6.000
8.000
10.000
12.000
14.000
16.000
18.000
20.000
1980 1990 2000 2010 2020 2030 2040 2050
CO
2 e
mis
sio
ns
[kt]
Actual emissions
Projection with measures
Projection with additional measures
Projection without measures

85
additional measures, the share after 2030, when it is 13%, is increasing rapidly, i.e.
21% in 2040.
Figure 10: CH4 emissions trend without sinks up to and including 2017, and emissions
trend according to the projection with measures, with additional measures and without
measures up to 2040 (source: EARS, IJS-CEU, KIS)
5.3.4 Nitrous Oxide
N2O emissions are the only emissions with no pronounced reduction. According to
the projection with measures, emissions increase compared to 2017. In 2030, they are
up by 13% and in 2040 by 15%. According to the projection with additional
measures, they increase up to 2025, and then start reducing. In 2030, they are higher
by 6.5%, and by 2.6% in 2040, compared to 2017. The main source with about 70%,
except in the projection with additional measures in 2040 with 76%, is agriculture.
They are followed by emissions from transport, where they reduce the most due to
electrification of the vehicle fleet. The share is 9%, except in the projection with
additional measures in 2030 (8%), and even 4% in 2040. The waste sector and other
sectors contribute more than 5% to emissions, while emissions are also generated in
combustion processes in other sectors (transformations and industry).
The projection without measures indicates a high growth in emissions. In 2030, they
are 22% higher than in 2017, and 29% higher in 2040.
Nitrous Oxide contributes 4% to total emissions in 2017. By 2030, the share according
to the projection with measures increases to 5% and remains at this level in 2040, while
according to the projection with additional measures it is 6% in 2030 and 11% in 2040.
0
500
1.000
1.500
2.000
2.500
3.000
3.500
1980 1990 2000 2010 2020 2030 2040 2050
CH
4 e
mis
sio
ns
[kt]
Actual emissions
Projection with measures
Projection with additional measures
Projection without measures
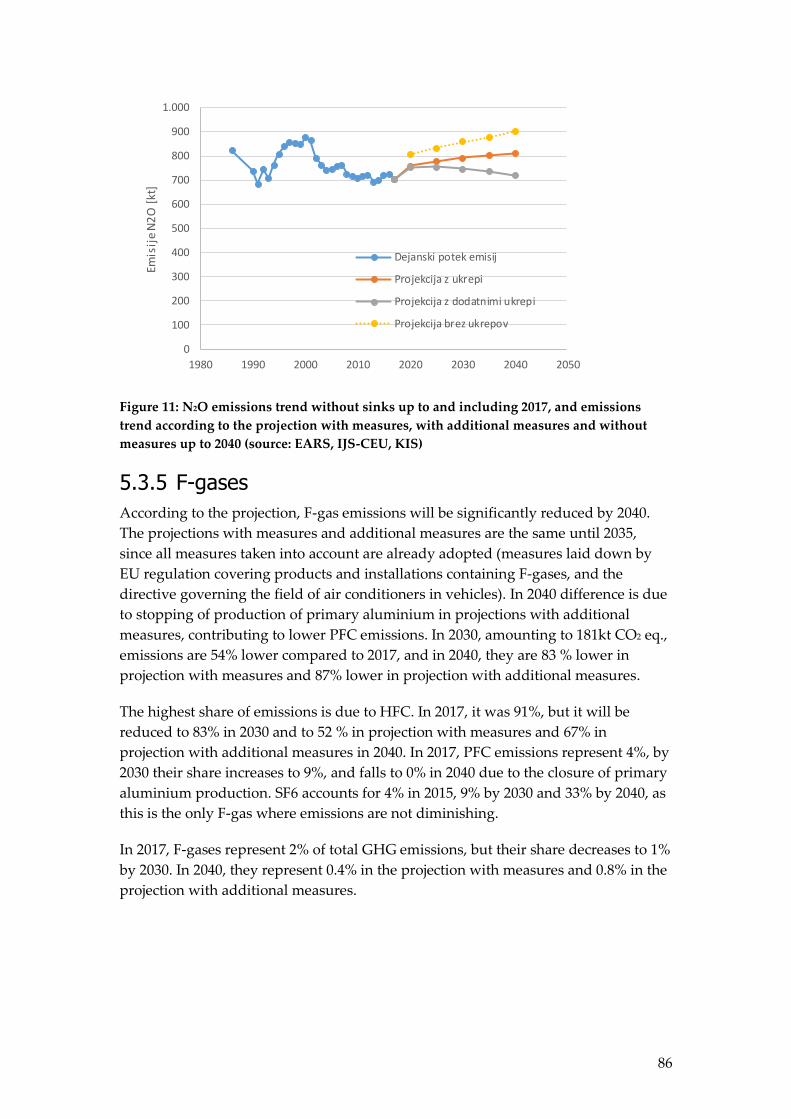
86
Figure 11: N2O emissions trend without sinks up to and including 2017, and emissions
trend according to the projection with measures, with additional measures and without
measures up to 2040 (source: EARS, IJS-CEU, KIS)
5.3.5 F-gases
According to the projection, F-gas emissions will be significantly reduced by 2040.
The projections with measures and additional measures are the same until 2035,
since all measures taken into account are already adopted (measures laid down by
EU regulation covering products and installations containing F-gases, and the
directive governing the field of air conditioners in vehicles). In 2040 difference is due
to stopping of production of primary aluminium in projections with additional
measures, contributing to lower PFC emissions. In 2030, amounting to 181kt CO2 eq.,
emissions are 54% lower compared to 2017, and in 2040, they are 83 % lower in
projection with measures and 87% lower in projection with additional measures.
The highest share of emissions is due to HFC. In 2017, it was 91%, but it will be
reduced to 83% in 2030 and to 52 % in projection with measures and 67% in
projection with additional measures in 2040. In 2017, PFC emissions represent 4%, by
2030 their share increases to 9%, and falls to 0% in 2040 due to the closure of primary
aluminium production. SF6 accounts for 4% in 2015, 9% by 2030 and 33% by 2040, as
this is the only F-gas where emissions are not diminishing.
In 2017, F-gases represent 2% of total GHG emissions, but their share decreases to 1%
by 2030. In 2040, they represent 0.4% in the projection with measures and 0.8% in the
projection with additional measures.
0
100
200
300
400
500
600
700
800
900
1.000
1980 1990 2000 2010 2020 2030 2040 2050
Emis
ije
N2
O[k
t]
Dejanski potek emisij
Projekcija z ukrepi
Projekcija z dodatnimi ukrepi
Projekcija brez ukrepov

87
Figure 12: F-gas emissions trend up to and including 2017, and emissions trend according
to projections until 2040 (source: EARS, IJS-CEU)
5.3.6 Emissions by Sector
TRANSFORMATIONS AND FUGITIVE EMISSIONS
Energy industries (1.A.1) mostly include emissions from the production of electricity
and heat where the greatest share of emissions is generated from coal-based thermal
power plants. Emissions are also generated by gas-powered units and production of
district heat by district heating systems. The emissions trend in the future is mostly
characterised by the reduction in the electricity production generated by coal-based
units and their replacement by gas-powered units (partially also by small CHPs),
where natural gas is gradually replaced also by synthetic gas, and an increase in the
use of renewable energy sources (RES). The share of RES is also increased in the
district heating systems. Synthetic gas and combustible RES are assumed to be CO2
neutral.
Fugitive emissions (1.B) include emissions generated by the distribution of gas and
liquid fuels, coal mining and flue gas desulfurisation. By way of reducing the need
for coal use, the fugitive emissions from coal mining and desulfurisation decrease.
After a marked reduction in emissions in 2014, emissions no longer increase to a level
above 5,400kt CO2 eq., which is due to the closure of certain coal units and
constructing a new more efficient coal unit. According to the projection with
measures, coal for production is being phased-out very gradually, and thus the
reduction in emissions is very slow. Also, additional electricity demand is covered
mainly by new gas units. As a result, energy industries and fugitive emissions in 2030
are 7% lower than in 2017, and in 2040 12% lower. A completely different situation is
indicated in the projection with additional measures. Here, the phasing out of coal
production is much faster and the additional electricity demand is mainly covered by
renewable energy sources, in particular solar power plants. Since all the requirements
cannot be covered by RES, in particular in winter time, additional gas units are
0
100
200
300
400
500
600
700
800
1980 1990 2000 2010 2020 2030 2040 2050
F ga
s em
issi
on
s [k
t]Actual emissions
Projection with measures
Projection with additional measures
Projection without measures
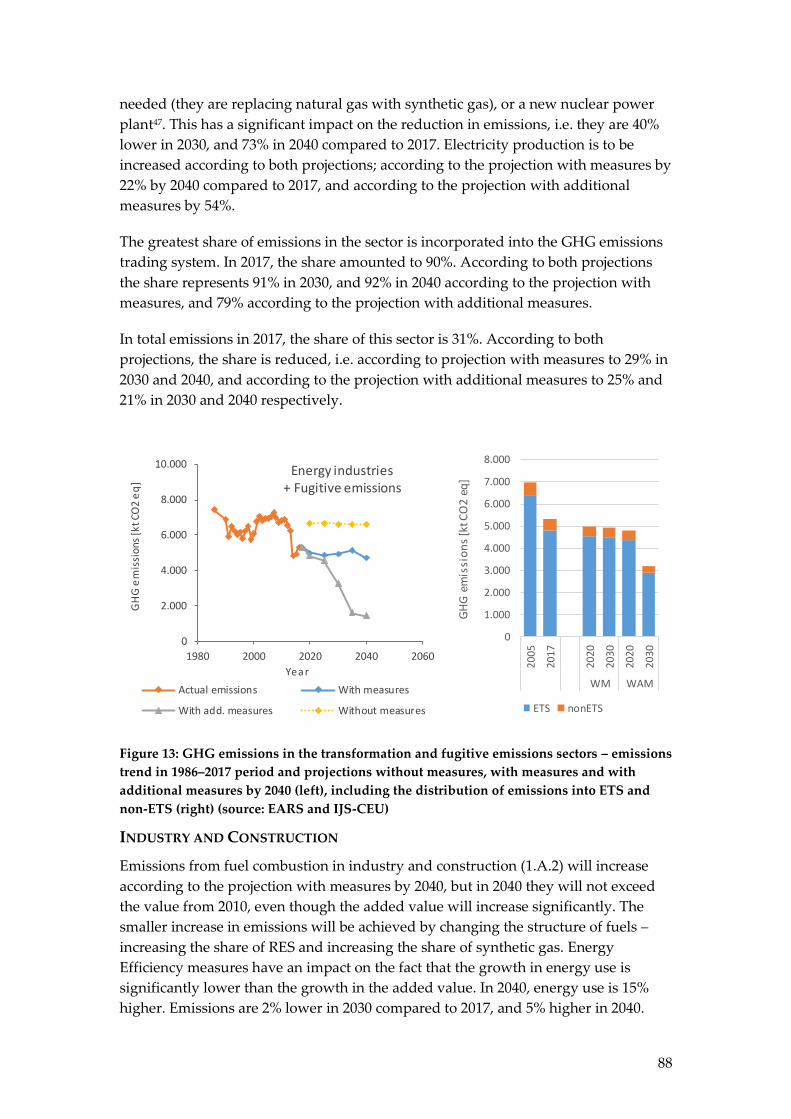
88
needed (they are replacing natural gas with synthetic gas), or a new nuclear power
plant47. This has a significant impact on the reduction in emissions, i.e. they are 40%
lower in 2030, and 73% in 2040 compared to 2017. Electricity production is to be
increased according to both projections; according to the projection with measures by
22% by 2040 compared to 2017, and according to the projection with additional
measures by 54%.
The greatest share of emissions in the sector is incorporated into the GHG emissions
trading system. In 2017, the share amounted to 90%. According to both projections
the share represents 91% in 2030, and 92% in 2040 according to the projection with
measures, and 79% according to the projection with additional measures.
In total emissions in 2017, the share of this sector is 31%. According to both
projections, the share is reduced, i.e. according to projection with measures to 29% in
2030 and 2040, and according to the projection with additional measures to 25% and
21% in 2030 and 2040 respectively.
Figure 13: GHG emissions in the transformation and fugitive emissions sectors – emissions
trend in 1986–2017 period and projections without measures, with measures and with
additional measures by 2040 (left), including the distribution of emissions into ETS and
non-ETS (right) (source: EARS and IJS-CEU)
INDUSTRY AND CONSTRUCTION
Emissions from fuel combustion in industry and construction (1.A.2) will increase
according to the projection with measures by 2040, but in 2040 they will not exceed
the value from 2010, even though the added value will increase significantly. The
smaller increase in emissions will be achieved by changing the structure of fuels –
increasing the share of RES and increasing the share of synthetic gas. Energy
Efficiency measures have an impact on the fact that the growth in energy use is
significantly lower than the growth in the added value. In 2040, energy use is 15%
higher. Emissions are 2% lower in 2030 compared to 2017, and 5% higher in 2040.
0
2.000
4.000
6.000
8.000
10.000
1980 2000 2020 2040 2060
GH
G e
mis
sio
ns
[kt
CO
2 e
q]
Year
Energy industries + Fugitive emissions
Actual emissions With measures
With add. measures Without measures
0
1.000
2.000
3.000
4.000
5.000
6.000
7.000
8.000
20
05
20
17
20
20
20
30
20
20
20
30
WM WAM
GH
G e
mis
sio
ns
[kt C
O2
eq
]
ETS nonETS
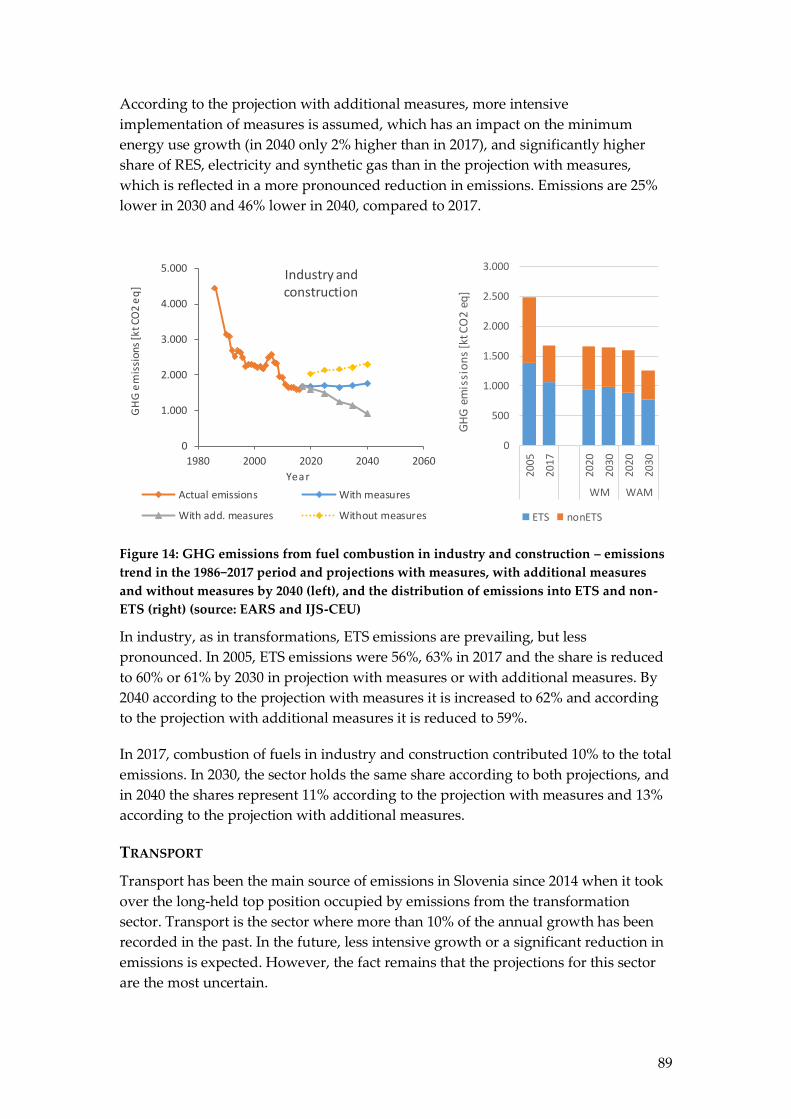
89
According to the projection with additional measures, more intensive
implementation of measures is assumed, which has an impact on the minimum
energy use growth (in 2040 only 2% higher than in 2017), and significantly higher
share of RES, electricity and synthetic gas than in the projection with measures,
which is reflected in a more pronounced reduction in emissions. Emissions are 25%
lower in 2030 and 46% lower in 2040, compared to 2017.
Figure 14: GHG emissions from fuel combustion in industry and construction – emissions
trend in the 1986−2017 period and projections with measures, with additional measures
and without measures by 2040 (left), and the distribution of emissions into ETS and non-
ETS (right) (source: EARS and IJS-CEU)
In industry, as in transformations, ETS emissions are prevailing, but less
pronounced. In 2005, ETS emissions were 56%, 63% in 2017 and the share is reduced
to 60% or 61% by 2030 in projection with measures or with additional measures. By
2040 according to the projection with measures it is increased to 62% and according
to the projection with additional measures it is reduced to 59%.
In 2017, combustion of fuels in industry and construction contributed 10% to the total
emissions. In 2030, the sector holds the same share according to both projections, and
in 2040 the shares represent 11% according to the projection with measures and 13%
according to the projection with additional measures.
TRANSPORT
Transport has been the main source of emissions in Slovenia since 2014 when it took
over the long-held top position occupied by emissions from the transformation
sector. Transport is the sector where more than 10% of the annual growth has been
recorded in the past. In the future, less intensive growth or a significant reduction in
emissions is expected. However, the fact remains that the projections for this sector
are the most uncertain.
0
500
1.000
1.500
2.000
2.500
3.000
20
05
20
17
20
20
20
30
20
20
20
30
WM WAM
GH
G e
mis
sio
ns
[kt C
O2
eq
]
ETS nonETS
0
1.000
2.000
3.000
4.000
5.000
1980 2000 2020 2040 2060
GH
G e
mis
sion
s [k
t CO
2 e
q]
Year
Industry and construction
Actual emissions With measures
With add. measures Without measures
90
Further growth of transport on Slovenian roads is expected by 2040. The projection
with measures foresees the domestic vehicle passenger transport to increase by 35%
in the 2017-2040 period, and freight transport by 79%, while according to the
projections with additional measures the passenger transport increases by 24% and
freight transport by 58%. In addition to domestic vehicles, Slovenia is also heavily
exposed to the transport of foreign vehicles. In passenger transport, the growth is
lower than for domestic vehicles, while in freight transport the growth of 95% and
69% is significantly higher than the growth of domestic vehicle transport. The
construction of railway infrastructure will result in freight transport rail increasing,
which will suffice for a minimum increase in the share of rail transport. The
promotion of public passenger transport along with the construction of railway
infrastructure, in particular intensively according to the projection with additional
measures, has an impact on the increase in share of railway passenger transport to
3% or 5%, and maintains the current share or slight increase in bus transport. Energy
use due to significant improvement in vehicle efficiency, changes in the structure of
vehicle fleet, in particular electrification, and partially due to changes in behaviour
and transport mode, increases significantly less than transport activity or it actually
decreases. In the projection with measures, energy use is 14% higher in 2040 than in
2017, while in the projection with additional measures it is 36% lower. In addition,
the use of biofuels also contributes to lower emissions; the share of biofuels increases
from 1.3% in 2017 to 6.5% in 2020 according to both projections. According to the
projection with measures, it remains at a similar level after 2020, while the projection
with additional measures foresees it amounting to 11% in 2030 and 15% in 2040.
The implementation of measures described above maintains transport emissions just
above the emissions levels recorded in 2008, according to the projection with
measures. In 2008, emissions amounted to 6,158kt CO2 eq., while according to the
projection with measures, the highest emissions levels are achieved in 2030,
amounting to 6,355kt CO2 eq., i.e. 15% lower compared to 2017. By 2040, emissions
are reduced to 5,994kt CO2 eq. In the projection with additional measures, emissions
are rapidly falling from 2025 onwards. In 2030, emissions are 10% lower than in 2017,
and 66% in 2040. All emissions from transport are included in non-ETS emissions.
In terms of total emissions, transport represents 32% in 2017, 38% in 2030 according
to both projections, and 37% in 2040 according to the projection with measures, and
28% according to the projection with additional measures.

91
Figure 15: GHG emissions from transport (left) and from the other sectors (right) in the
1986−2017 period and according to the projections with measures, with additional
measures and without measures by 2040 (source: EARS and IJS-CEU)
OTHER SECTORS
GHG emissions generated in other sectors which includes energy use in households,
services and agriculture, decrease significantly. In fact, the projection anticipates a
very ambitious implementation of measures in these areas, specifically, phasing-out
of fuel oil-powered boilers, the great share of boilers using wood biomass and heat
pumps, a significant increase of solar collectors installed and high level of energy
renovation of residential and non-residential buildings turning them into energy
efficient buildings. The remainder of natural gas is replaced by synthetic gas in the
projection with additional measures. In spite of an increase in the surface of
residential buildings (by 6% in the 2017−2040 period) and non-residential buildings
(by 29% in the 2017−2040 period), these measures have an effect on the reduction of
emissions. In agriculture, diesel fuel, which has no suitable alternative, is replaced by
synthetic liquid fuels, which are CO2 neutral, and with biofuels.
Compared to 2017, emissions are 46% lower in 2030 according to the projection with
measures and 57% lower according to the projection with additional measures. They
decrease additionally by 2040, being thus 62% or 79% lower compared to 2017.
With regard to total emissions, other sectors represented 8% in 2017, while the sector
share is reduced to 5% by 2030, and to 3% by 2040 according to projection with
measures and to 4% according to the projection with additional measures.
INDUSTRIAL PROCESSES
Following a reduction in emissions in 2008 due to the economic crisis and closure of
certain plants not fulfilling the requirements of environmental permits, emissions
0
1.000
2.000
3.000
4.000
5.000
6.000
7.000
8.000
9.000
1980 2000 2020 2040 2060
Emis
ije T
GP
[kt
CO
2 e
kv]
Year
Transport
Actual emissions With measures
With add. measures Without measures
0
500
1.000
1.500
2.000
2.500
3.000
3.500
4.000
1980 2000 2020 2040 2060
GH
G e
mis
sio
ns
[kt
CO
2 e
q]
Year
Other sectors
Actual emissions With measures
With add. measures Without measures
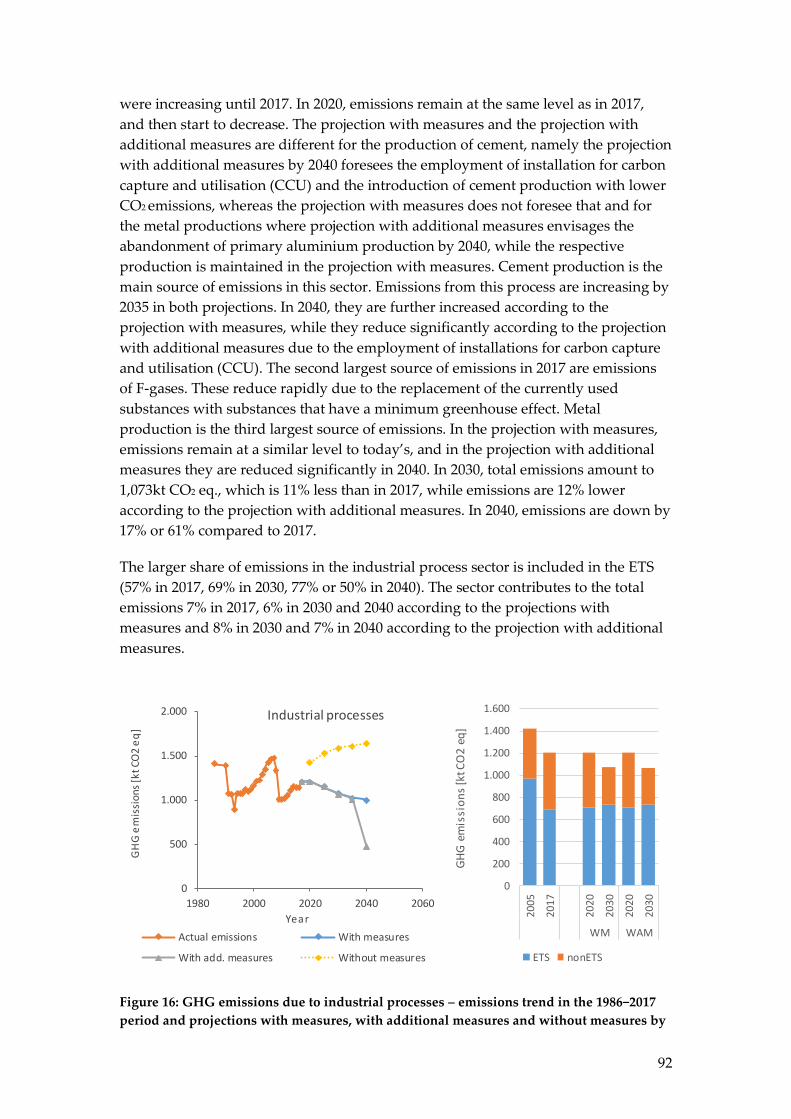
92
were increasing until 2017. In 2020, emissions remain at the same level as in 2017,
and then start to decrease. The projection with measures and the projection with
additional measures are different for the production of cement, namely the projection
with additional measures by 2040 foresees the employment of installation for carbon
capture and utilisation (CCU) and the introduction of cement production with lower
CO2 emissions, whereas the projection with measures does not foresee that and for
the metal productions where projection with additional measures envisages the
abandonment of primary aluminium production by 2040, while the respective
production is maintained in the projection with measures. Cement production is the
main source of emissions in this sector. Emissions from this process are increasing by
2035 in both projections. In 2040, they are further increased according to the
projection with measures, while they reduce significantly according to the projection
with additional measures due to the employment of installations for carbon capture
and utilisation (CCU). The second largest source of emissions in 2017 are emissions
of F-gases. These reduce rapidly due to the replacement of the currently used
substances with substances that have a minimum greenhouse effect. Metal
production is the third largest source of emissions. In the projection with measures,
emissions remain at a similar level to today’s, and in the projection with additional
measures they are reduced significantly in 2040. In 2030, total emissions amount to
1,073kt CO2 eq., which is 11% less than in 2017, while emissions are 12% lower
according to the projection with additional measures. In 2040, emissions are down by
17% or 61% compared to 2017.
The larger share of emissions in the industrial process sector is included in the ETS
(57% in 2017, 69% in 2030, 77% or 50% in 2040). The sector contributes to the total
emissions 7% in 2017, 6% in 2030 and 2040 according to the projections with
measures and 8% in 2030 and 7% in 2040 according to the projection with additional
measures.
Figure 16: GHG emissions due to industrial processes – emissions trend in the 1986−2017
period and projections with measures, with additional measures and without measures by
0
200
400
600
800
1.000
1.200
1.400
1.600
20
05
20
17
20
20
20
30
20
20
20
30
WM WAM
GH
G e
mis
sio
ns
[kt C
O2
eq
]
ETS nonETS
0
500
1.000
1.500
2.000
1980 2000 2020 2040 2060
GH
G e
mis
sio
ns
[kt
CO
2 e
q]
Year
Industrial processes
Actual emissions With measures
With add. measures Without measures

93
2040 (left) and the distribution of emissions into ETS and non-ETS (right) (source: EARS
and IJS-CEU)
AGRICULTURE
By 2020, the emissions in agriculture increase according to both projections
compared to 2017. According to the projection with measures, average annual
growth in the 2020–2030 period is 0.3%, while it is further reduced to 0.2% in the
following decade. Compared to 2017, emissions in 2030 are 4% higher, and in 2040
6% higher; additional measures contribute to the reduction in emissions from
agriculture after 2020. According to the projection with additional measures,
emissions are 2% lower in 2030, and 9% lower in 2040. In 2017, agriculture accounts
for 10% of total emissions. According to the projection with measures, the share is
stabilised at 11%, while according to the projection with additional measures it
increases to 13% by 2030, and to 24% by 2040.
The projections with measures foresee the preservation of the number of livestock at
the level from previous years. The exception is pig farming, where the volume of
farming has decreased significantly after 2007. In this sector, the weight gain is
projected to return to approximately 70% of the increment which has already been
achieved in a decade before the reduction. In crop production, the increase in the
yield by 2050 is projected to be approximately 40% compared to the average from the
2013–2017 period. The amount of nitrogen in the yield of agricultural plants
(including grassland) is expected to increase by approximately 8% by 2030.
The projections with additional measures foresaw the increase in the efficiency of
breeding. This allows for similar quantities of milk and beef being produced with a
smaller number of animals and smaller greenhouse gas emissions. It has been
announced that in the context of the consistent implementation of the measure
"Increase in the efficiency of domestic animal production" the total number of bovine
animals will be reduced by 15% and the number of dairy cows by 11% by 2030.
Within the scope of the measure "Promoting breeding with low emissions", an
increased volume in livestock manure processing on biogas installations is foreseen
(in pig farming from 12 to 20% and in cattle farming from 0.4% to 8% by 2030). In
cattle farming, an increase in livestock grazing is foreseen (in dairy cows from 6 to
8%, in suckler cows from 26 to 31% and in young bovine animals from 12 to 15%).
Within the framework of the Rational fertilising of crops with nitrogen measure, an
increased volume of urea retention (50%), an increase in the immediate tilling of
manure on fields to 30%, in terms of slurry manure an increase of the use of
techniques of fertilising with low emission to 100% on fields and to 50% in grassland
were foreseen. Model calculations indicate that, due to measures to improve the
efficient use of nitrogen, the use of mineral fertilisers will increase for less than 2%
despite a significant increase of nitrogen in agricultural products.
WASTE
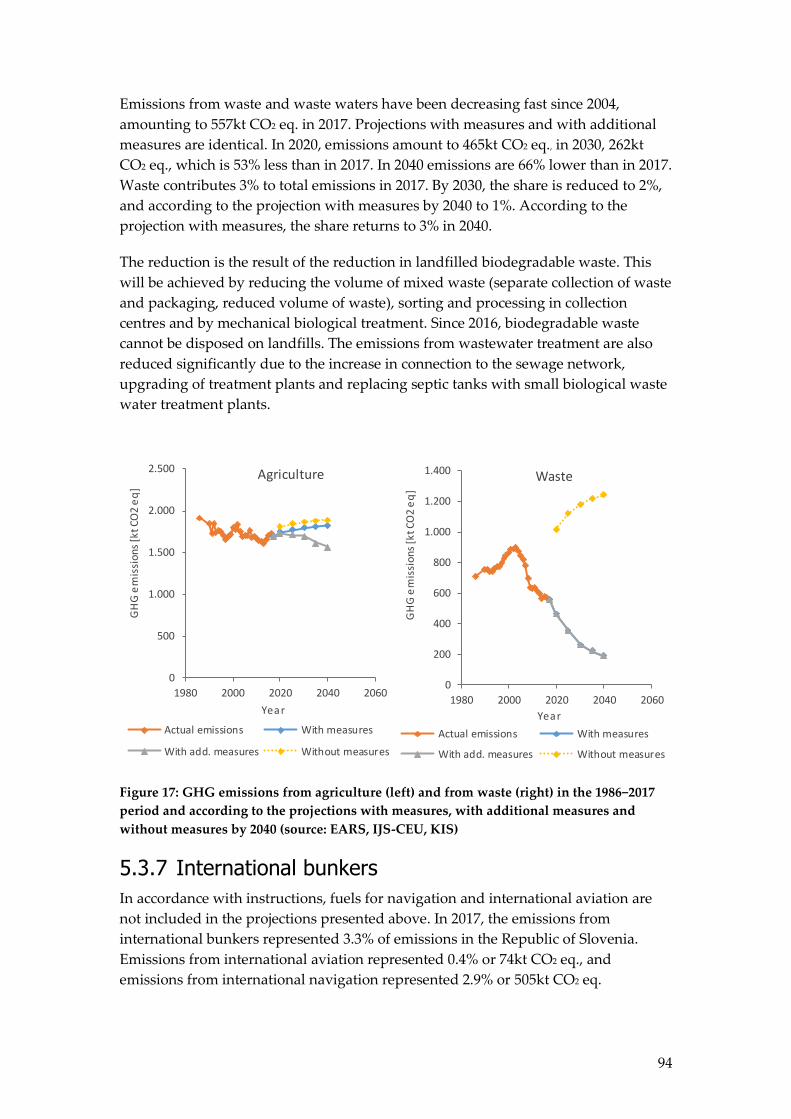
94
Emissions from waste and waste waters have been decreasing fast since 2004,
amounting to 557kt CO2 eq. in 2017. Projections with measures and with additional
measures are identical. In 2020, emissions amount to 465kt CO2 eq., in 2030, 262kt
CO2 eq., which is 53% less than in 2017. In 2040 emissions are 66% lower than in 2017.
Waste contributes 3% to total emissions in 2017. By 2030, the share is reduced to 2%,
and according to the projection with measures by 2040 to 1%. According to the
projection with measures, the share returns to 3% in 2040.
The reduction is the result of the reduction in landfilled biodegradable waste. This
will be achieved by reducing the volume of mixed waste (separate collection of waste
and packaging, reduced volume of waste), sorting and processing in collection
centres and by mechanical biological treatment. Since 2016, biodegradable waste
cannot be disposed on landfills. The emissions from wastewater treatment are also
reduced significantly due to the increase in connection to the sewage network,
upgrading of treatment plants and replacing septic tanks with small biological waste
water treatment plants.
Figure 17: GHG emissions from agriculture (left) and from waste (right) in the 1986−2017
period and according to the projections with measures, with additional measures and
without measures by 2040 (source: EARS, IJS-CEU, KIS)
5.3.7 International bunkers
In accordance with instructions, fuels for navigation and international aviation are
not included in the projections presented above. In 2017, the emissions from
international bunkers represented 3.3% of emissions in the Republic of Slovenia.
Emissions from international aviation represented 0.4% or 74kt CO2 eq., and
emissions from international navigation represented 2.9% or 505kt CO2 eq.
0
500
1.000
1.500
2.000
2.500
1980 2000 2020 2040 2060
GH
G e
mis
sio
ns
[kt
CO
2 e
q]
Year
Agriculture
Actual emissions With measures
With add. measures Without measures
0
200
400
600
800
1.000
1.200
1.400
1980 2000 2020 2040 2060
GH
G e
mis
sio
ns
[kt
CO
2 e
q]
Year
Waste
Actual emissions With measures
With add. measures Without measures
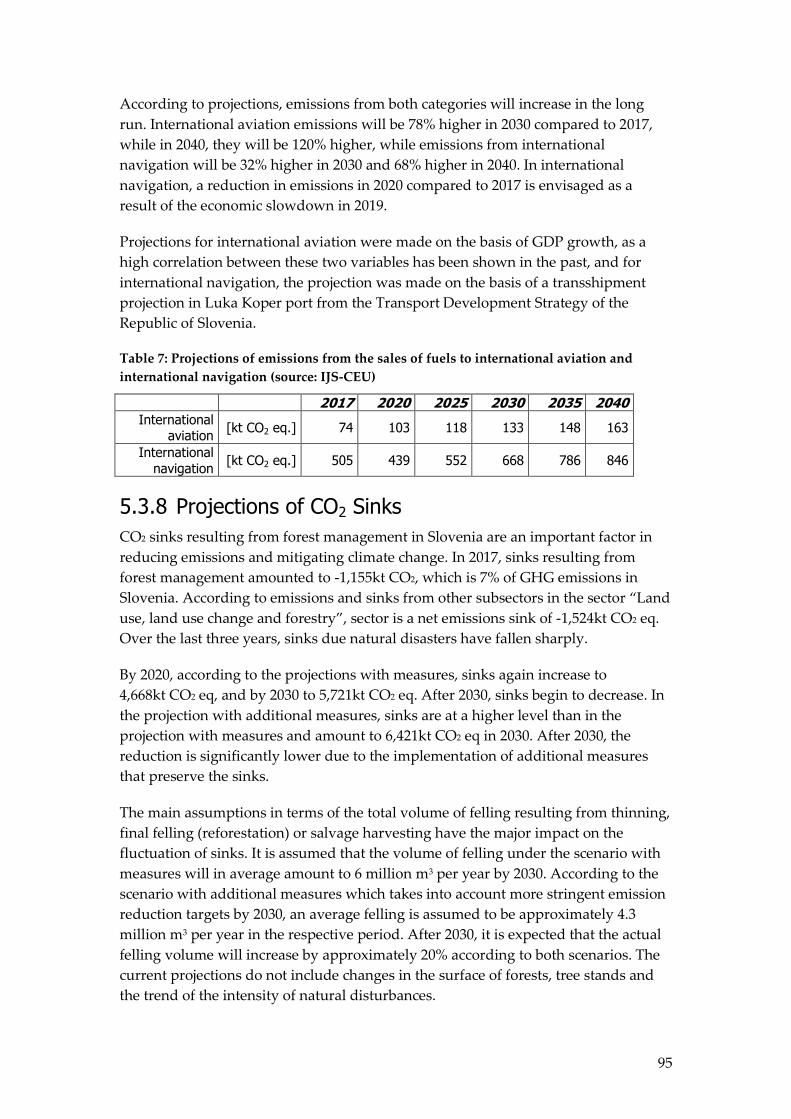
95
According to projections, emissions from both categories will increase in the long
run. International aviation emissions will be 78% higher in 2030 compared to 2017,
while in 2040, they will be 120% higher, while emissions from international
navigation will be 32% higher in 2030 and 68% higher in 2040. In international
navigation, a reduction in emissions in 2020 compared to 2017 is envisaged as a
result of the economic slowdown in 2019.
Projections for international aviation were made on the basis of GDP growth, as a
high correlation between these two variables has been shown in the past, and for
international navigation, the projection was made on the basis of a transshipment
projection in Luka Koper port from the Transport Development Strategy of the
Republic of Slovenia.
Table 7: Projections of emissions from the sales of fuels to international aviation and
international navigation (source: IJS-CEU)
2017 2020 2025 2030 2035 2040 International
aviation [kt CO2 eq.] 74 103 118 133 148 163
International
navigation [kt CO2 eq.] 505 439 552 668 786 846
5.3.8 Projections of CO2 Sinks
CO2 sinks resulting from forest management in Slovenia are an important factor in
reducing emissions and mitigating climate change. In 2017, sinks resulting from
forest management amounted to -1,155kt CO2, which is 7% of GHG emissions in
Slovenia. According to emissions and sinks from other subsectors in the sector “Land
use, land use change and forestry”, sector is a net emissions sink of -1,524kt CO2 eq.
Over the last three years, sinks due natural disasters have fallen sharply.
By 2020, according to the projections with measures, sinks again increase to
4,668kt CO2 eq, and by 2030 to 5,721kt CO2 eq. After 2030, sinks begin to decrease. In
the projection with additional measures, sinks are at a higher level than in the
projection with measures and amount to 6,421kt CO2 eq in 2030. After 2030, the
reduction is significantly lower due to the implementation of additional measures
that preserve the sinks.
The main assumptions in terms of the total volume of felling resulting from thinning,
final felling (reforestation) or salvage harvesting have the major impact on the
fluctuation of sinks. It is assumed that the volume of felling under the scenario with
measures will in average amount to 6 million m3 per year by 2030. According to the
scenario with additional measures which takes into account more stringent emission
reduction targets by 2030, an average felling is assumed to be approximately 4.3
million m3 per year in the respective period. After 2030, it is expected that the actual
felling volume will increase by approximately 20% according to both scenarios. The
current projections do not include changes in the surface of forests, tree stands and
the trend of the intensity of natural disturbances.
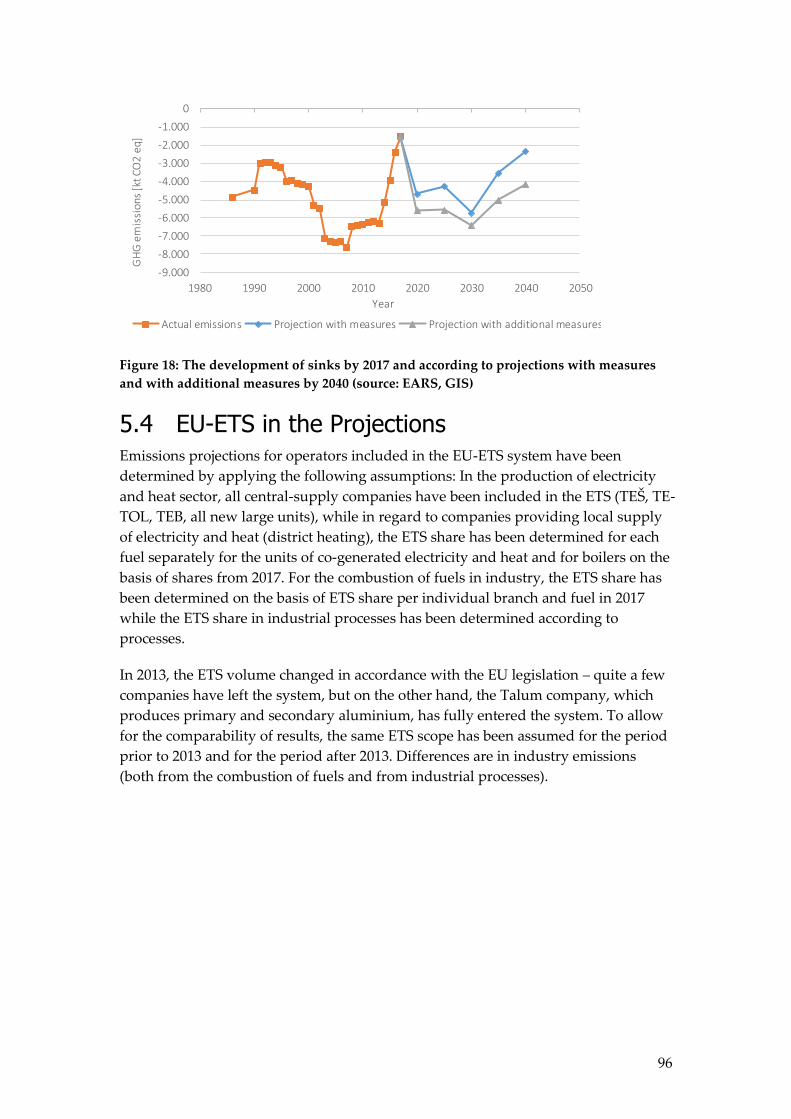
96
Figure 18: The development of sinks by 2017 and according to projections with measures
and with additional measures by 2040 (source: EARS, GIS)
5.4 EU-ETS in the Projections Emissions projections for operators included in the EU-ETS system have been
determined by applying the following assumptions: In the production of electricity
and heat sector, all central-supply companies have been included in the ETS (TEŠ, TE-
TOL, TEB, all new large units), while in regard to companies providing local supply
of electricity and heat (district heating), the ETS share has been determined for each
fuel separately for the units of co-generated electricity and heat and for boilers on the
basis of shares from 2017. For the combustion of fuels in industry, the ETS share has
been determined on the basis of ETS share per individual branch and fuel in 2017
while the ETS share in industrial processes has been determined according to
processes.
In 2013, the ETS volume changed in accordance with the EU legislation – quite a few
companies have left the system, but on the other hand, the Talum company, which
produces primary and secondary aluminium, has fully entered the system. To allow
for the comparability of results, the same ETS scope has been assumed for the period
prior to 2013 and for the period after 2013. Differences are in industry emissions
(both from the combustion of fuels and from industrial processes).
-9.000
-8.000
-7.000
-6.000
-5.000
-4.000
-3.000
-2.000
-1.000
0
1980 1990 2000 2010 2020 2030 2040 2050
GH
G e
mis
sio
ns [k
t CO
2 e
q]
Year
Actual emissions Projection with measures Projection with additional measures
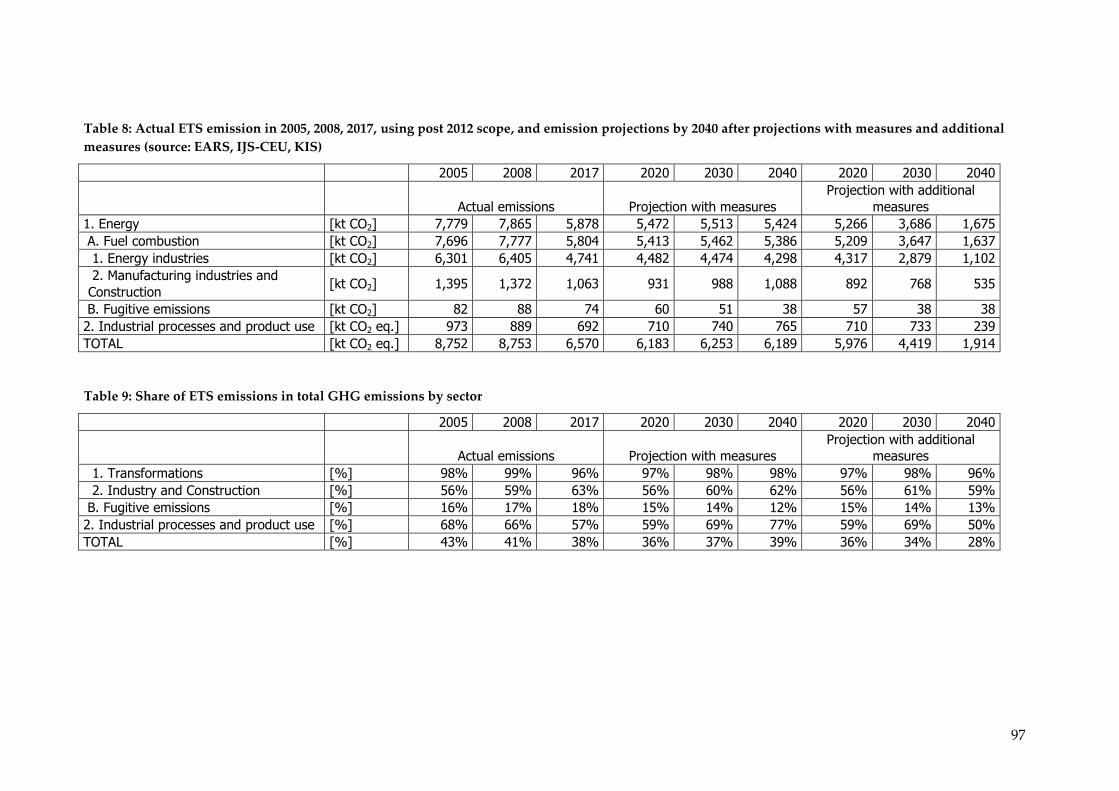
97
Table 8: Actual ETS emission in 2005, 2008, 2017, using post 2012 scope, and emission projections by 2040 after projections with measures and additional
measures (source: EARS, IJS-CEU, KIS)
2005 2008 2017 2020 2030 2040 2020 2030 2040
Actual emissions Projection with measures
Projection with additional
measures
1. Energy [kt CO2] 7,779 7,865 5,878 5,472 5,513 5,424 5,266 3,686 1,675
A. Fuel combustion [kt CO2] 7,696 7,777 5,804 5,413 5,462 5,386 5,209 3,647 1,637
1. Energy industries [kt CO2] 6,301 6,405 4,741 4,482 4,474 4,298 4,317 2,879 1,102
2. Manufacturing industries and
Construction [kt CO2] 1,395 1,372 1,063 931 988 1,088 892 768 535
B. Fugitive emissions [kt CO2] 82 88 74 60 51 38 57 38 38
2. Industrial processes and product use [kt CO2 eq.] 973 889 692 710 740 765 710 733 239
TOTAL [kt CO2 eq.] 8,752 8,753 6,570 6,183 6,253 6,189 5,976 4,419 1,914
Table 9: Share of ETS emissions in total GHG emissions by sector
2005 2008 2017 2020 2030 2040 2020 2030 2040
Actual emissions Projection with measures
Projection with additional
measures
1. Transformations [%] 98% 99% 96% 97% 98% 98% 97% 98% 96%
2. Industry and Construction [%] 56% 59% 63% 56% 60% 62% 56% 61% 59%
B. Fugitive emissions [%] 16% 17% 18% 15% 14% 12% 15% 14% 13%
2. Industrial processes and product use [%] 68% 66% 57% 59% 69% 77% 59% 69% 50%
TOTAL [%] 43% 41% 38% 36% 37% 39% 36% 34% 28%

98
According to the projection with measures, the emissions from ETS sources are being
maintained at a level around 6,200 kt CO2 eq., while according to the projection with
additional measures the emissions are significantly reduced, so that in 2030 they are
33% lower than in 2017, and 71% lower in 2040. Emissions are the most reduced in
transformations, which also represent by far the largest share of emissions in the ETS.
In 2030, the emissions are 6% lower based on the projection with measures and 39%
lower based on the projection with additional measures. Emissions from other
sources are reduced by 3% and 16% in 2030 compared to 2017 according to the
projections with measures and with additional measures. Total ETS emissions were
5% or 33% lower in 2030 compared to 2017 according to both projections, and
compared to 2005, 29% and 50% lower, respectively.
The share of emissions from sources included in the ETS scheme varies by sector,
which is clearly shown in the presentation of emission trends by sector in the figures
at sectoral descriptions and in the table above. Practically all emissions of the
transformation sector are covered in the ETS; only smaller units in district heating are
not covered by the system. In industry and construction, the emissions of ETS
sources represent 56% in 2005, and this share is increased to 63% by 2017, and then it
stays around 60%. This means that the energy intensive industry in Slovenia is
preserved. In terms of fugitive emissions, emissions from flue gas desulfurisation are
included in the ETS system. In industrial processes, the share of ETS in sector
emissions is changing the most. It increases according to the projection with
measures, as F-gases emissions reduce significantly, while the emissions in ETS are
not reduced to the same extent, while in the projection with additional measures, the
share is significantly reduced in 2040 because of the carbon capture in cement
production.
Figure 19: Actual ETS emissions and projections with measures and with additional
measures by 2040 (source: EARS, IJS-CEU, KIS)
5.5 Non-ETS in Projections Within the scope of the EU objective for reducing GHG emissions by 20% by 2020,
the target set for Slovenia for the non-ETS sector allows for an increase in emissions
0
2.000
4.000
6.000
8.000
10.000
2000 2005 2010 2015 2020 2025 2030 2035 2040 2045
GH
G e
mis
sio
ns
[kt C
O2
eq
]
Year
Actual emissions
With measures
With add. measures
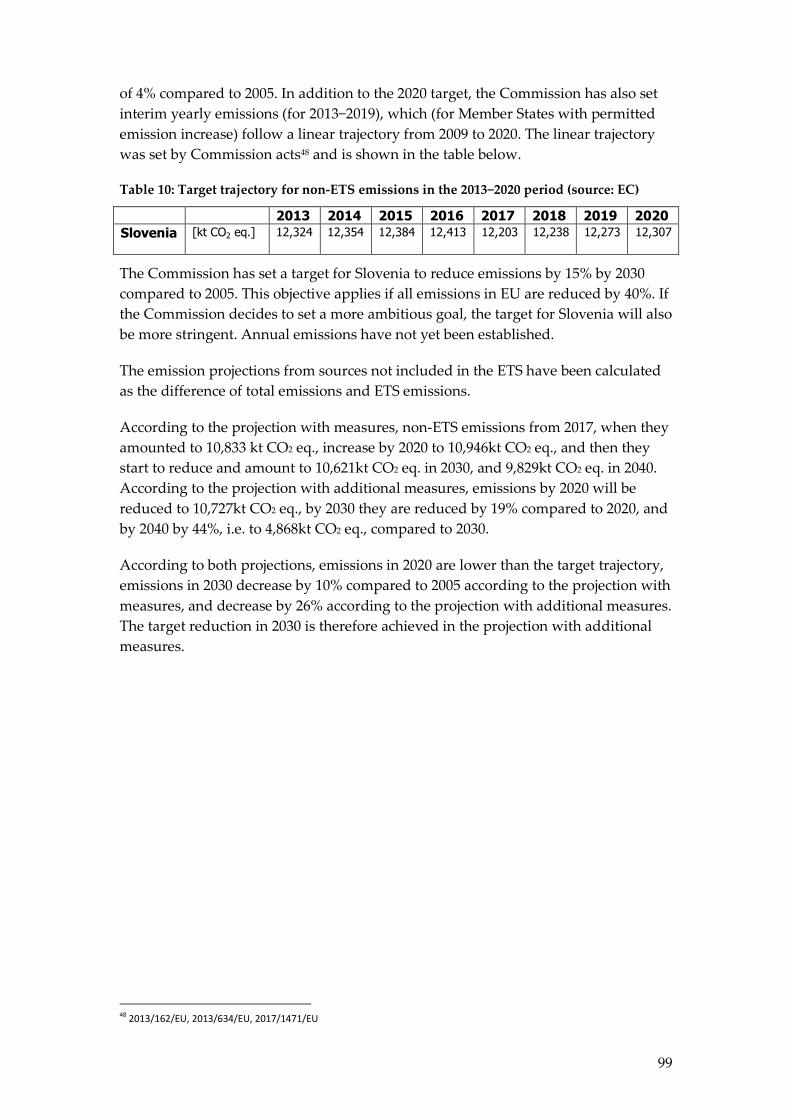
99
of 4% compared to 2005. In addition to the 2020 target, the Commission has also set
interim yearly emissions (for 2013−2019), which (for Member States with permitted
emission increase) follow a linear trajectory from 2009 to 2020. The linear trajectory
was set by Commission acts48 and is shown in the table below.
Table 10: Target trajectory for non-ETS emissions in the 2013−2020 period (source: EC)
2013 2014 2015 2016 2017 2018 2019 2020
Slovenia [kt CO2 eq.] 12,324 12,354 12,384 12,413 12,203 12,238 12,273 12,307
The Commission has set a target for Slovenia to reduce emissions by 15% by 2030
compared to 2005. This objective applies if all emissions in EU are reduced by 40%. If
the Commission decides to set a more ambitious goal, the target for Slovenia will also
be more stringent. Annual emissions have not yet been established.
The emission projections from sources not included in the ETS have been calculated
as the difference of total emissions and ETS emissions.
According to the projection with measures, non-ETS emissions from 2017, when they
amounted to 10,833 kt CO2 eq., increase by 2020 to 10,946kt CO2 eq., and then they
start to reduce and amount to 10,621kt CO2 eq. in 2030, and 9,829kt CO2 eq. in 2040.
According to the projection with additional measures, emissions by 2020 will be
reduced to 10,727kt CO2 eq., by 2030 they are reduced by 19% compared to 2020, and
by 2040 by 44%, i.e. to 4,868kt CO2 eq., compared to 2030.
According to both projections, emissions in 2020 are lower than the target trajectory,
emissions in 2030 decrease by 10% compared to 2005 according to the projection with
measures, and decrease by 26% according to the projection with additional measures.
The target reduction in 2030 is therefore achieved in the projection with additional
measures.
48 2013/162/EU, 2013/634/EU, 2017/1471/EU
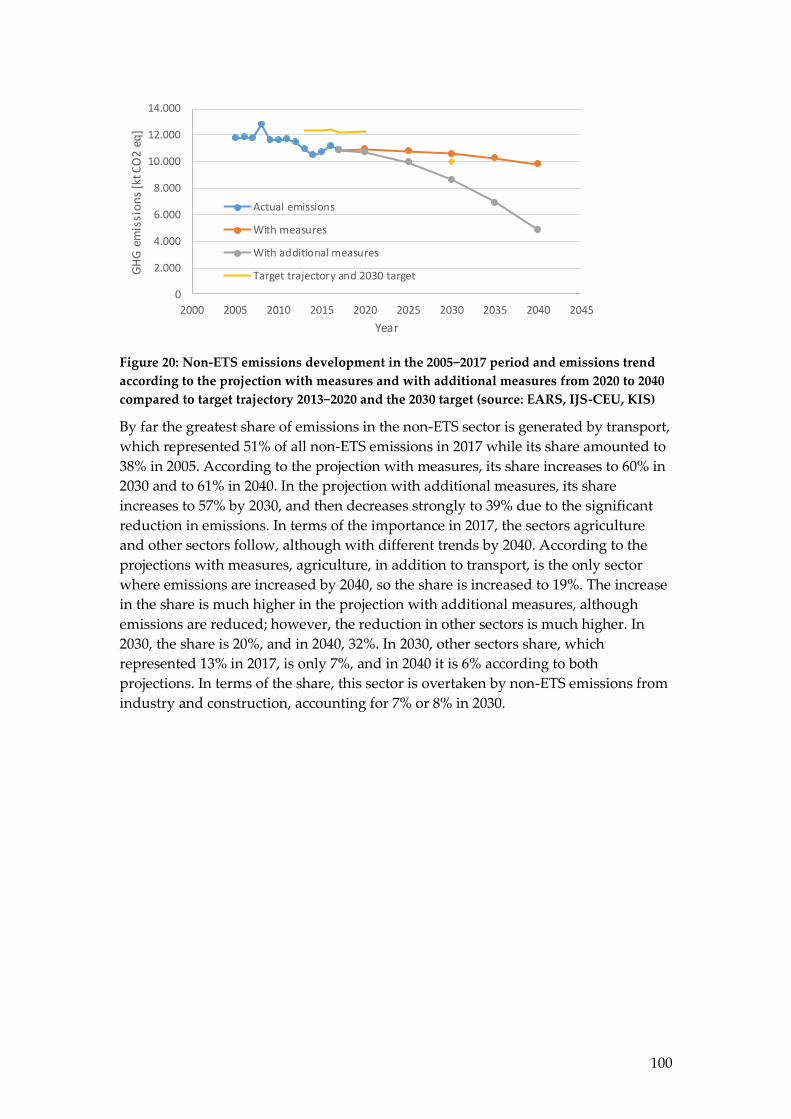
100
Figure 20: Non-ETS emissions development in the 2005−2017 period and emissions trend
according to the projection with measures and with additional measures from 2020 to 2040
compared to target trajectory 2013−2020 and the 2030 target (source: EARS, IJS-CEU, KIS)
By far the greatest share of emissions in the non-ETS sector is generated by transport,
which represented 51% of all non-ETS emissions in 2017 while its share amounted to
38% in 2005. According to the projection with measures, its share increases to 60% in
2030 and to 61% in 2040. In the projection with additional measures, its share
increases to 57% by 2030, and then decreases strongly to 39% due to the significant
reduction in emissions. In terms of the importance in 2017, the sectors agriculture
and other sectors follow, although with different trends by 2040. According to the
projections with measures, agriculture, in addition to transport, is the only sector
where emissions are increased by 2040, so the share is increased to 19%. The increase
in the share is much higher in the projection with additional measures, although
emissions are reduced; however, the reduction in other sectors is much higher. In
2030, the share is 20%, and in 2040, 32%. In 2030, other sectors share, which
represented 13% in 2017, is only 7%, and in 2040 it is 6% according to both
projections. In terms of the share, this sector is overtaken by non-ETS emissions from
industry and construction, accounting for 7% or 8% in 2030.
0
2.000
4.000
6.000
8.000
10.000
12.000
14.000
2000 2005 2010 2015 2020 2025 2030 2035 2040 2045
GH
G e
mis
sio
ns
[kt C
O2
eq
]
Year
Actual emissions
With measures
With additional measures
Target trajectory and 2030 target

101
Figure 21: Non-ETS emission structure in 2005 and 2017 and according to the projections
for 2020, 2030 and 2040 (source: IJS-CEU, KIS)
0
2.000
4.000
6.000
8.000
10.000
12.000
14.000
Actualemissions
WM WAM
GH
G e
mis
sio
ns
[kt C
O2
eq
]
Waste
Agriculture
Industrial processes
Other sectors
Transport
Industry and construction
Transformations and fugitiveemissions

102
Table 11: Emissions from sources which are not included in EU-ETS (non-ETS) in 2005, 2008, 2017 and projection with measures and with additional
measures by 2040
GHG [kt CO2 eq.] Actual emissions Projection with
measures
Projection with additional
measures
With
measures
With
additional
measures Sector \ Year 2005 2008 2017 2020 2030 2040 2020 2030 2040 2030/2005 2030/2005
Transformations and fugitive emissions 591 533 509 455 431 366 440 302 300 -27% -49%
Industry and Construction 1,090 946 616 735 662 671 710 486 373 -39% -55%
Transport 4,416 6,141 5,541 5,779 6,355 5,994 5,699 4,962 1,898 44% 12%
Other sectors 2,661 2,365 1,456 1,267 784 548 1,186 620 305 -71% -77%
Industrial Processes 452 451 516 497 333 234 497 333 234 -26% -26%
Agriculture 1,709 1,686 1,688 1,747 1,796 1,826 1,730 1,695 1,567 5% -1%
Waste 848 697 557 465 262 189 465 262 189 -69% -69%
TOTAL 11,767 12,819 10,883 10,946 10,621 9,829 10,727 8,660 4,868 -10% -26%
Target trajectory and TARGET 2020 12,203 12,307 12,307
Distance to the TARGET
(emissions/target-1) -11% -13%
103
5.6 The Total Effect of Measures The overall impact of the implemented and adopted measures was determined by
comparing the projection with measures and the projection without measures, and
the overall impact of additional measures by comparing the projection with
additional measures and the projection with measures.
The overall effect of adopted and implemented measures for 2020 amounts 3,505kt
CO2 eq. and the total effect of additional measures is 426kt CO2 eq. The high impact
of the adopted and taken measures is the result that the base year for the projection
without measures is not the year 2017 (with the exception of the other sectors and
agriculture), but one of years before 2017. As expected, the effect increases on a
yearly basis, so that in 2030 it amounts to 5,136kt CO2 eq. for adopted and
implemented measures, and 3,795kt CO2 eq. for additional measures. In 2040, the
effect is 7,526kt CO2 eq. or 9,236kt CO2 eq. so that the impact of the additional
measures exceeds the impact of the adopted and implemented measures. By far the
greatest effect is accounted for by CO2, followed by CH4. More interesting is the effect
of measures across sectors. The biggest impact of the measures is seen in the
transport sector due to improved efficiency of vehicles, increase in the use of low-
carbon fuels, and changes in the structure of modes of transport; however, the impact
is increased mainly after 2030. It is followed by the energy industries sector resulting
from overhauling of thermal power plants and increasing the RES share in electricity
generation. The impact in waste is very large, as the projection without measures
foresees the complete non-implementation of measures. The impact of measures in
other sectors is also significant, despite the fact that the base year is 2017. With an
earlier base year, the impact would be significantly higher, as there was already a
significant reduction in emissions in 2017 with regard to 2005 (by 45%). In industrial
processes, the major part of the reduction in HFC emissions is taken into account in
adopted and implemented measures and other measures are taken into account in
the additional measures. The smallest effect of measures among large sectors is seen
in agriculture, which confirms how difficult it is to reduce emissions in this sector. As
in other sectors, 2017 as base year, also has great impact on small effect of measures.
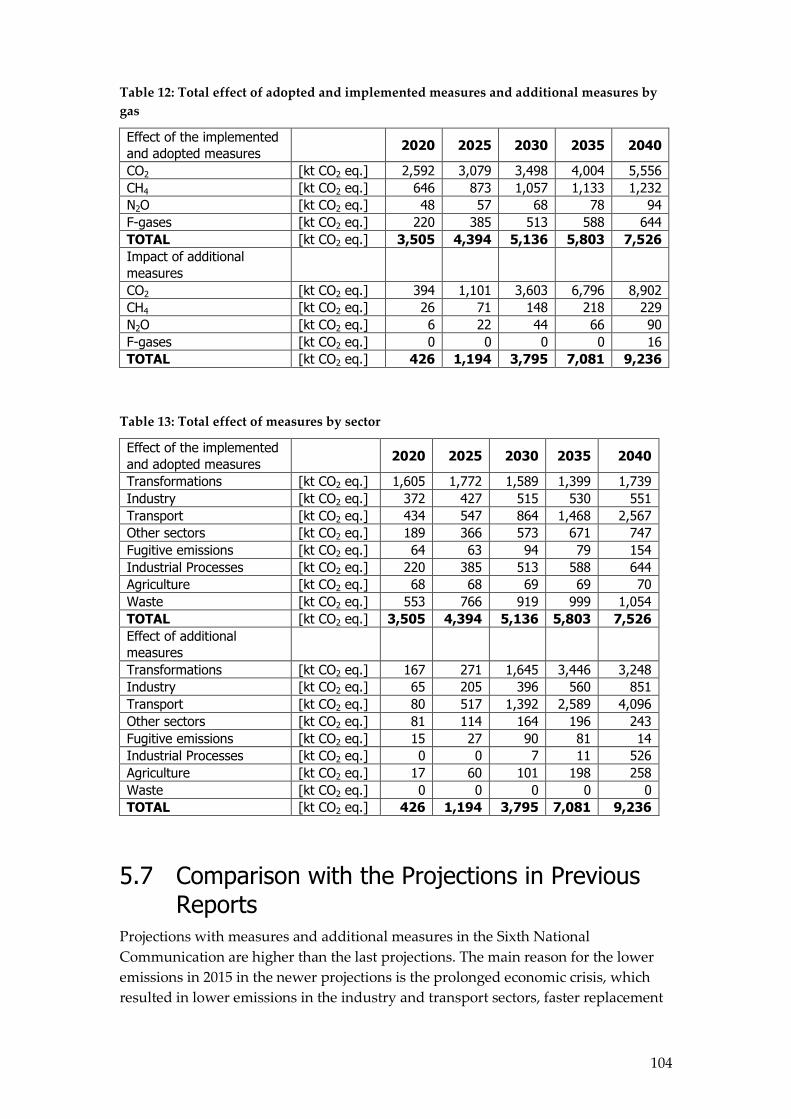
104
Table 12: Total effect of adopted and implemented measures and additional measures by
gas
Effect of the implemented
and adopted measures 2020 2025 2030 2035 2040
CO2 [kt CO2 eq.] 2,592 3,079 3,498 4,004 5,556
CH4 [kt CO2 eq.] 646 873 1,057 1,133 1,232
N2O [kt CO2 eq.] 48 57 68 78 94
F-gases [kt CO2 eq.] 220 385 513 588 644
TOTAL [kt CO2 eq.] 3,505 4,394 5,136 5,803 7,526
Impact of additional
measures
CO2 [kt CO2 eq.] 394 1,101 3,603 6,796 8,902
CH4 [kt CO2 eq.] 26 71 148 218 229
N2O [kt CO2 eq.] 6 22 44 66 90
F-gases [kt CO2 eq.] 0 0 0 0 16
TOTAL [kt CO2 eq.] 426 1,194 3,795 7,081 9,236
Table 13: Total effect of measures by sector
Effect of the implemented
and adopted measures 2020 2025 2030 2035 2040
Transformations [kt CO2 eq.] 1,605 1,772 1,589 1,399 1,739
Industry [kt CO2 eq.] 372 427 515 530 551
Transport [kt CO2 eq.] 434 547 864 1,468 2,567
Other sectors [kt CO2 eq.] 189 366 573 671 747
Fugitive emissions [kt CO2 eq.] 64 63 94 79 154
Industrial Processes [kt CO2 eq.] 220 385 513 588 644
Agriculture [kt CO2 eq.] 68 68 69 69 70
Waste [kt CO2 eq.] 553 766 919 999 1,054
TOTAL [kt CO2 eq.] 3,505 4,394 5,136 5,803 7,526
Effect of additional
measures
Transformations [kt CO2 eq.] 167 271 1,645 3,446 3,248
Industry [kt CO2 eq.] 65 205 396 560 851
Transport [kt CO2 eq.] 80 517 1,392 2,589 4,096
Other sectors [kt CO2 eq.] 81 114 164 196 243
Fugitive emissions [kt CO2 eq.] 15 27 90 81 14
Industrial Processes [kt CO2 eq.] 0 0 7 11 526
Agriculture [kt CO2 eq.] 17 60 101 198 258
Waste [kt CO2 eq.] 0 0 0 0 0
TOTAL [kt CO2 eq.] 426 1,194 3,795 7,081 9,236
5.7 Comparison with the Projections in Previous Reports
Projections with measures and additional measures in the Sixth National
Communication are higher than the last projections. The main reason for the lower
emissions in 2015 in the newer projections is the prolonged economic crisis, which
resulted in lower emissions in the industry and transport sectors, faster replacement

105
of fuel oil with, in particular, wood biomass in households and the service sector,
and lower emissions in transformations. In the transport sector, the impact of the
changed ratio between the prices of motor fuel in Slovenia and the neighbouring
countries is also important, since the share of foreign vehicles that buy fuel in
Slovenia is decreasing. In addition to the above-mentioned, there were also lower
emissions in agriculture, in particular due to smaller number of animals, and the
waste sector, in particular due to faster implementation of measures than envisaged
(faster reduction in deposited biodegradable waste). Implementation of measures
beyond 2020 is similar to older projections, since emissions in 2030, in contrast to
emissions in 2020, are 6% or 7% lower in all three projections (VI. NC and 2 BR
projections), while according to the projection in the Seventh National
Communication they are reduced by 9%. The emissions level of projection with
measures presented in this report is absolutely comparable to the projections in the
preceding report and the one before that, while the level of reduction between 2020
and 2030 is lower since emissions in 2020 are lower. Lower emissions in 2020 are the
result of lower growth of emissions in the context of economic recovery. The
projection with additional measures clearly stands out, reflecting more ambition with
regard to the emission reduction targets in line with the Paris Agreement.
Figure 22: Comparison of projections of the Sixth National Communication (VI. NC), the
second Biennial Report (BR 2) and the Seventh National Communication (VII. NC) with
projections in this report (BR 4)
5.8 Uncertainty in Projections Uncertainty in projections stems from the following: uncertainty in data applied as the
basis for projections (statistical data, emission factors); models applied in projections
which represent a simplified image of real-life developments; uncertainty in scenarios
regarding the implementation of policies and measures as the actual effect of
instruments is hard to foresee since they are subject to numerous factors that affect
them; and uncertainty in the future economic, technological, and social development
0,00
5,00
10,00
15,00
20,00
25,00
2005 2010 2015 2020 2025 2030 2035 2040 2045
Emis
ije
TGP
[kt
CO
2 e
kv]
Leto
Z ukrepi (VI. NC)
Z dod. ukrepi (VI. NC)
Z ukrepi (BR2)
Z ukrepi (VII. NC)
Z ukrepi (BR 4)
Z dod. ukrepi (BR 4)
106
which includes uncertainty in energy prices; the growth in energy supply and demand;
the behaviour of the main players on the market and other factors.
The source of great uncertainty is the scenario of future development of the gross
domestic product, which, in particular, has a major impact on energy use and thus
emissions in industry (fuel combustion and processes) and transport. The scenario
used in the projections was based on a scenario prepared by the European Commission
for the recent energy projections and revised so that it is more coherent with short-term
trends. Since short term projections are used for the purpose of planning the budget
the scenario is conservative. This is demonstrated by a comparison of the average
growth in added value in the 2015–2019 period with the estimated growth in the 2015–
2020 period. The actual average annual growth was 3.6%, while the projections foresaw
a 2.2% growth. It may be concluded that the projection of the added value
underestimates the economic growth of Slovenia, whereby indications of economic
cooling were present at the end of 2019, and also, on this basis, it is hard to conclude
that this also implies higher emissions since, as a result of higher added value, there
are more investment activities and, therefore more EEU and RES measures.
The results of emission projections for the energy sector is mostly subject to the
implementation of measures considered in regard to renewable sources of energy
and energy efficiency which will mostly depend on the funds available. The prices of
energy products and emission allowances, that have shown a very dynamic
movement in the past, exert a considerable impact. Great uncertainty is also
correlated with technological development, which is also related to the price of the
measures. The projections foresee that natural gas will be replaced by synthetic gas,
and it is envisaged that carbon capture will be installed at the coal power plant and
at the cement plant, despite the fact that the development of technology is faced with
large delays from the initial plans. Major technological developments are also
foreseen in other sectors (electricity storage devices, photovoltaics, building
insulation materials, etc.)
The largest uncertainty for Slovenia in the preparation of projections stems from the
transport sector. High uncertainty in projections regarding transport accounts for
transit transport, firstly, because modelling its volume is difficult, and secondly,
because the purchase of fuel for transit transport is a highly variable category which
mostly depends on the ratio between the prices for motor fuels in Slovenia and in
neighbouring countries. Transit transport has a significant impact on the Slovenian
energy balance due to the smallness of Slovenia. In 2008, when the sale of fuel to
transit transport reached its peak, sales of motor fuel to foreign vehicles in Slovenia
represented 30%. The uncertainty regarding transport is also the result of the
uncertainty regarding the implementation of measures in connection with the
transport policy in which little regard was given in the past for the promotion of
public transport and for the development of railway transport, in spite of plans, since
the main development axis was the construction of road network; additional
uncertainty is also caused by the introduction of new technologies in the transport –
electric vehicles, autonomous vehicles, mobility as a services, etc.
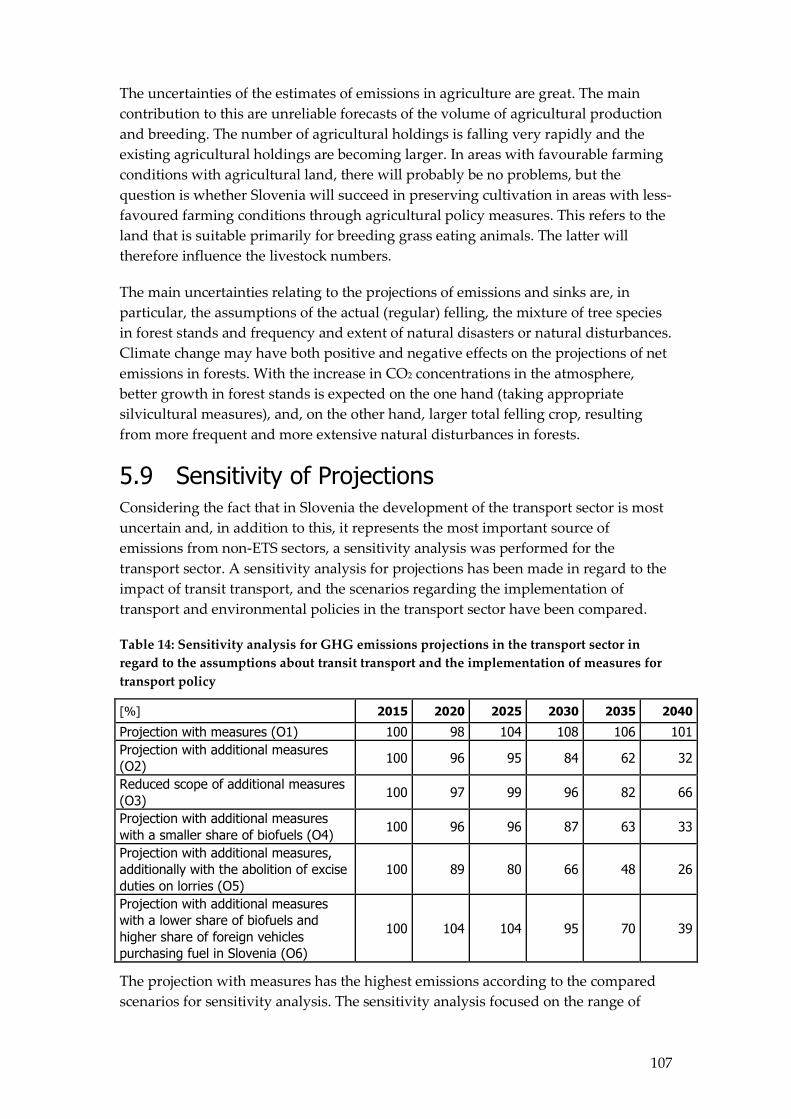
107
The uncertainties of the estimates of emissions in agriculture are great. The main
contribution to this are unreliable forecasts of the volume of agricultural production
and breeding. The number of agricultural holdings is falling very rapidly and the
existing agricultural holdings are becoming larger. In areas with favourable farming
conditions with agricultural land, there will probably be no problems, but the
question is whether Slovenia will succeed in preserving cultivation in areas with less-
favoured farming conditions through agricultural policy measures. This refers to the
land that is suitable primarily for breeding grass eating animals. The latter will
therefore influence the livestock numbers.
The main uncertainties relating to the projections of emissions and sinks are, in
particular, the assumptions of the actual (regular) felling, the mixture of tree species
in forest stands and frequency and extent of natural disasters or natural disturbances.
Climate change may have both positive and negative effects on the projections of net
emissions in forests. With the increase in CO2 concentrations in the atmosphere,
better growth in forest stands is expected on the one hand (taking appropriate
silvicultural measures), and, on the other hand, larger total felling crop, resulting
from more frequent and more extensive natural disturbances in forests.
5.9 Sensitivity of Projections Considering the fact that in Slovenia the development of the transport sector is most
uncertain and, in addition to this, it represents the most important source of
emissions from non-ETS sectors, a sensitivity analysis was performed for the
transport sector. A sensitivity analysis for projections has been made in regard to the
impact of transit transport, and the scenarios regarding the implementation of
transport and environmental policies in the transport sector have been compared.
Table 14: Sensitivity analysis for GHG emissions projections in the transport sector in
regard to the assumptions about transit transport and the implementation of measures for
transport policy
[%] 2015 2020 2025 2030 2035 2040
Projection with measures (O1) 100 98 104 108 106 101
Projection with additional measures
(O2) 100 96 95 84 62 32
Reduced scope of additional measures
(O3) 100 97 99 96 82 66
Projection with additional measures
with a smaller share of biofuels (O4) 100 96 96 87 63 33
Projection with additional measures,
additionally with the abolition of excise
duties on lorries (O5)
100 89 80 66 48 26
Projection with additional measures
with a lower share of biofuels and
higher share of foreign vehicles
purchasing fuel in Slovenia (O6)
100 104 104 95 70 39
The projection with measures has the highest emissions according to the compared
scenarios for sensitivity analysis. The sensitivity analysis focused on the range of

108
different scenarios of projections with additional measures. In 2030, a similar
reduction is achieved in scenario with reduced scope of implementing additional
measures (O3) (4% lower emissions compared to 2017) at the same level of
implementing additional measures as in the basic projection with additional
measures but with the same share of biofuels as in 2020 and a high share of transit
transport (O6) (5%). The lower share of biofuels alone (O4) does not have a major
impact (13%), while a significant reduction in the sale of fuel to foreign vehicles (O5)
would significantly reduce emissions (34%). The difference is reduced by 2040 due to
the increased use of fuels, which have a smaller CO2 print, with the exception of the
scenario with a lower level of implementing additional measures, which envisages a
slower introduction of alternative fuels (electricity, synthetic gas), which is reflected
in significantly higher emissions.
The sensitivity analysis of total emissions in regard to the transport scenarios
presented above has shown that the emission trend in transport has a significant
impact to total emissions. Emissions in 2030 according to the scenario, which
represents the upper sensitivity limit (O3), amount to 13.8Mt CO2 eq., which is 21%
less emissions than in 2017; however, emissions in 2030 according to the scenario,
which represents the lower sensitivity limit (O5), amount to 12.0Mt CO2 eq., which
are 31% lower than emissions in 2017. In 2040, the emissions range is maintained at a
similar level: emissions according to the scenario which represents the upper
sensitivity limit amount to 8.8Mt CO2 eq., and emissions according to the scenario
which represents the lower sensitivity limit amount to 6.4Mt CO2 eq.
Table 15: Sensitivity analysis for total GHG emissions projections in regard to the
assumptions about transit transport and the implementation of measures for sustainable
transport and environmental policy
[%] 2015 2020 2025 2030 2035 2040
Projection with measures 100 98 97 97 96 92
The projection with additional
measures 100 96 90 75 56 39
Reduced scope of additional measures 100 96 92 79 62 50
Projections with additional measures
with a smaller share of biofuels 100 96 91 76 56 39
Projections with additional measures,
additionally with the abolition of excise
duties on lorries
100 93 85 69 51 37
Projections with additional measures
with a lower share of biofuels and
higher share of foreign vehicles
purchasing fuel in Slovenia
100 98 93 79 58 41
An even greater impact is recorded by the sensitivity analysis regarding transport
emissions in case of non-ETS emissions since transport represents more than 50% of
these emissions. The reduction in emissions ranges from 14% to 30% in 2030 and
from 37% to 59% in 2040.
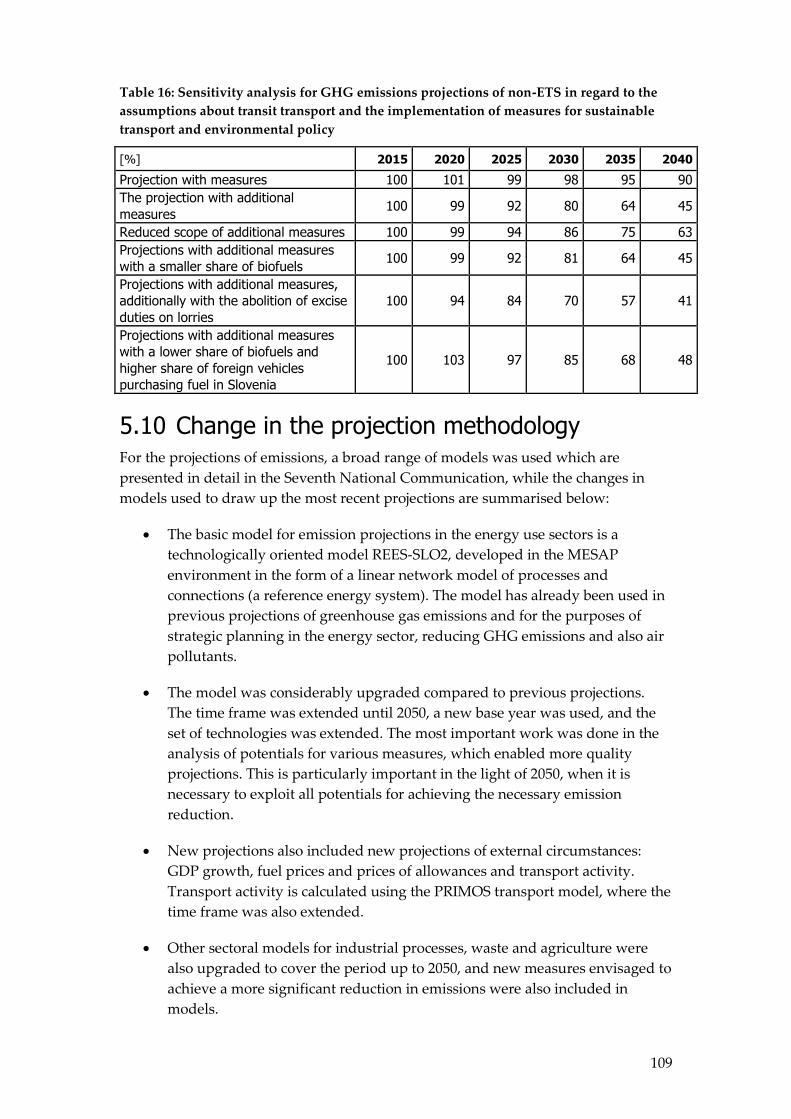
109
Table 16: Sensitivity analysis for GHG emissions projections of non-ETS in regard to the
assumptions about transit transport and the implementation of measures for sustainable
transport and environmental policy
[%] 2015 2020 2025 2030 2035 2040
Projection with measures 100 101 99 98 95 90
The projection with additional
measures 100 99 92 80 64 45
Reduced scope of additional measures 100 99 94 86 75 63
Projections with additional measures
with a smaller share of biofuels 100 99 92 81 64 45
Projections with additional measures,
additionally with the abolition of excise
duties on lorries
100 94 84 70 57 41
Projections with additional measures
with a lower share of biofuels and
higher share of foreign vehicles
purchasing fuel in Slovenia
100 103 97 85 68 48
5.10 Change in the projection methodology For the projections of emissions, a broad range of models was used which are
presented in detail in the Seventh National Communication, while the changes in
models used to draw up the most recent projections are summarised below:
The basic model for emission projections in the energy use sectors is a
technologically oriented model REES-SLO2, developed in the MESAP
environment in the form of a linear network model of processes and
connections (a reference energy system). The model has already been used in
previous projections of greenhouse gas emissions and for the purposes of
strategic planning in the energy sector, reducing GHG emissions and also air
pollutants.
The model was considerably upgraded compared to previous projections.
The time frame was extended until 2050, a new base year was used, and the
set of technologies was extended. The most important work was done in the
analysis of potentials for various measures, which enabled more quality
projections. This is particularly important in the light of 2050, when it is
necessary to exploit all potentials for achieving the necessary emission
reduction.
New projections also included new projections of external circumstances:
GDP growth, fuel prices and prices of allowances and transport activity.
Transport activity is calculated using the PRIMOS transport model, where the
time frame was also extended.
Other sectoral models for industrial processes, waste and agriculture were
also upgraded to cover the period up to 2050, and new measures envisaged to
achieve a more significant reduction in emissions were also included in
models.

110
A new model for preparing the LULUCF projections was developed and now
enables the preparation of projections for this sector by 2050. A Canadian
model49 was used, implementing the Tier 3 approach according to IPCC
guidelines ("Good Practice Guidance for reporting on carbon stocks and
carbon stock changes resulting from Land Use, Land-use Change and
Forestry").
The complete upgrade of models was carried out within the framework of the LIFE
ClimatePath2050 project, which was co-financed by the EU and the Ministry of the
Environment and Spatial Planning.
49 https://www.nrcan.gc.ca/climate-change/impacts-adaptations/climate-change-impacts-forests/carbon-accounting/carbon-budget-model/13107

111