Embed Size (px)
Citation preview

Slovenian Economic Mirror
IMAD
Economic Analyses/May 2008 No. 5, Vol. XIV
Slovenian Economic Mirror presents current macroeconomic developments as well as selected economic, social and environmental issues. The publication consists of articles, which present the main economic indicators, assess the realisation of the spring and autumn forecasts, and monitor implementation of economic policies (earnings, public finance, prices, competitiveness, etc.). The periodical is published monthly, except in September.
This issue of Slovenian Economic Mirror was prepared by:
Jure Brložnik (In the Spotlight, International Environment), Jože Markič (Balance of Payments – Current Account, Balance of Payments – Capital and Financial Account), Miha Trošt (Price Trends & Policy), Tomaž Kraigher (Labour Market), Saša Kovačič (Earnings), Katarina Ivas (Manufacturing), Janez Kušar (Construction), Judita Mirjana Novak (Performance of Companies and Cooperatives).
Director: Boštjan Vasle. Editor in Chief: Luka Žakelj. Translator: Marija Kavčič. Language Editing: Translation and Interpretation Division of the Secretariat-General of the Government of the RS. Technical Editors: Luka Žakelj, Ema Bertina Kopitar. Statistical Appendix, Data Preparation & Graphs: Bibijana Cirman Naglič, Marjeta Žigman. Distribution: Katja Ferfolja. Printed by: Tiskarna Štrok. Concept & Design: Sandi Radovan, Studio DVA. Circulation: 500 copies.
Institute of Macroeconomic Analysis and Development Gregorčičeva 27, 1000 Ljubljana (+386 1) 478 10 12 fax: 478 10 70 Editor in chief: [email protected] Translator: [email protected] Distribution: [email protected]
SEM can be found on the Internet at http://www.umar.gov.si/en/publications/slovenian_economic_mirror/zapisi/?no_cache=1 Publication is included in Ebsco Publishing Database and Internet Securities Database. © Institute of Macroeconomic Analysis and Development, 1995–2008. The contents of this publication may be reproduced in whole or in part provided that the source is acknowledged.

Contents Slovenian Economic Mirror IMAD
No. 5/2008 p. 2
In the Spotlight Growth of exports and production in manufacturing continued to moderate in March, while construction activity growth remained high
p. 3
International Environment Economic growth in the EMU in the first quarter remained at the same level as at the end of last year
p. 4
Balance of Payments – Current Account
The higher current account deficit in the first quarter was mainly due to the widening trade deficit
p. 5
Balance of Payments – Capital and Financial Account Increased net capital inflows from investment in securities p. 6
Price Trends & Policy Year-on-year inflation dropped in April, but remained relatively high p. 7 Labour Market Employment growth is slowing down according to seasonally adjusted data p. 8 Earnings Wage policy agreement for 2008 and 2009 in the private sector signed p. 9
Manufacturing Growth in the first quarter driven only by the chemical and automotive industries
p. 10
Construction Construction activity strengthened significantly in the first quarter p. 11
SELECTED TOPICS
Performance of Companies and Cooperatives
Performance of companies and cooperatives in 2007 the best in the 2002–2007 period
p. 15
Data: (pp. A 1–12), Main Indicators (p. A 13), International Comparisons (pp. A 14–15), Graphs (pp. A 16–17).
Selected indicators of current economic developments, change in %
Latest data
Compared to the
previous month
same period of previous year
latest data pre-latest data
pre-pre latest data
Industrial production (value based) III 3.3 1.7 4.3 0.6
Manufacturing III 3.2 1.9 4.6 0.8
Electricity, gas and water supply III -1.3 -3.4 -3.8 -7.2
Value of construction put in place, real terms III 10.6 33.0 40.1 38.7
Exports of goods (nominal terms)1 III 2.4 6.7 12.2 11.2
Imports of goods (nominal terms)1 III 3.8 10.7 16.0 16.5
Real effective exchange rate2 III 1.1 4.5 4.4 4.4
Gross wage per employee, real terms III 0.7 1.1 1.1 -0.3
Total household savings in banks,3 nominal terms III 1.2 10.8 9.5 9.8
General government revenue, real terms IV 36.3 5.1 4.9 5.5
Number of persons in paid employment III 0.4 3.5 3.5 3.5
Number of registered unemployed IV -2.9 -13.6 -13.5 -13.6
Number of job vacancies IV 9.5 5.6 5.7 19.4 Month current previous pre-previous Registered unemployment rate III 6.9 7.1 7.4 Month current cumulative annual4
Consumer prices V 1.1 3.2 6.4
Producer prices (domestic market) IV 0.7 3.2 6.1 Sources of data: SORS, BS, ESS, estimates and calculations by IMAD. Notes: 1balance of payments’ statistics; 2euro exchange rate for Slovenia
measured by relative consumer prices; the calculation of the effective exchange rate includes the currencies/prices of Slovenia's 17 trading partners (Austria, Belgium, Germany, Italy, France, Netherlands, Spain, Denmark, United Kingdom, Sweden, Czech Republic, Hungary, Poland,
Slovakia, USA, Switzerland, Japan); weights are the shares of individual trading partners in Slovenian exports and imports of goods within manufacturing (5–8 SITC) in 2001–2003; exports are double weighted; 3the year-on-year growth rate is defined as the ratio between the stock at
the end of the current month and the stock in the same month of the previous year; 4total in the last 12 months.

In the Spotlight Slovenian Economic Mirror IMAD
No. 5/2008 p. 3
In the first quarter of 2008, economic growth in the euro area remained at the same level as in the final three months last year and higher than projected in the European Commission’s April forecast. Real year-on-year GDP growth in the first three months this year was equal to the final quarter last year (2.2%). At the quarterly level, growth accelerated from 0.4% to 0.7% and thus exceeded the EC spring forecast. It was stronger than expected, mainly due to accelerated growth in Germany and France, which together account for almost one half of the economy in the euro area. A gradual moderation in economic growth is nevertheless expected this year, which is also evident from data on activity in manufacturing, construction and trade, where growth slowed gradually in the first quarter, as well as from the sentiment indicators, whose values are at their lowest since the end of 2005/beginning of 2006, when economic growth began to accelerate. According to the ECB, inflation, which was at 3.6% in May, will not see a notable decline before the second half of the year, due to continued high growth rates of food and energy prices (see p. 4). Some indicators show that economic activity in Slovenia slowed down in the first quarter; construction activity strengthened considerably. Quarterly growth of the value of construction works put in place was at its highest since 1999 in the first quarter of 2008, although the data on business trends did not suggest such growth at the beginning of the year. High construction activity was recorded in all segments, the highest in residential construction (see p. 11). Construction activity slowed down at the monthly level in March. In March, manufacturing production and exports moderated significantly as well, which contributed to a considerable decline in their growth rates in the first quarter. Year-on-year production growth in manufacturing dropped to 1.9%, from 6.1% in the final quarter last year. The value of the confidence indicator in manufacturing dropped again in May, to the level from the beginning of 2006, though it is still above the long-term average. In the first quarter this year, growth of production in manufacturing was propelled by the two highly export-oriented industries, the chemical industry and the manufacture of transport equipment, which together constituted almost a third of all merchandise exports. Other industries, which accounted for the remaining two thirds, recorded weak or negative growth. These developments in manufacturing thus match the considerable slowdown in growth rates of merchandise exports in the first quarter this year (see also p. 5 and 10). Growth of trade in goods and services in the first quarter slowed, largely due to weaker growth in goods flows. The deterioration of the trade balance is the main reason for the widening deficit in the current account of the balance of payments. Growth of external trade moderated in the first quarter as expected. Year-on-year nominal growth of goods exports and imports dropped to 6.0% and 10.4%, respectively (compared to 18.2% and 18.0% in the first quarter last year). The trade deficit therefore widened. Almost two thirds of the deterioration is attributable to worsened terms of trade. On the other hand, strong growth rates in exports as well as imports of services have continued for the fifth quarter in a row, and the services trade surplus is widening as well. The current account deficit also widened in
the first three months this year (by EUR 260.3 m y-o-y), largely owing to the higher trade deficit (see p. 5) Net capital imports in the first quarter were almost a fifth higher than in the same period last year. High net capital imports largely resulted from the issue of a new benchmark government bond with a nominal value of EUR 1 bn. The other reason for the increase is further net borrowing of commercial banks abroad, posting an increase in long-term as well as in short-term loans. The value of short-term loans in the first quarter was seven times higher year-on-year, while banks net repaid long-term loans in the first quarter last year. Net inflow of foreign direct investment also increased year on year in the first three months, mainly due to the year-on-year decline in domestic direct investment abroad as a result of lesser financing of foreign-affiliated enterprises, but also a somewhat higher inflow of foreign direct investment to Slovenia (see p. 6). Favourable developments on the labour market continued in the first quarter of 2008 as well. The number of persons in formal employment was 3.4% higher than a year ago. The registered unemployment rate thus dropped again, to 6.9%; the number of unemployed persons was more than 10,000 lower year on year. The data from the labour force survey also show that employment increased and unemployment dropped year on year (in the first quarter, the number of persons in formal employment increased by 1.4%, year on year); the survey unemployment rate (5.1%) decreased by 0.6 p.p. At the same time, seasonally adjusted survey-based data already indicate a gradual moderation compared to the final quarter last year (see also p. 8). Wages rose by a nominal 2.0% in March as a consequence of the increase in the private sector, while in the public sector they declined after February’s rise on account of the offset. Wage developments in March mainly resulted from one-off factors, as wages in the private sector increased mainly thanks to the disbursement of bonuses related to last year’s performance, whereas wages in the public sector dropped as a consequence of the base effect due to the offset in February (see p. 9). Inflation dropped by 0.5 p.p. over the last two months, but remained relatively high in May (6.4%). Consumer prices increased by 1.1% in May (compared to 1.2% in May, 2007), principally as a result of higher oil prices and partly due to seasonal factors (clothing and footwear, recreation and culture, fruit and vegetables). Against the background of these developments, prices continue to surge; compared to the same period last year, stronger growth of prices has been observed in as many as eight out of the twelve price index groups. The risks are increasing in both the international and domestic environment, by our estimate, which suggests that inflation will moderate at a slower pace than projected at the beginning of the year. Namely, the recent price trends and forecasts for 2008 suggest even stronger growth of commodity prices on global markets than last year. The moderation of inflation will crucially depend on developments of commodity prices on global markets in the following months, but the measures adopted in the area of public finances and wages will play a significant role as well.

International Environment Slovenian Economic Mirror IMAD
No. 5/2008 p. 4
Real GDP growth – comparison of forecasts and IMAD’s assumptions
2007 2008 2009
IMF Oct. 07
EC Nov. 07
EC Feb. 08
IMAD Mar. 08
IMFApr. 08
ECApr. 08
CONSMay 08
ECNov. 07
IMAD Mar. 08
IMF Apr. 08
EC Apr. 08
CONS May 08
EU 2.8 N/A 2.4 2.0 1.9 N/A 2.0 1.9 2.4 2.1 N/A 1.8 1.8 EMU 2.6 2.1 2.2 1.8 1.6 1.4 1.7 1.5 2.1 1.9 1.2 1.5 1.6 Germany 2.5 2.0 2.1 1.6 1.6 1.4 1.8 1.7 2.2 1.9 1.0 1.5 1.5 Italy 1.5 1.3 1.4 0.7 0.7 0.3 0.5 0.6 1.6 1.4 0.3 0.8 1.0 Austria 3.4 2.5 2.7 N/A 2.4 1.9 2.2 2.1 2.4 2.3 1.7 1.8 2.1 France 1.9 2.0 2.0 1.7 1.6 1.4 1.6 1.5 1.8 1.9 1.2 1.4 1.7 USA 2.2 1.9 1.7 N/A 1.2 0.5 0.9 1.3 2.6 2.4 0.6 0.7 1.9 Source of data: Eurostat; IMAD – assumptions from the Spring Forecast (March 2008); EC Autumn Forecast (November 2007); EC Interim Forecast
(February 2008); EC Spring Forecast (April 2008); IMF World Economic Outlook (October 2007; April 2008); Consensus Forecasts (May 2008).
In the first quarter, economic growth in the euro area remained at the same level as at the end of last year (2.2%). Against the background of further rapid oil price rises, inflation is not likely to decrease significantly in the short run. According to Eurostat’s first estimate, real GDP growth in the euro area in the first three months was equal to the final quarter last year and 0.3 p.p. higher than projected in the European Commission’s spring forecast (see Graph 1). At the quarterly level, growth accelerated from 0.4% to 0.7% and was thus 0.4 p.p. above the EC February interim forecast. Inflation rose again in May (from 3.3% in April to 3.6%) and will, according to the ECB, remain well above the target 2.0 figure in 2008. As strong growth of commodity prices is likely to continue, inflation will only be gradually approaching the target this year. The depreciation of the US dollar, which was one of the main drivers of commodity price rises this year, stopped in May, as the euro depreciated against the dollar by 1.2%. Oil prices saw new record highs in May (USD 135/barrel), when the monthly average price of a barrel of Brent crude was 82% higher than the year before. Due to stronger growth of agricultural commodities at the beginning of the year, the Economist Intelligence Unit, like the European Commission last month, also revised upwards its forecast of this year’s average growth of agricultural commodity prices, from 7.0% in November to 40.3% in May (see Graph 2). As regards the main trading partners from the euro area, economic growth in the first quarter was stronger than expected in Germany and France, while growth in other main EMU members was slowing. In Germany, year-on-year growth accelerated significantly in the first quarter (from 1.8% to 2.6%). At the quarterly level, it reached a 12-year high (1.5%), being as much as five times higher than in the final three months of last year. According to the quarterly growth figures, the main driver of growth was investment (having contributed 50% to total
growth), due to accelerated growth in construction investment, as well as investment in machinery and equipment. Despite record inflation, private consumption also witnessed a slight increase, as the sale of motor vehicles rebounded after stagnating for quite some time. The stronger euro and cooling of the global economy had a negative impact on growth of exports, which was slower than that of imports, resulting in a negative contribution of external trade for the first time in a year. In France, year-on-year GDP growth at the beginning of the year was also above the assumptions of the European Commission and equal to the final quarter of 2007 (2.2%). Quarterly growth was twice as high as in the final quarter last year (0.6%). Exports strengthened significantly and the contribution of external trade was positive for the second quarter in a row. However, growth of private consumption, which was the main driver of growth over the last years, declined notably due to strong growth of prices. In Italy, GDP growth stagnated in the last two quarters (0.1% and 0.2%, y-o-y), due to considerably lower growth rates posted by all components of the expenditure side of GDP. Even though GDP growth in the first quarter was higher than expected, most indicators show that economic growth in the euro area and in all our main partners will moderate gradually. Since January, a gradual, but significant decline has been seen in growth of industrial production, construction and retail trade in the entire euro area as well as in our main trading partners. At the monthly level, these activities recorded negative growth in the euro area in March. The expected moderation in growth is also corroborated by most sentiment indicators, which have reached their lowest values since the end of 2005, when economic growth started to accelerate. The sentiment indicators have been affected mainly by high energy and food price rises, the strong euro and tightening credit conditions.
Graph 1: Year-on-year GDP growth in the EMU Graph 2: Year-on-year growth of the EIU food-price index
9.1
13.716.4
24.8
20.4 18.9
35.4
46.0
69.5
61.1
32.4
11.3
-5.6
-5.3
-3.4
-1.3
-1.9
1.0
-10
0
10
20
30
40
50
60
70
80
Q1 06
Q2 Q3 Q4 Q1 07
Q2 Q3 Q4 Q1 08
Q2 Q3 Q4 Q1 09
Q2 Q3 Q4 Q1 10
Q2
%
Source of data: Economist Intelligence Unit.
2.5
2.9
2.8
3.2 3.2
2.5
2.7
2.2
2.2
1.9 1.8
1.5 1.5
1.41.5
1.6
1.7
1.0
1.5
2.0
2.5
3.0
3.5
Q1 2006
Q2 Q3 Q4 Q1 2007
Q2 Q3 Q4 Q1 2008
Q2 Q3 Q4 Q1 2009
Q2 Q3 Q4
%
Source of data: Eurostat, Consensus Forecasts, EC.
Feb. 07
Nov. 07
Feb. 08
May 08
Actual
Cons. (Mar. 08)
EC (Apr. 08)
EC (Nov. 07)

Slovenian Economic Mirror IMAD Balance of Payments – Current Account
No. 5/2008 p. 5
Balance of Payments, Jan-Mar 2008, EUR million Inflows Outflows Balance1 Balance Jan-Mar 2007 Current account 6,544.5 7,165.2 -620.7 -260.3
Trade balance (FOB) 5,102.6 5,566.8 -464.3 -246.3 Services 988.2 765.3 223.0 204.5
Transport 322.2 181.8 140.3 111.5 Travel 298.5 168.9 129.7 136.6 Other services 367.5 414.5 -47.0 -43.7
Labour and capital income 278.6 486.9 -208.3 -142.8 Current transfers 175.1 346.2 -171.1 -75.7 Source of data: BS. Note: 1a minus sign (-) in the balance indicates a surplus of imports over exports in the current account and an increase in
assets in the capital and financial account and the central bank’s international reserves.
The current account deficit is widening. The higher year-on-year deficit in the first quarter this year was mainly due to a higher trade deficit. The deficits in current transfers and factor incomes strengthened as well, though to a somewhat lesser extent. The services trade surplus widened somewhat, which alleviated the deterioration of the external imbalance. Growth of trade in goods and services slowed in the first quarter this year. Year-on-year growth of international trade (10.3% compared to 16.5% in the same period last year) was largely affected by a lower increase in goods trade flows, whereas growth of services trade flows remained high. Goods exports, which were mainly influenced by lower demand in EU member states, were up 6.0% in nominal terms, year on year (to EU countries by 4.1%, to non-members by 11.0%). The slowdown in year-on-year nominal growth of goods imports was less notable. In addition to the otherwise weak growth of domestic industrial production, this is linked to high import prices and, according to the available figures for the first two months, also to continued relatively strong growth of investment goods imports and strengthened imports of consumer goods. In nominal terms, goods imports were up 10.4% year on year (from EU countries by 8.6%, from non-members by 17.6%). The trade deficit widened by EUR 218 m year on year in the first quarter of 2008; within that, around EUR 150 m came on account of deteriorated terms of trade. Looking at the regional structure, the deficit in trade with EU countries widened (by EUR 190.5 m, to EUR 725.5 m) and the surplus in trade with non-member states narrowed (by EUR 27.5 m, to EUR 261.2 m). Services trade flows have recorded high growth
rates for the fifth quarter in a row. In the first quarter, exports and imports of services rose year on year by a respective 19.2% and 22.5% in nominal terms. In both exports and imports, the strongest growth was achieved in the group of other services (26.8%). Growth of transport services was also high (18.9%). Strong growth of these services is partly attributable to road vehicle trade, which is also on the increase this year. The services trade surplus increased year on year, largely due to net exports of road transport and merchanting services. The deficit in factor incomes widened, largely as a result of commercial banks’ net payments of interest on foreign loans. Although banks’ interest receipts from loans given to the rest of the world also increased, their interest payments were higher due to strong borrowing abroad and the rising interest rates. In the first quarter this year, the net paid interest of commercial banks to the rest of the world accounted for 64.6% of all net payments of interest on foreign loans. The deficit in current transfers was due to the higher deficit of the government sector. Slovenia received EUR 48.2 m from the EU budget in the first quarter this year (compared to EUR 86.2 m in the same period last year), mainly due to a smaller volume of funds appropriated for implementing the common agricultural policy and internal policy. Payments to the EU budget totalled EUR 127.7 m (compared to EUR 100 m in the same period last year). Gross-national-income-based payments recorded the highest increase. Slovenia’s net budgetary position to the EU budget thus recorded a deficit of EUR 79.6 m, up 65.8 m over the same period last year.
Graph: Dynamics of terms of trade, year-on-year indices
90
92
94
96
98
100
102
104
106
108
Jan 2007
Feb Mar Apr May Jun Jul Aug Sep Oct Nov Dec Jan 2008
Feb Mar Sources of data:
SORS, BS, calculations by IMAD.
Terms of trade
Index of export prices
Index of import prices
Slovenian Economic Mirror IMAD Balance of Payments – Capital & Financial Account
No. 5/2008 p. 6
Balance of Payments, Jan-Mar 2008, EUR million Inflows Outflows Balance1 Balance, Jan-Mar 2007Capital and financial account 2,264.0 -1,835.9 428.1 499.9
Capital account 58.6 -60.5 -1.9 14.8 Capital transfers 57.5 -59.0 -1.5 15.4 Patents, Licences 1.1 -1.5 -0.4 -0.6
Financial account 2,205.4 -1,775.4 430.0 485.1 Direct investment 259.5 -137.1 122.4 -120.2 Portfolio investment 821.5 -655.6 165.9 -623.3 Financial derivatives 0.0 2.4 2.4 2.0 Other investment 1,124.4 -903.8 220.6 1,171.8
Assets 60.7 -895.2 -834.5 -2,311.3 Liabilities 1,063.7 -8.6 1,055.1 3,483.1
International reserves (BS) 0.0 -81.3 -81.3 54.8 Statistical error 192.6 0.0 192.6 -239.5
Source of data: BS. Note: 1a minus sign (-) in the balance indicates the surplus of imports over exports in the current account and the rise in assets in the capital and financial account and the central bank’s international reserves.
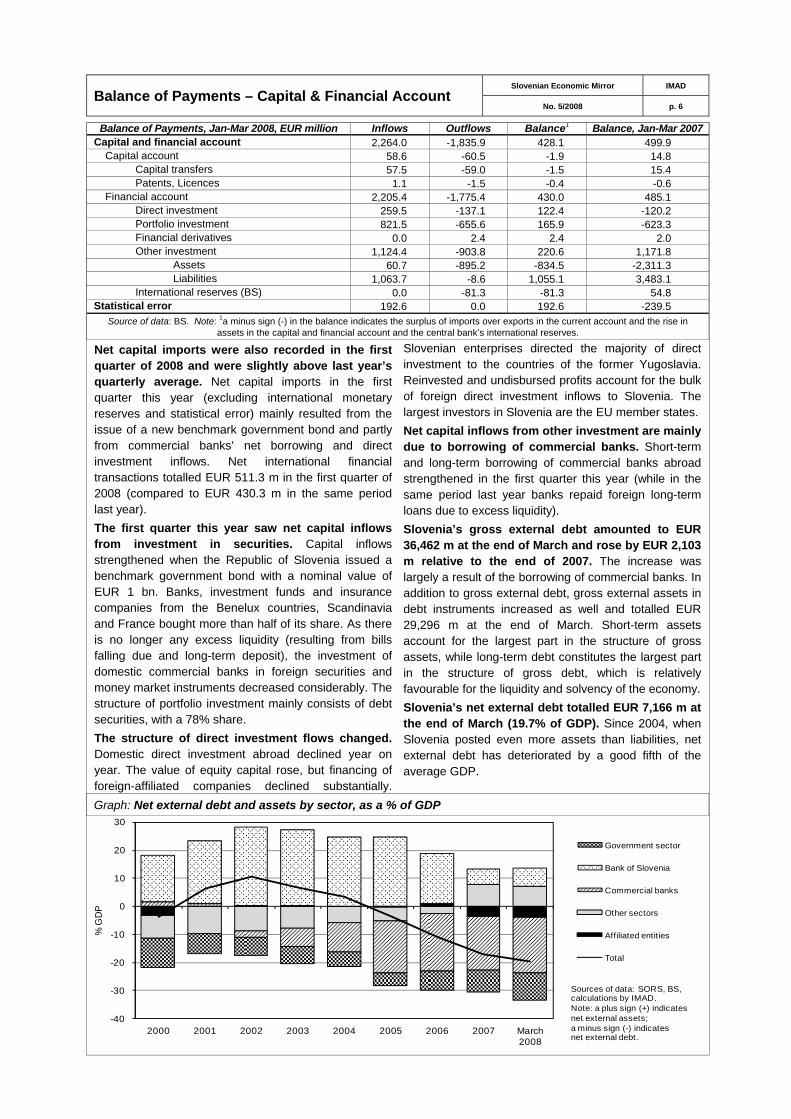
Net capital imports were also recorded in the first quarter of 2008 and were slightly above last year’s quarterly average. Net capital imports in the first quarter this year (excluding international monetary reserves and statistical error) mainly resulted from the issue of a new benchmark government bond and partly from commercial banks’ net borrowing and direct investment inflows. Net international financial transactions totalled EUR 511.3 m in the first quarter of 2008 (compared to EUR 430.3 m in the same period last year). The first quarter this year saw net capital inflows from investment in securities. Capital inflows strengthened when the Republic of Slovenia issued a benchmark government bond with a nominal value of EUR 1 bn. Banks, investment funds and insurance companies from the Benelux countries, Scandinavia and France bought more than half of its share. As there is no longer any excess liquidity (resulting from bills falling due and long-term deposit), the investment of domestic commercial banks in foreign securities and money market instruments decreased considerably. The structure of portfolio investment mainly consists of debt securities, with a 78% share. The structure of direct investment flows changed. Domestic direct investment abroad declined year on year. The value of equity capital rose, but financing of foreign-affiliated companies declined substantially.
Slovenian enterprises directed the majority of direct investment to the countries of the former Yugoslavia. Reinvested and undisbursed profits account for the bulk of foreign direct investment inflows to Slovenia. The largest investors in Slovenia are the EU member states. Net capital inflows from other investment are mainly due to borrowing of commercial banks. Short-term and long-term borrowing of commercial banks abroad strengthened in the first quarter this year (while in the same period last year banks repaid foreign long-term loans due to excess liquidity). Slovenia’s gross external debt amounted to EUR 36,462 m at the end of March and rose by EUR 2,103 m relative to the end of 2007. The increase was largely a result of the borrowing of commercial banks. In addition to gross external debt, gross external assets in debt instruments increased as well and totalled EUR 29,296 m at the end of March. Short-term assets account for the largest part in the structure of gross assets, while long-term debt constitutes the largest part in the structure of gross debt, which is relatively favourable for the liquidity and solvency of the economy. Slovenia’s net external debt totalled EUR 7,166 m at the end of March (19.7% of GDP). Since 2004, when Slovenia posted even more assets than liabilities, net external debt has deteriorated by a good fifth of the average GDP.
Graph: Net external debt and assets by sector, as a % of GDP
-40
-30
-20
-10
0
10
20
30
2000 2001 2002 2003 2004 2005 2006 2007 March 2008
% G
DP
Government sector
Bank of Slovenia
Commercial banks
Other sectors
Affiliated entities
Total
Sources of data: SORS, BS, calculations by IMAD. Note: a plus sign (+) indicates net external assets; a minus sign (-) indicates net external debt.
Price Trends and Policy Slovenian Economic Mirror IMAD
No. 5/2008 p. 7
Price indices 2007 2008
XII 2007/ XII 2006
Φ (I 07–XII 07)/Φ (I 06–XII 06)
IV 2008/ III 2008
IV 2008/ IV 2007
Φ (V 07–VI 08)/Φ (V 06–VI 07)
Consumer prices (CPI) 105.6 103.6 100.8 106.5 105.0 Goods 106.0 103.2 100.9 106.8 105.0
Fuel and energy 109.8 103.1 100.8 109.9 106.9 Other 105.2 103.2 100.9 106.1 104.6
Services 104.8 104.5 100.4 105.9 105.0 Consumer prices (HICP) 105.7 103.8 100.7 106.2 105.0 Administered prices1 107.2 102.6 100.8 110.3 105.2
Energy 109.6 102.7 101.1 115.2 107.3 Other 101.5 102.4 100.4 100.6 100.9
Core inflation: - trimmean 103.2 102.3 100.6 104.3 103.2 - excluding food & energy 104.0 102.7 100.6 105.3 103.7
Consumer prices in the EMU 103.1 102.1 100.3 103.3 102.6 Producer prices of domestic manufacturers:
- domestic market 106.3 105.4 100.7 106.2 105.8 - EMU 100.9 105.0 100.1 100.4 103.0
Sources of data: CPI, HICP, IPI: SORS; administered prices and core inflation: IMAD estimate; MUICP in the EU: Eurostat (provisional data) and IMAD recalculation. Note: 1figures are not directly comparable between years due to the annual changes of the administered prices index.
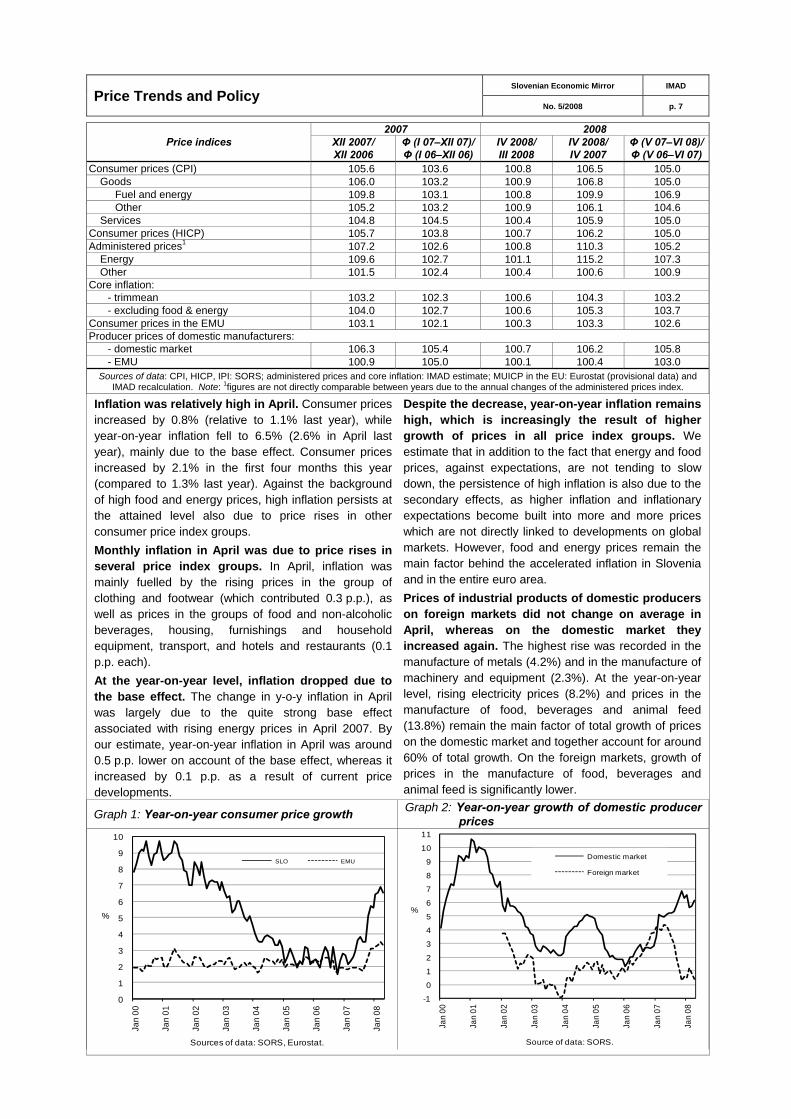
Inflation was relatively high in April. Consumer prices increased by 0.8% (relative to 1.1% last year), while year-on-year inflation fell to 6.5% (2.6% in April last year), mainly due to the base effect. Consumer prices increased by 2.1% in the first four months this year (compared to 1.3% last year). Against the background of high food and energy prices, high inflation persists at the attained level also due to price rises in other consumer price index groups. Monthly inflation in April was due to price rises in several price index groups. In April, inflation was mainly fuelled by the rising prices in the group of clothing and footwear (which contributed 0.3 p.p.), as well as prices in the groups of food and non-alcoholic beverages, housing, furnishings and household equipment, transport, and hotels and restaurants (0.1 p.p. each). At the year-on-year level, inflation dropped due to the base effect. The change in y-o-y inflation in April was largely due to the quite strong base effect associated with rising energy prices in April 2007. By our estimate, year-on-year inflation in April was around 0.5 p.p. lower on account of the base effect, whereas it increased by 0.1 p.p. as a result of current price developments.
Despite the decrease, year-on-year inflation remains high, which is increasingly the result of higher growth of prices in all price index groups. We estimate that in addition to the fact that energy and food prices, against expectations, are not tending to slow down, the persistence of high inflation is also due to the secondary effects, as higher inflation and inflationary expectations become built into more and more prices which are not directly linked to developments on global markets. However, food and energy prices remain the main factor behind the accelerated inflation in Slovenia and in the entire euro area. Prices of industrial products of domestic producers on foreign markets did not change on average in April, whereas on the domestic market they increased again. The highest rise was recorded in the manufacture of metals (4.2%) and in the manufacture of machinery and equipment (2.3%). At the year-on-year level, rising electricity prices (8.2%) and prices in the manufacture of food, beverages and animal feed (13.8%) remain the main factor of total growth of prices on the domestic market and together account for around 60% of total growth. On the foreign markets, growth of prices in the manufacture of food, beverages and animal feed is significantly lower.
Graph 1: Year-on-year consumer price growth Graph 2: Year-on-year growth of domestic producer prices
-1
0
1
2
3
4
5
6
7
8
9
10
11
Jan
00
Jan
01
Jan
02
Jan
03
Jan
04
Jan
05
Jan
06
Jan
07
Jan
08
%
Source of data: SORS.
0
1
2
3
4
5
6
7
8
9
10
Jan
00
Jan
01
Jan
02
Jan
03
Jan
04
Jan
05
Jan
06
Jan
07
Jan
08
%
Sources of data: SORS, Eurostat.
Domestic marketSLO EMU
Foreign market
Slovenian Economic Mirror IMAD Labour Market
No. 5/2008 p. 8
Selected labour market indicators Thousands of people Growth, in %
I–XII 2007
III 2007
XII 2007
III 2008
III 2008/ II 2008
I–III 2008/ I–III 2007
Φ 2007/ Φ 2006
A Registered labour force (A=B+C) 925.3 920.0 932.8 938.5 0.1 2.0 1.6
B
Persons in formal employment* 854.0 845.8 864.4 874.2 0.4 3.5 3.5 in enterprises and organisations 696.1 689.0 705.9 713.0 0.3 3.6 3.1 by those self-employed 69.9 68.0 70.8 71.3 0.8 5.1 5.1 self-employed and farmers 87.9 88.8 87.7 89.9 0.3 1.1 5.6
C
Registered unemployed 71.3 74.2 68.4 64.3 -4.0 -13.5 -16.9 women 39.1 40.7 36.7 34.3 -3.7 -15.2 -16.7 aged over 40 37.1 38.1 36.3 35.6 -2.2 -6.0 -6.5 unemployed more than 1 year 36.5 37.9 34.7 33.3 -2.2 -12.5 -12.8
D Rate of reg. unemployment (C/A), in % 7.7 8.1 7.3 6.9 - - -
male 6.3 6.6 6.1 5.7 - - - female 9.6 10.0 8.9 8.3 - - -
E Job vacancies 20.2 23.6 14.2 19.8 8.4 5.7 6.6 for a fixed term, in % 76.3 77.5 69.8 74.2 - - -
F
Number of persons hired 13.3 13.9 9.7 13.4 3.6 4.6 2.6 lower education 4.1 4.6 2.6 4.5 6.5 8.2 5.2 secondary education 7.2 7.5 5.6 7.3 2.3 3.0 1.7 tertiary education 2.0 1.8 1.5 1.7 2.2 3.4 1.1
Sources of data: SORS, ESS; calculations by IMAD. Note: *persons in employment according to administrative sources.
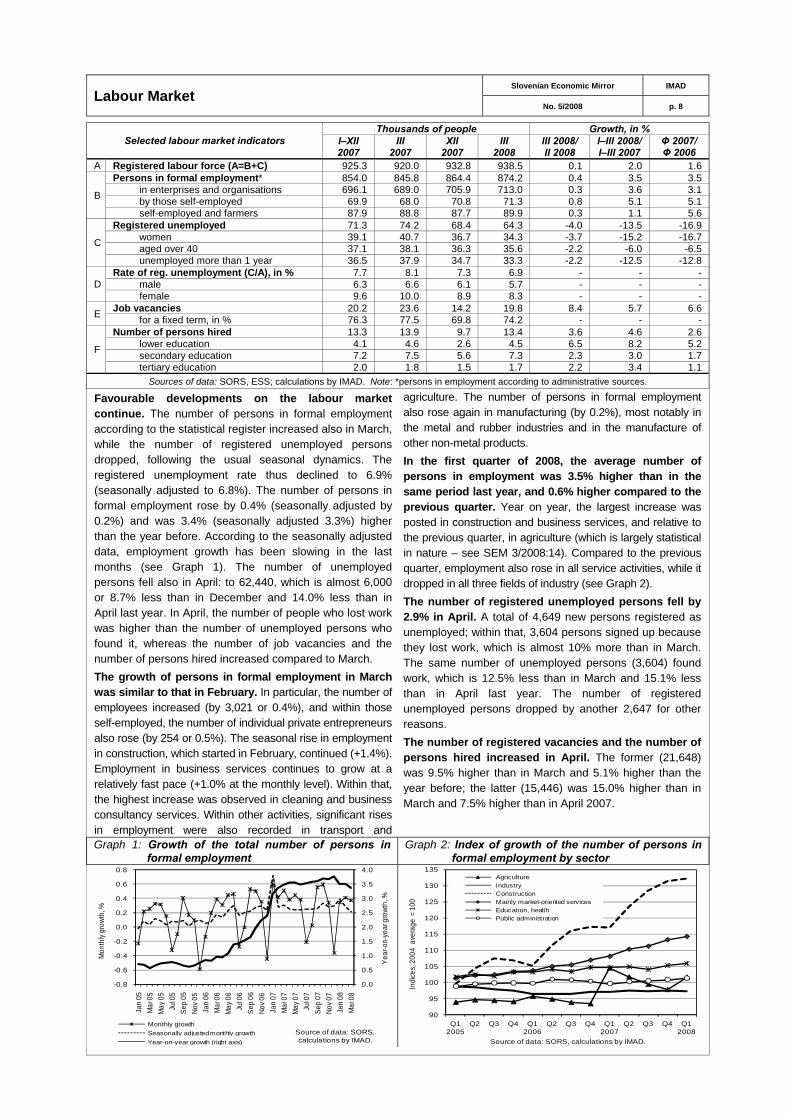
Favourable developments on the labour market continue. The number of persons in formal employment according to the statistical register increased also in March, while the number of registered unemployed persons dropped, following the usual seasonal dynamics. The registered unemployment rate thus declined to 6.9% (seasonally adjusted to 6.8%). The number of persons in formal employment rose by 0.4% (seasonally adjusted by 0.2%) and was 3.4% (seasonally adjusted 3.3%) higher than the year before. According to the seasonally adjusted data, employment growth has been slowing in the last months (see Graph 1). The number of unemployed persons fell also in April: to 62,440, which is almost 6,000 or 8.7% less than in December and 14.0% less than in April last year. In April, the number of people who lost work was higher than the number of unemployed persons who found it, whereas the number of job vacancies and the number of persons hired increased compared to March. The growth of persons in formal employment in March was similar to that in February. In particular, the number of employees increased (by 3,021 or 0.4%), and within those self-employed, the number of individual private entrepreneurs also rose (by 254 or 0.5%). The seasonal rise in employment in construction, which started in February, continued (+1.4%). Employment in business services continues to grow at a relatively fast pace (+1.0% at the monthly level). Within that, the highest increase was observed in cleaning and business consultancy services. Within other activities, significant rises in employment were also recorded in transport and
agriculture. The number of persons in formal employment also rose again in manufacturing (by 0.2%), most notably in the metal and rubber industries and in the manufacture of other non-metal products. In the first quarter of 2008, the average number of persons in employment was 3.5% higher than in the same period last year, and 0.6% higher compared to the previous quarter. Year on year, the largest increase was posted in construction and business services, and relative to the previous quarter, in agriculture (which is largely statistical in nature – see SEM 3/2008:14). Compared to the previous quarter, employment also rose in all service activities, while it dropped in all three fields of industry (see Graph 2). The number of registered unemployed persons fell by 2.9% in April. A total of 4,649 new persons registered as unemployed; within that, 3,604 persons signed up because they lost work, which is almost 10% more than in March. The same number of unemployed persons (3,604) found work, which is 12.5% less than in March and 15.1% less than in April last year. The number of registered unemployed persons dropped by another 2,647 for other reasons. The number of registered vacancies and the number of persons hired increased in April. The former (21,648) was 9.5% higher than in March and 5.1% higher than the year before; the latter (15,446) was 15.0% higher than in March and 7.5% higher than in April 2007.
Graph 1: Growth of the total number of persons in formal employment
Graph 2: Index of growth of the number of persons in formal employment by sector
90
95
100
105
110
115
120
125
130
135
Q1 2005
Q2 Q3 Q4 Q1 2006
Q2 Q3 Q4 Q1 2007
Q2 Q3 Q4 Q1 2008
Indi
ces,
200
4 a
vera
ge =
100
Source of data: SORS, calculations by IMAD.
0.0
0.5
1.0
1.5
2.0
2.5
3.0
3.5
4.0
-0.8
-0.6
-0.4
-0.2
0.0
0.2
0.4
0.6
0.8
Jan
05M
ar 0
5M
ay 0
5Ju
l 05
Sep
05No
v 05
Jan
06M
ar 0
6M
ay 0
6Ju
l 06
Sep
06No
v 06
Jan
07M
ar 0
7M
ay 0
7Ju
l 07
Sep
07No
v 07
Jan
08M
ar 0
8
Year
-on-
year
gro
wth,
%
Mon
thly
grow
th, %
Source of data: SORS, calculations by IMAD.
AgricultureIndustryConstruction Mainly market-oriented servicesEducation, healthPublic administration
Monthly growthSeasonally adjusted monthly growthYear-on-year growth (right axis)

Earnings Slovenian Economic Mirror IMAD
No. 5/2008 p. 9
Gross wage per employee, growth index
Wages in EUR
III 2008
In nominal terms In real terms1 III 08/ II 08
III 08/ III 07
I–III 08/ I–III 07
III 08/ II 08
III 08/ III 07
I–III 08/ I–III 07
Gross wage per employee, total 1,352.87 102.0 108.0 107.8 100.7 101.0 101.1 Private sector (activities A–K) 1,284.69 103.3 108.5 108.3 102.0 101.5 101.6 A Agriculture 1,092.02 96.7 106.7 110.2 95.5 99.8 103.4 B Fisheries 1,046.89 101.9 114.0 106.8 100.6 106.6 100.1 C Mining and quarrying 1,721.33 104.8 114.1 110.1 103.5 106.8 103.3 D Manufacturing 1,192.00 103.4 108.5 108.2 102.1 101.5 101.5 E Electricity, gas, and water supply 1,625.09 101.7 108.3 109.0 100.4 101.3 102.3 F Construction 1,106.83 102.3 106.6 107.5 101.0 99.7 100.8 G Distributive trades 1,223.14 102.5 107.0 107.4 101.2 100.1 100.8 H Hotels and restaurants 985.03 101.6 108.7 110.1 100.3 101.7 103.3 I Transport, storage & communications 1,488.83 106.7 109.6 107.7 105.3 102.5 101.0 J Financial intermediation 2,026.60 104.9 110.7 108.1 103.6 103.6 101.4 K Real estate, renting, business services 1,447.32 102.5 109.6 109.5 101.2 102.5 102.7 Public services (activities L–O) 1,557.79 99.2 107.2 107.1 97.9 100.3 100.5 L Public administration 1,618.99 98.2 112.0 111.1 97.0 104.8 104.2 M Education 1,615.03 98.7 105.6 105.5 97.5 98.8 99.0 N Health and social work 1,460.51 100.6 106.7 106.1 99.3 99.8 99.5 O Other social and personal services 1,467.42 100.3 101.8 104.5 99.0 95.2 98.1
Source of data: SORS and IMAD calculations for the private sector and public services. Note: 1deflated by the consumer price index.
In March, the gross wage per employee increased by 2% in nominal terms and, given the 1.3% monthly inflation, by 0.7% in real terms. The wage increase in the private sector (activities A to K) was expected, even though the number of working days was the same as in February. In this sector, earnings tend to be higher in March, as companies evaluate their performance and wages may increase due to one-off payments based on good business results. Payments for overtime work also increased relative to February, by 13%. The gross wage in this sector thus increased by 3.3% in nominal and 2% in real terms. The disparities in gross wage increases between activity groups were not significant. In industry and construction (activities C, D, E, F), the gross wage increased by 3.2% in nominal terms and somewhat more, by 3.3%, in business services (activities J, K). The highest rise (3.7%) was posted in production services (activities G, H, I). In public services (activities L to O), the gross wage declined by 0.8% in nominal terms, and by 2.1% in real terms due to the base effect, as February’s gross wage increased also on account of the adjustment for January to compensate for last year’s inflation, which was higher than foreseen (by 3.4%; see SEM 4/2008: 12). The largest drop in gross wages was observed in public administration, which had posted the most notable wage increase in February. Wages in education declined somewhat less, while wages in health and social work even rose slightly, which may be due to a greater extent of overtime work and hours worked on duty. In the first quarter of 2008, the gap between wage rises in the private sector (8.3%) and in the public sector (7.1%) narrowed relative to the same period last year (6.3% and 3.5%, respectively). The smaller lag of this year’s wage growth in public services is already a result of January’s extraordinary 3.4% adjustment to actual inflation in 2007, which was higher than projected. In the private sector, employers and trade unions also agreed upon an extraordinary adjustment (4.7%) in January, but the agreement was not signed. The extraordinary increase was nevertheless realised at the level of certain activities. The employers and trade unions have meanwhile come to an agreement and the Collective Agreement on the Wage
Adjustment Mechanism, reimbursement of work-related costs and holiday allowances for 2008 and 2009 was signed at the end of May. Compared to January, a somewhat higher adjustment (by 5.2%) was agreed upon for the difference between last-year’s projected and actual inflation (year-on-year inflation in December 2007 was 5.6%). All basic wages are set to rise, but the adjustment percentage will be reduced by the already effected increase in basic wages for this purpose. In the adjustment mechanism for 2008 and 2009, the starting-level wage or the lowest basic wage will be taken into account as the basis for the increase. In August 2008, the base will be raised by 3.9% and, in the event of higher inflation, again in January next year, by the difference between 4.55% and actual inflation in 2008. In August 2009, the base will increase by 2.3%. If inflation is higher, the difference between 2.7% and actual inflation in 2009 will be taken into account in January. The collective agreement also includes criteria for taking account of labour productivity growth in wage negotiations at the level of activities. From 2009 onwards, this collective agreement will no longer serve as the framework collective agreement defining minimum standards applying to all employees irrespective of the collective agreements for activities, but will be given the same weight as the collective agreements for activities. As the starting-level wage or the lowest basic wage remains the basis for the general adjustment in August, the increase by the adjustment percentage still will not extend to all wages. The harmonisation of the documents regulating implementation of the new wage system in the public sector is in the final phase, as well as negotiations on annexes to the collective agreements for activities. The compromise solutions for the conclusion of all these documents have led to agreements, which will require additional funds for the implementation of the system. Even though wage disparities are to be reduced quarterly, an increase above the already agreed volume of funds allocated for this purpose may jeopardise macroeconomic sustainability and reduce the competitive edge of Slovenia’s economy in the entire period of eliminating wage disparities in the public sector (2008–2010).
Slovenian Economic Mirror IMAD Manufacturing
No. 5/2008 p. 10
Selected economic indicators, growth rates, in % III 2008/II 2008
III 2008/III 2007
I–III 2008/ I–III 2007
I–XII 2007/I–XII 2006
Production value1 3.3 -2.8 1.9 7.9 - highly export-oriented industries2 8.1 12.3 10.6 16.9 - mainly export-oriented industries3 -0.4 -9.0 -1.8 6.3 - mainly domestic market-oriented industries4 5.6 -5.7 -0.3 0.4
Average number of employees 0.2 0.3 0.3 0.9 Labour productivity 3.0 -3.1 1.6 7.0 Level of inventories5 1.5 11.2 11.1 8.7 Turnover5 2.2 -3.7 2.4 7.3 New orders5 4.7 -9.5 -6.2 4.4 Domestic industrial producer prices 0.2 2.9 2.8 3.5 - domestic market 0.7 5.5 5.3 4.3 - foreign market -0.3 0.8 0.8 2.9
Source of data: SORS; calculations by IMAD. Notes: 1real growth calculated on the basis of data on production value – SORS' recalculation with the IPI (provisional data); 2manufacturing industries (DG, DK, DM) which have, according to data on Slovenian commercial companies from the
AJPES, earned over 70% of their average net revenue from sales on foreign markets in the last three years on average; 3manufacturing industries (DB, DC, DD, DH, DJ, DL, DN) which have earned 50–70% of their average net revenue from sales on foreign markets in the last three years on
average; 4manufacturing industries (DA, DE, DF, DI) which have earned less than 50% of their average net revenue from sales on foreign markets in the last three years; 5real growth.
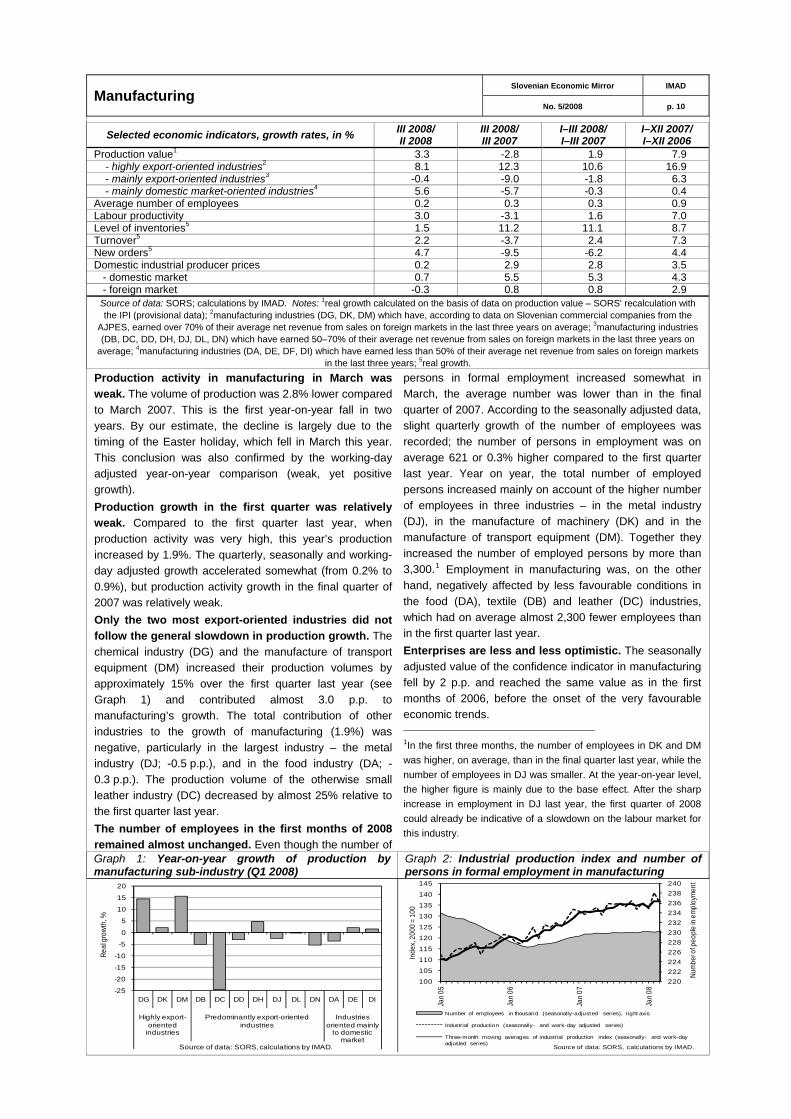
Production activity in manufacturing in March was weak. The volume of production was 2.8% lower compared to March 2007. This is the first year-on-year fall in two years. By our estimate, the decline is largely due to the timing of the Easter holiday, which fell in March this year. This conclusion was also confirmed by the working-day adjusted year-on-year comparison (weak, yet positive growth). Production growth in the first quarter was relatively weak. Compared to the first quarter last year, when production activity was very high, this year’s production increased by 1.9%. The quarterly, seasonally and working-day adjusted growth accelerated somewhat (from 0.2% to 0.9%), but production activity growth in the final quarter of 2007 was relatively weak. Only the two most export-oriented industries did not follow the general slowdown in production growth. The chemical industry (DG) and the manufacture of transport equipment (DM) increased their production volumes by approximately 15% over the first quarter last year (see Graph 1) and contributed almost 3.0 p.p. to manufacturing’s growth. The total contribution of other industries to the growth of manufacturing (1.9%) was negative, particularly in the largest industry – the metal industry (DJ; -0.5 p.p.), and in the food industry (DA; -0.3 p.p.). The production volume of the otherwise small leather industry (DC) decreased by almost 25% relative to the first quarter last year. The number of employees in the first months of 2008 remained almost unchanged. Even though the number of
persons in formal employment increased somewhat in March, the average number was lower than in the final quarter of 2007. According to the seasonally adjusted data, slight quarterly growth of the number of employees was recorded; the number of persons in employment was on average 621 or 0.3% higher compared to the first quarter last year. Year on year, the total number of employed persons increased mainly on account of the higher number of employees in three industries – in the metal industry (DJ), in the manufacture of machinery (DK) and in the manufacture of transport equipment (DM). Together they increased the number of employed persons by more than 3,300.1 Employment in manufacturing was, on the other hand, negatively affected by less favourable conditions in the food (DA), textile (DB) and leather (DC) industries, which had on average almost 2,300 fewer employees than in the first quarter last year. Enterprises are less and less optimistic. The seasonally adjusted value of the confidence indicator in manufacturing fell by 2 p.p. and reached the same value as in the first months of 2006, before the onset of the very favourable economic trends. 1In the first three months, the number of employees in DK and DM was higher, on average, than in the final quarter last year, while the number of employees in DJ was smaller. At the year-on-year level, the higher figure is mainly due to the base effect. After the sharp increase in employment in DJ last year, the first quarter of 2008 could already be indicative of a slowdown on the labour market for this industry.
Graph 1: Year-on-year growth of production by manufacturing sub-industry (Q1 2008)
Graph 2: Industrial production index and number of persons in formal employment in manufacturing
220222224226228230232234236238240
100
105
110
115
120
125
130
135
140
145
Jan
05
Jan
06
Jan
07
Jan
08
Num
ber o
f peo
ple
in e
mpl
oym
ent
Inde
x, 2
000
= 10
0
Source of data: SORS, calculations by IMAD.
-25
-20
-15
-10
-5
0
5
10
15
20
DG DK DM DB DC DD DH DJ DL DN DA DE DI
Highly export-oriented
industries
Predominantly export-oriented industries
Industries oriented mainly
to domestic market
Real
gro
wth,
%
Number of employees in thousand (seasonally-adjusted series), right axis
Industrial production (seasonally- and work-day adjusted series)
Three-month moving averages of industrial production index (seasonally- and work-day adjusted series)Source of data: SORS, calculations by IMAD.
Slovenian Economic Mirror IMAD Construction
No. 5/2008 p. 11
Selected construction indicators, real indexes III 2008/ III 2007
Q1 2008/ Q1 2007
2007/ 2006
Value of construction put in place1 122.5 133.0 118.2 Buildings 122.5 138.6 115.7
Residential buildings 146.2 174.8 99.8 Non-residential buildings 116.2 129.9 120.1
Civil engineering 122.4 128.1 124.1 Value of the stock of contracts1, 2 (nominal) 131.5 131.8 131.8 Value of new contracts1 (nominal) 196.3 153.5 97.6 Number of people employed in construction 113.7 113.0 111.3 Average gross wage per worker employed in construction3 99.8 100.8 102.8
Sources of data: SORS, CCIS; calculations by IMAD. Notes: 1the survey covers all construction firms whose turnover value according to annual accounts for 2005 reached at least EUR 1.45 m and company units engaged in construction employing at least 20 workers, as well as several non-
construction firms that perform out construction services; 2end of period; 3deflated by the CPI.
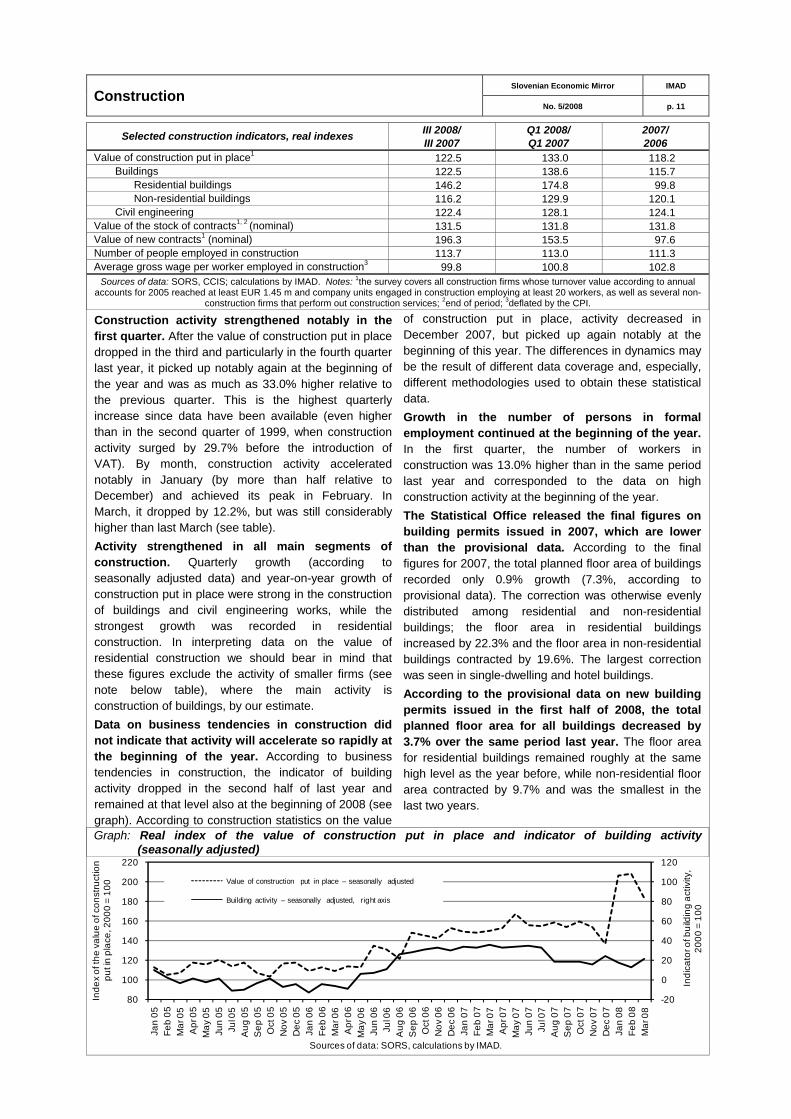
Construction activity strengthened notably in the first quarter. After the value of construction put in place dropped in the third and particularly in the fourth quarter last year, it picked up notably again at the beginning of the year and was as much as 33.0% higher relative to the previous quarter. This is the highest quarterly increase since data have been available (even higher than in the second quarter of 1999, when construction activity surged by 29.7% before the introduction of VAT). By month, construction activity accelerated notably in January (by more than half relative to December) and achieved its peak in February. In March, it dropped by 12.2%, but was still considerably higher than last March (see table). Activity strengthened in all main segments of construction. Quarterly growth (according to seasonally adjusted data) and year-on-year growth of construction put in place were strong in the construction of buildings and civil engineering works, while the strongest growth was recorded in residential construction. In interpreting data on the value of residential construction we should bear in mind that these figures exclude the activity of smaller firms (see note below table), where the main activity is construction of buildings, by our estimate. Data on business tendencies in construction did not indicate that activity will accelerate so rapidly at the beginning of the year. According to business tendencies in construction, the indicator of building activity dropped in the second half of last year and remained at that level also at the beginning of 2008 (see graph). According to construction statistics on the value
of construction put in place, activity decreased in December 2007, but picked up again notably at the beginning of this year. The differences in dynamics may be the result of different data coverage and, especially, different methodologies used to obtain these statistical data. Growth in the number of persons in formal employment continued at the beginning of the year. In the first quarter, the number of workers in construction was 13.0% higher than in the same period last year and corresponded to the data on high construction activity at the beginning of the year. The Statistical Office released the final figures on building permits issued in 2007, which are lower than the provisional data. According to the final figures for 2007, the total planned floor area of buildings recorded only 0.9% growth (7.3%, according to provisional data). The correction was otherwise evenly distributed among residential and non-residential buildings; the floor area in residential buildings increased by 22.3% and the floor area in non-residential buildings contracted by 19.6%. The largest correction was seen in single-dwelling and hotel buildings. According to the provisional data on new building permits issued in the first half of 2008, the total planned floor area for all buildings decreased by 3.7% over the same period last year. The floor area for residential buildings remained roughly at the same high level as the year before, while non-residential floor area contracted by 9.7% and was the smallest in the last two years.
Graph: Real index of the value of construction put in place and indicator of building activity (seasonally adjusted)
-20
0
20
40
60
80
100
120
80
100
120
140
160
180
200
220
Jan
05Fe
b 05
Mar
05
Apr
05
May
05
Jun
05Ju
l 05
Aug
05
Sep
05
Oct
05
Nov
05
Dec
05
Jan
06Fe
b 06
Mar
06
Apr
06
May
06
Jun
06Ju
l 06
Aug
06
Sep
06
Oct
06
Nov
06
Dec
06
Jan
07Fe
b 07
Mar
07
Apr
07
May
07
Jun
07Ju
l 07
Aug
07
Sep
07
Oct
07
Nov
07
Dec
07
Jan
08Fe
b 08
Mar
08
Indi
cato
r of b
uild
ing
activ
ity,
2000
= 1
00
Inde
x of
the
valu
e of
con
stru
ctio
n pu
t in
plac
e, 2
000
= 10
0
Sources of data: SORS, calculations by IMAD.
Value of construction put in place – seasonally adjusted
Building activity – seasonally adjusted, right axis
Slovenian Economic Mirror IMAD Selected Topics
No. 5/2008 pp. 13-15
Slovenian Economic Mirror IMAD Performance of Companies and Cooperatives
No. 5/2008 p. 15
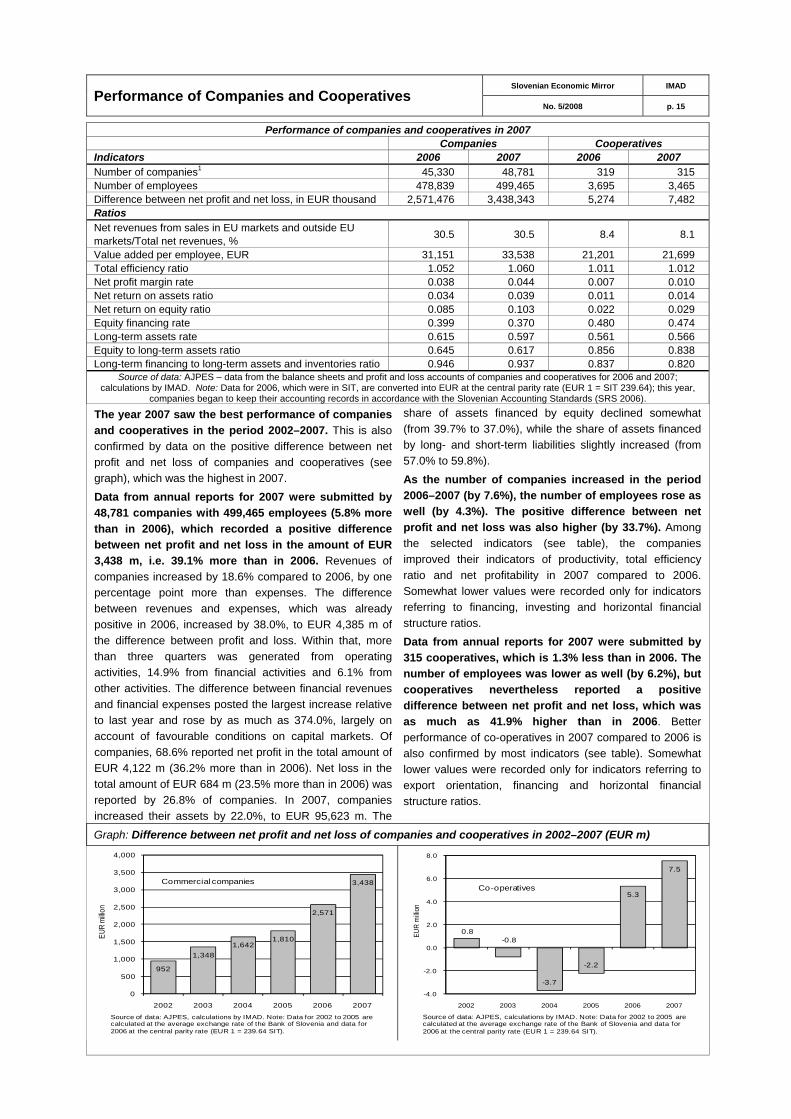
Performance of companies and cooperatives in 2007 Companies Cooperatives Indicators 2006 2007 2006 2007 Number of companies1 45,330 48,781 319 315 Number of employees 478,839 499,465 3,695 3,465 Difference between net profit and net loss, in EUR thousand 2,571,476 3,438,343 5,274 7,482 Ratios Net revenues from sales in EU markets and outside EU markets/Total net revenues, % 30.5 30.5 8.4 8.1
Value added per employee, EUR 31,151 33,538 21,201 21,699 Total efficiency ratio 1.052 1.060 1.011 1.012 Net profit margin rate 0.038 0.044 0.007 0.010 Net return on assets ratio 0.034 0.039 0.011 0.014 Net return on equity ratio 0.085 0.103 0.022 0.029 Equity financing rate 0.399 0.370 0.480 0.474 Long-term assets rate 0.615 0.597 0.561 0.566 Equity to long-term assets ratio 0.645 0.617 0.856 0.838 Long-term financing to long-term assets and inventories ratio 0.946 0.937 0.837 0.820
Source of data: AJPES – data from the balance sheets and profit and loss accounts of companies and cooperatives for 2006 and 2007; calculations by IMAD. Note: Data for 2006, which were in SIT, are converted into EUR at the central parity rate (EUR 1 = SIT 239.64); this year,
companies began to keep their accounting records in accordance with the Slovenian Accounting Standards (SRS 2006). The year 2007 saw the best performance of companies and cooperatives in the period 2002–2007. This is also confirmed by data on the positive difference between net profit and net loss of companies and cooperatives (see graph), which was the highest in 2007. Data from annual reports for 2007 were submitted by 48,781 companies with 499,465 employees (5.8% more than in 2006), which recorded a positive difference between net profit and net loss in the amount of EUR 3,438 m, i.e. 39.1% more than in 2006. Revenues of companies increased by 18.6% compared to 2006, by one percentage point more than expenses. The difference between revenues and expenses, which was already positive in 2006, increased by 38.0%, to EUR 4,385 m of the difference between profit and loss. Within that, more than three quarters was generated from operating activities, 14.9% from financial activities and 6.1% from other activities. The difference between financial revenues and financial expenses posted the largest increase relative to last year and rose by as much as 374.0%, largely on account of favourable conditions on capital markets. Of companies, 68.6% reported net profit in the total amount of EUR 4,122 m (36.2% more than in 2006). Net loss in the total amount of EUR 684 m (23.5% more than in 2006) was reported by 26.8% of companies. In 2007, companies increased their assets by 22.0%, to EUR 95,623 m. The
share of assets financed by equity declined somewhat (from 39.7% to 37.0%), while the share of assets financed by long- and short-term liabilities slightly increased (from 57.0% to 59.8%). As the number of companies increased in the period 2006–2007 (by 7.6%), the number of employees rose as well (by 4.3%). The positive difference between net profit and net loss was also higher (by 33.7%). Among the selected indicators (see table), the companies improved their indicators of productivity, total efficiency ratio and net profitability in 2007 compared to 2006. Somewhat lower values were recorded only for indicators referring to financing, investing and horizontal financial structure ratios. Data from annual reports for 2007 were submitted by 315 cooperatives, which is 1.3% less than in 2006. The number of employees was lower as well (by 6.2%), but cooperatives nevertheless reported a positive difference between net profit and net loss, which was as much as 41.9% higher than in 2006. Better performance of co-operatives in 2007 compared to 2006 is also confirmed by most indicators (see table). Somewhat lower values were recorded only for indicators referring to export orientation, financing and horizontal financial structure ratios.
Graph: Difference between net profit and net loss of companies and cooperatives in 2002–2007 (EUR m)
952
1,3481,642
1,810
2,571
3,438
0
500
1,000
1,500
2,000
2,500
3,000
3,500
4,000
2002 2003 2004 2005 2006 2007
EUR
millio
n
0.8-0.8
-3.7
-2.2
5.3
7.5
-4.0
-2.0
0.0
2.0
4.0
6.0
8.0
2002 2003 2004 2005 2006 2007
EUR
milli
on
Commercial companies
Source of data: AJPES, calculations by IMAD. Note: Data for 2002 to 2005 are calculated at the average exchange rate of the Bank of Slovenia and data for 2006 at the central parity rate (EUR 1 = 239.64 SIT).
Co-operatives
Source of data: AJPES, calculations by IMAD. Note: Data for 2002 to 2005 are calculated at the average exchange rate of the Bank of Slovenia and data for 2006 at the central parity rate (EUR 1 = 239.64 SIT).

Slovenian Economic Mirror IMAD Statistical Appendix
No. 5/2008 pp. A 1–17
Gross Domestic Product / I Slovenian Economic Mirror IMAD
No. 5/2008 p. A 2
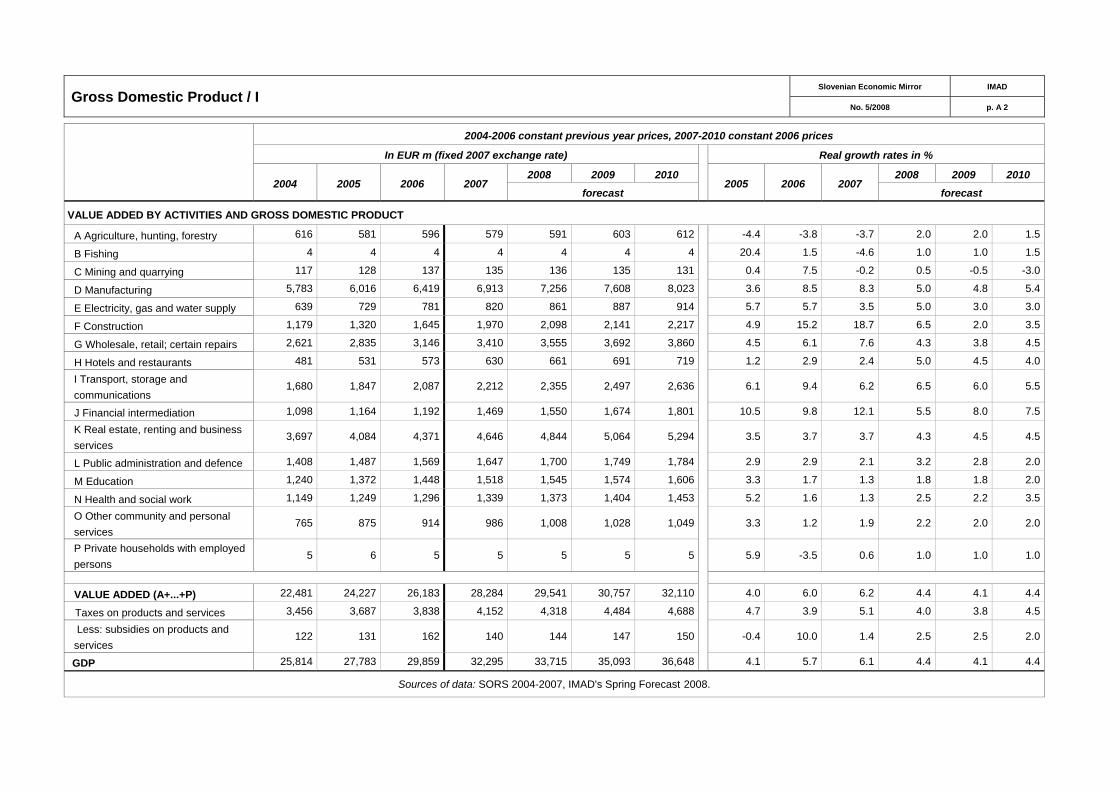
2004-2006 constant previous year prices, 2007-2010 constant 2006 prices
In EUR m (fixed 2007 exchange rate) Real growth rates in %
2004 2005 2006 2007 2008 2009 2010
2005 2006 2007 2008 2009 2010
forecast forecast
VALUE ADDED BY ACTIVITIES AND GROSS DOMESTIC PRODUCT
A Agriculture, hunting, forestry 616 581 596 579 591 603 612 -4.4 -3.8 -3.7 2.0 2.0 1.5
B Fishing 4 4 4 4 4 4 4 20.4 1.5 -4.6 1.0 1.0 1.5
C Mining and quarrying 117 128 137 135 136 135 131 0.4 7.5 -0.2 0.5 -0.5 -3.0
D Manufacturing 5,783 6,016 6,419 6,913 7,256 7,608 8,023 3.6 8.5 8.3 5.0 4.8 5.4
E Electricity, gas and water supply 639 729 781 820 861 887 914 5.7 5.7 3.5 5.0 3.0 3.0
F Construction 1,179 1,320 1,645 1,970 2,098 2,141 2,217 4.9 15.2 18.7 6.5 2.0 3.5
G Wholesale, retail; certain repairs 2,621 2,835 3,146 3,410 3,555 3,692 3,860 4.5 6.1 7.6 4.3 3.8 4.5
H Hotels and restaurants 481 531 573 630 661 691 719 1.2 2.9 2.4 5.0 4.5 4.0
I Transport, storage and communications
1,680 1,847 2,087 2,212 2,355 2,497 2,636 6.1 9.4 6.2 6.5 6.0 5.5
J Financial intermediation 1,098 1,164 1,192 1,469 1,550 1,674 1,801 10.5 9.8 12.1 5.5 8.0 7.5
K Real estate, renting and business services
3,697 4,084 4,371 4,646 4,844 5,064 5,294 3.5 3.7 3.7 4.3 4.5 4.5
L Public administration and defence 1,408 1,487 1,569 1,647 1,700 1,749 1,784 2.9 2.9 2.1 3.2 2.8 2.0
M Education 1,240 1,372 1,448 1,518 1,545 1,574 1,606 3.3 1.7 1.3 1.8 1.8 2.0
N Health and social work 1,149 1,249 1,296 1,339 1,373 1,404 1,453 5.2 1.6 1.3 2.5 2.2 3.5
O Other community and personal services
765 875 914 986 1,008 1,028 1,049 3.3 1.2 1.9 2.2 2.0 2.0
P Private households with employed persons
5 6 5 5 5 5 5 5.9 -3.5 0.6 1.0 1.0 1.0
VALUE ADDED (A+...+P) 22,481 24,227 26,183 28,284 29,541 30,757 32,110 4.0 6.0 6.2 4.4 4.1 4.4
Taxes on products and services 3,456 3,687 3,838 4,152 4,318 4,484 4,688 4.7 3.9 5.1 4.0 3.8 4.5
Less: subsidies on products and services
122 131 162 140 144 147 150 -0.4 10.0 1.4 2.5 2.5 2.0
GDP 25,814 27,783 29,859 32,295 33,715 35,093 36,648 4.1 5.7 6.1 4.4 4.1 4.4
Sources of data: SORS 2004-2007, IMAD's Spring Forecast 2008.

Gross Domestic Product / II Slovenian Economic Mirror IMAD
No.5/2008 p. A 3
In EUR m (fixed 2007 exchange rate), current prices Structure in %, current prices, GDP=100
2004 2005 2006 2007 2008 2009 20010
2005 2006 2007 2008 2009 20010
forecast forecast SUPPLY AND USE OF GROSS NATIONAL DISPOSABLE INCOME 1. GROSS DOMESTIC PRODUCT 26,677 28,243 30,448 33,542 36,308 39,234 42,270 100.0 100.0 100.0 100.0 100.0 100.0
2. Net primary income with the rest of the world -314 -244 -328 -702 -881 -938 -976 -0.9 -1.1 -2.1 -2.4 -2.4 -2.3
3. GROSS NATIONAL INCOME (1+2) 26,364 28,000 30,120 32,839 35,427 38,296 41,294 99.1 98.9 97.9 97.6 97.6 97.7
4. Net current transfers with the rest of the world -44 -144 -210 -286 -48 -12 -30 -0.5 -0.7 -0.9 -0.1 0.0 -0.1 5. GROSS NATIONAL DISPOSABLE INCOME (3+4) 26,320 27,856 29,910 32,553 35,378 38,285 41,264 98.6 98.2 97.1 97.4 97.6 97.6
6. Final consumption expenditure 19,628 20,717 22,116 23,640 25,885 27,760 29,746 73.4 72.6 70.5 71.3 70.8 70.4
Private consumption 14,494 15,245 16,259 17,537 19,137 20,485 21,897 54.0 53.4 52.3 52.7 52.2 51.8
Government consumption 5,134 5,472 5,857 6,103 6,748 7,274 7,849 19.4 19.2 18.2 18.6 18.5 18.6
7. GROSS SAVINGS (5-6) 6,692 7,139 7,794 8,914 9,494 10,525 11,518 25.3 25.6 26.6 26.1 26.8 27.2
8. GROSS CAPITAL FORMATION 7,387 7,705 8,634 10,490 11,180 11,628 12,417 27.3 28.4 31.3 30.8 29.6 29.4 9. SURPLUS ON THE CURRENT ACCOUNT
WITH THE ROW (7-8) -695 -566 -839 -1,576 -1,686 -1,103 -899 -2.0 -2.8 -4.7 -4.6 -2.8 -2.1
Sources of data: SORS 2004-2007, BS; IMAD's Spring Forecast 2008.
EXPENDITURE STRUCTURE OF GROSS DOMESTIC PRODUCT, 2004–2006 constant previous year prices, 2007–2010 constant 2006 prices In EUR m (fixed 2007 exchange rate) Real growth rates, in %
GROSS DOMESTIC PRODUCT (3+4+5) 25,814 27,783 29,859 32,295 33,715 35,093 36,648 4.1 5.7 6.1 4.4 4.1 4.4
1. Exports of goods and services 15,247 17,298 19,982 23,184 25,442 27,825 30,525 10.1 12.3 13.0 9.7 9.4 9.7
2. Imports of goods and services 15,418 17,115 20,159 23,761 25,781 27,727 30,125 6.7 12.2 14.1 8.5 7.5 8.6
3. EXTERNAL BALANCE * (1-2) -170 183 -177 -577 -339 98 399 2,0* 0,0* -0,9* 0,7* 1,3* 0,9*
4. FINAL CONSUMPTION 19,019 20,182 21,569 22,704 23,544 24,331 25,172 2.8 4.1 2.7 3.7 3.3 3.5
Private consumption 14,077 14,881 15,858 16,766 17,375 18,023 18,712 2.7 4.0 3.1 3.6 3.7 3.8 Government consumption (individual and collective) 4,942 5,301 5,712 5,937 6,169 6,308 6,460 3.2 4.4 1.4 3.9 2.3 2.4
5. GROSS CAPITAL FORMATION 6,966 7,418 8,466 10,169 10,510 10,664 11,077 0.4 9.9 17.8 3.4 1.5 3.9
Gross fixed capital formation 6,390 6,953 7,813 9,325 9,828 10,079 10,533 2.5 8.4 17.2 5.4 2.6 4.5
Changes in inventories and valuables* 575 465 653 844 682 585 544 -0,5* 0,6* 0,6* -0,5* -0,3* -0,1*
Sources of data: SORS 2004-2007, BS, IMAD's Spring Forecast 2008. Note: *as contributions to real GDP growth (in percentage points).

Industrial Production Slovenian Economic Mirror IMAD
No. 5/2008 p. A 4
2003 2004 2005 2006 2007
2007 2008 2007 2008 QI QII QIII QIV QI 2 3 4 5 6 7 8 9 10 11 12 1 2 3
INDUSTRIAL PRODUCTION by sectors *, indices, 2000=100; 2007 data are provisional INDUSTRY, total 106.9 112.8 116.5 123.7 131.9 128.2 133.1 129.7 136.0 130.4 121.0 139.0 128.3 134.6 136.4 136.1 117.7 135.4 148.3 142.4 117.2 125.2 130.8 135.1 C Mining and quarrying 104.9 97.6 104.2 115.0 118.8 113.2 129.7 106.7 124.8 119.5 107.5 138.6 133.5 135.0 120.6 91.9 121.2 107.1 132.2 144.9 97.4 105.7 118.0 134.8 D Manufacturing 106.5 111.6 115.6 123.2 133.1 128.4 134.8 131.4 137.1 130.9 121.4 139.9 129.1 136.4 138.9 138.7 117.7 137.8 150.6 143.5 117.3 125.0 131.7 136.0 DA Food, beverages, tobacco 99.6 89.4 88.0 87.9 86.7 78.9 89.6 88.2 90.3 75.9 75.3 86.0 88.4 89.8 90.6 91.0 89.1 84.6 93.3 89.8 87.7 75.0 77.2 75.6 DB Textiles & textile products 71.3 61.7 54.1 52.3 52.1 55.5 51.6 49.7 50.1 52.6 52.0 62.3 52.0 50.0 52.7 54.2 40.9 54.1 58.9 48.3 43.1 51.4 51.4 55.0 DC Leather & leather products 72.7 68.2 72.7 76.5 60.1 72.8 52.3 59.1 56.1 55.0 61.0 71.5 53.2 51.2 52.4 80.8 51.6 45.0 62.9 63.6 41.7 65.9 49.5 49.7 DD Wood & wood products 91.0 94.7 100.7 104.1 115.8 111.2 124.0 113.7 113.8 107.9 110.3 126.4 119.5 128.3 124.3 121.9 103.3 115.8 130.9 117.2 93.2 97.0 109.9 116.8 DE Paper, publishing, printing 1 100.6 101.2 104.8 103.9 104.3 100.3 102.9 104.7 107.4 102.4 91.7 109.1 100.4 106.2 102.1 108.6 103.7 101.7 111.2 109.4 101.6 100.4 98.8 108.1 DF Coke, petrol. prod., nuclear fuel 2 36.3 – – – 21.4 22.3 18.6 20.1 24.7 25.8 21.2 23.0 18.8 18.4 18.6 20.2 18.8 21.2 25.4 27.8 21.0 25.0 27.7 24.6 DG Chem., prod., man-made fibers 128.0 147.5 158.7 179.4 218.4 201.1 213.9 218.8 239.6 230.3 193.6 200.4 206.8 199.2 235.8 241.5 180.7 234.3 272.5 250.0 196.2 216.4 219.1 255.3 DH Rubber & plastic products 103.6 116.5 122.2 130.0 142.5 135.1 141.0 146.3 146.2 141.5 125.3 152.4 130.8 146.3 145.8 145.4 136.3 157.2 166.3 156.5 115.7 131.3 147.6 145.5 DI Non-metal mineral products 101.6 84.6 78.7 83.6 88.3 78.1 91.4 91.9 87.9 79.3 72.4 90.4 83.5 95.6 95.0 95.5 87.4 92.9 101.2 96.5 65.9 72.1 78.0 87.8 DJ Basic metals & fabricated. prod. 112.0 107.8 116.3 129.8 142.2 143.2 145.9 139.4 139.2 139.5 134.7 152.5 141.7 146.9 149.1 145.3 130.4 142.4 149.7 149.9 118.0 135.5 145.0 137.9 DK Machinery & equipment nec. 120.9 138.5 140.9 149.5 165.7 163.9 166.5 161.7 169.5 167.3 154.6 184.6 162.8 168.9 167.9 164.7 140.8 179.5 184.3 181.5 142.6 157.6 175.5 168.7 DL Electrical & optical equipment 122.8 153.0 157.7 181.5 195.1 186.7 202.5 188.4 205.2 187.0 175.5 210.4 185.6 214.5 207.3 192.5 165.1 207.6 227.5 214.2 174.0 175.7 189.7 195.6 DM Transport equipment 111.7 152.7 184.7 177.7 205.7 195.4 206.5 196.2 222.8 226.1 184.7 221.7 184.3 216.7 218.6 231.0 141.5 216.2 237.6 227.3 203.4 222.4 222.2 233.6 DN Manufacturing nec. 102.6 103.4 108.7 107.5 104.1 105.4 106.5 97.8 107.1 99.6 104.4 115.0 103.3 110.7 105.6 105.8 81.7 105.9 116.2 113.7 91.5 95.2 104.7 99.0 E Electricity, gas & water supply 3 111.3 132.9 130.9 129.6 115.2 126.4 104.2 111.7 118.5 122.1 117.5 119.3 108.3 102.4 101.8 115.0 111.2 109.0 116.4 117.8 121.4 132.2 117.8 116.2 NUMBER OF PERSONS IN PAID EMPLOYMENT IN INDUSTRY 4
Total, in 1000 255.1 251.7 247.3 243.3 245.1 244.6 245.5 244.8 245.6 245.0 244.8 245.0 245.2 245.5 245.6 245.1 244.6 244.8 245.9 246.1 244.8 244.8 244.9 245.5 C Mining & quarrying 4.8 4.4 4.2 4.0 3.8 3.9 3.8 3.7 3.7 3.7 3.9 3.8 3.8 3.8 3.8 3.8 3.7 3.7 3.8 3.7 3.7 3.7 3.7 3.7 D Manufacturing 238.9 236.1 231.8 227.9 229.9 229.4 230.2 229.6 230.4 230.0 229.6 229.7 230.0 230.2 230.3 229.8 229.3 229.7 230.7 230.9 229.7 229.8 229.9 230.4
E Electricity, gas & water supply 11.4 11.3 11.4 11.4 11.4 244.6 245.5 244.8 245.6 245.0 244.8 245.0 245.2 245.5 245.6 245.1 244.6 244.8 245.9 246.1 244.8 244.8 244.9 245.5
CONSTRUCTION 5, real indices of construction put in place, indices 2000=100 Construction 105.7 108.4 111.7 128.8 152.5 104.0 157.8 173.9 174.1 138.3 98.1 125.1 136.2 171.0 166.3 166.1 174.2 181.3 206.8 175.4 140.2 123.1 138.6 153.2 Buildings 104.9 114.6 126.4 144.2 166.8 123.0 172.7 181.6 189.7 170.4 115.3 146.5 150.9 182.7 184.6 184.8 183.1 177.0 195.5 203.4 170.2 166.2 165.6 179.5 Civil engineering 106.4 102.6 98.0 114.5 143.1 91.5 148.1 168.8 163.9 117.2 86.8 111.1 126.5 163.3 154.4 153.8 168.3 184.2 214.3 157.0 120.5 94.8 120.8 136.0 Persons in paid employment in construction 4 99.1 97.5 102.0 109.6 122.0 114.1 120.3 125.3 128.1 128.9 114.4 114.8 118.0 120.4 122.7 124.0 125.2 126.8 128.3 129.1 126.8 127.3 128.8 130.6
Source of data: SORS. Notes: *From February 2004 onwards the industrial production indices have been provisional. For the period up until January 2004 they are calculated according to data on produced quantities of industrial goods. From February 2004 onwards, data on production value have been taken as the basis for the calculation. The value of production is calculated according to the following
formula: turnover in the month (x) + value of stocks in the month (x) - value of stocks in the month (x-1).1Enterprises with activity of publishing are excluded; 2data not published because of confidentiality; 3only companies with activity of electricity supply are included. 4In January 2005, the SORS adopted a new methodology of obtaining data on persons in paid employment. The new source of data for
employed and self-employed persons excluding farmers is the Statistical Register of Employment (SRE), while data on farmers are forecast using the ARIMA model based on quarterly figures for farmers from the Labor Force Survey. Data for previous years dating back to January 2000 have also been calculated according to the new methodology. 5The survey covers all larger construction enterprises and
some other enterprises that perform construction work.

Production Slovenian Economic Mirror IMAD
No. 5/2008 p. A 5
2003 2004 2005 2006 2007
2007 2008 2007 2008 QI QII QIII QIV QI 3 4 5 6 7 8 9 10 11 12 1 2 3
TRANSPORT Passenger-km in transport for hire or reward, in m 1,065 980 848 850 817 209 222 167 219 206 76 69 80 73 45 43 79 79 74 67 72 63 71
Passenger-km in rail transport, in m 778 764 777 788 812 196 202 204 210 - - - - - - - - - - - - - -
Passenger-km in air transport, in m 837 896 1,019 1,044 1,186 183 289 459 255 227 65 79 88 121 161 158 139 107 77 72 72 73 82
Tonne-km in rail transport, in m 3,274 3,466 3,402 3,373 3,603 918 913 865 908 - - - - - - - - - - - - - -
Tonne-km in maritime transport, in m 28,361 37,047 52,513 49,155 46,586 10,813 13,224 12,050 10,499 14,524 3,387 4,884 3,967 4,373 4,585 3,676 3,790 3,390 2,628 4,481 4,515 4,650 5,360
Tonne-km in road transport, in m 7,040 9,007 11,033 12,112 13,734 3,103 3,418 3,617 3,596 - - - - - - - - - - - - - -
Urban passenger traffic, in m 98.4 100.2 97.2 94.0 90.7 26.3 23.3 14.4 26.7 25.5 9.1 8.3 7.8 7.2 4.1 3.8 6.6 8.9 9.0 8.8 8.5 8.3 8.7 Airport passengers traffic, in 000 922 1,047 1,228 1,339 1,505 251 382 535 336 303 91 108 123 152 184 181 169 140 102 94 95 97 110
Harbour freight transport, in 000 t 10,788 12,063 12,625 15,462 15,847 4,282 3,967 3,406 4,191 4,249 1,762 1,091 1,383 1,493 1,113 1,167 1,126 1,331 1,422 1,438 1,374 1,571 1,303
Transport of gas, million m3 1,098 1,097 1,136 - - - - - - - - - - - - - - - - - - - -
TOURISM, overnight stays, in 000 Total 7,503 7,589 7,573 7,722 8,261 1,472 1,997 3,327 1,465 1,533 502 568 619 811 1,226 1,325 776 573 441 452 486 542 505 Domestic tourists 3,327 3,226 3,173 3,233 3,393 700 786 1,253 654 734 242 208 239 339 503 489 261 228 203 223 198 315 221 Foreign tourists 4,175 4,363 4,399 4,489 4,868 771 1,211 2,074 811 799 261 359 380 472 723 836 515 344 238 229 288 227 284 Health resorts 2,360 2,417 2,464 2,550 2,651 560 636 841 614 572 193 205 205 226 282 325 234 233 201 180 177 202 193 Seaside 2,010 2,002 1,949 1,925 1,993 203 535 987 268 215 94 140 153 243 390 390 206 115 88 64 45 71 99
AGRICULTURE, slaughter in slaughterhouses, in 000 tons Cattle 43.1 40.1 37.4 37.9 36.2 8.0 8.6 8.1 11.5 8.7 2.9 3.0 2.9 2.7 2.6 2.7 2.7 3.5 4.3 3.8 2.9 2.8 3.0 Pigs 37.3 34.6 31.7 33.6 33.2 8.2 8.5 7.8 8.7 8.3 2.9 2.9 2.9 2.6 2.7 2.6 2.5 2.8 2.6 3.3 2.8 2.8 2.8 Poultry 56.0 52.0 53.4 49.2 58.9 13.9 14.3 15.2 15.6 14.2 5.2 4.6 4.7 5.0 5.2 5.1 4.8 5.4 5.4 4.8 5.2 4.4 4.6 Purchase of agricultural products, SIT bn, since 2007 in EURO m
103.3 102.4 103.7 106.7 492.2 101.3 109.7 120.8 160.3 117.9 37.9 37.5 38.4 33.8 38.3 41.8 40.7 46.2 53.1 61.0 38.5 39.3 40.0
FISHING, in tons
Catches in marine waters 1087.5 815.9 1021.6 736.7 795.3 174.5 246.0 230.9 143.8 - 25.8 39.6 77.8 128.7 51.1 123.4 56.4 60.6 47.8 35.5 - - -
Source of data: SORS.

Balance of Payments Slovenian Economic Mirror IMAD
No. 5/2008 p. A 6
2003 2004 2005 2006 2007 2007 2008 2007 2008
QI QII QIII QIV QI 3 4 5 6 7 8 9 10 11 12 1 2 3
BALANCE OF PAYMENTS, in EUR m Current account -196 -720 -561 -857 -1,641 -260 -231 -357 -793 -621 -63 -107 -126 2 -92 -54 -211 -207 -245 -342 -250 -196 -175 Goods 1 -543 -1,009 -1,026 -1,151 -1,664 -246 -384 -387 -646 -464 -80 -143 -161 -80 -90 -103 -194 -177 -187 -283 -177 -130 -158
Exports 11,417 12,933 14,599 17,028 19,777 4,782 5,004 4,926 5,065 5,103 1,798 1,578 1,714 1,712 1,741 1,477 1,709 1,856 1,783 1,427 1,634 1,714 1,755 Imports 11,960 13,942 15,625 18,179 21,441 5,028 5,389 5,313 5,711 5,567 1,879 1,721 1,875 1,792 1,830 1,580 1,903 2,032 1,969 1,709 1,811 1,843 1,913
Services 540 688 849 866 1,040 204 342 337 157 223 70 101 116 126 85 133 119 63 42 51 58 67 98 Exports 2,465 2,783 3,143 3,449 4,116 829 1,015 1,294 978 988 297 332 334 349 436 458 399 357 285 336 326 319 344 Imports 1,925 2,095 2,294 2,584 3,075 625 673 957 821 765 227 231 218 224 351 325 281 293 242 286 268 252 246
Income -219 -322 -288 -398 -725 -143 -157 -205 -220 -208 -53 -51 -52 -54 -65 -70 -70 -70 -73 -77 -70 -65 -73 Receipts 510 530 648 902 1,019 218 269 259 272 279 76 88 91 90 83 85 91 89 90 94 89 96 93 Expenditure 728 852 936 1,300 1,744 361 427 464 492 487 128 139 143 144 149 155 161 159 163 170 160 161 166
Current transfers 26 -76 -97 -173 -292 -76 -31 -102 -84 -171 0 -13 -29 11 -23 -14 -65 -23 -28 -33 -61 -68 -42 Receipts 474 561 738 785 910 197 239 220 253 175 87 76 66 97 71 90 60 74 85 94 58 59 58 Expenditure 449 638 835 958 1,203 273 271 322 337 346 87 89 95 87 93 104 125 98 113 126 119 127 100
Capital and financial account 46 698 818 1,050 2,032 500 275 259 998 428 306 75 -38 237 191 11 57 203 354 442 162 143 124 Capital account -165 -96 -114 -131 -52 15 -27 -32 -8 -2 -9 0 -7 -20 -11 3 -24 7 5 -21 6 1 -9 Financial account 211 794 932 1,182 2,084 485 302 291 1,006 430 315 76 -31 257 202 8 80 196 349 462 156 141 133 Direct investment -151 224 -43 -207 -81 -120 -14 -106 159 122 34 -20 -79 85 -26 27 -107 130 -62 91 85 -41 79
Domestic abroad -421 -441 -516 -718 -1,154 -307 -245 -404 -198 -137 -56 -118 -108 -19 -141 -59 -204 23 -145 -76 -35 -40 -62 Foreign in Slovenia 270 665 473 512 1,073 187 230 298 357 260 90 97 29 104 115 85 97 108 83 167 120 -1 141
Portfolio investment -223 -637 -1,466 -1,444 -2,273 -623 -1,203 377 -823 166 430 -414 -620 -169 234 119 24 -360 -483 20 -5 594 -423 Financial derivatives 0 6 -10 -13 -22 2 -2 -12 -9 2 1 0 0 -2 -7 -5 -1 -11 1 1 3 3 -3 Other investment 849 945 2,639 1,564 4,320 1,172 1,533 0 1,616 221 -143 455 733 344 -131 -125 256 417 921 277 72 -451 599
Assets -730 -1,308 -1,459 -1,936 -4,647 -2,311 -396 -1,373 -567 -835 -811 -819 498 -75 -600 -352 -421 -268 -341 42 175 -894 -116 Commercial credits -116 -237 -226 -435 -426 -375 -178 29 98 -474 -190 -95 -9 -73 31 152 -154 -229 -18 345 -68 -209 -198 Loans -223 -281 -340 -733 -1,807 -351 -439 -419 -599 61 -258 -45 -203 -191 -215 -144 -60 -120 -125 -354 167 -27 -80 Currency and deposits -323 -720 -872 -747 -2,424 -1,605 219 -972 -66 -419 -322 -665 708 176 -402 -363 -207 76 -198 56 63 -660 178 Other assets -68 -69 -21 -21 10 20 1 -11 0 -2 -41 -14 3 13 -13 3 0 5 -1 -5 13 2 -16
Liabilities 1,579 2,252 4,098 3,500 8,968 3,483 1,929 1,373 2,182 1,055 669 1,275 235 419 469 227 677 685 1,262 235 -103 443 715 Commercial credits 59 214 291 468 512 275 52 -83 267 179 227 -17 85 -16 54 -297 161 167 94 7 -67 94 153 Loans 1,123 1,671 2,731 2,064 3,761 15 1,546 895 1,305 632 -72 1,021 294 230 220 251 424 204 873 227 97 209 327 Deposits 428 335 1,053 998 4,727 3,208 338 567 613 253 521 279 -140 199 188 281 98 328 299 -14 -134 150 236 Other liabilities -31 33 23 -30 -32 -16 -7 -6 -2 -9 -6 -9 -5 6 7 -8 -6 -14 -4 16 2 -10 -1
International reserves 2 -264 256 -189 1,281 140 55 -11 32 64 -81 -7 55 -65 -1 132 -8 -91 20 -28 72 0 37 -118 Statistical error 150 22 -257 -194 -391 -240 -44 98 -205 193 -243 31 164 -239 -99 43 154 4 -109 -100 89 53 51 EXPORTS AND IMPORTS BY END-USE OF PRODUCTS, in EUR m Export of investment goods 1,172 1,333 1,392 1,680 1,933 455 508 466 505 N/A 185 159 176 173 166 140 160 180 165 159 147 175 N/A Intermediate goods 5,989 6,926 7,723 9,368 10,438 2,611 2,674 2,560 2,593 N/A 964 856 922 896 918 778 864 959 927 707 892 919 N/A Consumer goods 4,124 4,523 5,282 5,709 7,014 1,645 1,720 1,790 1,859 N/A 622 536 575 609 619 520 651 679 653 526 558 587 N/A
Import of investment goods 1,974 2,104 2,163 2,565 3,004 658 736 740 870 N/A 249 229 265 242 246 199 295 303 299 268 244 241 N/A Intermediate goods 7,209 8,492 9,764 11,319 12,874 3,154 3,215 3,162 3,343 N/A 1,160 1,017 1,120 1,078 1,105 955 1,102 1,161 1,185 998 1,108 1,136 N/A Consumer goods 3,056 3,547 3,877 4,456 5,609 1,240 1,447 1,413 1,509 N/A 478 478 494 476 478 424 511 576 492 440 462 471 N/A
Sources of data: BS, SORS. Notes: 1exports and imports (F.O.B.) include also the adjustment for exports and imports of goods by ITRS and duty-free shops reports; 2 reserve assets of the BS.
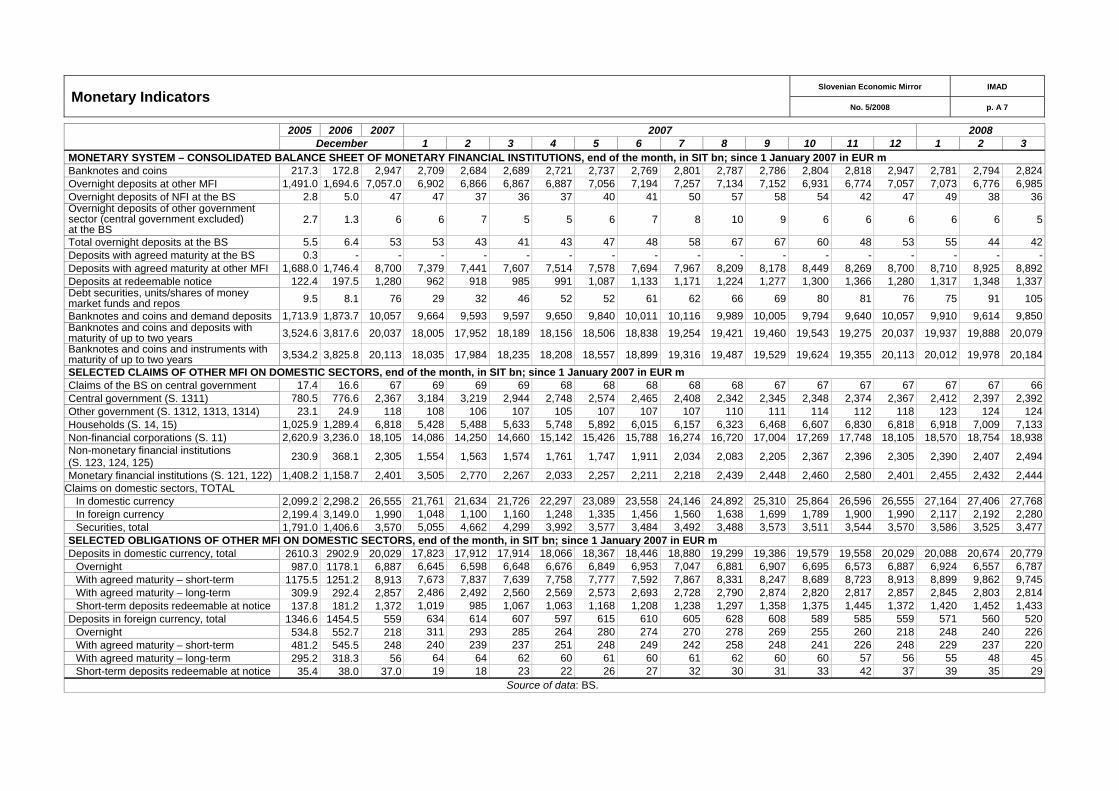
Monetary Indicators Slovenian Economic Mirror IMAD
No. 5/2008 p. A 7
2005 2006 2007 2007 2008 December 1 2 3 4 5 6 7 8 9 10 11 12 1 2 3
MONETARY SYSTEM – CONSOLIDATED BALANCE SHEET OF MONETARY FINANCIAL INSTITUTIONS, end of the month, in SIT bn; since 1 January 2007 in EUR m Banknotes and coins 217.3 172.8 2,947 2,709 2,684 2,689 2,721 2,737 2,769 2,801 2,787 2,786 2,804 2,818 2,947 2,781 2,794 2,824 Overnight deposits at other MFI 1,491.0 1,694.6 7,057.0 6,902 6,866 6,867 6,887 7,056 7,194 7,257 7,134 7,152 6,931 6,774 7,057 7,073 6,776 6,985 Overnight deposits of NFI at the BS 2.8 5.0 47 47 37 36 37 40 41 50 57 58 54 42 47 49 38 36 Overnight deposits of other government sector (central government excluded) at the BS
2 .7 1.3 6 6 7 5 5 6 7 8 10 9 6 6 6 6 6 5
Total overnight deposits at the BS 5.5 6.4 53 53 43 41 43 47 48 58 67 67 60 48 53 55 44 42 Deposits with agreed maturity at the BS 0.3 - - - - - - - - - - - - - - - - - Deposits with agreed maturity at other MFI 1,688.0 1,746.4 8,700 7,379 7,441 7,607 7,514 7,578 7,694 7,967 8,209 8,178 8,449 8,269 8,700 8,710 8,925 8,892 Deposits at redeemable notice 122.4 197.5 1,280 962 918 985 991 1,087 1,133 1,171 1,224 1,277 1,300 1,366 1,280 1,317 1,348 1,337 Debt securities, units/shares of money market funds and repos 9.5 8.1 76 29 32 46 52 52 61 62 66 69 80 81 76 75 91 105 Banknotes and coins and demand deposits 1,713.9 1,873.7 10,057 9,664 9,593 9,597 9,650 9,840 10,011 10,116 9,989 10,005 9,794 9,640 10,057 9,910 9,614 9,850 Banknotes and coins and deposits with maturity of up to two years 3,524.6 3,817.6 20,037 18,005 17,952 18,189 18,156 18,506 18,838 19,254 19,421 19,460 19,543 19,275 20,037 19,937 19,888 20,079 Banknotes and coins and instruments with maturity of up to two years 3,534.2 3,825.8 20,113 18,035 17,984 18,235 18,208 18,557 18,899 19,316 19,487 19,529 19,624 19,355 20,113 20,012 19,978 20,184 SELECTED CLAIMS OF OTHER MFI ON DOMESTIC SECTORS, end of the month, in SIT bn; since 1 January 2007 in EUR m Claims of the BS on central government 17.4 16.6 67 69 69 69 68 68 68 68 68 67 67 67 67 67 67 66 Central government (S. 1311) 780.5 776.6 2,367 3,184 3,219 2,944 2,748 2,574 2,465 2,408 2,342 2,345 2,348 2,374 2,367 2,412 2,397 2,392 Other government (S. 1312, 1313, 1314) 23.1 24.9 118 108 106 107 105 107 107 107 110 111 114 112 118 123 124 124 Households (S. 14, 15) 1,025.9 1,289.4 6,818 5,428 5,488 5,633 5,748 5,892 6,015 6,157 6,323 6,468 6,607 6,830 6,818 6,918 7,009 7,133 Non-financial corporations (S. 11) 2,620.9 3,236.0 18,105 14,086 14,250 14,660 15,142 15,426 15,788 16,274 16,720 17,004 17,269 17,748 18,105 18,570 18,754 18,938 Non-monetary financial institutions (S. 123, 124, 125) 230.9 368.1 2,305 1,554 1,563 1,574 1,761 1,747 1,911 2,034 2,083 2,205 2,367 2,396 2,305 2,390 2,407 2,494
Monetary financial institutions (S. 121, 122) 1,408.2 1,158.7 2,401 3,505 2,770 2,267 2,033 2,257 2,211 2,218 2,439 2,448 2,460 2,580 2,401 2,455 2,432 2,444 Claims on domestic sectors, TOTAL
In domestic currency 2,099.2 2,298.2 26,555 21,761 21,634 21,726 22,297 23,089 23,558 24,146 24,892 25,310 25,864 26,596 26,555 27,164 27,406 27,768 In foreign currency 2,199.4 3,149.0 1,990 1,048 1,100 1,160 1,248 1,335 1,456 1,560 1,638 1,699 1,789 1,900 1,990 2,117 2,192 2,280 Securities, total 1,791.0 1,406.6 3,570 5,055 4,662 4,299 3,992 3,577 3,484 3,492 3,488 3,573 3,511 3,544 3,570 3,586 3,525 3,477
SELECTED OBLIGATIONS OF OTHER MFI ON DOMESTIC SECTORS, end of the month, in SIT bn; since 1 January 2007 in EUR m Deposits in domestic currency, total 2610.3 2902.9 20,029 17,823 17,912 17,914 18,066 18,367 18,446 18,880 19,299 19,386 19,579 19,558 20,029 20,088 20,674 20,779
Overnight 987.0 1178.1 6,887 6,645 6,598 6,648 6,676 6,849 6,953 7,047 6,881 6,907 6,695 6,573 6,887 6,924 6,557 6,787 With agreed maturity – short-term 1175.5 1251.2 8,913 7,673 7,837 7,639 7,758 7,777 7,592 7,867 8,331 8,247 8,689 8,723 8,913 8,899 9,862 9,745 With agreed maturity – long-term 309.9 292.4 2,857 2,486 2,492 2,560 2,569 2,573 2,693 2,728 2,790 2,874 2,820 2,817 2,857 2,845 2,803 2,814 Short-term deposits redeemable at notice 137.8 181.2 1,372 1,019 985 1,067 1,063 1,168 1,208 1,238 1,297 1,358 1,375 1,445 1,372 1,420 1,452 1,433
Deposits in foreign currency, total 1346.6 1454.5 559 634 614 607 597 615 610 605 628 608 589 585 559 571 560 520 Overnight 534.8 552.7 218 311 293 285 264 280 274 270 278 269 255 260 218 248 240 226 With agreed maturity – short-term 481.2 545.5 248 240 239 237 251 248 249 242 258 248 241 226 248 229 237 220 With agreed maturity – long-term 295.2 318.3 56 64 64 62 60 61 60 61 62 60 60 57 56 55 48 45 Short-term deposits redeemable at notice 35.4 38.0 37.0 19 18 23 22 26 27 32 30 31 33 42 37 39 35 29
Source of data: BS.

Prices Slovenian Economic Mirror IMAD
No. 5/2008 p. A 8
Indices, 2005 = 100 2003 2004 2005 2006 20072007 2008 2007 2008
QI QII QIII QIV QI 4 5 6 7 8 9 10 11 12 1 2 3 4
GROWTH IN SELECTED PRICE INDICATORS
CPI 94.2 97.6 100.0 102.5 106.2 103.1 105.8 106.9 108.8 109.9 104.9 106.1 106.5 106.6 106.9 107.3 108.0 108.9 109.4 109.5 109.4 110.9 111.7
Food, non-alcoholic beverages 100.3 100.8 100.0 102.3 110.2 105.3 108.7 110.7 116.1 120.0 107.5 109.3 109.2 109.5 109.7 113.0 115.5 115.5 117.3 120.4 119.9 119.8 120.8
Alcoholic beverages, tobacco 91.0 96.3 100.0 103.7 110.5 107.1 108.0 113.6 113.2 112.9 107.6 108.1 108.2 113.9 114.0 113.1 113.2 113.1 113.2 113.0 112.8 112.9 112.8
Clothing and footwear 99.3 101.0 100.0 99.5 101.6 95.4 105.7 97.1 108.1 100.1 103.4 106.8 107.0 95.0 94.2 102.3 106.8 109.9 107.7 95.6 97.8 106.8 110.6
Housing, water, electricity, gas 85.4 91.7 100.0 105.3 108.1 104.2 107.1 109.3 111.7 115.2 106.7 107.0 107.7 108.5 110.3 109.1 110.2 112.3 112.5 115.7 113.8 116.0 116.7
Furnishings, household equip. 94.3 96.5 100.0 104.1 108.7 107.0 108.3 109.0 110.4 111.9 108.0 108.2 108.8 108.8 109.1 109.1 109.9 110.5 111.0 111.1 111.3 113.2 114.1
Medical, pharmaceutical products 98.8 100.3 100.0 98.3 99.4 99.9 99.9 99.1 98.7 99.4 100.0 99.7 99.9 100.0 98.7 98.7 98.8 98.8 98.7 98.3 98.5 101.3 101.4
Transport 92.1 97.4 100.0 101.3 101.6 99.7 102.6 102.1 101.9 102.6 101.6 102.9 103.2 102.9 102.2 101.1 100.7 102.5 102.4 102.7 102.0 103.2 103.7
Communications 99.8 100.0 100.0 100.3 100.6 100.0 99.6 100.9 101.8 102.2 99.3 99.7 99.7 100.6 100.8 101.5 101.4 100.8 103.1 102.5 102.1 102.1 102.1
Recreation and culture 94.2 97.7 100.0 102.1 105.8 102.5 104.3 110.6 105.9 107.2 102.0 104.4 106.4 111.0 113.0 107.9 105.5 105.6 106.6 106.5 108.0 107.3 107.5
Education 87.1 93.4 100.0 103.1 105.0 103.1 104.7 105.7 106.7 107.9 103.0 105.6 105.6 105.6 105.6 106.0 106.7 106.7 106.7 106.6 107.0 110.2 110.2
Catering services 91.1 95.8 100.0 104.5 112.1 109.2 110.8 112.8 115.5 119.4 110.3 111.0 111.1 111.8 112.7 113.9 114.4 115.6 116.6 119.0 119.5 119.8 121.4
Miscellaneous goods & services 94.5 98.1 100.0 104.1 107.8 106.4 107.1 108.2 109.4 110.6 106.7 107.2 107.3 107.8 108.3 108.5 108.8 109.6 109.9 110.1 110.6 111.2 111.7
HCPI 94.2 97.6 100.0 102.5 106.4 103.4 106.2 107.0 109.0 110.1 105.3 106.5 106.8 106.7 106.9 107.4 108.2 109.2 109.6 109.7 109.6 111.0 111.8 Producer price indices (domestic market) 93.4 97.4 100.0 102.3 107.8 105.9 107.4 108.2 109.9 112.1 107.1 107.4 107.7 107.8 107.7 108.9 109.6 110.1 110.1 111.0 112.4 113.0 113.7
Intermediate goods 91.4 96.9 100.0 103.5 111.9 109.1 111.7 112.6 114.3 117.0 111.3 111.8 112.1 112.3 112.1 113.5 114.2 114.3 114.4 115.2 117.7 118.0 119.0
Capital goods 94.7 97.0 100.0 100.2 101.5 101.2 101.1 101.5 102.0 102.6 101.4 101.0 100.9 101.6 101.4 101.6 102.1 101.9 101.9 102.4 102.2 103.4 104.4
Consumption goods 95.3 98.1 100.0 101.5 104.4 103.1 103.6 104.2 106.7 108.8 103.2 103.5 104.0 103.8 103.8 105.1 105.8 107.1 107.2 108.2 108.8 109.4 109.7
PRICE CONTROL1
Energy prices 83.3 89.4 100.0 108.0 108.6 102.6 109.5 110.1 112.4 116.1 107.5 110.3 110.7 111.8 109.8 108.5 108.5 114.4 114.3 116.5 112.6 119.1 120.3
Oil products 80.2 86.7 100.0 110.3 109.3 101.4 110.9 111.3 113.5 116.5 107.5 112.3 112.9 113.5 111.0 109.3 108.7 115.9 115.9 117.3 112.3 119.8 121.0
Electricity for households 93.8 98.6 100.0 101.6 – 101.7 107.1 – – – 107.1 107.1 107.1 – – – – – – – – – –
Basic utilities 88.6 96.2 100.0 97.4 95.2 93.8 94.7 97.2 95.1 95.1 94.7 94.7 94.7 94.7 101.7 95.2 95.2 95.1 95.1 95.1 95.1 95.0 95.9
Transport & communications 95.2 97.9 100.0 101.5 102.1 101.9 102.2 102.2 102.2 102.4 102.2 102.2 102.2 102.2 102.2 102.2 102.2 102.2 102.2 102.2 102.2 102.8 102.8
Other controlled prices 89.8 95.7 100.0 102.6 105.6 104.9 104.9 106.3 106.4 106.4 105.3 104.7 104.7 105.5 107.1 106.4 106.4 106.4 106.4 106.4 106.4 106.4 106.6
Direct control – total 85.5 91.5 100.0 107.0 110.4 105.6 110.8 112.0 113.2 115.6 109.4 111.3 111.7 112.6 112.7 110.7 110.7 114.5 114.4 115.9 113.3 117.7 118.7 Source of data: SORS, calculations and estimates IMAD. Note: 1 the structure of groups varies, data published are not directly comparable to those published previously. The electricity market
was liberalized on 1 July 2007. Data from July 2007 onwards are not comparable.
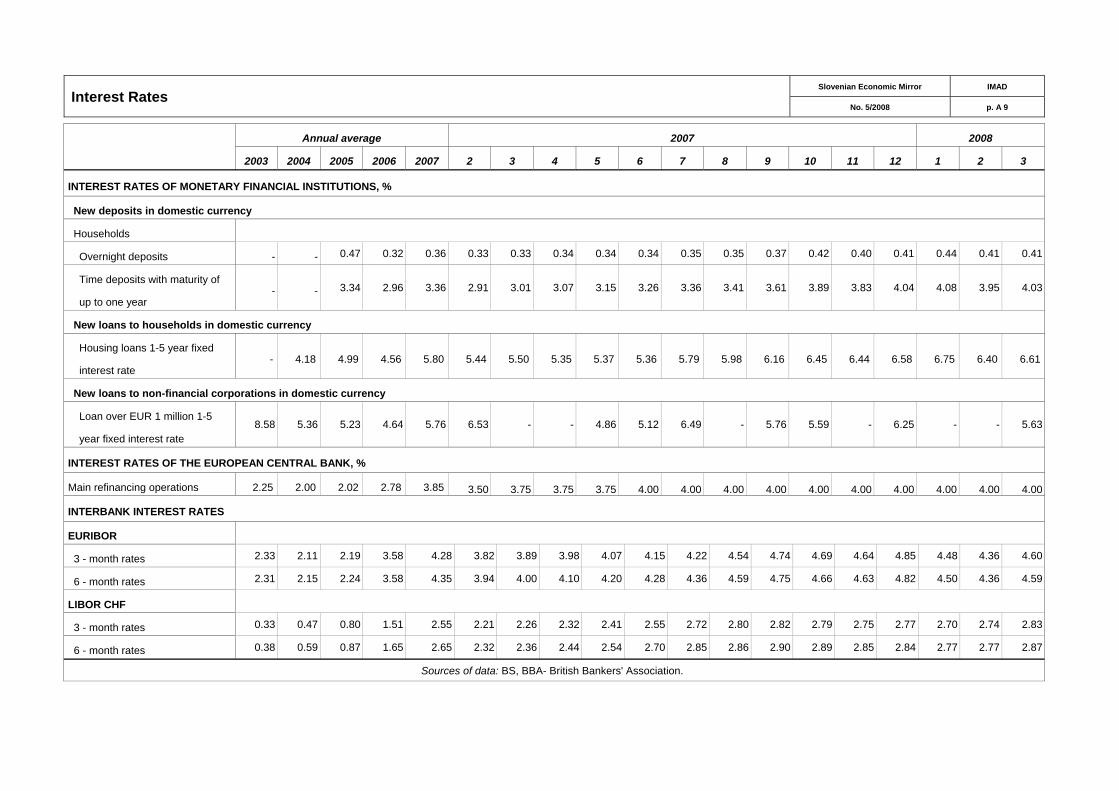
Interest Rates Slovenian Economic Mirror IMAD
No. 5/2008 p. A 9
Annual average 2007 2008
2003 2004 2005 2006 2007 2 3 4 5 6 7 8 9 10 11 12 1 2 3
INTEREST RATES OF MONETARY FINANCIAL INSTITUTIONS, %
New deposits in domestic currency
Households
Overnight deposits - - 0.47 0.32 0.36 0.33 0.33 0.34 0.34 0.34 0.35 0.35 0.37 0.42 0.40 0.41 0.44 0.41 0.41
Time deposits with maturity of
up to one year - - 3.34 2.96 3.36 2.91 3.01 3.07 3.15 3.26 3.36 3.41 3.61 3.89 3.83 4.04 4.08 3.95 4.03
New loans to households in domestic currency
Housing loans 1-5 year fixed
interest rate - 4.18 4.99 4.56 5.80 5.44 5.50 5.35 5.37 5.36 5.79 5.98 6.16 6.45 6.44 6.58 6.75 6.40 6.61
New loans to non-financial corporations in domestic currency
Loan over EUR 1 million 1-5
year fixed interest rate 8.58 5.36 5.23 4.64 5.76 6.53 - - 4.86 5.12 6.49 - 5.76 5.59 - 6.25 - - 5.63
INTEREST RATES OF THE EUROPEAN CENTRAL BANK, %
Main refinancing operations 2.25 2.00 2.02 2.78 3.85 3.50 3.75 3.75 3.75 4.00 4.00 4.00 4.00 4.00 4.00 4.00 4.00 4.00 4.00
INTERBANK INTEREST RATES
EURIBOR
3 - month rates 2.33 2.11 2.19 3.58 4.28 3.82 3.89 3.98 4.07 4.15 4.22 4.54 4.74 4.69 4.64 4.85 4.48 4.36 4.60
6 - month rates 2.31 2.15 2.24 3.58 4.35 3.94 4.00 4.10 4.20 4.28 4.36 4.59 4.75 4.66 4.63 4.82 4.50 4.36 4.59
LIBOR CHF
3 - month rates 0.33 0.47 0.80 1.51 2.55 2.21 2.26 2.32 2.41 2.55 2.72 2.80 2.82 2.79 2.75 2.77 2.70 2.74 2.83
6 - month rates 0.38 0.59 0.87 1.65 2.65 2.32 2.36 2.44 2.54 2.70 2.85 2.86 2.90 2.89 2.85 2.84 2.77 2.77 2.87
Sources of data: BS, BBA- British Bankers' Association.

Labour Market Slovenian Economic Mirror IMAD
No. 5/2008 p. A 10
Number in thousand 2003 2004 2005 2006 20072007 2008 2007 2008
Q I Q II Q III Q IV Q I 3 4 5 6 7 8 9 10 11 12 1 2 3 A FORMAL LABOUR FORCE (A=B+E) 899.1 900.3 905.0 910.7 925.3 919.1 923.5 924.6 934.2 937.7 920.0 921.6 923.6 925.4 924.5 923.1 926.0 934.0 935.8 932.8 936.6 937.9 938.5 B PERSONS IN FORMAL
EMPLOYMENT (C+D) 801.4 807.5 813.1 824.8 854.0 841.8 852.7 856.1 865.4 870.8 845.8 849.0 852.9 856.2 854.4 854.6 859.4 864.5 867.4 864.4 867.3 870.9 874.2 In agriculture, forestry, fishing 37.7 41.2 38.7 38.9 41.6 43.1 42.0 41.0 40.3 41.9 43.1 41.9 42.0 42.0 41.0 41.0 41.0 40.4 40.3 40.2 41.8 41.9 42.1 In industry, construction 318.4 313.9 310.9 313.3 322.9 317.4 322.2 324.8 327.3 327.3 318.3 320.5 322.3 323.9 324.3 324.4 325.7 327.7 328.4 325.7 326.0 327.1 328.8
Of which: in manufacturing 238.9 236.1 233.7 227.9 229.9 229.4 230.2 229.6 230.4 230.0 229.7 230.0 230.2 230.3 229.8 229.3 229.7 230.7 230.9 229.7 229.8 229.9 230.4 in construction 63.3 62.2 61.7 69.9 77.8 72.8 76.8 80.0 81.7 82.2 73.3 75.3 76.8 78.3 79.1 79.9 80.9 81.8 82.4 80.9 81.2 82.2 83.3 In services 445.2 452.3 463.5 472.6 489.5 481.3 488.5 490.3 497.8 501.6 484.4 486.6 488.6 490.3 489.1 489.2 492.7 496.4 498.7 498.5 499.6 502.0 503.4 Of which: in public administration 47.7 49.9 49.1 50.2 50.1 49.7 50.1 50.2 50.3 50.6 49.7 49.9 50.1 50.2 50.2 50.2 50.2 50.3 50.3 50.4 50.6 50.7 50.5 in education, health-services, social work 102.7 105.0 106.5 109.1 110.0 109.9 110.2 109.3 110.6 111.3 110.2 110.4 110.1 110.2 109.0 108.7 110.1 110.6 110.8 110.5 110.9 111.4 111.5
C FORMALLY EMPLOYED 1 722.1 724.4 731.6 741.6 766.0 753.1 764.7 768.6 777.8 781.2 757.0 761.3 764.9 768.1 767.0 767.1 771.6 777.0 779.7 776.7 777.9 781.3 784.3 In enterprises and organisations 656.0 658.7 666.2 675.1 696.1 685.8 695.0 697.5 706.2 710.4 689.0 692.4 695.1 697.5 696.2 696.1 700.1 705.2 707.7 705.9 707.8 710.5 713.0 By those self-employed 66.2 65.6 65.4 66.5 69.9 67.3 69.8 71.1 71.6 70.8 68.0 68.9 69.8 70.6 70.8 71.0 71.5 71.8 72.0 70.8 70.2 70.8 71.3
D SELF-EMPLOYED AND FARMERS 79.2 83.1 81.5 83.3 87.9 88.7 87.9 87.6 87.6 89.6 88.8 87.8 88.0 88.1 87.3 87.5 87.8 87.5 87.7 87.7 89.4 89.6 89.9 E REGISTERED UNEMPLOYMENT 97.7 92.8 91.9 85.8 71.3 77.3 70.9 68.4 68.8 66.8 74.2 72.6 70.7 69.3 70.1 68.5 66.7 69.5 68.4 68.4 69.2 67.0 64.3
Female 51.6 49.3 49.4 47.0 39.1 42.0 39.3 38.0 37.3 35.6 40.7 40.2 39.2 38.5 39.3 38.1 36.7 38.0 37.1 36.7 36.9 35.7 34.3 By age: under 26 25.5 24.3 22.2 18.2 11.9 14.0 11.6 10.3 11.7 10.3 12.8 12.2 11.5 11.1 11.1 10.4 9.5 12.2 11.6 11.2 11.1 10.3 9.5 older than 40 43.1 39.7 40.1 39.7 37.1 38.7 37.2 36.6 36.1 36.3 38.1 37.7 37.2 36.7 36.9 36.6 36.3 36.1 36.0 36.3 37.0 36.4 35.6 Unskilled 43.2 38.6 37.5 33.7 28.0 30.4 27.7 27.0 26.9 26.8 29.0 28.2 27.7 27.1 27.2 27.0 26.7 27.0 26.8 27.1 27.6 26.9 25.9 For more than 1 year 47.5 42.9 43.4 41.9 36.5 38.8 36.7 35.5 35.0 34.0 37.9 37.4 36.8 36.0 35.8 35.6 35.0 35.3 35.0 34.7 34.7 34.0 33.3 Those receiving benefits 24.3 22.3 23.3 22.7 16.6 19.1 16.8 15.8 14.7 15.0 18.3 17.2 16.9 16.3 16.3 16.0 15.2 14.8 14.5 14.7 15.6 15.1 14.2
F RATE OF REGISTERED UNEMPLOYMENT, E/A, in % 10.9 10.3 10.2 9.4 8.4 8.4 7.7 7.4 7.4 7.1 8.1 7.9 7.7 7.5 7.6 7.4 7.2 7.4 7.3 7.3 7.4 7.1 6.9
G FLOWS OF FORMAL LABOUR FORCE -10.2 1.5 8.0 5.2 21.5 8.7 5.4 0.6 6.7 5.7 0.8 1.6 2.0 1.8 -0.9 -1.4 2.9 8.0 1.8 -3.0 3.8 1.4 0.6 New unemployed first job seekers 25.4 26.0 21.7 18.6 14.7 2.9 2.4 2.3 7.2 2.2 0.9 1.0 0.7 0.6 0.7 0.6 1.0 5.3 1.2 0.6 0.9 0.6 0.7 Redundancies 68.8 69.6 67.2 63.8 52.5 15.4 11.6 12.6 12.9 12.5 4.0 4.0 4.0 3.7 4.9 3.5 4.2 4.5 4.3 4.1 5.8 3.4 3.3 Registered unemployed who found employment 50.5 54.3 53.9 57.4 49.1 14.8 12.1 11.3 10.9 12.4 5.2 4.2 4.1 3.7 3.0 3.8 4.4 4.3 4.1 2.5 4.1 4.2 4.1 Other unemployed erased out of register 47.3 46.6 33.1 39.2 28.0 7.6 6.9 6.2 7.4 6.4 3.1 2.4 2.5 2.0 1.6 1.9 2.7 2.6 2.5 2.2 1.8 2.1 2.5 Change in number of work permits for foreigners 3.5 -0.5 3.9 7.8 15.3 3.9 4.9 4.3 2.2 6.0 2.5 3.6 1.7 -0.5 2.2 1.6 0.5 1.7 0.3 0.2 -0.2 2.4 3.8 Retirements 2 19.4 21.0 18.4 20.6 20.7 5.2 4.7 5.0 5.9 5.4 1.4 1.7 1.6 1.4 1.6 1.1 2.3 2.2 2.1 1.6 2.4 1.4 1.7 Deaths 2 2.6 2.5 2.3 2.5 2.4 0.6 0.6 0.6 0.6 0.7 0.2 0.2 0.2 0.2 0.2 0.2 0.2 0.2 0.2 0.2 0.2 0.2 0.2 Others who found employment 2 27.8 43.6 34.1 39.0 20.5 14.3 9.2 4.5 11.1 9.9 1.8 0.8 3.3 5.0 -0.8 -0.9 6.1 5.5 4.5 -0.2 7.1 1.7 0.1
H REGISTERED VACANCIES 3 12.1 14.1 16.9 19.0 20.2 20.5 21.0 20.4 19.1 21.6 23.6 20.6 19.3 23.1 18.8 19.7 22.8 24.4 18.7 14.2 22.4 22.8 19.8 For fixed term, in % 73.8 73.7 75.6 75.3 76.5 76.7 77.5 77.2 74.4 73.0 77.5 76.9 79.1 76.6 78.4 77.1 76.5 76.4 75.2 69.8 71.9 73.0 74.2
WORK PERMITS FOR FOREIGNERS 39.7 39.7 41.6 48.3 60.2 52.6 59.3 63.0 65.8 68.7 54.7 58.3 60.1 59.5 61.7 63.3 63.9 65.6 65.9 66.1 65.8 68.3 72.1 As % of labour force (I/A) 4.4 4.4 4.6 5.3 7.0 5.7 6.4 6.8 7.0 7.3 5.9 6.3 6.5 6.4 6.7 6.9 6.9 7.0 7.0 7.1 7.0 7.3 7.7
Sources of data: SORS, PDII, ESS. Notes: 1In January 2005, the SORS adopted new methodology of obtaining data on persons in paid employment. The new source of data for employed and self-employed persons excluding farmers is the Statistical Register of Employment (SRE), while data on farmers are forecast using the ARIMA model based on quarterly figures for farmers from the Labour Force Survey.
Data for previous years dating back to January 2000 have also been calculated according to the new methodology. 2Estimated by IMAD, based on data by PDII and ESS; 3according to ESS.

Wages, Competitiveness, Exchange Rate Slovenian Economic Mirror IMAD
No. 5/2008 p. A 11
2005 2006 2007
2007 2008 2007 2008 QII QIII QIV QI 3 4 5 6 7 8 9 10 11 12 1 2 3
GROSS WAGE PER EMPLOYEE, in SIT, since 2007 in EURTotal 277,279 290,635 1,285 1,252 1,267 1,379 1,335 1,252 1,237 1,264 1,254 1,263 1,279 1,259 1,304 1,492 1,343 1,326 1,326 1,353
Private sector (A to K) 258,714 272,709 1,217 1,178 1,191 1,328 1,264 1,184 1,164 1,192 1,179 1,180 1,211 1,181 1,238 1,468 1,279 1,263 1,244 1,285 Agriculture, fishing (A, B) 224,253 236,822 1,069 1,036 1,048 1,185 1,112 1,021 1,026 1,057 1,026 1,029 1,073 1,044 1,113 1,323 1,118 1,117 1,127 1,091 A Agriculture 224,225 236,681 1,069 1,036 1,049 1,184 1,114 1,023 1,025 1,058 1,027 1,029 1,072 1,045 1,110 1,323 1,120 1,120 1,129 1,092 B Fishing 218,670 236,027 1,063 1,032 1,030 1,202 1,036 919 1,070 1,011 1,015 1,015 1,078 999 1,231 1,337 1,039 1,032 1,027 1,047 Industry, construction (C to F) 243,067 256,362 1,140 1,101 1,120 1,241 1,184 1,110 1,081 1,114 1,109 1,106 1,145 1,109 1,168 1,372 1,184 1,189 1,163 1,200 C Mining and quarrying 344,670 360,110 1,608 1,547 1,538 1,848 1,656 1,508 1,487 1,580 1,572 1,518 1,549 1,547 1,628 2,139 1,777 1,605 1,642 1,721 D Manufacturing 238,985 252,162 1,124 1,086 1,105 1,217 1,175 1,099 1,069 1,094 1,095 1,091 1,132 1,093 1,151 1,335 1,165 1,181 1,152 1,192 E Electricity, gas & water supply 353,836 373,743 1,657 1,537 1,564 2,031 1,629 1,501 1,483 1,551 1,576 1,502 1,602 1,588 1,689 2,553 1,850 1,663 1,598 1,625 F Construction 224,794 238,698 1,061 1,036 1,054 1,129 1,094 1,038 1,011 1,066 1,031 1,050 1,071 1,039 1,091 1,217 1,080 1,092 1,081 1,107 Production services (G to I) 253,747 266,326 1,189 1,156 1,167 1,280 1,241 1,171 1,153 1,163 1,152 1,162 1,177 1,163 1,204 1,377 1,260 1,235 1,221 1,266 G Distributive trade 244,880 258,521 1,161 1,130 1,143 1,247 1,205 1,143 1,130 1,135 1,125 1,136 1,151 1,142 1,176 1,332 1,231 1,200 1,194 1,223 H Hotels & restaurants 202,895 211,873 937 922 927 1,004 983 906 905 930 931 920 945 916 958 1,042 1,011 993 969 985 I Transport, storage & communications 299,377 310,080 1,368 1,320 1,331 1,480 1,436 1,359 1,316 1,332 1,313 1,329 1,343 1,322 1,377 1,627 1,436 1,423 1,395 1,489 Business services (J to K) 325,355 340,552 1,520 1,472 1,466 1,698 1,563 1,450 1,452 1,504 1,461 1,458 1,486 1,453 1,528 1,942 1,623 1,555 1,542 1,592 J Financial intermediation 413,896 443,595 1,986 1,943 1,834 2,347 1,959 1,830 1,897 2,021 1,911 1,833 1,853 1,815 1,973 3,015 2,054 1,918 1,932 2,027 K Real estate 292,763 304,295 1,361 1,312 1,341 1,480 1,431 1,321 1,300 1,328 1,309 1,330 1,361 1,331 1,379 1,583 1,479 1,433 1,412 1,447 Public services (L to O) 330,580 341,999 1,485 1,469 1,495 1,531 1,548 1,453 1,454 1,474 1,478 1,509 1,485 1,490 1,500 1,563 1,531 1,515 1,570 1,558 L Public administration 333,302 343,572 1,507 1,482 1,538 1,561 1,606 1,445 1,452 1,488 1,506 1,565 1,512 1,538 1,553 1,569 1,562 1,549 1,648 1,619 M Education 340,967 357,301 1,550 1,545 1,561 1,573 1,605 1,530 1,533 1,550 1,550 1,571 1,556 1,556 1,560 1,585 1,575 1,563 1,636 1,615 N Health & social work 316,827 325,245 1,400 1,393 1,405 1,436 1,450 1,369 1,386 1,401 1,392 1,423 1,401 1,391 1,404 1,453 1,450 1,438 1,452 1,461 O Other social & personal services 325,159 332,137 1,440 1,394 1,407 1,553 1,465 1,441 1,389 1,393 1,399 1,399 1,415 1,407 1,421 1,733 1,504 1,466 1,463 1,467
INDICATORS OF OVERALL COMPETITIVENESS, 2001=100 Foreign exchange rates Effective exchange rate1, nominal 94.0 94.1 94.9 94.8 94.9 95.4 95.6 94.5 94.7 94.8 94.9 95.0 94.8 95.0 95.3 95.4 95.4 95.5 95.4 95.8
Real (relative consumer prices) 105.0 105.7 108.1 107.9 108.7 110.1 110.5 106.1 107.0 108.1 108.5 108.5 108.6 109.0 109.6 110.3 110.3 110.4 109.9 111.1
Real (relative producer prices)2 102.5 101.6 103.7 103.3 103.5 104.7 104.9 103.5 103.2 103.3 103.4 103.2 103.2 104.0 104.7 104.7 104.8 105.0 104.8 105.0
SIT/US$ 192.7 191.0 – – – – – – – – – – – – – – – – – – SIT/EUR 239.6 239.6 – – – – – – – – – – – – – – – – – – US$/EUR 1.2448 1.2557 1.3706 1.3482 1.3745 1.4494 1.4998 1.3242 1.3516 1.3511 1.3419 1.3716 1.3622 1.3896 1.4227 1.4684 1.457 1.4718 1.4748 1.5527
Sources of data: SORS, AP, BS, OECD Main Economic Indicators, calculations IMAD. Notes: Data on the monthly gross wage per employee for 2004 and beyond calculated according to the new methodology were published in September 2005. 1Change of methodology: the calculation of domestic
currency's effective exchange rate includes the currencies/prices of Slovenia's 17 trading partners (Austria, Belgium, Germany, Italy, France, Netherlands, Spain, Denmark, United Kingdom, Sweden, Czech Republic, Hungary, Poland, Slovakia, USA, Switzerland, Japan); weights are the shares of individual trading partners in Slovenian exports and imports of goods within manufacturing (5-8 SITC) in 2001-2003; exports are double
weighted; a rise in the index value indicates an appreciation of domestic currency and vice versa. 2Producer prices in manufacturing activities.
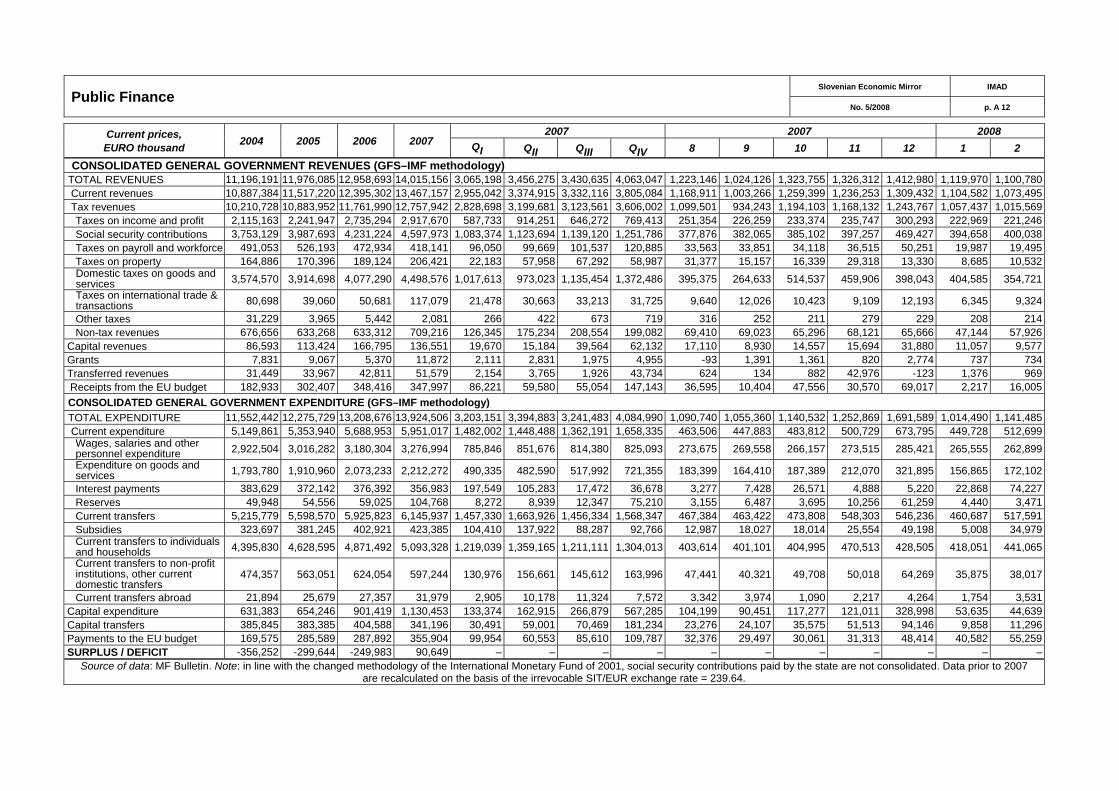
Public Finance Slovenian Economic Mirror IMAD
No. 5/2008 p. A 12
Current prices, EURO thousand 2004 2005 2006 2007
2007 2007 2008 QI QII QIII QIV 8 9 10 11 12 1 2
CONSOLIDATED GENERAL GOVERNMENT REVENUES (GFS–IMF methodology) TOTAL REVENUES 11,196,191 11,976,085 12,958,693 14,015,156 3,065,198 3,456,275 3,430,635 4,063,047 1,223,146 1,024,126 1,323,755 1,326,312 1,412,980 1,119,970 1,100,780 Current revenues 10,887,384 11,517,220 12,395,302 13,467,157 2,955,042 3,374,915 3,332,116 3,805,084 1,168,911 1,003,266 1,259,399 1,236,253 1,309,432 1,104,582 1,073,495 Tax revenues 10,210,728 10,883,952 11,761,990 12,757,942 2,828,698 3,199,681 3,123,561 3,606,002 1,099,501 934,243 1,194,103 1,168,132 1,243,767 1,057,437 1,015,569
Taxes on income and profit 2,115,163 2,241,947 2,735,294 2,917,670 587,733 914,251 646,272 769,413 251,354 226,259 233,374 235,747 300,293 222,969 221,246 Social security contributions 3,753,129 3,987,693 4,231,224 4,597,973 1,083,374 1,123,694 1,139,120 1,251,786 377,876 382,065 385,102 397,257 469,427 394,658 400,038 Taxes on payroll and workforce 491,053 526,193 472,934 418,141 96,050 99,669 101,537 120,885 33,563 33,851 34,118 36,515 50,251 19,987 19,495 Taxes on property 164,886 170,396 189,124 206,421 22,183 57,958 67,292 58,987 31,377 15,157 16,339 29,318 13,330 8,685 10,532 Domestic taxes on goods and services 3,574,570 3,914,698 4,077,290 4,498,576 1,017,613 973,023 1,135,454 1,372,486 395,375 264,633 514,537 459,906 398,043 404,585 354,721 Taxes on international trade & transactions 80,698 39,060 50,681 117,079 21,478 30,663 33,213 31,725 9,640 12,026 10,423 9,109 12,193 6,345 9,324
Other taxes 31,229 3,965 5,442 2,081 266 422 673 719 316 252 211 279 229 208 214 Non-tax revenues 676,656 633,268 633,312 709,216 126,345 175,234 208,554 199,082 69,410 69,023 65,296 68,121 65,666 47,144 57,926
Capital revenues 86,593 113,424 166,795 136,551 19,670 15,184 39,564 62,132 17,110 8,930 14,557 15,694 31,880 11,057 9,577 Grants 7,831 9,067 5,370 11,872 2,111 2,831 1,975 4,955 -93 1,391 1,361 820 2,774 737 734 Transferred revenues 31,449 33,967 42,811 51,579 2,154 3,765 1,926 43,734 624 134 882 42,976 -123 1,376 969 Receipts from the EU budget 182,933 302,407 348,416 347,997 86,221 59,580 55,054 147,143 36,595 10,404 47,556 30,570 69,017 2,217 16,005 CONSOLIDATED GENERAL GOVERNMENT EXPENDITURE (GFS–IMF methodology) TOTAL EXPENDITURE 11,552,442 12,275,729 13,208,676 13,924,506 3,203,151 3,394,883 3,241,483 4,084,990 1,090,740 1,055,360 1,140,532 1,252,869 1,691,589 1,014,490 1,141,485 Current expenditure 5,149,861 5,353,940 5,688,953 5,951,017 1,482,002 1,448,488 1,362,191 1,658,335 463,506 447,883 483,812 500,729 673,795 449,728 512,699
Wages, salaries and other personnel expenditure 2,922,504 3,016,282 3,180,304 3,276,994 785,846 851,676 814,380 825,093 273,675 269,558 266,157 273,515 285,421 265,555 262,899 Expenditure on goods and services 1,793,780 1,910,960 2,073,233 2,212,272 490,335 482,590 517,992 721,355 183,399 164,410 187,389 212,070 321,895 156,865 172,102
Interest payments 383,629 372,142 376,392 356,983 197,549 105,283 17,472 36,678 3,277 7,428 26,571 4,888 5,220 22,868 74,227 Reserves 49,948 54,556 59,025 104,768 8,272 8,939 12,347 75,210 3,155 6,487 3,695 10,256 61,259 4,440 3,471 Current transfers 5,215,779 5,598,570 5,925,823 6,145,937 1,457,330 1,663,926 1,456,334 1,568,347 467,384 463,422 473,808 548,303 546,236 460,687 517,591 Subsidies 323,697 381,245 402,921 423,385 104,410 137,922 88,287 92,766 12,987 18,027 18,014 25,554 49,198 5,008 34,979 Current transfers to individuals and households 4,395,830 4,628,595 4,871,492 5,093,328 1,219,039 1,359,165 1,211,111 1,304,013 403,614 401,101 404,995 470,513 428,505 418,051 441,065 Current transfers to non-profit institutions, other current domestic transfers
474,357 563,051 624,054 597,244 130,976 156,661 145,612 163,996 47,441 40,321 49,708 50,018 64,269 35,875 38,017
Current transfers abroad 21,894 25,679 27,357 31,979 2,905 10,178 11,324 7,572 3,342 3,974 1,090 2,217 4,264 1,754 3,531 Capital expenditure 631,383 654,246 901,419 1,130,453 133,374 162,915 266,879 567,285 104,199 90,451 117,277 121,011 328,998 53,635 44,639 Capital transfers 385,845 383,385 404,588 341,196 30,491 59,001 70,469 181,234 23,276 24,107 35,575 51,513 94,146 9,858 11,296 Payments to the EU budget 169,575 285,589 287,892 355,904 99,954 60,553 85,610 109,787 32,376 29,497 30,061 31,313 48,414 40,582 55,259 SURPLUS / DEFICIT -356,252 -299,644 -249,983 90,649 – – – – – – – – – – –
Source of data: MF Bulletin. Note: in line with the changed methodology of the International Monetary Fund of 2001, social security contributions paid by the state are not consolidated. Data prior to 2007 are recalculated on the basis of the irrevocable SIT/EUR exchange rate = 239.64.
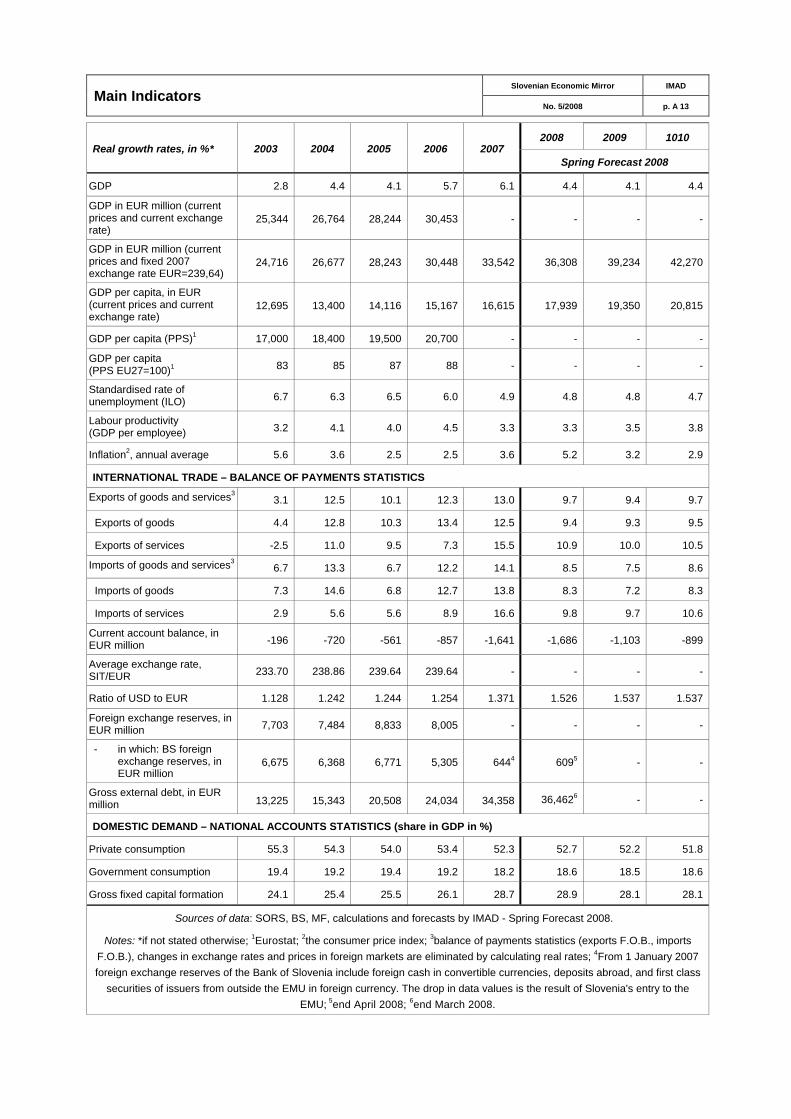
Main Indicators Slovenian Economic Mirror IMAD
No. 5/2008 p. A 13
Real growth rates, in %* 2003 2004 2005 2006 2007 2008 2009 1010
Spring Forecast 2008
GDP 2.8 4.4 4.1 5.7 6.1 4.4 4.1 4.4
GDP in EUR million (current prices and current exchange rate)
25,344 26,764 28,244 30,453 - - - -
GDP in EUR million (current prices and fixed 2007 exchange rate EUR=239,64)
24,716 26,677 28,243 30,448 33,542 36,308 39,234 42,270
GDP per capita, in EUR (current prices and current exchange rate)
12,695 13,400 14,116 15,167 16,615 17,939 19,350 20,815
GDP per capita (PPS)1 17,000 18,400 19,500 20,700 - - - -
GDP per capita (PPS EU27=100)1 83 85 87 88 - - - -
Standardised rate of unemployment (ILO) 6.7 6.3 6.5 6.0 4.9 4.8 4.8 4.7
Labour productivity (GDP per employee) 3.2 4.1 4.0 4.5 3.3 3.3 3.5 3.8
Inflation2, annual average 5.6 3.6 2.5 2.5 3.6 5.2 3.2 2.9
INTERNATIONAL TRADE – BALANCE OF PAYMENTS STATISTICS
Exports of goods and services33.1 12.5 10.1 12.3 13.0 9.7 9.4 9.7
Exports of goods 4.4 12.8 10.3 13.4 12.5 9.4 9.3 9.5
Exports of services -2.5 11.0 9.5 7.3 15.5 10.9 10.0 10.5
Imports of goods and services36.7 13.3 6.7 12.2 14.1 8.5 7.5 8.6
Imports of goods 7.3 14.6 6.8 12.7 13.8 8.3 7.2 8.3
Imports of services 2.9 5.6 5.6 8.9 16.6 9.8 9.7 10.6
Current account balance, in EUR million -196 -720 -561 -857 -1,641 -1,686 -1,103 -899
Average exchange rate, SIT/EUR 233.70 238.86 239.64 239.64 - - - -
Ratio of USD to EUR 1.128 1.242 1.244 1.254 1.371 1.526 1.537 1.537
Foreign exchange reserves, in EUR million 7,703 7,484 8,833 8,005 - - - -
- in which: BS foreign exchange reserves, in EUR million
6,675 6,368 6,771 5,305 6444 6095 - -
Gross external debt, in EUR million 13,225 15,343 20,508 24,034 34,358 36,4626 - -
DOMESTIC DEMAND – NATIONAL ACCOUNTS STATISTICS (share in GDP in %)
Private consumption 55.3 54.3 54.0 53.4 52.3 52.7 52.2 51.8
Government consumption 19.4 19.2 19.4 19.2 18.2 18.6 18.5 18.6
Gross fixed capital formation 24.1 25.4 25.5 26.1 28.7 28.9 28.1 28.1
Sources of data: SORS, BS, MF, calculations and forecasts by IMAD - Spring Forecast 2008.
Notes: *if not stated otherwise; 1Eurostat; 2the consumer price index; 3balance of payments statistics (exports F.O.B., imports F.O.B.), changes in exchange rates and prices in foreign markets are eliminated by calculating real rates; 4From 1 January 2007 foreign exchange reserves of the Bank of Slovenia include foreign cash in convertible currencies, deposits abroad, and first class
securities of issuers from outside the EMU in foreign currency. The drop in data values is the result of Slovenia's entry to the EMU; 5end April 2008; 6end March 2008.

International Comparisons / I Slovenian Economic Mirror IMAD
No. 5/2008 p. A 14
Real GDP growth GDP per capita in PPS1 EU27=100 Inflation2 (annual average)
2004 2005 2006 2007 2003 2004 2005 2006 2004 2005 2006 2007 Slovenia 4.4 4.1 5.7 6.1 82.3 85.3 86.8 87.8 3.7 2.5 2.5 3.8 EU27 2.5 1.9 3.1 2.9 100.0 100.0 100.0 100.0 2.0 2.2 2.2 2.3 EU25 2.5 1.9 3.0 2.8 104.4 104.2 104.1 103.9 2.1 2.2 2.2 2.3 EMU 2.1 1.6 2.7 2.6 112.1 110.9 110.9 110.4 2.1 2.2 2.2 2.1 Belgium 3.0 1.7 2.8 2.8 123.3 121.0 121.1 119.8 1.9 2.5 2.3 1.8 Bulgaria 6.6 6.2 6.3 6.2 32.6 33.8 35.3 36.7 6.1 6.0 7.4 7.6 Czech Republic 4.5 6.4 6.4 6.5 73.6 75.3 76.6 78.6 2.6 1.6 2.1 3.0 Denmark 2.3 2.5 3.9 1.8 124.5 125.9 126.6 125.8 0.9 1.7 1.9 1.7 Germany 1.1 0.8 2.9 2.5 116.9 116.6 115.1 114.2 1.8 1.9 1.8 2.3 Estonia 8.3 10.2 11.2 7.1 54.5 56.9 62.9 68.4 3.0 4.1 4.4 6.7 Ireland 4.4 6.0 5.7 5.3 140.8 141.8 143.7 145.5 2.3 2.2 2.7 2.9 Greece 4.6 3.8 4.2 4.0 92.2 93.9 96.2 97.3 3.0 3.5 3.3 3.0 Spain 3.3 3.6 3.9 3.8 101.2 101.2 102.9 105.0 3.1 3.4 3.6 2.8 France 2.5 1.9 2.2 2.2 112.1 110.3 112.4 111.9 2.3 1.9 1.9 1.6 Italy 1.5 0.6 1.8 1.5 111.0 106.9 105.1 103.3 2.3 2.2 2.2 2.0 Cyprus 4.2 3.9 4.0 4.4 89.2 90.5 92.6 91.9 1.9 2.0 2.2 2.2 Latvia 8.7 10.6 12.2 10.3 43.4 45.8 49.9 53.7 6.2 6.9 6.6 10.1 Lithuania 7.3 7.9 7.7 8.8 49.1 50.5 53.2 56.2 1.2 2.7 3.8 5.8 Luxembourg 4.9 5.0 6.1 4.5 247.3 253.2 264.2 279.3 3.2 3.8 3.0 2.7 Hungary 4.8 4.1 3.9 1.3 63.4 63.3 64.2 65.0 6.8 3.5 4.0 7.9 Malta 0.2 3.4 3.4 3.8 78.6 76.8 77.3 76.9 2.7 2.5 2.6 0.7 Netherlands 2.2 1.5 3.0 3.5 129.7 129.5 131.1 130.6 1.4 1.5 1.7 1.6 Austria 2.3 2.0 3.3 3.4 128.8 128.8 128.7 127.5 2.0 2.1 1.7 2.2 Poland 5.3 3.6 6.2 6.5 49.0 50.7 51.2 52.4 3.6 2.2 1.3 2.6 Portugal 1.5 0.9 1.3 1.9 76.9 74.7 75.4 74.5 2.5 2.1 3.0 2.4 Romania 8.5 4.2 7.9 6.0 31.4 34.1 35.4 38.9 11.9 9.1 6.6 4.9 Slovakia 5.2 6.6 8.5 10.4 55.6 57.2 60.5 63.7 7.5 2.8 4.3 1.9 Finland 3.7 2.8 4.9 4.4 113.3 116.5 115.1 117.0 0.1 0.8 1.3 1.6 Sweden 4.1 3.3 4.1 2.7 123.0 125.0 123.7 124.6 1.0 0.8 1.5 1.7 United Kingdom 3.3 1.8 2.9 3.0 119.8 122.0 119.2 118.0 1.3 2.1 2.3 2.3 USA 3.6 3.1 2.9 2.2 153.9 155.0 158.4 157.6 2.7 3.4 3.2 2.9
Sources of data: SORS; Eurostat. Notes: 1PPS – Purchasing Power Standard. 2 Harmonised Index of Consumer Prices for EU countries and Consumer Price Index for the USA.
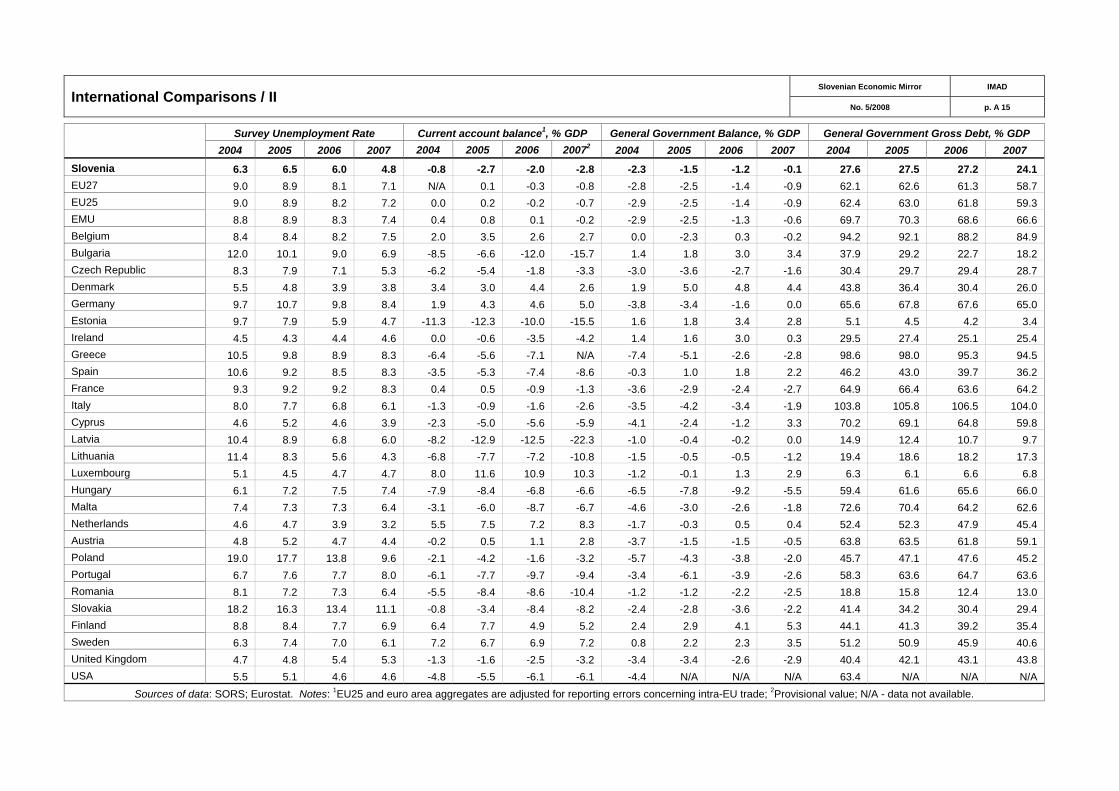
International Comparisons / II Slovenian Economic Mirror IMAD
No. 5/2008 p. A 15
Survey Unemployment Rate Current account balance1, % GDP General Government Balance, % GDP General Government Gross Debt, % GDP 2004 2005 2006 2007 2004 2005 2006 20072 2004 2005 2006 2007 2004 2005 2006 2007
Slovenia 6.3 6.5 6.0 4.8 -0.8 -2.7 -2.0 -2.8 -2.3 -1.5 -1.2 -0.1 27.6 27.5 27.2 24.1 EU27 9.0 8.9 8.1 7.1 N/A 0.1 -0.3 -0.8 -2.8 -2.5 -1.4 -0.9 62.1 62.6 61.3 58.7 EU25 9.0 8.9 8.2 7.2 0.0 0.2 -0.2 -0.7 -2.9 -2.5 -1.4 -0.9 62.4 63.0 61.8 59.3 EMU 8.8 8.9 8.3 7.4 0.4 0.8 0.1 -0.2 -2.9 -2.5 -1.3 -0.6 69.7 70.3 68.6 66.6 Belgium 8.4 8.4 8.2 7.5 2.0 3.5 2.6 2.7 0.0 -2.3 0.3 -0.2 94.2 92.1 88.2 84.9 Bulgaria 12.0 10.1 9.0 6.9 -8.5 -6.6 -12.0 -15.7 1.4 1.8 3.0 3.4 37.9 29.2 22.7 18.2 Czech Republic 8.3 7.9 7.1 5.3 -6.2 -5.4 -1.8 -3.3 -3.0 -3.6 -2.7 -1.6 30.4 29.7 29.4 28.7 Denmark 5.5 4.8 3.9 3.8 3.4 3.0 4.4 2.6 1.9 5.0 4.8 4.4 43.8 36.4 30.4 26.0 Germany 9.7 10.7 9.8 8.4 1.9 4.3 4.6 5.0 -3.8 -3.4 -1.6 0.0 65.6 67.8 67.6 65.0 Estonia 9.7 7.9 5.9 4.7 -11.3 -12.3 -10.0 -15.5 1.6 1.8 3.4 2.8 5.1 4.5 4.2 3.4 Ireland 4.5 4.3 4.4 4.6 0.0 -0.6 -3.5 -4.2 1.4 1.6 3.0 0.3 29.5 27.4 25.1 25.4 Greece 10.5 9.8 8.9 8.3 -6.4 -5.6 -7.1 N/A -7.4 -5.1 -2.6 -2.8 98.6 98.0 95.3 94.5 Spain 10.6 9.2 8.5 8.3 -3.5 -5.3 -7.4 -8.6 -0.3 1.0 1.8 2.2 46.2 43.0 39.7 36.2 France 9.3 9.2 9.2 8.3 0.4 0.5 -0.9 -1.3 -3.6 -2.9 -2.4 -2.7 64.9 66.4 63.6 64.2 Italy 8.0 7.7 6.8 6.1 -1.3 -0.9 -1.6 -2.6 -3.5 -4.2 -3.4 -1.9 103.8 105.8 106.5 104.0 Cyprus 4.6 5.2 4.6 3.9 -2.3 -5.0 -5.6 -5.9 -4.1 -2.4 -1.2 3.3 70.2 69.1 64.8 59.8 Latvia 10.4 8.9 6.8 6.0 -8.2 -12.9 -12.5 -22.3 -1.0 -0.4 -0.2 0.0 14.9 12.4 10.7 9.7 Lithuania 11.4 8.3 5.6 4.3 -6.8 -7.7 -7.2 -10.8 -1.5 -0.5 -0.5 -1.2 19.4 18.6 18.2 17.3 Luxembourg 5.1 4.5 4.7 4.7 8.0 11.6 10.9 10.3 -1.2 -0.1 1.3 2.9 6.3 6.1 6.6 6.8 Hungary 6.1 7.2 7.5 7.4 -7.9 -8.4 -6.8 -6.6 -6.5 -7.8 -9.2 -5.5 59.4 61.6 65.6 66.0 Malta 7.4 7.3 7.3 6.4 -3.1 -6.0 -8.7 -6.7 -4.6 -3.0 -2.6 -1.8 72.6 70.4 64.2 62.6 Netherlands 4.6 4.7 3.9 3.2 5.5 7.5 7.2 8.3 -1.7 -0.3 0.5 0.4 52.4 52.3 47.9 45.4 Austria 4.8 5.2 4.7 4.4 -0.2 0.5 1.1 2.8 -3.7 -1.5 -1.5 -0.5 63.8 63.5 61.8 59.1 Poland 19.0 17.7 13.8 9.6 -2.1 -4.2 -1.6 -3.2 -5.7 -4.3 -3.8 -2.0 45.7 47.1 47.6 45.2 Portugal 6.7 7.6 7.7 8.0 -6.1 -7.7 -9.7 -9.4 -3.4 -6.1 -3.9 -2.6 58.3 63.6 64.7 63.6 Romania 8.1 7.2 7.3 6.4 -5.5 -8.4 -8.6 -10.4 -1.2 -1.2 -2.2 -2.5 18.8 15.8 12.4 13.0 Slovakia 18.2 16.3 13.4 11.1 -0.8 -3.4 -8.4 -8.2 -2.4 -2.8 -3.6 -2.2 41.4 34.2 30.4 29.4 Finland 8.8 8.4 7.7 6.9 6.4 7.7 4.9 5.2 2.4 2.9 4.1 5.3 44.1 41.3 39.2 35.4 Sweden 6.3 7.4 7.0 6.1 7.2 6.7 6.9 7.2 0.8 2.2 2.3 3.5 51.2 50.9 45.9 40.6 United Kingdom 4.7 4.8 5.4 5.3 -1.3 -1.6 -2.5 -3.2 -3.4 -3.4 -2.6 -2.9 40.4 42.1 43.1 43.8 USA 5.5 5.1 4.6 4.6 -4.8 -5.5 -6.1 -6.1 -4.4 N/A N/A N/A 63.4 N/A N/A N/A
Sources of data: SORS; Eurostat. Notes: 1EU25 and euro area aggregates are adjusted for reporting errors concerning intra-EU trade; 2Provisional value; N/A - data not available.
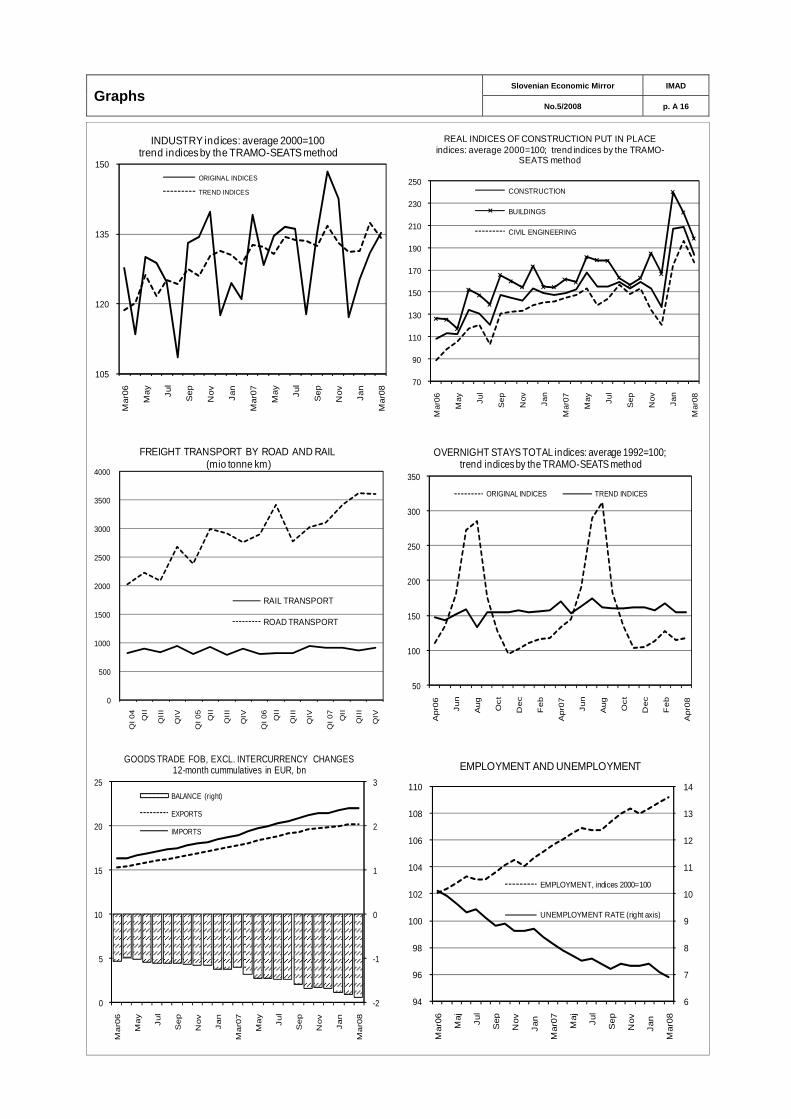
Slovenian Economic Mirror IMAD Graphs
No.5/2008 p. A 16
70
90
110
130
150
170
190
210
230
250
Mar
06
May Ju
l
Sep
Nov Jan
Mar
07
May Ju
l
Sep
Nov Jan
Mar
08
REAL INDICES OF CONSTRUCTION PUT IN PLACEindices: average 2000=100; trend indices by the TRAMO-
SEATS method
CONSTRUCTION
BUILDINGS
CIVIL ENGINEERING
105
120
135
150
Mar
06
May Ju
l
Sep
Nov Jan
Mar
07
May Ju
l
Sep
Nov Jan
Mar
08
INDUSTRY indices: average 2000=100trend indices by the TRAMO-SEATS method
ORIGINAL INDICES
TREND INDICES
0
500
1000
1500
2000
2500
3000
3500
4000
QI 0
4
QII
QII
I
QIV
QI 0
5
QII
QII
I
QIV
QI 0
6
QII
QII
I
QIV
QI 0
7
QII
QII
I
QIV
FREIGHT TRANSPORT BY ROAD AND RAIL(mio tonne km)
RAIL TRANSPORT
ROAD TRANSPORT
50
100
150
200
250
300
350
Apr
06 Jun
Aug Oct
Dec
Feb
Apr
07 Jun
Aug Oct
Dec
Feb
Apr
08
OVERNIGHT STAYS TOTAL indices: average 1992=100;trend indices by the TRAMO-SEATS method
ORIGINAL INDICES TREND INDICES
-2
-1
0
1
2
3
0
5
10
15
20
25
Ma
r06
Ma
y
Ju
l
Se
p
No
v
Ja
n
Ma
r07
Ma
y
Ju
l
Se
p
No
v
Ja
n
Ma
r08
GOODS TRADE FOB, EXCL. INTERCURRENCY CHANGES12-month cummulatives in EUR, bn
BALANCE (right)
EXPORTS
IMPORTS
6
7
8
9
10
11
12
13
14
94
96
98
100
102
104
106
108
110
Mar
06 Maj Ju
l
Se p
Nov
Jan
Mar
07 Maj Ju
l
Sep
Nov
Jan
Mar
08
EMPLOYMENT AND UNEMPLOYMENT
EMPLOYMENT, indices 2000=100
UNEMPLOYMENT RATE (right axis)

Slovenian Economic Mirror IMAD Graphs
No.5/2008 p. A 17
0
1500
3000
4500
6000
7500
9000
10500
12000
13500
15000
Mar
06
May Ju
l
Sep
Nov Jan
Mar
07
May Ju
l
Se p
Nov Jan
Mar
08
HOUSEHOLDS' DEPOSITS in EUR million
DOMESTIC CURRENCY
FOREIGNCURRENCIES
0
50
100
150
200
250
300
350
400
450
500
550
600
650
700
750
Apr
06 Jun
Aug Oct
Dec
Feb
Apr
07 Jun
Aug Oct
Dec
Feb
Apr
08
NET WAGES AND OTHER REMUNERATION, in EUR million
OTHER REMUNERATION BILL
TOTAL WAGE BILL
100
105
110
115
120
Apr
06 Jun
Aug Oct
Dec Feb
Apr
07 Jun
Aug Oct
Dec Feb
Apr
08
GROWTH IN SELECTED PRICE INDICATORSINDICES:2005=100
PRICE CONTROL
CONSUMER PRICE INDICES
PRODUCER PRICE INDICES (DOMESTIC MARKET)
100
150
200
250
300
350
400
450
500
Apr
06 Jun
Aug Oct
Dec Feb
Apr
07 Jun
Aug Oct
Dec Feb
Apr
08
PAYMENTS FOR INVESTMENT in EUR million, constant 2000 prices
100
102
104
106
108
110
112
Mar
06
May Ju
l
Sep
Nov Jan
Mar
07
May Ju
l
Sep
Nov Jan
Mar
08
EFFECTIVE EXCHANGE RATE IN REAL TERMSindices: average 2001=100
PRODUCER PRICE INDICES
CONSUMER PRICE INDICES
BASED ON RELATIVE:
130
135
140
145
150
155
160
165
170
0.6
0.8
1.0
1.2
1.4
1.6
1.8
Apr
06 Jun
Aug Oct
Dec Feb
Apr
07 Jun
Aug Oct
Dec Feb
Apr
08
EURO EXCHANGE RATES indices: average 2001 = 100
US$ / EUR
GBP / EUR
JPY / EUR (right axis)
Index Slovenian Economic Mirror IMAD
No. 5/2008 p. A 18
Agriculture and food processing industry agricultural production 6/04:15, 2/07:15 CAP reform 7/03:18-19 negotiations with the EU 2/02:23, 1/03:17 prices 3/03:14, 3/04:14, 3/05:13, 1/08:20-21, 2/08:16-17, 3/08:24 sample surveys of agricultural holdings 10/03:15
cattle breeding main indicators, number of cattle, BSE, milk production 1/08:20-21, 2/08:16-17
fishing 8-9/04:16, 10/06:17, 11/07:19 forestry 5/04:16, 11/06:19, 10/07:17 international trade 3/04:15, 4/06:23, 4/07:18 value added forecasting 4/07:21 Balance of payments see also External debt current account, capital and financial account, international money reserves 1/03:3,4, 2/03:4, 3/03:7, 4/03:5, 5/03:4, 6/03:4, 7/03:5, 8-9/03:6, 10/03:4, 11/03:4, 12/03:4, 1/04:4, 2/04:4-5, 3/04:6, 4/04:6, 5/04:4, 6/04:4, 7/04:4, 8-9/04:4-5, 10/04:5, 11/04:4-5, 12/04:4, 1/05:4, 2/05:4-5, 4/05:5, 5/05:4-5, 6/05:3, 7/05:4, 8-9/05:5, 10/05:6, 11/05:7-8, 12/05:4, 1/06:4, 2/06:4-5, 3/06:4, 4/06:6, 5/06:6-7, 6/06:6, 7/06:4, 8-9/06:6, 10/06:4, 11/06:6-7, 12/06:10, 1/07:5, 2/07:6-7, 4/07:7, 6/07:5-6, 7/07:5, 8-9/07:6, 11/07:7, 12/07:6, 1/08:5, 2/08:3, 3/08:8, 4/08:5, 5/08:5-6
terms of trade 2/03:4, 4/03:5, 5/03:4, 7/03:5, 5/08:5
export financing and export credit insurance 5/03:22
regional composition of trade 2/05:4, 3/07:16-17 trade in services
3/03:5, 7/03:5, 8-9/03:7, 2/04:6, 8-9/04:6, 12/04:29, 2/05:8, 8-9/05:6, 2/06:6, 8-9/06:7, 2/07:8, 8-9/07:7, 3/08:9 competitiveness of exports of services 12/03:17 coverage of international trade in services (methodology) 3/03:24,25 regional distribution 6/04:20
Business subjects 5/03:21, 5/04:20-21 Economic subjects 4/05:17, 4/06:22 Co-operative societies
business performance 11/03:17, 12/04:30, 11/05:23
Corporate sectorsss company performance
R&D: 6/05:18 by kind of ownership 11/04:18, 8-9/05:23 by origin of capital 11/04:19, 10/05:22 by size 10/03:22, 7/04:24, 8-9/04:26, 6/05:16 by share of exports in total revenues 11/02:19, 8-9/03:20, 10/04:20, 7/05:19 by technology intensity 10/07:20-21 by no. of employees 7/05:18 in 1994-2000 4/01:8 overall performance 6/03:13, 7/03:20, 6/04:21, 7/04:24, 5/05:19, 5/06:22, 10/06:20-21, 5/07:21, 5/08:15 in dairy industry: 1/08:20-21 in meat processing firms: 2/08:16-17
comparison of Slovenian and European enterprises 1/05:20-21 enterprises by size 7/05:17, 7/06:20-21, 8-9/07:22-23 entrepreneurial activity 5/06:17-18 compulsory settlement, bankruptcies, liquidations 3/05:19 ownership structure, ownership concentration
1/03:15, 3/05:22, 6/05:15 foreign direct investment
performance of companies employing foreign capital 7/03:21, 8-9/03:21, 10/03:21
number of business entities 5/07:20, 4/08:21 solvency of business entities 3/05:23, 5/06:23, 5/07:22, 4/08:22 small sole proprietorships 12/05:20 Doing Business rankings (WB) 12/06:24-25 Competitiveness (export competitiveness)
price and cost competitiveness – effective exchange rate, unit labour costs: quarterly trends 2/03:7, 5/03:5, 8-9/03:8, 11/03:5, 3/04:4, 5/04:5, 8-9/04:7, 11/04:6, 2/05:6, 10/05:4, 11/05:6, 2/06:7, 6/06:4, 8-
9/06:5, 12/06:8, 3/07:5, 5/07:6, 8-9/07:5, 11/07:6 annual trends 2/03:8, 3/04:5, 2/05:7, 3/07:5, 3/08:6
market share 10/05:5, 6/06:5, 12/06:9, 4/07:6, 3/08:7 value added and productivity
methodological changes in measuring competitiveness 12/06:26 Competitiveness of nations
global competitiveness and country risk, int. comparison 3/03:6
global competitiveness IMD's annual report 5/03:17, 5/04:18, 5/05:20-21, 7/05:22-23, 5/06:19-20, 5/07:23-24 - location attractiveness 11/03:20-21 WEF Report 1/05:18-19, 12/05:17-18, 1/06:19, 1/07:24-25 Country risk see Competitiveness of nations Crime international comparison 3/03:26 trends in Slovenia 4/03:17 Development Report 3/03:20-21, 3/05:4-5, 5/06:4-5 Distributive trades
selected indicators 3/06:11, 8-9/06:16, 12/06:18, 3/07:11, 6/07:13, 8-9/07:16, 12/07:13, 3/08:17 value added 3/03:15, 6/03:12, 8-9/03:17, 12/03:13, 6/04:14, 8-9/04:19, 3/06:11, 7/06:15, 8-9/06:16, 12/06:18, 3/07:11, 6/07:13, 8-9/07:16, 12/07:13, 3/08:17 sales capacities 12/06:23 competition 2/07:22
Earnings gross wage per employee by activities 1/03:10, 2/03:14-15, 4/03:12, 5/03:11, 6/03:10, 7/03:12, 8-9/03:13, 10/03:9, 11/03:11, 12/03:10, 1/04:11, 2/04:12, 3/04:12, 4/04:13, 5/04:11, 6/04:10, 7/04:11, 8-9/04:13, 10/04:13, 11/04:12, 12/04:10, 1/05:11, 2/05:14, 7/05:3, 8-9/05:12, 10/05:14, 11/05:14, 12/05:10, 1/06:12, 2/06:13, 3/06:9, 4/06:14, 5/06:10, 6/06:12-13, 7/06:11, 8-9/06:12, 10/06:11, 11/06:12, 12/06:15, 1/07:12, 2/07:12, 3/07:8, 4/07:14, 5/07:11, 6/07:11, 7/07:12, 8-9/07:12, 10/07:11, 11/07:12, 12/07:11, 1/08:12, 2/08:10, 3/08:15, 4/08:12, 5/08:9 earnings in the public sector 7/07:19-20
Economic growth see GDP see also Sustainable development see also Strategy for the Economic Development of Slovenia
Economic Policy Government’s Programme for Effective Integration into the European Union 7/03:3 Programme for Entering the ERM II and Introducing the Euro 11/03:3 Education see Human resources Energy sector electricity
selected indicators (production and consumption, international comparison) 1/03:13, 4/03:15, 7/03:15, 10/03:12, 1/04:14, 4/04:15, 7/04:15, 10/04:16, 1/05:14, 4/05:14, 7/05:14, 10/05:17, 1/06:15, 4/06:17, 7/06:13, 10/06:14, 1/07:15, 4/07:16, 7/07:15, 11/07:15, 1/08:15, 4/08:15 prices 10/04:16, 2/07:20-21 international comparison 7/06:13, 2/07:20-21
- electricity market 2/07:20-21, 11/07:15 oil and oil products
excise duties 1/03:13, 7/03:15, 4/04:15 prices – international comparison 1/03:13, 4/03:15, 7/03:15, 10/03:12, 1/05:14 pricing model for liquid fuel prices 1/03:13, 4/03:15, 4/04:15, 7/04:15,19
Environment – Environmental policy see also Sustainable development
environmental component of economic development 5/07:17 greenhouse gas emissions 6/07:22-23, 4/08:19
EU economic trends and forecasts 3/03:4-5, 7/03:4, 8-9/03:5, 7/04:3,19, 11/05:3, 11/06:4,
3/08:5, 4/08:3-4 Lisbon strategy 11/05:4-5 Stability and growth pact 10/06:19 tax and contributions structure 11/05:19-20 public finance flows between SLO and EU 1/07:26, 10/07:22-23 regional disparities: 4/08:20
Exchange rate see Competitiveness Exchange rate mechanism (ERM) II 6/04:3, 6/04:6 External debt of Slovenia
2/03:6, 10/04:6, 3/05:6 external debt statistics according to new methodology: - gross external debt it ´s dynamic
indicators 10/03:20 foreign exchange reserves/external debt 2/03:6
Forecasts for Slovenian economy by IMAD autumn forecasts 8-9/03:3, 10/04:3-4, 8-9/05:4, 8-9/06:4, 8-9/07:3 spring forecasts 4/03:3-4, 4/04:3-4, 4/05:3-4, 4/06:3-4, 4/07:4, 3/08:3 Foreign analysts forecasts
4/06:5 GDP – Slovenia annual growth 3/03:3, 8-9/03:4, 3/04:3, 3/05:3, 3/06:3, 3/07:3, 12/07:3, 3/08:4
- economic growth components 3/03:3, 8-9/03:4, 3/04:3, 3/05:3, 3/07:3, 12/07:5, 3/08:4
- international comparison see International environment quarterly growth
6/03:3, 8-9/03:4, 12/03:3, 3/04:3, 6/04:3, 8-9/04:3, 12/04:3, 1/05:3, 3/05:3, 8-9/06:3, 11/06:4-5, 11/07:4-5, 12/07:3, 12/07:5, 2/08:4, 3/08:5, 5/08:4
Past and Future of Slovenian GDP 12/04:22 Room for Future Improvement of Slovenian GDP Growth 12/04:23 Global competitiveness see Competitiveness of nations Households private consumption and indebtedness 1/04:13, 7/04:13, 8-9/04:15, 12/04:12, 3/05:16, 6/05:11, 8-9/05:15, 12/05:11, 3/06:12, 6/06:15, 8-9/06:15, 12/06:17, 3/07:9, 3/07:18, 6/07:15, 8-9/07:15, 12/07:15, 3/08:19 available and allocated assets of households 12/05:19, 1/07:20-21, 12/07:20-21, 1/08:22 Human development see Social indicators Human resources see also Social Indicators Education
youth in secondary education 6/07:19-21 adults in secondary schools 7/06:22-23 informal/continuing education 10/06:18, 12/07:19 lifelong learning 6/06:21-22 higher education 7/05:20-21, 8-9/05:22, 7/06:24 higher education-scholarships 8-9/06:21, 1/08:19 mobility of students 4/07:24-25, 5/07:18-19 expenditure on educational institutions – international comparison 6/05:17, 1/06:20-21 public expenditure on education – international comparison 12/04:21, 1/06:20-21 science and technology graduates 3/06:16-17
Industry and construction construction 2/03:17, 5/03:14, 8-9/03:16,
11/03:14, 2/04:15, 5/04:14, 8-9/04:18, 12/04:14, 2/05:17, 5/05:12, 8-9/05:14, 11/05:16, 2/06:15, 5/06:12, 8-9/06:14, 11/06:14, 2/07:14, 5/07:13, 8-9/07:14, 11/07:14, 2/08:12, 5/08:11
manufacturing technology intensity 10/07:20-21, 11/07:13 production volumes, trends, forecasts and employment 1/03:12, 3/03:17, 4/03:14, 5/03:13, 6/03:13, 7/03:14, 8-9/03:15, 10/03:11, 11/03:13, 12/03:12, 2/04:14, 5/04:13, 6/04:12, 7/04:14, 8-9/04:17, 10/04:15, 11/04:14, 12/04:13, 1/05:13, 2/05:16, 4/05:13, 5/05:11, 6/05:12, 7/05:12,
Index Slovenian Economic Mirror IMAD
No. 5/2008 p. A 19
8-9/05:13, 10/05:15, 11/05:15, 12/05:12, 1/06:13, 2/06:14, 3/06:10, 4/06:15, 5/06:11, 6/06:14, 7/06:12, 8-9/06:13, 10/06:12, 11/06:13, 12/06:16, 1/07:13, 2/07:13, 4/07:15, 5/07:12, 6/07:12, 7/07:13, 8-9/07:13, 10/07:12, 11/07:13, 12/07:12, 1/08:13, 2/08:11, 3/08:16, 4/08:13, 5/08:10 value added and productivity by activities 8-9/03:15
Industrial policy State aid – international comparisons 1/03:16 Industrial relations see also Labour market employment relationship
collective bargaining coverage and extension procedures 2/04:22-23 European works councils 5/05:22 working time 11/04:20
data collections and international comparisons 3/04:20-21 membership in employers’ organisations 12/03:18 employee participation in a European Joint-Stock Company 3/05:23 Inflation see Prices Institutions
trust in institutions 4/06:21 Insurance sector international comparison export financing and export credit insurance see Balance of payments / foreign trade policy International environment
7/03:4, 8-9/03:5, 1/05:3, 5/05:3, 4/06:5, 12/06:6-7, 1/07:4, 2/07:4-5, 3/07:4, 4/07:5, 5/07:4-5, 6/07:4, 7/07:4, 8-9/07:4, 10/07:4, 11/07:4-5, 12/07:4, 1/08:4, 2/08:4, 4/08:3, 5/08:3-4 Germany 1/02:5, 3/03:4,5, 7/03:4, 4/06:5, 12/06:6-7, 2/07:4, 4/07:5, 5/07:4-5, 7/07:4, 1/08:4, 5/08:4
candidate-countries for the EU economic developments and forecasts 4/02:4
Croatia 3/07:4, 6/07:4 Labour market see also Industrial relations unemployment
structure of registered unemployment 2/03:13, 7/03:11, 8-9/03:12, 1/06:11, 2/08:9 survey unemployment rate 3/03:12, 5/03:10, 8-9/03:12, 2/04:11, 2/05:13, 2/06:3, 12/06:14, 2/07:3, 2/07:11, 5/07:3, 2/08:9, 5/08:8 selected labour market indicators 1/03:9, 2/03:13, 3/03:12, 4/03:11, 5/03:10, 6/03:9, 7/03:11, 8-9/03:12, 10/03:8, 11/03:10, 12/03:9, 1/04:10, 2/04:11, 3/04:11, 4/04:12, 5/04:10, 6/04:9, 7/04:10, 8-9/04:12, 10/04:12, 11/04:11, 12/04:9, 1/05:10, 2/05:13, 3/05:11, 4/05:11, 5/05:10, 6/05:10, 7/05:11, 8-9/05:11, 10/05:13, 11/05:13, 12/05:9, 1/06:10, 2/06:11, 3/06:8, 4/06:12, 5/06:3, 5/06:9, 6/06:11, 7/06:10, 8-9/06:11, 10/06:10, 11/06:11, 12/06:14, 1/07:11, 2/07:10, 3/07:7, 4/07:13, 5/07:10, 6/07:3, 6/07:10, 7/07:11, 8-9/07:11, 10/07:10, 11/07:11, 12/07:10, 1/08:11, 2/08:8, 3/08:14, 4/08:11, 5/08:8 vacancies and people hired 2/06:12 job vacancy rate 10/07:18 education structure of persons in employment 12/03:9 employment by activities 4/06:13 employment rate of older workers 8-9/04:25 employment of foreigners 4/07:22-23 jobs and (un)employment across regions 3/03:19, 8-9/07:21, 10/07:19 labour market flexibility 3/05:20-21 occupational structure of labour demand 4/03:11 structural unemployment 10/03:8 part-time work 2/03:19
employment programmes 10,000 Programme 11/03:10 Public Works Programmes 4/04:12 Programme of promoting self-employment 5/04:10
legislation Employment of Foreigners Act 6/03:9 Vocational Rehabilitation and Employment of Disabled Persons Act 7/04:10
productivity growth 1/04:10 Manufacturing see Industry Money market and monetary policy money aggregates, interest and exchange rates
1/03:6, 2/03:10, 3/03:9, 4/03:7, 5/03:7, 6/03:6, 7/03:7, 10/03:6, 11/03:7, 12/03:6, 1/04:6, 2/04:8, 3/04:8, 4/04:8, 5/04:7, 6/04:6, 7/04:6, 8-9/04:9, 10/04:8, 11/04:8, 12/04:6, 1/05:6, 2/05:10, 3/05:8, 4/05:7, 5/05:7, 6/05:7, 7/05:6, 8-9/05:8, 10/05:8, 11/05:10, 12/05:6 monetary policy guidelines 10/02:3-4
banks money market, loans 1/03:8, 2/03:12, 3/03:11, 4/03:9, 5/03:9, 6/03:8, 7/03:9, 8-9/03:11, 11/03:9, 12/03:8, 1/04:8, 2/04:10, 3/04:10, 4/04:10, 5/04:9, 6/04:8, 7/04:8, 8-9/04:11, 10/04:10, 11/04:10, 12/04:8,1/05:8, 2/05:12, 3/05:10, 4/05:9, 5/05:9, 6/05:9, 7/05:8, 8-9/05:10, 10/05:10, 11/05:12, 12/05:8, 1/06:7, 2/06:10, 3/06:7, 4/06:9, 6/06:8, 7/06:6, 8-9/06:9, 10/06:6, 11/06:9, 12/06:12, 1/07:7, 4/07:10, 5/07:9, 6/07:9, 7/07:8, 8-9/07:10, 10/07:7, 11/07:10,12/07:9, 1/08:8, 2/08:7, 3/08:11, 4/08:8
savings with banks and mutual funds 1/03:7, 2/03:11, 3/03:10, 4/03:8, 5/03:8, 6/03:7, 7/03:8, 8-9/03:10, 11/03:8, 12/03:7, 1/04:7, 2/04:9, 3/04:9, 4/04:9, 5/04:8, 6/04:7, 7/04:7, 8-9/04:10, 10/04:9, 11/04:9, 12/04:7, 1/05:7, 2/05:11, 3/05:9, 4/05:8, 5/05:8, 6/05:8, 7/05:7, 8-9/05:9, 10/05:9, 11/05:11, 12/05:7, 1/06:6, 2/06:9, 3/06:6, 4/06:8, 5/06:21, 6/06:9, 7/06:7, 8-9/06:10, 10/06:7, 11/06:10, 12/06:13, 1/07:8, 4/07:9, 5/07:8, 6/07:8, 7/07:7, 8-9/07:9, 10/07:6, 11/07:9, 12/07:8, 1/08:7, 2/08:6, 3/08:12, 4/08:7
Maastricht criteria long-term interest rates 5/04:19 Population 1/07:22-23, 12/07:22-23 household savings see The money market Prices price trends – inflation, administered and unregulated prices
1/03:5, 2/03:9, 3/03:8, 4/03:6, 5/03:6, 6/03:5, 7/03:6, 8-9/03:9, 10/03:5, 11/03:6, 12/03:5, 1/04:5, 2/04:7, 3/04:7, 4/04:7, 5/04:6, 6/04:5, 7/04:5, 8-9/04:8, 10/04:7, 11/04:7, 12/04:5, 1/05:5, 2/05:9, 3/05:7, 4/05:6, 5/05:6,23,24, 6/05:6, 7/05:5, 8-9/05:3, 8-9/05:7, 10/05:3, 10/05:7, 11/05:9, 12/05:3,5, 1/06:5, 2/06:8, 3/06:5, 4/06:7, 5/06:8, 6/06:7, 7/06:5,19, 8-9/06:8, 10/06:5, 11/06:8, 12/06:3, 12/06:11, 1/07:6, 1/07:19, 2/07:9, 3/07:6, 4/07:8, 4/07:3, 5/07:3, 5/07:7, 6/07:3, 6/07:7, 7/07:3, 7/07:6, 8-9/07:3, 8-9/07:8, 10/07:3, 10/07:5, 11/07:3, 11/07:8, 12/07:3, 12/07:7, 1/08:6, 2/08:3, 2/08:5, 3/08:3, 3/08:10, 4/08:6, 5/08:3-7
prices policy 5/05:23, 6/05:6 harmonised index of consumer prices 1/05:22 core inflation 2/03:9, 3/03:8, 6/03:5 producer prices 3/07:6 bond yield curve see Money market and Monetary policy and Stock Exchange Productivity see Industry and Competitiveness
Private Consumption see Households Public finance general government revenue 1/03:11, 2/03:16, 3/03:13, 4/03:13, 5/03:12, 6/03:11, 7/03:13, 10/03:10, 11/03:12, 12/03:11, 1/04:12, 2/04:13, 3/04:13, 4/04:14, 5/04:12, 6/04:11, 7/04:12, 8-9/04:14, 10/04:14, 11/04:13, 12/04:11, 1/05:12, 2/05:15, 4/05:12, 7/05:10, 10/05:12, 1/06:9, 4/06:11, 7/06:9, 10/06:9, 1/07:10, 4/07:12, 7/07:10, 10/07:9, 1/08:10, 3/08:13, 4/08:10 general government expenditures 3/05:12, 6/06:10, 3/08:13 general government balance 12/04:3, 3/05:12, 3/08:13 state budget expenditure 3/05:12 public expenditure on education – international comparison 12/04:21
Public services network see also Human resources 7/04:20 − international comp. 7/04:21
Public institutes financial results in 2002 11/03:18 financing 11/03:19 Public Health Institutes 2/04:20-21 Quality of life see Social indicators Research and development see Technological development Regional development
company performance by regions 7/05:24, 2/07:24-25 development deficiency index 7/06:25 jobs and (un)employment across regions 10/03:16, 4/04:20, 7/05:24, 2/07:24-25, 8-9/07:21, 10/07:19 regional GDP 8-9/03:19, 4/04:20, 7/04:23, 7/05:24, 2/06:19 population’s education structure – regional aspect 6/03:15, 4/04:20 population’s demographic structure 5/06:24, 11/07:20 personal income tax base per capita 6/06:20, 3/08:23
Report on structural reforms 10/03:3 structural changes in network industries 4/07:26-27 Report on economic and social cohesion 2/04:18-19 Services domestic trade see Distributive trades information technology see Information technology real estate, renting and business services
4/04:16, 5/05:15, 12/05:13 prices of telecommunication services 2/06:20 tourism see Tourism trade in services see Balance of payments Social indicators civil society see Civil society equal opportunities policy 1/04:20-21, 3/04:18-19, 2/05:21-22 trust in other people 6/06:19 Human Development Report 5/03:18-19, 8-9/05:19, 11/06:17, 1/08:23 Social Overview 2006 12/06:4-5 human resources mortality caused by injuries:
- due to external causes of injury 4/03:18 - by age and gender 5/03:20
gender-related development index 3/03:22, 10/05:21 gender empowerment measure 10/03:17, 10/04:19 gender equality 10/04:19 human development index 7/03:17, 7/04:22 health insurance
– supplementary 1/04:19 health expenditure 2/07:23, 4/07:30-31 social welfare
cash benefits 11/06:18 social protection of the elderly 3/03:23 indicators (happiness, satisfaction with life, etc) 12/04:24-25, 3/06:18, 4/07:28-29 jobless households 3/07:15 long-term care 12/04:26-27, 4/07:32 the at-risk-of-poverty rate 11/03:22, 11/04:17, 6/07:24, 2/08:15
transfers expenditures for social protection 4/04:19, 3/06:19, 11/07:21 social benefits: – pensions 2/07:19 – financial social assistance 1/05:17
trust in institutions see Institutions Stock exchange turnover, capitalisation, indices
4/03:10, 7/03:10, 10/03:7, 1/04:9, 4/04:11, 7/04:9, 10/04:11, 1/05:9, 4/05:10, 7/05:9, 10/05:11, 1/06:8, 4/06:10, 7/06:8, 10/06:8, 1/07:9, 4/07:11, 7/07:9, 10/07:8, 1/08:9, 4/08:9 bonds 4/04:11
Index Slovenian Economic Mirror IMAD
No. 5/2008 p. A 20
Strategy of Slovenia’s Development 6/05:4,5 Sustainable development
ecological footprint 8-9/05:20-21 Technological development
R&D activity in Slovenia 10/03:18-19 Public Research Institutes 11/05:21-22 science and technology graduates/students 3/06:16-17, 11/07:22-23
Tourism travels of domestic population 1/03:14, 3/03:16, 5/03:15, 7/03:16, 1/04:16, 12/04:28, 1/06:22, 1/07:27
foreign exchange receipts 3/06:15, 12/06:19, 3/08:18 overnight stays by resort 3/03:16, 5/03:15, 1/04:15, 5/06:13, 6/07:14
selected indicators 3/03:16, 5/03:15, 10/03:13, 1/04:15, 6/04:13, 8-9/04:21, 12/04:17, 3/05:14, 5/05:14, 10/05:18, 1/06:16, 5/06:13, 8-9/06:17, 12/06:19, 3/07:10, 6/07:14, 8-9/07:17, 12/07:14, 3/08:18
survey on foreign tourists in the summer season 6/04:19
Transport
selected indicators 5/03:16, 11/03:15, 2/04:16, 5/04:15, 8-9/04:20, 12/04:15, 3/05:15, 7/05:13, 10/05:16, 1/06:14, 4/06:16, 7/06:14, 10/06:13, 1/07:14, 4/07:17, 7/07:14, 10/07:13, 1/08:14, 4/08:14
Value added see Competitiveness and Industry and Distributive trades Welfare see Sustainable development social welfare indicators: see Social indicators
Acronyms in the text have the following meanings: AIS-Agricultural Institute of Slovenia, AJPES-Agency of the Republic of Slovenia for Public Legal Records and Related Services, AP-Agency of the Republic of Slovenia for Payments, APr-Agency of the Republic of Slovenia for Privatisation, BS-Bank of Slovenia, bn-billion, CCIS-Chamber of Commerce and Industry of Slovenia, CSCC-Central Securities Clearing Corporation, DUNZ–Directorate of Administrative Interior Affairs, DURS-Tax Administration of the Republic of Slovenia, EIMV-Electro Institute Milan Vidmar, ELES-Electro Slovenia, ESS-Employment Service of Slovenia, GEM-Global Entrepreneurship Monitor, HICP-Harmonised Index of Consumer Prices, HII-Health Insurance Institute, ICT-information and communications technologies, IER-Institute for Economic Research, IAAD-International Administrative Affairs Directorate, IMAD-Institute of Macroeconomic Analysis and Development, IPI-Industrial Price Index, LSE-Ljubljana Stock Exchange, m-million, MAFF-Ministry of Agriculture, Forestry and Food, MEA-Ministry of Economic Affairs, MES-Ministry of Education and Sport, MESP-Ministry of the Environment and Spatial Planning, MF-Ministry of Finance, MIA-Ministry of Internal Affairs, MLFSA-Ministry of Labour, Family and Social Affairs, MMTS-Market Maker Trading Segment, MST-Ministry of Science and Technology, N/A or (-)-not available, N/R-not reasonable, NFC-National Financial Corporation, OG-Uradni list Republike Slovenije (Official Gazette of the Republic of Slovenia), PDII-Pension and Disability Insurance Institute, p.p.-percentage points, PPA-Public Payments Administration of the Republic of Slovenia, PPP-purchasing power parity, PPS-purchasing parity standards, SCA – Standard Classification of Activities, SDC-Slovene Development Corporation, SEC-Slovene Exports Corporation, SIA-Slovenian Insurance Association, SITC-Standard International Trade Classification, SMARS-Surveying and Mapping Authority of the Republic of Slovenia, SORS-Statistical Office of the Republic of Slovenia. Acronyms of Standard Classification of Activities (SCA): A-Agriculture, hunting, forestry, B-Fishing, C-Mining and quarrying, D-manufacturing, DA-food beverages and tobacco, DB-textiles and textile products, DC-leather and leather products, DD-wood and wood products, DE-paper, publishing, printing, DF-coke, petroleum products and nuclear fuel, DG-chemicals, DH-rubber and plastic products, DI-non-metal mineral products, DJ-metals and metal products, DK-machinery and equipment, DL-electrical and optical equipment, DM-transport equipment, DN-furniture and NEC, E-Electricity, gas and water supply, F-Construction, G-Wholesale, retail, trade, repair, H-Hotels and restaurants, I-Transport, storage, communications, J-Financial intermediation, K-Real estate, renting and business activities, L-Public administ. & defence; comp. soc. sec., M-Education, N-Health and social work, O-Other social and personal services. Acronyms of Countries: AT-Austria, BE-Belgium, BG-Bulgaria, BY-Belarus, CH-Switzerland, CZ-Czech Republic, CY-Cyprus, DE-Germany, DK-Denmark, ES-Spain, EE-Estonia, EL-Greece, FR-France, FI-Finland, HU-Hungary, I-Italy, IE-Ireland, JP-Japan, LU-Luxembourg, LV-Latvia, LT-Lithuania, MT-Malta, NL-Netherlands, NO-Norway, PT-Portugal, RO-Romania, RU-Russia, SE-Sweden, UA-Ukraine, UK-United Kingdom, US-United States of America, PL-Poland, SI-Slovenia, SK-Slovakia. Data: data for trends and seasonally adjusted series are calculated by using TRAMO-SEATS method if not stated otherwise.
The IMAD's Other Publications Slovenian Economic Mirror IMAD
No. 5/2008
Social Overview 2006, 2007 Forecasts of
Economic Trends
Autumn Forecast of Economic Trends 2007
Analysis, Research and Development
Slovenia's Development Strategy (SDS 2006–2013), 2005 Spring Report 2006 Autumn Report 2006 Human Development Report Slovenia 2002–2003
Development Report 2007
Slovenia – On the Way to the Information Society
Working papers
• No. 6/2007. Innovation Cooperation and Innovation Activity of Slovenian Enterprises, Jaklič Andreja, Jože P. Damijan, Matija Rojec
• No. 11/2006. Firm of Private Value: What is Behind the Creation of Multiple Blockholder Structure? A. Brezigar Masten, A. Gregorič, K. Zajc
• No. 2/2006. Does Exporting Boost Capital Investments? The Evidence from Slovenian Manufacturing Firms' Balance Sheets, A. Burger, M. Ferjančič
• No. 5/2004. On the possibility of negative effects of EU entry on output, employment, wages and inflation in Slovenia, A. Brezigar
• 4/2004. Future GDP growth in Slovenia: Looking for room for improvement, E. L. W. Jongen
• 3/2004. An analysis of past and future GDP growth in Slovenia, E. L. W. Jongen
• 1/2004. Productivity growth and functional upgrading in foreign subsidiaries in the Slovenian manufacturing sector, M. Rojec, B. Majcen, A. Jaklič, S. Radošević
More Working papers are available in Slovene. Internet http://www.gov.si/umar

Subscription Form Slovenian Economic Mirror IMAD
No. 5/2008
Subscriber details
Natural – legal person (please encircle as appropriate)
Name and surname/Company name:
Street, number: Postal code, city:
E-mail:
Phone/fax no.: Subscription date:
ID for VAT _ _ _ _ _ _ _ _ Stamp and signature of the responsible person
VAT–liable taxpayer yes – no (please encircle as appropriate) I irrevocably subscribe to
Yearly subscription* Publication Yearly subscription rate (in EUR) Enter the number of yearly
subscriptions Ekonomsko ogledalo 66.77 (11 copies) Ekonomski izzivi 10.43 Poročilo o razvoju 12.52 IB Revija 41.73 (4 copies) Slovenian Economic Mirror 66.77 (11 copies) Development Report 12.52 *Your subscription will be renewed automatically for the next year. Cancellation of the subscription takes effect at the end of your current subscription year. It should be submitted in writing not later than at the end of the calendar year. Separate copies
Publication Single copy rate (in EUR) Enter the publication number and the number of copies
Ekonomsko ogledalo 6.26 Ekonomski izzivi 10.43 Poročilo o razvoju 12.52 Socialni razgledi 16.00 IB Revija 12,52 (16.69 double issue) Slovenian Economic Mirror 6.26 Development Report 12.52 Social Overview 26.00
8.5% VAT is not included in the price. Discounts are subject to agreement (bulk discounts up to 25% for larger quantities of one title). Please fill in the form and send it to the e-mail address [email protected], fax 01/4781070 or to the Institute of Macroeconomic Analysis and Development, Gregorčičeva 27, 1000 Ljubljana. You will receive the ordered publications and the invoice by post. Other publications in printed form are listed on our website www.umar.gov.si. For additional information please e-mail [email protected] or call 01/478 10 43.