Embed Size (px)
Citation preview
1
SLOVENIAN AGRI-FOOD SECTOR – A DECADE AFTER
THE EU ACCESSION
Kožar Maja
1, Pintar Marjeta
1, Volk Tina
1
1 Agricultural Institute of Slovenia, Hacquetova ulica 17, 1000 Ljubljana, Slovenia;
Tel.: +386 (0)1 280 5225; E-mail: [email protected] (Corresponding author)
The paper was part of the organized session “Economic effects of joining the EU for agro-food sectors in
Central and Eastern European countries (CEECs) – expected and unexpected developments” at the
EAAE 2014 Congress ‘Agri-Food and Rural Innovations for Healthier Societies’
August 26 to 29, 2014
Ljubljana, Slovenia
Copyright 2014 by Kožar Maja, Pintar Marjeta and Volk Tina. All rights reserved. Readers may
make verbatim copies of this document for non-commercial purposes by any means, provided that this
copyright notice appears on all such copies.
2
Abstract
The paper outlines the most noticeable economic effects of the 2004 accession of
Slovenia to the European Union (EU) on its agri-food sector. The main national statistical
data are used to compare the situation in the Slovenian agri-food sector in the pre- and post-
accession period.
The main expected effects were related to joining the vast Common market through
increased market competition and opportunities, as well as through the structural and
organizational adjustments of a relatively small agri-food sector to it. Unexpectedly, these
adjustments were halted in general, resulting most evidently in the increased export of raw
agri-food products and import of processed products.
Slovenian agri-food chain, especially the food industry, remains heavily challenged by its
relatively poor competitive and organizational performance, both even more pronounced a
decade after the EU accession.
Key words: agriculture, agricultural policy, EU accession, Slovenia, accession effects
Introduction
Studies analyzing the first years after the 2004 accession of Slovenia to the EU (e.g.,
Volk et al., 2006 and 2007) mostly concluded that the EU accession has not severely affected
the Slovenian agriculture. This was mainly attributed to the fact that the Slovenian
agricultural policy was to a large extent already compliant with the Common Agricultural
Policy (CAP) of the EU in the pre-accession period. In practice this largely meant a
continuation of the pre-accession national agricultural policy, but with the increased
budgetary support. Further, the pre-accession agricultural price level was at a level,
comparable to the EU, in some cases even higher.
The forecasts for the market and income developments after the EU accession were also
relatively favorable for the Slovenian agriculture in general (e.g., preservation or increase of
pre-accession agricultural income level), mainly due to the favorable starting position in terms
of the negotiated funds for the Slovenian agriculture and rural development, compliant
agricultural policy and expanded market opportunities through the Common market (adopted
from Münch, 2000; Erjavec et al., 2003; Kavčič et al., 2003; Report on the state …, 2005-
2013; Rednak et al., 2007). Expected aggregate price drop was forecasted to be mitigated by
the overall higher budgetary support. Regarding the foreign trade, it was expected that the
traditionally negative trade balance with agri-food products will further deteriorate after the
EU accession (Kuhar and Erjavec, 2007). Also, comprehensive structural adjustments of the
Slovenian agri-food sector were expected to ensue after the EU accession (Volk et al., 2007).
The direction and magnitude of the forecasted economic effects were strongly influenced by
the choice of modelling method and assumptions (e.g., see in Rednak et al., 2007), especially
regarding the evaluation of vertical transmission between agriculture and food industry
(Kuhar and Erjavec, 2007). Also, many of the studies expected favorable or neutral economic
results for the Slovenian agriculture at the aggregate level, whereas at the level of individual
sub-sectors and activities the forecasts were more diverse in direction and magnitude (Kavčič
and Erjavec, 2003; Rednak et al., 2007; Kuhar and Erjavec, 2007; Volk, 2008).
The forecasts for the Slovenian food industry after the EU accession were generally less
favorable than for agriculture, mainly due to the protectionist-like pre-accession policy for the
processed products and managerial (organizational) and structural rigidity (e.g., Erjavec et al.,
2003; Kuhar and Erjavec, 2007; Kuhar et al., 2012). The negative impacts of opening the
3
borders and higher competition in retail supply were expected to occur (Kuhar and Erjavec,
2007).
Aim of the paper is to highlight most noticeable economic effects of the EU accession on
the agri-food sector in Slovenia. The available national statistics data were used to compare
the main indicators of the economic performance of the Slovenian agri-food sector in the pre-
and post-accession period in terms of the following aspects: macroeconomics, agricultural
policy and budgetary support, production, prices, income, food industry and foreign trade.
The research questions were two:
1. Does data confirm the expected general developments of post-accession situation in
the Slovenian agri-food sector (outlined above)?
2. If situation is different than expected, which could be the main reasons?
The macroeconomic role of agri-food sector
Slovenia was economically the most developed acceding country (Kuhar and Erjavec,
2007) and in the first post-accession years macroeconomic conditions were relatively
favorable (Volk et al., 2007; Rednak et al., 2007). In 2003, a year preceding the EU accession,
the annual economic growth rate was 2.9% (real GDP), GDP per capita in PPS at 84% in EU
terms, and unemployment rate was lower than in EU (6.7% vs. 9.1%). In 2008 the global
economic crisis occurred, and its adverse lagged effects remain present and put additional
pressure on the agri-food sector in Slovenia.
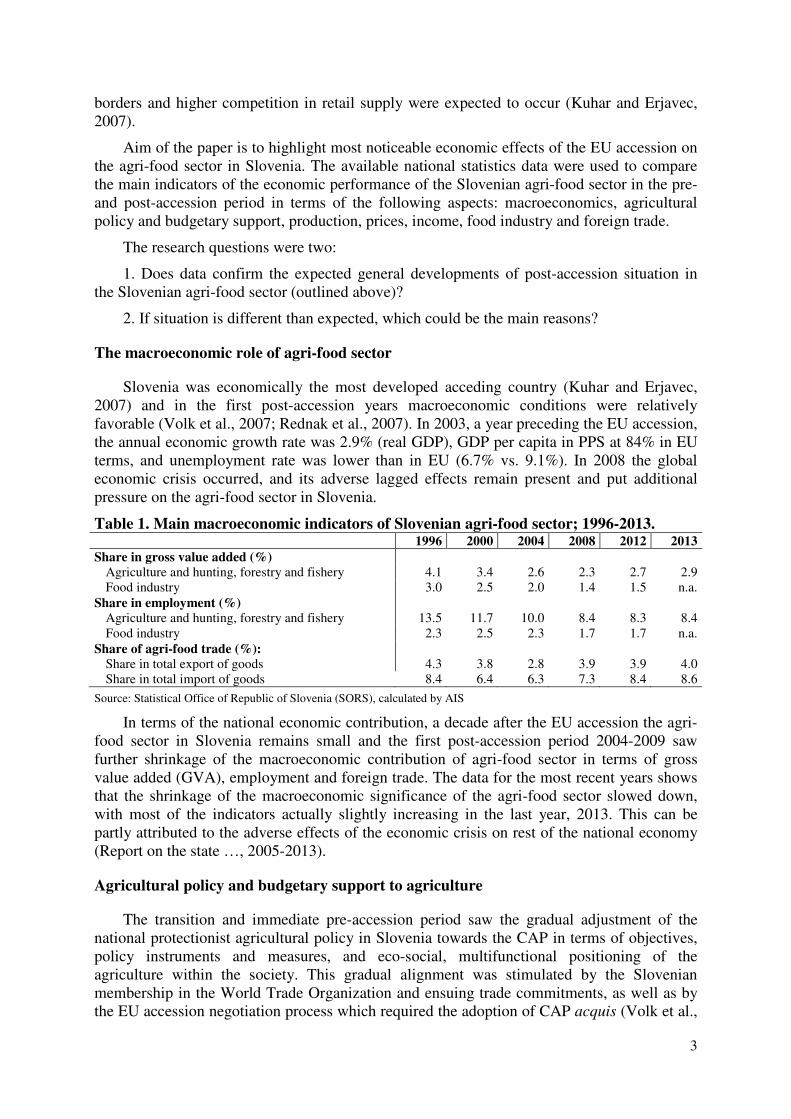
Table 1. Main macroeconomic indicators of Slovenian agri-food sector; 1996-2013. 1996 2000 2004 2008 2012 2013
Share in gross value added (%)
Agriculture and hunting, forestry and fishery 4.1 3.4 2.6 2.3 2.7 2.9
Food industry 3.0 2.5 2.0 1.4 1.5 n.a.
Share in employment (%)
Agriculture and hunting, forestry and fishery 13.5 11.7 10.0 8.4 8.3 8.4
Food industry 2.3 2.5 2.3 1.7 1.7 n.a.
Share of agri-food trade (%):
Share in total export of goods 4.3 3.8 2.8 3.9 3.9 4.0
Share in total import of goods 8.4 6.4 6.3 7.3 8.4 8.6
Source: Statistical Office of Republic of Slovenia (SORS), calculated by AIS
In terms of the national economic contribution, a decade after the EU accession the agri-
food sector in Slovenia remains small and the first post-accession period 2004-2009 saw
further shrinkage of the macroeconomic contribution of agri-food sector in terms of gross
value added (GVA), employment and foreign trade. The data for the most recent years shows
that the shrinkage of the macroeconomic significance of the agri-food sector slowed down,
with most of the indicators actually slightly increasing in the last year, 2013. This can be
partly attributed to the adverse effects of the economic crisis on rest of the national economy
(Report on the state …, 2005-2013).
Agricultural policy and budgetary support to agriculture
The transition and immediate pre-accession period saw the gradual adjustment of the
national protectionist agricultural policy in Slovenia towards the CAP in terms of objectives,
policy instruments and measures, and eco-social, multifunctional positioning of the
agriculture within the society. This gradual alignment was stimulated by the Slovenian
membership in the World Trade Organization and ensuing trade commitments, as well as by
the EU accession negotiation process which required the adoption of CAP acquis (Volk et al.,
4
2007). The previous, predominantly market-price support oriented policy, composed
predominantly of high border protection and administration of prices on internal markets,
shifted to the policy of budgetary support, thus transposing the burden of agricultural support
from consumers to taxpayers (Volk et al., 2007). At the time of the EU accession the
Slovenian agricultural policy and budgetary support were at a level, strongly compliant with
the EU (Erjavec, 2004, quoted from Volk et al., 2007; Volk, 2004, quoted from Volk et al.,
2007).
Slovenia was relatively successful in the accession negotiations: the highest level of
national complementing of direct payments was granted among all ten candidate countries,
quotas and reference quantities were higher than the actual production level at the time
(enabling a favorable premium rights volume), and the negotiated rural development funds
were relatively most favorable among all acceding countries (Volk et al., 2007). Slovenia
entered the EU with majority of the direct payments at the 85% EU15 level, reaching 100%
level in 2007 by the means of phasing-in and national topping up.
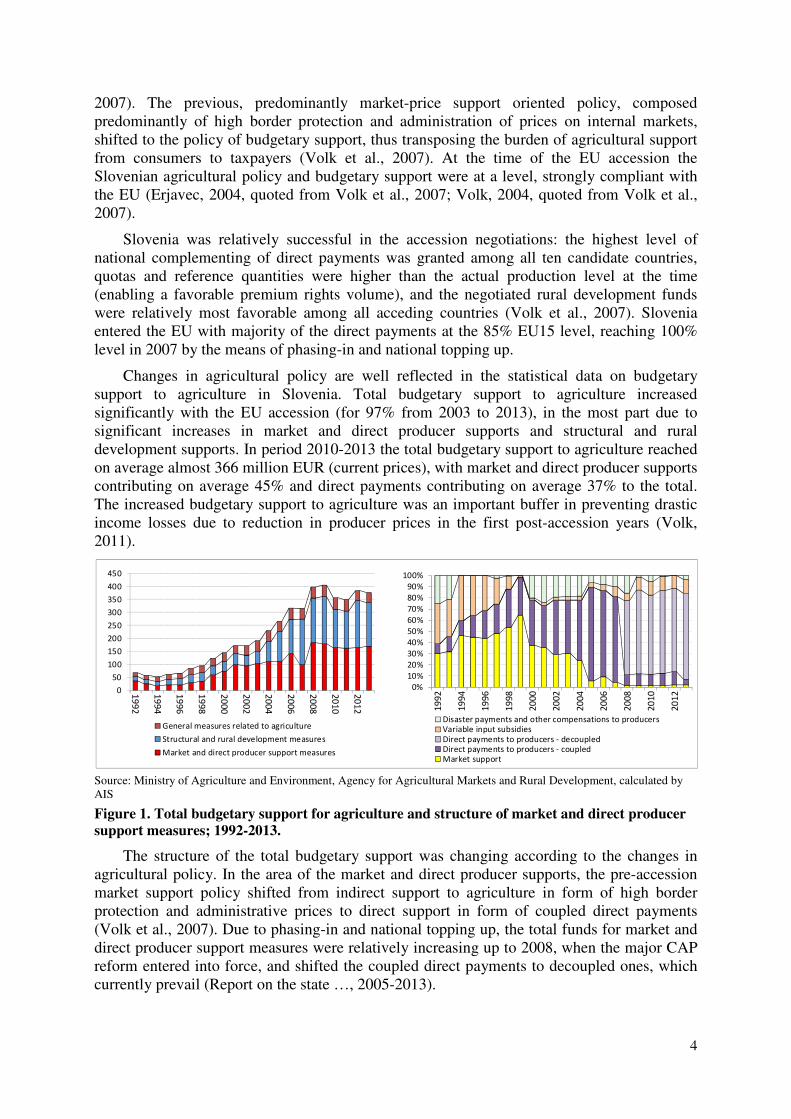
Changes in agricultural policy are well reflected in the statistical data on budgetary
support to agriculture in Slovenia. Total budgetary support to agriculture increased
significantly with the EU accession (for 97% from 2003 to 2013), in the most part due to
significant increases in market and direct producer supports and structural and rural
development supports. In period 2010-2013 the total budgetary support to agriculture reached
on average almost 366 million EUR (current prices), with market and direct producer supports
contributing on average 45% and direct payments contributing on average 37% to the total.
The increased budgetary support to agriculture was an important buffer in preventing drastic
income losses due to reduction in producer prices in the first post-accession years (Volk,
2011).
Source: Ministry of Agriculture and Environment, Agency for Agricultural Markets and Rural Development, calculated by
AIS
Figure 1. Total budgetary support for agriculture and structure of market and direct producer
support measures; 1992-2013.
The structure of the total budgetary support was changing according to the changes in
agricultural policy. In the area of the market and direct producer supports, the pre-accession
market support policy shifted from indirect support to agriculture in form of high border
protection and administrative prices to direct support in form of coupled direct payments
(Volk et al., 2007). Due to phasing-in and national topping up, the total funds for market and
direct producer support measures were relatively increasing up to 2008, when the major CAP
reform entered into force, and shifted the coupled direct payments to decoupled ones, which
currently prevail (Report on the state …, 2005-2013).
0
50
100
150
200
250
300
350
400
450
19
92
19
94
19
96
19
98
20
00
20
02
20
04
20
06
20
08
20
10
20
12
General measures related to agriculture
Structural and rural development measures
Market and direct producer support measures
0%
10%
20%
30%
40%
50%
60%
70%
80%
90%
100%
19
92
19
94
19
96
19
98
20
00
20
02
20
04
20
06
20
08
20
10
20
12
Disaster payments and other compensations to producers
Variable input subsidies
Direct payments to producers - decoupled
Direct payments to producers - coupled
Market support
5
Food industry was significantly less budgetary subsidized, especially in terms of
restructuring investments, already in the transition and pre-accession period, but with the
accession the budget support to food industry decreased drastically, mostly due to the
expiration of export subsidies received for the key traditional markets (Volk et al., 2006).
Agriculture
Production
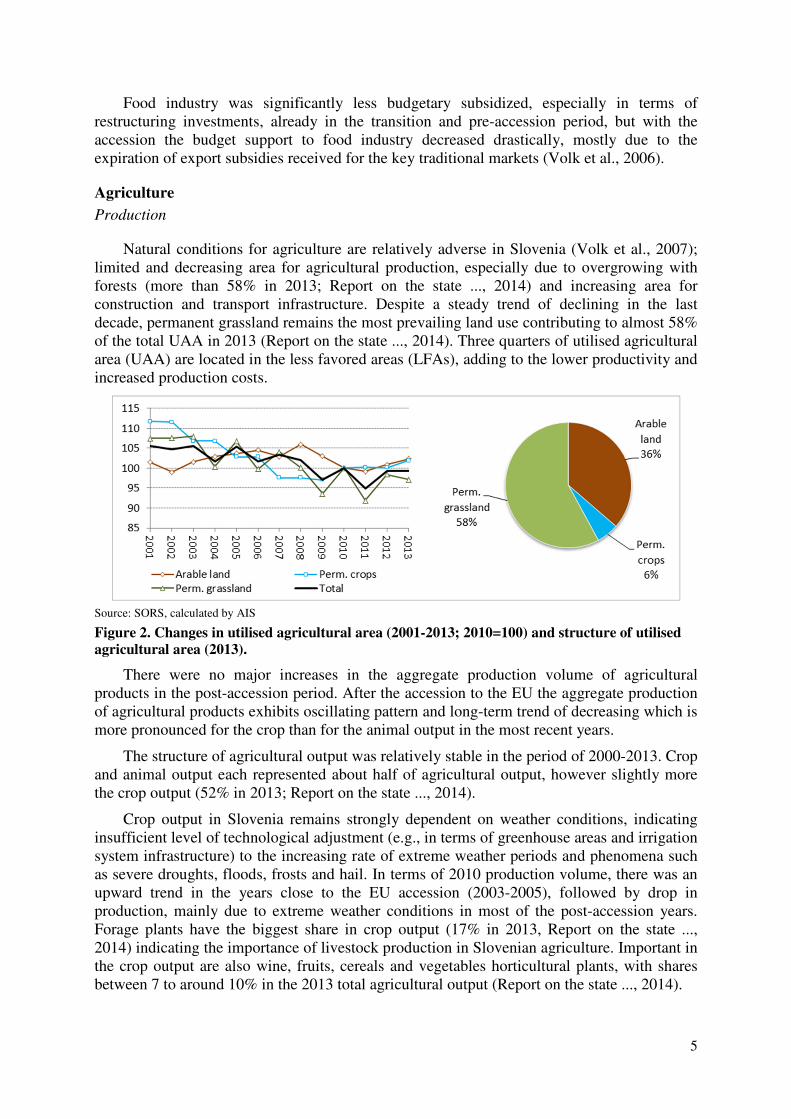
Natural conditions for agriculture are relatively adverse in Slovenia (Volk et al., 2007);
limited and decreasing area for agricultural production, especially due to overgrowing with
forests (more than 58% in 2013; Report on the state ..., 2014) and increasing area for
construction and transport infrastructure. Despite a steady trend of declining in the last
decade, permanent grassland remains the most prevailing land use contributing to almost 58%
of the total UAA in 2013 (Report on the state ..., 2014). Three quarters of utilised agricultural
area (UAA) are located in the less favored areas (LFAs), adding to the lower productivity and
increased production costs.
Source: SORS, calculated by AIS
Figure 2. Changes in utilised agricultural area (2001-2013; 2010=100) and structure of utilised
agricultural area (2013).
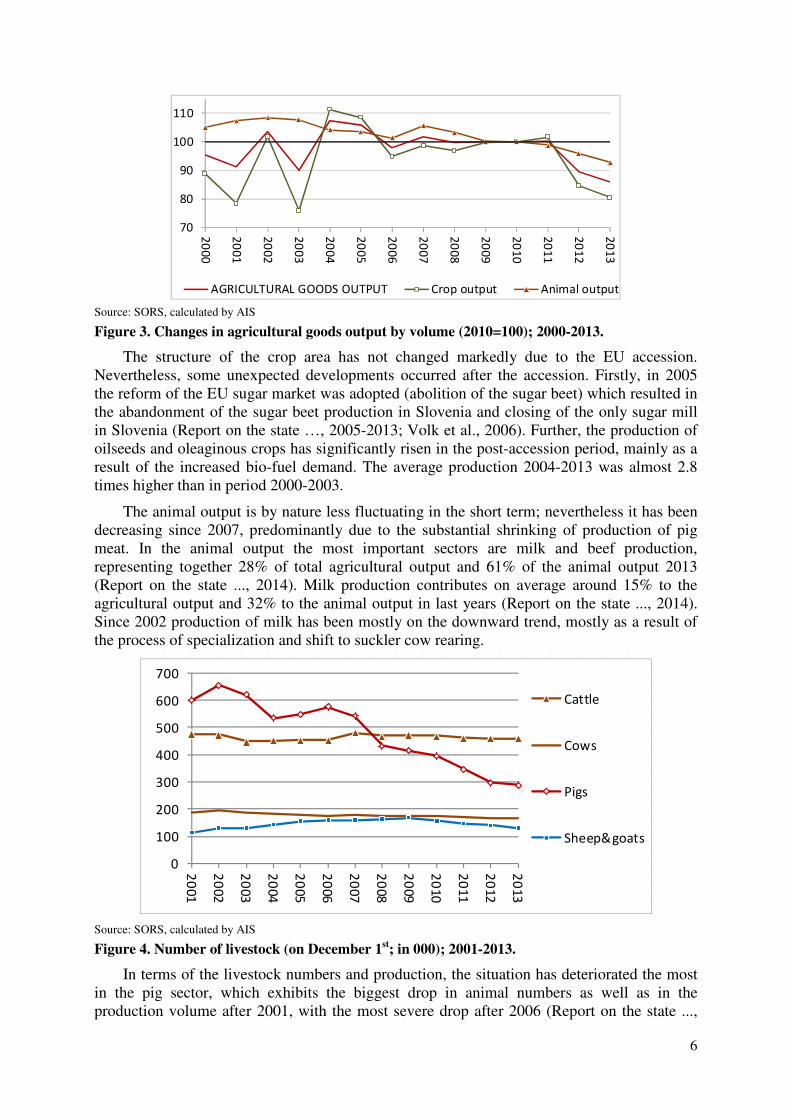
There were no major increases in the aggregate production volume of agricultural
products in the post-accession period. After the accession to the EU the aggregate production
of agricultural products exhibits oscillating pattern and long-term trend of decreasing which is
more pronounced for the crop than for the animal output in the most recent years.
The structure of agricultural output was relatively stable in the period of 2000-2013. Crop
and animal output each represented about half of agricultural output, however slightly more
the crop output (52% in 2013; Report on the state ..., 2014).
Crop output in Slovenia remains strongly dependent on weather conditions, indicating
insufficient level of technological adjustment (e.g., in terms of greenhouse areas and irrigation
system infrastructure) to the increasing rate of extreme weather periods and phenomena such
as severe droughts, floods, frosts and hail. In terms of 2010 production volume, there was an
upward trend in the years close to the EU accession (2003-2005), followed by drop in
production, mainly due to extreme weather conditions in most of the post-accession years.
Forage plants have the biggest share in crop output (17% in 2013, Report on the state ...,
2014) indicating the importance of livestock production in Slovenian agriculture. Important in
the crop output are also wine, fruits, cereals and vegetables horticultural plants, with shares
between 7 to around 10% in the 2013 total agricultural output (Report on the state ..., 2014).
6
Source: SORS, calculated by AIS
Figure 3. Changes in agricultural goods output by volume (2010=100); 2000-2013.
The structure of the crop area has not changed markedly due to the EU accession.
Nevertheless, some unexpected developments occurred after the accession. Firstly, in 2005
the reform of the EU sugar market was adopted (abolition of the sugar beet) which resulted in
the abandonment of the sugar beet production in Slovenia and closing of the only sugar mill
in Slovenia (Report on the state …, 2005-2013; Volk et al., 2006). Further, the production of
oilseeds and oleaginous crops has significantly risen in the post-accession period, mainly as a
result of the increased bio-fuel demand. The average production 2004-2013 was almost 2.8
times higher than in period 2000-2003.
The animal output is by nature less fluctuating in the short term; nevertheless it has been
decreasing since 2007, predominantly due to the substantial shrinking of production of pig
meat. In the animal output the most important sectors are milk and beef production,
representing together 28% of total agricultural output and 61% of the animal output 2013
(Report on the state ..., 2014). Milk production contributes on average around 15% to the
agricultural output and 32% to the animal output in last years (Report on the state ..., 2014).
Since 2002 production of milk has been mostly on the downward trend, mostly as a result of
the process of specialization and shift to suckler cow rearing.
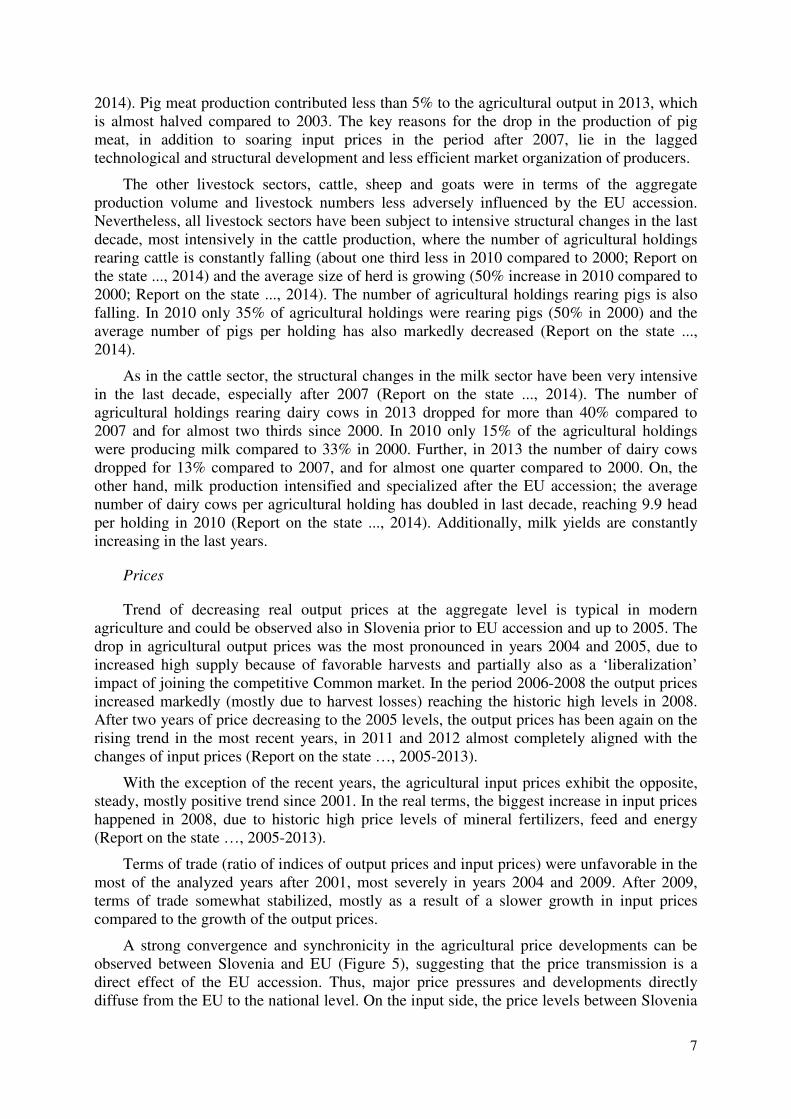
Source: SORS, calculated by AIS
Figure 4. Number of livestock (on December 1st; in 000); 2001-2013.
In terms of the livestock numbers and production, the situation has deteriorated the most
in the pig sector, which exhibits the biggest drop in animal numbers as well as in the
production volume after 2001, with the most severe drop after 2006 (Report on the state ...,
70
80
90
100
110
20
00
20
01
20
02
20
03
20
04
20
05
20
06
20
07
20
08
20
09
20
10
20
11
20
12
20
13
AGRICULTURAL GOODS OUTPUT Crop output Animal output
0
100
200
300
400
500
600
700
20
01
20
02
20
03
20
04
20
05
20
06
20
07
20
08
20
09
20
10
20
11
20
12
20
13
Cattle
Cows
Pigs
Sheep&goats
7
2014). Pig meat production contributed less than 5% to the agricultural output in 2013, which
is almost halved compared to 2003. The key reasons for the drop in the production of pig
meat, in addition to soaring input prices in the period after 2007, lie in the lagged
technological and structural development and less efficient market organization of producers.
The other livestock sectors, cattle, sheep and goats were in terms of the aggregate
production volume and livestock numbers less adversely influenced by the EU accession.
Nevertheless, all livestock sectors have been subject to intensive structural changes in the last
decade, most intensively in the cattle production, where the number of agricultural holdings
rearing cattle is constantly falling (about one third less in 2010 compared to 2000; Report on
the state ..., 2014) and the average size of herd is growing (50% increase in 2010 compared to
2000; Report on the state ..., 2014). The number of agricultural holdings rearing pigs is also
falling. In 2010 only 35% of agricultural holdings were rearing pigs (50% in 2000) and the
average number of pigs per holding has also markedly decreased (Report on the state ...,
2014).
As in the cattle sector, the structural changes in the milk sector have been very intensive
in the last decade, especially after 2007 (Report on the state ..., 2014). The number of
agricultural holdings rearing dairy cows in 2013 dropped for more than 40% compared to
2007 and for almost two thirds since 2000. In 2010 only 15% of the agricultural holdings
were producing milk compared to 33% in 2000. Further, in 2013 the number of dairy cows
dropped for 13% compared to 2007, and for almost one quarter compared to 2000. On, the
other hand, milk production intensified and specialized after the EU accession; the average
number of dairy cows per agricultural holding has doubled in last decade, reaching 9.9 head
per holding in 2010 (Report on the state ..., 2014). Additionally, milk yields are constantly
increasing in the last years.
Prices
Trend of decreasing real output prices at the aggregate level is typical in modern
agriculture and could be observed also in Slovenia prior to EU accession and up to 2005. The
drop in agricultural output prices was the most pronounced in years 2004 and 2005, due to
increased high supply because of favorable harvests and partially also as a ‘liberalization’
impact of joining the competitive Common market. In the period 2006-2008 the output prices
increased markedly (mostly due to harvest losses) reaching the historic high levels in 2008.
After two years of price decreasing to the 2005 levels, the output prices has been again on the
rising trend in the most recent years, in 2011 and 2012 almost completely aligned with the
changes of input prices (Report on the state …, 2005-2013).
With the exception of the recent years, the agricultural input prices exhibit the opposite,
steady, mostly positive trend since 2001. In the real terms, the biggest increase in input prices
happened in 2008, due to historic high price levels of mineral fertilizers, feed and energy
(Report on the state …, 2005-2013).
Terms of trade (ratio of indices of output prices and input prices) were unfavorable in the
most of the analyzed years after 2001, most severely in years 2004 and 2009. After 2009,
terms of trade somewhat stabilized, mostly as a result of a slower growth in input prices
compared to the growth of the output prices.
A strong convergence and synchronicity in the agricultural price developments can be
observed between Slovenia and EU (Figure 5), suggesting that the price transmission is a
direct effect of the EU accession. Thus, major price pressures and developments directly
diffuse from the EU to the national level. On the input side, the price levels between Slovenia
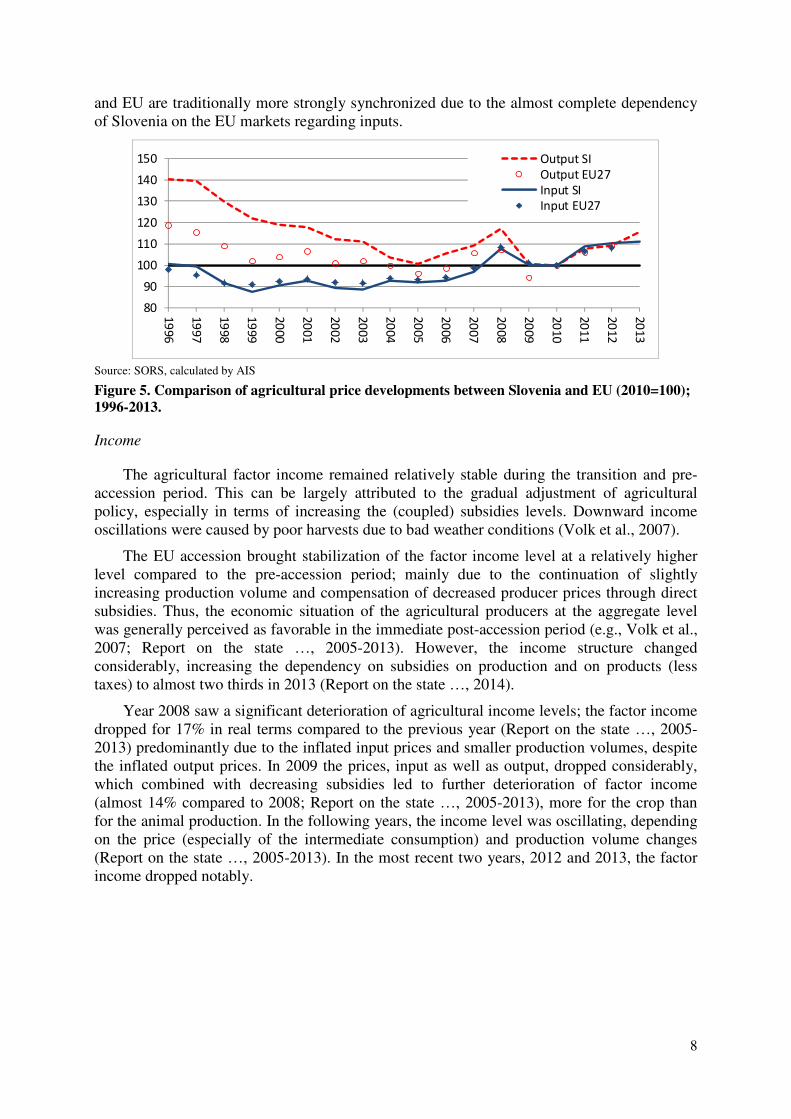
8
and EU are traditionally more strongly synchronized due to the almost complete dependency
of Slovenia on the EU markets regarding inputs.
Source: SORS, calculated by AIS
Figure 5. Comparison of agricultural price developments between Slovenia and EU (2010=100);
1996-2013.
Income
The agricultural factor income remained relatively stable during the transition and pre-
accession period. This can be largely attributed to the gradual adjustment of agricultural
policy, especially in terms of increasing the (coupled) subsidies levels. Downward income
oscillations were caused by poor harvests due to bad weather conditions (Volk et al., 2007).
The EU accession brought stabilization of the factor income level at a relatively higher
level compared to the pre-accession period; mainly due to the continuation of slightly
increasing production volume and compensation of decreased producer prices through direct
subsidies. Thus, the economic situation of the agricultural producers at the aggregate level
was generally perceived as favorable in the immediate post-accession period (e.g., Volk et al.,
2007; Report on the state …, 2005-2013). However, the income structure changed
considerably, increasing the dependency on subsidies on production and on products (less
taxes) to almost two thirds in 2013 (Report on the state …, 2014).
Year 2008 saw a significant deterioration of agricultural income levels; the factor income
dropped for 17% in real terms compared to the previous year (Report on the state …, 2005-
2013) predominantly due to the inflated input prices and smaller production volumes, despite
the inflated output prices. In 2009 the prices, input as well as output, dropped considerably,
which combined with decreasing subsidies led to further deterioration of factor income
(almost 14% compared to 2008; Report on the state …, 2005-2013), more for the crop than
for the animal production. In the following years, the income level was oscillating, depending
on the price (especially of the intermediate consumption) and production volume changes
(Report on the state …, 2005-2013). In the most recent two years, 2012 and 2013, the factor
income dropped notably.
80
90
100
110
120
130
140
150
19
96
19
97
19
98
19
99
20
00
20
01
20
02
20
03
20
04
20
05
20
06
20
07
20
08
20
09
20
10
20
11
20
12
20
13
Output SI
Output EU27
Input SI
Input EU27
9
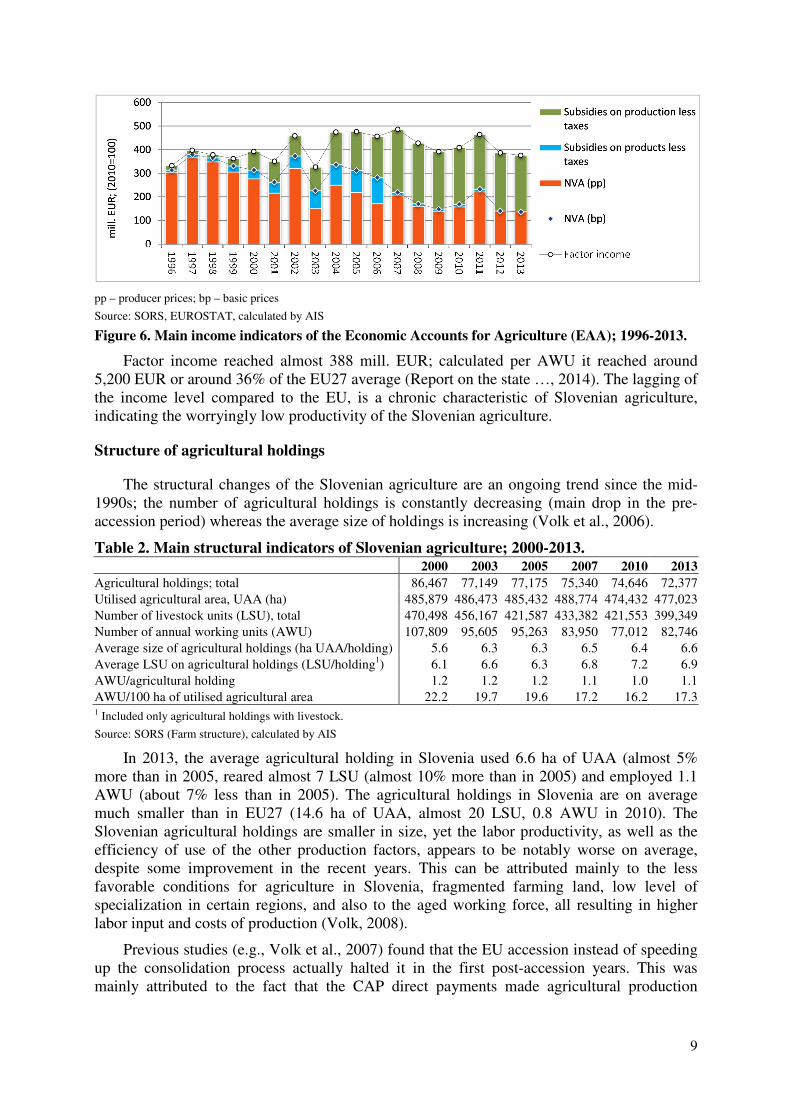
pp – producer prices; bp – basic prices
Source: SORS, EUROSTAT, calculated by AIS
Figure 6. Main income indicators of the Economic Accounts for Agriculture (EAA); 1996-2013.
Factor income reached almost 388 mill. EUR; calculated per AWU it reached around
5,200 EUR or around 36% of the EU27 average (Report on the state …, 2014). The lagging of
the income level compared to the EU, is a chronic characteristic of Slovenian agriculture,
indicating the worryingly low productivity of the Slovenian agriculture.
Structure of agricultural holdings
The structural changes of the Slovenian agriculture are an ongoing trend since the mid-
1990s; the number of agricultural holdings is constantly decreasing (main drop in the pre-
accession period) whereas the average size of holdings is increasing (Volk et al., 2006).
Table 2. Main structural indicators of Slovenian agriculture; 2000-2013. 2000 2003 2005 2007 2010 2013
Agricultural holdings; total 86,467 77,149 77,175 75,340 74,646 72,377
Utilised agricultural area, UAA (ha) 485,879 486,473 485,432 488,774 474,432 477,023
Number of livestock units (LSU), total 470,498 456,167 421,587 433,382 421,553 399,349
Number of annual working units (AWU) 107,809 95,605 95,263 83,950 77,012 82,746
Average size of agricultural holdings (ha UAA/holding) 5.6 6.3 6.3 6.5 6.4 6.6
Average LSU on agricultural holdings (LSU/holding1) 6.1 6.6 6.3 6.8 7.2 6.9
AWU/agricultural holding 1.2 1.2 1.2 1.1 1.0 1.1
AWU/100 ha of utilised agricultural area 22.2 19.7 19.6 17.2 16.2 17.3 1 Included only agricultural holdings with livestock.
Source: SORS (Farm structure), calculated by AIS
In 2013, the average agricultural holding in Slovenia used 6.6 ha of UAA (almost 5%
more than in 2005, reared almost 7 LSU (almost 10% more than in 2005) and employed 1.1
AWU (about 7% less than in 2005). The agricultural holdings in Slovenia are on average
much smaller than in EU27 (14.6 ha of UAA, almost 20 LSU, 0.8 AWU in 2010). The
Slovenian agricultural holdings are smaller in size, yet the labor productivity, as well as the
efficiency of use of the other production factors, appears to be notably worse on average,
despite some improvement in the recent years. This can be attributed mainly to the less
favorable conditions for agriculture in Slovenia, fragmented farming land, low level of
specialization in certain regions, and also to the aged working force, all resulting in higher
labor input and costs of production (Volk, 2008).
Previous studies (e.g., Volk et al., 2007) found that the EU accession instead of speeding
up the consolidation process actually halted it in the first post-accession years. This was
mainly attributed to the fact that the CAP direct payments made agricultural production
10
economically profitable enough for the smaller farms, which thus did not (have to) exit the
agriculture.
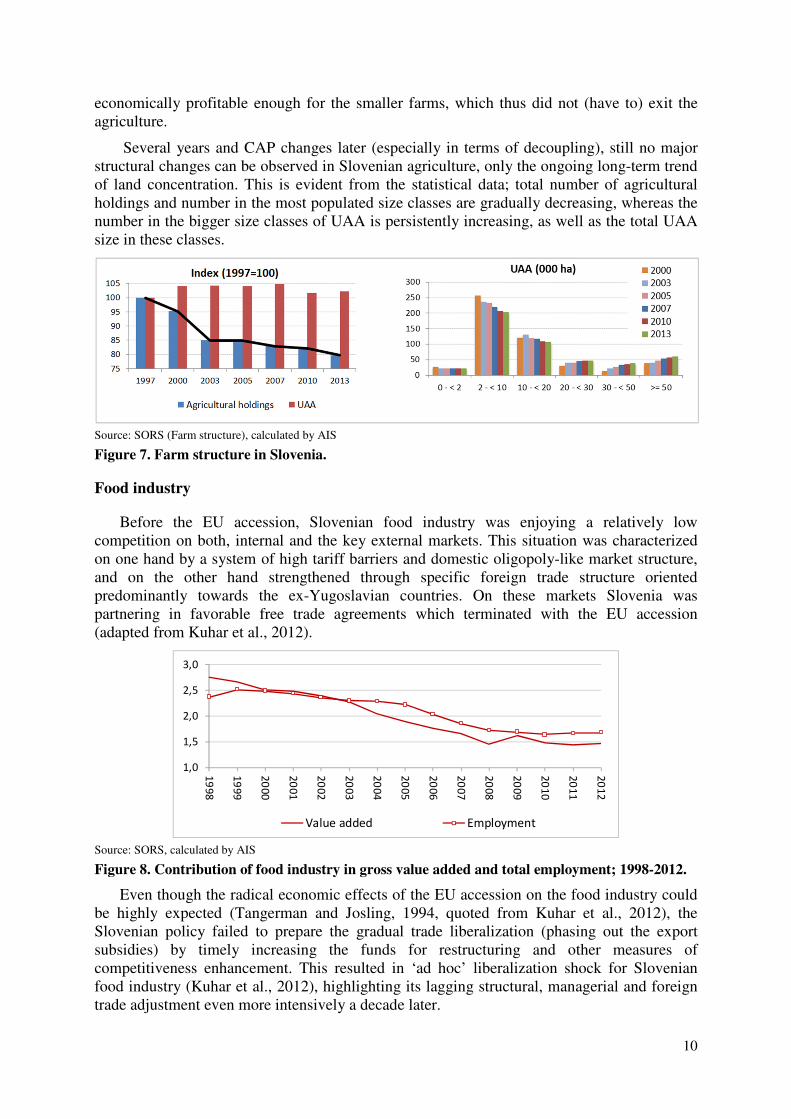
Several years and CAP changes later (especially in terms of decoupling), still no major
structural changes can be observed in Slovenian agriculture, only the ongoing long-term trend
of land concentration. This is evident from the statistical data; total number of agricultural
holdings and number in the most populated size classes are gradually decreasing, whereas the
number in the bigger size classes of UAA is persistently increasing, as well as the total UAA
size in these classes.
Source: SORS (Farm structure), calculated by AIS
Figure 7. Farm structure in Slovenia.
Food industry
Before the EU accession, Slovenian food industry was enjoying a relatively low
competition on both, internal and the key external markets. This situation was characterized
on one hand by a system of high tariff barriers and domestic oligopoly-like market structure,
and on the other hand strengthened through specific foreign trade structure oriented
predominantly towards the ex-Yugoslavian countries. On these markets Slovenia was
partnering in favorable free trade agreements which terminated with the EU accession
(adapted from Kuhar et al., 2012).
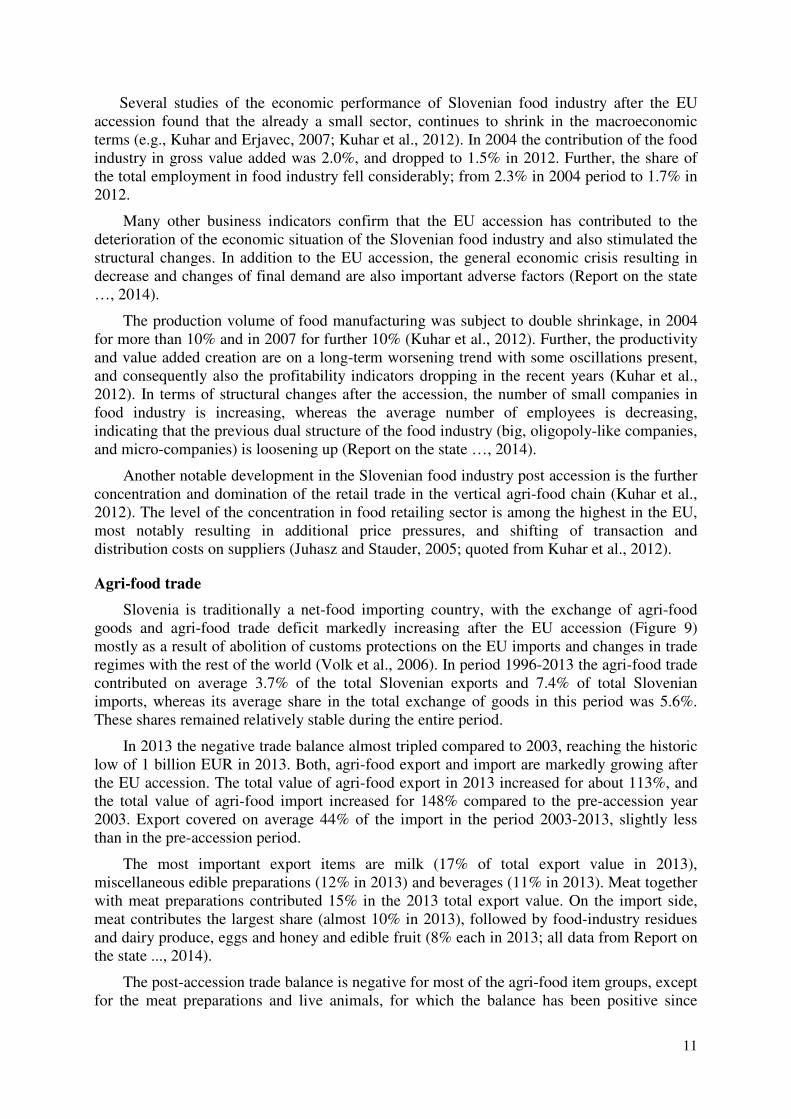
Source: SORS, calculated by AIS
Figure 8. Contribution of food industry in gross value added and total employment; 1998-2012.
Even though the radical economic effects of the EU accession on the food industry could
be highly expected (Tangerman and Josling, 1994, quoted from Kuhar et al., 2012), the
Slovenian policy failed to prepare the gradual trade liberalization (phasing out the export
subsidies) by timely increasing the funds for restructuring and other measures of
competitiveness enhancement. This resulted in ‘ad hoc’ liberalization shock for Slovenian
food industry (Kuhar et al., 2012), highlighting its lagging structural, managerial and foreign
trade adjustment even more intensively a decade later.
1,0
1,5
2,0
2,5
3,0
19
98
19
99
20
00
20
01
20
02
20
03
20
04
20
05
20
06
20
07
20
08
20
09
20
10
20
11
20
12
Value added Employment
11
Several studies of the economic performance of Slovenian food industry after the EU
accession found that the already a small sector, continues to shrink in the macroeconomic
terms (e.g., Kuhar and Erjavec, 2007; Kuhar et al., 2012). In 2004 the contribution of the food
industry in gross value added was 2.0%, and dropped to 1.5% in 2012. Further, the share of
the total employment in food industry fell considerably; from 2.3% in 2004 period to 1.7% in
2012.
Many other business indicators confirm that the EU accession has contributed to the
deterioration of the economic situation of the Slovenian food industry and also stimulated the
structural changes. In addition to the EU accession, the general economic crisis resulting in
decrease and changes of final demand are also important adverse factors (Report on the state
…, 2014).
The production volume of food manufacturing was subject to double shrinkage, in 2004
for more than 10% and in 2007 for further 10% (Kuhar et al., 2012). Further, the productivity
and value added creation are on a long-term worsening trend with some oscillations present,
and consequently also the profitability indicators dropping in the recent years (Kuhar et al.,
2012). In terms of structural changes after the accession, the number of small companies in
food industry is increasing, whereas the average number of employees is decreasing,
indicating that the previous dual structure of the food industry (big, oligopoly-like companies,
and micro-companies) is loosening up (Report on the state …, 2014).
Another notable development in the Slovenian food industry post accession is the further
concentration and domination of the retail trade in the vertical agri-food chain (Kuhar et al.,
2012). The level of the concentration in food retailing sector is among the highest in the EU,
most notably resulting in additional price pressures, and shifting of transaction and
distribution costs on suppliers (Juhasz and Stauder, 2005; quoted from Kuhar et al., 2012).
Agri-food trade
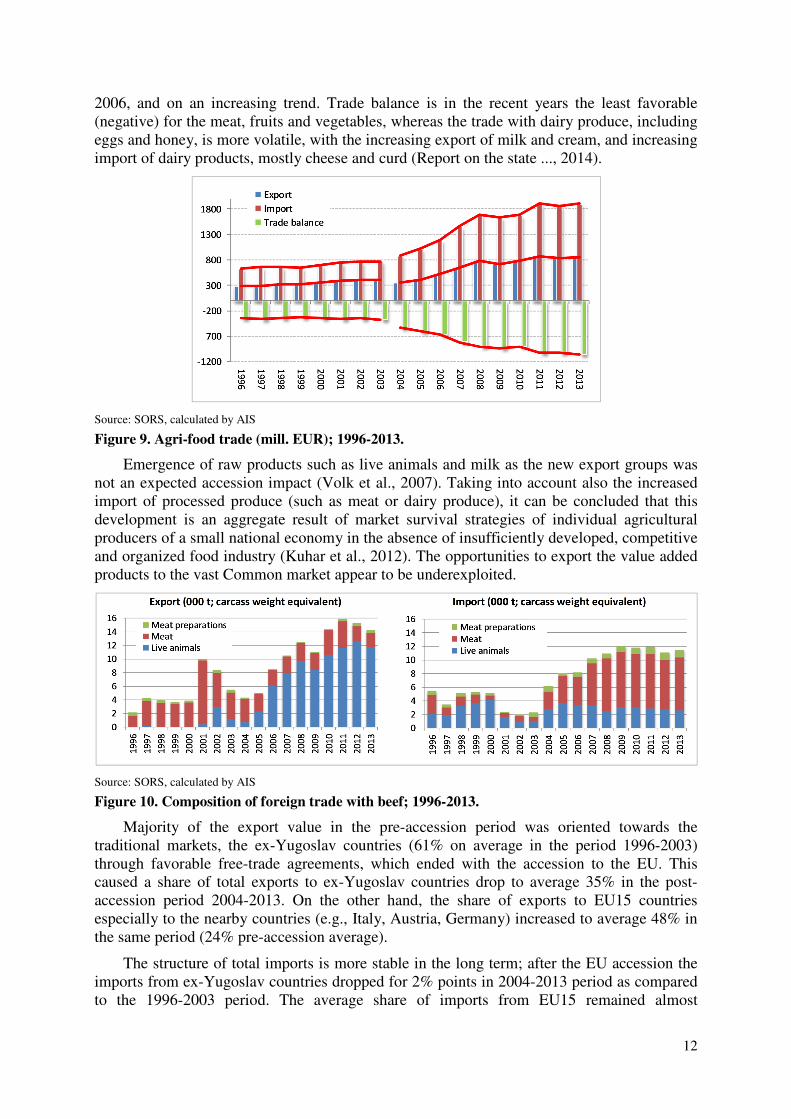
Slovenia is traditionally a net-food importing country, with the exchange of agri-food
goods and agri-food trade deficit markedly increasing after the EU accession (Figure 9)
mostly as a result of abolition of customs protections on the EU imports and changes in trade
regimes with the rest of the world (Volk et al., 2006). In period 1996-2013 the agri-food trade
contributed on average 3.7% of the total Slovenian exports and 7.4% of total Slovenian
imports, whereas its average share in the total exchange of goods in this period was 5.6%.
These shares remained relatively stable during the entire period.
In 2013 the negative trade balance almost tripled compared to 2003, reaching the historic
low of 1 billion EUR in 2013. Both, agri-food export and import are markedly growing after
the EU accession. The total value of agri-food export in 2013 increased for about 113%, and
the total value of agri-food import increased for 148% compared to the pre-accession year
2003. Export covered on average 44% of the import in the period 2003-2013, slightly less
than in the pre-accession period.
The most important export items are milk (17% of total export value in 2013),
miscellaneous edible preparations (12% in 2013) and beverages (11% in 2013). Meat together
with meat preparations contributed 15% in the 2013 total export value. On the import side,
meat contributes the largest share (almost 10% in 2013), followed by food-industry residues
and dairy produce, eggs and honey and edible fruit (8% each in 2013; all data from Report on
the state ..., 2014).
The post-accession trade balance is negative for most of the agri-food item groups, except
for the meat preparations and live animals, for which the balance has been positive since
12
2006, and on an increasing trend. Trade balance is in the recent years the least favorable
(negative) for the meat, fruits and vegetables, whereas the trade with dairy produce, including
eggs and honey, is more volatile, with the increasing export of milk and cream, and increasing
import of dairy products, mostly cheese and curd (Report on the state ..., 2014).
Source: SORS, calculated by AIS
Figure 9. Agri-food trade (mill. EUR); 1996-2013.
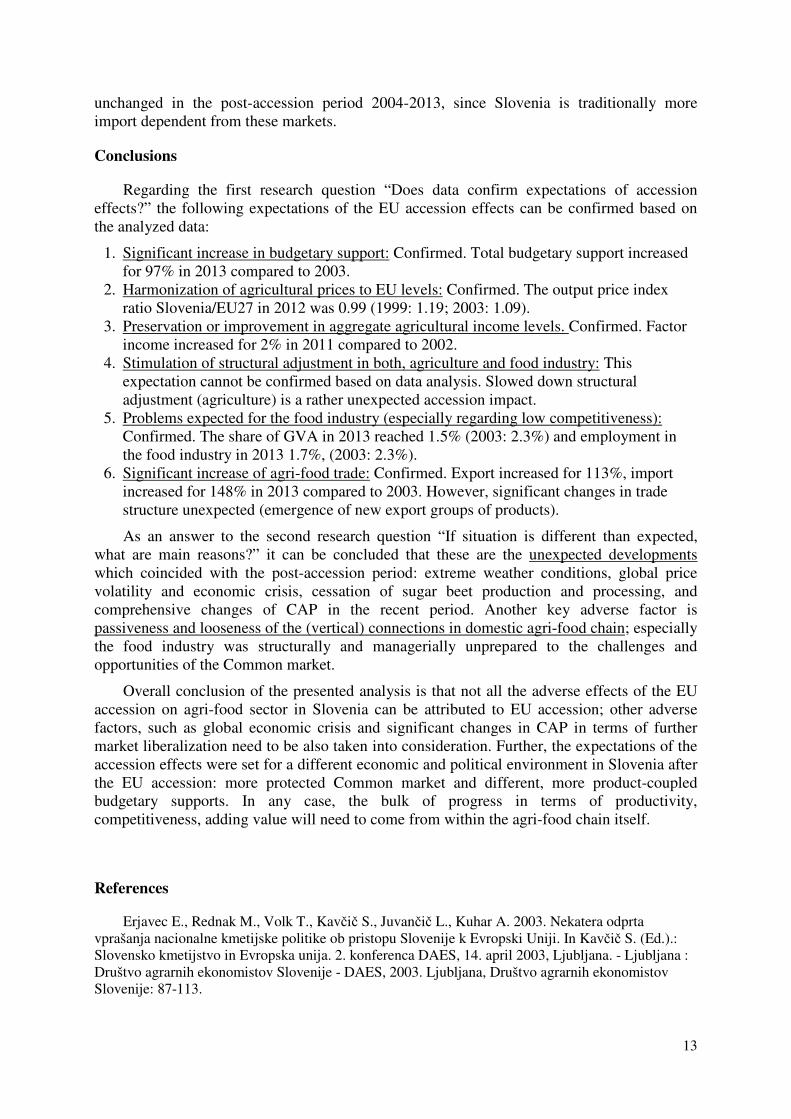
Emergence of raw products such as live animals and milk as the new export groups was
not an expected accession impact (Volk et al., 2007). Taking into account also the increased
import of processed produce (such as meat or dairy produce), it can be concluded that this
development is an aggregate result of market survival strategies of individual agricultural
producers of a small national economy in the absence of insufficiently developed, competitive
and organized food industry (Kuhar et al., 2012). The opportunities to export the value added
products to the vast Common market appear to be underexploited.
Source: SORS, calculated by AIS
Figure 10. Composition of foreign trade with beef; 1996-2013.
Majority of the export value in the pre-accession period was oriented towards the
traditional markets, the ex-Yugoslav countries (61% on average in the period 1996-2003)
through favorable free-trade agreements, which ended with the accession to the EU. This
caused a share of total exports to ex-Yugoslav countries drop to average 35% in the post-
accession period 2004-2013. On the other hand, the share of exports to EU15 countries
especially to the nearby countries (e.g., Italy, Austria, Germany) increased to average 48% in
the same period (24% pre-accession average).
The structure of total imports is more stable in the long term; after the EU accession the
imports from ex-Yugoslav countries dropped for 2% points in 2004-2013 period as compared
to the 1996-2003 period. The average share of imports from EU15 remained almost
13
unchanged in the post-accession period 2004-2013, since Slovenia is traditionally more
import dependent from these markets.
Conclusions
Regarding the first research question “Does data confirm expectations of accession
effects?” the following expectations of the EU accession effects can be confirmed based on
the analyzed data:
1. Significant increase in budgetary support: Confirmed. Total budgetary support increased
for 97% in 2013 compared to 2003.
2. Harmonization of agricultural prices to EU levels: Confirmed. The output price index
ratio Slovenia/EU27 in 2012 was 0.99 (1999: 1.19; 2003: 1.09).
3. Preservation or improvement in aggregate agricultural income levels. Confirmed. Factor
income increased for 2% in 2011 compared to 2002.
4. Stimulation of structural adjustment in both, agriculture and food industry: This
expectation cannot be confirmed based on data analysis. Slowed down structural
adjustment (agriculture) is a rather unexpected accession impact.
5. Problems expected for the food industry (especially regarding low competitiveness):
Confirmed. The share of GVA in 2013 reached 1.5% (2003: 2.3%) and employment in
the food industry in 2013 1.7%, (2003: 2.3%).
6. Significant increase of agri-food trade: Confirmed. Export increased for 113%, import
increased for 148% in 2013 compared to 2003. However, significant changes in trade
structure unexpected (emergence of new export groups of products).
As an answer to the second research question “If situation is different than expected,
what are main reasons?” it can be concluded that these are the unexpected developments
which coincided with the post-accession period: extreme weather conditions, global price
volatility and economic crisis, cessation of sugar beet production and processing, and
comprehensive changes of CAP in the recent period. Another key adverse factor is
passiveness and looseness of the (vertical) connections in domestic agri-food chain; especially
the food industry was structurally and managerially unprepared to the challenges and
opportunities of the Common market.
Overall conclusion of the presented analysis is that not all the adverse effects of the EU
accession on agri-food sector in Slovenia can be attributed to EU accession; other adverse
factors, such as global economic crisis and significant changes in CAP in terms of further
market liberalization need to be also taken into consideration. Further, the expectations of the
accession effects were set for a different economic and political environment in Slovenia after
the EU accession: more protected Common market and different, more product-coupled
budgetary supports. In any case, the bulk of progress in terms of productivity,
competitiveness, adding value will need to come from within the agri-food chain itself.
References
Erjavec E., Rednak M., Volk T., Kavčič S., Juvančič L., Kuhar A. 2003. Nekatera odprta
vprašanja nacionalne kmetijske politike ob pristopu Slovenije k Evropski Uniji. In Kavčič S. (Ed.).:
Slovensko kmetijstvo in Evropska unija. 2. konferenca DAES, 14. april 2003, Ljubljana. - Ljubljana :
Društvo agrarnih ekonomistov Slovenije - DAES, 2003. Ljubljana, Društvo agrarnih ekonomistov
Slovenije: 87-113.
14
Kavčič S., Erjavec E., Mergos G., Stoforos C. 2003. EU enlargement and the Common
Agricultural Policy: the case of Slovenia. Agric. Food Sci. Finl., 12(1): 3-29.
Kuhar A. 2014. Competitiveness of Slovenian agri-food sector. Review on agriculture and rural
development, 3(1): 5-11.
Kuhar A., Erjavec E. 2007. Implications of Slovenia's EU accession for the agri-food sectors:
Economic and business review, 9(2): 147-164.
Kuhar A., Erjavec E., Borovšak K. 2012. Restructuring of the Slovenian food industry in the pre-
and post EU-accession period. Paper prepared for the 132nd
EAAE Seminar, Skopje, October 25-27,
2012: Is transition in European agriculture really over? : new dimensions and challenges of transition
and post-transition processes in agriculture and food sectors in the European Union and EU acceding
and neighbouring countries: 17 pg.
Münch W. 2000. Effects of CEEC-EU accession on agricultural markets in the CEEC and on
government expenditure. In: Central and Eastern European agriculture in an expanding European
Union. Tangerman S., Banse M. (Eds.). Wallingford, CAB INTERNATIONAL: 113–132.
Rednak M., Volk T., Erjavec E. 2007 EAA-ABTA Model for Ex-Post and Ex-Ante Analysis of
Economic Position of Slovenian Agriculture. Thematic proceedings of the 100th Seminar, June 21-23,
2007, Novi Sad, Serbia and Montenegro, European Association of Agricultural Economists: 111-119.
http://purl.umn.edu/162404 (August 4th 2014)
Report on the state of Slovenian agriculture, food, forestry and fisheries (more editions). 2005-
2013. Volk T. (Ed.). Reports prepared by the Agricultural Institute of Slovenia (AIS) on behalf of the
Ministry of Agriculture and Environment.
http://www.kis.si/pls/kis/!kis.web?m=36&j=SI#nav (Retrieved, July 20th 2014)
Report on the state of Slovenian agriculture, food, forestry and fisheries in year 2013. 2014. Volk
T. (Ed.). Report prepared by the Agricultural Institute of Slovenia (AIS) on behalf of the Ministry of
Agriculture and Environment.
http://www.kis.si/pls/kis/!kis.web?m=36&j=SI#nav (Retrieved, July 20th 2014)
Volk T. 2008. Dohodki v slovenskem kmetijstvu. Sejalec, 3(5): 8-10.
Volk T. 2011. Generell über die slowenische Landwirtschaft: [der Vorlesen an der] Internationale
Arbeitsgemeinschaft für Dauerversuche (IOSDV/ILTE) in der Internationalen Bodenkundlichen
Union (IUSS) : Einladung und Programm der IOSDV/ILTE - Sommertagung 2011 in Slowenien vom
14.6. - 17. 6. 2011: Kolloquium and der LIS in Ljubljana. Volk T., Erjavec E., Kavčič S. 2011. Agricultural policy in Slovenia prior and post its accession
to the European Union. In: Perović N., Despotović A., Jovanović M. (Eds.): Agriculture in the light of
the global economic crisis: monography. Podgorica, University of Montenegro, Biotehnical Faculty:
96-106.
Volk T., Rednak M., Erjavec E. 2006. Ex-post EU accession effects on the agri-food sector: the
case of Slovenia. Poljoprivreda i šumarstvo, 52(1/4): str. 61-83.
Volk T., Rednak M., Erjavec E. 2007. The agri-food sector in Slovenia after European Union
accession. In: Czartoryski W. (Ed.): Changes in the food sector after the enlargement of the EU.
Warsaw, Institute of Agricultural and Food Economics, National Research Institute: 244-266.