Embed Size (px)
Citation preview
CLASSIFICATION NOTES
DET NORSKE VERITAS AS
The content of this service document is the subject of intellectual property rights reserved by Det Norske Veritas AS (DNV). The useraccepts that it is prohibited by anyone else but DNV and/or its licensees to offer and/or perform classification, certification and/orverification services, including the issuance of certificates and/or declarations of conformity, wholly or partly, on the basis of and/orpursuant to this document whether free of charge or chargeable, without DNV's prior written consent. DNV is not responsible for theconsequences arising from any use of this document by others.
The electronic pdf version of this document found through http://www.dnv.com is the officially binding version
No. 30.9
Sloshing Analysis of LNG Membrane Tanks
AUGUST 2014

FOREWORD
DNV is a global provider of knowledge for managing risk. Today, safe and responsible business conduct is both a licenseto operate and a competitive advantage. Our core competence is to identify, assess, and advise on risk management. Fromour leading position in certification, classification, verification, and training, we develop and apply standards and bestpractices. This helps our customers safely and responsibly improve their business performance. DNV is an independentorganisation with dedicated risk professionals in more than 100 countries, with the purpose of safeguarding life, propertyand the environment.
Classification Notes
Classification Notes are publications that give practical information on classification of ships and other objects. Examplesof design solutions, calculation methods, specifications of test procedures, as well as acceptable repair methods for somecomponents are given as interpretations of the more general rule requirements.
© Det Norske Veritas AS August 2014
Any comments may be sent by e-mail to [email protected]
If any person suffers loss or damage which is proved to have been caused by any negligent act or omission of Det Norske Veritas, then Det Norske Veritas shall pay compensation tosuch person for his proved direct loss or damage. However, the compensation shall not exceed an amount equal to ten times the fee charged for the service in question, provided thatthe maximum compensation shall never exceed USD 2 million.In this provision "Det Norske Veritas" shall mean the Foundation Det Norske Veritas as well as all its subsidiaries, directors, officers, employees, agents and any other acting on behalfof Det Norske Veritas.
Classification Notes - No. 30.9, August 2014
CHANGES – CURRENT – Page 3
DET NORSKE VERITAS AS
CHANGES – CURRENT
General
This document supersedes Classification Notes No. 30.9, June 2006.
Text affected by the main changes in this edition is highlighted in red colour. However, if the changes involve
Det Norske Veritas AS, company registration number 945 748 931, has on 27th November 2013 changed itsname to DNV GL AS. For further information, see www.dnvgl.com. Any reference in this document to“Det Norske Veritas AS” or “DNV” shall therefore also be a reference to “DNV GL AS”.
a whole chapter, section or sub-section, normally only the title will be in red colour.
Main changes
• General
— This document has been totally rewritten.
• Sec.1 General
— [1.1]: Added some basic description of sloshing as a resonance phenomenon and included a description ofthe filling limitations for membrane vessels.
— Part of previous [1.5] moved forward to new [1.4]. Previous [1.4] moved to new [1.6]. Previous [1.6] and[1.7] moved to new Sec.2 (Design basis and principles) and partly rewritten.
• Sec.2 Design basis and principles
— Previous Sec.2 merged with previous [1.7] to [1.8] and called Design basis and principles. Text in previousSec.2 rewritten to reflect current sloshing assessment practice.
• Sec. 3 Sloshing impact design loads
— Section is almost totally rewritten to describe the current practice for sloshing load assessment.
• Sec.4 Pump tower design loads
— Previous [4.2] and [4.3] combined and rewritten to reflect current practice for assessment of pump towerloads.
— Combination of responses in [4.7] has been revised.
• Sec.5 Structural response of containment systems
— [5.1]: Added considerations related to the primary membrane to reflect the concerns caused by primarymembrane deformations on Mark III. Added opening for alternative assessment methods.
— [5.2]: Added reference to membrane.
• Sec.6 Ultimate strength of containment systems
— Added [6.3.9] “Failure modes for primary membrane” describing the observed deformations of membranesand the criteria that will be enforced by DNV during surveys.
— Removed partial resistance factors in all equations.— Corrected errors in equations describing dynamic strength factor in [6.4.5.4] and figures in Table 6-5.
• Sec. 7 Strength of inner hull structure
— Revised heading to “Strength of inner hull structure” as stiffness requirements have been removed.— Previous [7.3] has been removed.— Previous [7.4] (now [7.3]) has been rewritten to reflect a new and simplified comparative method for inner
hull structure strength assessment.— New [7.5] describes how to handle situations with increased vapour pressure compared to reference case.
• Sec.8 Response and strength of pump tower and supports
— Text related to operational profile for fatigue analysis removed as this is defined in [2.2].
In addition to the above stated main changes, editorial corrections may have been made.
Editorial corrections

Classification Notes - No. 30.9, August 2014
Contents – Page 4
DET NORSKE VERITAS AS
CONTENTS
CHANGES – CURRENT ................................................................................................................... 3
1 General ....................................................................................................................................... 6
1.1 Introduction.................................................................................................................................................... 6
1.2 Membrane type LNG tanks ........................................................................................................................ 11
1.3 Purpose of this document ............................................................................................................................ 11
1.4 Applicability of this document.................................................................................................................... 11
1.5 Applicable Rules and Classification Notes ................................................................................................ 11
1.6 Documentation ............................................................................................................................................. 12
2 Design basis and principles..................................................................................................... 14
2.1 Design basis .................................................................................................................................................. 14
2.2 Design principles .......................................................................................................................................... 15
2.3 Application of principles ............................................................................................................................. 20
2.4 Strength assessment methodology.............................................................................................................. 23
3 Sloshing impact design loads .................................................................................................. 26
3.1 Introduction.................................................................................................................................................. 26
3.2 Statistical analysis ........................................................................................................................................ 27
3.3 Environmental and operational modelling................................................................................................ 35
3.4 Ship motion calculation for sloshing tests ................................................................................................. 38
3.5 Sloshing model experiments........................................................................................................................ 38
3.6 Model test program ..................................................................................................................................... 40
3.7 Derivation of design loads ........................................................................................................................... 41
3.8 Quality and efficiency considerations ........................................................................................................ 42
4 Pump tower design loads ........................................................................................................ 45
4.1 Motivation..................................................................................................................................................... 45
4.2 Identification of relevant loads ................................................................................................................... 45
4.3 Sloshing, gravity and inertia loads ............................................................................................................. 46
4.4 Thermal loads............................................................................................................................................... 52
4.5 Hull girder loads .......................................................................................................................................... 52
4.6 Internal tank pressure and external sea pressure..................................................................................... 52
4.7 Combination of load effects ........................................................................................................................ 52
5 Structural response analysis of containment systems .......................................................... 53
5.1 General.......................................................................................................................................................... 53
5.2 Mark III system ........................................................................................................................................... 54
5.3 NO96 system................................................................................................................................................. 62
5.4 Material stiffness parameters ..................................................................................................................... 68
5.5 Mastic............................................................................................................................................................ 70
5.6 Simplified assessment of dynamic response .............................................................................................. 70
6 Ultimate strength of containment systems ............................................................................ 71
6.1 General.......................................................................................................................................................... 71
6.2 Capacity assessment .................................................................................................................................... 71
6.3 Mark III system ........................................................................................................................................... 72
6.4 NO96 system................................................................................................................................................. 77
6.5 Plywood strength data ................................................................................................................................. 87
6.6 RPUF strength data ..................................................................................................................................... 88
7 Strength of inner hull structure ............................................................................................. 88
7.1 General.......................................................................................................................................................... 88
7.2 Comparative basis (reference case)............................................................................................................ 89
7.3 Strength of hull plating ............................................................................................................................... 89

Classification Notes - No. 30.9, August 2014
Contents – Page 5
DET NORSKE VERITAS AS
7.4 Strength of hull stiffeners............................................................................................................................ 90
7.5 Effect of differences in vapour pressure .................................................................................................... 91
8 Response and strength of pump tower and supports .......................................................... 91
8.1 General.......................................................................................................................................................... 91
8.2 Response analysis of main structure .......................................................................................................... 92
8.3 Response analysis of base support.............................................................................................................. 94
8.4 Response analysis of liquid dome area....................................................................................................... 94
8.5 ULS assessment ............................................................................................................................................ 95
8.6 FLS assessment ............................................................................................................................................ 95
8.7 Vibration check............................................................................................................................................ 96
9 References ................................................................................................................................ 97
CHANGES – HISTORIC ................................................................................................................. 98
Classification Notes - No. 30.9, August 2014
Sec.1 General – Page 6
DET NORSKE VERITAS AS
1 General
1.1 Introduction
Sloshing is the term used to describe the violent resonant motion of the free surface of a liquid cargo inside amoving container, e.g. standing waves in partially filled cargo tanks on board an LNG carrier. The movingliquid will exert forces on bodies inside the container and on the container walls. These forces are normallyreferred to as sloshing loads, and need to be considered in the design of the cargo containment system, pumptower and pump tower supports, as well as the inner hull structure that supports the cargo containment system.
Sloshing can induce various types of loads on the tank structure. Violent sloshing may cause breaking wavesand high velocities of the fluid surface. In this case the fluid can cause impact loads on the containment system.The intensity of the impact loads vary considerably during stationary vessel motion conditions. The mostsevere impacts are characterized by a high pressure with short duration acting on a limited area, and occur onlyoccasionally. Moderate standing wave type liquid motion cause dynamic pressure loads with magnitude similarto hydrostatic pressure based on the instantaneous wave elevation. The load period is approximately the sameas the sloshing resonance period.
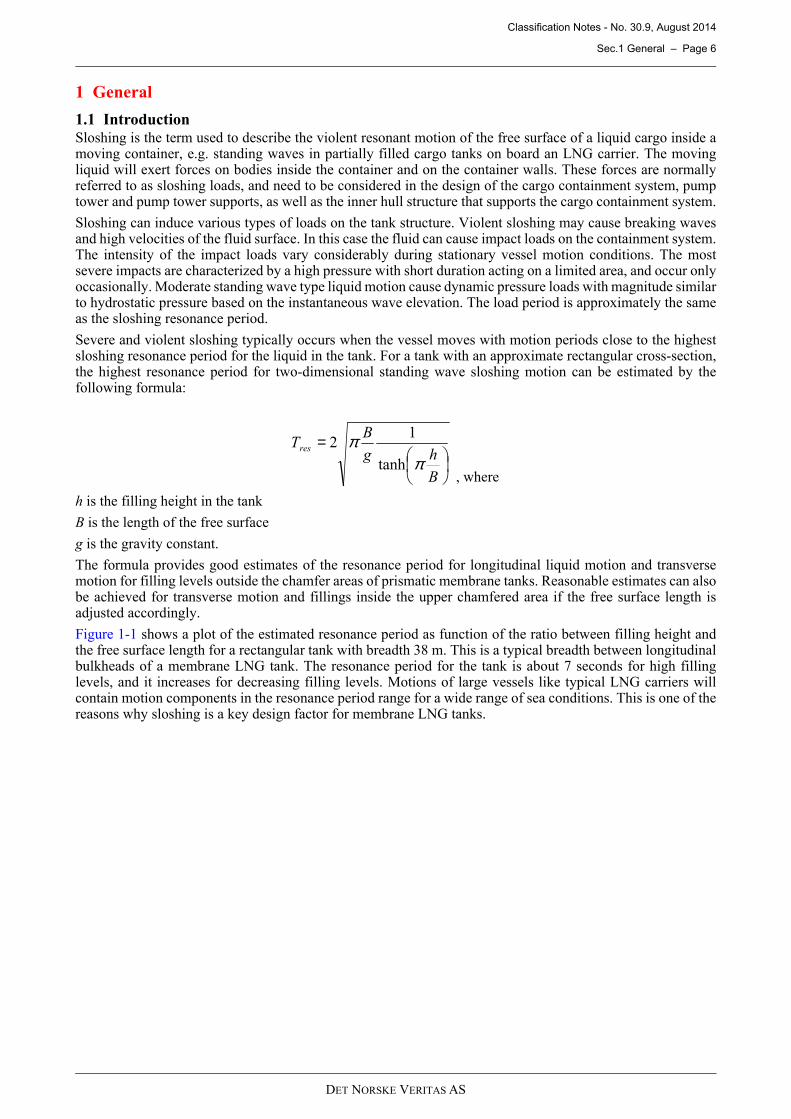
Severe and violent sloshing typically occurs when the vessel moves with motion periods close to the highestsloshing resonance period for the liquid in the tank. For a tank with an approximate rectangular cross-section,the highest resonance period for two-dimensional standing wave sloshing motion can be estimated by thefollowing formula:
h is the filling height in the tank
B is the length of the free surface
g is the gravity constant.
The formula provides good estimates of the resonance period for longitudinal liquid motion and transversemotion for filling levels outside the chamfer areas of prismatic membrane tanks. Reasonable estimates can alsobe achieved for transverse motion and fillings inside the upper chamfered area if the free surface length isadjusted accordingly.
Figure 1-1 shows a plot of the estimated resonance period as function of the ratio between filling height andthe free surface length for a rectangular tank with breadth 38 m. This is a typical breadth between longitudinalbulkheads of a membrane LNG tank. The resonance period for the tank is about 7 seconds for high fillinglevels, and it increases for decreasing filling levels. Motions of large vessels like typical LNG carriers willcontain motion components in the resonance period range for a wide range of sea conditions. This is one of thereasons why sloshing is a key design factor for membrane LNG tanks.
=
B
hg
BTres
ππ
tanh
12
, where
Classification Notes - No. 30.9, August 2014
Sec.1 General – Page 7
DET NORSKE VERITAS AS
Figure 1-1Estimated sloshing resonance period as function of relative filling height for a typical membrane LNGtank with length 45 m and breadth 38 m.
The prismatic shape of the membrane tanks has been designed to reduce the risk of severe sloshing inducedimpact loads. The chamfers affect the sloshing resonance periods and reduce the impact loads by changing theimpact angle between the free surface and tank boundary.
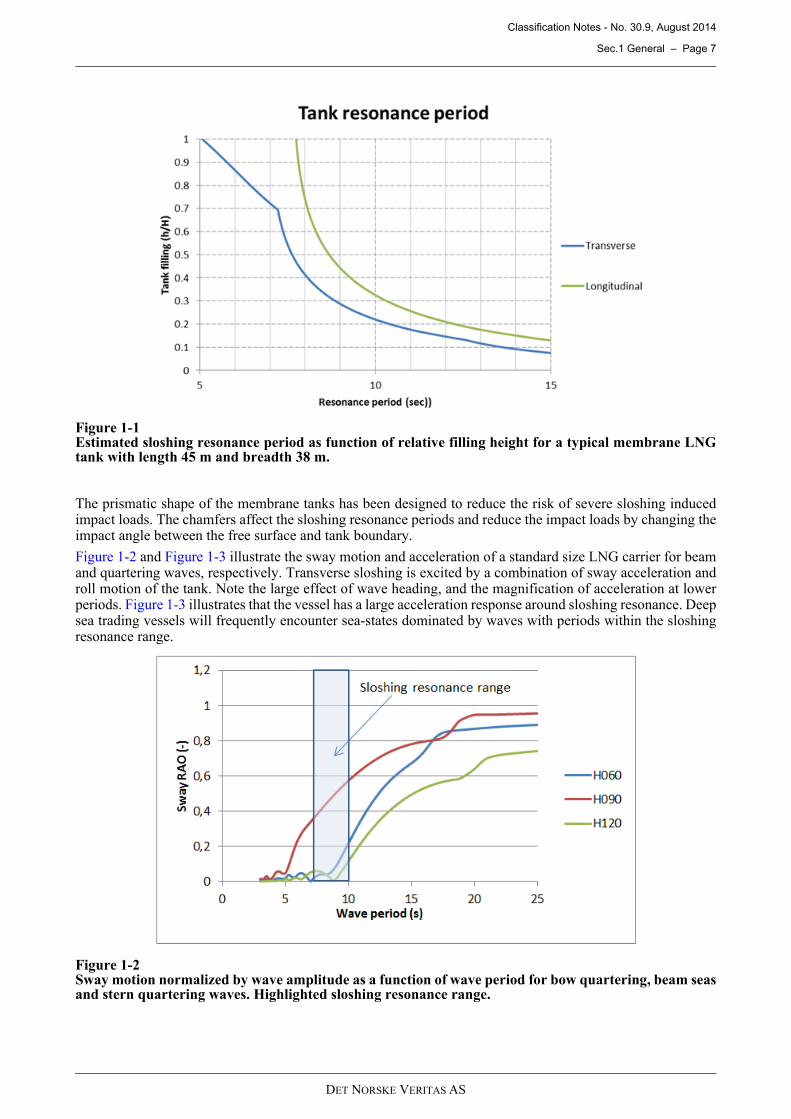
Figure 1-2 and Figure 1-3 illustrate the sway motion and acceleration of a standard size LNG carrier for beamand quartering waves, respectively. Transverse sloshing is excited by a combination of sway acceleration androll motion of the tank. Note the large effect of wave heading, and the magnification of acceleration at lowerperiods. Figure 1-3 illustrates that the vessel has a large acceleration response around sloshing resonance. Deepsea trading vessels will frequently encounter sea-states dominated by waves with periods within the sloshingresonance range.
Figure 1-2Sway motion normalized by wave amplitude as a function of wave period for bow quartering, beam seasand stern quartering waves. Highlighted sloshing resonance range.
Classification Notes - No. 30.9, August 2014
Sec.1 General – Page 8
DET NORSKE VERITAS AS
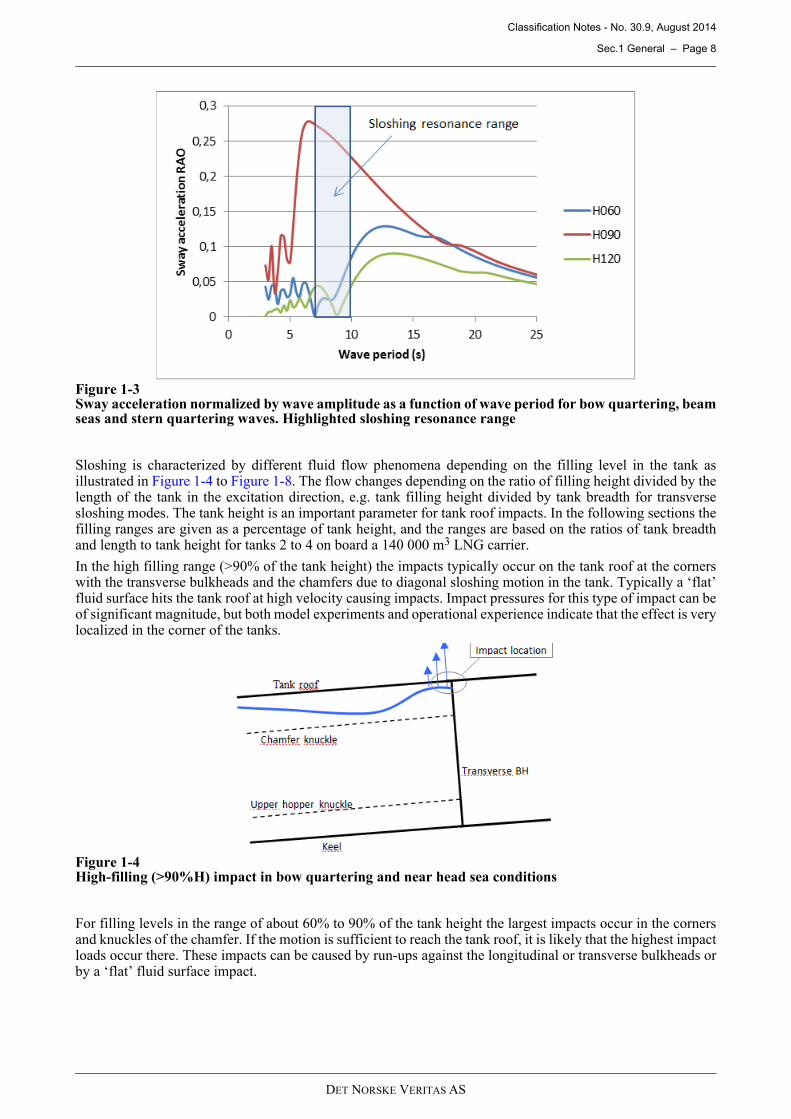
Figure 1-3Sway acceleration normalized by wave amplitude as a function of wave period for bow quartering, beamseas and stern quartering waves. Highlighted sloshing resonance range
Sloshing is characterized by different fluid flow phenomena depending on the filling level in the tank asillustrated in Figure 1-4 to Figure 1-8 . The flow changes depending on the ratio of filling height divided by thelength of the tank in the excitation direction, e.g. tank filling height divided by tank breadth for transversesloshing modes. The tank height is an important parameter for tank roof impacts. In the following sections thefilling ranges are given as a percentage of tank height, and the ranges are based on the ratios of tank breadthand length to tank height for tanks 2 to 4 on board a 140 000 m3 LNG carrier.
In the high filling range (>90% of the tank height) the impacts typically occur on the tank roof at the cornerswith the transverse bulkheads and the chamfers due to diagonal sloshing motion in the tank. Typically a ‘flat’fluid surface hits the tank roof at high velocity causing impacts. Impact pressures for this type of impact can beof significant magnitude, but both model experiments and operational experience indicate that the effect is verylocalized in the corner of the tanks.
Figure 1-4High-filling (>90%H) impact in bow quartering and near head sea conditions
For filling levels in the range of about 60% to 90% of the tank height the largest impacts occur in the cornersand knuckles of the chamfer. If the motion is sufficient to reach the tank roof, it is likely that the highest impactloads occur there. These impacts can be caused by run-ups against the longitudinal or transverse bulkheads orby a ‘flat’ fluid surface impact.
Classification Notes - No. 30.9, August 2014
Sec.1 General – Page 9
DET NORSKE VERITAS AS
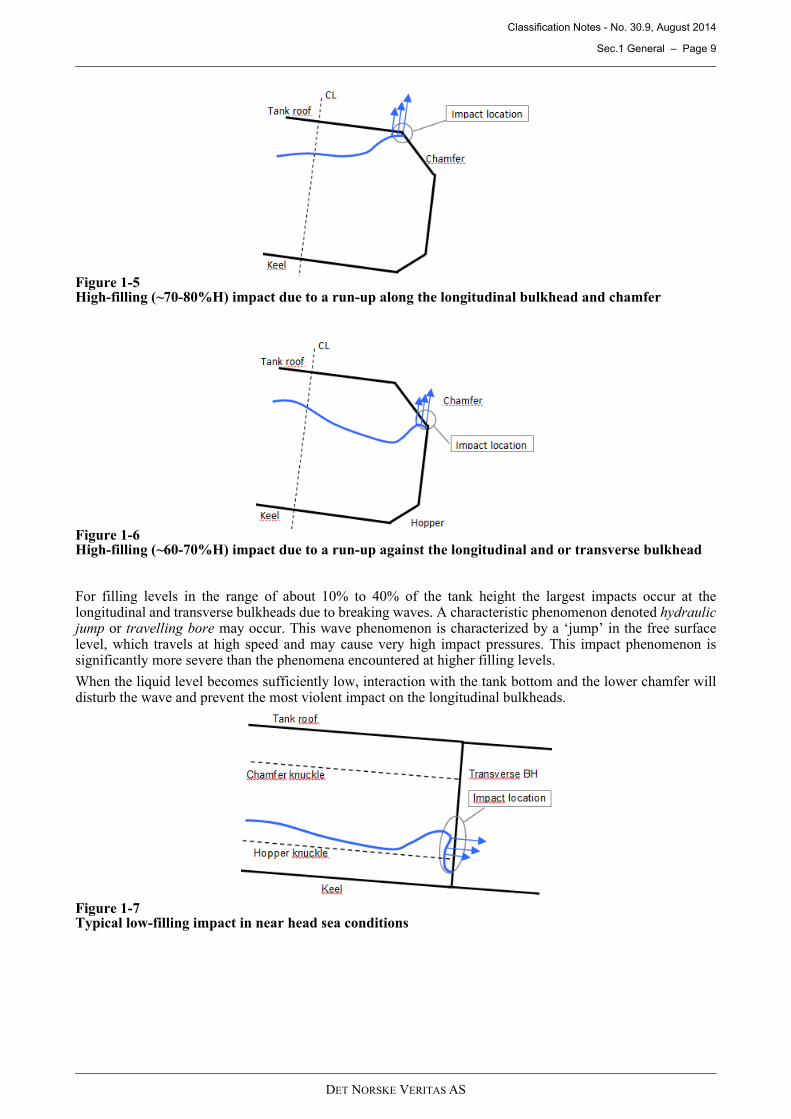
Figure 1-5High-filling (~70-80%H) impact due to a run-up along the longitudinal bulkhead and chamfer
Figure 1-6High-filling (~60-70%H) impact due to a run-up against the longitudinal and or transverse bulkhead
For filling levels in the range of about 10% to 40% of the tank height the largest impacts occur at thelongitudinal and transverse bulkheads due to breaking waves. A characteristic phenomenon denoted hydraulicjump or travelling bore may occur. This wave phenomenon is characterized by a ‘jump’ in the free surfacelevel, which travels at high speed and may cause very high impact pressures. This impact phenomenon issignificantly more severe than the phenomena encountered at higher filling levels.
When the liquid level becomes sufficiently low, interaction with the tank bottom and the lower chamfer willdisturb the wave and prevent the most violent impact on the longitudinal bulkheads.
Figure 1-7Typical low-filling impact in near head sea conditions
Classification Notes - No. 30.9, August 2014
Sec.1 General – Page 10
DET NORSKE VERITAS AS
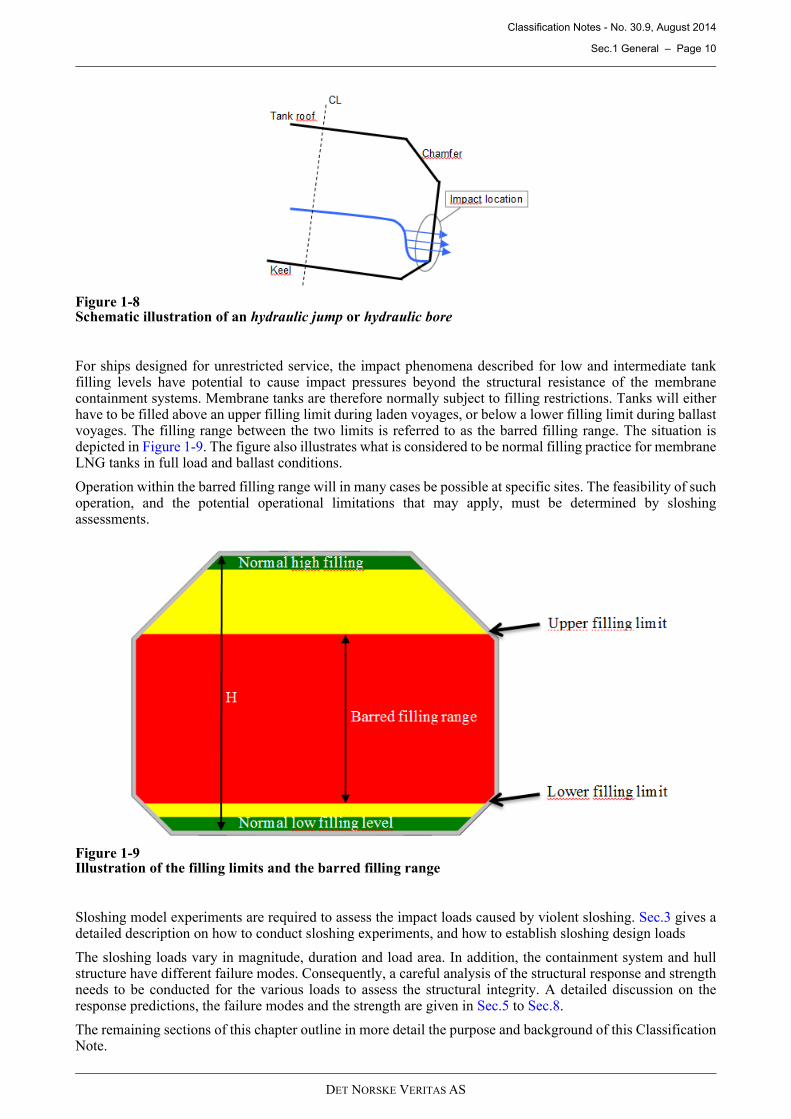
Figure 1-8Schematic illustration of an hydraulic jump or hydraulic bore
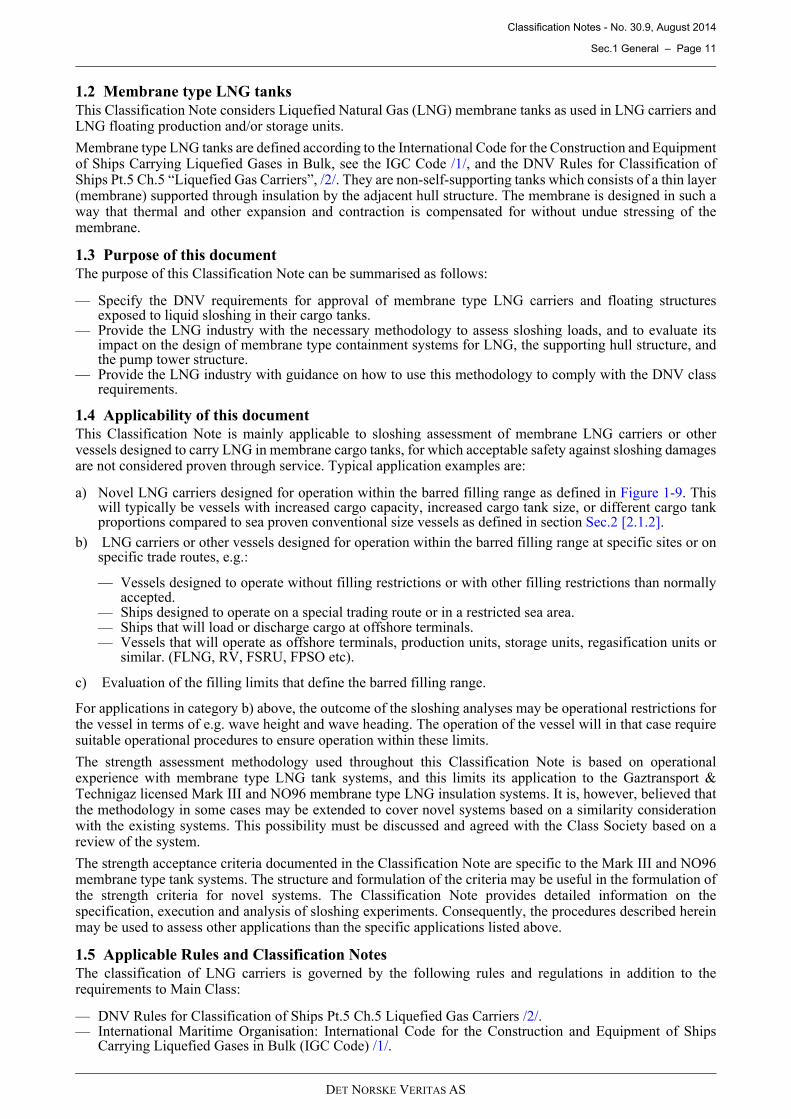
For ships designed for unrestricted service, the impact phenomena described for low and intermediate tankfilling levels have potential to cause impact pressures beyond the structural resistance of the membranecontainment systems. Membrane tanks are therefore normally subject to filling restrictions. Tanks will eitherhave to be filled above an upper filling limit during laden voyages, or below a lower filling limit during ballastvoyages. The filling range between the two limits is referred to as the barred filling range. The situation isdepicted in Figure 1-9 . The figure also illustrates what is considered to be normal filling practice for membraneLNG tanks in full load and ballast conditions.
Operation within the barred filling range will in many cases be possible at specific sites. The feasibility of suchoperation, and the potential operational limitations that may apply, must be determined by sloshingassessments.
Figure 1-9Illustration of the filling limits and the barred filling range
Sloshing model experiments are required to assess the impact loads caused by violent sloshing. Sec.3 gives adetailed description on how to conduct sloshing experiments, and how to establish sloshing design loads
The sloshing loads vary in magnitude, duration and load area. In addition, the containment system and hullstructure have different failure modes. Consequently, a careful analysis of the structural response and strengthneeds to be conducted for the various loads to assess the structural integrity. A detailed discussion on theresponse predictions, the failure modes and the strength are given in Sec.5 to Sec.8.
The remaining sections of this chapter outline in more detail the purpose and background of this ClassificationNote.
Classification Notes - No. 30.9, August 2014
Sec.1 General – Page 11
DET NORSKE VERITAS AS
1.2 Membrane type LNG tanks
This Classification Note considers Liquefied Natural Gas (LNG) membrane tanks as used in LNG carriers andLNG floating production and/or storage units.
Membrane type LNG tanks are defined according to the International Code for the Construction and Equipmentof Ships Carrying Liquefied Gases in Bulk, see the IGC Code /1/, and the DNV Rules for Classification ofShips Pt.5 Ch.5 “Liquefied Gas Carriers”, /2/. They are non-self-supporting tanks which consists of a thin layer(membrane) supported through insulation by the adjacent hull structure. The membrane is designed in such away that thermal and other expansion and contraction is compensated for without undue stressing of themembrane.
1.3 Purpose of this document
The purpose of this Classification Note can be summarised as follows:
— Specify the DNV requirements for approval of membrane type LNG carriers and floating structuresexposed to liquid sloshing in their cargo tanks.
— Provide the LNG industry with the necessary methodology to assess sloshing loads, and to evaluate itsimpact on the design of membrane type containment systems for LNG, the supporting hull structure, andthe pump tower structure.
— Provide the LNG industry with guidance on how to use this methodology to comply with the DNV classrequirements.
1.4 Applicability of this document
This Classification Note is mainly applicable to sloshing assessment of membrane LNG carriers or othervessels designed to carry LNG in membrane cargo tanks, for which acceptable safety against sloshing damagesare not considered proven through service. Typical application examples are:
a) Novel LNG carriers designed for operation within the barred filling range as defined in Figure 1-9 . Thiswill typically be vessels with increased cargo capacity, increased cargo tank size, or different cargo tankproportions compared to sea proven conventional size vessels as defined in section Sec.2 [2.1.2].
b) LNG carriers or other vessels designed for operation within the barred filling range at specific sites or onspecific trade routes, e.g.:
— Vessels designed to operate without filling restrictions or with other filling restrictions than normallyaccepted.
— Ships designed to operate on a special trading route or in a restricted sea area.— Ships that will load or discharge cargo at offshore terminals.— Vessels that will operate as offshore terminals, production units, storage units, regasification units or
similar. (FLNG, RV, FSRU, FPSO etc).
c) Evaluation of the filling limits that define the barred filling range.
For applications in category b) above, the outcome of the sloshing analyses may be operational restrictions forthe vessel in terms of e.g. wave height and wave heading. The operation of the vessel will in that case requiresuitable operational procedures to ensure operation within these limits.
The strength assessment methodology used throughout this Classification Note is based on operationalexperience with membrane type LNG tank systems, and this limits its application to the Gaztransport &Technigaz licensed Mark III and NO96 membrane type LNG insulation systems. It is, however, believed thatthe methodology in some cases may be extended to cover novel systems based on a similarity considerationwith the existing systems. This possibility must be discussed and agreed with the Class Society based on areview of the system.
The strength acceptance criteria documented in the Classification Note are specific to the Mark III and NO96membrane type tank systems. The structure and formulation of the criteria may be useful in the formulation ofthe strength criteria for novel systems. The Classification Note provides detailed information on thespecification, execution and analysis of sloshing experiments. Consequently, the procedures described hereinmay be used to assess other applications than the specific applications listed above.
1.5 Applicable Rules and Classification Notes
The classification of LNG carriers is governed by the following rules and regulations in addition to therequirements to Main Class:
— DNV Rules for Classification of Ships Pt.5 Ch.5 Liquefied Gas Carriers /2/.— International Maritime Organisation: International Code for the Construction and Equipment of Ships
Carrying Liquefied Gases in Bulk (IGC Code) /1/.

Classification Notes - No. 30.9, August 2014
Sec.1 General – Page 12
DET NORSKE VERITAS AS
In addition to these documents, the Classification Society enforces limits on the allowable tank filling levelsand limits on the allowable cargo tanks dimensions. These limits are subject to continuous considerations, andthe applicable limits can be obtained upon request to the Society.
1.5.1 Approval procedure for non-standard ships or ship operations
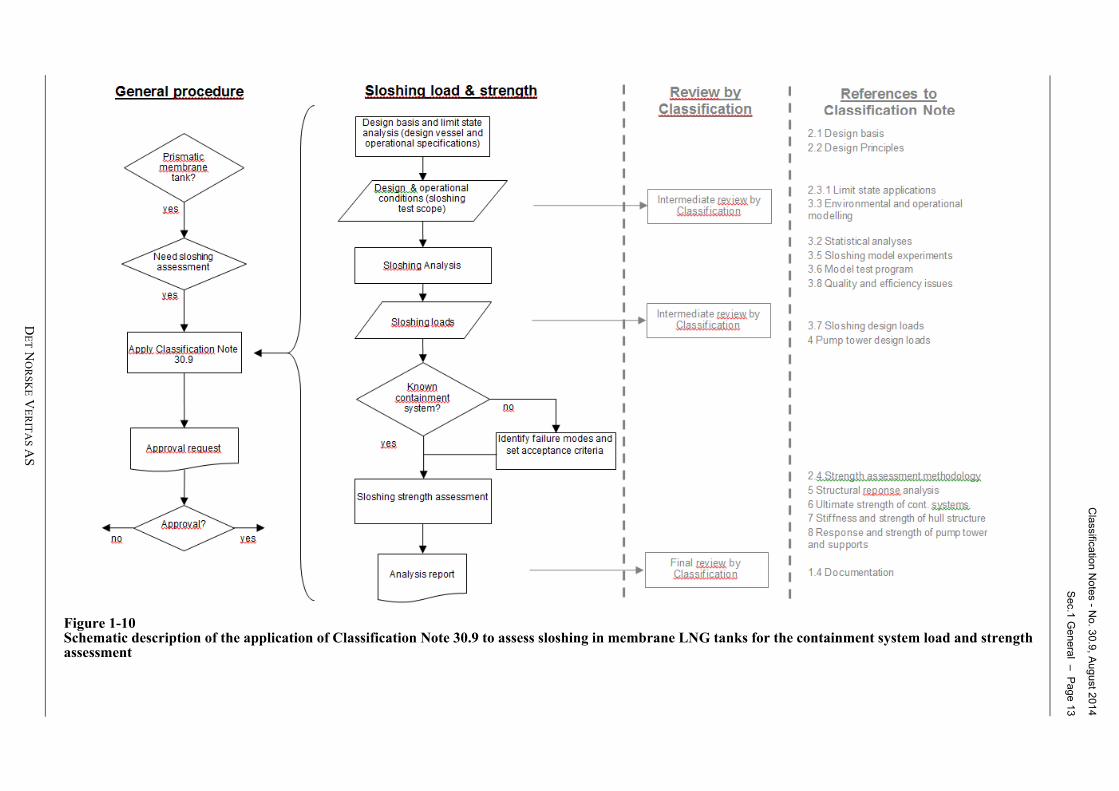
This document describes how a sloshing load and strength assessment can be conducted in order to achieveclass approval from DNV. The basic approach as outlined in this Classification Note is illustrated in Figure 1-10 . A short summary of the 2nd column describing the sloshing load and strength assessment is given in thefollowing.
The first step starts by describing the design basis and the limit states for the vessel. The result of this is adetailed list describing the specifications, which are used to develop a scope of work for the sloshingexperiments. It is strongly recommended that this first phase is discussed with DNV Classification.
Sloshing experiments are conducted resulting in a set of sloshing loads, which are used in the strengthassessment of the containment system. Strength acceptance criteria for the containment system(s) is needed tocarry out a strength assessment. For the known GTT systems, i.e. NO96 and Mark III, acceptance criteria areestablished and described in this Classification Note.
If a new containment system is under consideration, the failure modes must be identified and the strengthacceptance criteria need to be defined.
1.6 DocumentationThe following documentation is to be provided and submitted to the Classification Society as part of the designreview and approval:
— The design basis used for the design of the vessel, i.e. the target case.— The sloshing experimental programme, including the ship motion predictions, the test set-up, the test scope,
the post-processing and the results.— The analysis of the sloshing experimental programme.— Load and/or strength analysis for containment system and hull strength— Load and strength calculations for the pump tower and supports.— Drawings of containment system, pump tower, and supports.
C
lassific
atio
n N
ote
s - N
o. 3
0.9
, Au
gu
st 2
01
4 S
ec.1
Ge
ne
ral –
Pa
ge
13
DE
T N
OR
SK
E V
ER
ITA
S A
S
Figure 1-10Schematic description of the application of Classification Note 30.9 to assess sloshing in membrane LNG tanks for the containment system load and strengthassessment
Classification Notes - No. 30.9, August 2014
Sec.2 Design basis and principles – Page 14
DET NORSKE VERITAS AS
2 Design basis and principles
2.1 Design basis
2.1.1 Materials
The methodology for assessment of the hull structure and the pump tower presented in this Classification Noteis based on the presumption that materials are selected in accordance with the requirements of the DNV RulesPt5 Ch5.
The methodology for the strength assessment of the containment systems is based on the presumption that thematerials satisfy the requirements specified by the license owner, Gaztransport & Technigaz S.A.s.
2.1.2 Comparative basis (reference case)
The basis for the comparative assessment of new LNG carrier designs and operations should be a referencecase which represents the LNG carrier designs and operations proven acceptable through service.
The reference vessel is a 4-tank LNG carrier with a total cargo capacity of 130 000 m3 to 140 000m3 utilisingthe Gaztransport & Technigaz Mark III or NO96 type containment system. The containment system should beof the same type for the reference case as for the target case. The selection of an appropriate reference vesselmay be subject to discussion with DNV Classification.
A design speed of 19.5 knots is assumed.
Wave climate representing the trade routes for the existing fleet of reference type vessels should be considered.
The tank fillings are between 90% and 98.5% of the tank height.
2.1.3 Containment systems
For the purpose of this Classification Note, the target LNG carrier utilises a membrane type containment systemapplied in prismatic chamfered tank configurations.
The structural strength assessment methods described in this Classification Note is applicable to theGaztransport & Technigaz Mark III and NO96 tank insulation systems, and moderate evolutions of thesesystems in terms of modified plate thickness, modified support spacing, and modified configurations of internalload bearing structure.
2.1.4 Cargo tank environment
The strength of the insulation system should be evaluated on the basis of a cargo temperature of -163°C, and atemperature of 20°C at the level of the steel structure in the cargo tank compartment.
A cargo density of 500 kg/m3 is recommended to be used in the analyses.
2.1.5 Normal operation of LNG carriers
With the exception of vessels trading as specified in [2.1.7], it is assumed in this Classification Note that LNGcarriers mainly trade with tank filling levels above 90%H, and only occasionally at filling levels between 90%Hand the minimum acceptable upper range.
2.1.6 Novel vessel designs operated within the standard approved filling range
This refers to LNG carriers with design modifications compared to carriers known to and approved by theSociety in the past, and where the design modification is expected alter the sloshing characteristics of the tanks.This could be an LNG carrier with increased tank dimensions, different tank proportions, different tankdimensions relative to ship dimensions, etc. compared to proven LNG carrier designs.
What is considered to be a proven LNG carrier design will evolve over time, and the designer is requested tocontact DNV for the current status.
The number of tanks may be specified by the designer.
The design speed is to be specified by the designer.
It is assumed that the vessel trades on a World Wide basis. Dedicated trade routes should be considered if thesecould be more severe in terms of sloshing.
A minimum design life of 25 years is assumed for the fatigue calculations of the pump tower.
The carrier will operate with a barred filling range, i.e. the tank filling will be maintained below a specifiedmaximum filling height during operation with low tank filling, and above a minimum allowable fill heightduring operation with high tank fillings. The filling limits may have to be changed to achieve compliance withthe strength requirements for the containment system.

Classification Notes - No. 30.9, August 2014
Sec.2 Design basis and principles – Page 15
DET NORSKE VERITAS AS
2.1.7 Operation outside the standard approved filling ranges
This section applies to vessels or offshore units designed to operate outside the standard approved filling rangeduring part of its service life. Examples are vessels that spend limited time discharging at a offshore terminal,or vessel that operate as an FPSO and is permanently moored at an offshore site.
The number, shape and configuration of tanks may be specified by the designer.
The designer needs to define a mooring configuration to be used by the vessels when at site, e.g. spreadmooring, bow-turret mooring or mooring alongside an offshore structure. The use of dynamic positioningsystem (DP) or other means to obtain more optimal relative wave headings should be accounted for.
The designer need to define the cargo discharge procedures.
The forward speed profile of the vessel must be defined.
The fractions of the vessel’s operation time spent moored on-site and being in normal trading must be specified.The annual risk of failure during both parts of the operation needs to be within acceptable limits. To assess thisboth the relative wave heading profile and the tank filling profile in the different phases of the vessel operationneed to be assessed.
During filling and discharging, vessels will normally experience all filling levels inside the cargo tanks.
Emergency procedures should be specified in order to account for these in the assessment.
2.2 Design principles
2.2.1 Limit state design principles
The sloshing assessment is to be based on the principles of limit state design. This means that all relevant failuremodes of the considered structure or structural component should be identified and assigned criteria that definethe limits for when it satisfies its required function. The limit is referred to as a limit state, and is formallydefined as a condition which the structure, or part of the structure, no longer satisfies its functionalrequirements.
In terms of liquid sloshing the requirements concern the safety of life, property (ship + cargo) and theenvironment, and the limit states will be classified as follows:
The limit states will be classified as follows:
1) ULS – Ultimate Limit StatesThe ULS concern the ability of the structure (or system) to resist the action of (extreme) the maximumexpected loads or load effects during the design life of the ship. The limit state corresponds to the maximumload-carrying capacity (or strain or deformation) under intact conditions.
2) ALS – Accidental Limit StatesThe ALS concerns the ability of the structure or system to resist accident situations. The limit state concernsthe safety of life, property and the environment in
a) Intact conditions under the action of abnormal loads.
b) Damaged condition under the action of normal loads.
3) FLS – Fatigue Limit StatesThe FLS concerns the ability of the structure to resist time-varying (cyclic or repeated) loading.
4) SLS – Serviceability Limit States
The SLS concern the ability of the structure or system to resist the action of expected loads or load effectsencountered during normal use without causing deformations or damages that may cause detoriation of thedurability or function of the structure/system.
If the ULS assessment is based on structural strength criteria that ensure insignificant permanent deformationof the insulation system or the membranes, as will be the case if the criteria given in this Class Note are used,the SLS can be disregarded when considering sloshing loads. If, however, the ULS acceptance criteria accepthigher deformations within ranges acceptable with respect to the integrity of the membranes, additionalServiceability Limit States may have to be defined to ensure a suitably low frequency of permanentdeformations of insulation and membranes during operation. No abnormal environmental conditions areconsidered for the ALS, e.g. freak waves, tsunamis, 10 000 years storms.
The possible severe consequences of loss of containment of the membrane system, and the severe economicconsequences of damages to the system implies that the functional requirements defining the Accidental LimitState will be the same as the ones defining the Ultimate Limit State and the Fatigue Limit State.
The overall functional requirements that need to be considered when determining the limit states for thestructures governed by this Classification Note are:
Classification Notes - No. 30.9, August 2014
Sec.2 Design basis and principles – Page 16
DET NORSKE VERITAS AS
— Integrity of the primary and the secondary membranes— The insulation system should be able to withstand the sloshing impact loads without suffering damages or
excessive deformations compromising the support of the primary and secondary membranes.— The inner hull structure should be able to withstand the combined effect of global hull stresses and sloshing
impact loads without compromising the support of the tank insulation system.— The pump tower including its supports should be able to withstand the combined effect of gravity,
temperature loads, inertia loads, and drag forces induced by liquid sloshing without suffering damage.
2.2.2 Risk based acceptance criteria
Acceptance criteria should be defined for all identified modes of failure of the considered structure by the useof risk assessments as outlined in the DNV Rules for Classification of Ships Pt.1 Ch.1 Sec.1 B609. Acceptancelevels should be set to obtain a risk level for the considered operation consistent with maritime industrystandards, or higher standards set by owners or operators.
The general acceptance criteria specified in the class note will be applicable to other regulatory regimes, suchas the offshore industry, provided that the acceptable risk level is adjusted accordingly.
Risk is defined as the product of probability of failure times the consequence associated with failure. A costoptimal design is achieved when the risk associated with all modes of failure is uniform, and it follows that theacceptance level for the failure modes should depend on the consequence of failure.
Full quantitative risk assessments will normally not be realistic due to insufficient information about the largenumber of variables and parameters involved. A simpler qualitative assessment as described below isconsidered to be a more realistic alternative.
Failure modes should be ranked according to the perceived consequences of exceeding the associated limitstates. It is recommended that this is done by introducing consequence classes, where a step in consequenceclass represents a uniform change in consequence. A factor of ten (logarithmic) between consequence classesis commonly used. A convenient framework for evaluating failure consequences can be found e.g. in DNV-RP-A203 /15/.
The acceptable probabilities of exceeding the limit states for the considered failure modes should be set toachieve the defined acceptable risk level associated with all modes of failure. If the failure modes are rankedin consequence classes as described above, the acceptable probabilities of failure will be linearly dependent onconsequence class.
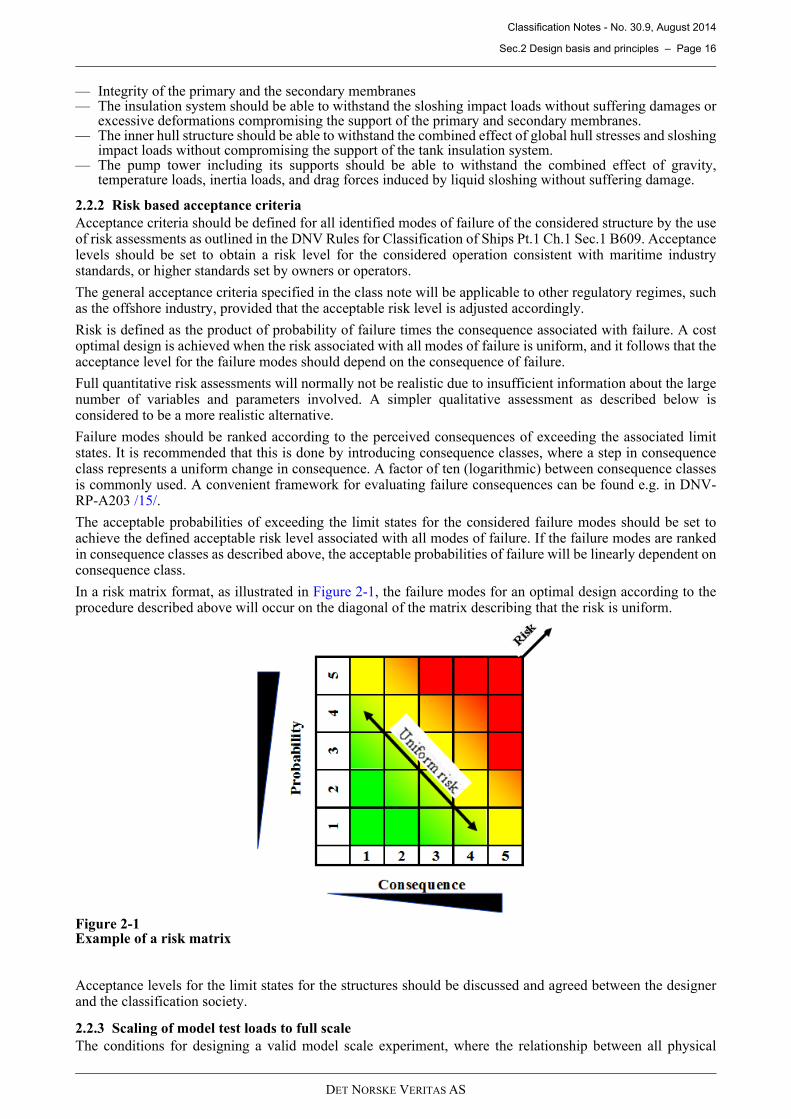
In a risk matrix format, as illustrated in Figure 2-1 , the failure modes for an optimal design according to theprocedure described above will occur on the diagonal of the matrix describing that the risk is uniform.
Figure 2-1Example of a risk matrix
Acceptance levels for the limit states for the structures should be discussed and agreed between the designerand the classification society.
2.2.3 Scaling of model test loads to full scale
The conditions for designing a valid model scale experiment, where the relationship between all physical
Classification Notes - No. 30.9, August 2014
Sec.2 Design basis and principles – Page 17
DET NORSKE VERITAS AS
quantities in model and prototype are consistent and well defined, can be derived from the mathematicalequations governing the physical problem. The conditions are normally expressed in terms of non-dimensionalquantities that describe how each physical quantity that enters the problem should be scaled to achievesimilarity. For quantities measured in the model experiment these relationships describes how the quantityshould be scaled to represent the conditions in a full scale tank (prototype).
It is well established that the wave motion and hydrodynamic pressures in liquids in a confined tank can bestudied in model scale provided that the model experiment is designed so that the dimensionless Froude numberis similar between model and prototype. Hydrodynamic pressures at prototype scale can easily be obtainedfrom the model by applying the geometric model scale factor. Under idealized conditions this would also applyto the impact pressure. However, the impact pressure is influenced by other phenomena such as the local shapeof the wave at impact, the flow of gas between the wave and the wall prior to impact, behaviour of gas trappedbetween wave and tank wall, etc. Additional similarity conditions must be met to ensure physical similaritybetween impacts at model and prototype scale, and hence ensure well defined relationships between impactpressures in the two scales. This is discussed in e.g. /13/ and /14/.
Ref. /14/ identifies the following potential effects that may happen locally at the same time or in sequenceduring an impact:
1) Escape of the gas in between the liquid and the wall when possible. This leads to a transfer of momentumbetween liquid and gas.
2) Compression of the gas fraction during the last stage of the impact. The gas is partially entrapped (bubblesor pockets) and partially escaping.
3) Partial condensation of the compressed fraction of gas depending on the speed of condensation with regardto impact duration.
4) Rapid change of momentum of the liquid forced to adapt its shape to avoid the obstacle.
5) Possible creation of shock waves: pressure wave within the liquid and strain wave within the wall. This willhappen when the Density Ratio is low or when the modulus of compressibility of the gas is low. The liquidcannot sufficiently adapt its momentum before the impact. Shock waves are necessary to absorb themomentum gap at the surface of discontinuity between liquid and impacting wall.
6) Hydro-elasticity effects during the fluid-structure interaction.
Deviations from the proper similarity conditions will influence the relative importance of the variousphenomena. This will affect impact pressure intensities and pressure signatures in a way that cannot be fullyaccounted for by a scaling law for e.g. pressure magnitude or duration.
Similarity between model scale experiment and prototype is determined by the liquid test medium, the ullagegas, and the thermodynamic states of the liquid and the ullage gas (temperature and pressure). Current researchindicates that the main parameters of influence are compressibility of the gas and the density ratio betweenliquid and gas. It has also been concluded that the target similarity conditions cannot be simultaneously met forthese parameters at the scales commonly used in model experiments.
Current research does not yet provide conclusive recommendation regarding test liquid, ullage gas, and scaling.A practical engineering approach as described in the following is proposed.
The factor for scaling of model test loads to full scale should be determined by a sloshing assessment of thereference vessel specified in [2.1.2], considering the operational experience relevant for this kind of vessels.Details about how to establish and use this scale factor is given in [2.4].
The model tests for the reference vessel and the vessel under consideration, referred to as the target vessel, mustbe carried out on the same test rig, and using the same measurement equipment and data acquisitions system.Further, the data processing and analysis methods, as well as the response and strength analysis methods mustbe similar for the reference and the target cases. Consistent treatment of the reference and the target cases islikely to reduce potential bias in the determination of the sloshing impact loads and the structural response andcapacity assessment.
The scale factor obtained in this way does not only represent the model scale factor for the experimental setup,but also a calibration of the load and strength assessment procedure. This includes the effects of local wallsurface geometry, i.e. raised edges and corrugations, that is normally not considered in the model tests, but thathas been shown by research and experience to have a potentially significant influence on the local impactpressure
Alternative methods to determine the scale factor may be accepted by the Society if proper technicaljustification is provided.
Classification Notes - No. 30.9, August 2014
Sec.2 Design basis and principles – Page 18
DET NORSKE VERITAS AS
2.2.4 Comparative treatment of inner hull structure
The loads that act on the cargo containment system (CCS) must be carried by the inner hull structure of thevessel. Structural collapse of the inner hull structure is likely to cause loss of containment of the tank. Further,adequate support of the CCS is of high importance to avoid excessive interaction loads and deformations thatcan lead to damages from extreme impact loads and during long time exposure.
The inner hull structure should be dimensioned to provide adequate safety against excessive permanentdeformations, and to provide a sufficient support to avoid unacceptable stress concentrations in the cargocontainment system.
Sloshing impact loads are considered to occur on a limited part of the sloshing exposed surfaces of the tank,and due to the proportions of the inner hull structure it is only considered relevant for the dimensioning of theplates and stiffeners that carry the cargo containment systems. The plates and stiffeners have significantlylarger proportions than the structural components of the cargo containment system, and are less sensitive to thehighest localised sloshing impact loads that will normally be dimensioning for the containment system. Plateand stiffener dimensions will be determined by the integrated loads over a larger area of the structure.
The strength assessment of the inner hull structure may be carried out using simplified comparative assessmentmethodology considering only the relative change in linear elastic structural response between the consideredtarget vessel and the reference vessel.
2.2.5 Sloshing design loads
The determination of the sloshing impact loads for assessment of containment system and hull strength shouldbe based on sloshing model experiments. For the pump tower, the hydrodynamic loads associated with sloshingcan be considered to be drag dominated, and may be determined based on numerical simulations.
The ship motions used for the sloshing experiments should be determined using a verified ship motion analysisprogram.
The sloshing design loads should in general be based on long term load distributions relevant for actual vesseloperation at sea. The exceedance probability level for the design loads should be determined based on theconsequence associated with the considered mode of failure. If the reference and the target are very similar withrespect to geometry, tank size and filling level simplifications might be possible.
The sloshing loads considered for the assessment of the containment system are impact loads acting on smallareas, typical box or panel sizes and smaller. Larger areas may be relevant for assessment of the hull structure.
The procedure to determine sloshing design loads is presented in detail in Sec.3.
2.2.6 Structural response analyses
The structural response analysis methodology needs to be capable of accurately predicting the structuralresponse in the response range up to where damages are likely to occur in the structure. Depending on theresponse characteristics of the considered structure, it may be required to consider non-linear structuralresponse.
The structural response assessment needs to consider and include all physical effects that affect the relativestructural response between locations relevant for the assessment of the individual failure modes, and effectsthat potentially give different results for the reference and the target cases. The most important effects that mustbe included are:
— Effects of the temperature variations through the thickness of the insulation system.— Dynamic response effects.
Details on how to handle these effects are given in Sec.4.
2.2.7 Ultimate capacity models
The ultimate capacity models should be able to predict the limit states associated with damages to thecontainment system.
All physical effects that significantly affect the relative structural strength between the individual failuremodes, and effects that may affect the validity of the load scale factor described in [2.2.3] should be includedin the capacity models.
The most important effects that must be included are:
— Effects of the temperature variations through the thickness of the insulation system.— Strength differences caused by differences in the dynamics of the response.
Details on how to handle these effects are given in Sec.6 for the containment systems.

Classification Notes - No. 30.9, August 2014
Sec.2 Design basis and principles – Page 19
DET NORSKE VERITAS AS
2.2.8 Fatigue capacity models
The cumulative damage (D) from repeated sloshing impacts should be calculated according to the Miner-Palmgren theory in combination with S-N curves, a characteristic stress range, and a long term responsedistribution curve, as follows:
where the summation is over a number of i stress intervals, ni is the number of load cycles within each stressinterval, and Ni is the number of cycles to failure for the constant stress range of that interval.
2.2.9 Design format
2.2.9.1 Cargo containment system
The criteria for the assessment of the cargo containment system are formulated as follows:
S is the structural response, in general a non-linear function of the dynamic load.
p is the design sloshing impact pressure scaled according to the comparative procedure described in [2.4].
DAF is the dynamic load factor.
Rc is the capacity in terms of the considered response parameter.
2.2.9.2 Inner hull structure
The criteria for the assessment of the inner hull structure are formulated as follows:
For comparative strength assessment of inner hull stiffeners:
σtar is a stress response at a location considered relevant to describe the resistance of the target vessel structure
σref is a stress response at a location considered relevant to describe the resistance of the reference vesselstructure
2.2.9.3 Pump tower assessment
The criteria for the assessment of the pump tower and the pump tower support structures are formulated asfollows:
S is the structural response
Fi are the various load components acting on the structure, e.g. sloshing loads, inertia loads, wave induced loads
Rc is the capacity in terms of the considered response parameter
γFi are the partial load factors defined in [2.2.10]
γM is the partial resistance factor, defined in [2.2.10].
2.2.10 Partial safety factors
2.2.10.1 Load and resistance factors for pump tower and supports
Applicable load and resistance factors for the pump tower and supports are given in Table 2-1.
For FLS assessment, a design fatigue factor shall be used. The calculated damage, multiplied with the designfatigue factor (DFF), should be less than or equal to 1.0:
Table 2-1 Applicable values of the load and resistance factors for pump tower and supports
ULS FLS
γF, sloshing loads 1.3 1.0
γF, wave induced loads (inertia, hull girder, pressure) 1.15 1.0
γF, other loads (gravity, thermal) 1.0 1.0
γM 1.15 1.0
∑=i i
i
N
nD ,
cRDAFpS ≤⋅ )( , where
refear σσ ≤ , where
M
cFi
RFS
i γγ ≤)( , where
Classification Notes - No. 30.9, August 2014
Sec.2 Design basis and principles – Page 20
DET NORSKE VERITAS AS
The design fatigue factor should be taken as /11/:
DFF=1.0 for parts accessible for inspection
DFF=3.0 for parts not accessible for inspection, but not substantial consequence of failure
DFF=10.0 for parts not accessible for inspection, and substantial consequence of failure
2.3 Application of principles
This chapter describes the application of the design principles as outlined in [2.2] using the design basis asgiven section Sec.2.
2.3.1 Limit state applications
This section describes the application of the limit states, as described in [2.2.1], to specific LNG carrierapplications.
Consideration of fatigue limit states (FLS) will normally not be required for the membrane insulation systems.This conclusion is based on technical investigations carried out by DNV that can be generalised as aconsequence of both the characteristics of the sloshing phenomenon as well as properties of the comparativestrength assessment methodology.
The following characteristics of the sloshing phenomenon are important:
1) Significant liquid sloshing motion requires a certain level of ship motions combined with motion periodsin the same range as the natural period for the sloshing motion in the tank (resonance). The number ofsloshing impacts during the lifetime of a vessel is therefore low compared to what is common for fatigueexposed structures.
2) Extreme sloshing impact loads do not only require the presence of extreme sloshing motion in the tank, butalso requires a certain unfavourable fluid surface geometry at impact to avoid gas cushioning. The few highimpact loads of this character occurring during the lifetime of the vessel are significantly higher than theother impact loads. The long term sloshing load distribution will therefore show a rapid decrease in loadlevel with increasing number of cumulative impacts.
3) Variations in wave heading and filling levels will lead to variations in the sloshing exposed locations in thetank. This will further limit the number sloshing impacts per impact location in the LNG tank.
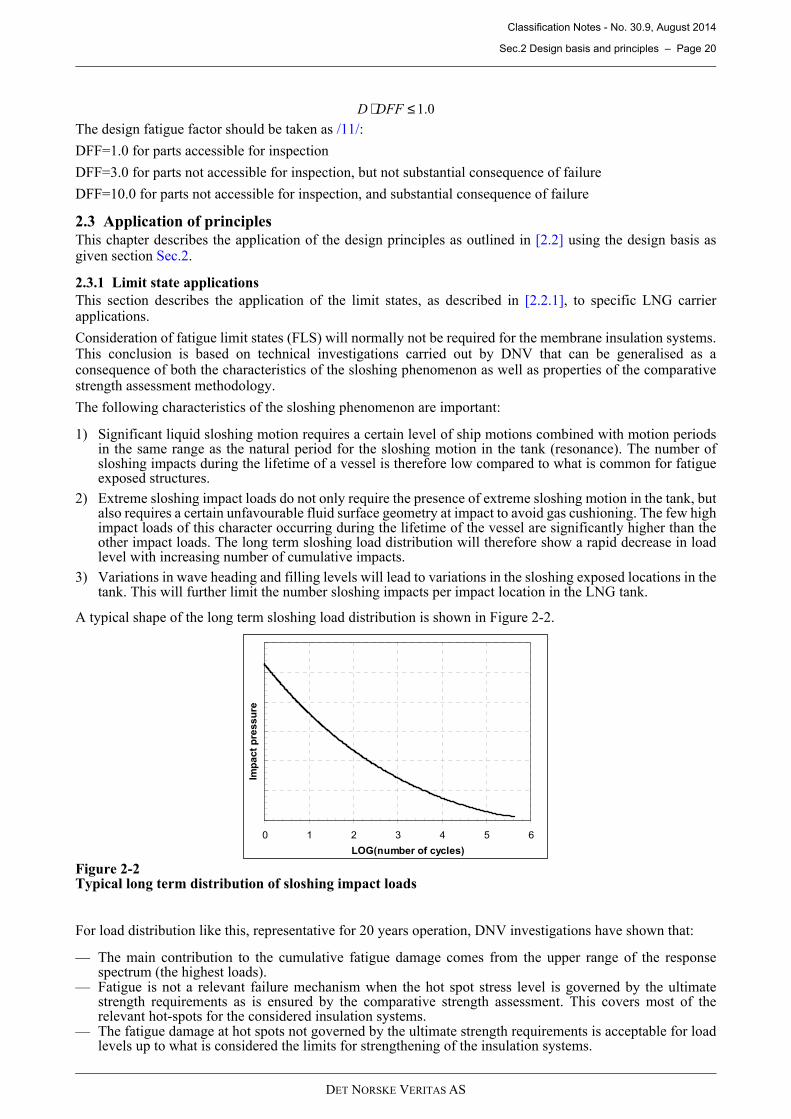
A typical shape of the long term sloshing load distribution is shown in Figure 2-2.
Figure 2-2Typical long term distribution of sloshing impact loads
For load distribution like this, representative for 20 years operation, DNV investigations have shown that:
— The main contribution to the cumulative fatigue damage comes from the upper range of the responsespectrum (the highest loads).
— Fatigue is not a relevant failure mechanism when the hot spot stress level is governed by the ultimatestrength requirements as is ensured by the comparative strength assessment. This covers most of therelevant hot-spots for the considered insulation systems.
— The fatigue damage at hot spots not governed by the ultimate strength requirements is acceptable for loadlevels up to what is considered the limits for strengthening of the insulation systems.
0.1≤⋅ DFFD
0 1 2 3 4 5 6
LOG(number of cycles)
Imp
ac
t p
res
su
re
Classification Notes - No. 30.9, August 2014
Sec.2 Design basis and principles – Page 21
DET NORSKE VERITAS AS
These conclusions can be extended to govern longer operational times for the target case, e.g. 40 yearsoperation by the following argument.
The ULS design loads are taken at exceedance probability levels significantly below the lifetime return period,whether this is 20 or 40 years. The maximum response in response spectrum relevant for fatigue assessmentwill hence be significantly lower than the ultimate strength of the structure for any practically relevant designlife time.
2.3.2 Comparative design – reference case
Only an ULS condition is considered for this case, i.e. no FLS and ALS conditions are considered. Drifting inbeam seas due to an engine black-out is considered to occur in a less severe sea state than the ULS requirementsfor beam seas.
2.3.2.1 ULS condition
The ULS design load should be derived from a long term distribution of sloshing impact loads.
The ULS condition should be based on the accumulated operational experience for the existing fleet of LNGcarriers that has been confirmed to operate without sloshing damages.
Environmental conditions relevant for the actual trade of the LNG fleet should be considered. A trade specificscatter diagram can be developed based on global wave statistics given in DNV RP-C205 /3/.
The reference case sloshing impact loads should be defined as the most probable highest sloshing loadexperienced over the accumulated damage free operation time for the entire fleet. It follows that only the partof the fleet that has been inspected and found without damages caused by sloshing impacts should beconsidered.
If damages or deformations of the cargo containment system of the reference vessels have been identified, theload level considered not giving damages are relevant to consider as an acceptable reference load level.
The short-term sea states are to be modelled by the two-parameter Pierson-Moskowitz spectrum, see reference/3/.
Waves are to be modelled as short-crested.
A representative wave heading distribution should be used. If no accurate information is available, an equalprobability of all headings assumption is recommended. A minimum step size of 15 degrees is recommended.
To account for the voluntary heading changes, a significant wave limit (Hs) of 7 meters should be used for beamsea conditions (60-120 degrees). The probabilities related to sea state exceeding this Hs limit for beam seaconditions should be assigned to headings close to head sea (165 degrees).
For quartering sea conditions (30-60 and 120-150 degrees) the same principle of voluntary heading changeapplies. DNV recommends that a linear varying limitation from 7 meters at 60 and 120 degrees to 14 meters at30 and 150 degrees. The probabilities related to sea state exceeding this Hs limit for quartering sea conditionsshould be assigned to headings close to head sea (165 degrees).
A ballast loading condition and a loaded condition should be considered. For the latter a fully loaded or partlyloaded condition may be used. The loading condition giving the most representative ship motions should beused to determine the ship motions for the sloshing analyses.
The speed of the vessel should reflect typical operating speed. The speed of the vessel used in the analysis hasan important effect on the sloshing loads.
In following and stern quartering seas (135 and 180 degrees) no speed loss is anticipated.
For beam sea conditions (45 to 135 degrees) a reduction to 2/3 of the design speed is recommended for wavesexceeding 5 meters significant.
For head sea and bow quartering seas a reduction to 2/3 of the design speed is recommended for significantwave heights between 4 – 7 meters, and a reduction to half the design speed for waves exceeding 7 meterssignificant.
Use of other assumptions than those described above may be accepted if justified based on operationalexperience.
2.3.3 Novel vessel designs operated within the standard approved filling ranges
Only an ULS condition is considered for this case.
2.3.3.1 ULS condition
The ULS design load should be derived from a long term distribution of sloshing impact loads.
For vessels designed for unrestricted operation the ULS condition should be based on North-Atlantic operation.

Classification Notes - No. 30.9, August 2014
Sec.2 Design basis and principles – Page 22
DET NORSKE VERITAS AS
Wave scatter diagrams for the North-Atlantic Ocean can be found in IACS Rec. No. 34, see /4/, or DNVRecommended Practice RP-C205, see /3/.
Vessels could also be designed to operate on specific routes, with actual wave climate conditions.Representative wave conditions are given in DNV Recommended Practice RP-C205, see /3/.
The short-term sea states are to be modelled by the two-parameter Pierson-Moskowitz spectrum, see reference/3/.
Waves are to be modelled as short crested waves.
Wave headings from following (0 degrees) to head waves (180 degrees) are to be considered. A minimum stepsize of 15 degrees is recommended.
As captains normally voluntarily will avoid beam sea conditions in the most severe sea states, a significantwave height (Hs) limit may be introduced for sea conditions (60-120 degrees). DNV recommend a limitationof 7 meters, but other limitations may be accepted if more precise information of operation of the vessels isavailable. The probabilities related to sea state exceeding this Hs limit for beam sea conditions should beassigned to headings close to head sea (165 degrees).
For quartering sea conditions (30-60 and 120-150 degrees) the same principle of voluntary heading changeapplies. DNV recommend that a linear varying limitation from 7 meters Hs at 60 and 120 degrees to 14 metersat 30 and 150 degrees. The probabilities related to sea state exceeding this Hs limit for quartering sea conditionsshould be assigned to headings close to head sea (165 degrees).
The speed of the vessel should reflect both the involuntary and voluntary speed loss in different waveconditions and relative wave headings, experienced by the vessel under operation. The speed of the vessel usedin the analysis has an important effect on the sloshing loads.
In following and stern quartering seas (135 and 180 degrees) no speed loss is anticipated.
For beam sea conditions (45 to 135 degrees) a reduction to 2/3 of the design speed is recommended for wavesover 5 meters.
For head sea and bow quartering seas a reduction to 2/3 of the design speed is recommended for significantwave heights between 4 – 7 meters and a reduction to half the design speed for waves exceeding 7 meterssignificant.
A ballast loading condition and a loaded condition are to be considered. For the latter, a fully loaded or partlyloaded condition may be used. The loading condition giving the most severe ship motions is to be used todetermine the ship motions for the sloshing analyses.
Use of other assumptions than those described above may be accepted if justified based on operationalexperience.
2.3.4 Operation outside the standard approved filling ranges
Only ULS and ALS conditions are considered for this case.
2.3.4.1 ULS condition
The ULS design load should be derived from a long term distribution of sloshing impact loads.
The ULS design load should be based on wave conditions from a specific site / trading route.
The short-term sea states are to be modelled by a wave spectrum representative for the operational site/tradingroute. If no specific wave spectral information is available the JONSWAP wave spectrum may be used with apeakness parameter as described in DNV Recommended Practice RP-C205, /3/, [3.5.5.5].
Waves should be modelled as short-crested or long crested depending on what is considered mostrepresentative for the operation site/trading route.
Special care has to be taken if multi directional waves are expected on the site.
For a bow-turret moored LNG carrier wave headings from beam seas (90 degrees) to head waves (180 degrees)should be considered. A minimum step size of 15 degrees is recommended.
A weather vaning bow-turret moored LNG carrier will experience predominantly head sea waves. A low-frequency drift study may be used to determine the probability distribution for headings from beam to head seawaves. Such a study needs careful modelling or assessment of at least the following aspects:
— draft and trim variations— joint modelling of wave, current and wind— the effect of swell — mooring characteristics
Classification Notes - No. 30.9, August 2014
Sec.2 Design basis and principles – Page 23
DET NORSKE VERITAS AS
— shallow water effects (if present) (wave and ship dynamics).
For vessels where mooring limits weather vaning, wave headings from following (0 degrees) to head waves(180 degrees) should be considered. A minimum step size of 15 degrees is recommended.
For vessels using dynamic positioning (DP) to control wave headings during operation it is recommended tocontact the Classification Society in order to discuss a relevant set of wave headings that need to be consideredin the sloshing experiments.
For an LNG carrier that will operate inside the barred filling range on a specific route, wave headings fromfollowing (0 degrees) to head waves (180 degrees) should be considered.
The actual operation of the vessel needs to be reflected in the analysis. This includes e.g. the tank filling and/or discharge procedure, cargo transfer procedures that affects the filling level probability distribution for thetanks.
The number of tanks simultaneously operated in partial filling should be considered in the analysis.
Ballast, fully loaded, and intermediate loading conditions should be considered. The loading condition givingthe most severe ship motions should be used to determine the ship motions for the sloshing analyses.
While on-site no forward speed is normally to be considered.
2.3.4.2 ALS conditions
Accidental situations having a low but not negligible probability of occurrence, and where the resultingoperation scenario cannot be considered governed by the ultimate limit state assessment, will have to bespecially addressed as accidental limit state conditions.
ALS conditions will be relevant in situations where the ULS assessment is based on a set of operationalrestrictions, and where accidental or emergency scenarios can be envisaged where the specified operationallimits may be exceeded.
Examples of emergency and accidental events that may potentially lead to situations that require considerationof accidental conditions are:
— A vessel is forced to leave sheltered discharge locations with partially filled tanks due to an emergencysituation.
— Loss of passive or active wave heading control during partial fill operation due to disconnection frommooring or loss of thruster power.
Rare and extreme weather events such as hurricanes/typhoons may represent an ALS condition in cases wherethe environmental conditions created by these events are not reflected in the design basis (wind, wave, current,etc.) for the ULS.
The relevance of accidental conditions are dependent on the probability for coincident exposure to otheroperational or environmental parameters outside the specified operational limits, as well as the existence ofemergency plans to mitigate risks during accidents or emergencies. In the examples above this would typicallybe:
— The probability to encounter sloshing critical sea states and/or wave heading during emergency departure.— The probability to encounter wave environments outside the operational limits for beam sea operation. — The ability and preparedness to avoid unfavourable wave heading exposure by alternative operational
measures such as navigation away from site. — The capability to redistribute cargo between tanks to linit exposore to hazardous conditions.
Relevant accidental scenarios should be identified in each particular case by operational risk analysis likeHAZOP studies or similar.
The expected frequency and duration of the scenarios should be estimated to the extent possible. This isimportant for determining relevant environmental conditions and acceptance criteria for the analyses.
Emergency operation procedures should be considered in the analyses.
The short-term sea states should be modelled by a wave spectrum which is representative for the specific site/route.
2.4 Strength assessment methodology
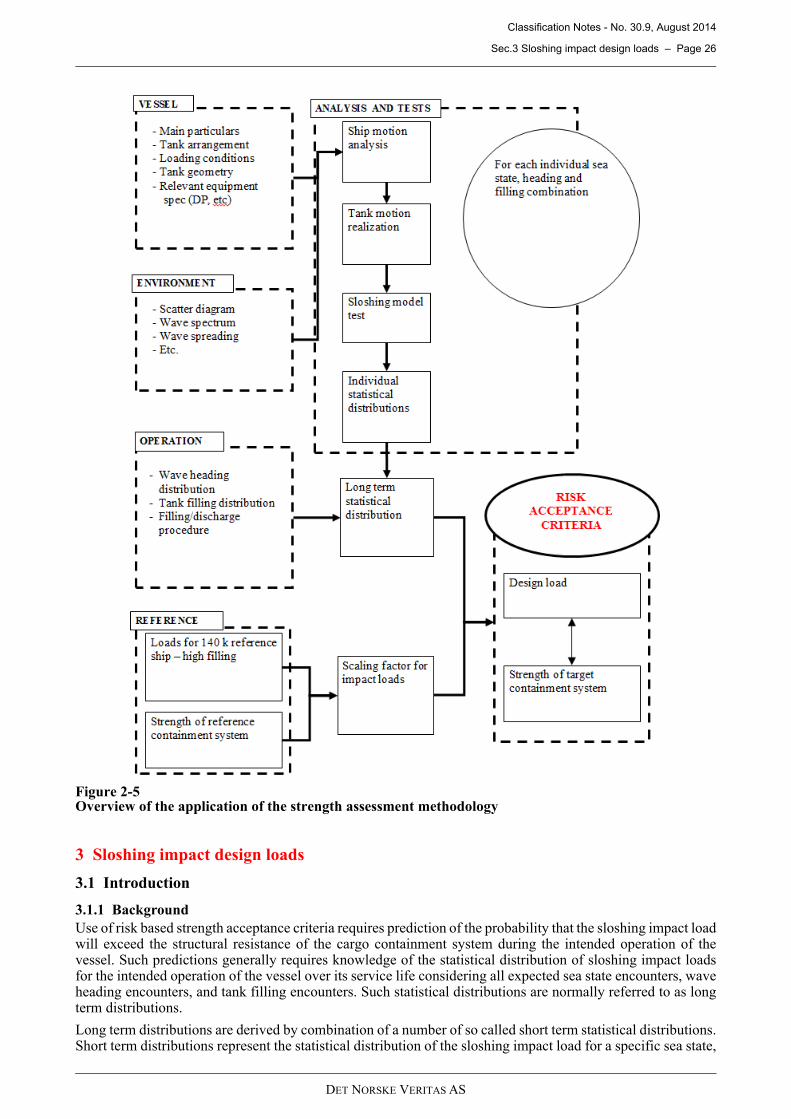
The overall methodology for the strength assessment of the membrane type insulation systems and itssupporting hull structure are summarised in Figure 2-5 . In the figure it is assumed that the reference load isestablished, but in principle this has to be done in a similar way as described for a target vessel.
The comparative aspect of the methodology lies in the assessment of the reference case, which is used to
Classification Notes - No. 30.9, August 2014
Sec.2 Design basis and principles – Page 24
DET NORSKE VERITAS AS
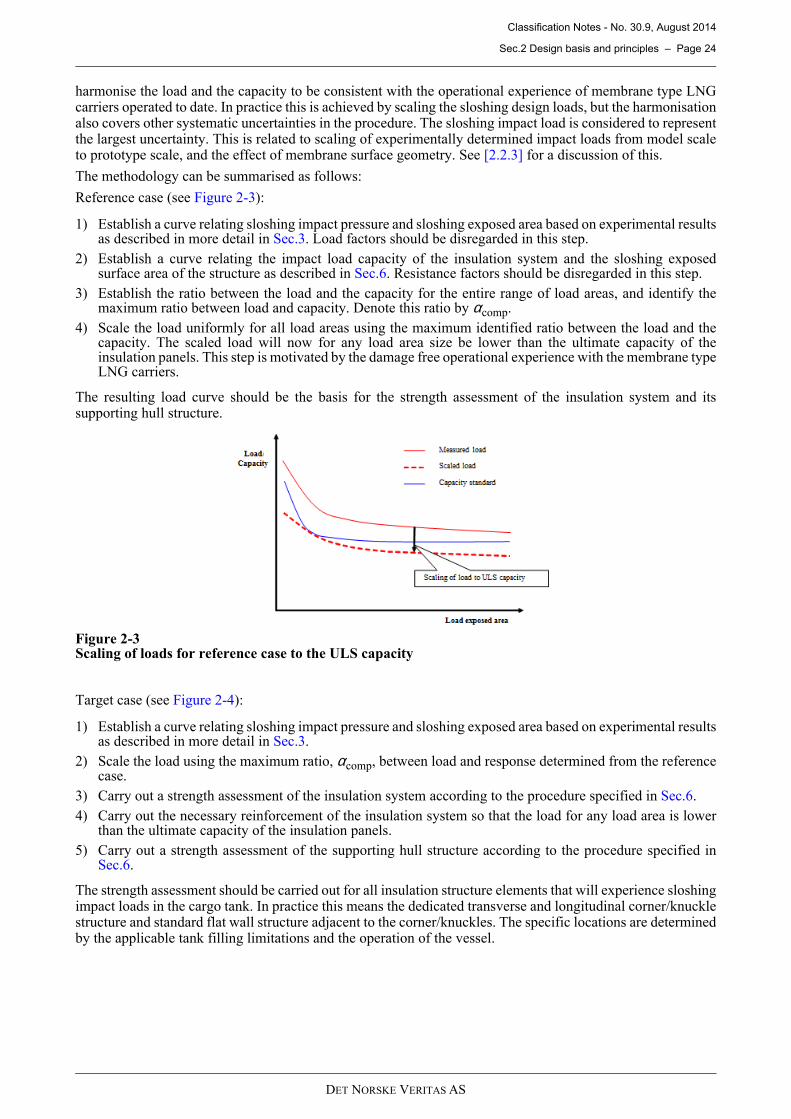
harmonise the load and the capacity to be consistent with the operational experience of membrane type LNGcarriers operated to date. In practice this is achieved by scaling the sloshing design loads, but the harmonisationalso covers other systematic uncertainties in the procedure. The sloshing impact load is considered to representthe largest uncertainty. This is related to scaling of experimentally determined impact loads from model scaleto prototype scale, and the effect of membrane surface geometry. See [2.2.3] for a discussion of this.
The methodology can be summarised as follows:
Reference case (see Figure 2-3 ):
1) Establish a curve relating sloshing impact pressure and sloshing exposed area based on experimental resultsas described in more detail in Sec.3. Load factors should be disregarded in this step.
2) Establish a curve relating the impact load capacity of the insulation system and the sloshing exposedsurface area of the structure as described in Sec.6. Resistance factors should be disregarded in this step.
3) Establish the ratio between the load and the capacity for the entire range of load areas, and identify themaximum ratio between load and capacity. Denote this ratio by αcomp.
4) Scale the load uniformly for all load areas using the maximum identified ratio between the load and thecapacity. The scaled load will now for any load area size be lower than the ultimate capacity of theinsulation panels. This step is motivated by the damage free operational experience with the membrane typeLNG carriers.
The resulting load curve should be the basis for the strength assessment of the insulation system and itssupporting hull structure.
Figure 2-3Scaling of loads for reference case to the ULS capacity
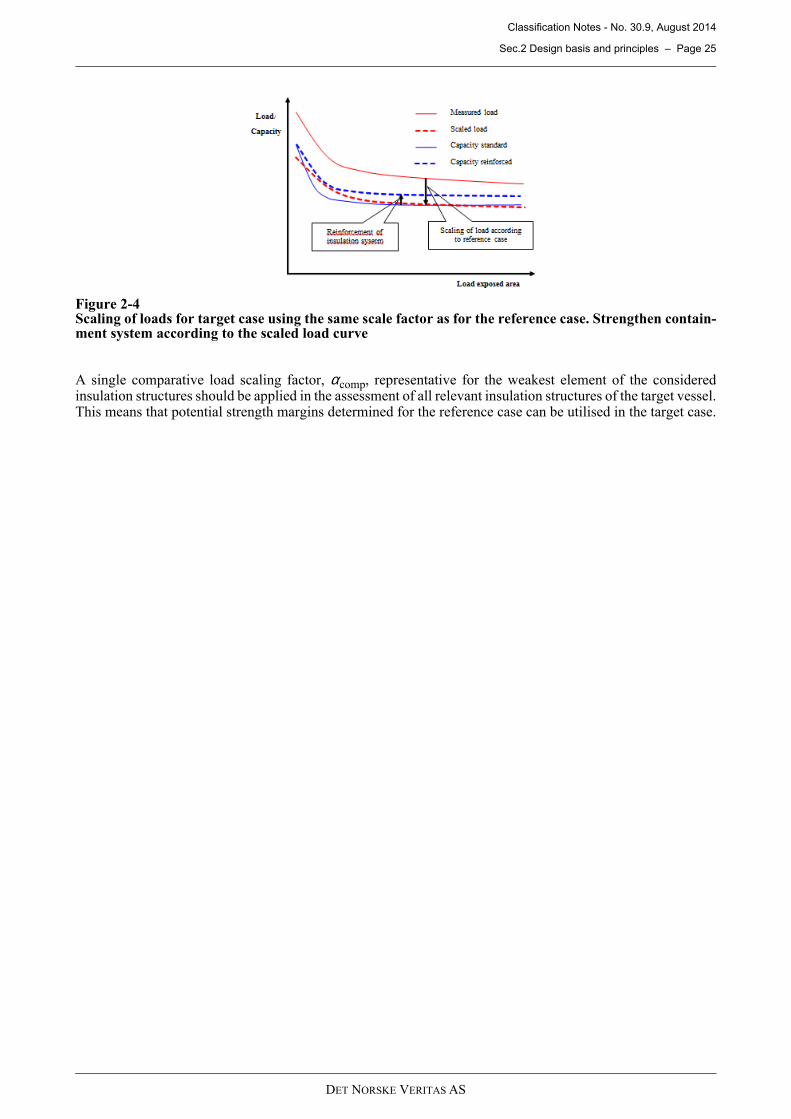
Target case (see Figure 2-4 ):
1) Establish a curve relating sloshing impact pressure and sloshing exposed area based on experimental resultsas described in more detail in Sec.3.
2) Scale the load using the maximum ratio, αcomp, between load and response determined from the referencecase.
3) Carry out a strength assessment of the insulation system according to the procedure specified in Sec.6.
4) Carry out the necessary reinforcement of the insulation system so that the load for any load area is lowerthan the ultimate capacity of the insulation panels.
5) Carry out a strength assessment of the supporting hull structure according to the procedure specified inSec.6.
The strength assessment should be carried out for all insulation structure elements that will experience sloshingimpact loads in the cargo tank. In practice this means the dedicated transverse and longitudinal corner/knucklestructure and standard flat wall structure adjacent to the corner/knuckles. The specific locations are determinedby the applicable tank filling limitations and the operation of the vessel.
Classification Notes - No. 30.9, August 2014
Sec.2 Design basis and principles – Page 25
DET NORSKE VERITAS AS
Figure 2-4Scaling of loads for target case using the same scale factor as for the reference case. Strengthen contain-ment system according to the scaled load curve
A single comparative load scaling factor, αcomp, representative for the weakest element of the consideredinsulation structures should be applied in the assessment of all relevant insulation structures of the target vessel.This means that potential strength margins determined for the reference case can be utilised in the target case.
Classification Notes - No. 30.9, August 2014
Sec.3 Sloshing impact design loads – Page 26
DET NORSKE VERITAS AS
Figure 2-5Overview of the application of the strength assessment methodology
3 Sloshing impact design loads
3.1 Introduction
3.1.1 Background
Use of risk based strength acceptance criteria requires prediction of the probability that the sloshing impact loadwill exceed the structural resistance of the cargo containment system during the intended operation of thevessel. Such predictions generally requires knowledge of the statistical distribution of sloshing impact loadsfor the intended operation of the vessel over its service life considering all expected sea state encounters, waveheading encounters, and tank filling encounters. Such statistical distributions are normally referred to as longterm distributions.
Long term distributions are derived by combination of a number of so called short term statistical distributions.Short term distributions represent the statistical distribution of the sloshing impact load for a specific sea state,
Classification Notes - No. 30.9, August 2014
Sec.3 Sloshing impact design loads – Page 27
DET NORSKE VERITAS AS
wave heading, tank filling, or any other environmental or operational parameter identified to be relevant for theassessment. It is recommended that the short term distributions are derived by statistical analyses of impactpressures recorded during sloshing model experiments. Signal processing and statistical analysis methods aredescribed in [3.2].
Model experiments are conducted by exposing a scale model of the tank to the predicted motions of the vesselfor the considered sea state, heading, and filling conditions. Guidance for environmental and operationalmodelling required both for ship motion analysis and for the long term statistical analyses of the measurementsare given in [3.3]. Ship motion analyses are described in [3.4].
Guidance and recommendations for execution of sloshing model tests are given in [3.5]. Model testing isconsidered to be the only method currently available to reliably predict sloshing induced impact pressures. Themodel test tank must be equipped with suitable impact pressure measurement system that must be connectedto a data acquisition system that can record the impact pressures occurring during the tests.
It follows that model experiments will have to be conducted for a range of different sea state, wave heading,and filling level combinations to be able to determine the long term distribution. Guidance on how to efficientlyexecute the model test program to achieve the best possible accuracy of the long term distribution is given in[3.6].
Sloshing design loads are derived from the long term distribution such that compliance with the strengthacceptance criteria will ensure a suitably low probability that the load will exceed the structural resistance.Guidance on design load assessment is given in [3.7].
[3.8] gives recommendations on how experience, physical insight, together with data analysis to evaluate andimprove the quality of the statistical analyses.
3.2 Statistical analysis
3.2.1 General
The purpose of the statistical analyses described in this section is to derive the long term distribution of sloshingimpact loads for the various structural elements in the tank. The main steps in this process are:
— Processing of impact pressure time series to develop discrete short term statistical distributions.— Processing of measured time signals to produce modified signals representing combinations of the original
signals.— Processing of measured and combined time series to determine the dynamic characteristics of the measured
impacts.— Fit of continuous theoretical statistical distributions to the discrete statistical distributions obtained from
model tests.— Compile long term statistical distributions for the impact pressure considering operational environment and
operational parameters such as wave heading encounter, tank filling encounter, etc.
In addition to the main steps mentioned above, the section provides guidance and recommendations on how tomake the most efficient use of the available test data, and outlines how to improve the quality of the predictionby efficient use of the information contained in the available data.
3.2.2 Long term distribution
The long term exceedance probability function for sloshing impact loads can be determined as follows:
where,
is the exceedance probability function of sloshing impact peak pressure values given sea state i,heading j, and tank filling k
is the weighing factor to account for relative number of impacts in condition i, j, k
is the average impact event rate [impacts/hr] (long term)
is the impact event rate for short term condition i, j, k
probability for sea state range i
probability for relative wave heading j
probability for filling range k
The probabilities to encounter sea state i, heading j, and filling range k, pi, pj, pk, should be assessed based on
( ) ( )∑ ∑ ∑= = =
− ⋅⋅⋅⋅=Fillings
1
Headings
1
States Sea
1 testingFrominput Analysis
k j i
aijkijkijkatermlong pQwppppQ4342143421
( )aijk pQ
E
Ew
ijk
ijk =
E
ijkE
ip
jp
kp
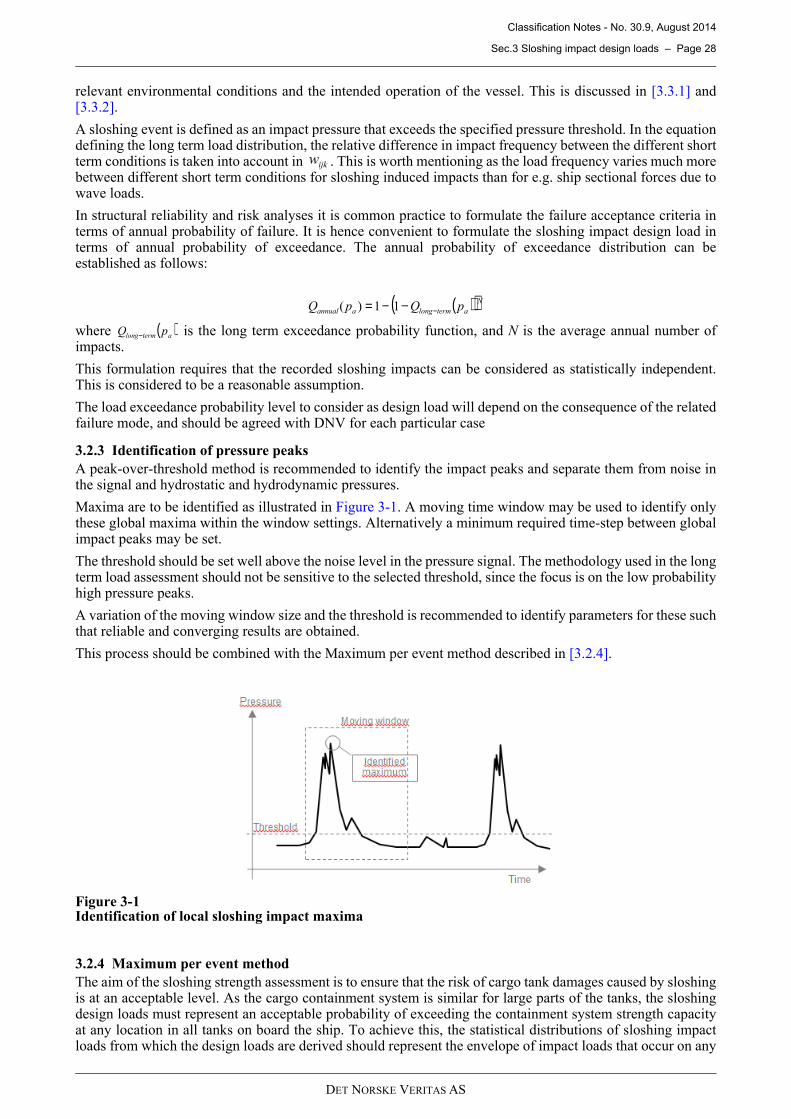
Classification Notes - No. 30.9, August 2014
Sec.3 Sloshing impact design loads – Page 28
DET NORSKE VERITAS AS
relevant environmental conditions and the intended operation of the vessel. This is discussed in [3.3.1] and[3.3.2].
A sloshing event is defined as an impact pressure that exceeds the specified pressure threshold. In the equationdefining the long term load distribution, the relative difference in impact frequency between the different shortterm conditions is taken into account in . This is worth mentioning as the load frequency varies much morebetween different short term conditions for sloshing induced impacts than for e.g. ship sectional forces due towave loads.
In structural reliability and risk analyses it is common practice to formulate the failure acceptance criteria interms of annual probability of failure. It is hence convenient to formulate the sloshing impact design load interms of annual probability of exceedance. The annual probability of exceedance distribution can beestablished as follows:
where is the long term exceedance probability function, and N is the average annual number ofimpacts.
This formulation requires that the recorded sloshing impacts can be considered as statistically independent.This is considered to be a reasonable assumption.
The load exceedance probability level to consider as design load will depend on the consequence of the relatedfailure mode, and should be agreed with DNV for each particular case
3.2.3 Identification of pressure peaks
A peak-over-threshold method is recommended to identify the impact peaks and separate them from noise inthe signal and hydrostatic and hydrodynamic pressures.
Maxima are to be identified as illustrated in Figure 3-1 . A moving time window may be used to identify onlythese global maxima within the window settings. Alternatively a minimum required time-step between globalimpact peaks may be set.
The threshold should be set well above the noise level in the pressure signal. The methodology used in the longterm load assessment should not be sensitive to the selected threshold, since the focus is on the low probabilityhigh pressure peaks.
A variation of the moving window size and the threshold is recommended to identify parameters for these suchthat reliable and converging results are obtained.
This process should be combined with the Maximum per event method described in [3.2.4].
Figure 3-1Identification of local sloshing impact maxima
3.2.4 Maximum per event method
The aim of the sloshing strength assessment is to ensure that the risk of cargo tank damages caused by sloshingis at an acceptable level. As the cargo containment system is similar for large parts of the tanks, the sloshingdesign loads must represent an acceptable probability of exceeding the containment system strength capacityat any location in all tanks on board the ship. To achieve this, the statistical distributions of sloshing impactloads from which the design loads are derived should represent the envelope of impact loads that occur on any
ijkw
( )( )N
atermlongaannual pQpQ −−−= 11)(
( )atermlong pQ −
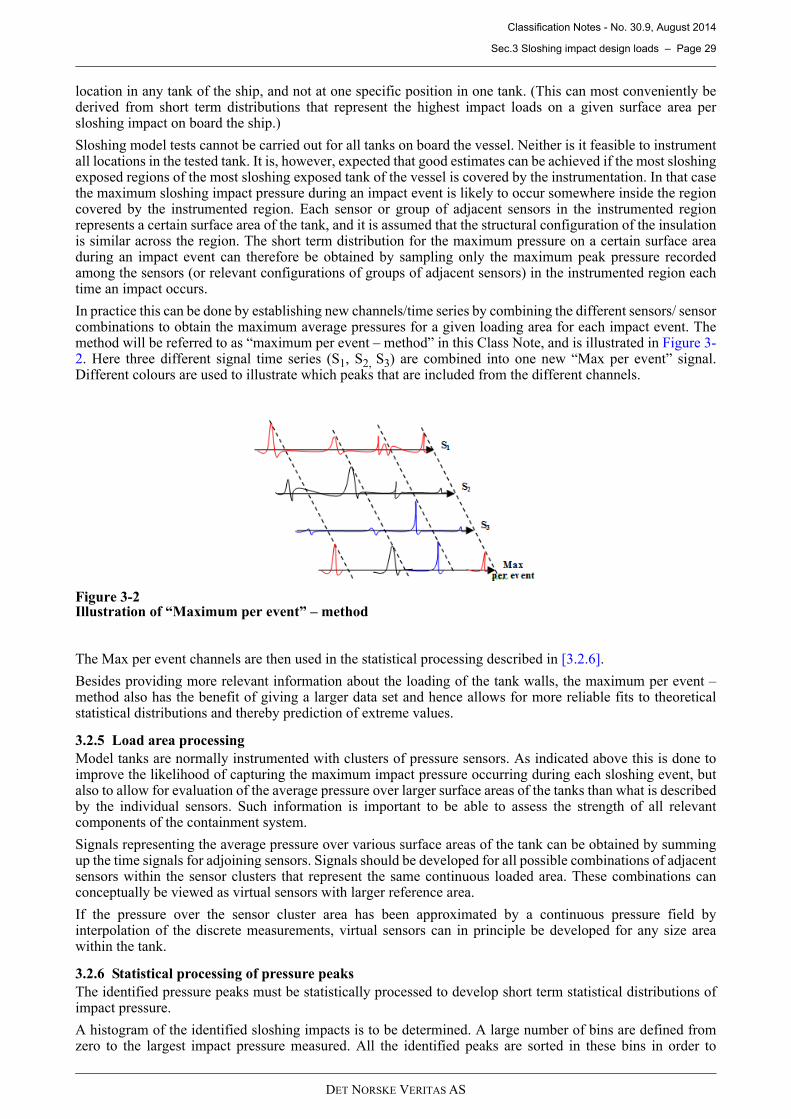
Classification Notes - No. 30.9, August 2014
Sec.3 Sloshing impact design loads – Page 29
DET NORSKE VERITAS AS
location in any tank of the ship, and not at one specific position in one tank. (This can most conveniently bederived from short term distributions that represent the highest impact loads on a given surface area persloshing impact on board the ship.)
Sloshing model tests cannot be carried out for all tanks on board the vessel. Neither is it feasible to instrumentall locations in the tested tank. It is, however, expected that good estimates can be achieved if the most sloshingexposed regions of the most sloshing exposed tank of the vessel is covered by the instrumentation. In that casethe maximum sloshing impact pressure during an impact event is likely to occur somewhere inside the regioncovered by the instrumented region. Each sensor or group of adjacent sensors in the instrumented regionrepresents a certain surface area of the tank, and it is assumed that the structural configuration of the insulationis similar across the region. The short term distribution for the maximum pressure on a certain surface areaduring an impact event can therefore be obtained by sampling only the maximum peak pressure recordedamong the sensors (or relevant configurations of groups of adjacent sensors) in the instrumented region eachtime an impact occurs.
In practice this can be done by establishing new channels/time series by combining the different sensors/ sensorcombinations to obtain the maximum average pressures for a given loading area for each impact event. Themethod will be referred to as “maximum per event – method” in this Class Note, and is illustrated in Figure 3-2 . Here three different signal time series (S1, S2, S3) are combined into one new “Max per event” signal.Different colours are used to illustrate which peaks that are included from the different channels.
Figure 3-2Illustration of “Maximum per event” – method
The Max per event channels are then used in the statistical processing described in [3.2.6].
Besides providing more relevant information about the loading of the tank walls, the maximum per event –method also has the benefit of giving a larger data set and hence allows for more reliable fits to theoreticalstatistical distributions and thereby prediction of extreme values.
3.2.5 Load area processing
Model tanks are normally instrumented with clusters of pressure sensors. As indicated above this is done toimprove the likelihood of capturing the maximum impact pressure occurring during each sloshing event, butalso to allow for evaluation of the average pressure over larger surface areas of the tanks than what is describedby the individual sensors. Such information is important to be able to assess the strength of all relevantcomponents of the containment system.
Signals representing the average pressure over various surface areas of the tank can be obtained by summingup the time signals for adjoining sensors. Signals should be developed for all possible combinations of adjacentsensors within the sensor clusters that represent the same continuous loaded area. These combinations canconceptually be viewed as virtual sensors with larger reference area.
If the pressure over the sensor cluster area has been approximated by a continuous pressure field byinterpolation of the discrete measurements, virtual sensors can in principle be developed for any size areawithin the tank.
3.2.6 Statistical processing of pressure peaks
The identified pressure peaks must be statistically processed to develop short term statistical distributions ofimpact pressure.
A histogram of the identified sloshing impacts is to be determined. A large number of bins are defined fromzero to the largest impact pressure measured. All the identified peaks are sorted in these bins in order to
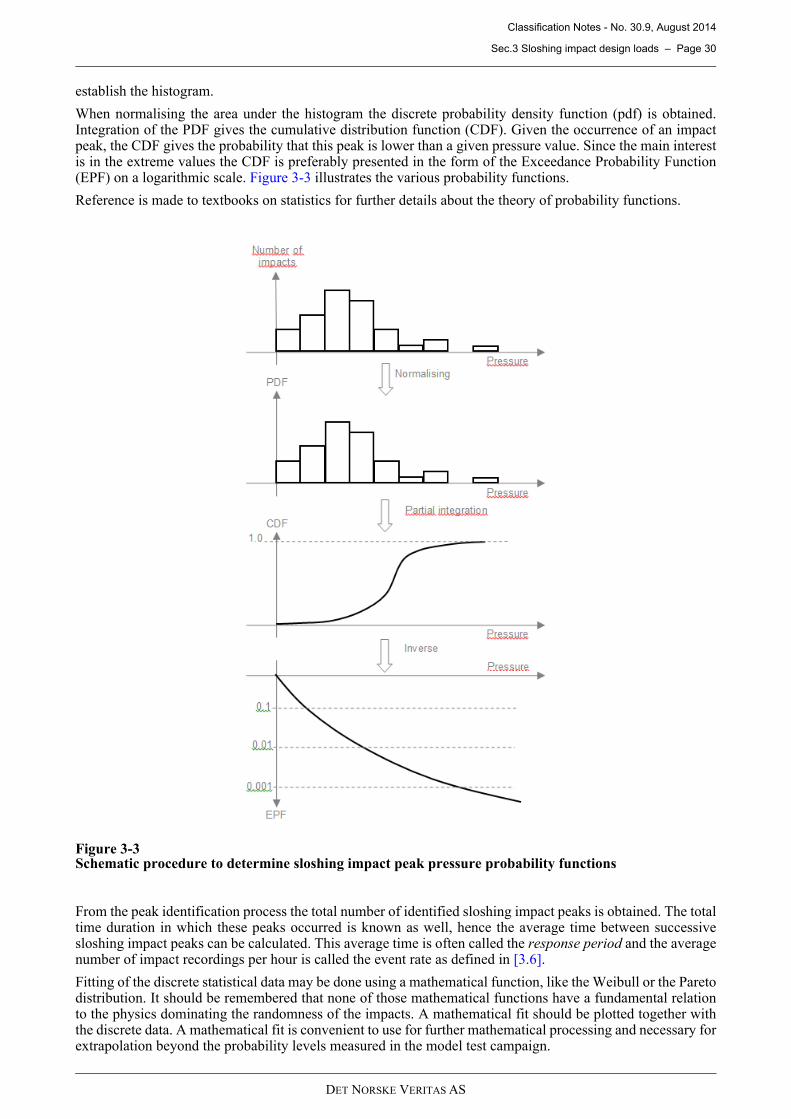
Classification Notes - No. 30.9, August 2014
Sec.3 Sloshing impact design loads – Page 30
DET NORSKE VERITAS AS
establish the histogram.
When normalising the area under the histogram the discrete probability density function (pdf) is obtained.Integration of the PDF gives the cumulative distribution function (CDF). Given the occurrence of an impactpeak, the CDF gives the probability that this peak is lower than a given pressure value. Since the main interestis in the extreme values the CDF is preferably presented in the form of the Exceedance Probability Function(EPF) on a logarithmic scale. Figure 3-3 illustrates the various probability functions.
Reference is made to textbooks on statistics for further details about the theory of probability functions.
Figure 3-3Schematic procedure to determine sloshing impact peak pressure probability functions
From the peak identification process the total number of identified sloshing impact peaks is obtained. The totaltime duration in which these peaks occurred is known as well, hence the average time between successivesloshing impact peaks can be calculated. This average time is often called the response period and the averagenumber of impact recordings per hour is called the event rate as defined in [3.6].
Fitting of the discrete statistical data may be done using a mathematical function, like the Weibull or the Paretodistribution. It should be remembered that none of those mathematical functions have a fundamental relationto the physics dominating the randomness of the impacts. A mathematical fit should be plotted together withthe discrete data. A mathematical fit is convenient to use for further mathematical processing and necessary forextrapolation beyond the probability levels measured in the model test campaign.
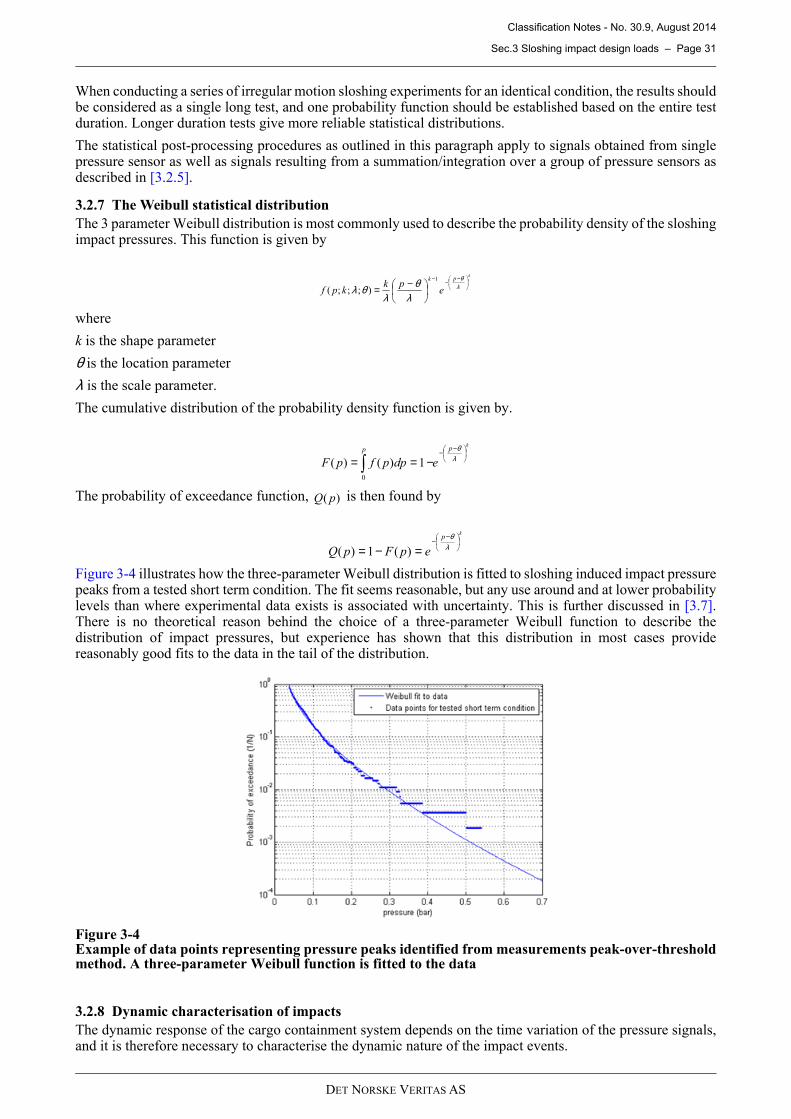
Classification Notes - No. 30.9, August 2014
Sec.3 Sloshing impact design loads – Page 31
DET NORSKE VERITAS AS
When conducting a series of irregular motion sloshing experiments for an identical condition, the results shouldbe considered as a single long test, and one probability function should be established based on the entire testduration. Longer duration tests give more reliable statistical distributions.
The statistical post-processing procedures as outlined in this paragraph apply to signals obtained from singlepressure sensor as well as signals resulting from a summation/integration over a group of pressure sensors asdescribed in [3.2.5].
3.2.7 The Weibull statistical distribution
The 3 parameter Weibull distribution is most commonly used to describe the probability density of the sloshingimpact pressures. This function is given by
where
k is the shape parameter
θ is the location parameter
λ is the scale parameter.
The cumulative distribution of the probability density function is given by.
The probability of exceedance function, is then found by
Figure 3-4 illustrates how the three-parameter Weibull distribution is fitted to sloshing induced impact pressurepeaks from a tested short term condition. The fit seems reasonable, but any use around and at lower probabilitylevels than where experimental data exists is associated with uncertainty. This is further discussed in [3.7].There is no theoretical reason behind the choice of a three-parameter Weibull function to describe thedistribution of impact pressures, but experience has shown that this distribution in most cases providereasonably good fits to the data in the tail of the distribution.
Figure 3-4Example of data points representing pressure peaks identified from measurements peak-over-thresholdmethod. A three-parameter Weibull function is fitted to the data
3.2.8 Dynamic characterisation of impacts
The dynamic response of the cargo containment system depends on the time variation of the pressure signals,and it is therefore necessary to characterise the dynamic nature of the impact events.
kpk
epk
kpf
−−−
−= λθ
λθ
λθλ
1
);;;(
kpp
edppfpF
−−
∫ −== λθ
0
1)()(
)( pQ
kp
epFpQ
−−
=−= λθ
)(1)(
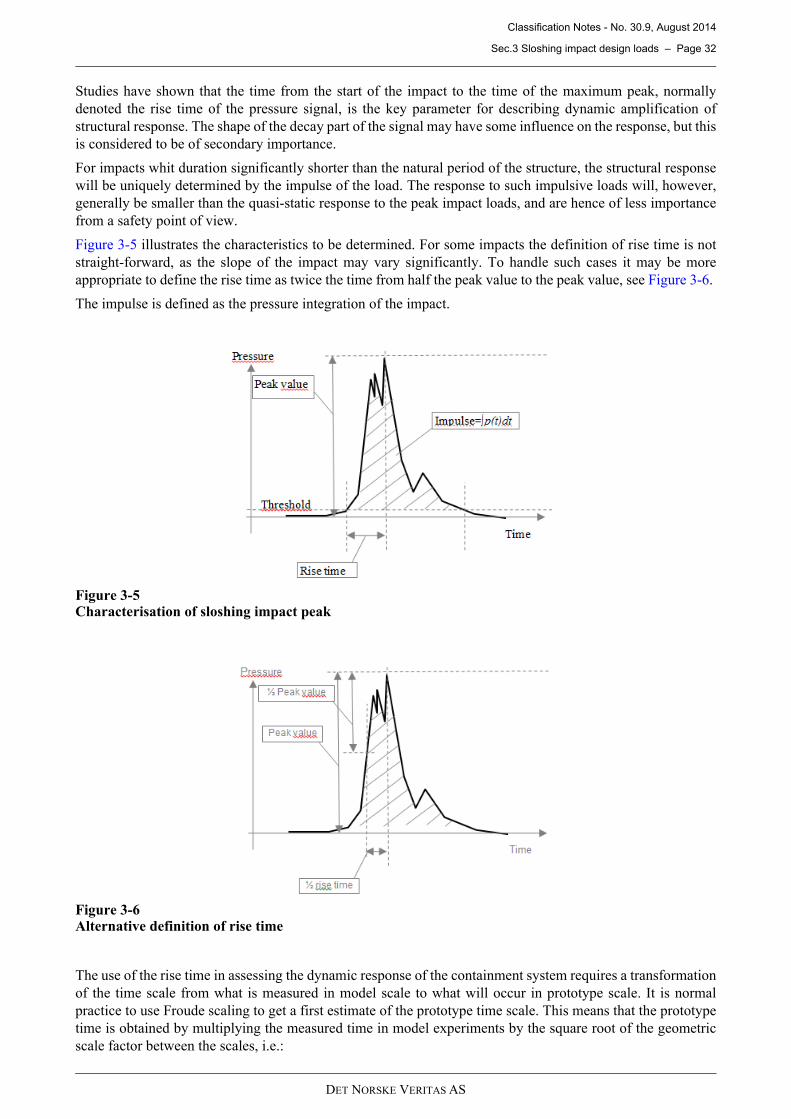
Classification Notes - No. 30.9, August 2014
Sec.3 Sloshing impact design loads – Page 32
DET NORSKE VERITAS AS
Studies have shown that the time from the start of the impact to the time of the maximum peak, normally
denoted the rise time of the pressure signal, is the key parameter for describing dynamic amplification of
structural response. The shape of the decay part of the signal may have some influence on the response, but this
is considered to be of secondary importance.
For impacts whit duration significantly shorter than the natural period of the structure, the structural response
will be uniquely determined by the impulse of the load. The response to such impulsive loads will, however,
generally be smaller than the quasi-static response to the peak impact loads, and are hence of less importance
from a safety point of view.
Figure 3-5 illustrates the characteristics to be determined. For some impacts the definition of rise time is not
straight-forward, as the slope of the impact may vary significantly. To handle such cases it may be more
appropriate to define the rise time as twice the time from half the peak value to the peak value, see Figure 3-6 .
The impulse is defined as the pressure integration of the impact.
Figure 3-5Characterisation of sloshing impact peak
Figure 3-6Alternative definition of rise time
The use of the rise time in assessing the dynamic response of the containment system requires a transformation
of the time scale from what is measured in model scale to what will occur in prototype scale. It is normal
practice to use Froude scaling to get a first estimate of the prototype time scale. This means that the prototype
time is obtained by multiplying the measured time in model experiments by the square root of the geometric
scale factor between the scales, i.e.:

Classification Notes - No. 30.9, August 2014
Sec.3 Sloshing impact design loads – Page 33
DET NORSKE VERITAS AS
α is the geometric scale factor between prototype and model:
Because of lack of full physical similarity of impacts between model test and prototype, as discussed in Sec.2[2.2.3], Froude scaling of the rise times measured in model scale may not be fully accurate. Rise times are henceassociated with some uncertainty, and some conservativeness is recommended when using the model testresults to assess structural dynamic effects.
It is recommended to treat the rise times in a statistical manner. Ideally, joint probability distribution of risetimes and impact pressures should be made to identify the rise time for the most likely largest impact pressure.Due to the previously discussed uncertainties in the model scale rise times it is however acceptable to do it ina more simplified manner, with main focus on the sensitivity. The procedure is outlined in the following.
Rise times from all the tests are sorted in bins and plotted as a histogram. Figure 3-7 illustrates the results ofsuch processing for three different situations depending on the choice of pressure threshold used in the signalprocessing. The first figure illustrates the probability density function if all the measured impacts are includedin the probability distribution. This gives a broad distribution, with a large scatter in the observed rise times.As the pressure threshold is increased the probability density function gets narrower and more peaked asillustrated in the two next figures. The variability in rise time among the highest recorded events is lower thanfor the entire population.
The high pressure design sloshing event has a low probability of occurrence, and is not likely to be representedamong the events recorded in the experiments. It is nevertheless reasonable to assume that the characteristicsof the design event are better represented by the events with the highest recorded pressures than with the entirepopulation. It is therefore recommended that the “design” rise time is determined from the peak value of adistribution determined using a high threshold. A reasonable threshold value should be determined based on aparametric study. It is important to ensure that the number of impact events included in the sample remainssufficient to get a reasonable estimate of the distribution.
It is important to look at the sensitivity in the choice of rise time and the related dynamic response of the containmentsystem. This is both related to the uncertainty in the scaling of the rise time as discussed above, but also related tothe variability in the measured rise time. The dynamic structural response should therefore be calculated at least onestandard deviation lower and higher than the peak value. The highest DAF should be chosen for design.
α⋅= elprototype tt mod , where
el
prototype
l
l
mod
=α
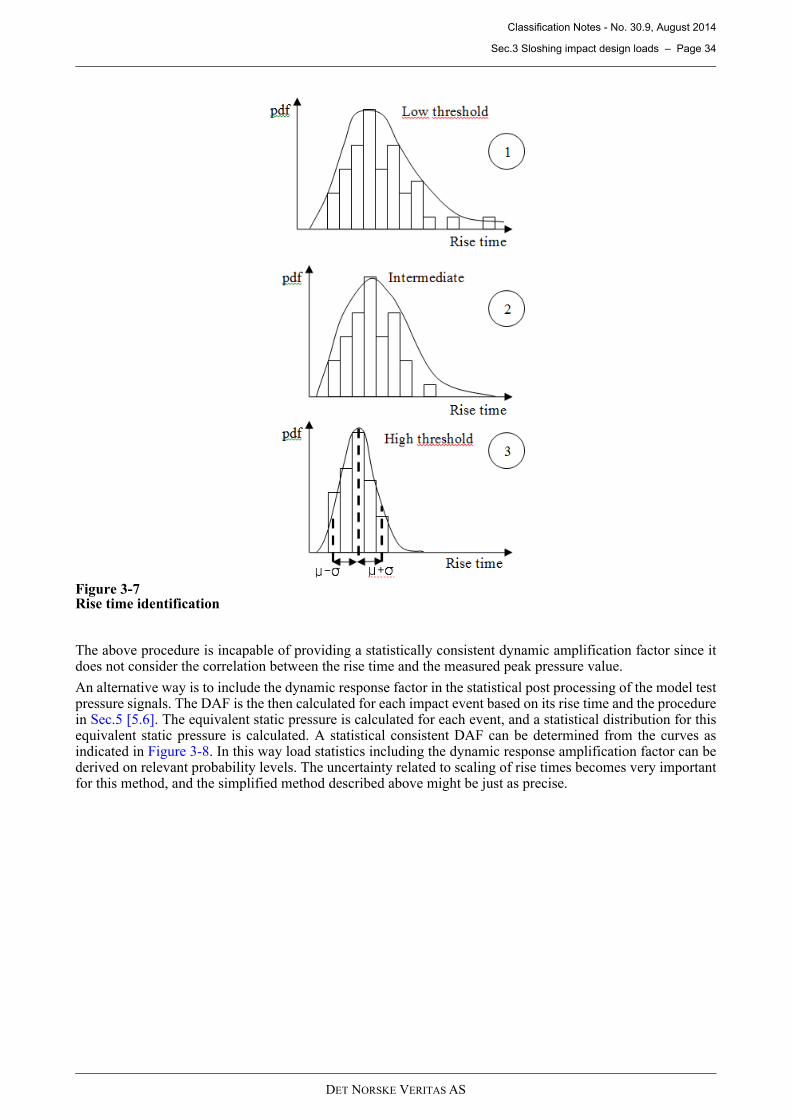
Classification Notes - No. 30.9, August 2014
Sec.3 Sloshing impact design loads – Page 34
DET NORSKE VERITAS AS
Figure 3-7Rise time identification
The above procedure is incapable of providing a statistically consistent dynamic amplification factor since itdoes not consider the correlation between the rise time and the measured peak pressure value.
An alternative way is to include the dynamic response factor in the statistical post processing of the model testpressure signals. The DAF is the then calculated for each impact event based on its rise time and the procedurein Sec.5 [5.6]. The equivalent static pressure is calculated for each event, and a statistical distribution for thisequivalent static pressure is calculated. A statistical consistent DAF can be determined from the curves asindicated in Figure 3-8. In this way load statistics including the dynamic response amplification factor can bederived on relevant probability levels. The uncertainty related to scaling of rise times becomes very importantfor this method, and the simplified method described above might be just as precise.
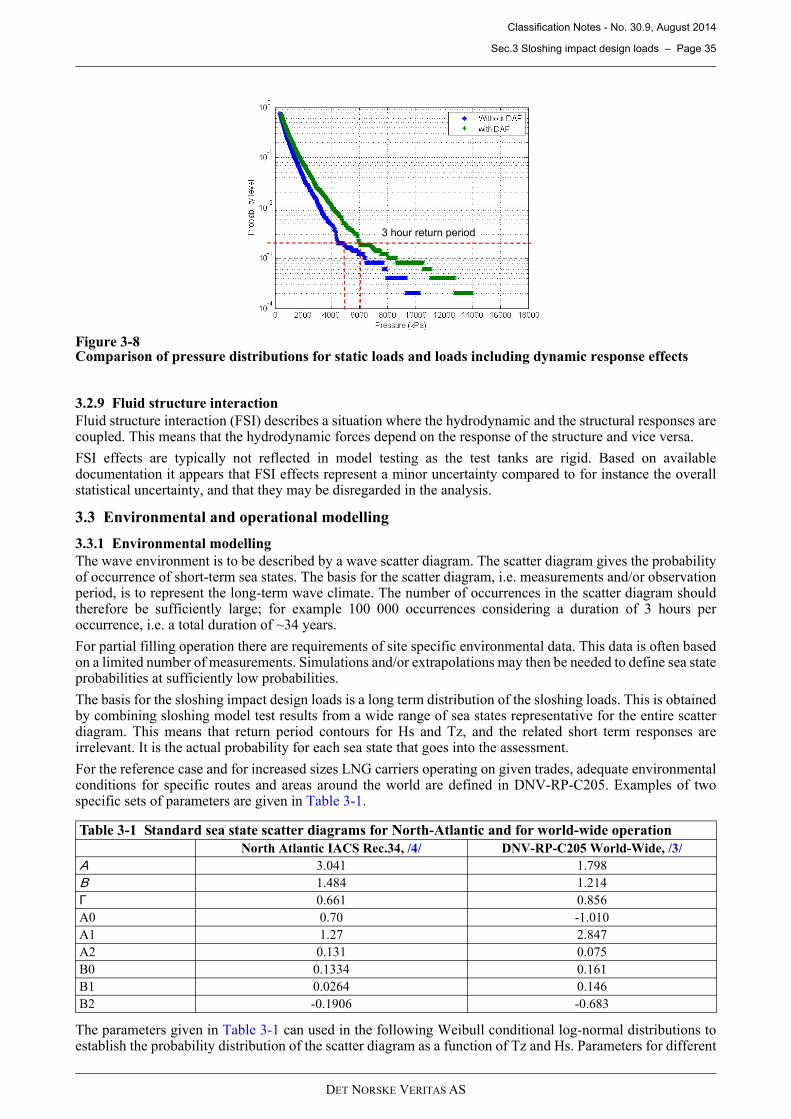
Classification Notes - No. 30.9, August 2014
Sec.3 Sloshing impact design loads – Page 35
DET NORSKE VERITAS AS
Figure 3-8Comparison of pressure distributions for static loads and loads including dynamic response effects
3.2.9 Fluid structure interaction
Fluid structure interaction (FSI) describes a situation where the hydrodynamic and the structural responses arecoupled. This means that the hydrodynamic forces depend on the response of the structure and vice versa.
FSI effects are typically not reflected in model testing as the test tanks are rigid. Based on availabledocumentation it appears that FSI effects represent a minor uncertainty compared to for instance the overallstatistical uncertainty, and that they may be disregarded in the analysis.
3.3 Environmental and operational modelling
3.3.1 Environmental modelling
The wave environment is to be described by a wave scatter diagram. The scatter diagram gives the probabilityof occurrence of short-term sea states. The basis for the scatter diagram, i.e. measurements and/or observationperiod, is to represent the long-term wave climate. The number of occurrences in the scatter diagram shouldtherefore be sufficiently large; for example 100 000 occurrences considering a duration of 3 hours peroccurrence, i.e. a total duration of ~34 years.
For partial filling operation there are requirements of site specific environmental data. This data is often basedon a limited number of measurements. Simulations and/or extrapolations may then be needed to define sea stateprobabilities at sufficiently low probabilities.
The basis for the sloshing impact design loads is a long term distribution of the sloshing loads. This is obtainedby combining sloshing model test results from a wide range of sea states representative for the entire scatterdiagram. This means that return period contours for Hs and Tz, and the related short term responses areirrelevant. It is the actual probability for each sea state that goes into the assessment.
For the reference case and for increased sizes LNG carriers operating on given trades, adequate environmentalconditions for specific routes and areas around the world are defined in DNV-RP-C205. Examples of twospecific sets of parameters are given in Table 3-1.
The parameters given in Table 3-1 can used in the following Weibull conditional log-normal distributions toestablish the probability distribution of the scatter diagram as a function of Tz and Hs. Parameters for different
Table 3-1 Standard sea state scatter diagrams for North-Atlantic and for world-wide operation
North Atlantic IACS Rec.34, /4/ DNV-RP-C205 World-Wide, /3/
Α 3.041 1.798
Β 1.484 1.214
Γ 0.661 0.856
A0 0.70 -1.010
A1 1.27 2.847
A2 0.131 0.075
B0 0.1334 0.161
B1 0.0264 0.146
B2 -0.1906 -0.683
3 hour return period
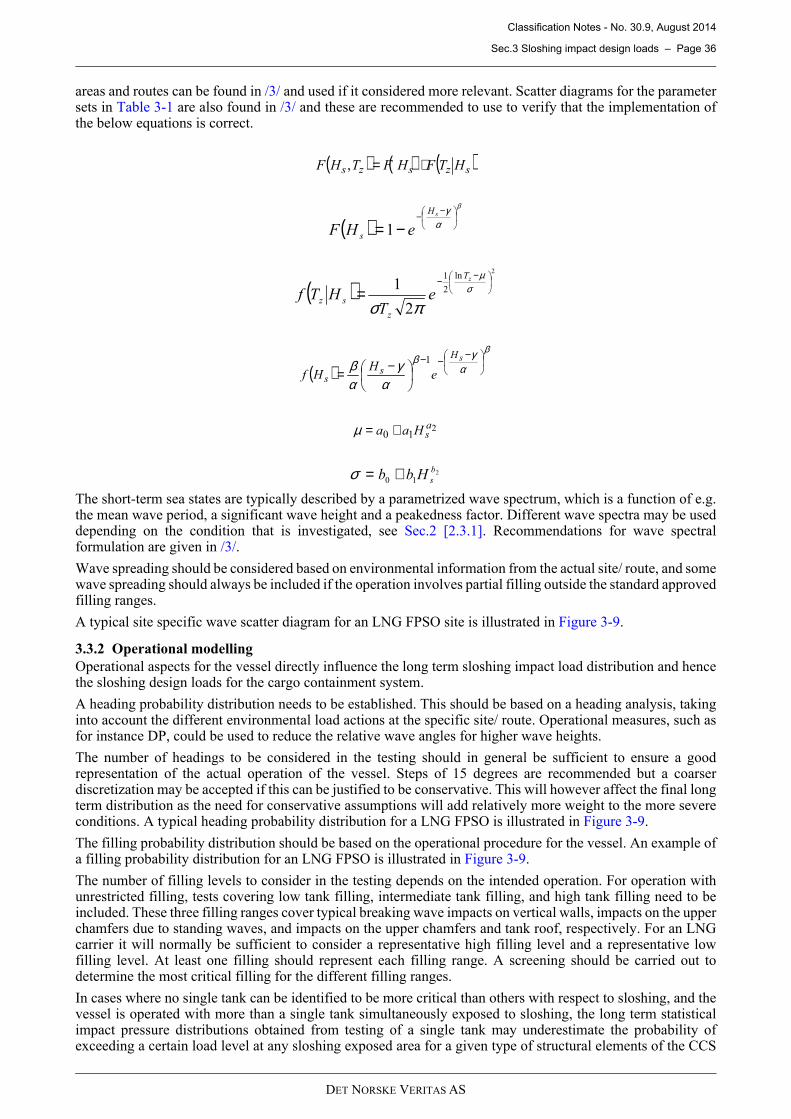
Classification Notes - No. 30.9, August 2014
Sec.3 Sloshing impact design loads – Page 36
DET NORSKE VERITAS AS
areas and routes can be found in /3/ and used if it considered more relevant. Scatter diagrams for the parametersets in Table 3-1 are also found in /3/ and these are recommended to use to verify that the implementation ofthe below equations is correct.
The short-term sea states are typically described by a parametrized wave spectrum, which is a function of e.g.the mean wave period, a significant wave height and a peakedness factor. Different wave spectra may be useddepending on the condition that is investigated, see Sec.2 [2.3.1]. Recommendations for wave spectralformulation are given in /3/.
Wave spreading should be considered based on environmental information from the actual site/ route, and somewave spreading should always be included if the operation involves partial filling outside the standard approvedfilling ranges.
A typical site specific wave scatter diagram for an LNG FPSO site is illustrated in Figure 3-9 .
3.3.2 Operational modelling
Operational aspects for the vessel directly influence the long term sloshing impact load distribution and hencethe sloshing design loads for the cargo containment system.
A heading probability distribution needs to be established. This should be based on a heading analysis, takinginto account the different environmental load actions at the specific site/ route. Operational measures, such asfor instance DP, could be used to reduce the relative wave angles for higher wave heights.
The number of headings to be considered in the testing should in general be sufficient to ensure a goodrepresentation of the actual operation of the vessel. Steps of 15 degrees are recommended but a coarserdiscretization may be accepted if this can be justified to be conservative. This will however affect the final longterm distribution as the need for conservative assumptions will add relatively more weight to the more severeconditions. A typical heading probability distribution for a LNG FPSO is illustrated in Figure 3-9.
The filling probability distribution should be based on the operational procedure for the vessel. An example ofa filling probability distribution for an LNG FPSO is illustrated in Figure 3-9.
The number of filling levels to consider in the testing depends on the intended operation. For operation withunrestricted filling, tests covering low tank filling, intermediate tank filling, and high tank filling need to beincluded. These three filling ranges cover typical breaking wave impacts on vertical walls, impacts on the upperchamfers due to standing waves, and impacts on the upper chamfers and tank roof, respectively. For an LNGcarrier it will normally be sufficient to consider a representative high filling level and a representative lowfilling level. At least one filling should represent each filling range. A screening should be carried out todetermine the most critical filling for the different filling ranges.
In cases where no single tank can be identified to be more critical than others with respect to sloshing, and thevessel is operated with more than a single tank simultaneously exposed to sloshing, the long term statisticalimpact pressure distributions obtained from testing of a single tank may underestimate the probability ofexceeding a certain load level at any sloshing exposed area for a given type of structural elements of the CCS
( ) ( ) ( )szszs HTFHFTHF ⋅=,
( )β
αγ
−−
−=sH
s eHF 1
( )2
ln
2
1
2
1
−−
= σµ
πσ
zT
z
sz eT
HTf
( )β
αγβ
αγ
αβ
−−−
−=sH
ss e
HHf
1
210
asHaa +=µ
2
10
b
sHbb +=σ
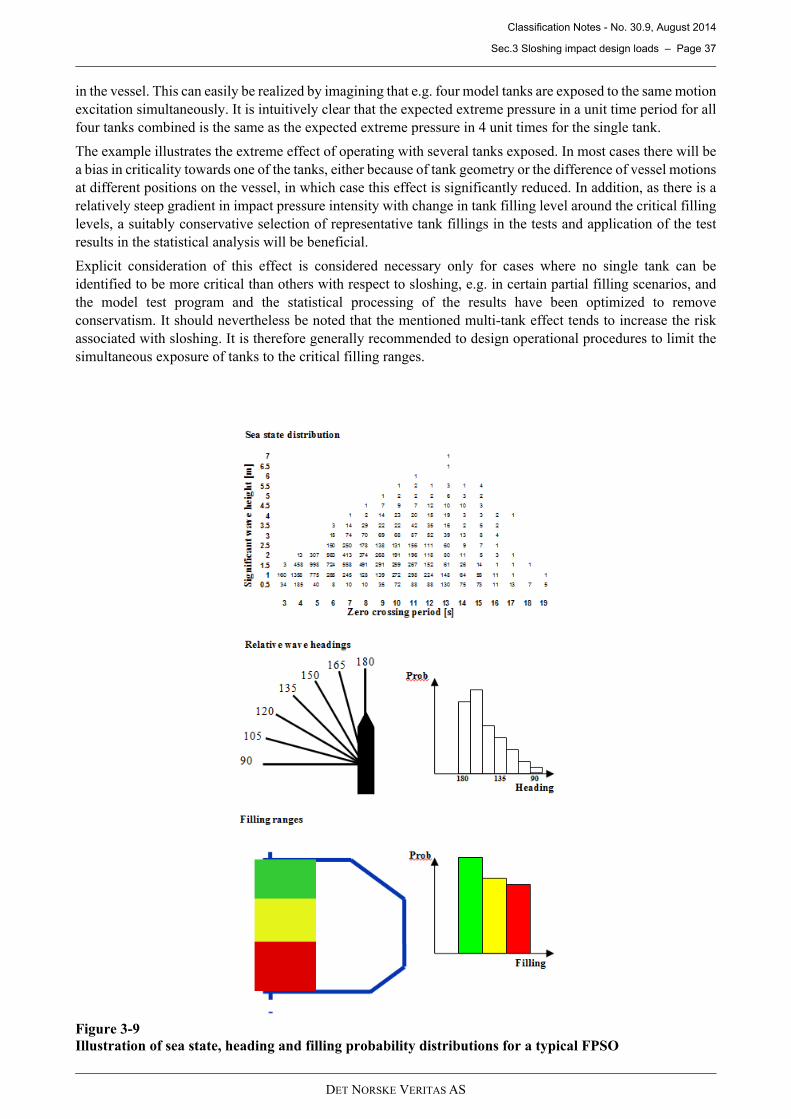
Classification Notes - No. 30.9, August 2014
Sec.3 Sloshing impact design loads – Page 37
DET NORSKE VERITAS AS
in the vessel. This can easily be realized by imagining that e.g. four model tanks are exposed to the same motion
excitation simultaneously. It is intuitively clear that the expected extreme pressure in a unit time period for all
four tanks combined is the same as the expected extreme pressure in 4 unit times for the single tank.
The example illustrates the extreme effect of operating with several tanks exposed. In most cases there will be
a bias in criticality towards one of the tanks, either because of tank geometry or the difference of vessel motions
at different positions on the vessel, in which case this effect is significantly reduced. In addition, as there is a
relatively steep gradient in impact pressure intensity with change in tank filling level around the critical filling
levels, a suitably conservative selection of representative tank fillings in the tests and application of the test
results in the statistical analysis will be beneficial.
Explicit consideration of this effect is considered necessary only for cases where no single tank can be
identified to be more critical than others with respect to sloshing, e.g. in certain partial filling scenarios, and
the model test program and the statistical processing of the results have been optimized to remove
conservatism. It should nevertheless be noted that the mentioned multi-tank effect tends to increase the risk
associated with sloshing. It is therefore generally recommended to design operational procedures to limit the
simultaneous exposure of tanks to the critical filling ranges.
Figure 3-9
Illustration of sea state, heading and filling probability distributions for a typical FPSO
Classification Notes - No. 30.9, August 2014
Sec.3 Sloshing impact design loads – Page 38
DET NORSKE VERITAS AS
3.3.3 Operational restrictions
In some situations it may be necessary to introduce operational restrictions to achieve compliance with the riskacceptance criteria discussed in Sec.2 [2.2.2]. This will normally imply that operation with certain critical tankfilling ranges is restricted to occur only within specified limits. This can typically be an upper wave heightlimit, potentially combined with wave heading limits if heading control systems are in place. Wave periods canalso be a relevant operational parameter, provided that the periodicity of the waves is sufficiently far away fromthe sloshing resonance periods of the tanks. This could e.g. be relevant for short period wind generated sea andvery long period swell.
Operational restrictions may be accounted for in the development of the long term sloshing impact loaddistribution by disregarding the short term operational situations that fall outside the operational limits. Theprobability of occurrence of the disregarded situations must generally be reassigned to situations within theoperational envelope.
The use of operational restrictions introduces the possibility of accidental situations where the operationalrestrictions cannot be adhered to. Relevant accidental situations should be identified by risk analyses, andshould be taken into account in the sloshing assessment as described in Sec.2 [2.2.1] and Sec.2 [2.3.4.2].
3.4 Ship motion calculation for sloshing tests
The motions for a sloshing test are to be determined by a dedicated ship motion analysis using a verified andvalidated computer code recognized by the Class Society. The analyses are to provide linear ship motiontransfer functions, which can be used to generate tank motions for specified short-term sea states.
The ship motion calculations are to be conducted for the loading condition and speed specified for theassociated sloshing test.
In head and near head waves the surge motion is an important motion or excitation mode for sloshing. The surgemotion equation is to be modelled properly in the code. It is therefore recommended to use a ship motionprogram based on a 3-dimensional boundary element method.
In quartering and beam seas the roll motion is an important motion or excitation mode for sloshing. Rolldamping additional to the potential damping is to be accounted for in the roll motion prediction. The effects ofbilge keels, fins, skegs, etc. and their possible speed dependence are to be included. This inclusion can be doneusing linearization techniques. This linearization may be done for varying sea state severities.
The coupled motion effect due to partially filled tanks may be included in the motion predictions. In case of avessel moored side-by-side with another vessel the hydrodynamic interaction is to be taken into account in themotion predictions. A verification of the implementation of the coupling effect in the ship motion programneeds to be documented as the results are highly sensitive to the phasing between the coupling effect and theordinary ship motions.
Irregular time series of the ship in a seaway are to be calculated by combining a specified wave spectrum withthe motion transfer functions. The calculated motions are to be calculated for the motion reference point of thesloshing rig. The motions are to be Froude-scaled for input to the sloshing rig.
Repetition of irregular motion sequences of the tank during the test program are to be avoided. This can beachieved by using an inverse Fourier approach using a very small frequency step size, i.e. a large number offrequency components. Alternatively, the irregular time series can be composed by a linear superposition ofharmonic components with un-equidistant frequency step sizes.
3.5 Sloshing model experiments
3.5.1 Sloshing experimental lay-out
Sloshing model experiments are to be carried out in a laboratory environment with the necessary safetyfacilities and complying with the applicable safety regulations.
Sloshing experiments require a motion platform capable or simulating the motions of the tank on-board a shipin a seaway. The motion platform should be able to simulate both regular and irregular motions as specified bytime series from a ship motion analysis.
The maximum strokes and angles for the motion platform are to be designed such that the most extreme shipmotions anticipated for the intended sloshing tank model size can be simulated. It is recommended not todimension the rig capabilities only by regular maximum expected motion amplitudes. Especially in beam seaconditions, the combination of large heave, large sway and large roll angles is expected to define the capabilityenvelope for the rig.
The motion control needs to be designed such that the specified ship motions can accurately be simulated. Themotion platform, loaded with its maximum payload, is to be equipped with a motion response unit to verify if
Classification Notes - No. 30.9, August 2014
Sec.3 Sloshing impact design loads – Page 39
DET NORSKE VERITAS AS
the generated tank motions correspond with the input motion signals.
The capacity of the motion platform should be sufficient to accurately represent both the motion amplitudesand the phasing between motions of the tank. The tank should be as large as possible and at least at a scale of1:50.
A six-degree of freedom motion platform is to be used.
The sloshing model tank is to be made sufficiently stiff such that natural frequencies of the tank and its partsdo not interfere with the sloshing impact pressures.
It is recommended to manufacture the sloshing model test tank of transparent material such that the behaviourof the fluid motions in the tank can be observed.
The sloshing model tank is to be prepared for the mounting of pressure sensors, single and cluster-wise, atvarious locations throughout the tank in order to be able to measure sloshing pressures at possible critical areas.The local structure of the tank in areas where pressure transducers are positioned are to be sufficiently stiff toavoid fluid-structure interaction effects.
The sloshing model test tank should be equipped with filling and emptying taps, such that level adjustmentsare made easily and accurately. At high filling (~95% of tank height) significant differences in impact pressurescan be measured for small filling differences. Consequently, the accuracy of the filling level is an importantaspect.
In case sloshing tests are to be conducted with varying ullage gas conditions the sloshing model tank structureshould be designed for depressurisation. The sloshing model tank should be prepared with taps for gas fillingand emptying.
When using different gases or fluids to vary the ullage or fluid conditions inside the tank, preparations must bemade to contain the gases or fluids after testing to comply with environmental regulations if applicable.
3.5.2 Instrumentation and data acquisition
Pressure transducers are to be mounted to measure the fluid pressures inside the tank. The sensing area shouldbe positioned flush with the inner tank wall.
The shock resistance of pressure sensors should be sufficient not to interfere with the impacts and accelerationsexpected.
The pressure sensors should be applicable in a wet and/or corrosive environment.
The rated pressures and the maximum measurable pressure should be sufficiently above the expected pressures,which will be measured inside the tank.
The frequency response of the pressure sensor and signal amplifier must be sufficiently high to capture thepressure fluctuations at least at the intended sampling frequency, i.e. the signal should not be conditioned.
The pressure sensors should preferably be sufficiently insensitive to temperature fluctuations or this should becorrected for in the testing.
The sensing area should be in direct contact with the medium inside the tank. No protective cover or similarcaps are to be used, which can affect the dynamics of the measurements.
Pressure transducers should be calibrated before use. In addition to a static calibration, a dynamic calibrationis recommended. This can be accomplished by use of drop-tests, where the pressure sensors are mounted in awedge-shaped section being dropped down onto a flat water surface. The temporal and spatial shapes of thepressure pulse are functions of the impact velocity and wedge dead rise angle. They can easily be accuratelycalculated for a small dead rise angle, and provide an excellent means of assessing the pressure sensorperformance.
The size of pressure transducers should be small to be able to measure local impact pressures and to be able toposition several pressure transducers close together. At least 16 sensors should cover a full-scale square areaof 1.5m2. Common hot-spots for impact loads at high filling are at intersections between the tank roof orchamfers and the tank walls. The sensors should be placed sufficiently close to these intersections so that thecorner panels are covered. A 4×4 cluster of sensors (16 in total) should be used in order to facilitate a loadversus area estimate based on 9 sensors for both the perimeter zone and the internal area excluding cornerboxes.
Hot-spots for impact loads at partial filling are close to the corners, in a range relatively close to the still freeliquid surface. High pressures may also occur on the longitudinal and the transverse bulkheads. Generally theimpact pressures are less localized in hot spots at partial filling, and the tank should be sufficiently instrumentedto assess this.
Studies of symmetry of loading for different corners in the tank should be carried out to assure that the area
Classification Notes - No. 30.9, August 2014
Sec.3 Sloshing impact design loads – Page 40
DET NORSKE VERITAS AS
having the most severe loads are chosen for the final instrumentation.
The data acquisition system should be able to sample the pressure sensors at a sufficiently high sampling rateto capture short impact pressure time histories. Typically sampling rates of ~10 kHz to ~20 kHz are requiredfor sloshing tests at scales of 1:15 to 1:50 respectively.
The pressure time histories and the tank motion histories are to be stored as raw data for further post-processing.Alternatively only data exceeding a pre-defined threshold may be stored. This threshold has to be set lowenough to capture all relevant impact peak pressures.
The test setup should have a monitoring system stopping the experiments if for instance the deviation betweeninput and output is too large, or if more than one sensor stops working.
Video capturing of the sloshing tests is recommended in order to study the resulting fluid behaviour inside thetank for specific conditions, like for example the wave heading, the sea state and the filling level.
3.5.3 Test liquid and ullage gas
As mentioned in Sec.2 [2.2.3] the choice of liquid and ullage gas for the model experiment will to a large extentdefine the similarity relationships between the experiment and the prototype.
The model tests can be carried out using water and air at ambient temperature and pressure. This configurationhas lower density ratio than LNG and its vapour. This is expected to increase the impact pressure during eventswhere the gas is efficiently displaced by the liquid prior to impact on the tank walls, as it implies reducedrelative momentum transfer from the liquid to the gas and hence reduced cushioning of the impact.
Improved similarity in density ratio can be achieved by the choice of a suitable ullage gas for the test model.A mix of sulphur hexafluoride and nitrogen is a frequently used and accepted alternative.
Other test configurations may be accepted by DNV if this can be justified by the designer,
Current research does not yet provide conclusive recommendation regarding test liquid, ullage gas, and scaling.The comparative based scaling factor is expected to reduce the uncertainty related to differences in similarity.The same liquid and ullage gas must be used in the experiments made to determine sloshing loads for thereference and the target vessel.
3.5.4 Documentation of a sloshing test facility
DNV requires documentation of test facilities that are used for sloshing model experiments. Generally alldetails needed to set up the experiment are required in the documentation, and the aspects discussed in [3.5.1]and [3.5.2] should be included. A summary of some issues that need to be documented is given in the following.Other requirements may be defined in addition.
— A comparison between input and output motions, with a relevant set of excitation motions needs to bedocumented. It is important that both the maximum motion amplitudes, both for translations and rotations,and the phasing between the motion modes are reproduced accurately. This should be documented for allfrequencies relevant for wave exciation, and for amplitudes representing the most severe sea states. Themaximum payload of the test rig should be used in the tests.
— The sensors should be tested in a controlled setup, to demonstrate that the dynamic behaviour of the sensorsare acceptable. A wedge drop test setup is recommended, where drop velocities and wedge angles arechosen to reproduce representative impact risetimes and magnitudes from sloshing model tests. Severalsensors should be tested, to illustrate the variability between the sensors. It should also be documented thatthe characteristics of the sensors do not change with wear and tear.
— An overview of the testing setup, with sensors, data acquisition system and data processing should bedocumented. All relevant information such as technical specifications should be given.
— Documentation of the test facility monitoring system.— Documentation of the statistical post processing procedure.
The documentation should be on a report format, and should be updated annually or whenever changes aremade to the test setup or to procedures related to the testing.
3.6 Model test program
The model test program must include a sufficient number of relevant short term probability distributions toaccurately describe the long term sloshing load probability distribution. In practical terms this means that it isnecessary to test a large number of sea state, wave heading, and tank filling level combinations that cover thevessel operation. The duration of the test needs to be long enough to get converged statistical short termdistributions.
Long term distributions for linear ship motion responses are normally calculated from short term distributionswith a discretization of 1 second for Tz, 1 meter for Hs and 15 degrees for the relative wave heading. Executionof model tests covering the same range of sea states and wave headings is not considered feasible within an
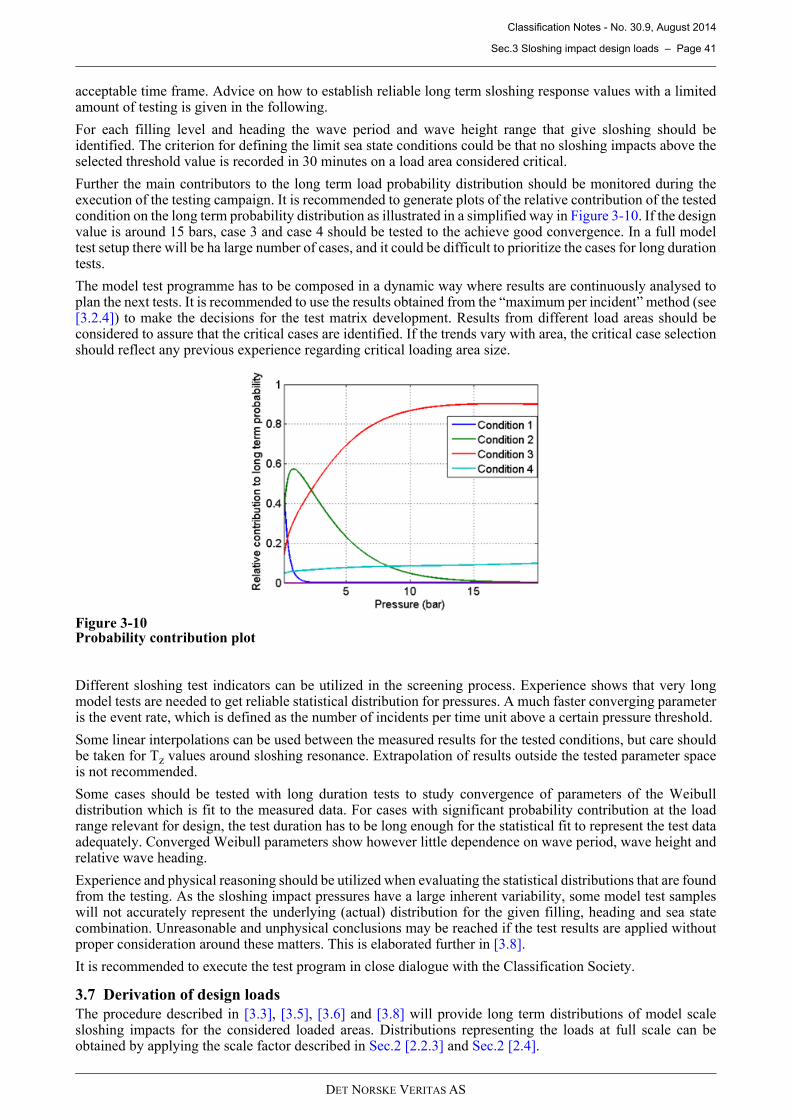
Classification Notes - No. 30.9, August 2014
Sec.3 Sloshing impact design loads – Page 41
DET NORSKE VERITAS AS
acceptable time frame. Advice on how to establish reliable long term sloshing response values with a limitedamount of testing is given in the following.
For each filling level and heading the wave period and wave height range that give sloshing should beidentified. The criterion for defining the limit sea state conditions could be that no sloshing impacts above theselected threshold value is recorded in 30 minutes on a load area considered critical.
Further the main contributors to the long term load probability distribution should be monitored during theexecution of the testing campaign. It is recommended to generate plots of the relative contribution of the testedcondition on the long term probability distribution as illustrated in a simplified way in Figure 3-10 . If the designvalue is around 15 bars, case 3 and case 4 should be tested to the achieve good convergence. In a full modeltest setup there will be ha large number of cases, and it could be difficult to prioritize the cases for long durationtests.
The model test programme has to be composed in a dynamic way where results are continuously analysed toplan the next tests. It is recommended to use the results obtained from the “maximum per incident” method (see[3.2.4]) to make the decisions for the test matrix development. Results from different load areas should beconsidered to assure that the critical cases are identified. If the trends vary with area, the critical case selectionshould reflect any previous experience regarding critical loading area size.
Figure 3-10Probability contribution plot
Different sloshing test indicators can be utilized in the screening process. Experience shows that very longmodel tests are needed to get reliable statistical distribution for pressures. A much faster converging parameteris the event rate, which is defined as the number of incidents per time unit above a certain pressure threshold.
Some linear interpolations can be used between the measured results for the tested conditions, but care shouldbe taken for Tz values around sloshing resonance. Extrapolation of results outside the tested parameter spaceis not recommended.
Some cases should be tested with long duration tests to study convergence of parameters of the Weibulldistribution which is fit to the measured data. For cases with significant probability contribution at the loadrange relevant for design, the test duration has to be long enough for the statistical fit to represent the test dataadequately. Converged Weibull parameters show however little dependence on wave period, wave height andrelative wave heading.
Experience and physical reasoning should be utilized when evaluating the statistical distributions that are foundfrom the testing. As the sloshing impact pressures have a large inherent variability, some model test sampleswill not accurately represent the underlying (actual) distribution for the given filling, heading and sea statecombination. Unreasonable and unphysical conclusions may be reached if the test results are applied withoutproper consideration around these matters. This is elaborated further in [3.8].
It is recommended to execute the test program in close dialogue with the Classification Society.
3.7 Derivation of design loads
The procedure described in [3.3], [3.5], [3.6] and [3.8] will provide long term distributions of model scalesloshing impacts for the considered loaded areas. Distributions representing the loads at full scale can beobtained by applying the scale factor described in Sec.2 [2.2.3] and Sec.2 [2.4].
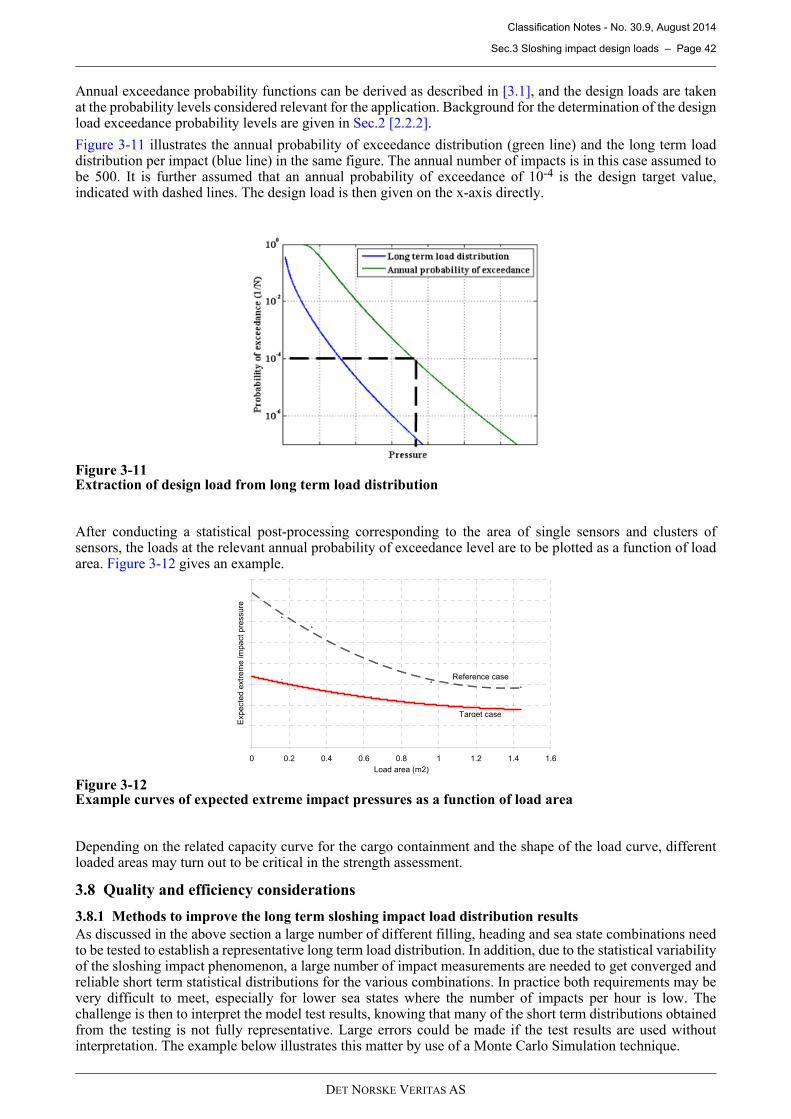
Classification Notes - No. 30.9, August 2014
Sec.3 Sloshing impact design loads – Page 42
DET NORSKE VERITAS AS
Annual exceedance probability functions can be derived as described in [3.1], and the design loads are takenat the probability levels considered relevant for the application. Background for the determination of the designload exceedance probability levels are given in Sec.2 [2.2.2].
Figure 3-11 illustrates the annual probability of exceedance distribution (green line) and the long term loaddistribution per impact (blue line) in the same figure. The annual number of impacts is in this case assumed tobe 500. It is further assumed that an annual probability of exceedance of 10-4 is the design target value,indicated with dashed lines. The design load is then given on the x-axis directly.
Figure 3-11Extraction of design load from long term load distribution
After conducting a statistical post-processing corresponding to the area of single sensors and clusters ofsensors, the loads at the relevant annual probability of exceedance level are to be plotted as a function of loadarea. Figure 3-12 gives an example.
Figure 3-12Example curves of expected extreme impact pressures as a function of load area
Depending on the related capacity curve for the cargo containment and the shape of the load curve, differentloaded areas may turn out to be critical in the strength assessment.
3.8 Quality and efficiency considerations
3.8.1 Methods to improve the long term sloshing impact load distribution results
As discussed in the above section a large number of different filling, heading and sea state combinations needto be tested to establish a representative long term load distribution. In addition, due to the statistical variabilityof the sloshing impact phenomenon, a large number of impact measurements are needed to get converged andreliable short term statistical distributions for the various combinations. In practice both requirements may bevery difficult to meet, especially for lower sea states where the number of impacts per hour is low. Thechallenge is then to interpret the model test results, knowing that many of the short term distributions obtainedfrom the testing is not fully representative. Large errors could be made if the test results are used withoutinterpretation. The example below illustrates this matter by use of a Monte Carlo Simulation technique.
0 0.2 0.4 0.6 0.8 1 1.2 1.4 1.6
Load area (m2)
Exp
ecte
d e
xtr
em
e im
pa
ct
pre
ssu
re
Reference case
Target case
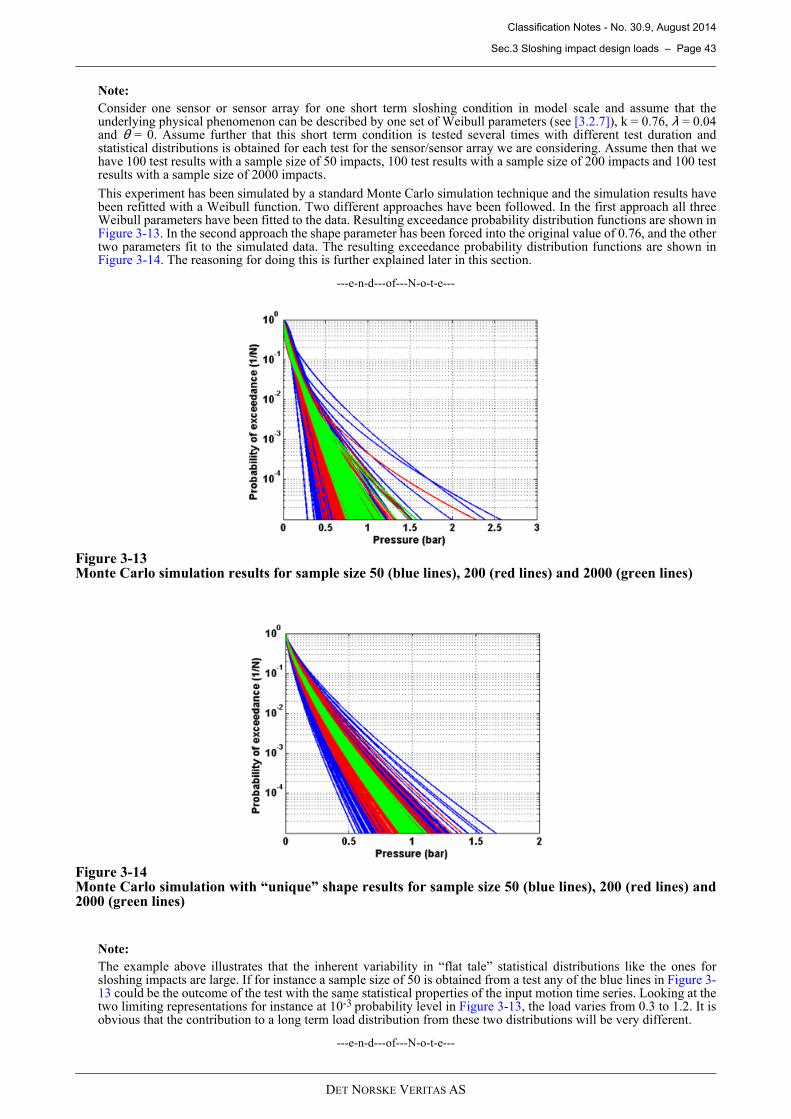
Classification Notes - No. 30.9, August 2014
Sec.3 Sloshing impact design loads – Page 43
DET NORSKE VERITAS AS
Note:
Consider one sensor or sensor array for one short term sloshing condition in model scale and assume that theunderlying physical phenomenon can be described by one set of Weibull parameters (see [3.2.7]), k = 0.76, λ = 0.04and θ = 0. Assume further that this short term condition is tested several times with different test duration andstatistical distributions is obtained for each test for the sensor/sensor array we are considering. Assume then that wehave 100 test results with a sample size of 50 impacts, 100 test results with a sample size of 200 impacts and 100 testresults with a sample size of 2000 impacts.
This experiment has been simulated by a standard Monte Carlo simulation technique and the simulation results havebeen refitted with a Weibull function. Two different approaches have been followed. In the first approach all threeWeibull parameters have been fitted to the data. Resulting exceedance probability distribution functions are shown inFigure 3-13 . In the second approach the shape parameter has been forced into the original value of 0.76, and the othertwo parameters fit to the simulated data. The resulting exceedance probability distribution functions are shown inFigure 3-14 . The reasoning for doing this is further explained later in this section.
---e-n-d---of---N-o-t-e---
Figure 3-13Monte Carlo simulation results for sample size 50 (blue lines), 200 (red lines) and 2000 (green lines)
Figure 3-14Monte Carlo simulation with “unique” shape results for sample size 50 (blue lines), 200 (red lines) and2000 (green lines)
Note:
The example above illustrates that the inherent variability in “flat tale” statistical distributions like the ones forsloshing impacts are large. If for instance a sample size of 50 is obtained from a test any of the blue lines in Figure 3-13 could be the outcome of the test with the same statistical properties of the input motion time series. Looking at thetwo limiting representations for instance at 10-3 probability level in Figure 3-13, the load varies from 0.3 to 1.2. It isobvious that the contribution to a long term load distribution from these two distributions will be very different.
---e-n-d---of---N-o-t-e---
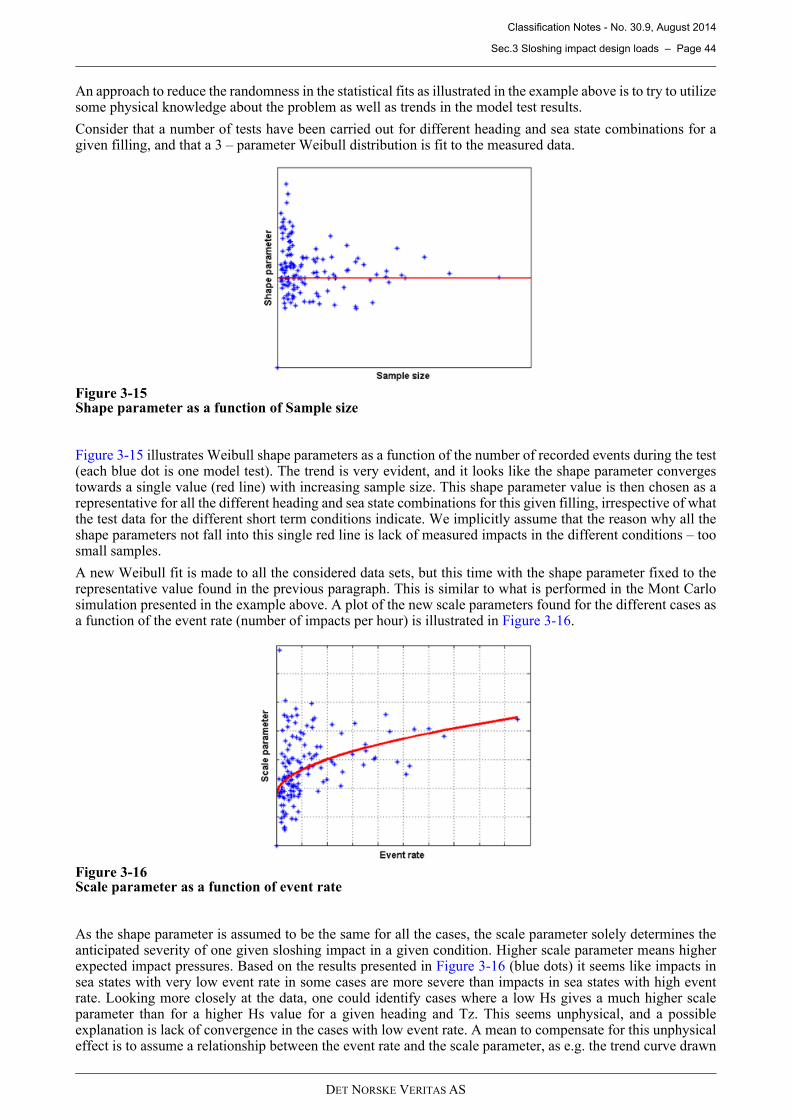
Classification Notes - No. 30.9, August 2014
Sec.3 Sloshing impact design loads – Page 44
DET NORSKE VERITAS AS
An approach to reduce the randomness in the statistical fits as illustrated in the example above is to try to utilizesome physical knowledge about the problem as well as trends in the model test results.
Consider that a number of tests have been carried out for different heading and sea state combinations for agiven filling, and that a 3 – parameter Weibull distribution is fit to the measured data.
Figure 3-15Shape parameter as a function of Sample size
Figure 3-15 illustrates Weibull shape parameters as a function of the number of recorded events during the test(each blue dot is one model test). The trend is very evident, and it looks like the shape parameter convergestowards a single value (red line) with increasing sample size. This shape parameter value is then chosen as arepresentative for all the different heading and sea state combinations for this given filling, irrespective of whatthe test data for the different short term conditions indicate. We implicitly assume that the reason why all theshape parameters not fall into this single red line is lack of measured impacts in the different conditions – toosmall samples.
A new Weibull fit is made to all the considered data sets, but this time with the shape parameter fixed to therepresentative value found in the previous paragraph. This is similar to what is performed in the Mont Carlosimulation presented in the example above. A plot of the new scale parameters found for the different cases asa function of the event rate (number of impacts per hour) is illustrated in Figure 3-16 .
Figure 3-16Scale parameter as a function of event rate
As the shape parameter is assumed to be the same for all the cases, the scale parameter solely determines theanticipated severity of one given sloshing impact in a given condition. Higher scale parameter means higherexpected impact pressures. Based on the results presented in Figure 3-16 (blue dots) it seems like impacts insea states with very low event rate in some cases are more severe than impacts in sea states with high eventrate. Looking more closely at the data, one could identify cases where a low Hs gives a much higher scaleparameter than for a higher Hs value for a given heading and Tz. This seems unphysical, and a possibleexplanation is lack of convergence in the cases with low event rate. A mean to compensate for this unphysicaleffect is to assume a relationship between the event rate and the scale parameter, as e.g. the trend curve drawn
Classification Notes - No. 30.9, August 2014
Sec.4 Pump tower design loads – Page 45
DET NORSKE VERITAS AS
in red in Figure 3-16 . It is not obvious how to draw this trend curve, but experience indicates that the scatter ofscale parameter is reduced with increasing sample size for the different cases. It could look like the scaleparameter is converging towards some finite value with increasing event rate
When using the above approach to improve the basis for the design load assessment, only the event rate is takendirectly from the test data results. The event rate is converging much faster than the Weibull parameters, andonly a limited number of test hours in normally needed to get a precise estimate. The event rate normallyincreases for motion periods close to liquid motion resonance and for increasing Hs values.
As demonstrated in this section, there will be large differences between small sample realisations of statisticaldistributions expected to be relevant for sloshing impact loads, and direct fit to these realisations will notreliably reproduce the original distribution. Small samples are often encountered in sloshing assessments dueto practical limitations, and it follows that the method outlined in this paragraph, or a similar method, will givemore reliable predictions of short and long term statistical distributions of sloshing loads than a method basedentirely on mathematical fits to short term experimental results.
The method is most efficiently utilised if it is taken into account in the planning and execution of the model testprogram as outlined below:
1) Select a set of key sea state and operational conditions that together can be considered governing for thestatistical behaviour in other sea states/operational conditions.
2) Carry out long duration tests for these sea states to obtain reliable estimates of short term statisticalbehaviour.
3) Carry out shorter duration model tests for the large number of other sea states and operational conditionsthat require consideration to establish event rates.
4) Assign representative short term distributions from the governing long duration tests. Alternatively, fitdistribution function to the test data by constraining e.g. the shape parameter of the distribution to the valueobtained for the long duration test.
3.8.2 Quality control and resolution of the parameter space in the long term load distribution
Choices must be made in how to discretize the parameter space (wave height, wave period, wave heading, tankfilling, etc.) when deriving sloshing impact design loads by use of a long term assessment methodology, asdescribed in [3.6].
To verify that the actual discretization is good enough it is recommended check the probability contribution atthe design load level as a function of the different parameters. If for instance the probability contribution ishighest for the largest wave heights and these are not the largest wave height encountered, it indicates that thetest matrix has not been extended to high enough sea states. If on the other hand the contribution is largest forthe smallest wave heights, it may be an indication that the threshold level is too high.
Another potential finding could be that just one wave heading dominates the design load probability, in whichcase it could indicate that a refinement of the heading probability distribution around this heading could bebeneficial.
This kind of QA work on the derivation of sloshing impact design loads is an absolute necessity, as it hasproven to be very easy to make mistakes in the process of deriving them. Small errors in the implementationof different input probabilities, Weibull parameters, or event rates give huge effects on the final results. Greatcare should hence be taken in all steps of the process.
4 Pump tower design loads
4.1 Motivation
The pump tower structure has to be design to withstand both extreme loads (ULS) and repetitive loading (FLS).Different load effects will act simultaneously on the tower structure, and the structural response due to thecombined load effect needs to be assessed.
It is recommended to use long term statistics to identify both the stress ranges for the fatigue loads and theextreme loading for the ultimate stress analysis.
The different loads to be considered, and a recommended procedure to determine the design loads, are outlinedin the following.
4.2 Identification of relevant loads
The loads relevant for the dimensioning of the pump tower are due to the ship motion, the motion of the LNGin the cargo tanks, and the temperature of the cargo. Several load effects need to be considered and it is
Classification Notes - No. 30.9, August 2014
Sec.4 Pump tower design loads – Page 46
DET NORSKE VERITAS AS
recommended to separate them in the following categories:
1) Sloshing load, gravity loads and inertia loads should be treated simultaneously in time domain. All threeforce components are dynamic loads that depends on the ship motions. The phasing between the loads andthe distribution of the loads over the tower will be important.
2) Thermal loads on the towerstructure due to the low temperature of the cargo.
3) Hull girder loads (for liquid dome area and for base support).
4) Internal tank pressure and external sea pressure (for base support).
A description of how to treat the different load categories is given in [4.3] to [4.6]. Guidelines for combinationof load effects for ultimate strength and fatigue analyses are given in [4.7].
4.3 Sloshing, gravity and inertia loads
4.3.1 General
Sloshing loads on the pump tower structure occur due to motion of the liquid inside the cargo tanks.
Inertia loads on the pump tower are due to the motion of the vessel. Translational tank accelerations due to thepitch and roll motion of the ship is to be accounted for. Weight of liquid inside the pipes should be included inthe calculation of inertia loads.
Gravity loads includes the self-weight of the pump tower and the longitudinal and transverse components ofthe self-weight due to the roll and pitch angles experienced by the ship. When the gravity loads are calculated,the buoyancy of the pipes should be deducted.
For both inertia loads and gravity loads, the mass of additional elements (structural members and equipment)that are not included in the finite element model used for the stress response analysis should be included aslumped or distributed masses.
It is recommended to process the sloshing loads together with the inertia- and gravity loads to get the phasingbetween the load effects incorporated in a consistent way.
The sloshing loads are to be determined using model testing or numerical analyses by computational fluiddynamics (CFD). Irregular vessel motions are to be considered.
If the pump tower design is similar in all tanks of the vessel it may, the analysis/tests may be limited to the mosthighly loaded pump tower. The critical tank(s) should be determined by evaluation of the ship motions. Thiswill usually be either the foremost or the aftmost tank, depending on the phasing between the motion modes.If tanks have different sizes, like for instance on a conventional LNG carrier, both tank no. 1 and tank no. 2may need to be considered to determine which one is most critical with respect to the combined effect ofsloshing loads and inertia loads. If pump tower designs differ between tanks it may be necessary to considerthe designs separately.
Froude scaling should be applied if model test results are used.
The guidance given in Sec.3 [3.3] regarding environmental and operational modelling is also valid for the pumptower design.
4.3.2 Filling levels and loading conditions
Depending on the filling level in the tanks and the loading condition the vessel is operating with, either inertiaeffects or sloshing loads may be dominating the structural response of the pump tower. The sloshing loads arevery dependent on the filling level in the tank, while the inertia loads are more dependent on the loadingcondition of the vessel. It is generally not feasible to optimize the analysis for both load effects. If sloshingloads are dominating, a simplification of the loading condition distribution is recommended.
The sloshing loads should be considered for various filling levels according to the ship’s filling restrictions.For operation with a barred filling range, at least three filling levels need to be considered: one levelrepresenting the low filling range, and two levels representing the high filling range. This will normally be thelower filling limit in the case of ballast operation and upper filling limit and full tank (95%H) in the case of fullload.
For unrestricted filling, at least four different filling levels should be considered, representing differentcharacteristic tank filling ranges. A screening to identify the worst filling level within each range isrecommended. Typically the following fillings should be considered:
— 15%B — 50%H— 70%H — 95%H.
Classification Notes - No. 30.9, August 2014
Sec.4 Pump tower design loads – Page 47
DET NORSKE VERITAS AS
Here B represents the tank breadth and H the tank height.
A more refined filling discretization may be used to reduce the conservatism of the analysis.
Ship loading conditions should be selected in a conservative way, e.g. by using a ballast condition for all fillinglevels except for 95%H.
If it can be documented that inertia forces are the main contributor to the structural response for high fillinglevels, and sloshing loads are the main contributor for low filling levels, the FLS assessment may be carriedout by considering the two effects separately for some fillings.
Sloshing loads may be disregarded for 95%H filling if it can be documented that the effect is small.
4.3.3 Load prediction
A sloshing test programme or calculation programme should be composed based on operational andenvironmental conditions for the considered vessel. Irregular motion time series based on the ship responsespectra for the different conditions should be used to excite the tank.
It is normally beneficial to divide the testing or calculation programme into a screening phase and a designphase. The screening phase is used to identify the combinations of sea state, heading and tank filling that givethe main contribution to the long term probability distribution. Longer duration tests or analyses should becarried out to achieve better statistical convergence for the cases identified to be most important.
The same load distribution should be used for both the FLS and the ULS analyses.
The load on the tower has a spatial variation that cannot easily be described statistically. From an analysis pointof view it is therefore more convenient to describe the loads on the tower in terms of the forces and bendingmoments at the top and bottom supports. Forces/moments at other potential critical cross sections of the towercan be included as required. Long term statistical distributions should be determined for the selected responseparameters, from which design values can be derived by specifying an appropriate return period.
Design load scenarios in terms of a spatial distribution over the tower can be derived by selecting relevantloading histories recorded during the testing/analysis program, and by scaling these to achieve the designvalues of the selected response parameters. The procedure is outlined in the following.
4.3.3.1 Establish time series for the sectional forces
A response model of the pump tower will have to be developed to calculate sectional forces and moments asfunction of the applied loads. The model should include the appropriate support stiffness from adjacentsupporting structures.
An example of a calculation model is illustrated in Figure 4-1 . f(ξ) denotes the combined load effect ofsloshing, gravity and inertia in a given time instant. Guidelines for how to determine these loads are found in[4.3.3.3], [4.3.3.3] and [4.3.3.4]. In this case the tower is modelled as a beam described by the Young’s modulus(E), the cross-section area moment of inertia (I), and the mass per unit length (m). Tripod masts typically usedin membrane LNG tanks may be better described by a truss/frame model.
For the support there will in general be reaction forces for the translation (FA and FB) and for the rotations (MAand MB). The rotational stiffnesses (KA and KB) and the end support conditions have to be determined basedon the design of the tower.
Time series for reaction forces and moments are determined by solving the equilibrium equations for thesystem in all degrees of freedom at all time instants:
Time series for other sectional force parameters can be found by solving similar equilibrium equations for theappropriate sub-regions of the model.
∑ = 0F
∑ = 0M
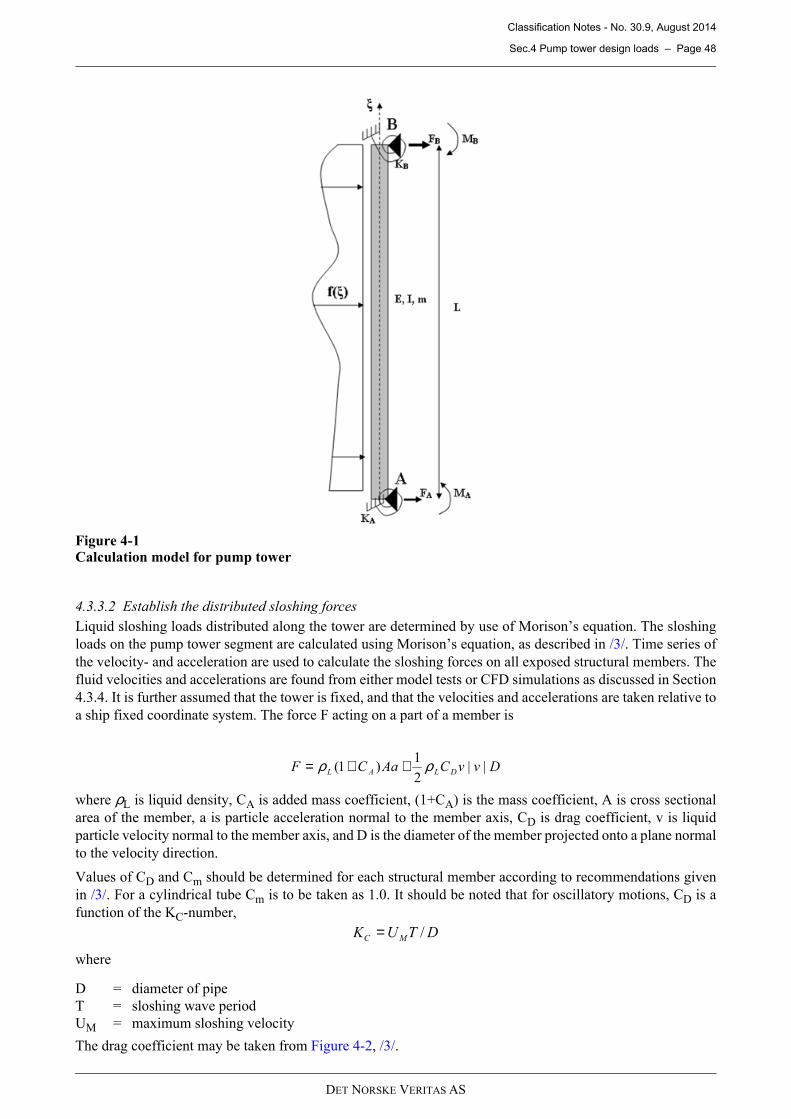
Classification Notes - No. 30.9, August 2014
Sec.4 Pump tower design loads – Page 48
DET NORSKE VERITAS AS
Figure 4-1
Calculation model for pump tower
4.3.3.2 Establish the distributed sloshing forces
Liquid sloshing loads distributed along the tower are determined by use of Morison’s equation. The sloshing
loads on the pump tower segment are calculated using Morison’s equation, as described in /3/. Time series of
the velocity- and acceleration are used to calculate the sloshing forces on all exposed structural members. The
fluid velocities and accelerations are found from either model tests or CFD simulations as discussed in Section
4.3.4. It is further assumed that the tower is fixed, and that the velocities and accelerations are taken relative to
a ship fixed coordinate system. The force F acting on a part of a member is
where ρL is liquid density, CA is added mass coefficient, (1+CA) is the mass coefficient, A is cross sectional
area of the member, a is particle acceleration normal to the member axis, CD is drag coefficient, v is liquid
particle velocity normal to the member axis, and D is the diameter of the member projected onto a plane normal
to the velocity direction.
Values of CD and Cm should be determined for each structural member according to recommendations given
in /3/. For a cylindrical tube Cm is to be taken as 1.0. It should be noted that for oscillatory motions, CD is a
function of the KC-number,
where
D = diameter of pipe
T = sloshing wave period
UM = maximum sloshing velocity
The drag coefficient may be taken from Figure 4-2 , /3/.
DvvCAaCF DLAL ||2
1)1( ρρ ++=
DTUK MC /=
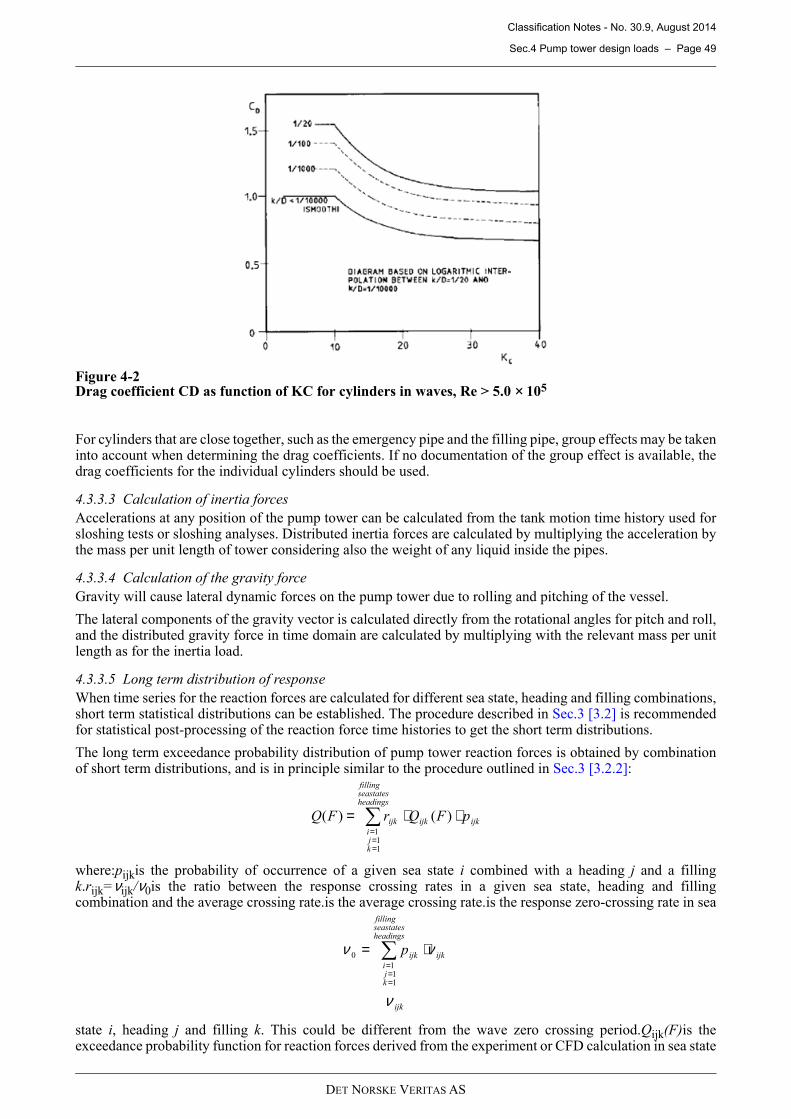
Classification Notes - No. 30.9, August 2014
Sec.4 Pump tower design loads – Page 49
DET NORSKE VERITAS AS
Figure 4-2Drag coefficient CD as function of KC for cylinders in waves, Re > 5.0 × 10⁵
For cylinders that are close together, such as the emergency pipe and the filling pipe, group effects may be takeninto account when determining the drag coefficients. If no documentation of the group effect is available, thedrag coefficients for the individual cylinders should be used.
4.3.3.3 Calculation of inertia forces
Accelerations at any position of the pump tower can be calculated from the tank motion time history used forsloshing tests or sloshing analyses. Distributed inertia forces are calculated by multiplying the acceleration bythe mass per unit length of tower considering also the weight of any liquid inside the pipes.
4.3.3.4 Calculation of the gravity force
Gravity will cause lateral dynamic forces on the pump tower due to rolling and pitching of the vessel.
The lateral components of the gravity vector is calculated directly from the rotational angles for pitch and roll,and the distributed gravity force in time domain are calculated by multiplying with the relevant mass per unitlength as for the inertia load.
4.3.3.5 Long term distribution of response
When time series for the reaction forces are calculated for different sea state, heading and filling combinations,short term statistical distributions can be established. The procedure described in Sec.3 [3.2] is recommendedfor statistical post-processing of the reaction force time histories to get the short term distributions.
The long term exceedance probability distribution of pump tower reaction forces is obtained by combinationof short term distributions, and is in principle similar to the procedure outlined in Sec.3 [3.2.2]:
where:pijkis the probability of occurrence of a given sea state i combined with a heading j and a fillingk.rijk=νijk/ν0is the ratio between the response crossing rates in a given sea state, heading and fillingcombination and the average crossing rate.is the average crossing rate.is the response zero-crossing rate in sea
state i, heading j and filling k. This could be different from the wave zero crossing period.Qijk(F)is theexceedance probability function for reaction forces derived from the experiment or CFD calculation in sea state
ijkijk
headingsseastatesfilling
kji
ijk pFQrFQ ⋅⋅= ∑===
)()(
111
∑===
⋅=headingsseastatesfilling
kji
ijkijkp
111
0 νν
ijkν
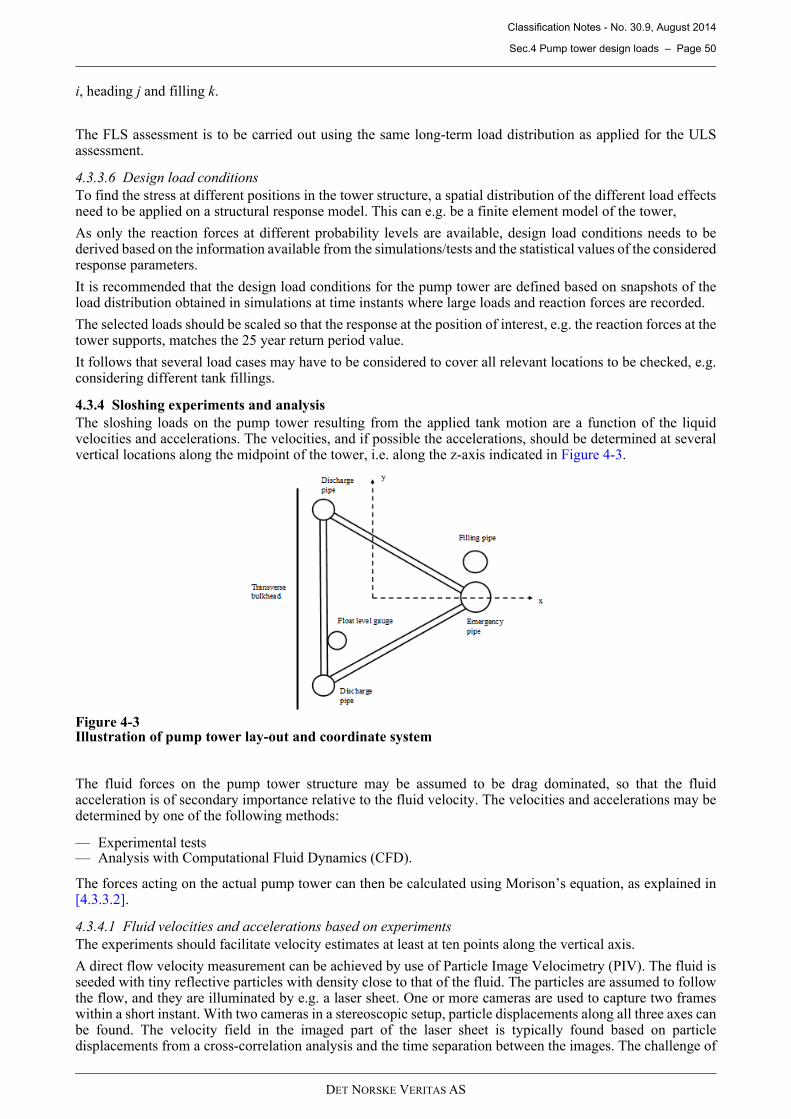
Classification Notes - No. 30.9, August 2014
Sec.4 Pump tower design loads – Page 50
DET NORSKE VERITAS AS
i, heading j and filling k.
The FLS assessment is to be carried out using the same long-term load distribution as applied for the ULSassessment.
4.3.3.6 Design load conditions
To find the stress at different positions in the tower structure, a spatial distribution of the different load effectsneed to be applied on a structural response model. This can e.g. be a finite element model of the tower,
As only the reaction forces at different probability levels are available, design load conditions needs to bederived based on the information available from the simulations/tests and the statistical values of the consideredresponse parameters.
It is recommended that the design load conditions for the pump tower are defined based on snapshots of theload distribution obtained in simulations at time instants where large loads and reaction forces are recorded.
The selected loads should be scaled so that the response at the position of interest, e.g. the reaction forces at thetower supports, matches the 25 year return period value.
It follows that several load cases may have to be considered to cover all relevant locations to be checked, e.g.considering different tank fillings.
4.3.4 Sloshing experiments and analysis
The sloshing loads on the pump tower resulting from the applied tank motion are a function of the liquidvelocities and accelerations. The velocities, and if possible the accelerations, should be determined at severalvertical locations along the midpoint of the tower, i.e. along the z-axis indicated in Figure 4-3 .
Figure 4-3Illustration of pump tower lay-out and coordinate system
The fluid forces on the pump tower structure may be assumed to be drag dominated, so that the fluidacceleration is of secondary importance relative to the fluid velocity. The velocities and accelerations may bedetermined by one of the following methods:
— Experimental tests— Analysis with Computational Fluid Dynamics (CFD).
The forces acting on the actual pump tower can then be calculated using Morison’s equation, as explained in[4.3.3.2].
4.3.4.1 Fluid velocities and accelerations based on experiments
The experiments should facilitate velocity estimates at least at ten points along the vertical axis.
A direct flow velocity measurement can be achieved by use of Particle Image Velocimetry (PIV). The fluid isseeded with tiny reflective particles with density close to that of the fluid. The particles are assumed to followthe flow, and they are illuminated by e.g. a laser sheet. One or more cameras are used to capture two frameswithin a short instant. With two cameras in a stereoscopic setup, particle displacements along all three axes canbe found. The velocity field in the imaged part of the laser sheet is typically found based on particledisplacements from a cross-correlation analysis and the time separation between the images. The challenge of
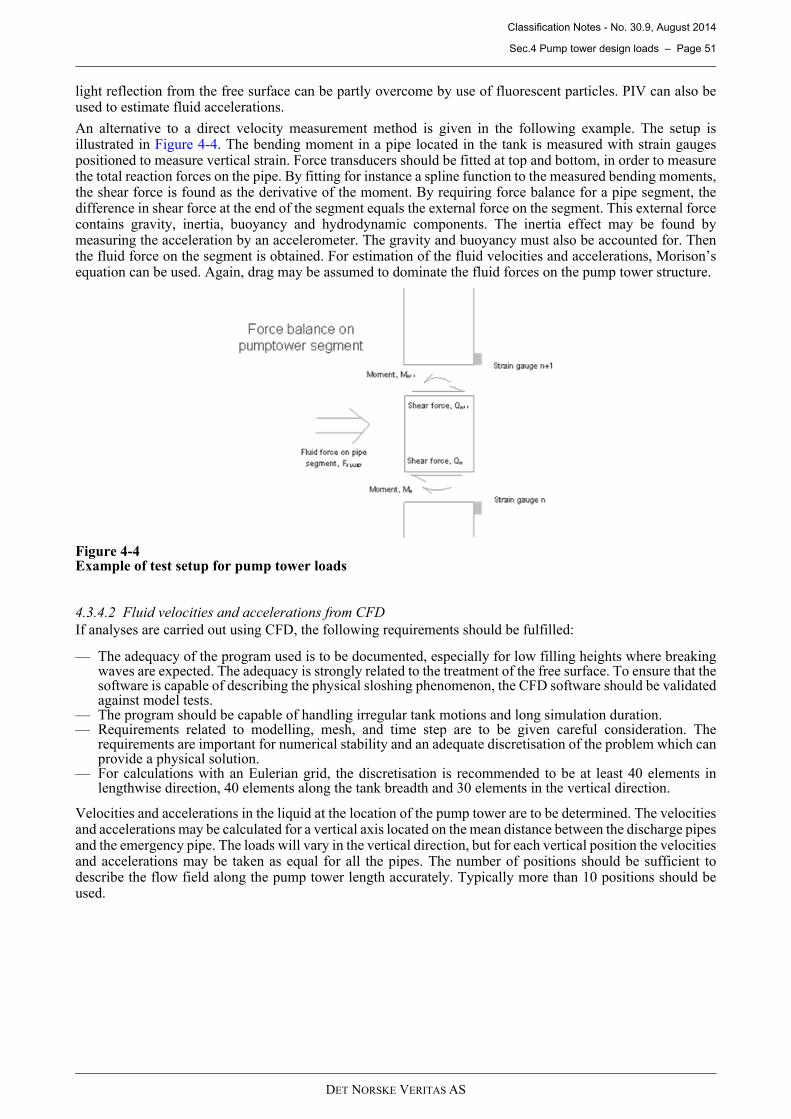
Classification Notes - No. 30.9, August 2014
Sec.4 Pump tower design loads – Page 51
DET NORSKE VERITAS AS
light reflection from the free surface can be partly overcome by use of fluorescent particles. PIV can also beused to estimate fluid accelerations.
An alternative to a direct velocity measurement method is given in the following example. The setup isillustrated in Figure 4-4 . The bending moment in a pipe located in the tank is measured with strain gaugespositioned to measure vertical strain. Force transducers should be fitted at top and bottom, in order to measurethe total reaction forces on the pipe. By fitting for instance a spline function to the measured bending moments,the shear force is found as the derivative of the moment. By requiring force balance for a pipe segment, thedifference in shear force at the end of the segment equals the external force on the segment. This external forcecontains gravity, inertia, buoyancy and hydrodynamic components. The inertia effect may be found bymeasuring the acceleration by an accelerometer. The gravity and buoyancy must also be accounted for. Thenthe fluid force on the segment is obtained. For estimation of the fluid velocities and accelerations, Morison’sequation can be used. Again, drag may be assumed to dominate the fluid forces on the pump tower structure.
Figure 4-4Example of test setup for pump tower loads
4.3.4.2 Fluid velocities and accelerations from CFD
If analyses are carried out using CFD, the following requirements should be fulfilled:
— The adequacy of the program used is to be documented, especially for low filling heights where breakingwaves are expected. The adequacy is strongly related to the treatment of the free surface. To ensure that thesoftware is capable of describing the physical sloshing phenomenon, the CFD software should be validatedagainst model tests.
— The program should be capable of handling irregular tank motions and long simulation duration.— Requirements related to modelling, mesh, and time step are to be given careful consideration. The
requirements are important for numerical stability and an adequate discretisation of the problem which canprovide a physical solution.
— For calculations with an Eulerian grid, the discretisation is recommended to be at least 40 elements inlengthwise direction, 40 elements along the tank breadth and 30 elements in the vertical direction.
Velocities and accelerations in the liquid at the location of the pump tower are to be determined. The velocitiesand accelerations may be calculated for a vertical axis located on the mean distance between the discharge pipesand the emergency pipe. The loads will vary in the vertical direction, but for each vertical position the velocitiesand accelerations may be taken as equal for all the pipes. The number of positions should be sufficient todescribe the flow field along the pump tower length accurately. Typically more than 10 positions should beused.
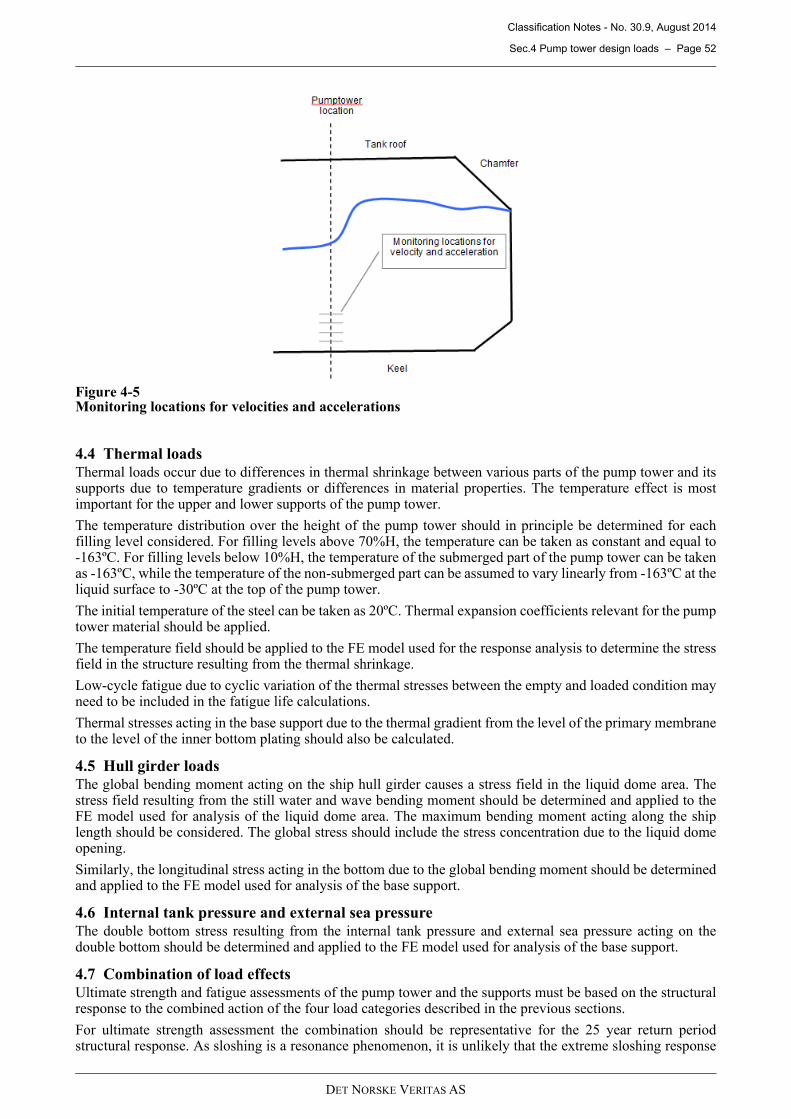
Classification Notes - No. 30.9, August 2014
Sec.4 Pump tower design loads – Page 52
DET NORSKE VERITAS AS
Figure 4-5Monitoring locations for velocities and accelerations
4.4 Thermal loads
Thermal loads occur due to differences in thermal shrinkage between various parts of the pump tower and itssupports due to temperature gradients or differences in material properties. The temperature effect is mostimportant for the upper and lower supports of the pump tower.
The temperature distribution over the height of the pump tower should in principle be determined for eachfilling level considered. For filling levels above 70%H, the temperature can be taken as constant and equal to-163ºC. For filling levels below 10%H, the temperature of the submerged part of the pump tower can be takenas -163ºC, while the temperature of the non-submerged part can be assumed to vary linearly from -163ºC at theliquid surface to -30ºC at the top of the pump tower.
The initial temperature of the steel can be taken as 20ºC. Thermal expansion coefficients relevant for the pumptower material should be applied.
The temperature field should be applied to the FE model used for the response analysis to determine the stressfield in the structure resulting from the thermal shrinkage.
Low-cycle fatigue due to cyclic variation of the thermal stresses between the empty and loaded condition mayneed to be included in the fatigue life calculations.
Thermal stresses acting in the base support due to the thermal gradient from the level of the primary membraneto the level of the inner bottom plating should also be calculated.
4.5 Hull girder loads
The global bending moment acting on the ship hull girder causes a stress field in the liquid dome area. Thestress field resulting from the still water and wave bending moment should be determined and applied to theFE model used for analysis of the liquid dome area. The maximum bending moment acting along the shiplength should be considered. The global stress should include the stress concentration due to the liquid domeopening.
Similarly, the longitudinal stress acting in the bottom due to the global bending moment should be determinedand applied to the FE model used for analysis of the base support.
4.6 Internal tank pressure and external sea pressure
The double bottom stress resulting from the internal tank pressure and external sea pressure acting on thedouble bottom should be determined and applied to the FE model used for analysis of the base support.
4.7 Combination of load effects
Ultimate strength and fatigue assessments of the pump tower and the supports must be based on the structuralresponse to the combined action of the four load categories described in the previous sections.
For ultimate strength assessment the combination should be representative for the 25 year return periodstructural response. As sloshing is a resonance phenomenon, it is unlikely that the extreme sloshing response
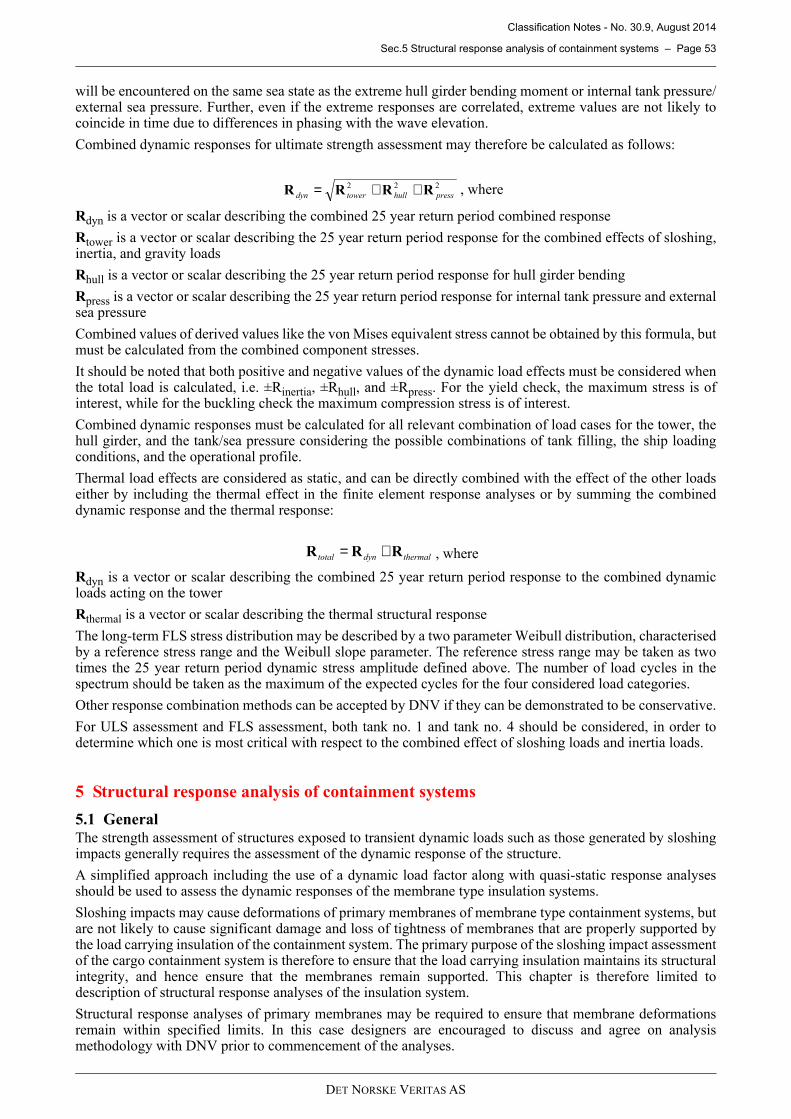
Classification Notes - No. 30.9, August 2014
Sec.5 Structural response analysis of containment systems – Page 53
DET NORSKE VERITAS AS
will be encountered on the same sea state as the extreme hull girder bending moment or internal tank pressure/external sea pressure. Further, even if the extreme responses are correlated, extreme values are not likely tocoincide in time due to differences in phasing with the wave elevation.
Combined dynamic responses for ultimate strength assessment may therefore be calculated as follows:
Rdyn is a vector or scalar describing the combined 25 year return period combined response
Rtower is a vector or scalar describing the 25 year return period response for the combined effects of sloshing,inertia, and gravity loads
Rhull is a vector or scalar describing the 25 year return period response for hull girder bending
Rpress is a vector or scalar describing the 25 year return period response for internal tank pressure and externalsea pressure
Combined values of derived values like the von Mises equivalent stress cannot be obtained by this formula, butmust be calculated from the combined component stresses.
It should be noted that both positive and negative values of the dynamic load effects must be considered whenthe total load is calculated, i.e. ±Rinertia, ±Rhull, and ±Rpress. For the yield check, the maximum stress is ofinterest, while for the buckling check the maximum compression stress is of interest.
Combined dynamic responses must be calculated for all relevant combination of load cases for the tower, thehull girder, and the tank/sea pressure considering the possible combinations of tank filling, the ship loadingconditions, and the operational profile.
Thermal load effects are considered as static, and can be directly combined with the effect of the other loadseither by including the thermal effect in the finite element response analyses or by summing the combineddynamic response and the thermal response:
Rdyn is a vector or scalar describing the combined 25 year return period response to the combined dynamicloads acting on the tower
Rthermal is a vector or scalar describing the thermal structural response
The long-term FLS stress distribution may be described by a two parameter Weibull distribution, characterisedby a reference stress range and the Weibull slope parameter. The reference stress range may be taken as twotimes the 25 year return period dynamic stress amplitude defined above. The number of load cycles in thespectrum should be taken as the maximum of the expected cycles for the four considered load categories.
Other response combination methods can be accepted by DNV if they can be demonstrated to be conservative.
For ULS assessment and FLS assessment, both tank no. 1 and tank no. 4 should be considered, in order todetermine which one is most critical with respect to the combined effect of sloshing loads and inertia loads.
5 Structural response analysis of containment systems
5.1 General
The strength assessment of structures exposed to transient dynamic loads such as those generated by sloshingimpacts generally requires the assessment of the dynamic response of the structure.
A simplified approach including the use of a dynamic load factor along with quasi-static response analysesshould be used to assess the dynamic responses of the membrane type insulation systems.
Sloshing impacts may cause deformations of primary membranes of membrane type containment systems, butare not likely to cause significant damage and loss of tightness of membranes that are properly supported bythe load carrying insulation of the containment system. The primary purpose of the sloshing impact assessmentof the cargo containment system is therefore to ensure that the load carrying insulation maintains its structuralintegrity, and hence ensure that the membranes remain supported. This chapter is therefore limited todescription of structural response analyses of the insulation system.
Structural response analyses of primary membranes may be required to ensure that membrane deformationsremain within specified limits. In this case designers are encouraged to discuss and agree on analysismethodology with DNV prior to commencement of the analyses.
222
presshulltowerdyn RRRR ++= , where
thermaldyntotal RRR += , where
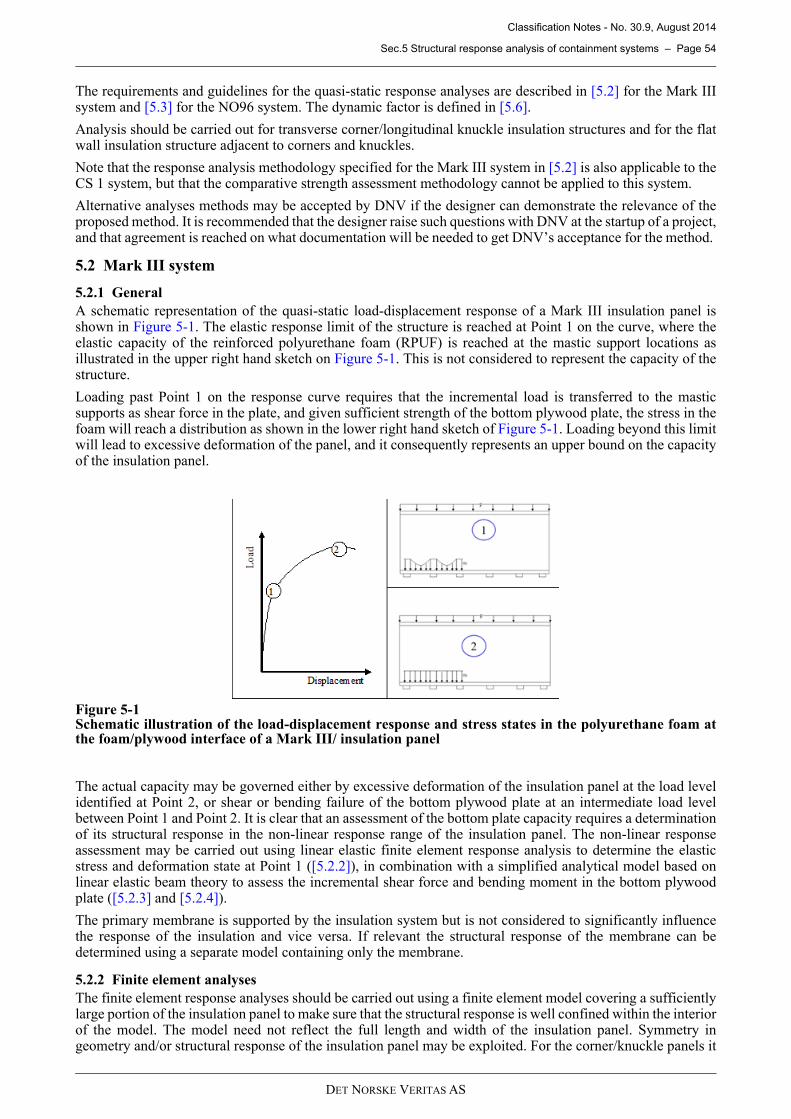
Classification Notes - No. 30.9, August 2014
Sec.5 Structural response analysis of containment systems – Page 54
DET NORSKE VERITAS AS
The requirements and guidelines for the quasi-static response analyses are described in [5.2] for the Mark IIIsystem and [5.3] for the NO96 system. The dynamic factor is defined in [5.6].
Analysis should be carried out for transverse corner/longitudinal knuckle insulation structures and for the flatwall insulation structure adjacent to corners and knuckles.
Note that the response analysis methodology specified for the Mark III system in [5.2] is also applicable to theCS 1 system, but that the comparative strength assessment methodology cannot be applied to this system.
Alternative analyses methods may be accepted by DNV if the designer can demonstrate the relevance of theproposed method. It is recommended that the designer raise such questions with DNV at the startup of a project,and that agreement is reached on what documentation will be needed to get DNV’s acceptance for the method.
5.2 Mark III system
5.2.1 General
A schematic representation of the quasi-static load-displacement response of a Mark III insulation panel isshown in Figure 5-1 . The elastic response limit of the structure is reached at Point 1 on the curve, where theelastic capacity of the reinforced polyurethane foam (RPUF) is reached at the mastic support locations asillustrated in the upper right hand sketch on Figure 5-1. This is not considered to represent the capacity of thestructure.
Loading past Point 1 on the response curve requires that the incremental load is transferred to the masticsupports as shear force in the plate, and given sufficient strength of the bottom plywood plate, the stress in thefoam will reach a distribution as shown in the lower right hand sketch of Figure 5-1. Loading beyond this limitwill lead to excessive deformation of the panel, and it consequently represents an upper bound on the capacityof the insulation panel.
Figure 5-1Schematic illustration of the load-displacement response and stress states in the polyurethane foam atthe foam/plywood interface of a Mark III/ insulation panel
The actual capacity may be governed either by excessive deformation of the insulation panel at the load levelidentified at Point 2, or shear or bending failure of the bottom plywood plate at an intermediate load levelbetween Point 1 and Point 2. It is clear that an assessment of the bottom plate capacity requires a determinationof its structural response in the non-linear response range of the insulation panel. The non-linear responseassessment may be carried out using linear elastic finite element response analysis to determine the elasticstress and deformation state at Point 1 ([5.2.2]), in combination with a simplified analytical model based onlinear elastic beam theory to assess the incremental shear force and bending moment in the bottom plywoodplate ([5.2.3] and [5.2.4]).
The primary membrane is supported by the insulation system but is not considered to significantly influencethe response of the insulation and vice versa. If relevant the structural response of the membrane can bedetermined using a separate model containing only the membrane.
5.2.2 Finite element analyses
The finite element response analyses should be carried out using a finite element model covering a sufficientlylarge portion of the insulation panel to make sure that the structural response is well confined within the interiorof the model. The model need not reflect the full length and width of the insulation panel. Symmetry ingeometry and/or structural response of the insulation panel may be exploited. For the corner/knuckle panels it
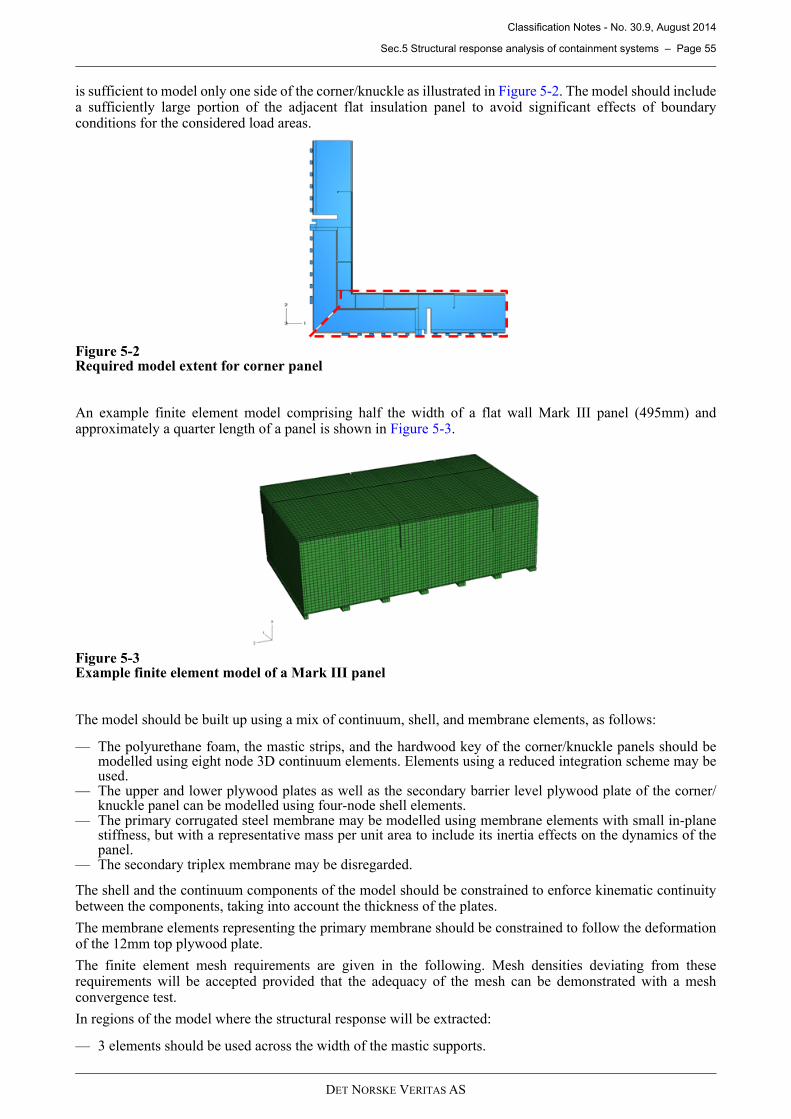
Classification Notes - No. 30.9, August 2014
Sec.5 Structural response analysis of containment systems – Page 55
DET NORSKE VERITAS AS
is sufficient to model only one side of the corner/knuckle as illustrated in Figure 5-2 . The model should includea sufficiently large portion of the adjacent flat insulation panel to avoid significant effects of boundaryconditions for the considered load areas.
Figure 5-2Required model extent for corner panel
An example finite element model comprising half the width of a flat wall Mark III panel (495mm) andapproximately a quarter length of a panel is shown in Figure 5-3 .
Figure 5-3Example finite element model of a Mark III panel
The model should be built up using a mix of continuum, shell, and membrane elements, as follows:
— The polyurethane foam, the mastic strips, and the hardwood key of the corner/knuckle panels should bemodelled using eight node 3D continuum elements. Elements using a reduced integration scheme may beused.
— The upper and lower plywood plates as well as the secondary barrier level plywood plate of the corner/knuckle panel can be modelled using four-node shell elements.
— The primary corrugated steel membrane may be modelled using membrane elements with small in-planestiffness, but with a representative mass per unit area to include its inertia effects on the dynamics of thepanel.
— The secondary triplex membrane may be disregarded.
The shell and the continuum components of the model should be constrained to enforce kinematic continuitybetween the components, taking into account the thickness of the plates.
The membrane elements representing the primary membrane should be constrained to follow the deformationof the 12mm top plywood plate.
The finite element mesh requirements are given in the following. Mesh densities deviating from theserequirements will be accepted provided that the adequacy of the mesh can be demonstrated with a meshconvergence test.
In regions of the model where the structural response will be extracted:
— 3 elements should be used across the width of the mastic supports.

Classification Notes - No. 30.9, August 2014
Sec.5 Structural response analysis of containment systems – Page 56
DET NORSKE VERITAS AS
— At least 7 elements should be used across the free span of the bottom plywood plate.— The element edge length in the direction of the mastic supports and in the through thickness direction of
the panel should be determined so that the elements are practically square.
In other parts of the model:
— 2 elements should be used across the width of the mastic supports.— At least 5 elements should be used across the free span of the bottom plywood plate.— The element edge length in the direction of the mastic supports and in the through thickness direction of
the panel can be rectangular, with a maximum aspect ratio of 3.0.
In the case the three planes of symmetry in geometry and response of the panel is exploited, the boundaryconditions for the panel should be taken as follows:
— Restrained translations of the bottom nodes of the mastic support.— Symmetry conditions on secondary foam, bottom plywood plate and centre mastic at panel symmetry
planes (see Figure 5-4 ). — Symmetry conditions on primary foam and top plywood plate at cross-panel boundaries (see Figure 5-4 ).
The far end plane of the model may be kept free. All patch loads should be applied away from this boundary,and even in the case of uniform load the results are taken at the opposite end of the model.
Figure 5-4Symmetry planes for the example Mark III insulation panel model
The plywood and the reinforced polyurethane foam materials may be modelled as homogeneous linearorthotropic elastic materials. In this case the bending stiffness moduli should be used to represent the plywoodstiffness. Alternatively the plywood may be modelled as a 0-90 laminate of layers of orthotropic elasticmaterials. The mastic may be modelled as a homogeneous linear elastic material. Material properties are givenin [5.4], and should be selected based on the material directions specified in Figure 5-5 .

Classification Notes - No. 30.9, August 2014
Sec.5 Structural response analysis of containment systems – Page 57
DET NORSKE VERITAS AS
Figure 5-5Definition of RPUF and plywood material directions relative to the Mark III insulation panel
5.2.3 Average through thickness stress in foam
The average through thickness stress may for a patch load case be interpreted as the equivalent uniform stressapplied to the surface of the panel. It follows that for a uniform load situation the stress is directly defined bythe applied load, p:
The average through thickness stress for the secondary foam insulation at the interface with the bottomplywood plate should be assessed as follows:
1) For a reference patch load, establish the elastic through thickness stress on top of the mastic support locatedas far as possible directly below the centre of the loaded area (see Figure 5-6 ). If the load patch covers morethan one mastic support, the average of the stress at all the mastic supports may be used. Let this be .
2) Establish the elastic through thickness stress on top of the same mastic support(s) for the case of a uniformreference load with the same magnitude as above (see Figure 5-6). Let this be .
3) Calculate the ratio .
4) Calculate the average through thickness stress as .
p=σ
p
0σ
u
0σ
u
p
r0
0
σσ
=
pr ⋅=σ
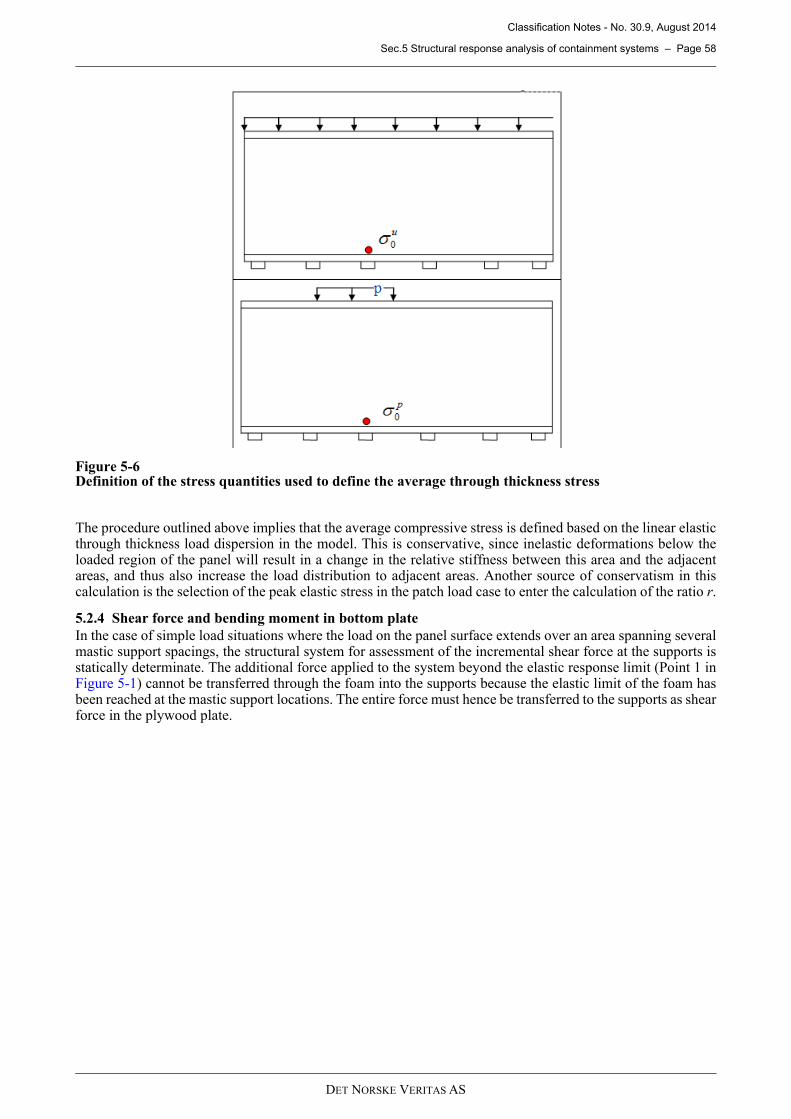
Classification Notes - No. 30.9, August 2014
Sec.5 Structural response analysis of containment systems – Page 58
DET NORSKE VERITAS AS
Figure 5-6Definition of the stress quantities used to define the average through thickness stress
The procedure outlined above implies that the average compressive stress is defined based on the linear elasticthrough thickness load dispersion in the model. This is conservative, since inelastic deformations below theloaded region of the panel will result in a change in the relative stiffness between this area and the adjacentareas, and thus also increase the load distribution to adjacent areas. Another source of conservatism in thiscalculation is the selection of the peak elastic stress in the patch load case to enter the calculation of the ratio r.
5.2.4 Shear force and bending moment in bottom plate
In the case of simple load situations where the load on the panel surface extends over an area spanning severalmastic support spacings, the structural system for assessment of the incremental shear force at the supports isstatically determinate. The additional force applied to the system beyond the elastic response limit (Point 1 inFigure 5-1) cannot be transferred through the foam into the supports because the elastic limit of the foam hasbeen reached at the mastic support locations. The entire force must hence be transferred to the supports as shearforce in the plywood plate.
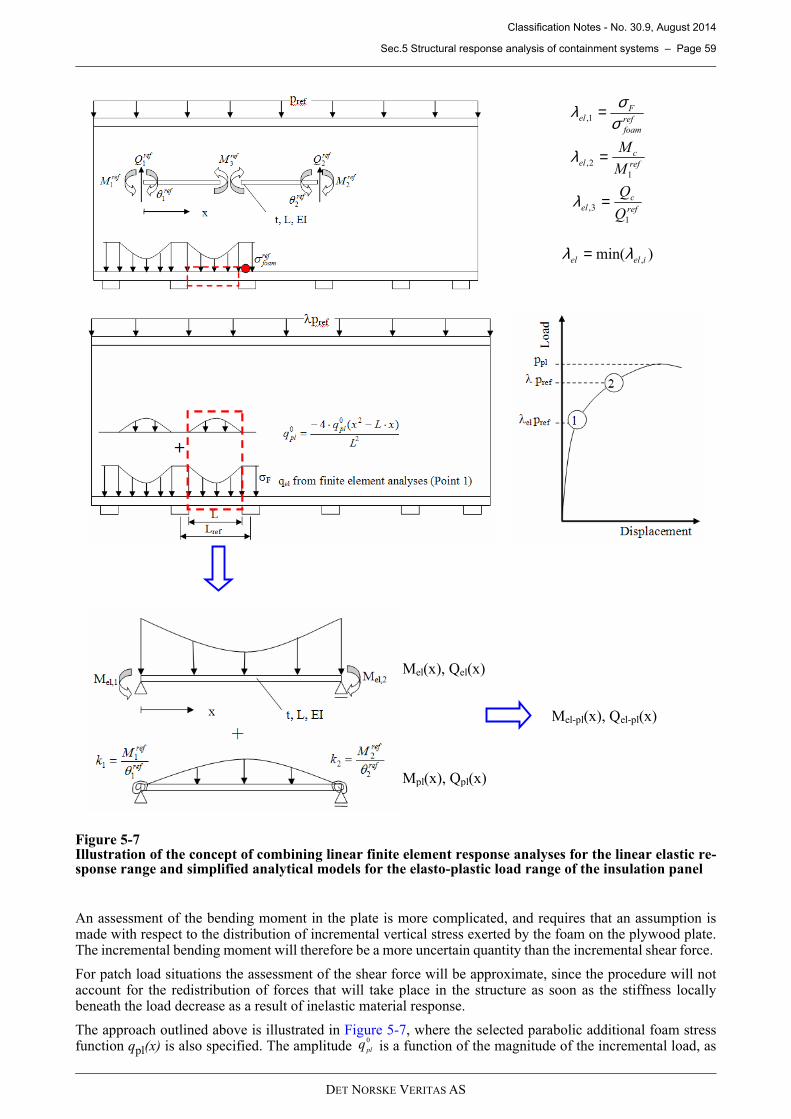
Classification Notes - No. 30.9, August 2014
Sec.5 Structural response analysis of containment systems – Page 59
DET NORSKE VERITAS AS
Figure 5-7Illustration of the concept of combining linear finite element response analyses for the linear elastic re-sponse range and simplified analytical models for the elasto-plastic load range of the insulation panel
An assessment of the bending moment in the plate is more complicated, and requires that an assumption ismade with respect to the distribution of incremental vertical stress exerted by the foam on the plywood plate.The incremental bending moment will therefore be a more uncertain quantity than the incremental shear force.
For patch load situations the assessment of the shear force will be approximate, since the procedure will notaccount for the redistribution of forces that will take place in the structure as soon as the stiffness locallybeneath the load decrease as a result of inelastic material response.
The approach outlined above is illustrated in Figure 5-7 , where the selected parabolic additional foam stressfunction qpl(x) is also specified. The amplitude is a function of the magnitude of the incremental load, as
ref
foam
Fel σ
σλ =1,
ref
cel
M
M
1
2, =λ
ref
c
elQ
Q
1
3, =λ
)min( ,ielel λλ =
Mel(x), Qel(x)
Mpl(x), Qpl(x)
Mel-pl(x), Qel-pl(x)
0
plq
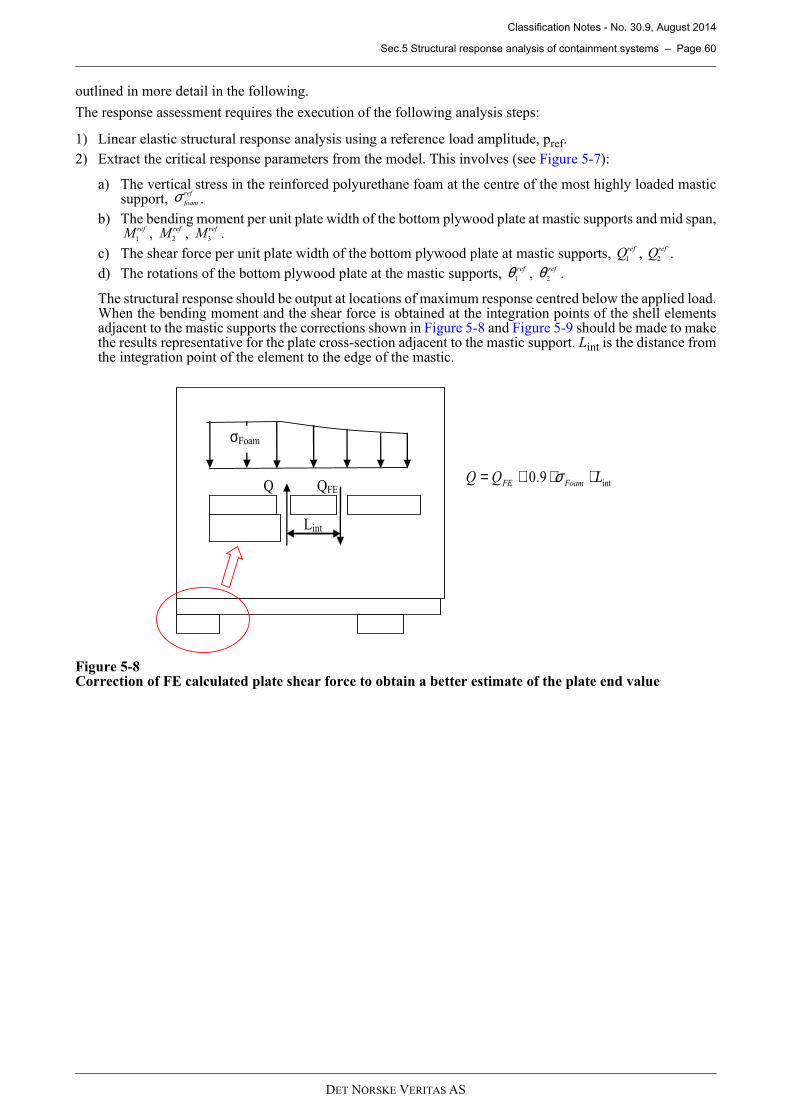
Classification Notes - No. 30.9, August 2014
Sec.5 Structural response analysis of containment systems – Page 60
DET NORSKE VERITAS AS
outlined in more detail in the following.
The response assessment requires the execution of the following analysis steps:
1) Linear elastic structural response analysis using a reference load amplitude, pref.
2) Extract the critical response parameters from the model. This involves (see Figure 5-7):
a) The vertical stress in the reinforced polyurethane foam at the centre of the most highly loaded masticsupport, .
b) The bending moment per unit plate width of the bottom plywood plate at mastic supports and mid span,, , .
c) The shear force per unit plate width of the bottom plywood plate at mastic supports, , .
d) The rotations of the bottom plywood plate at the mastic supports, , .
The structural response should be output at locations of maximum response centred below the applied load.When the bending moment and the shear force is obtained at the integration points of the shell elementsadjacent to the mastic supports the corrections shown in Figure 5-8 and Figure 5-9 should be made to makethe results representative for the plate cross-section adjacent to the mastic support. Lint is the distance fromthe integration point of the element to the edge of the mastic.
Figure 5-8Correction of FE calculated plate shear force to obtain a better estimate of the plate end value
ref
foamσ
refM1
refM2
refM3
refQ1
refQ2
ref
1θ ref
2θ
QFE Q
Lint
σFoam
int9.0 LQQ FoamFE ⋅⋅+= σ
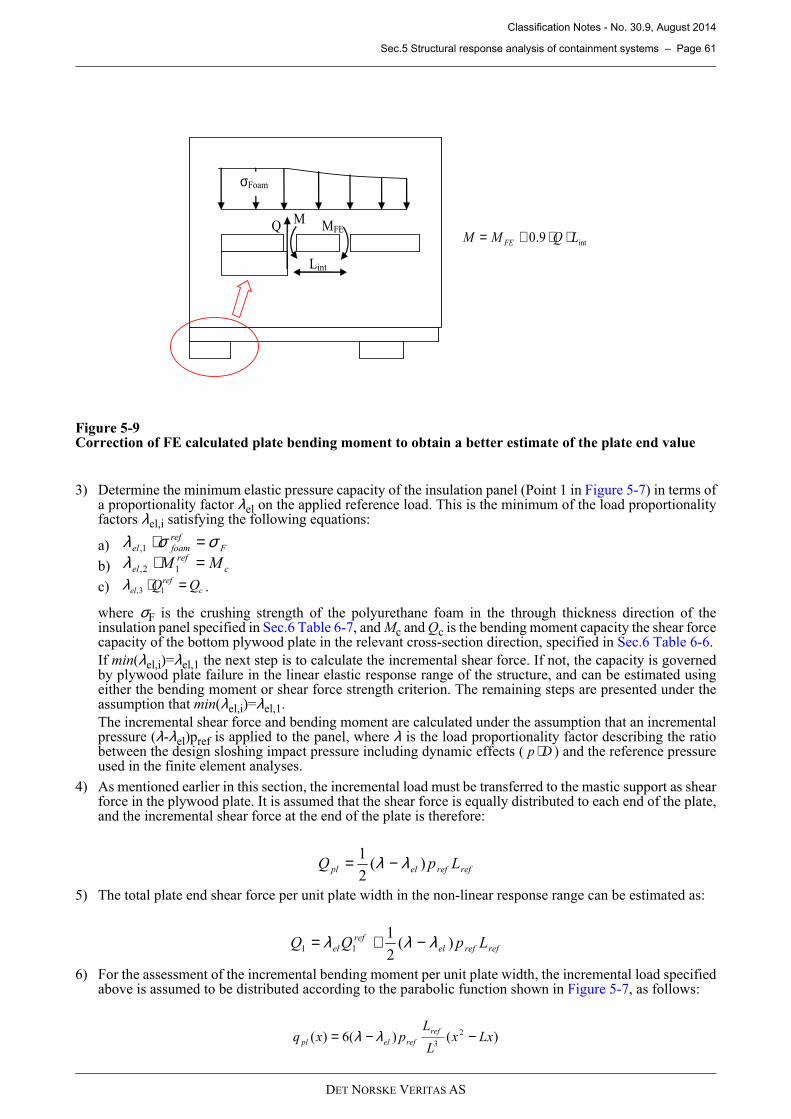
Classification Notes - No. 30.9, August 2014
Sec.5 Structural response analysis of containment systems – Page 61
DET NORSKE VERITAS AS
Figure 5-9Correction of FE calculated plate bending moment to obtain a better estimate of the plate end value
3) Determine the minimum elastic pressure capacity of the insulation panel (Point 1 in Figure 5-7 ) in terms ofa proportionality factor λel on the applied reference load. This is the minimum of the load proportionalityfactors λel,i satisfying the following equations:
a)
b)
c) .
where σF is the crushing strength of the polyurethane foam in the through thickness direction of theinsulation panel specified in Sec.6 Table 6-7, and Mc and Qc is the bending moment capacity the shear forcecapacity of the bottom plywood plate in the relevant cross-section direction, specified in Sec.6 Table 6-6.
If min(λel,i)=λel,1 the next step is to calculate the incremental shear force. If not, the capacity is governedby plywood plate failure in the linear elastic response range of the structure, and can be estimated usingeither the bending moment or shear force strength criterion. The remaining steps are presented under theassumption that min(λel,i)=λel,1.
The incremental shear force and bending moment are calculated under the assumption that an incrementalpressure (λ-λel)pref is applied to the panel, where λ is the load proportionality factor describing the ratiobetween the design sloshing impact pressure including dynamic effects ( ) and the reference pressureused in the finite element analyses.
4) As mentioned earlier in this section, the incremental load must be transferred to the mastic support as shearforce in the plywood plate. It is assumed that the shear force is equally distributed to each end of the plate,and the incremental shear force at the end of the plate is therefore:
5) The total plate end shear force per unit plate width in the non-linear response range can be estimated as:
6) For the assessment of the incremental bending moment per unit plate width, the incremental load specifiedabove is assumed to be distributed according to the parabolic function shown in Figure 5-7 , as follows:
MFE Q
Lint
σFoam
M
int9.0 LQMM FE ⋅⋅+=
F
ref
foamel σσλ =⋅1,
c
ref
el MM =⋅ 12,λc
ref
el QQ =⋅ 13,λ
Dp ⋅
refrefelpl LpQ )(2
1 λλ −=
refrefel
ref
el LpQQ )(2
111 λλλ −+=
)()(6)( 2
3Lxx
L
Lpxq
ref
refelpl −−= λλ
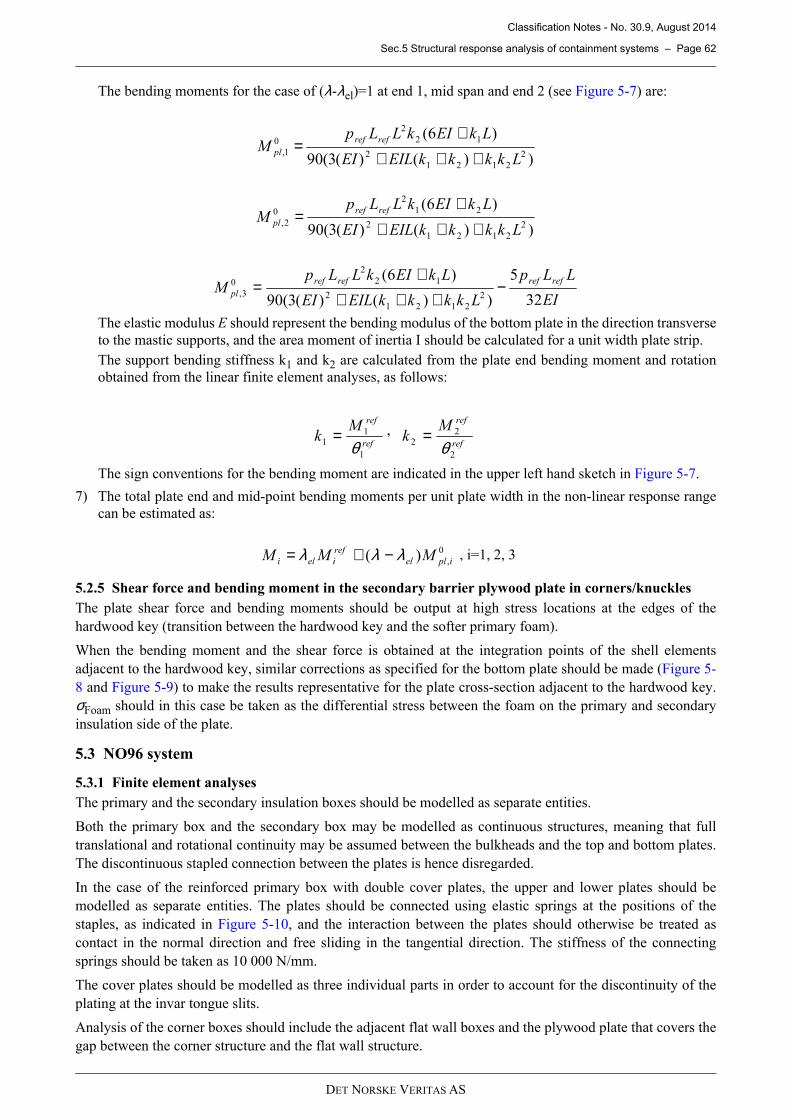
Classification Notes - No. 30.9, August 2014
Sec.5 Structural response analysis of containment systems – Page 62
DET NORSKE VERITAS AS
The bending moments for the case of (λ-λel)=1 at end 1, mid span and end 2 (see Figure 5-7) are:
The elastic modulus E should represent the bending modulus of the bottom plate in the direction transverse
to the mastic supports, and the area moment of inertia I should be calculated for a unit width plate strip.
The support bending stiffness k1 and k2 are calculated from the plate end bending moment and rotation
obtained from the linear finite element analyses, as follows:
The sign conventions for the bending moment are indicated in the upper left hand sketch in Figure 5-7.
7) The total plate end and mid-point bending moments per unit plate width in the non-linear response range
can be estimated as:
5.2.5 Shear force and bending moment in the secondary barrier plywood plate in corners/knuckles
The plate shear force and bending moments should be output at high stress locations at the edges of the
hardwood key (transition between the hardwood key and the softer primary foam).
When the bending moment and the shear force is obtained at the integration points of the shell elements
adjacent to the hardwood key, similar corrections as specified for the bottom plate should be made (Figure 5-
8 and Figure 5-9 ) to make the results representative for the plate cross-section adjacent to the hardwood key.
σFoam should in this case be taken as the differential stress between the foam on the primary and secondary
insulation side of the plate.
5.3 NO96 system
5.3.1 Finite element analyses
The primary and the secondary insulation boxes should be modelled as separate entities.
Both the primary box and the secondary box may be modelled as continuous structures, meaning that full
translational and rotational continuity may be assumed between the bulkheads and the top and bottom plates.
The discontinuous stapled connection between the plates is hence disregarded.
In the case of the reinforced primary box with double cover plates, the upper and lower plates should be
modelled as separate entities. The plates should be connected using elastic springs at the positions of the
staples, as indicated in Figure 5-10 , and the interaction between the plates should otherwise be treated as
contact in the normal direction and free sliding in the tangential direction. The stiffness of the connecting
springs should be taken as 10 000 N/mm.
The cover plates should be modelled as three individual parts in order to account for the discontinuity of the
plating at the invar tongue slits.
Analysis of the corner boxes should include the adjacent flat wall boxes and the plywood plate that covers the
gap between the corner structure and the flat wall structure.
))()(3(90
)6(
2
2121
2
12
2
0
1,LkkkkEILEI
LkEIkLLpM
refref
pl ++++
=
))()(3(90
)6(
2
2121
2
21
2
0
2,LkkkkEILEI
LkEIkLLpM
refref
pl ++++
=
EI
LLp
LkkkkEILEI
LkEIkLLpM
refrefrefref
pl32
5
))()(3(90
)6(
2
2121
2
12
2
0
3, −+++
+=
ref
refMk
1
11 θ
=ref
refMk
2
22 θ
=,
0
,)( iplel
ref
ieli MMM λλλ −+= , i=1, 2, 3
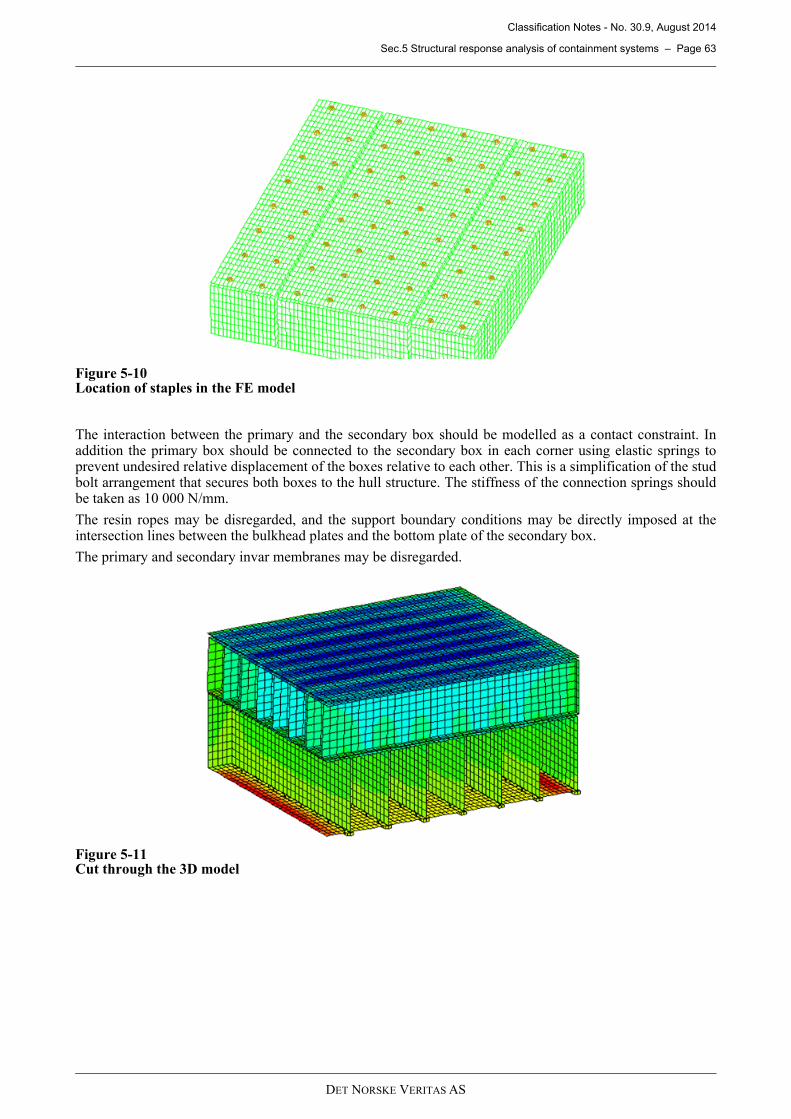
Classification Notes - No. 30.9, August 2014
Sec.5 Structural response analysis of containment systems – Page 63
DET NORSKE VERITAS AS
Figure 5-10Location of staples in the FE model
The interaction between the primary and the secondary box should be modelled as a contact constraint. Inaddition the primary box should be connected to the secondary box in each corner using elastic springs toprevent undesired relative displacement of the boxes relative to each other. This is a simplification of the studbolt arrangement that secures both boxes to the hull structure. The stiffness of the connection springs shouldbe taken as 10 000 N/mm.
The resin ropes may be disregarded, and the support boundary conditions may be directly imposed at theintersection lines between the bulkhead plates and the bottom plate of the secondary box.
The primary and secondary invar membranes may be disregarded.
Figure 5-11Cut through the 3D model

Classification Notes - No. 30.9, August 2014
Sec.5 Structural response analysis of containment systems – Page 64
DET NORSKE VERITAS AS
Figure 5-12Modelling of staples in the FE model
The NO96 insulation boxes should be modelled using 4 node shell elements. The mesh requirements are asfollows:
Cover plates:
— At least 7 elements between the vertical bulkheads of the primary box.— The element aspect ratio for the cover plate should not exceed 2.0, and should be determined based on the
bulkhead plate mesh requirements given below.
Primary box bulkheads:
— The element mesh should be congruent with the mesh in the cover plates.— At least 7 elements should be used across the height of the bulkhead plates.— The elements in the bulkheads should as far as possible be square.
Secondary box:
— At least 9 elements should be used across the height of the secondary bulkheads.— The elements in the bulkhead plates should as far as possible be square.
The following displacement restraints shall be imposed on the model:
— The secondary box are to be fixed in the vertical direction at the intersection lines between the bulkheadplates and the bottom plate of the secondary box. In case the resin ropes are included in the model the samecondition should be enforced at the bottom of the resin rope elements.
— A minimum restraint against in-plane translation and rigid body rotation of the model should be imposedat two of the bottom corners of the secondary box.
The plywood material may either be modelled as a homogeneous linear orthotropic elastic material, or as a 0-90 laminate of layers of orthotropic elastic materials. In the former case the cover plate stiffness should berepresented by the bending stiffness moduli of the plate, whereas the membrane stiffness moduli should be usedfor all other components. Material properties are given in [5.4], and should be selected based on the materialdirections specified in Figure 5-13 unless other directions are specified on the drawings.
Spring
Node
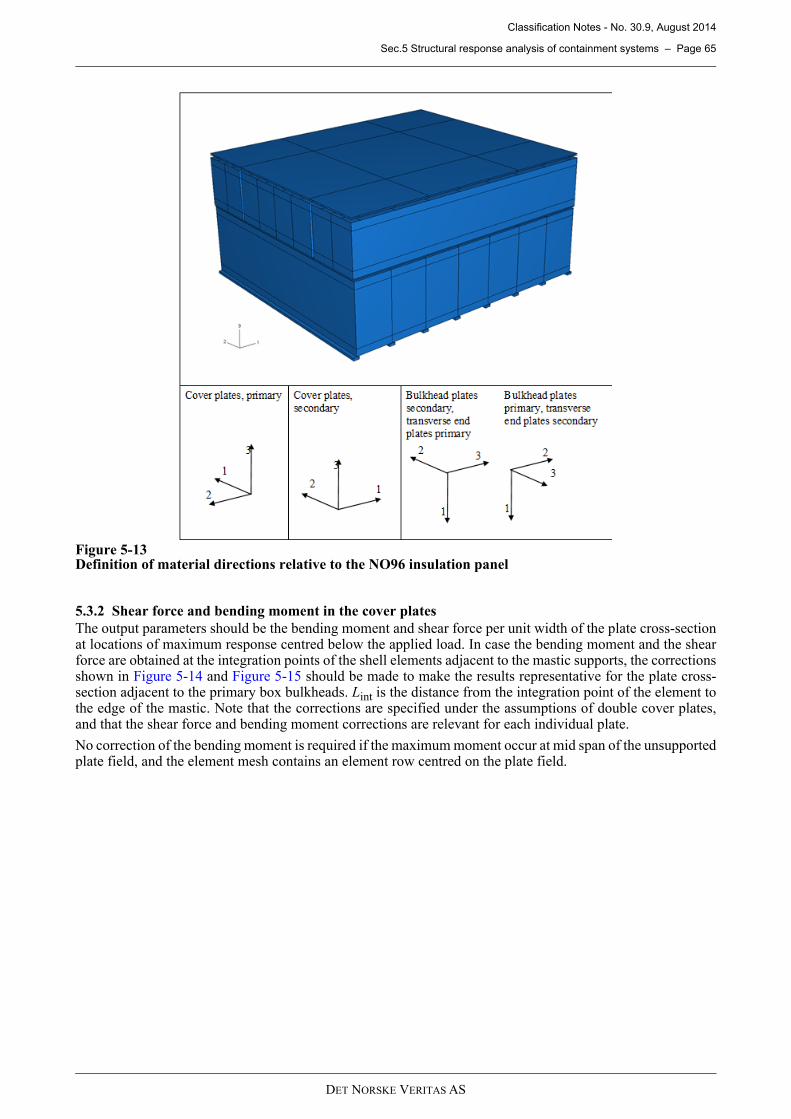
Classification Notes - No. 30.9, August 2014
Sec.5 Structural response analysis of containment systems – Page 65
DET NORSKE VERITAS AS
Figure 5-13Definition of material directions relative to the NO96 insulation panel
5.3.2 Shear force and bending moment in the cover plates
The output parameters should be the bending moment and shear force per unit width of the plate cross-sectionat locations of maximum response centred below the applied load. In case the bending moment and the shearforce are obtained at the integration points of the shell elements adjacent to the mastic supports, the correctionsshown in Figure 5-14 and Figure 5-15 should be made to make the results representative for the plate cross-section adjacent to the primary box bulkheads. Lint is the distance from the integration point of the element tothe edge of the mastic. Note that the corrections are specified under the assumptions of double cover plates,and that the shear force and bending moment corrections are relevant for each individual plate.
No correction of the bending moment is required if the maximum moment occur at mid span of the unsupportedplate field, and the element mesh contains an element row centred on the plate field.
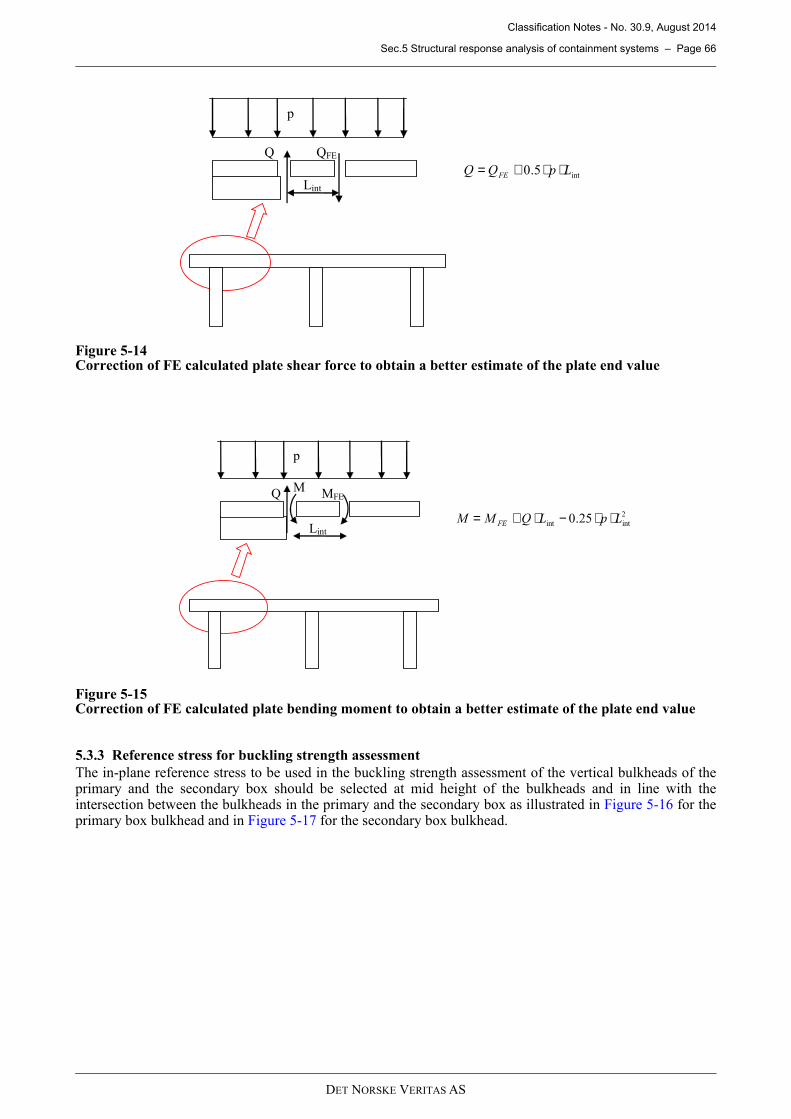
Classification Notes - No. 30.9, August 2014
Sec.5 Structural response analysis of containment systems – Page 66
DET NORSKE VERITAS AS
Figure 5-14Correction of FE calculated plate shear force to obtain a better estimate of the plate end value
Figure 5-15Correction of FE calculated plate bending moment to obtain a better estimate of the plate end value
5.3.3 Reference stress for buckling strength assessment
The in-plane reference stress to be used in the buckling strength assessment of the vertical bulkheads of theprimary and the secondary box should be selected at mid height of the bulkheads and in line with theintersection between the bulkheads in the primary and the secondary box as illustrated in Figure 5-16 for theprimary box bulkhead and in Figure 5-17 for the secondary box bulkhead.
QFE Q
Lint
p
int5.0 LpQQ FE ⋅⋅+=
MFE Q
Lint
M
p
2
intint 25.0 LpLQMM FE ⋅⋅−⋅+=
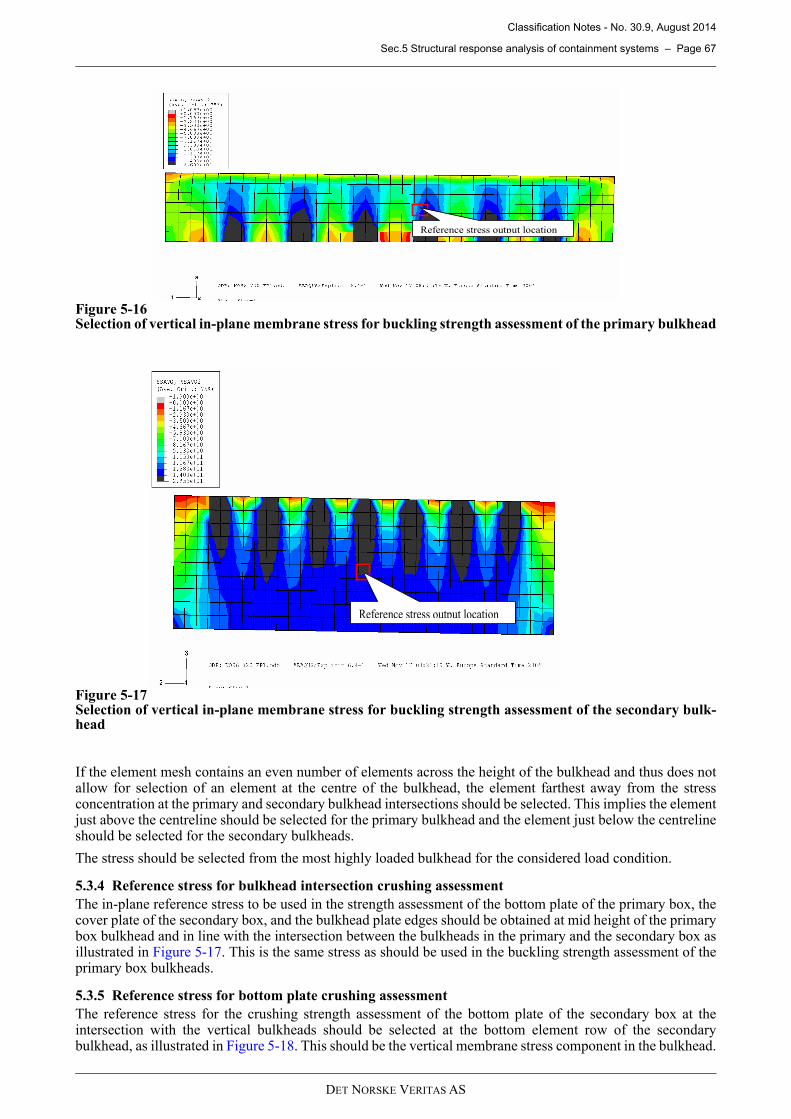
Classification Notes - No. 30.9, August 2014
Sec.5 Structural response analysis of containment systems – Page 67
DET NORSKE VERITAS AS
Figure 5-16Selection of vertical in-plane membrane stress for buckling strength assessment of the primary bulkhead
Figure 5-17Selection of vertical in-plane membrane stress for buckling strength assessment of the secondary bulk-head
If the element mesh contains an even number of elements across the height of the bulkhead and thus does notallow for selection of an element at the centre of the bulkhead, the element farthest away from the stressconcentration at the primary and secondary bulkhead intersections should be selected. This implies the elementjust above the centreline should be selected for the primary bulkhead and the element just below the centrelineshould be selected for the secondary bulkheads.
The stress should be selected from the most highly loaded bulkhead for the considered load condition.
5.3.4 Reference stress for bulkhead intersection crushing assessment
The in-plane reference stress to be used in the strength assessment of the bottom plate of the primary box, thecover plate of the secondary box, and the bulkhead plate edges should be obtained at mid height of the primarybox bulkhead and in line with the intersection between the bulkheads in the primary and the secondary box asillustrated in Figure 5-17 . This is the same stress as should be used in the buckling strength assessment of theprimary box bulkheads.
5.3.5 Reference stress for bottom plate crushing assessment
The reference stress for the crushing strength assessment of the bottom plate of the secondary box at theintersection with the vertical bulkheads should be selected at the bottom element row of the secondarybulkhead, as illustrated in Figure 5-18 . This should be the vertical membrane stress component in the bulkhead.
Reference stress output location
Reference stress output location
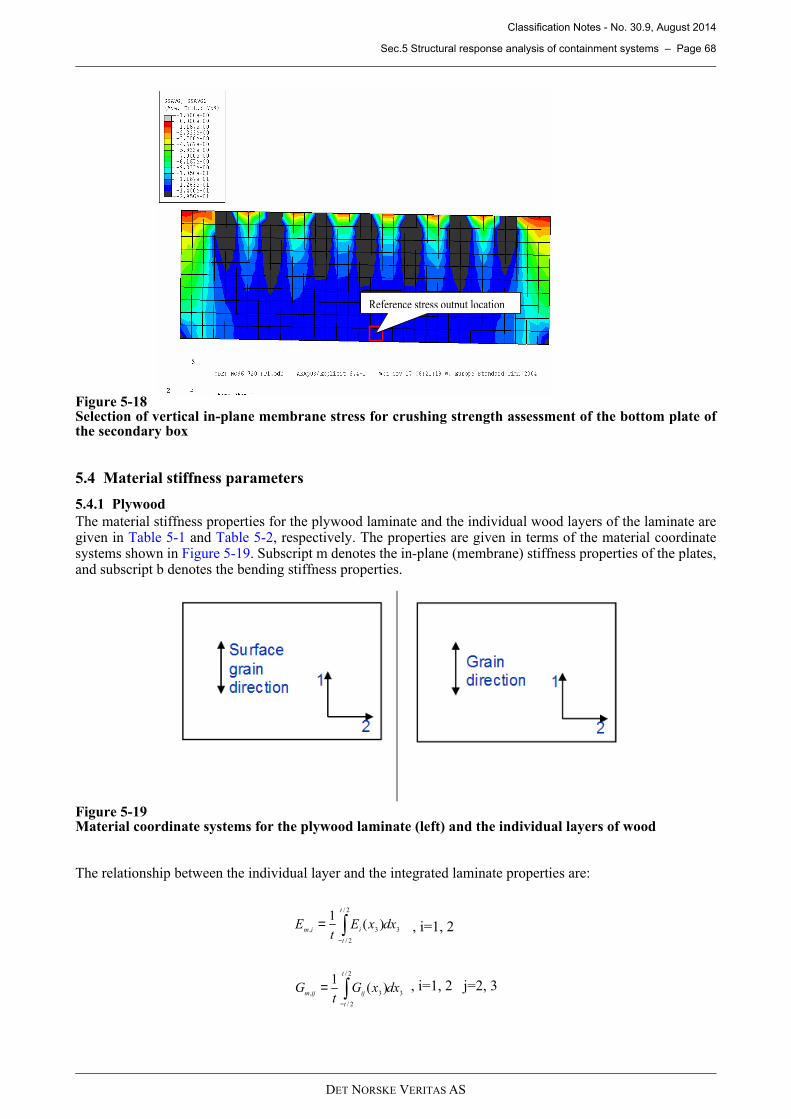
Classification Notes - No. 30.9, August 2014
Sec.5 Structural response analysis of containment systems – Page 68
DET NORSKE VERITAS AS
Figure 5-18Selection of vertical in-plane membrane stress for crushing strength assessment of the bottom plate ofthe secondary box
5.4 Material stiffness parameters
5.4.1 Plywood
The material stiffness properties for the plywood laminate and the individual wood layers of the laminate aregiven in Table 5-1 and Table 5-2, respectively. The properties are given in terms of the material coordinatesystems shown in Figure 5-19 . Subscript m denotes the in-plane (membrane) stiffness properties of the plates,and subscript b denotes the bending stiffness properties.
Figure 5-19Material coordinate systems for the plywood laminate (left) and the individual layers of wood
The relationship between the individual layer and the integrated laminate properties are:
Reference stress output location
3
2/
2/
3,)(
1dxxE
tE
t
t
iim ∫−
= , i=1, 2
3
2/
2/
3,)(
1dxxG
tG
t
t
ijijm ∫−
= , i=1, 2 j=2, 3
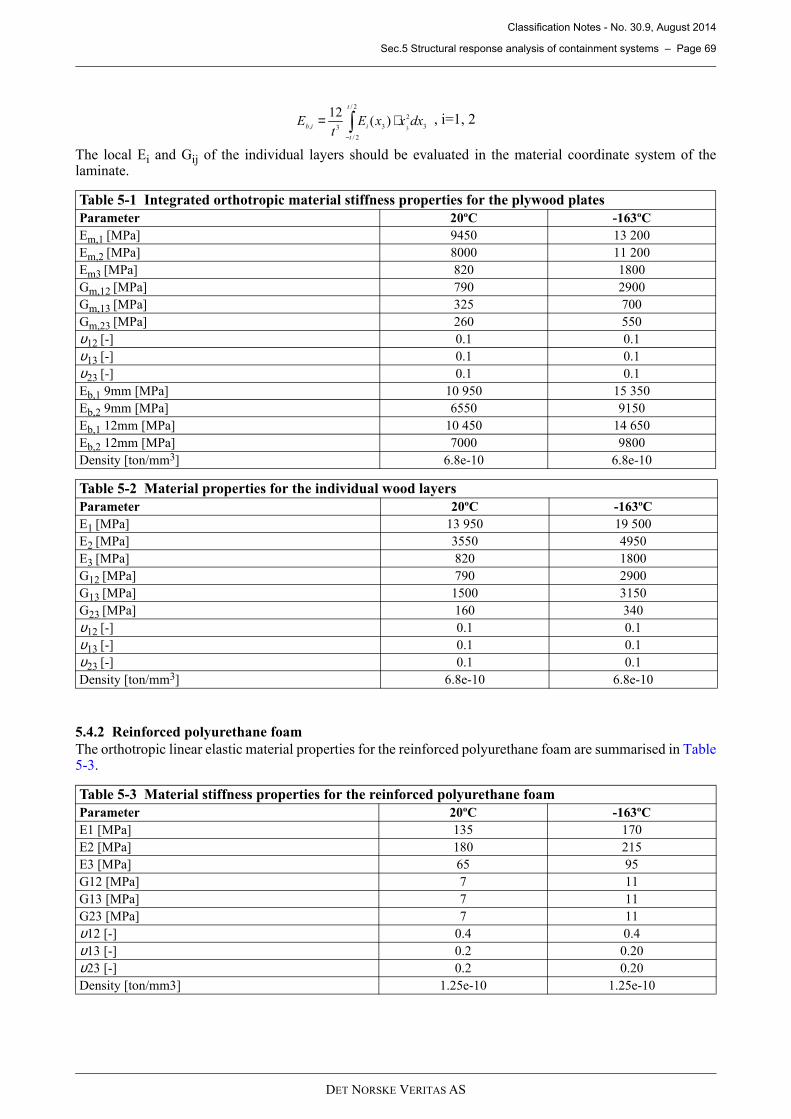
Classification Notes - No. 30.9, August 2014
Sec.5 Structural response analysis of containment systems – Page 69
DET NORSKE VERITAS AS
The local Ei and Gij of the individual layers should be evaluated in the material coordinate system of thelaminate.
5.4.2 Reinforced polyurethane foam
The orthotropic linear elastic material properties for the reinforced polyurethane foam are summarised in Table5-3.
Table 5-1 Integrated orthotropic material stiffness properties for the plywood plates
Parameter 20ºC -163ºC
Em,1 [MPa] 9450 13 200
Em,2 [MPa] 8000 11 200
Em3 [MPa] 820 1800
Gm,12 [MPa] 790 2900
Gm,13 [MPa] 325 700
Gm,23 [MPa] 260 550
υ12 [-] 0.1 0.1
υ13 [-] 0.1 0.1
υ23 [-] 0.1 0.1
Eb,1 9mm [MPa] 10 950 15 350
Eb,2 9mm [MPa] 6550 9150
Eb,1 12mm [MPa] 10 450 14 650
Eb,2 12mm [MPa] 7000 9800
Density [ton/mm3] 6.8e-10 6.8e-10
Table 5-2 Material properties for the individual wood layers
Parameter 20ºC -163ºC
E1 [MPa] 13 950 19 500
E2 [MPa] 3550 4950
E3 [MPa] 820 1800
G12 [MPa] 790 2900
G13 [MPa] 1500 3150
G23 [MPa] 160 340
υ12 [-] 0.1 0.1
υ13 [-] 0.1 0.1
υ23 [-] 0.1 0.1
Density [ton/mm3] 6.8e-10 6.8e-10
Table 5-3 Material stiffness properties for the reinforced polyurethane foam
Parameter 20ºC -163ºC
E1 [MPa] 135 170
E2 [MPa] 180 215
E3 [MPa] 65 95
G12 [MPa] 7 11
G13 [MPa] 7 11
G23 [MPa] 7 11
υ12 [-] 0.4 0.4
υ13 [-] 0.2 0.20
υ23 [-] 0.2 0.20
Density [ton/mm3] 1.25e-10 1.25e-10
3
2
2/
2/
33, 3)(
12dxxxE
tE
t
t
iib⋅= ∫
−
, i=1, 2
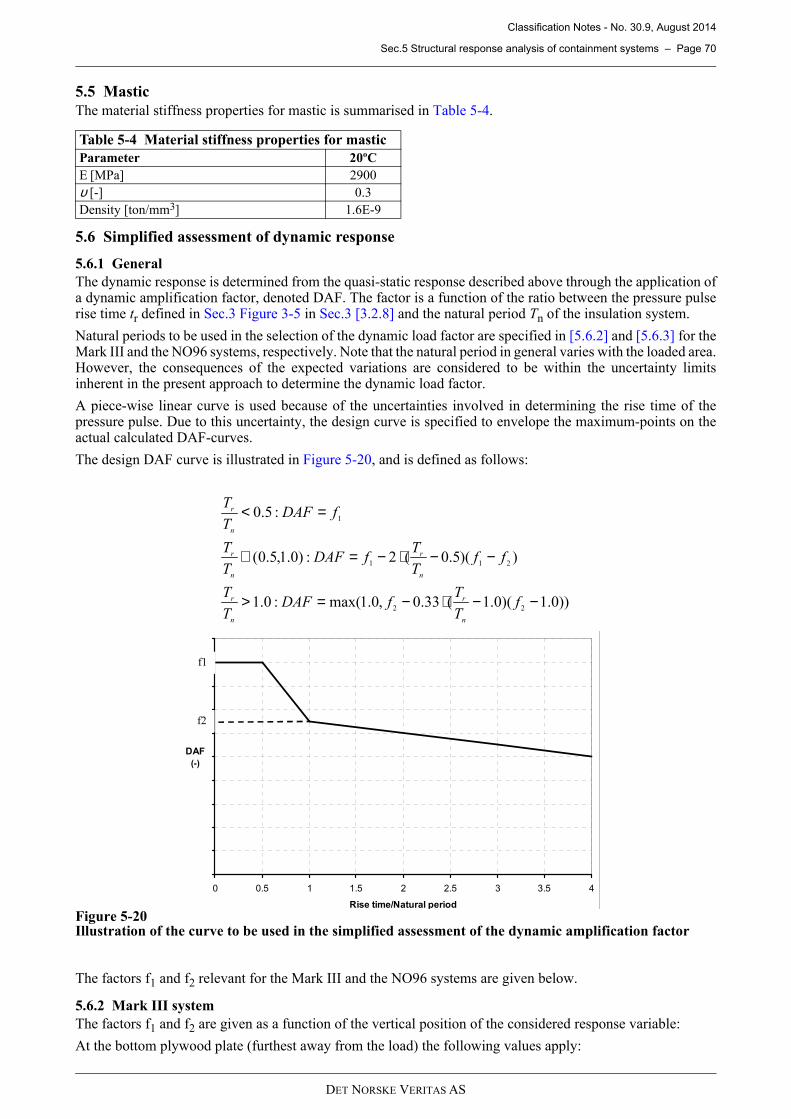
Classification Notes - No. 30.9, August 2014
Sec.5 Structural response analysis of containment systems – Page 70
DET NORSKE VERITAS AS
5.5 Mastic
The material stiffness properties for mastic is summarised in Table 5-4.
5.6 Simplified assessment of dynamic response
5.6.1 General
The dynamic response is determined from the quasi-static response described above through the application ofa dynamic amplification factor, denoted DAF. The factor is a function of the ratio between the pressure pulserise time tr defined in Sec.3 Figure 3-5 in Sec.3 [3.2.8] and the natural period Tn of the insulation system.
Natural periods to be used in the selection of the dynamic load factor are specified in [5.6.2] and [5.6.3] for theMark III and the NO96 systems, respectively. Note that the natural period in general varies with the loaded area.However, the consequences of the expected variations are considered to be within the uncertainty limitsinherent in the present approach to determine the dynamic load factor.
A piece-wise linear curve is used because of the uncertainties involved in determining the rise time of thepressure pulse. Due to this uncertainty, the design curve is specified to envelope the maximum-points on theactual calculated DAF-curves.
The design DAF curve is illustrated in Figure 5-20, and is defined as follows:
Figure 5-20Illustration of the curve to be used in the simplified assessment of the dynamic amplification factor
The factors f1 and f2 relevant for the Mark III and the NO96 systems are given below.
5.6.2 Mark III system
The factors f1 and f2 are given as a function of the vertical position of the considered response variable:
At the bottom plywood plate (furthest away from the load) the following values apply:
Table 5-4 Material stiffness properties for mastic
Parameter 20ºC
E [MPa] 2900
υ [-] 0.3
Density [ton/mm3] 1.6E-9
))0.1)(0.1(33.0,0.1max(:0.1
))(5.0(2:)0.1,5.0(
:5.0
22
211
1
−−⋅−=>
−−⋅−=∈
=<
fT
TfDAF
T
T
ffT
TfDAF
T
T
fDAFT
T
n
r
n
r
n
r
n
r
n
r
0 0.5 1 1.5 2 2.5 3 3.5 4
Rise time/Natural period
DAF
(-)
f1
f2

Classification Notes - No. 30.9, August 2014
Sec.6 Ultimate strength of containment systems – Page 71
DET NORSKE VERITAS AS
f1=1.65
f2=1.25
At the upper plywood plate (closest to the load) the following values apply:
f1=1.25
f2=1.1
Linear interpolation may be applied when response variables in between the top and bottom are considered.
For moderate design modifications of the system including changes of the mastic support spacing and thebottom plate thickness the natural period to be used in the assessment of the dynamic load factor can be takenas 2.0 milliseconds.
More radical design modifications require that the natural period is established by dynamic finite elementanalyses.
5.6.3 NO96 system
The factors f1 and f2 are functions of the vertical position of the considered response variable, as given in thefollowing.
At the mid part of the secondary box bulkhead:
f1=1.6
f2=1.2
At the mid part of the primary box bulkhead:
f1=1.2
f2=1.05
At the cover plywood plates (closest to the load):
f1=1.4
f2=1.1
Linear interpolation may be applied when response variables in between the top and bottom are considered.
For moderate design modifications of the system including changes of the internal bulkhead plate thickness thenatural period to be used in the assessment of the dynamic load factor can be taken as 1.3 milliseconds.
More radical design modifications require that the natural period is established by dynamic finite elementanalyses.
6 Ultimate strength of containment systems
6.1 General
Acceptance criteria for the ultimate strength assessment of the Mark III and the NO96 insulation systems aregiven in [6.3] and [6.4], respectively.
Note that the acceptance criteria specified for the Mark III system in [6.3] is also applicable to the CS 1 system,but that the comparative strength assessment methodology cannot be applied to this system.
[6.2] gives guidance on how to use the acceptance criteria to calculate the load capacity of the insulation systemas needed to determine the load level for the reference case in the comparative assessment (see Sec.2 [2.4]).
6.2 Capacity assessment
The load capacity of the insulation systems in terms of peak impact pressure for a given impact area size shouldbe calculated based on the strength acceptance criteria given in this section, as follows:
1) Calculate the design capacity of each relevant response parameter including dynamic effects by solving thelimit state equations for the maximum allowable dynamic response parameter.
2) Invert the quasi-static response analysis to determine the surface pressures corresponding to the criticalresponse. This will be the maximum effective dynamic pressure the insulation system can sustain.
3) Calculate the peak pressure capacity for each considered impact area by dividing the effective dynamicpressure capacity by the relevant dynamic factor.
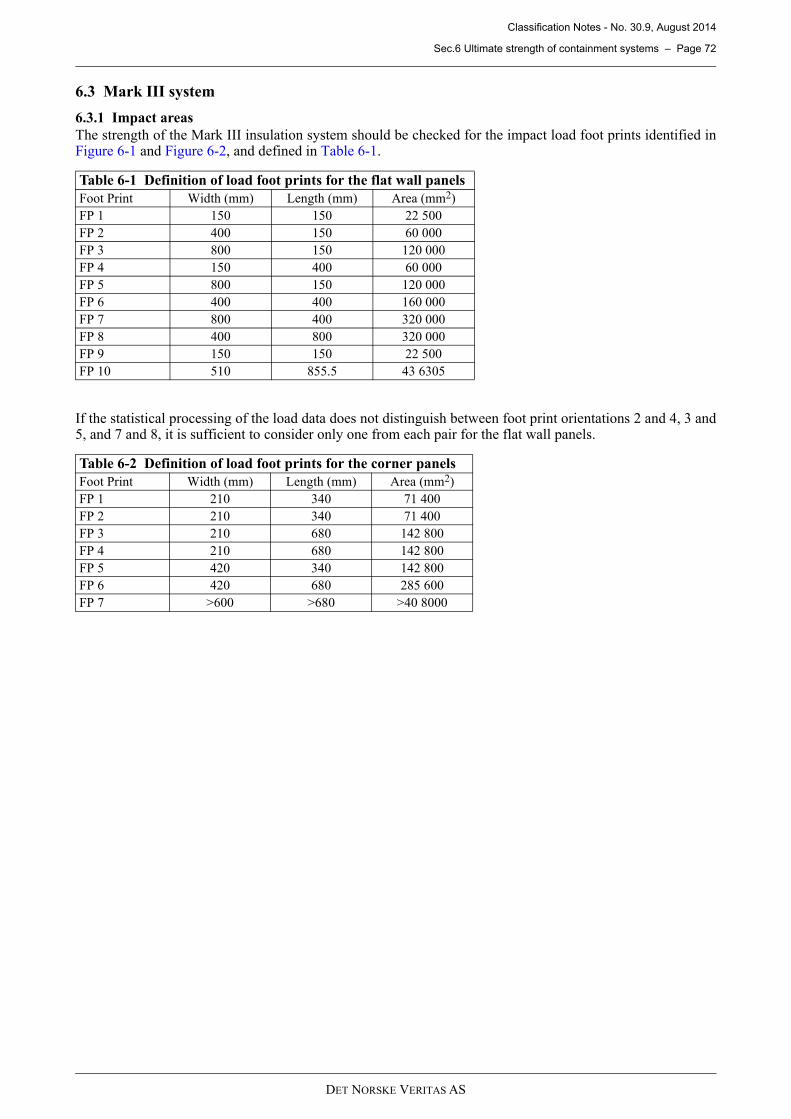
Classification Notes - No. 30.9, August 2014
Sec.6 Ultimate strength of containment systems – Page 72
DET NORSKE VERITAS AS
6.3 Mark III system
6.3.1 Impact areas
The strength of the Mark III insulation system should be checked for the impact load foot prints identified inFigure 6-1 and Figure 6-2 , and defined in Table 6-1.
If the statistical processing of the load data does not distinguish between foot print orientations 2 and 4, 3 and5, and 7 and 8, it is sufficient to consider only one from each pair for the flat wall panels.
Table 6-1 Definition of load foot prints for the flat wall panels
Foot Print Width (mm) Length (mm) Area (mm2)
FP 1 150 150 22 500
FP 2 400 150 60 000
FP 3 800 150 120 000
FP 4 150 400 60 000
FP 5 800 150 120 000
FP 6 400 400 160 000
FP 7 800 400 320 000
FP 8 400 800 320 000
FP 9 150 150 22 500
FP 10 510 855.5 43 6305
Table 6-2 Definition of load foot prints for the corner panels
Foot Print Width (mm) Length (mm) Area (mm2)
FP 1 210 340 71 400
FP 2 210 340 71 400
FP 3 210 680 142 800
FP 4 210 680 142 800
FP 5 420 340 142 800
FP 6 420 680 285 600
FP 7 >600 >680 >40 8000
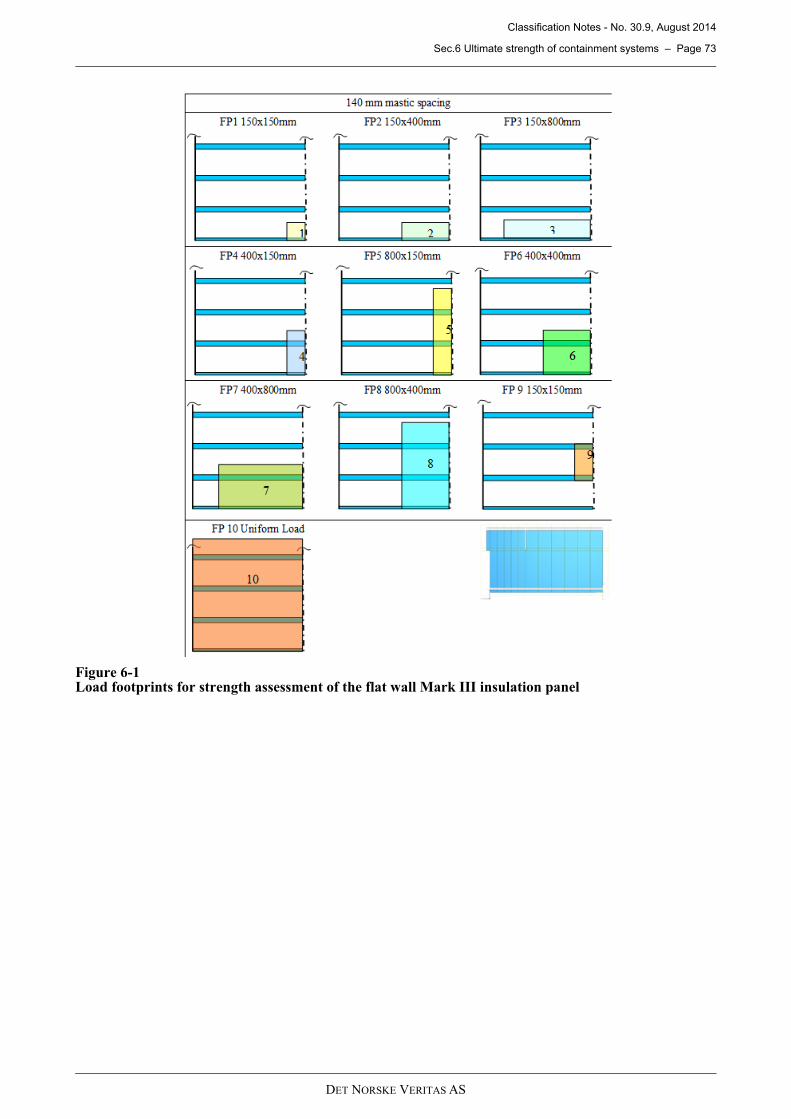
Classification Notes - No. 30.9, August 2014
Sec.6 Ultimate strength of containment systems – Page 73
DET NORSKE VERITAS AS
Figure 6-1Load footprints for strength assessment of the flat wall Mark III insulation panel
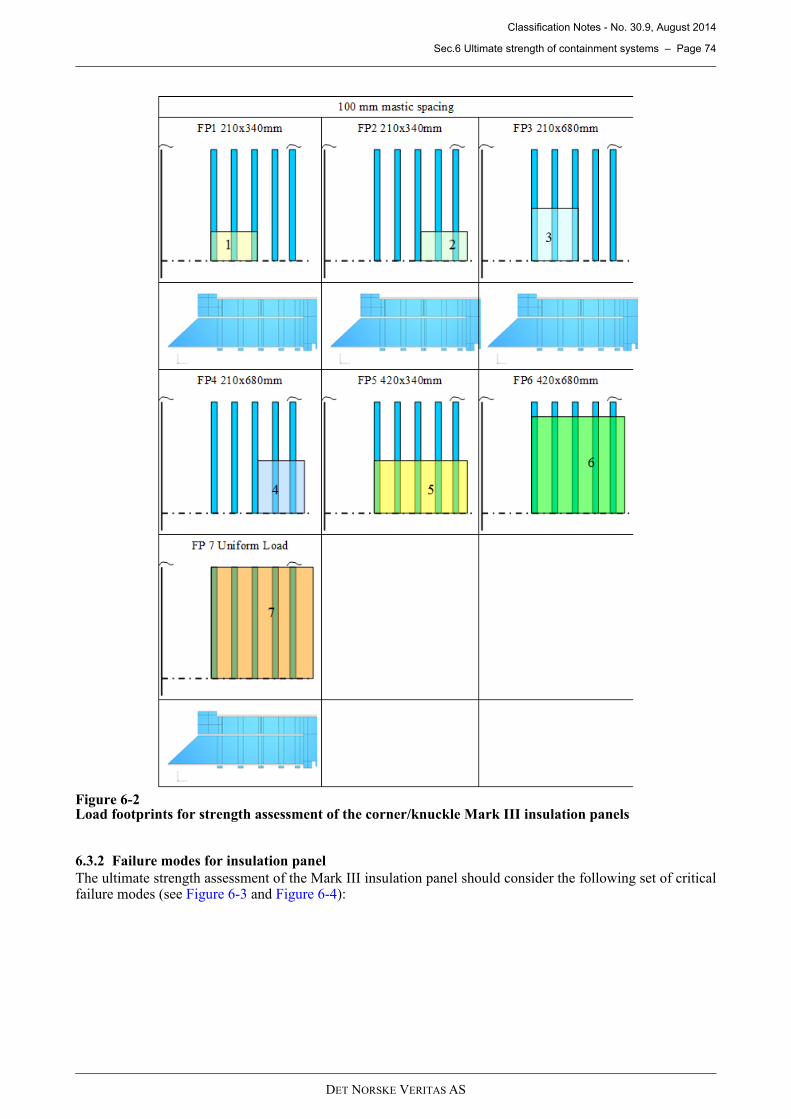
Classification Notes - No. 30.9, August 2014
Sec.6 Ultimate strength of containment systems – Page 74
DET NORSKE VERITAS AS
Figure 6-2Load footprints for strength assessment of the corner/knuckle Mark III insulation panels
6.3.2 Failure modes for insulation panel
The ultimate strength assessment of the Mark III insulation panel should consider the following set of criticalfailure modes (see Figure 6-3 and Figure 6-4 ):
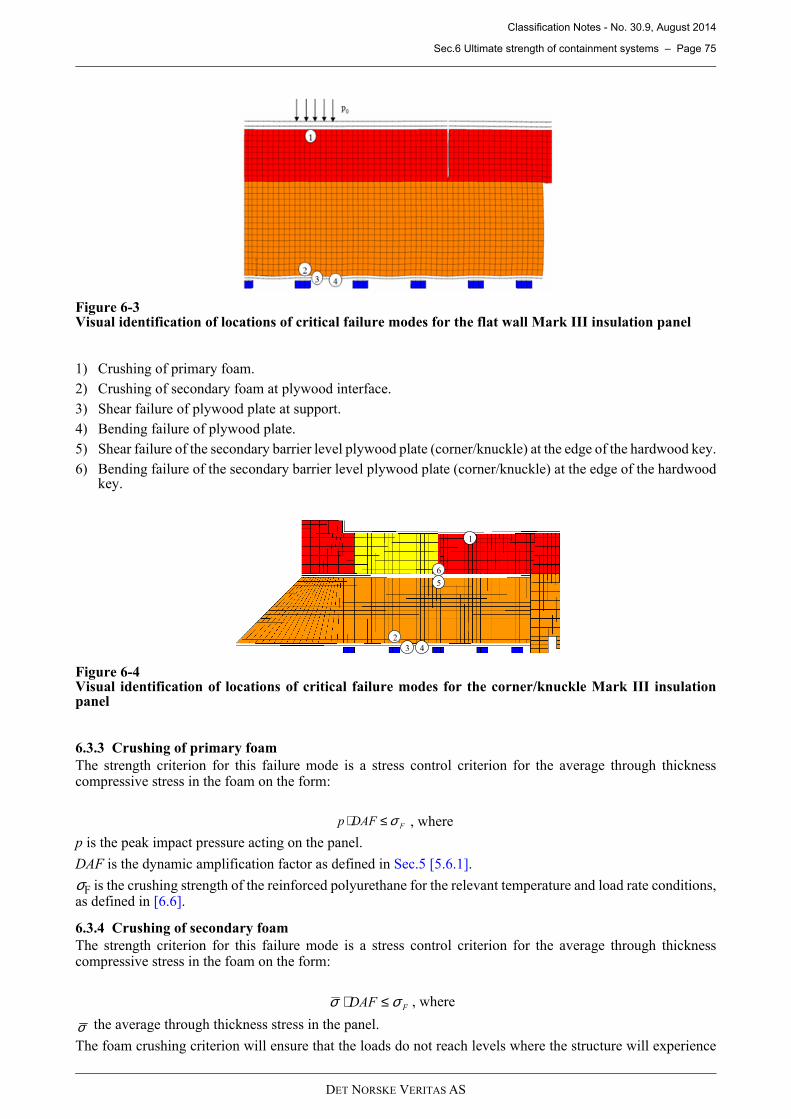
Classification Notes - No. 30.9, August 2014
Sec.6 Ultimate strength of containment systems – Page 75
DET NORSKE VERITAS AS
Figure 6-3Visual identification of locations of critical failure modes for the flat wall Mark III insulation panel
1) Crushing of primary foam.
2) Crushing of secondary foam at plywood interface.
3) Shear failure of plywood plate at support.
4) Bending failure of plywood plate.
5) Shear failure of the secondary barrier level plywood plate (corner/knuckle) at the edge of the hardwood key.
6) Bending failure of the secondary barrier level plywood plate (corner/knuckle) at the edge of the hardwoodkey.
Figure 6-4Visual identification of locations of critical failure modes for the corner/knuckle Mark III insulationpanel
6.3.3 Crushing of primary foam
The strength criterion for this failure mode is a stress control criterion for the average through thicknesscompressive stress in the foam on the form:
p is the peak impact pressure acting on the panel.
DAF is the dynamic amplification factor as defined in Sec.5 [5.6.1].
σF is the crushing strength of the reinforced polyurethane for the relevant temperature and load rate conditions,as defined in [6.6].
6.3.4 Crushing of secondary foam
The strength criterion for this failure mode is a stress control criterion for the average through thicknesscompressive stress in the foam on the form:
the average through thickness stress in the panel.
The foam crushing criterion will ensure that the loads do not reach levels where the structure will experience
1
2
3 4
5
6
FDAFp σ≤⋅ , where
FDAF σσ ≤⋅ , where
σ
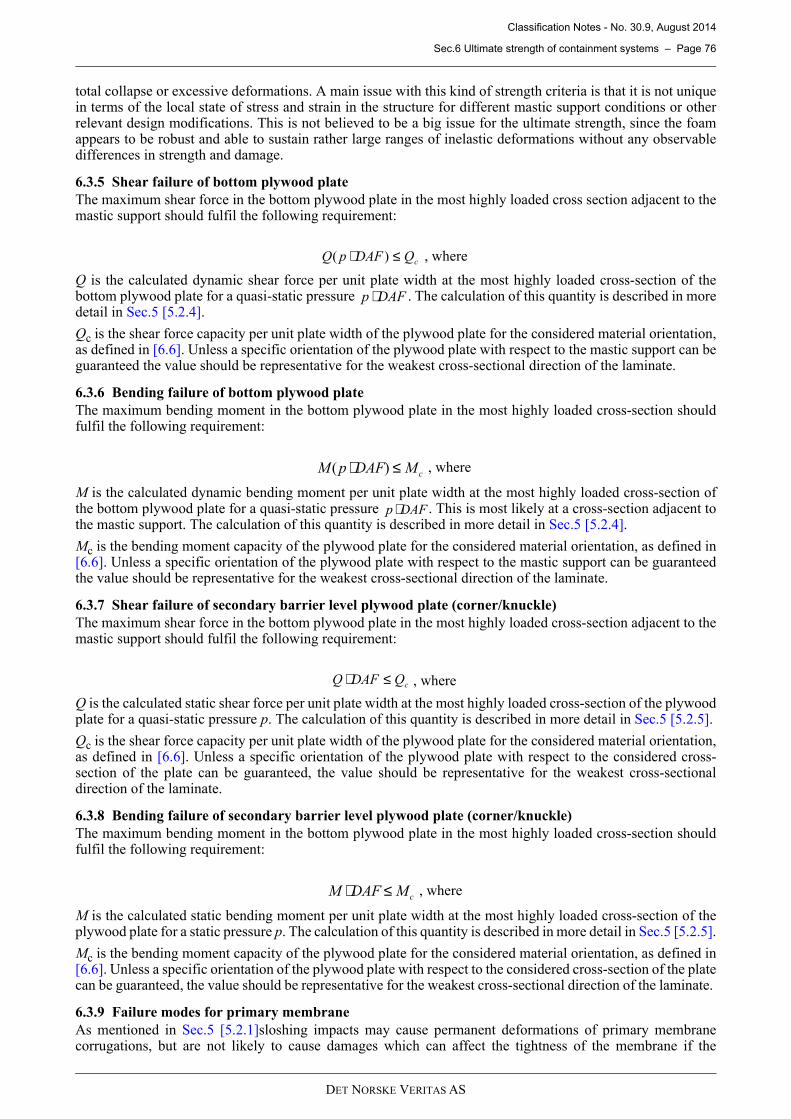
Classification Notes - No. 30.9, August 2014
Sec.6 Ultimate strength of containment systems – Page 76
DET NORSKE VERITAS AS
total collapse or excessive deformations. A main issue with this kind of strength criteria is that it is not uniquein terms of the local state of stress and strain in the structure for different mastic support conditions or otherrelevant design modifications. This is not believed to be a big issue for the ultimate strength, since the foamappears to be robust and able to sustain rather large ranges of inelastic deformations without any observabledifferences in strength and damage.
6.3.5 Shear failure of bottom plywood plate
The maximum shear force in the bottom plywood plate in the most highly loaded cross section adjacent to themastic support should fulfil the following requirement:
Q is the calculated dynamic shear force per unit plate width at the most highly loaded cross-section of thebottom plywood plate for a quasi-static pressure . The calculation of this quantity is described in moredetail in Sec.5 [5.2.4].
Qc is the shear force capacity per unit plate width of the plywood plate for the considered material orientation,as defined in [6.6]. Unless a specific orientation of the plywood plate with respect to the mastic support can beguaranteed the value should be representative for the weakest cross-sectional direction of the laminate.
6.3.6 Bending failure of bottom plywood plate
The maximum bending moment in the bottom plywood plate in the most highly loaded cross-section shouldfulfil the following requirement:
M is the calculated dynamic bending moment per unit plate width at the most highly loaded cross-section ofthe bottom plywood plate for a quasi-static pressure . This is most likely at a cross-section adjacent tothe mastic support. The calculation of this quantity is described in more detail in Sec.5 [5.2.4].
Mc is the bending moment capacity of the plywood plate for the considered material orientation, as defined in[6.6]. Unless a specific orientation of the plywood plate with respect to the mastic support can be guaranteedthe value should be representative for the weakest cross-sectional direction of the laminate.
6.3.7 Shear failure of secondary barrier level plywood plate (corner/knuckle)
The maximum shear force in the bottom plywood plate in the most highly loaded cross-section adjacent to themastic support should fulfil the following requirement:
Q is the calculated static shear force per unit plate width at the most highly loaded cross-section of the plywoodplate for a quasi-static pressure p. The calculation of this quantity is described in more detail in Sec.5 [5.2.5].
Qc is the shear force capacity per unit plate width of the plywood plate for the considered material orientation,as defined in [6.6]. Unless a specific orientation of the plywood plate with respect to the considered cross-section of the plate can be guaranteed, the value should be representative for the weakest cross-sectionaldirection of the laminate.
6.3.8 Bending failure of secondary barrier level plywood plate (corner/knuckle)
The maximum bending moment in the bottom plywood plate in the most highly loaded cross-section shouldfulfil the following requirement:
M is the calculated static bending moment per unit plate width at the most highly loaded cross-section of theplywood plate for a static pressure p. The calculation of this quantity is described in more detail in Sec.5 [5.2.5].
Mc is the bending moment capacity of the plywood plate for the considered material orientation, as defined in[6.6]. Unless a specific orientation of the plywood plate with respect to the considered cross-section of the platecan be guaranteed, the value should be representative for the weakest cross-sectional direction of the laminate.
6.3.9 Failure modes for primary membrane
As mentioned in Sec.5 [5.2.1]sloshing impacts may cause permanent deformations of primary membranecorrugations, but are not likely to cause damages which can affect the tightness of the membrane if the
cQDAFpQ ≤⋅ )( , where
DAFp ⋅
cMDAFpM ≤⋅ )( , where
DAFp ⋅
cQDAFQ ≤⋅ , where
cMDAFM ≤⋅ , where
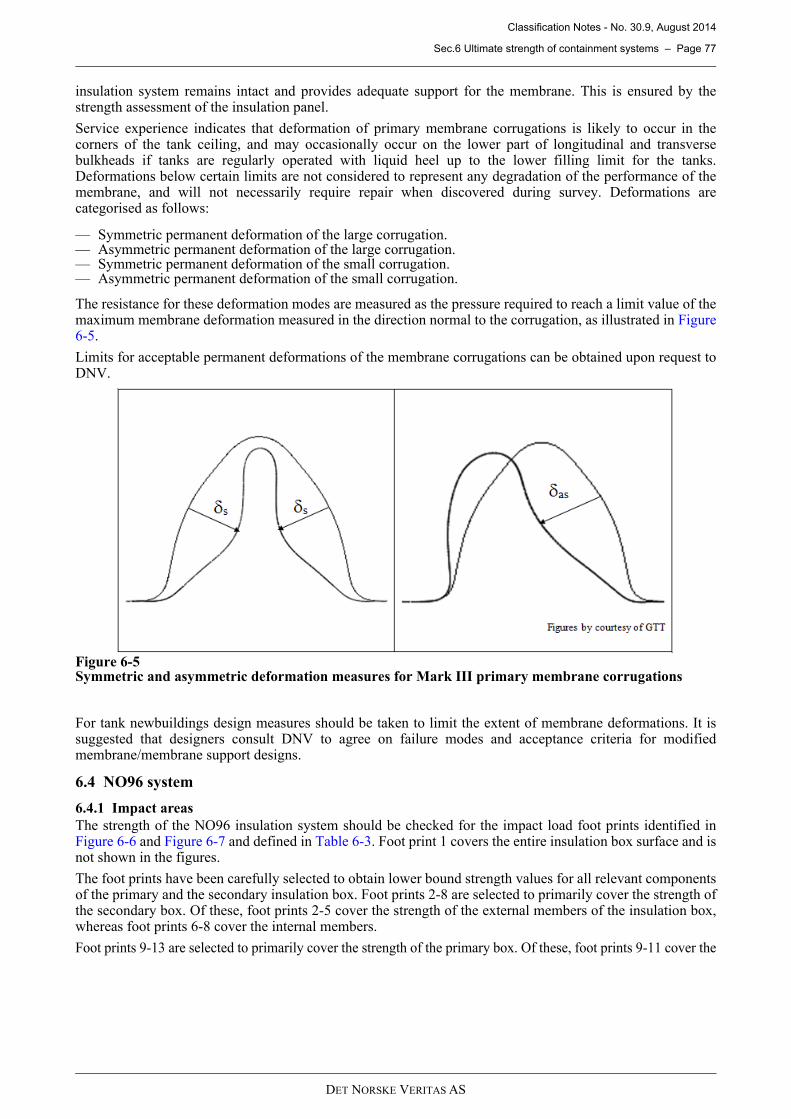
Classification Notes - No. 30.9, August 2014
Sec.6 Ultimate strength of containment systems – Page 77
DET NORSKE VERITAS AS
insulation system remains intact and provides adequate support for the membrane. This is ensured by thestrength assessment of the insulation panel.
Service experience indicates that deformation of primary membrane corrugations is likely to occur in thecorners of the tank ceiling, and may occasionally occur on the lower part of longitudinal and transversebulkheads if tanks are regularly operated with liquid heel up to the lower filling limit for the tanks.Deformations below certain limits are not considered to represent any degradation of the performance of themembrane, and will not necessarily require repair when discovered during survey. Deformations arecategorised as follows:
— Symmetric permanent deformation of the large corrugation.— Asymmetric permanent deformation of the large corrugation.— Symmetric permanent deformation of the small corrugation.— Asymmetric permanent deformation of the small corrugation.
The resistance for these deformation modes are measured as the pressure required to reach a limit value of themaximum membrane deformation measured in the direction normal to the corrugation, as illustrated in Figure6-5 .
Limits for acceptable permanent deformations of the membrane corrugations can be obtained upon request toDNV.
Figure 6-5Symmetric and asymmetric deformation measures for Mark III primary membrane corrugations
For tank newbuildings design measures should be taken to limit the extent of membrane deformations. It issuggested that designers consult DNV to agree on failure modes and acceptance criteria for modifiedmembrane/membrane support designs.
6.4 NO96 system
6.4.1 Impact areas
The strength of the NO96 insulation system should be checked for the impact load foot prints identified inFigure 6-6 and Figure 6-7 and defined in Table 6-3. Foot print 1 covers the entire insulation box surface and isnot shown in the figures.
The foot prints have been carefully selected to obtain lower bound strength values for all relevant componentsof the primary and the secondary insulation box. Foot prints 2-8 are selected to primarily cover the strength ofthe secondary box. Of these, foot prints 2-5 cover the strength of the external members of the insulation box,whereas foot prints 6-8 cover the internal members.
Foot prints 9-13 are selected to primarily cover the strength of the primary box. Of these, foot prints 9-11 cover the
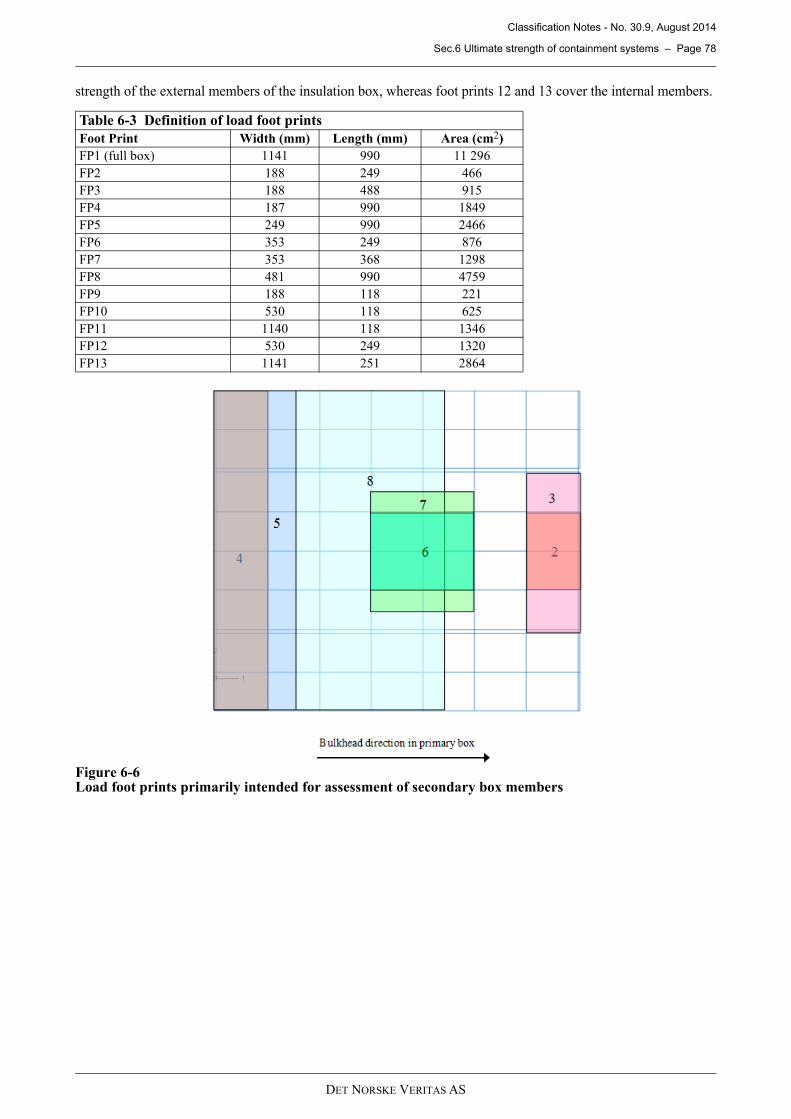
Classification Notes - No. 30.9, August 2014
Sec.6 Ultimate strength of containment systems – Page 78
DET NORSKE VERITAS AS
strength of the external members of the insulation box, whereas foot prints 12 and 13 cover the internal members.
Figure 6-6Load foot prints primarily intended for assessment of secondary box members
Table 6-3 Definition of load foot prints
Foot Print Width (mm) Length (mm) Area (cm2)
FP1 (full box) 1141 990 11 296
FP2 188 249 466
FP3 188 488 915
FP4 187 990 1849
FP5 249 990 2466
FP6 353 249 876
FP7 353 368 1298
FP8 481 990 4759
FP9 188 118 221
FP10 530 118 625
FP11 1140 118 1346
FP12 530 249 1320
FP13 1141 251 2864
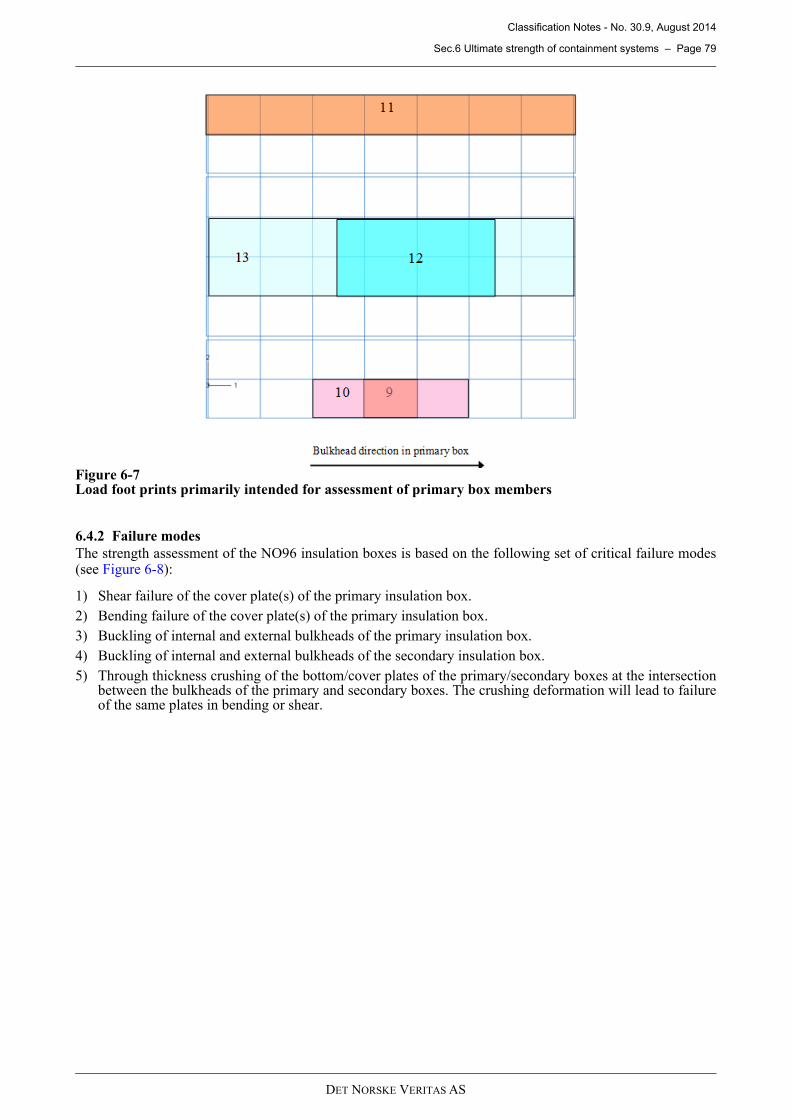
Classification Notes - No. 30.9, August 2014
Sec.6 Ultimate strength of containment systems – Page 79
DET NORSKE VERITAS AS
Figure 6-7Load foot prints primarily intended for assessment of primary box members
6.4.2 Failure modes
The strength assessment of the NO96 insulation boxes is based on the following set of critical failure modes(see Figure 6-8 ):
1) Shear failure of the cover plate(s) of the primary insulation box.
2) Bending failure of the cover plate(s) of the primary insulation box.
3) Buckling of internal and external bulkheads of the primary insulation box.
4) Buckling of internal and external bulkheads of the secondary insulation box.
5) Through thickness crushing of the bottom/cover plates of the primary/secondary boxes at the intersectionbetween the bulkheads of the primary and secondary boxes. The crushing deformation will lead to failureof the same plates in bending or shear.
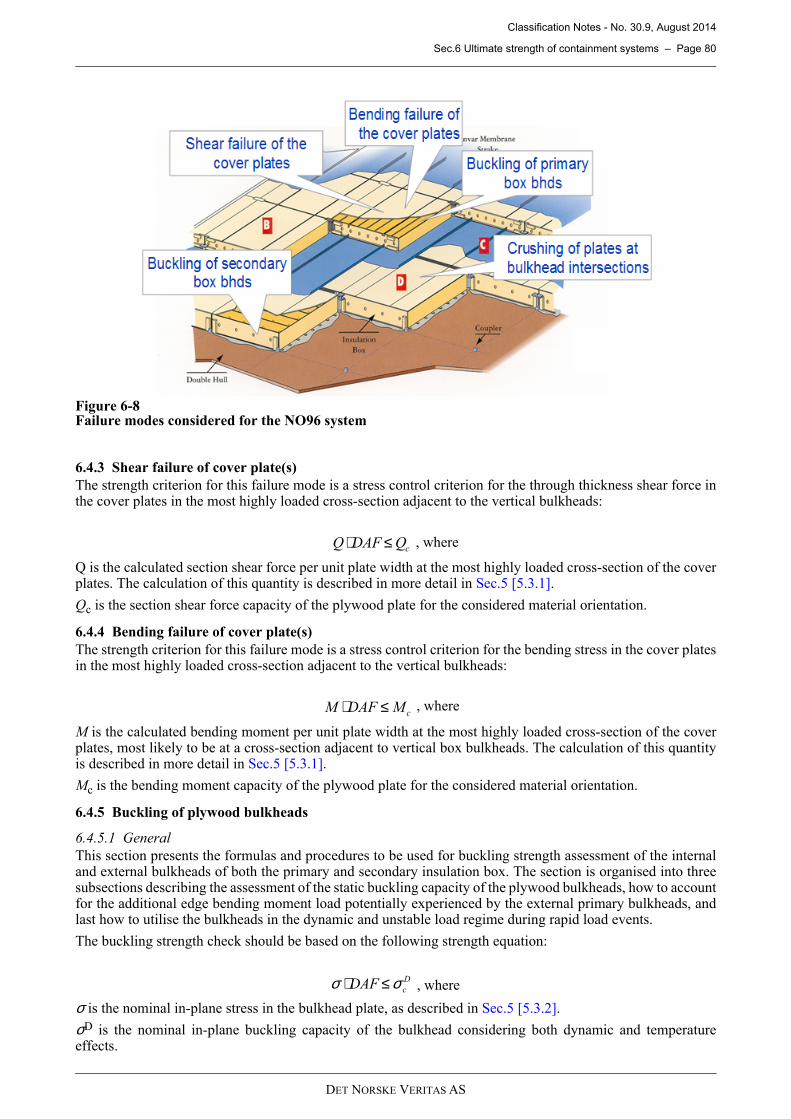
Classification Notes - No. 30.9, August 2014
Sec.6 Ultimate strength of containment systems – Page 80
DET NORSKE VERITAS AS
Figure 6-8Failure modes considered for the NO96 system
6.4.3 Shear failure of cover plate(s)
The strength criterion for this failure mode is a stress control criterion for the through thickness shear force inthe cover plates in the most highly loaded cross-section adjacent to the vertical bulkheads:
Q is the calculated section shear force per unit plate width at the most highly loaded cross-section of the coverplates. The calculation of this quantity is described in more detail in Sec.5 [5.3.1].
Qc is the section shear force capacity of the plywood plate for the considered material orientation.
6.4.4 Bending failure of cover plate(s)
The strength criterion for this failure mode is a stress control criterion for the bending stress in the cover platesin the most highly loaded cross-section adjacent to the vertical bulkheads:
M is the calculated bending moment per unit plate width at the most highly loaded cross-section of the coverplates, most likely to be at a cross-section adjacent to vertical box bulkheads. The calculation of this quantityis described in more detail in Sec.5 [5.3.1].
Mc is the bending moment capacity of the plywood plate for the considered material orientation.
6.4.5 Buckling of plywood bulkheads
6.4.5.1 General
This section presents the formulas and procedures to be used for buckling strength assessment of the internaland external bulkheads of both the primary and secondary insulation box. The section is organised into threesubsections describing the assessment of the static buckling capacity of the plywood bulkheads, how to accountfor the additional edge bending moment load potentially experienced by the external primary bulkheads, andlast how to utilise the bulkheads in the dynamic and unstable load regime during rapid load events.
The buckling strength check should be based on the following strength equation:
σ is the nominal in-plane stress in the bulkhead plate, as described in Sec.5 [5.3.2].
σD is the nominal in-plane buckling capacity of the bulkhead considering both dynamic and temperatureeffects.
cQDAFQ ≤⋅ , where
cMDAFM ≤⋅ , where
D
cDAF σσ ≤⋅ , where
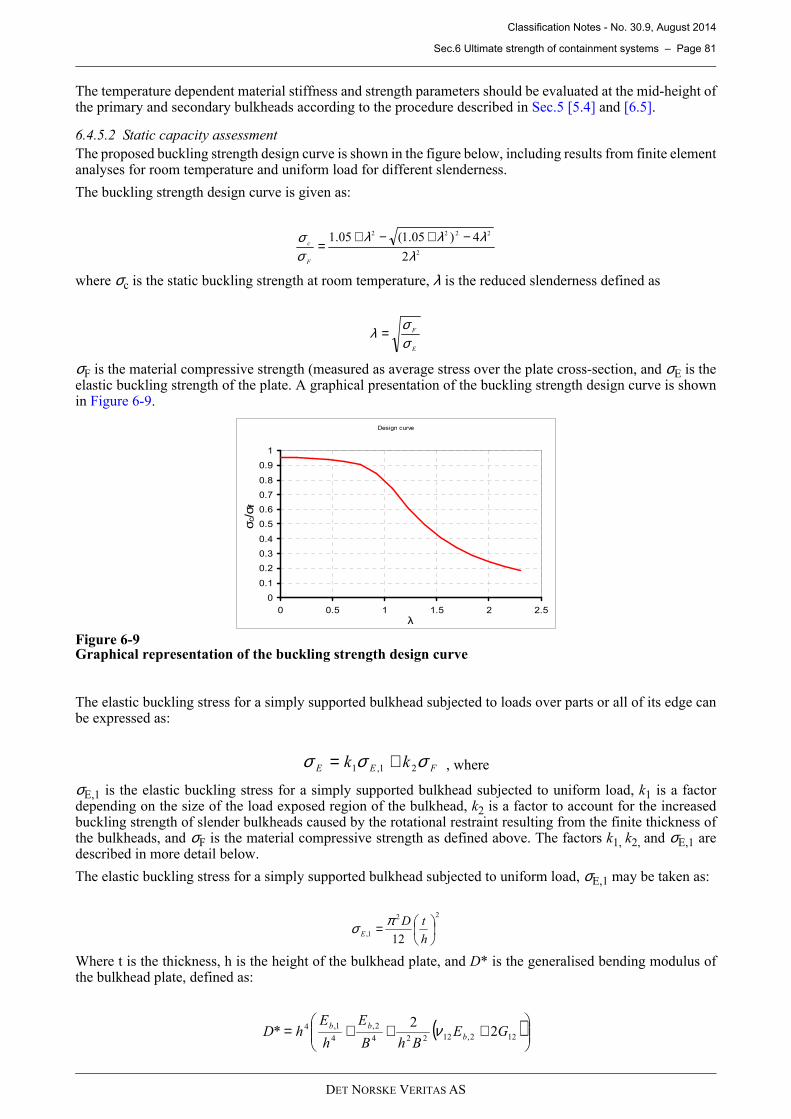
Classification Notes - No. 30.9, August 2014
Sec.6 Ultimate strength of containment systems – Page 81
DET NORSKE VERITAS AS
The temperature dependent material stiffness and strength parameters should be evaluated at the mid-height ofthe primary and secondary bulkheads according to the procedure described in Sec.5 [5.4] and [6.5].
6.4.5.2 Static capacity assessment
The proposed buckling strength design curve is shown in the figure below, including results from finite elementanalyses for room temperature and uniform load for different slenderness.
The buckling strength design curve is given as:
where σc is the static buckling strength at room temperature, λ is the reduced slenderness defined as
σF is the material compressive strength (measured as average stress over the plate cross-section, and σE is theelastic buckling strength of the plate. A graphical presentation of the buckling strength design curve is shownin Figure 6-9 .
Figure 6-9Graphical representation of the buckling strength design curve
The elastic buckling stress for a simply supported bulkhead subjected to loads over parts or all of its edge canbe expressed as:
σE,1 is the elastic buckling stress for a simply supported bulkhead subjected to uniform load, k1 is a factordepending on the size of the load exposed region of the bulkhead, k2 is a factor to account for the increasedbuckling strength of slender bulkheads caused by the rotational restraint resulting from the finite thickness ofthe bulkheads, and σF is the material compressive strength as defined above. The factors k1, k2, and σE,1 aredescribed in more detail below.
The elastic buckling stress for a simply supported bulkhead subjected to uniform load, σE,1 may be taken as:
Where t is the thickness, h is the height of the bulkhead plate, and D* is the generalised bending modulus ofthe bulkhead plate, defined as:
2
2222
2
4)05.1(05.1
λλλλ
σσ −+−+
=F
c
E
F
σσλ =
Design curve
0
0.1
0.2
0.3
0.4
0.5
0.6
0.7
0.8
0.9
1
0 0.5 1 1.5 2 2.5
λ
σ c/σ
f
FEE kk σσσ 21,1 += , where
22
1,12
=h
tDE
πσ
( )
+++= 122,12224
2,
4
1,4 22
* GEBhB
E
h
EhD b
bb ν
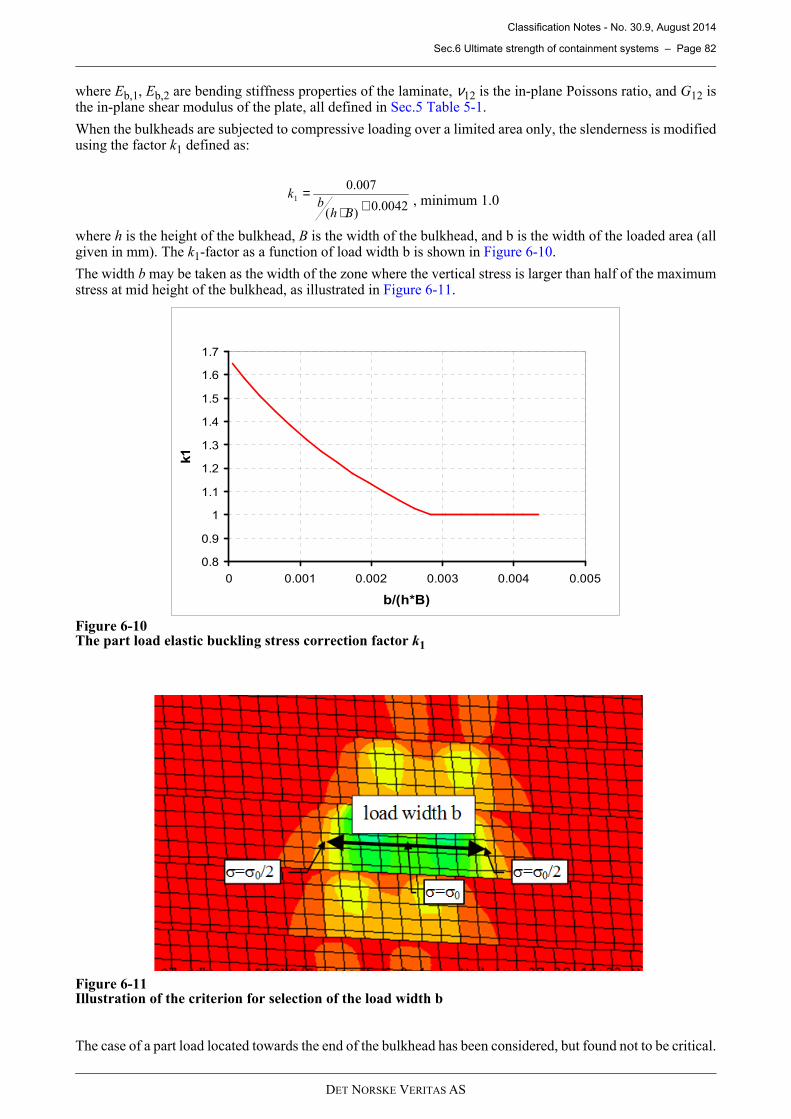
Classification Notes - No. 30.9, August 2014
Sec.6 Ultimate strength of containment systems – Page 82
DET NORSKE VERITAS AS
where Eb,1, Eb,2 are bending stiffness properties of the laminate, ν12 is the in-plane Poissons ratio, and G12 isthe in-plane shear modulus of the plate, all defined in Sec.5 Table 5-1.
When the bulkheads are subjected to compressive loading over a limited area only, the slenderness is modifiedusing the factor k1 defined as:
where h is the height of the bulkhead, B is the width of the bulkhead, and b is the width of the loaded area (allgiven in mm). The k1-factor as a function of load width b is shown in Figure 6-10 .
The width b may be taken as the width of the zone where the vertical stress is larger than half of the maximumstress at mid height of the bulkhead, as illustrated in Figure 6-11 .
Figure 6-10The part load elastic buckling stress correction factor k1
Figure 6-11Illustration of the criterion for selection of the load width b
The case of a part load located towards the end of the bulkhead has been considered, but found not to be critical.
0042.0)(
007.01
+⋅=
Bhb
k , minimum 1.0
0.8
0.9
1
1.1
1.2
1.3
1.4
1.5
1.6
1.7
0 0.001 0.002 0.003 0.004 0.005
b/(h*B)
k1
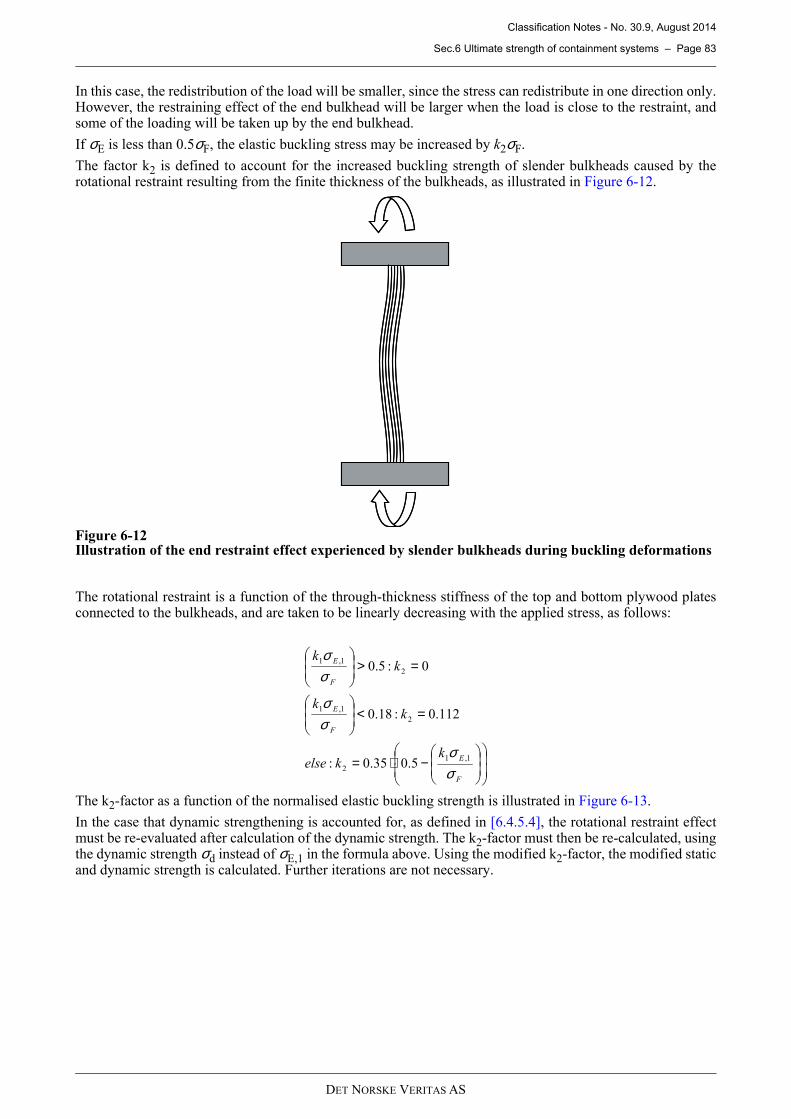
Classification Notes - No. 30.9, August 2014
Sec.6 Ultimate strength of containment systems – Page 83
DET NORSKE VERITAS AS
In this case, the redistribution of the load will be smaller, since the stress can redistribute in one direction only.However, the restraining effect of the end bulkhead will be larger when the load is close to the restraint, andsome of the loading will be taken up by the end bulkhead.
If σE is less than 0.5σF, the elastic buckling stress may be increased by k2σF.
The factor k2 is defined to account for the increased buckling strength of slender bulkheads caused by therotational restraint resulting from the finite thickness of the bulkheads, as illustrated in Figure 6-12 .
Figure 6-12Illustration of the end restraint effect experienced by slender bulkheads during buckling deformations
The rotational restraint is a function of the through-thickness stiffness of the top and bottom plywood platesconnected to the bulkheads, and are taken to be linearly decreasing with the applied stress, as follows:
The k2-factor as a function of the normalised elastic buckling strength is illustrated in Figure 6-13 .
In the case that dynamic strengthening is accounted for, as defined in [6.4.5.4], the rotational restraint effectmust be re-evaluated after calculation of the dynamic strength. The k2-factor must then be re-calculated, usingthe dynamic strength σd instead of σE,1 in the formula above. Using the modified k2-factor, the modified staticand dynamic strength is calculated. Further iterations are not necessary.
−⋅=
=<
=>
F
E
F
E
F
E
kkelse
kk
kk
σσ
σσ
σσ
1,1
2
2
1,1
2
1,1
5.035.0:
112.0:18.0
0:5.0
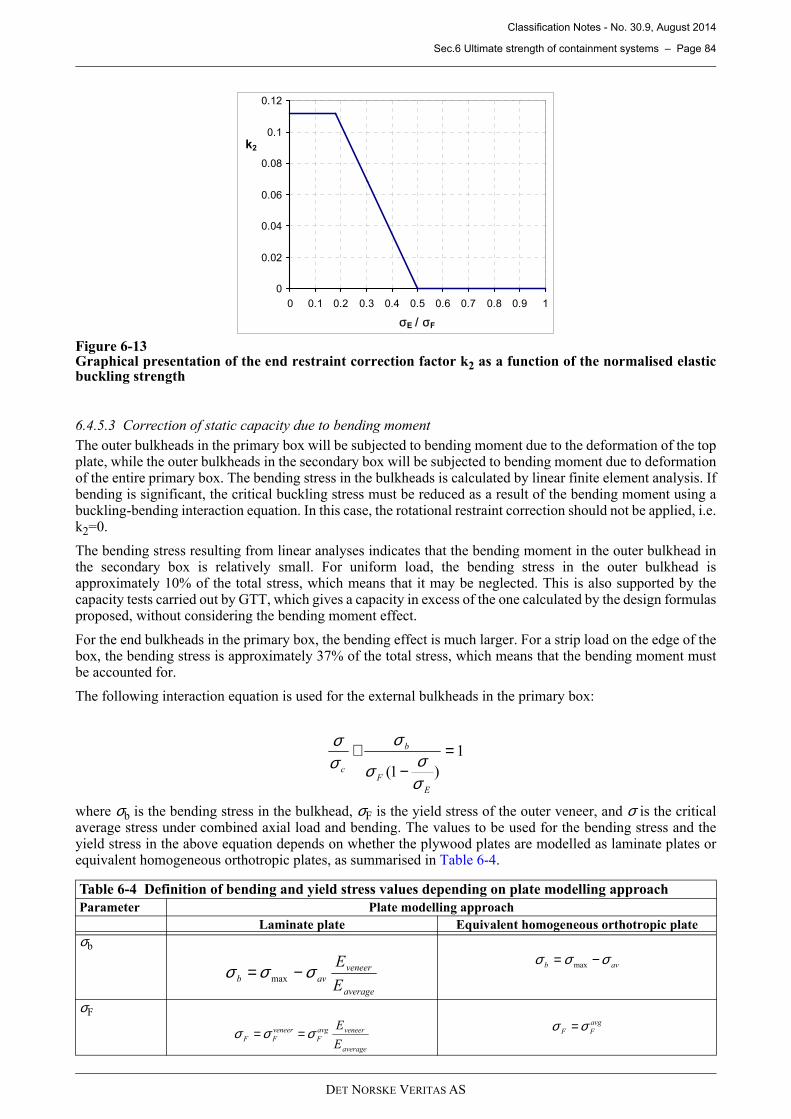
Classification Notes - No. 30.9, August 2014
Sec.6 Ultimate strength of containment systems – Page 84
DET NORSKE VERITAS AS
Figure 6-13Graphical presentation of the end restraint correction factor k2 as a function of the normalised elasticbuckling strength
6.4.5.3 Correction of static capacity due to bending moment
The outer bulkheads in the primary box will be subjected to bending moment due to the deformation of the topplate, while the outer bulkheads in the secondary box will be subjected to bending moment due to deformationof the entire primary box. The bending stress in the bulkheads is calculated by linear finite element analysis. Ifbending is significant, the critical buckling stress must be reduced as a result of the bending moment using abuckling-bending interaction equation. In this case, the rotational restraint correction should not be applied, i.e.k2=0.
The bending stress resulting from linear analyses indicates that the bending moment in the outer bulkhead inthe secondary box is relatively small. For uniform load, the bending stress in the outer bulkhead isapproximately 10% of the total stress, which means that it may be neglected. This is also supported by thecapacity tests carried out by GTT, which gives a capacity in excess of the one calculated by the design formulasproposed, without considering the bending moment effect.
For the end bulkheads in the primary box, the bending effect is much larger. For a strip load on the edge of thebox, the bending stress is approximately 37% of the total stress, which means that the bending moment mustbe accounted for.
The following interaction equation is used for the external bulkheads in the primary box:
where σb is the bending stress in the bulkhead, σF is the yield stress of the outer veneer, and σ is the criticalaverage stress under combined axial load and bending. The values to be used for the bending stress and theyield stress in the above equation depends on whether the plywood plates are modelled as laminate plates orequivalent homogeneous orthotropic plates, as summarised in Table 6-4.
Table 6-4 Definition of bending and yield stress values depending on plate modelling approach
Parameter Plate modelling approach
Laminate plate Equivalent homogeneous orthotropic plate
σb
σF
0
0.02
0.04
0.06
0.08
0.1
0.12
0 0.1 0.2 0.3 0.4 0.5 0.6 0.7 0.8 0.9 1
σE / σF
k2
1
)1(
=−
+
E
F
b
c
σσσ
σσσ
average
veneer
avbE
Eσσσ −= max
avb σσσ −= max
average
veneeravg
F
veneer
FFE
Eσσσ ==avg
FF σσ =
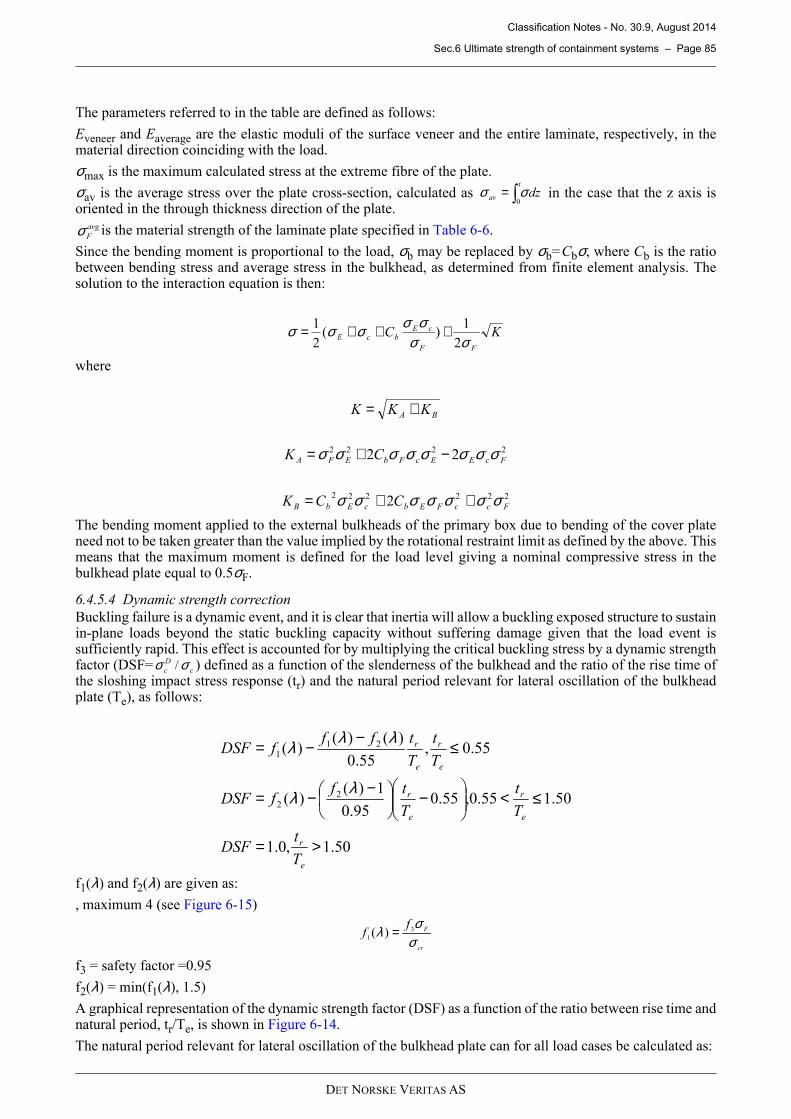
Classification Notes - No. 30.9, August 2014
Sec.6 Ultimate strength of containment systems – Page 85
DET NORSKE VERITAS AS
The parameters referred to in the table are defined as follows:
Eveneer and Eaverage are the elastic moduli of the surface veneer and the entire laminate, respectively, in thematerial direction coinciding with the load.
σmax is the maximum calculated stress at the extreme fibre of the plate.
σav is the average stress over the plate cross-section, calculated as in the case that the z axis isoriented in the through thickness direction of the plate.
is the material strength of the laminate plate specified in Table 6-6.
Since the bending moment is proportional to the load, σb may be replaced by σb=Cbσ, where Cb is the ratiobetween bending stress and average stress in the bulkhead, as determined from finite element analysis. Thesolution to the interaction equation is then:
where
The bending moment applied to the external bulkheads of the primary box due to bending of the cover plateneed not to be taken greater than the value implied by the rotational restraint limit as defined by the above. Thismeans that the maximum moment is defined for the load level giving a nominal compressive stress in thebulkhead plate equal to 0.5σF.
6.4.5.4 Dynamic strength correction
Buckling failure is a dynamic event, and it is clear that inertia will allow a buckling exposed structure to sustainin-plane loads beyond the static buckling capacity without suffering damage given that the load event issufficiently rapid. This effect is accounted for by multiplying the critical buckling stress by a dynamic strengthfactor (DSF= ) defined as a function of the slenderness of the bulkhead and the ratio of the rise time ofthe sloshing impact stress response (tr) and the natural period relevant for lateral oscillation of the bulkheadplate (Te), as follows:
f1(λ) and f2(λ) are given as:
, maximum 4 (see Figure 6-15 )
f3 = safety factor =0.95
f2(λ) = min(f1(λ), 1.5)
A graphical representation of the dynamic strength factor (DSF) as a function of the ratio between rise time andnatural period, tr/Te, is shown in Figure 6-14 .
The natural period relevant for lateral oscillation of the bulkhead plate can for all load cases be calculated as:
dzt
av ∫=0σσ
avg
Fσ
KCFF
cEbcE σσ
σσσσσ2
1)(
2
1 +++=
BA KKK +=
2222 22 FcEEcFbEFA CK σσσσσσσσ −+=
2222222 FccFEbcEbB CCK σσσσσσσ ++=
c
D
c σσ /
50.1,0.1
50.155.0,55.095.0
1)()(
55.0,55.0
)()()(
22
211
>=
≤<
−
−−=
≤−−=
e
r
e
r
e
r
e
r
e
r
T
tDSF
T
t
T
tffDSF
T
t
T
tfffDSF
λλ
λλλ
cr
Ff
fσσλ 3
1)( =
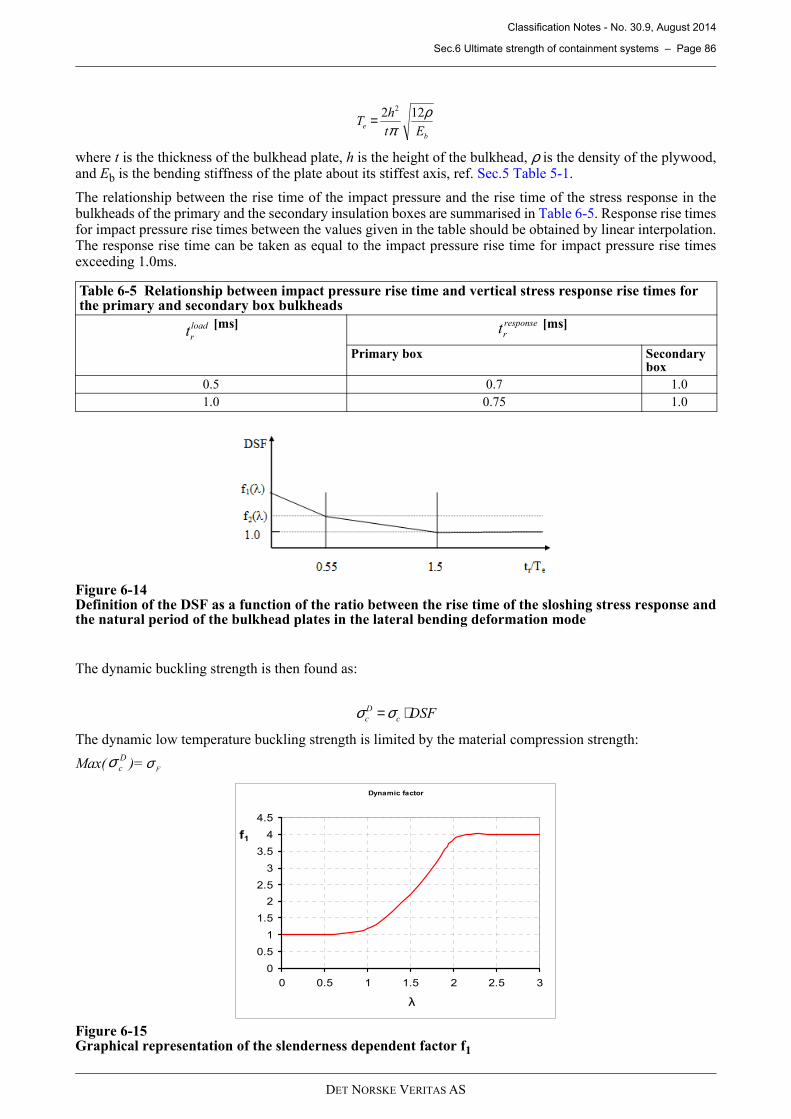
Classification Notes - No. 30.9, August 2014
Sec.6 Ultimate strength of containment systems – Page 86
DET NORSKE VERITAS AS
where t is the thickness of the bulkhead plate, h is the height of the bulkhead, ρ is the density of the plywood,and Eb is the bending stiffness of the plate about its stiffest axis, ref. Sec.5 Table 5-1.
The relationship between the rise time of the impact pressure and the rise time of the stress response in thebulkheads of the primary and the secondary insulation boxes are summarised in Table 6-5. Response rise timesfor impact pressure rise times between the values given in the table should be obtained by linear interpolation.The response rise time can be taken as equal to the impact pressure rise time for impact pressure rise timesexceeding 1.0ms.
Figure 6-14Definition of the DSF as a function of the ratio between the rise time of the sloshing stress response andthe natural period of the bulkhead plates in the lateral bending deformation mode
The dynamic buckling strength is then found as:
The dynamic low temperature buckling strength is limited by the material compression strength:
Max( )=
Figure 6-15Graphical representation of the slenderness dependent factor f1
Table 6-5 Relationship between impact pressure rise time and vertical stress response rise times for the primary and secondary box bulkheads
[ms] [ms]
Primary box Secondary box
0.5 0.7 1.0
1.0 0.75 1.0
b
eEt
hT
ρπ
122 2
=
load
rtresponse
rt
DSFc
D
c ⋅=σσ
D
cσF
σ
Dynamic factor
0
0.5
1
1.5
2
2.5
3
3.5
4
4.5
0 0.5 1 1.5 2 2.5 3
λ
f1
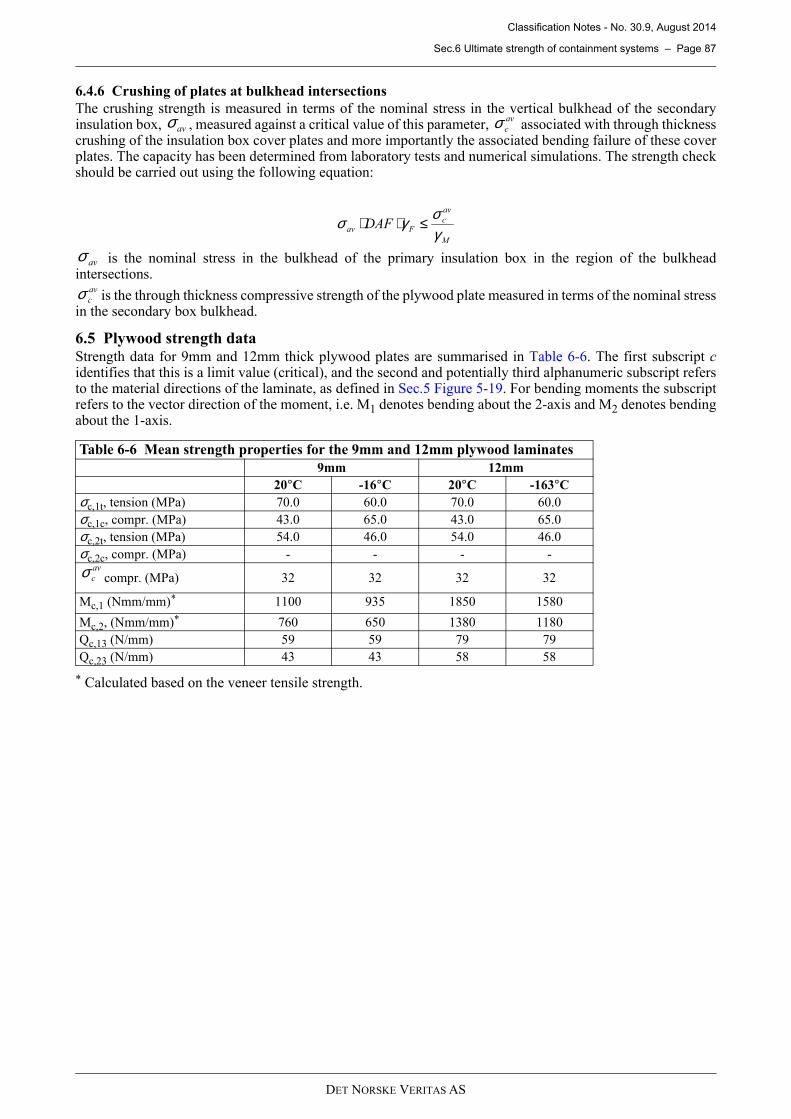
Classification Notes - No. 30.9, August 2014
Sec.6 Ultimate strength of containment systems – Page 87
DET NORSKE VERITAS AS
6.4.6 Crushing of plates at bulkhead intersections
The crushing strength is measured in terms of the nominal stress in the vertical bulkhead of the secondaryinsulation box, , measured against a critical value of this parameter, associated with through thicknesscrushing of the insulation box cover plates and more importantly the associated bending failure of these coverplates. The capacity has been determined from laboratory tests and numerical simulations. The strength checkshould be carried out using the following equation:
is the nominal stress in the bulkhead of the primary insulation box in the region of the bulkheadintersections.
is the through thickness compressive strength of the plywood plate measured in terms of the nominal stressin the secondary box bulkhead.
6.5 Plywood strength data
Strength data for 9mm and 12mm thick plywood plates are summarised in Table 6-6. The first subscript cidentifies that this is a limit value (critical), and the second and potentially third alphanumeric subscript refersto the material directions of the laminate, as defined in Sec.5 Figure 5-19 . For bending moments the subscriptrefers to the vector direction of the moment, i.e. M1 denotes bending about the 2-axis and M2 denotes bendingabout the 1-axis.
* Calculated based on the veneer tensile strength.
Table 6-6 Mean strength properties for the 9mm and 12mm plywood laminates
9mm 12mm
20°C -16°C 20°C -163°C
σc,1t, tension (MPa) 70.0 60.0 70.0 60.0
σc,1c, compr. (MPa) 43.0 65.0 43.0 65.0
σc,2t, tension (MPa) 54.0 46.0 54.0 46.0
σc,2c, compr. (MPa) - - - -
compr. (MPa) 32 32 32 32
Mc,1 (Nmm/mm)* 1100 935 1850 1580
Mc,2, (Nmm/mm)* 760 650 1380 1180
Qc,13 (N/mm) 59 59 79 79
Qc,23 (N/mm) 43 43 58 58
avσ av
cσ
M
av
cFav DAF
γσγσ ≤⋅⋅
avσ
av
cσ
av
cσ
Classification Notes - No. 30.9, August 2014
Sec.7 Strength of inner hull structure – Page 88
DET NORSKE VERITAS AS
6.6 RPUF strength data
The temperature and strain rate dependent through thickness crushing strength of the reinforced polyurethanefoam is given in Table 6-7.
* Quasi-static loading.
6.6.1 Evaluation of temperature dependent strength
It should be assumed that the temperature at the hull structure side of the containment system is 20°C, with alinear variation down to -163°C at the primary barrier of the system. The material strength can be taken as alinear function of the temperature between the limits given in Table 6-6 and Table 6-7. The material strengthfor temperatures between the limits given in should thus be obtained by linear interpolation between theselimits based on the through thickness coordinate at the location being investigated.
6.6.2 Evaluation of strain rate dependent strength
The strain rate dependent material strength should be determined based on linear interpolation between thevalues given in Table 6-7 using a strain rate calculated as follows:
is the average through thickness stress in the foam as defined in Sec.5 [5.2.3].
DAF is the dynamic amplification factor as defined Sec.5 [5.6.1].
E3 is the relevant temperature dependent through thickness elastic modulus of the reinforced polyurethanefoam as defined in Sec.5 [5.4].
is the estimated rise time of the average through thickness stress, and should be calculated as follows:
— For the upper part of the foam the response is considered to follow the load, and the response of the risetime should consequently be taken equal as the load rise time.
— For the foam adjacent to the bottom the response rise time should be taken equal to the load rise time forload rise times larger than 1.5ms. For shorter load rise times the response rise time should be obtained byinterpolation between the values given in Table 6-8.
7 Strength of inner hull structure
7.1 General
The sloshing impact loads acting on the containment system inside the cargo tanks must be transferred into thesupporting hull structure. It is therefore necessary to ensure that the hull structure has strength to carry thesloshing loads. The complex interaction between the response of the cargo containment and the hull structureas well as the challenge in selecting appropriate load scenarios based on the experimentally determinedsloshing impact loads makes it difficult to accurately assess the structural response of the inner hull plates. Asimplified comparative assessment is therefore recommended to ensure that the inner hull is properlydimensioned to carry impact loads. The reference case to be considered in the comparative assessment isdefined in the next section.
Alternative assessment methods may be accepted by DNV if it can be justified by the designer.
The inner hull strength assessment should be carried out for inner hull stiffeners and plates located in the most
Table 6-7 Temperature and strain rate dependent strength for through thickness compression of the RPUF
Strain rate
Temperature 0* 0.1/s 4/s 100/s
20°C 1.2 1.35 1.6 1.65
-163°C 2.0 2.2 2.3 2.3
Table 6-8 Relationship between load and response rise times for bottom foam for load rise times below 1.5ms
[ms] [ms]
0.250 0.500
1.500 1.500
response
rtE
DAF
⋅⋅⋅=32
σε& , where
σ
response
rt
load
rtresponse
rt
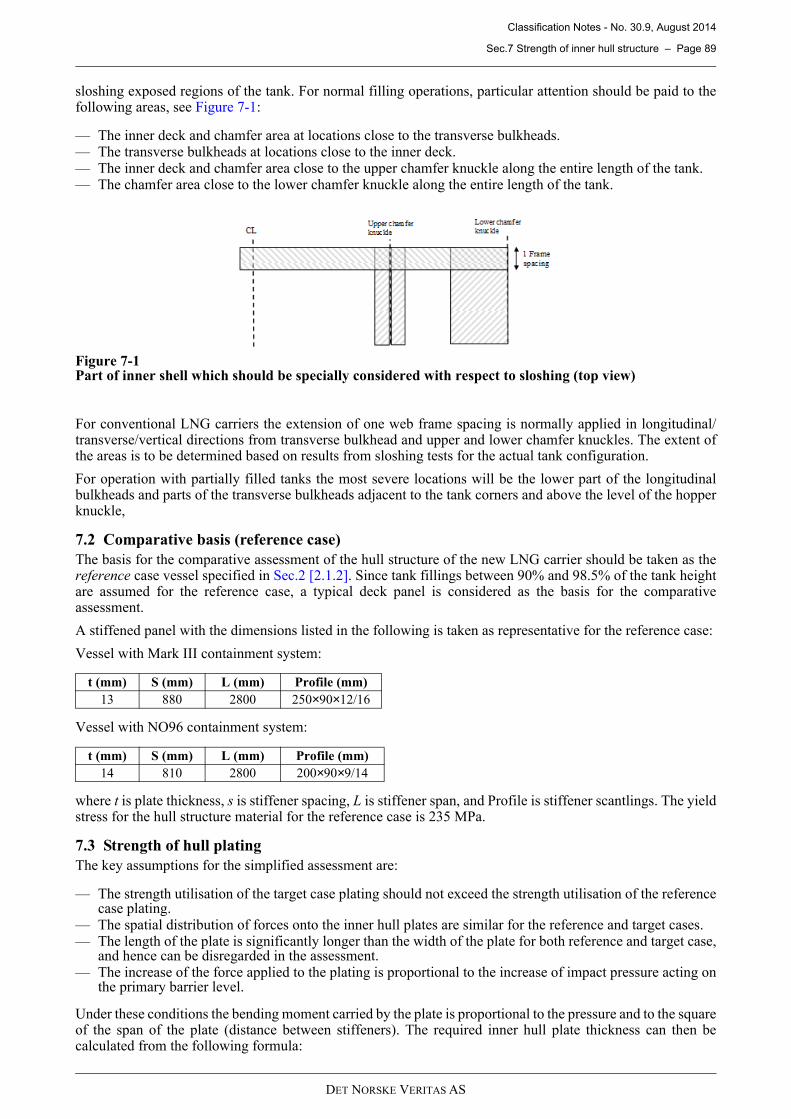
Classification Notes - No. 30.9, August 2014
Sec.7 Strength of inner hull structure – Page 89
DET NORSKE VERITAS AS
sloshing exposed regions of the tank. For normal filling operations, particular attention should be paid to thefollowing areas, see Figure 7-1 :
— The inner deck and chamfer area at locations close to the transverse bulkheads.— The transverse bulkheads at locations close to the inner deck.— The inner deck and chamfer area close to the upper chamfer knuckle along the entire length of the tank.— The chamfer area close to the lower chamfer knuckle along the entire length of the tank.
Figure 7-1Part of inner shell which should be specially considered with respect to sloshing (top view)
For conventional LNG carriers the extension of one web frame spacing is normally applied in longitudinal/transverse/vertical directions from transverse bulkhead and upper and lower chamfer knuckles. The extent ofthe areas is to be determined based on results from sloshing tests for the actual tank configuration.
For operation with partially filled tanks the most severe locations will be the lower part of the longitudinalbulkheads and parts of the transverse bulkheads adjacent to the tank corners and above the level of the hopperknuckle,
7.2 Comparative basis (reference case)
The basis for the comparative assessment of the hull structure of the new LNG carrier should be taken as thereference case vessel specified in Sec.2 [2.1.2]. Since tank fillings between 90% and 98.5% of the tank heightare assumed for the reference case, a typical deck panel is considered as the basis for the comparativeassessment.
A stiffened panel with the dimensions listed in the following is taken as representative for the reference case:
Vessel with Mark III containment system:
Vessel with NO96 containment system:
where t is plate thickness, s is stiffener spacing, L is stiffener span, and Profile is stiffener scantlings. The yieldstress for the hull structure material for the reference case is 235 MPa.
7.3 Strength of hull plating
The key assumptions for the simplified assessment are:
— The strength utilisation of the target case plating should not exceed the strength utilisation of the referencecase plating.
— The spatial distribution of forces onto the inner hull plates are similar for the reference and target cases.— The length of the plate is significantly longer than the width of the plate for both reference and target case,
and hence can be disregarded in the assessment.— The increase of the force applied to the plating is proportional to the increase of impact pressure acting on
the primary barrier level.
Under these conditions the bending moment carried by the plate is proportional to the pressure and to the squareof the span of the plate (distance between stiffeners). The required inner hull plate thickness can then becalculated from the following formula:
t (mm) S (mm) L (mm) Profile (mm)
13 880 2800 250×90×12/16
t (mm) S (mm) L (mm) Profile (mm)
14 810 2800 200×90×9/14
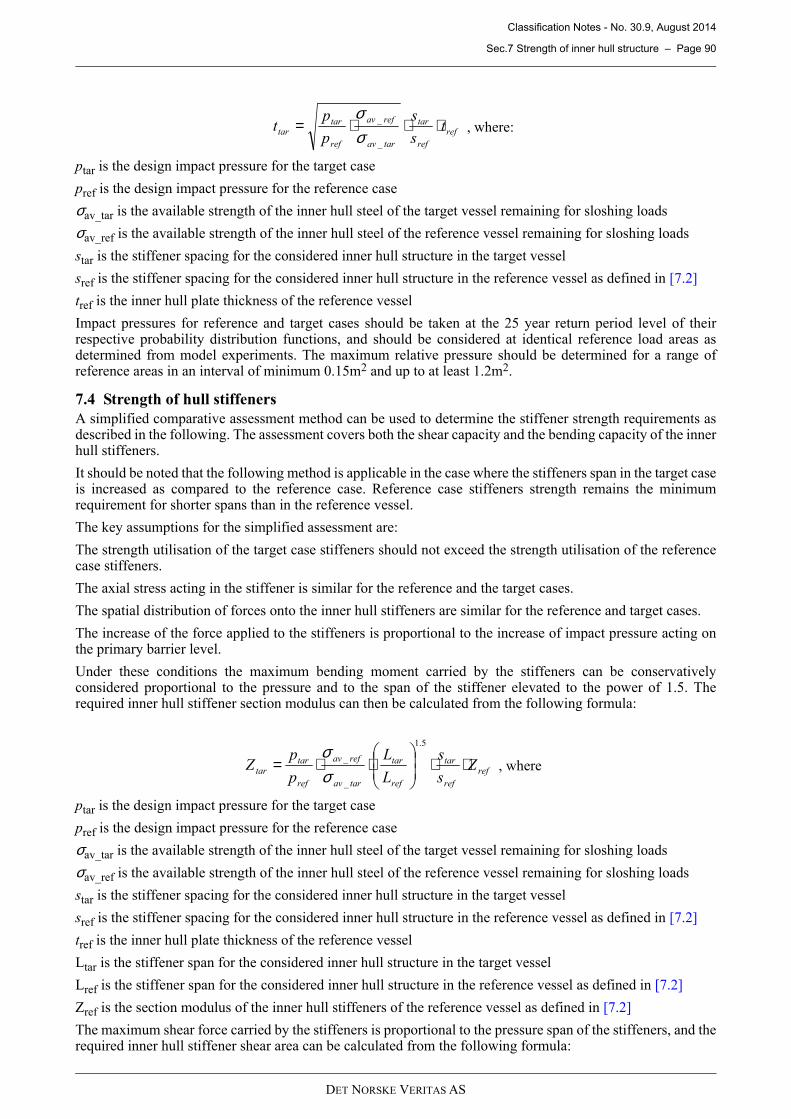
Classification Notes - No. 30.9, August 2014
Sec.7 Strength of inner hull structure – Page 90
DET NORSKE VERITAS AS
ptar is the design impact pressure for the target case
pref is the design impact pressure for the reference case
σav_tar is the available strength of the inner hull steel of the target vessel remaining for sloshing loads
σav_ref is the available strength of the inner hull steel of the reference vessel remaining for sloshing loads
star is the stiffener spacing for the considered inner hull structure in the target vessel
sref is the stiffener spacing for the considered inner hull structure in the reference vessel as defined in [7.2]
tref is the inner hull plate thickness of the reference vessel
Impact pressures for reference and target cases should be taken at the 25 year return period level of theirrespective probability distribution functions, and should be considered at identical reference load areas asdetermined from model experiments. The maximum relative pressure should be determined for a range ofreference areas in an interval of minimum 0.15m2 and up to at least 1.2m2.
7.4 Strength of hull stiffeners
A simplified comparative assessment method can be used to determine the stiffener strength requirements asdescribed in the following. The assessment covers both the shear capacity and the bending capacity of the innerhull stiffeners.
It should be noted that the following method is applicable in the case where the stiffeners span in the target caseis increased as compared to the reference case. Reference case stiffeners strength remains the minimumrequirement for shorter spans than in the reference vessel.
The key assumptions for the simplified assessment are:
The strength utilisation of the target case stiffeners should not exceed the strength utilisation of the referencecase stiffeners.
The axial stress acting in the stiffener is similar for the reference and the target cases.
The spatial distribution of forces onto the inner hull stiffeners are similar for the reference and target cases.
The increase of the force applied to the stiffeners is proportional to the increase of impact pressure acting onthe primary barrier level.
Under these conditions the maximum bending moment carried by the stiffeners can be conservativelyconsidered proportional to the pressure and to the span of the stiffener elevated to the power of 1.5. Therequired inner hull stiffener section modulus can then be calculated from the following formula:
ptar is the design impact pressure for the target case
pref is the design impact pressure for the reference case
σav_tar is the available strength of the inner hull steel of the target vessel remaining for sloshing loads
σav_ref is the available strength of the inner hull steel of the reference vessel remaining for sloshing loads
star is the stiffener spacing for the considered inner hull structure in the target vessel
sref is the stiffener spacing for the considered inner hull structure in the reference vessel as defined in [7.2]
tref is the inner hull plate thickness of the reference vessel
Ltar is the stiffener span for the considered inner hull structure in the target vessel
Lref is the stiffener span for the considered inner hull structure in the reference vessel as defined in [7.2]
Zref is the section modulus of the inner hull stiffeners of the reference vessel as defined in [7.2]
The maximum shear force carried by the stiffeners is proportional to the pressure span of the stiffeners, and therequired inner hull stiffener shear area can be calculated from the following formula:
ref
ref
tar
tarav
refav
ref
tartar t
s
s
p
pt ⋅⋅⋅=
_
_
σσ
, where:
ref
ref
tar
ref
tar
tarav
refav
ref
tartar Z
s
s
L
L
p
pZ ⋅⋅
⋅⋅=
5.1
_
_
σσ
, where

Classification Notes - No. 30.9, August 2014
Sec.8 Response and strength of pump tower and supports – Page 91
DET NORSKE VERITAS AS
ptar is the design impact pressure for the target case
pref is the design impact pressure for the reference case
σav_tar is the available strength of the inner hull steel of the target vessel remaining for sloshing loads
σav_ref is the available strength of the inner hull steel of the reference vessel remaining for sloshing loads
star is the stiffener spacing for the considered inner hull structure in the target vessel
sref is the stiffener spacing for the considered inner hull structure in the reference vessel as defined in [7.2]
tref is the inner hull plate thickness of the reference vessel
Ltar is the stiffener span for the considered inner hull structure in the target vessel
Lref is the stiffener span for the considered inner hull structure in the reference vessel as defined in [7.2]
As_ref is the shear area of the inner hull stiffeners of the reference vessel as defined in [7.2]
7.5 Effect of differences in vapour pressure
Two types of loading are considered in the analysis; a static vapour pressure pvapour and a dynamic psloshing.As the static pressure utilises some of the hull capacity, a limited steel strength is available for carrying theadditional dynamic sloshing impact pressure. The remaining strength available to carry the sloshing impactpressure in the target and reference cases are denoted σav_tar and σav_ref in the definitions above.
The acceptance criterion is given on the total stress experienced by the structure by a combination of both staticand dynamic loads:
σallowable = σf for stiffeners = 2σf for plates (plastic mechanism)σvapour =
σf is the yield strength of the material
Mvapour is the bending moment caused by vapour pressure in the structural element to be checked
Z is the section modulus
It follows that the available strength to sustain sloshing loads in the reference case and the minimumrequirement for the remaining strength in the target case are:
As a result, the solutions become implicit for the target plate thickness in [7.3] and for the target stiffenersection modulus in [7.4]. An iterative approach is therefore necessary to determine the plate thickness andstiffener section modulus requirements. In cases where the first iteration satisfies requirements, there is no needfor iteration. Otherwise, since the section modulus is affected by the plate thickness, iteration on the platethickness should be performed before the iteration on the section modulus.
8 Response and strength of pump tower and supports
8.1 General
The strength of the pump tower main structure, the base support and the liquid dome area should be checkedwith respect to ultimate strength (ULS) and fatigue (FLS). In addition, a vibration check should be carried outof the main structure.
Finite element analyses of the pump tower structure should be carried out to determine the response in thestructure due to the loads relevant for the ULS and the FLS assessments. Separate analyses should be carriedout for the main structure, for the base support, and for the liquid dome area, as described in the followingsections.
reftar S
ref
tar
ref
tar
tarav
refav
ref
tarS A
s
s
L
L
p
pA ⋅⋅⋅= .
_
_
σσ
, where
allowablesloshingvapour σσσσ ≤+= , where:
ZM vapor
tar
tarvapor
tarallowabletarav
ref
refvapor
refallowablerefavZ
Mand
Z
M _
__
_
__ −=−= σσσσ
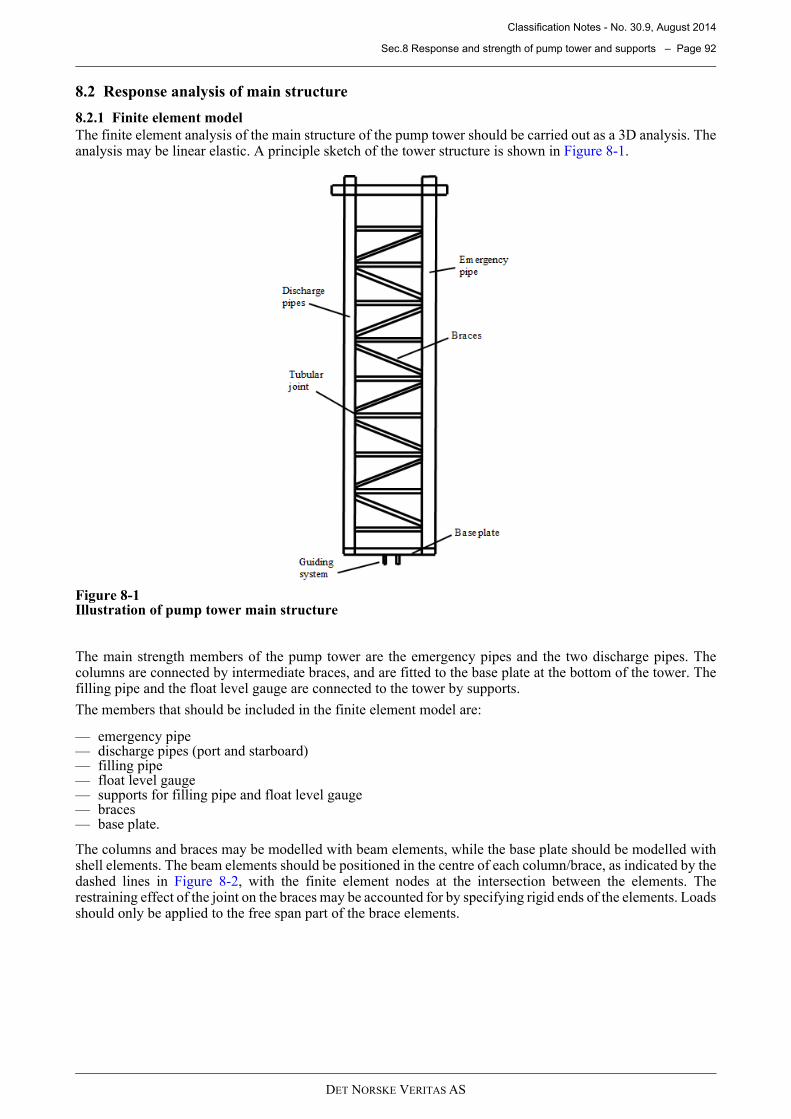
Classification Notes - No. 30.9, August 2014
Sec.8 Response and strength of pump tower and supports – Page 92
DET NORSKE VERITAS AS
8.2 Response analysis of main structure
8.2.1 Finite element model
The finite element analysis of the main structure of the pump tower should be carried out as a 3D analysis. Theanalysis may be linear elastic. A principle sketch of the tower structure is shown in Figure 8-1 .
Figure 8-1Illustration of pump tower main structure
The main strength members of the pump tower are the emergency pipes and the two discharge pipes. Thecolumns are connected by intermediate braces, and are fitted to the base plate at the bottom of the tower. Thefilling pipe and the float level gauge are connected to the tower by supports.
The members that should be included in the finite element model are:
— emergency pipe— discharge pipes (port and starboard)— filling pipe— float level gauge— supports for filling pipe and float level gauge— braces— base plate.
The columns and braces may be modelled with beam elements, while the base plate should be modelled withshell elements. The beam elements should be positioned in the centre of each column/brace, as indicated by thedashed lines in Figure 8-2 , with the finite element nodes at the intersection between the elements. Therestraining effect of the joint on the braces may be accounted for by specifying rigid ends of the elements. Loadsshould only be applied to the free span part of the brace elements.
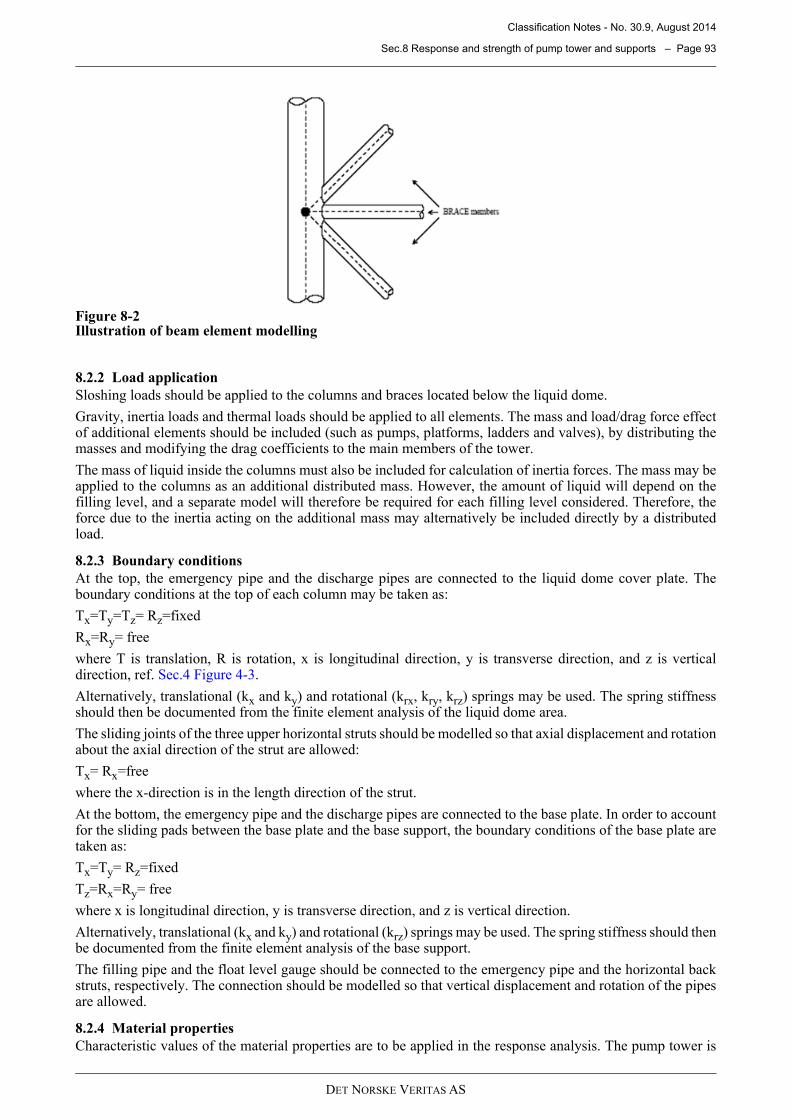
Classification Notes - No. 30.9, August 2014
Sec.8 Response and strength of pump tower and supports – Page 93
DET NORSKE VERITAS AS
Figure 8-2Illustration of beam element modelling
8.2.2 Load application
Sloshing loads should be applied to the columns and braces located below the liquid dome.
Gravity, inertia loads and thermal loads should be applied to all elements. The mass and load/drag force effectof additional elements should be included (such as pumps, platforms, ladders and valves), by distributing themasses and modifying the drag coefficients to the main members of the tower.
The mass of liquid inside the columns must also be included for calculation of inertia forces. The mass may beapplied to the columns as an additional distributed mass. However, the amount of liquid will depend on thefilling level, and a separate model will therefore be required for each filling level considered. Therefore, theforce due to the inertia acting on the additional mass may alternatively be included directly by a distributedload.
8.2.3 Boundary conditions
At the top, the emergency pipe and the discharge pipes are connected to the liquid dome cover plate. Theboundary conditions at the top of each column may be taken as:
Tx=Ty=Tz= Rz=fixed
Rx=Ry= free
where T is translation, R is rotation, x is longitudinal direction, y is transverse direction, and z is verticaldirection, ref. Sec.4 Figure 4-3 .
Alternatively, translational (kx and ky) and rotational (krx, kry, krz) springs may be used. The spring stiffnessshould then be documented from the finite element analysis of the liquid dome area.
The sliding joints of the three upper horizontal struts should be modelled so that axial displacement and rotationabout the axial direction of the strut are allowed:
Tx= Rx=free
where the x-direction is in the length direction of the strut.
At the bottom, the emergency pipe and the discharge pipes are connected to the base plate. In order to accountfor the sliding pads between the base plate and the base support, the boundary conditions of the base plate aretaken as:
Tx=Ty= Rz=fixed
Tz=Rx=Ry= free
where x is longitudinal direction, y is transverse direction, and z is vertical direction.
Alternatively, translational (kx and ky) and rotational (krz) springs may be used. The spring stiffness should thenbe documented from the finite element analysis of the base support.
The filling pipe and the float level gauge should be connected to the emergency pipe and the horizontal backstruts, respectively. The connection should be modelled so that vertical displacement and rotation of the pipesare allowed.
8.2.4 Material properties
Characteristic values of the material properties are to be applied in the response analysis. The pump tower is

Classification Notes - No. 30.9, August 2014
Sec.8 Response and strength of pump tower and supports – Page 94
DET NORSKE VERITAS AS
usually constructed by stainless steel, and typically of qualities in the 300-series. Properties for the 304Lstainless steel are given in Table 8-1.
For intermediate temperatures, the yield limit and the thermal expansion coefficient may be interpolatedlinearly between the specified values. The reference temperature for the thermal expansion is 20ºC.
8.2.5 Response parameters
For tubular members, the following result parameters should be determined for critical sections along thelength of the member:
— axial force (or tension/compression stress)— vertical bending moment (or bending stress)— horizontal bending moment (or bending stress)— torsional moment (or torsional stress).
For joints, the following result parameters should be determined:
— axial load— horizontal bending moment— vertical bending moment.
In addition, total reaction forces at the top and at the bottom of the tower are to be determined.
8.3 Response analysis of base support
The finite element analysis of the base support of the pump tower should be carried out as a 3D analysis usingshell elements. The analysis may be linear elastic.
The finite element model should include the base support itself, and a portion of the double bottom. The portionof the double bottom should be large enough to provide realistic restraint conditions to the base support.
Mesh density may be chosen according to recommendations given in DNV CN 30.7 /6/ and DNV RP-C203 /7/.
The reaction forces determined from the analysis of the pump tower main structure should be applied to themodel, and combined with hull girder loads due to global bending moment, double bottom stresses due toexternal sea pressure, and thermal stresses due to the thermal gradient in the base support. The temperaturevariation through the height of the base support should be determined by a separate analysis.
The resulting stress field in the base support should be determined, and applied for the ULS and FLS strengthassessment.
Areas of special concern for the base support are the connection between the base support and the inner bottom,the connection to the primary membrane, the connection to the secondary membrane, and the tower guidestructure.
In addition, the reinforcements in the inner bottom underneath the base support should be considered.
The complete set of hot spots to be considered should be agreed with the Classification Society.
8.4 Response analysis of liquid dome area
The finite element analysis of the liquid dome area should be carried out as a 3D analysis using shell elements,as illustrated in Figure 8-3 . The top cover plate and the connection to the pump tower should be included in theanalysis. The analysis may be linear elastic.
Mesh density may be chosen according to recommendations given in DNV CN 30.7 /6/ and DNV RP-C203 /7/.
The reaction forces determined from the analysis of the pump tower main structure should be applied to the
Table 8-1 Material properties for 304L stainless steel
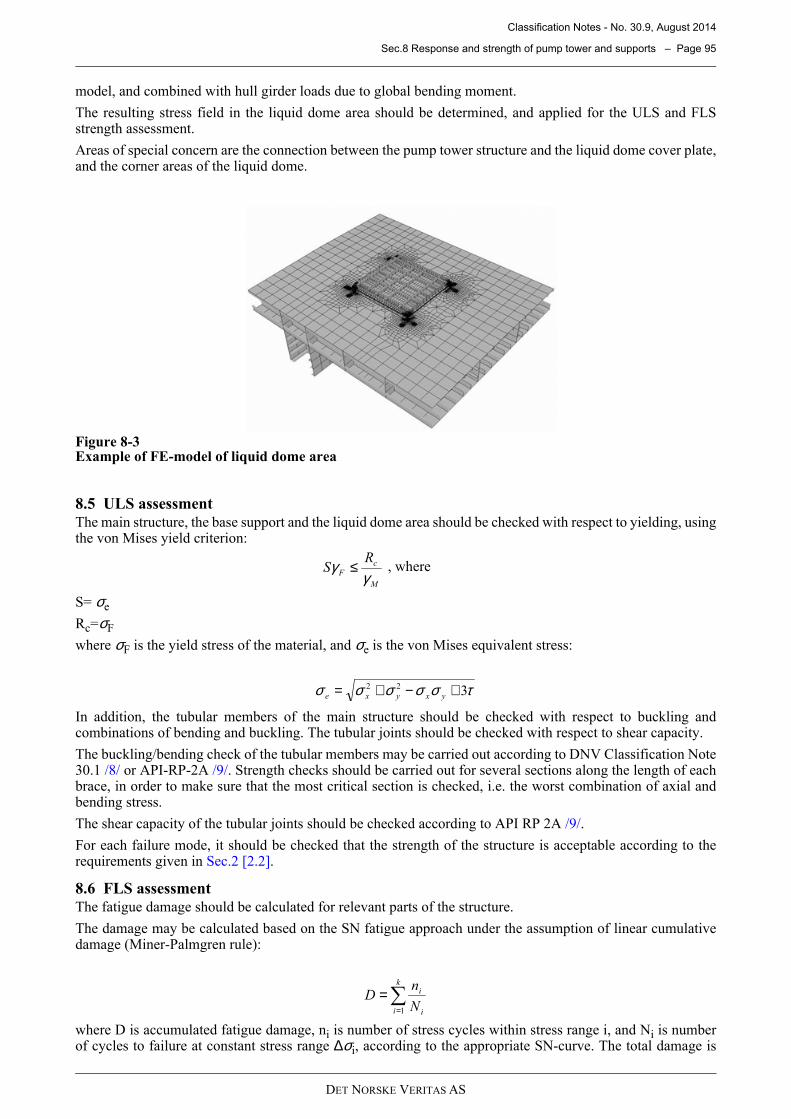
Classification Notes - No. 30.9, August 2014
Sec.8 Response and strength of pump tower and supports – Page 95
DET NORSKE VERITAS AS
model, and combined with hull girder loads due to global bending moment.
The resulting stress field in the liquid dome area should be determined, and applied for the ULS and FLSstrength assessment.
Areas of special concern are the connection between the pump tower structure and the liquid dome cover plate,and the corner areas of the liquid dome.
Figure 8-3Example of FE-model of liquid dome area
8.5 ULS assessment
The main structure, the base support and the liquid dome area should be checked with respect to yielding, usingthe von Mises yield criterion:
S= σe
Rc=σF
where σF is the yield stress of the material, and σe is the von Mises equivalent stress:
In addition, the tubular members of the main structure should be checked with respect to buckling andcombinations of bending and buckling. The tubular joints should be checked with respect to shear capacity.
The buckling/bending check of the tubular members may be carried out according to DNV Classification Note30.1 /8/ or API-RP-2A /9/. Strength checks should be carried out for several sections along the length of eachbrace, in order to make sure that the most critical section is checked, i.e. the worst combination of axial andbending stress.
The shear capacity of the tubular joints should be checked according to API RP 2A /9/.
For each failure mode, it should be checked that the strength of the structure is acceptable according to therequirements given in Sec.2 [2.2].
8.6 FLS assessment
The fatigue damage should be calculated for relevant parts of the structure.
The damage may be calculated based on the SN fatigue approach under the assumption of linear cumulativedamage (Miner-Palmgren rule):
where D is accumulated fatigue damage, ni is number of stress cycles within stress range i, and Ni is numberof cycles to failure at constant stress range ∆σi, according to the appropriate SN-curve. The total damage is
M
c
F
RS
γγ ≤ , where
τσσσσσ 322 +−+= yxyxe
∑=
=k
i i
i
N
nD
1
Classification Notes - No. 30.9, August 2014
Sec.8 Response and strength of pump tower and supports – Page 96
DET NORSKE VERITAS AS
found by summing the damage for each
— sea state (according to the North Atlantic scatter diagram)— for each sea state: all load conditions (full load/ballast)— for each sea state and load conditions: all headings (0-180º).
The cumulative damage for a design life of 40 years should not exceed the acceptable damage as defined inSec.2 [2.2].
Basic design SN-curves are generally given as
where N is number of cycles to failure at the stress range ∆σ, and m and are constants.
SN-curves for specific materials and details are obtained from fatigue tests, and are typically based on themean-minus-two-standard-deviation curves for relevant experimental data, meaning a 97.6% probability ofsurvival.
For the tubular joints of the main structure of the pump tower, the SN-curve should be taken as the two-slopeT-curve for air given in DNV RP-C203 /7/:
: ,
: ,
This curve is based on a reference thickness of 32mm. For other thicknesses, a thickness modification shouldbe applied, as specified in DNV RP-C203 /7/. It should be noted that the T-curve assumes full penetrationwelding.
For simplicity, a one-slope curve may conservatively be used, with and for the entirestress range. The fatigue damage for each load condition can then be expressed as:
where ν0 is the long-term average response zero-crossing frequency, Td is the design life of the ship in seconds(=1.26 108 for 40 years design life), and Γ(1+m/h) is the gamma function (equal to 6.0 for m=3.0 and h=1.0).
Stress concentration factors (SCFs) should be applied according to recommendations given in section 2.8 andAppendix 2 of DNV RP-C203 /7/. The hot spot stress to be used in combination with the T-curve is calculatedas
The combined hot spot stress due to axial force and bending moments should be calculated for several pointsaround the circumference of the intersection. Alternatively, the SCFs may be calculated using influencefunctions as proposed to Efthymiou /10/.
For the base support and the liquid dome area, the appropriate SN-curve to be used for each detail should betaken according to the recommendations given in DNV RP-C203, Appendix 1 /7/. Alternatively, the hot spotstress may be calculated by finite element analysis and combined with the D-curve, as explained in section 2.13of the RP. The procedure given in DNV CN 30.7 /6/ may also be followed. Special attention should be givento the connection between the base support and the double bottom, and to the connection between the basesupport and the primary/secondary membranes.
8.7 Vibration check
Modal analysis of the pump tower should be carried out to check that the natural frequencies of the pump towerare outside the resonance intervals of excitations coming from the propeller blade and the engine room. Thesame model as used for the response analysis may be applied.
For LNG carriers operating with tank filling restrictions the vibration check should be carried out for ballastcondition, 10%H filling, 70%H filling and 98%H filling. Additional tank fillings may have to be consideredfor vessels or units designed to operate with unrestricted filling. Mass of liquid inside pipes and added masseffects are to be considered in the analysis.
The margin between the excitation frequencies and the resonance frequencies should be at least 10%.
If the vessel is intended for ice-going operation, the excitation frequencies and forces from breaking the iceshould also be considered.
σ∆−= logloglog maN
a
710≤N 164.12log =a 3=m
710>N 606.15log =a 5=m
164.12log =a 3=m
)1(0
h
mq
a
TD md +Γ=
υ
nomhotspot SCFσσ =
Classification Notes - No. 30.9, August 2014
Sec.9 References – Page 97
DET NORSKE VERITAS AS
9 References
/1/ International Maritime Organization (IMO), International Code for the Construction and Equip-ment of Ships Carrying Liquefied Gases in Bulk, as amended, IMO.
/2/ Det Norske Veritas (DNV), Rules for Classification of Ships Pt.5 Ch.5, Liquefied Gas Carriers.
/3/ Det Norske Veritas (DNV), DNV-RP-C205 Environmental Conditions and Environmental Loads.
/4/ IACS Recommendation 34, http://www.iacs.org.uk/document/public/Publications/Guide-lines_and_recommendations/PDF/REC_34_pdf186.pdf
/5/ Pastoor, W., Østvold, T.K., Byklum, E., Valsgård, S. (2005) Sloshing in LNG carriers for new de-signs, new trades and new operations, GASTECH2005 conference and exhibition, Bilbao.
/6/ Det Norske Veritas (DNV), Classification Notes No.30.7, Fatigue Assessment of Ship Structures.
/7/ Det Norske Veritas (DNV), DNV-RP-C203, Fatigue Strength of Offshore Steel Structures.
/8/ Det Norske Veritas (DNV), Classification Notes No.30.1, Buckling Strength Analysis of Bars and Frames, and Spherical Shells.
/9/ American Petroleum Institute, Recommended Practice API-RP-2A-LRFD, Recommended Practice for Planning, Designing and Constructing Fixed Offshore Platforms – Load and Resistance Factor Design.
/10/ Efthymiou, M: Development of SCF Formulae and Generalised Influence Functions for use in Fa-tigue Analysis, Recent Developments in Tubular Joint Technology, OTJ’88, October 1988, London.
/11/ NORSOK, N-004 Design of Steel Structures.
/12/ Rognebakke, O.F., Opedal, J.A., Østvold T.K. (2009) Sloshing Impact Design Load Assessment Pro-ceedings of the Nineteenth InternationalOffshore and Polar Engineering Conference (ISOPE 2009), Osaka, Japan, June 21−26, 2009.
/13/ Yung, T.W., Sandstrom, R., He, H., Minta, M.K., (2009), On the Physics of Vapor/Liquid Interac-tion during Impact on Solids, Journal of Ship Research.
/14/ Braeunig, J.-P. Brosset, L. Dias, F. Ghidaglia, J.-M. Phenomenological Study of Liquid Impacts through 2D Compressible Two-fluid Numerical Simulations, Proceedings of the Nineteenth Interna-tional Offshore and Polar Engineering Conference (ISOPE 2009), Osaka, Japan, June 21−26, 2009.
/15/ Det Norske Veritas (DNV), DNV-RP-A203 Technology Qualification.

Classification Notes - No. 30.9, August 2014
CHANGES – HISTORIC – Page 98
DET NORSKE VERITAS AS
CHANGES – HISTORIC
Note that historic changes older than the editions shown below have not been included. Older historic changes(if any) may be retrieved through http://www.dnv.com.
June 2006 edition
This Classification Note was first issued in June 2006.