Embed Size (px)
DESCRIPTION
SLOFEC TankScanning
Citation preview

SLOFEC™ Technique
for
Tank Scanning
SLOFEC™ Technique for Tank Scanning
Page 2 of 7
One of the main applications of Innospection’s SLOFEC™ technique is the inspection of storage tanks. The technique has been proven in the field as a high speed and reliable method in detecting local corrosion in storage tanks. The SLOFEC capabilities in tank inspection include the following:
� Experienced with inspection up to 35mm wall thickness
� Experienced with inspection of coating up to 10mm
� Experienced with inspection of tanks with temperature up to 150 deg C
� Inspection of stainless steel tanks, carbon steel and non-ferrous tanks
� Inspection of lined and unlined tank floors
� Inspection and detection of corrosion at overlap welds in lined tanks
� Differentiation of top and underside defects through separate mapping
� Computer Aided Mapping with high speed results
� Comprehensive inspections, acquisition and interpretation of NDT data, tank life
forecasts, repair recommendations and high quality reports (as per EEMUA 159 & API 653)
SLOFEC™ Technique for Tank Scanning
Page 3 of 7
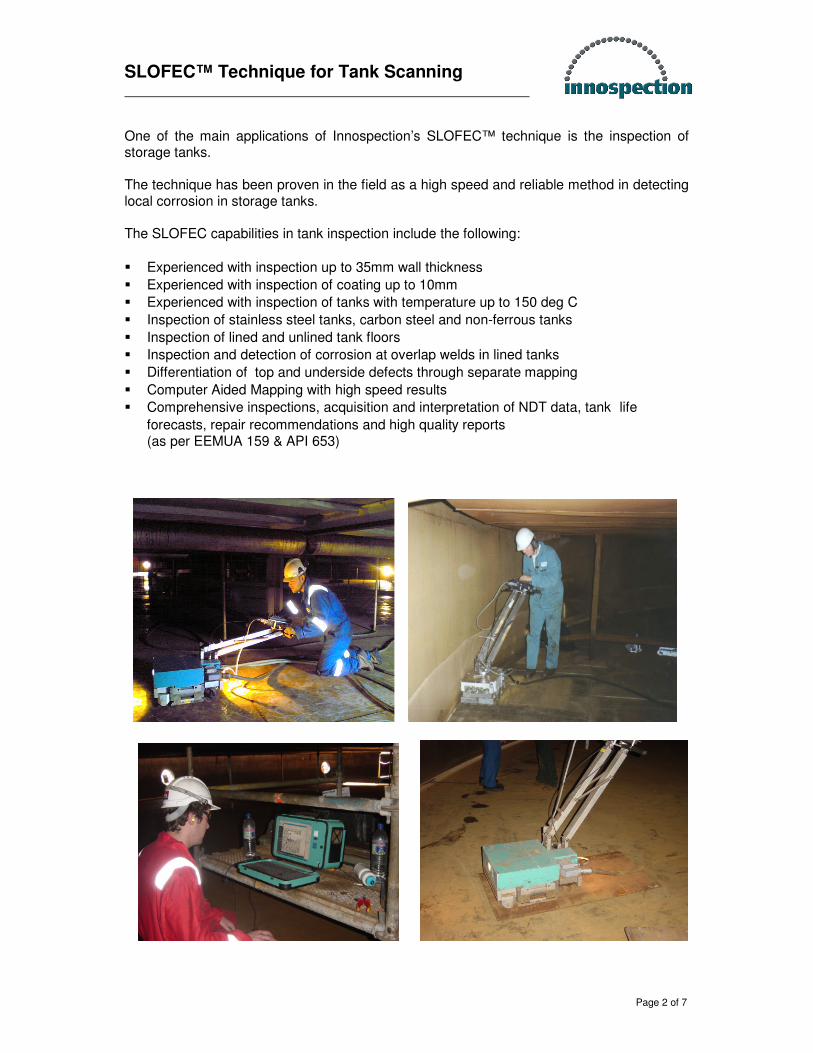
Due to the electromagnetic technical background, the SLOFEC technique is often compared to the Magnetic Flux Leakage (MFL) technique. However the advantages of the SLOFEC against the MFL technique in the inspection of storage tanks are proven to be multiple. Table 1 below shows some key facts of SLOFEC technique versus the MFL technique in storage tank inspection:
Table 1
SLOFEC MFL
Up to 30mm Up to 10 mm WT
(TUEV qualified 35mm) (between 12 to 15mm)
Coatings Up to 10mm, any type Up to 2mm
Distinguish Defects / False Calls
YES (by Signal Phase) NO
Distinguish (report) Topside from Underside Defects
YES (by Signal Phase) NO
Material magnetic properties
Allows tolerances Have to remain constant
Defect Detection Sensitivity
From below 20% wall loss From > 20% wall loss
Shape of corrosion Relative independent More dependant
Saturation level in parent material remains constant
Only light influences as no saturation is required
Strong influences as saturation is required
YES (by Signal Phase) Mapping
Topside / underside separate
Limited
YES (by Signal Phase) Inspecting close to the Shell Dead Zone ~ 20mm
-
20-30m/min 20-30m/min Speed
Independent of speed change
speed change influences amplitude
SLOFEC™ Technique for Tank Scanning
Page 4 of 7
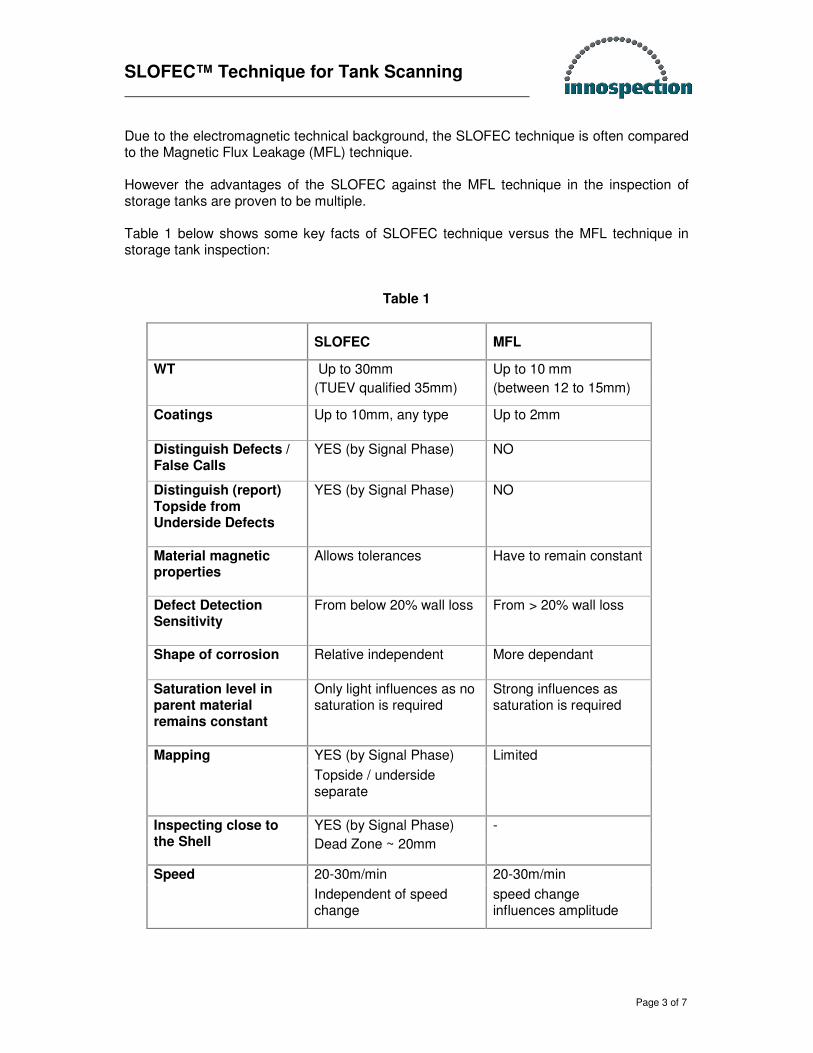
Examples of Tank Inspection using the SLOFEC technique Example 1: Tank floor inspection
Tankfloor : Chemical Plant Plate thickness : 12mm Coating : rubber, 10mm thick Detected Defects: � Corrosional pits from the underside � 20 – 30% loss � Additional through holes found � Defects confirmed by Ultrasonic Testing
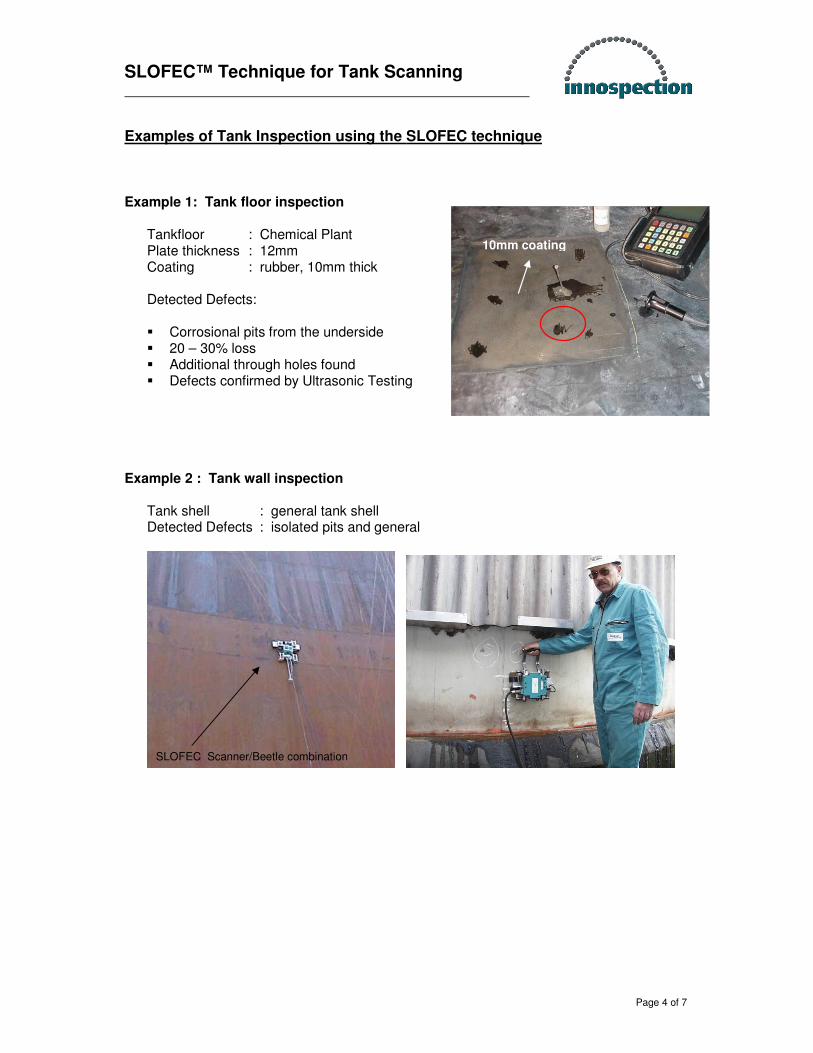
Example 2 : Tank wall inspection
Tank shell : general tank shell Detected Defects : isolated pits and general
10mm coating
SLOFEC Scanner/Beetle combination
SLOFEC™ Technique for Tank Scanning
Page 5 of 7
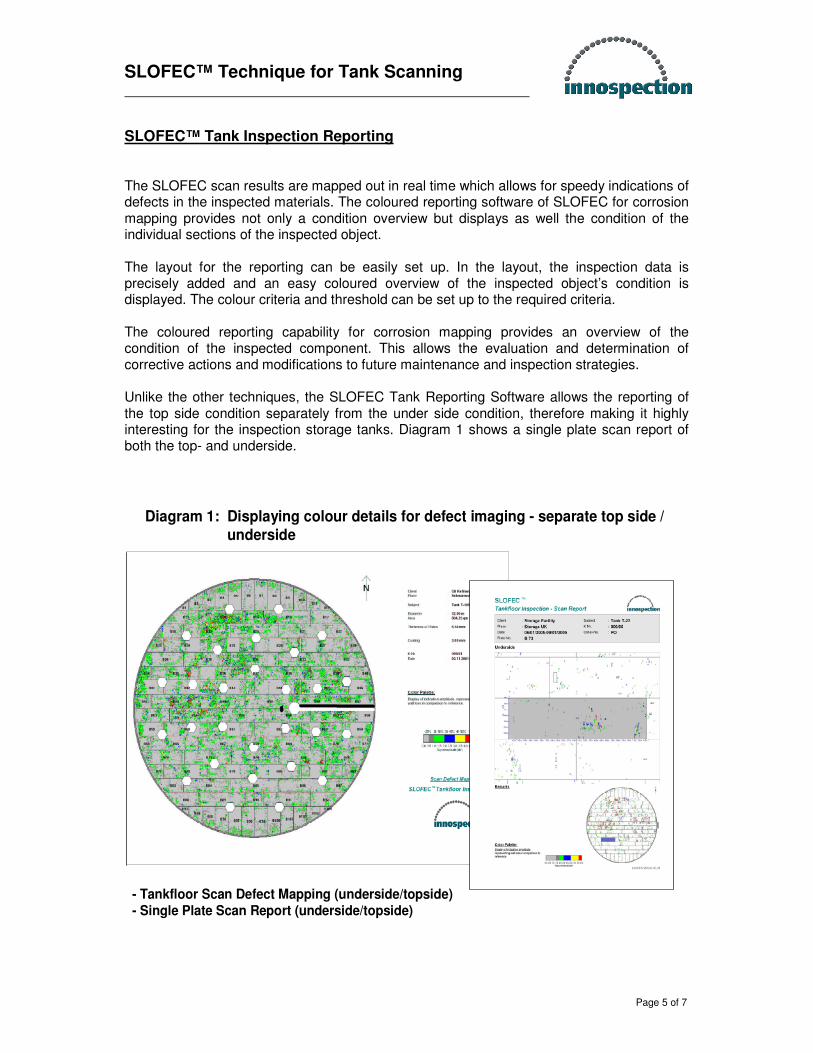
SLOFEC™ Tank Inspection Reporting The SLOFEC scan results are mapped out in real time which allows for speedy indications of defects in the inspected materials. The coloured reporting software of SLOFEC for corrosion mapping provides not only a condition overview but displays as well the condition of the individual sections of the inspected object. The layout for the reporting can be easily set up. In the layout, the inspection data is precisely added and an easy coloured overview of the inspected object’s condition is displayed. The colour criteria and threshold can be set up to the required criteria. The coloured reporting capability for corrosion mapping provides an overview of the condition of the inspected component. This allows the evaluation and determination of corrective actions and modifications to future maintenance and inspection strategies. Unlike the other techniques, the SLOFEC Tank Reporting Software allows the reporting of the top side condition separately from the under side condition, therefore making it highly interesting for the inspection storage tanks. Diagram 1 shows a single plate scan report of both the top- and underside.
- Tankfloor Scan Defect Mapping (underside/topside)- Single Plate Scan Report (underside/topside)
Diagram 1: Displaying colour details for defect imaging - separate top side /
underside
SLOFEC™ Technique for Tank Scanning
Page 6 of 7
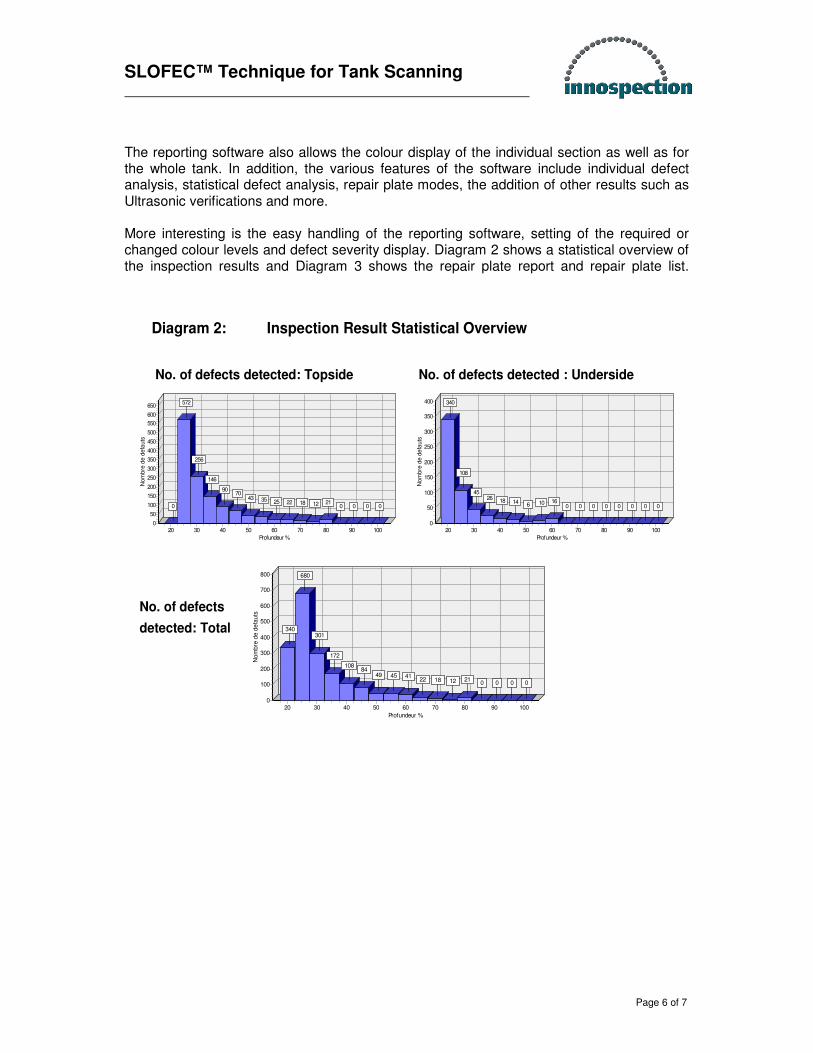
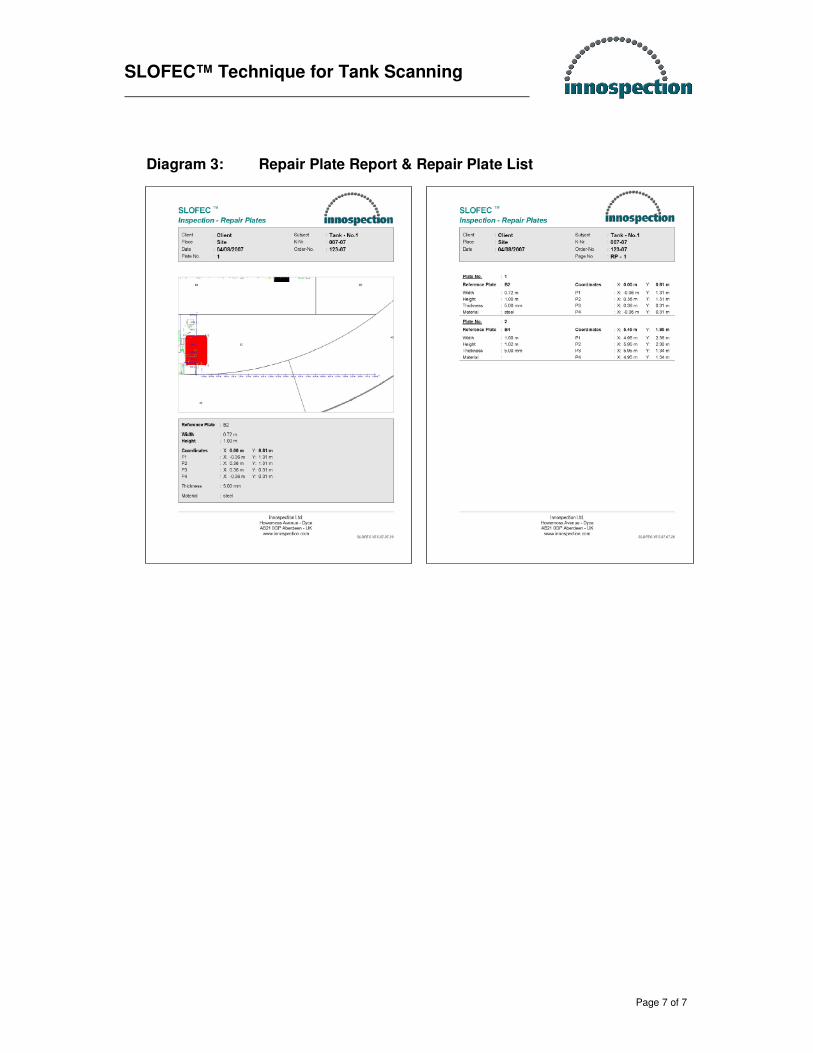
The reporting software also allows the colour display of the individual section as well as for the whole tank. In addition, the various features of the software include individual defect analysis, statistical defect analysis, repair plate modes, the addition of other results such as Ultrasonic verifications and more. More interesting is the easy handling of the reporting software, setting of the required or changed colour levels and defect severity display. Diagram 2 shows a statistical overview of the inspection results and Diagram 3 shows the repair plate report and repair plate list.
Diagram 2: Inspection Result Statistical Overview
No. of defects detected: Topside
Profundeur %
1009080706050403020
Nom
bre
de d
efa
uts
650
600
550
500
450
400
350
300
250
200
150
100
50
0
0
572
256
146
9070
43 35 25 22 18 12 210 0 0 0
Profundeur %
1009080706050403020
Nom
bre
de d
efa
uts
400
350
300
250
200
150
100
50
0
340
108
4526 18 14 6 10 16
0 0 0 0 0 0 0 0
No. of defects detected : Underside
Profundeur %
1009080706050403020
Nom
bre
de d
efa
uts
800
700
600
500
400
300
200
100
0
340
680
301
172
10884
49 45 4122 18 12 21
0 0 0 0
No. of defects
detected: Total
SLOFEC™ Technique for Tank Scanning
Page 7 of 7
Diagram 3: Repair Plate Report & Repair Plate List