Embed Size (px)
Citation preview

SLIGO and Environs
SLIGO County Council
SLIGO Borough Council
Development Plan 2010-2016


SLIGO and EnvironsSligo Borough Council Sligo County Council
Development Plan 2010-2016This Development Plan for Sligo and Environs (SEDP) has been prepared under Section 11 of the Planning and Development Act 2000-2006.
At their special meetings of 2 November 2009, Sligo County Council and Sligo Borough Council decided to adopt the SEDP 2010-2016. The Plan came into force on 30 November 2009 and will remain in force for a period of six years.
The SEDP and associated documents are available for inspection or purchase at the Planning Offices of Sligo Borough Council and Sligo County Council, in hard copy or in digital format (CD-ROM). The publica-tions can also be viewed and downloaded from the Councils’ websites at www.sligoborough.ie/sedp and www.sligococo.ie/sedp
No A3 or A0 maps
pertaining to this publication
may be copied, reproduced or transmitted
in any form or by any means
without the prior permission
of the copyright owners.
© Ordnance Survey Ireland
Licence number
2008/11CCMA/Sligo Local Authorities
The Plan is accompanied by the following supporting documents:
Joint Sligo City and County Housing Strategy 2010-2017
Joint Sligo City and County Retail Strategy 2010-2017
Environmental Report (Strategic Environmental Assessment)
Five A0 maps and one A1 map are also available as part of the SEDP.
The documents associated with the SEDP are: the Record of Protected Structures for the Sligo and Environs area, the North Fringe Local Area Plan, the Hazelwood-Ballinode Local Area Plan, the Courthouse Urban Design Framework, the Quay Quarter Urban Design Framework and the Centre Block Masterplan.
P r e p a r e d b y
November 2009
Revised edition May 2010

AcknowledgementsHubert Kearns, County Manager
Paula R. Gallagher, A/Director of Planning
Frank Moylan, A/Senior Planner
The Planning Team
Mihaela Davidescu, A/Senior Executive Planner (project co-ordinator)
Stephen Ward, A/Senior Executive Planner
Mairead O’Hara, Executive Planner
Leonora McConville, Executive Planner
Noel Ballantyne, Planning/GIS Technician
Siobhan Ryan, Heritage Officer
Administration
Janet McNamara, Administrative Officer
Anna Jones, Administrative Officer
Terri Dunleavy, Clerical Officer
Pauline Brennan, Clerical Officer
Main contributors
Mary McAuliffe, Arts Officer
Tom Brennan, Senior Engineer
Emer Concannon, Senior Executive Engineer
Sean Martin, A/Senior Architect
Micheal Condren, Senior Executive Parks Superintendent
Special thanks
Tom Kilfeather, Director of Infrastructure
Rita McNulty, Director of Community and Enterprise
Donal Harrison, Senior Engineer
Katrina McDaniel, Senior Executive Engineer
Gary Salter, Senior Executive Engineer
Michael Conway, Executive Engineer
Pat Doyle, Project Engineer
Rosie Morrisey, Assistant Scientist
Paul Hampson, Senior Executive Engineer
Michael Carty, Senior Executive Engineer
Margaret McConnell, Senior Executive Officer
John O’Flaherty, Senior Executive Engineer
Anthony Skeffington, Senior Executive Engineer
The staff of Sligo County Council’s Planning Section
Consultants
The National Building Agency
Roger Tym and Partners
C A A S
Additional inputs
The Members of Sligo Borough and County Councils Cover illustration: WB Yeats (bronze by Rowan Gillespie, 1990) against the Glasshouse (designed by Vincent Hannon Architects, opened in 2007)

Contents
Chapter 1. Existing Context
1.1 Policy documents 1
1.2 Physical development 2
1.3 Demographic trends 3
1.4 Socio-economic trends 4
Chapter 2. Strategic environmental assessment (SEA)
2.1 Legal context 7
2.2 SEA definition 7
2.3 SEA stages 7
2.4 Environmental Report 7
2.5 Scoping 7
2.6 Alternatives 7
2.7 Evaluation of the Plan 8
2.8 Mitigation measures 8
2.9 Monitoring 8
Chapter 3. Strategic goals and broad aims of the SEDP
3.1 Strategic Goals 9
3.2 Broad aims 9
Chapter 4. Growth model and key planning issues
4.1 Revised population projections 11
4.2 Growth model 12
4.3 Key planning issues 12
Chapter 5. Spatial strategy
5.1 Integration of land use and transport 13
5.2 Future City form 14
5.3 Local Area Plans 18
Chapter 6. The economy
6.1 Planning policy context 21
6.2 Employment overview 21
6.3 Economic strategy 22
6.4 Business, enterprise and industry 22
6.5 Retail Strategy 25
6.6 Tourism 31
6.7 Agriculture 32
6.8 Mineral extraction-natural resources 32
Chapter 7. Housing
7.1 Housing strategy 33
7.2 Existing and future housing development 34
7.3 Social and affordable housing 38
7.4 Traveller accommodation 39
7.5 Student accommodation 39
7.6 Voluntary and cooperative housing 39
7.7 Special needs housing 40
Chapter 8. Community facilities
8.1 Delivering community facilities 41
8.2 Education facilities 42
8.3 Healthcare, social and crisis facilities 43
8.4 Facilities for older people 43
8.5 Childcare facilities 43
8.6 Community development 44
8.7 Burial grounds 44
Chapter 9. The value of culture in place-making
9.1 International experience 45
9.2 Cultural policy and planning in Sligo 46
9.3 Cultural infrastructure 46
9.4 Public art 46
9.5 Culture and place-shaping 46
9.6 Cultural planning 47
9.7 Culture-led regeneration in the Green Fort area 47
9.8 Sligo’s Yeatsian legacy 49
Chapter 10. Mobility: effective transport and movement
10.1 Sligo as a regional transportation node 51
10.2 Strategic road proposals 52
10.3 Intra-urban roads 55
10.4 A pedestrian-friendly city centre 59
10.5 Car-parking 61
10.6 Public transport 62
10.7 Cycling 64
Chapter 11. Open space, sports and recreation
11.1 Open space strategy 65
11.2 Hierarchy of parks 66
11.3 Open space objectives 68
11.4 Green corridor objectives 70
11.5 Sports grounds 71
11.6 Playgrounds 71
11.7 Urban Squares 72
Chapter 12. Urban design
12.1 City vision and urban design strategy 73
12.2 City Centre 74
12.3 Character areas within the City Centre 74
12.4 City-Centre urban design initiatives 82
12.5 The Inner City 85
12.6 The Outer City 85
12.7 City Fringes 87
12.8 Urban regeneration 88
12.9 Tall Buildings 89
12.10 Implementing urban design policies 90
Chapter 13. Heritage
13.1 Archaeological heritage 91
13.2 Built heritage 95
13.3 Natural heritage 109
Chapter 14. Environmental infrastructure
14.1 Water supply 115
14.2 Wastewater services 116
14.3 Surface water and flooding 117
14.4 Water quality 119
14.5 Waste management, recycling and reuse 120
14.6 Litter control 121
14.7 Air quality and noise 121
14.8 Major Accidents Directive (Seveso II) 122
14.9 Climate change 122
Chapter 15. Energy and telecommunications
15.1 Energy 123
15.2 Telecommunications 124
Chapter 16. Development management standards
16.1 Development management principles 125
16.2 Site development standards 130
16.3 Residential development standards 133
16.4 Commercial development standards 137
16.5 Community facilities standards 141
16.6 Circulation and parking standards 142
16.7 Renewable energy development 144
16.8 Access to the road network 144
16.9 Development in the Docklands 144
Chapter 17. Implementation 145
Appendix A. Record of Monuments and Places 147


Figures, tables and maps
Chapter 1. Existing Context
Fig. 1.A Sligo Gateway in the context of the Border Region 1
Box 1.B Planning Guidelines relevant to the SEDP 1
Fig. 1.C Sligo and Environs within its Subregion 2
Fig. 1.D Sligo and Environs – urban shape 2
Fig. 1. E Sligo and Environs 3
Fig. 1.F Population change in County Sligo between 2002-2006 3
Box 1. G Summary of Sligo Gateway’s population change between 202-2006 3
Table 1.H Persons in Sligo and Environs classified by age groupin census years 1996, 2002 and 2006 4
Table 1.I Persons aged 15 years and over classified by the highest level of education completed in census years 1996, 2002 and 2006 5
Box 1.J Main projects funded by the NDP in Sligo during 2006-2007 6
Chapter 2. Strategic environmental assessment (SEA)
Fig. 2. A Doughnut City 7
Fig. 2.B Horseshoe City 8
Fig. 2.C Compact City 8
Chapter 4. Growth model and key planning issues
Table 4.A Summary of population change scenarios for SligoCity and County to the years 2016 and 2020 11
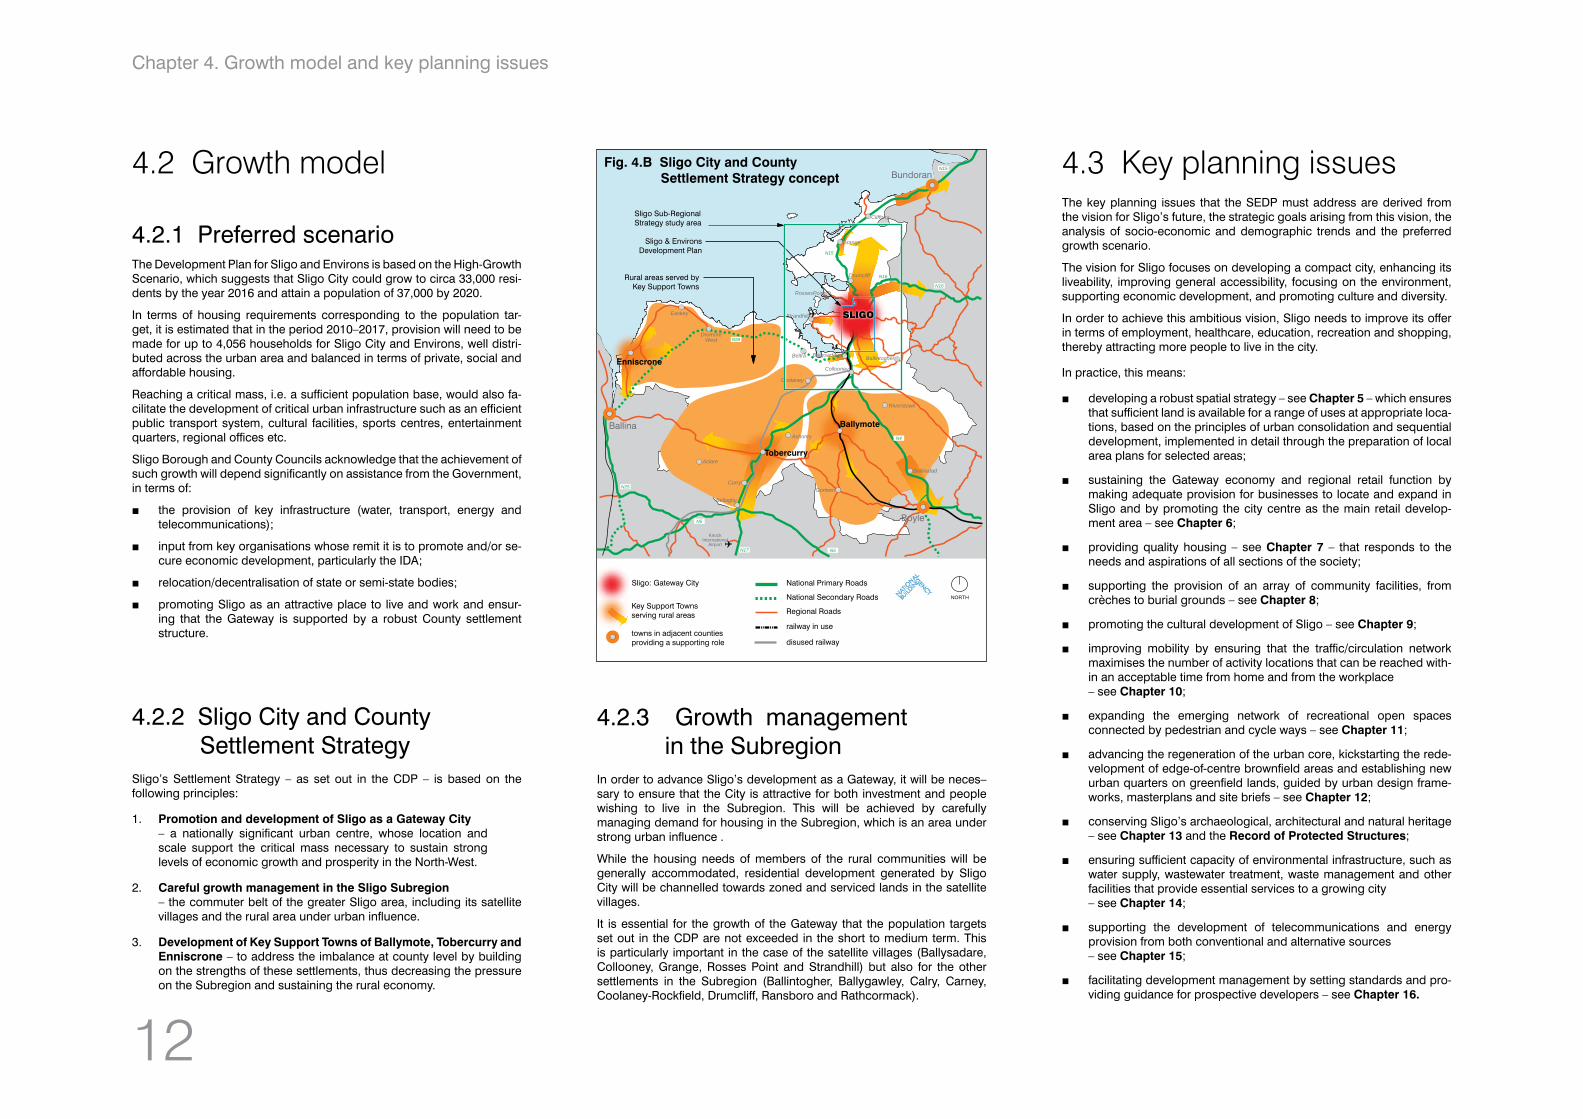
Fig. 4.B Sligo City and County Settlement Strategy concept 12
Chapter 5. Spatial strategy
Table 5.A Existing land use in the SEDP area 13
Fig. 5.B Existing land use (summer 2008) 13
Fig. 5.C Future City structure 14
Fig. 5.D Zoning detail – City Centre and Inner City 15
Box 5.E Principle of sequential development 15
Fig. 5.F Land use zoning within the SEDP area 17
Table 5.G Summary of the proposed land-use zoning 18
Fig. 5.H Existing/proposed local area plans– population capacities 19
Fig. 5.I Potential extent of the future Docklands LAP 20
Fig. 5.I Potential extent of the future Cranmore-Cleveragh LAP 20
Chapter 6. The economy
Box 6.A Enterprise support needs of the Gateways (RPGs) 21
Table 6.B Persons aged 15 years and over classified by principaleconomic status in Census years 1996, 2002 and 2006 21
Table 6.C Persons at work in Sligo and Environs, by industry,in Census years 1996, 2002 and 2006 23
Table 6.D Summary of retail and service outlets in 25Sligo and Environs, 2008
Table 6.E Minimum additional floor space requirements in Sligo City, above the 2008 floor space 26
Chapter 7. Housing
Table 7.A Additional households in need of accommodation inthe SEDP area 2010-2020 33
Fig. 7.B. County Sligo-Rural Housing Policy Map 37
Fig. 7.C Rural Housing Policy in the SEDP area 37
Chapter 8. Community facilities
Fig. 8.A RAPID areas in Sligo Borough 41
Chapter 9. The value of culture in place-making
Fig. 9.A The Green Fort in context 48
Chapter 10. Mobility: effective transport and movement
Fig. 10.A Transport, pedestrian and parking objectives 53
Fig. 10.B Objective T2.4 upgrading of Gibraltar Road and its links 55
Fig. 10.C Objective T 2.12 - a link from Mail Coach Road to Pearse Road 55
Fig. 10.D Objective T2.2 - a local road linking Summerhill Roundaboutto Caltragh and Tonafortes/ Ballyfree 56
Fig. 10.E Proposed links to facilitate accessin the Docklands area 57
Fig. 10.F Proposed upgrades and a new road in the North Fringe area 57
Fig. 10.G Objective T3.12 - Upgrading of Clarion Road 58
Fig. 10.H Objective T3.6 - Upgrading of Oakfield Road and L 36011-0 58
Fig. 10.I Objective T3.2- Upgrading of Ballast Quay 58
Fig. 10.J City Centre traffic management 60
Fig. 10.K Urban design solution for integrating the TransportationHub with Adelaide Square and the City Centre 63
Chapter 11. Open space, sports and recreation
Table 11.A Hierarchy of parks/open spacesin Sligo City and Environs 66
Table 11.B Typology of open space in Sligo City and Environs 66
Fig. 11.C Open space objectives 69
Fig. 11.D Open space in the City Centre 72
Chapter 12. Urban Design
Fig. 12.A Sligo and Environs – urban shape 73
Fig. 12.B Character areas in the City Centre 75
Fig. 12.C Basic principles of the Quay Quarter UDF 77
Fig. 12.D Current planning status (2008) of the Centre Block Masterplan 80
Fig. 12.E Courthouse Block development options 81
Fig. 12.F Possible shape of Adelaide Square at the junctionof Adelaide Street and Lord Edward/Wine Street 82
Fig. 12.G Sites designated for urban regeneration 88
Fig. 12.H Sites identified with potential for tall buildings 89
Chapter 13. Heritage
Fig. 13.A Zones of Archaeological Potential (ZAPs) 93
Fig. 13.B City-Centre buildings listed in theRecord of Protected Structures 97
Fig. 13.C Market Cross ACA 98
Fig. 13.D Courthouse ACA 100
Fig. 13.E Cathedral ACA 102
Fig. 13.F Wolfe Tone Street ACA 104
Fig. 13.G O’Connell Street ACA 106
Fig. 13.H Special Protection Areas (SPAs) 109
Fig. 13.I Special Areas of Conservation (SACs) 110
Fig. 13.J Natural Heritage Areas (NHAs) 111
Chapter 14. Environmental infrastructure
Table 14.A Water supply schemes and proposed upgrades 115
Table 14.B Wastewater services 116
Box 14.C Waste management principles 120
Chapter 16. Development Management Standards
Fig. 16.A Land use zoning within the SEDP area 127
Zoning Matrix 128-129
Table 16.B Minimum required sight distances 142
Table 16.C Vehicle parking requirements 143
Map 1. Zoning Map (A0)
Map 2. Transport objectives (A0)
Map 3. Open space objectives (A0)
Map 4. General objectives (A0)
Map 5. Protected Structures, ACAs and ZAPs (A0)
Map 6. Protected Structures, ACAs and ZAPs in the city centre (A1)


1
Chapter 1. Existing context
Chapter 1. Existing context
1.1 Policy documentsA range of national, regional and local policy documents have been re-viewed as part of the preparation of this Development Plan.
The documents most relevant to the development of Sligo City are:
at national level: the National Spatial Strategy 2002-2021 (NSS) and the National Development Plan 2007-2013 (NDP).
at regional level: the Regional Planning Guidelines for the Border Region 2004-2024 (RPGs) and the Connaught Waste Management Plan 2006-2011. A Western River Basin Management Plan (WRBMP), which covers most of County Sligo, is currently being prepared. The relevant provisions of this plan will be incorporated in the SEDP following adoption of the WRBMP.
at local level: the County Development Plan 2005-2011 (CDP), Sligo Subregional Strategy 2001-2021 and the County Development Board’s Integrated Economic, Social and Cultural Strategy for County Sligo 2002-2012.
The Department of the Environment, Heritage and Local Government (DoEHLG) also issues guidelines for planning authorities (see Box 1.B).
Key messagesKey messages from these policy documents, to which this Plan responds, are as follows:
1. The NSS identifies Sligo as an urban centre to be developed in an accelerated manner as a Gateway City to drive the overall develop-ment of the North-West. Drawing from Sligo Subregional Strategy 2001-2021, Sligo & Environs Development Plan 2004-2010 has set out the for the first time a growth framework for Sligo City. The SEDP 2010-2016 refines and consolidates this framework.
2. The NDP prioritises capital investment in line with the objectives of the NSS through a specific chapter on balanced regional develop-ment. A Gateway Innovation Fund (GIF) has been specified in the NDP 2007-2013. This initiative aims at stimulating the growth of the nine gateways identified under the NSS. The NDP also mentions Sligo as part of the envisaged Atlantic Gateways Corridor.
3. The RPGs seek to promote the growth of the NSS-identified gate-ways within a regional structure that also supports the development of other key settlements in the Border Region and the diversification of rural areas.
4. The CDP responds to the call in the NSS for frameworks at county level designed to achieve balanced development in areas outside the gateways. The CDP establishes a hierarchical settlement struc-ture and outlines the growth potential of key settlements, outside the Gateway. The CDP is also a tool for managing urban and rural devel-opment in the areas directly influenced by Sligo City.
Architectural Heritage Protection (2004)
Architectural Heritage Protection for Places of Worship (2003)
Best Practice Urban Design Manual (2008)
Childcare Facilities Guidelines (2001)
Design Standards for New Apartments (2007)
Development Management Guidelines (2007)
Development Plans Guidelines (2007)
Implementing Regional Planning Guidelines (2005)
Landscape and Landscape Assessment (draft, 2000)
Box 1.B Planning guidelines relevant to the SEDP
Fig 1.A Sligo Gatewayin the context of the Border Region
Provision of Schools and the Planning System (2008)
Quarries and Ancillary Activities (2004)
Retail Planning Guidelines (2005)
Strategic Environmental Assessment - SEA (2004)
Sustainable Residential Development in Urban Areas (2008)
Sustainable Rural Housing (2005)
Telecommunications Antennae and Support Structures
The Planning System and Flood Risk Management (draft, 2008)
Wind Energy Development (2006)

2
Chapter 1. Existing context
1.2.1 Strategic locationWith an estimated population of circa 25,000 in 2008 (refer to Section 1.3 Demographic trends), Sligo and Environs is the largest urban centre in the North-West. Given its location midway between Galway and Derry (circa 140 km from each city), Sligo is the natural capital of a substantial territory in the North-West.
Four national primary roads connect Sligo to Dublin (N4), Belfast (N16/A4), Derry (N15/A5) and Galway (N17), with a national secondary road (N59) linking Sligo to Ballina in Co. Mayo.
Along with its development potential in terms of existing infrastructure and services, Sligo’s strategic location was a critical element in its designation as a Gateway under the NSS.
The city’s spatial position means that it is capable of energising a wider area encompassing parts of Mayo, Donegal and Leitrim, as well as capi-talising on cross-border co-operation initiatives, while being at the north-ern end of an emerging extended Atlantic Gateways corridor (currently comprising only Waterford, Cork, Limerick and Galway).
1.2.2 Landscape settingSligo is located at the mouth of the Garavogue River, between Sligo Har-bour and Lough Gill, where the river originates. The city is surrounded by a mountainous skyline, with the ridges of Slieve Daeane and Killery Moun-tain to the south-east, Cope’s and Keelogyboy Mountains to the north-east, the highly-distinctive Knocknarea to the west and Ben Bulben to the north. These mountains, visible from many locations throughout the city, give Sligo a special sense of enclosure, interrupted only by the openings towards the sea to the west and the picturesque Lough Gill to the east.
The topography is varied within the city and environs. The most notable heights are Cairns Hill and the Green Fort, both containing archaeological remains and offering exquisite views over the city.
1.2.3 Urban shapeWithin the boundary of Sligo Borough, development has mainly taken place to the south, west and north. Noticeable tracts of land have been left unused to the south-west, north-east and east. The Garavogue River and estuary, Lough Gill and the significant woodlands at Hazelwood and Cleveragh have constrained the town to grow predominantly southwards towards Carrowroe and westwards along Strandhill Road.
The three road bridges – Hughes Bridge, Hyde Bridge and New Bridge – connecting the northern and southern parts of the city have gradually be-come less able to cope with the ever-increasing traffic and a fourth bridge is necessary to alleviate the problem.
The city’s shape can be described as follows:
the City Centre lies mostly on the southern side of the Garavogue; it is dominated by retail and other commercial activities. It also con-tains some public-institutional lands with heritage buildings dating from the 18th century, a period of prosperity for the city.
the Inner City surrounding the core features older, established resi-dential areas and substantial amounts of institutional lands, includ-ing former convents, the General Hospital, several schools and the Institute of Technology.
the Outer City combines a variety of uses, from new residential ar-eas developed at Finisklin, Knappaghmore, Caltragh, Carrowroe, Ballinode and Shannon Eighter to business/industrial areas at the Docklands, in Finisklin, Ballytivnan and Rathbraghan; a working port; utilities such as water/wastewater treatment plants (Fox’s Den and Harbour); warehousing and logistics at Belladrihid; retail warehous-es at Carrowroe and Cleveragh; a racecourse at Cranmore; and an expanding recreational area at Cleveragh.
the City Fringes have long been the predilect territory of ribbon de-velopment and single rural houses – see Strandhill Road west of the city, Ballinode-Calry Road or Teesan-Lisnalurg; in more recent times this form of sprawl has been replaced by orderly development.
The gaps visible in the outer city development were caused by a range of factors, such as the undetermined road corridor for the Inner Relief Road and the insufficient resources available for land servicing. With most of
these factors no longer hindering the city’s development, the way is now open for urban consolidation in a planned manner.
At the same time, there are noticeable spots of brownfield (i.e. previously used) and underutilised land within all areas: Centre, Inner and Outer City. Some of these sites have already become the target of urban regenera-tion initiatives, the best example being the Green Fort project, a proposed mixed-use development including landmark cultural facilities.
The Fringes, especially the North Fringe, offer the opportunity of planning and fostering entirely new communities on quasi-greenfield lands where essential infrastructure and services can be provided before development takes place.
1.2 Physical development
Fig. 1.D Sligo and Environs - urban shape
Fig. 1.C Sligo and Environs within its Subregion
City Centre
Inner City
Outer City
Outer City
Outer City
Outer City
CityFringes
CityFringes
CityFringes

1.3 Demographic trends 1.3.1 Population estimatesGateway populationThe population of the Gateway is defined in this Plan as the total popu-lation living inside the SEDP boundary. This figure includes the popula-tion of the Borough and Environs as enumerated by the Census, plus the population living in the suburban fringes and in the rural areas within the Plan limit.
As detailed Census figures for the entire Plan area are not available, the Gateway population is approximated by the total population of the Borough and the five adjoining Electoral Divisions (Calry, Drumcliff East, Drumcliff West, Kilmacowen and Knockaree) minus the population of Strandhill, Rosses Point, Ballincar, Rathcormack and Drumcliff (for the last two settlements, estimates were used).
Thus, the population of the Gateway was estimated at 24,755 in 2006 (a fall of 492 persons compared to 2002).
Population change in Sligo Borough and adjoining elec-toral divisionsDuring the intercensal period 2002-2006, the population of Sligo Borough decreased by 579 persons, from 18,473 to 17,894. This represents a loss of 3.1%, contrasting with the 3.9% population gain during the period 1996-2002.
In the same time, the five electoral divisions (EDs) adjoining the Borough, i.e. Calry, Drumcliff East, Drumcliff West, Kilmacowen and Knockaree, saw their combined population increase by 458 persons, from 9,321 to 9,779. This is a 4.91% increase over four years, comparable with the 8.4% increase over the six years from 1996 to 2002.
Total population living in the City and within 10 miles of itIn 2002, there were 38,780 people living in the Borough and the 29 EDs within 10 miles of the City Centre. By 2006, the population of the same area had grown to 40,011, which represents 65.73% of the total County population. This proportion is somewhat lower than its 2002 equivalent of 66.63% (38,780), but slightly higher than the 1996 ratio of 65.33% (36,468 persons).
The actual number of people living in Sligo Borough and within 10 miles of it has risen, slowly but constantly, by 3,543 persons, or 9.7% between 1996 and 2006.
Possible interpretations of recent population changeThe loss of population from the Borough to the surrounding areas could be attributed to several factors, among which probably the most important is the effect of the Rural Renewal Tax Incentive Scheme, which covered most of the southern and eastern parts of County Sligo and adjoining ar-eas in County Leitrim. The Scheme led to a mini-boom in house construc-tion in towns such as Tobercurry and Ballymote, in smaller villages like Ballysadare, Collooney and Coolaney, and in nearby settlements outside
the County boundaries, such as Dromahair, Manorhamilton and Kinlough in County Leitrim.
The availability of relatively cheap accommodation in a small-town or vil-lage setting, within short commuting distance, combined with the lack of quality new dwellings in Sligo, probably led families to move out of the City.
New residential and commercial development brought about by Sligo’s designation as a Gateway (2002) and the adoption of Sligo & Environs De-velopment Plan 2004-2010, did not begin to materialise until 2005-2006.
A significant number of residential units, many included in mixed com-mercial and residential developments, had been completed by 2008 and others were under construction or at planning/pre-planning stage at the time of preparing the Draft SEDP 2010-2016.
W
Population change by Electoral Division from 2002 to 2006 (percentage classes)
Percentagegain in
population
Percentage loss in
population
30.0% and over
20.0% to 29.9%
10.0% to 19.9%
0.0% to 9.9%
-9.9% to 0.0%
-19.9% to -10.0%
10 miles
Source: Census 2006 data, CSO
Fig. 1.E Sligo and Environs, as defined by Census boundaries (shaded in purple), is much smaller than the area covered by Sligo and Environs Development Plan (area inside the blue line)
Gateway population fell by 1.95% (492 persons).
Sligo Borough’s population decreased by 3.1% (579 persons).
The population of Sligo & Environs (Census area) decreased by 1.69% (333 persons).
The population of Electoral Divisions within 10 miles of Sligo increased by 8.91% (1,810) – growth occurred mainly in satel-lite villages (Strandhill, Collooney, Grange, Ballysadare).
The County’s population as a whole increased by 4.6% (2,663 persons).
Over 40,000 persons (circa 66% of the County’s population) live in Sligo City or within 10 miles of it.
Noticeable population growth in the City was expected in 2007-2008, following the completion of residential developments permitted since 2004 (the year when the first SEDP became operational) – approximately 500 apartments were permitted in the City between 2004 and 2006.
Box. 1.G Summary of Sligo Gateway’s population change between 2002 and 2006
Chapter 1. Existing context
3
Fig. 1.F Population change in County Sligofrom 2002 to 2006

1.3.2 Demographic characteristics
Gender, age and dependency rateCensus 2006 recorded a total of 19,402 living within the Borough and the environs as designated by the boundaries determined by the Central Statistics Office. Of this total, 52% or 10,128 were female and 48% or 9,274 were male. Circa 70% of this population was of working age, i.e. fell into the 15-64 age bracket. There were 3,116 children under 14 years and 2,577 aged 65 and over, giving a total dependency ratio of 2.4 to 1 (2.4 persons of working age for every child under 15 or senior over 64).
Sligo residents’ origin and ethnicityOf the 19,402 people living in Sligo Borough and its environs as defined by the 2006 Census, 18,902 were usually resident in the area. Of these, 3,247 had been born outside Ireland, most of them in the UK (1,285) but also in Poland (596), Lithuania (108), other EU states (424) and outside the EU (834).
Between April 2005 and April 2006 (Census date), 1306 persons had moved from the County to live permanently in Sligo City, with 690 more coming to Sligo from other parts of Ireland. From abroad there was an influx of 858 people in 2005.
Age group Persons 1996 Persons 2002 Persons 2006 Change 1996-2002 Change 2002-2006 Change 1996-2006
0 – 14 years 3,954 (21.36%) 3,645 (18.47%) 3,116 (16.06%)– 300
or fall of 7.59%
– 529
or fall of 14.51%
– 838
or fall of 21.19%
15 – 24 years 3,848 (20.79%) 4,168 (21.12) 3,752 (19.34%)+ 320
or rise of 8.32%
– 416
or fall of 9.98%
– 96
or fall of 2.49%
25 – 44 years 5,164 (27.90%) 5,752 (29.15) 5,803 (29.90%)+ 588
or rise of 11.39%
+ 51
or rise of 0.89%
+ 639
or rise of 12.37%
45 – 64 years 3,291 (17.78%) 3,817 (19.34%) 4,154 (21.41%)+ 526
or rise of 15.98%
+ 337
or rise of 8.83%
+ 863
or rise of 26.22%
65 years and over
2,252 (12.17%) 2,353 (11.92%) 2,577 (13.28%)+ 101
or rise of 4.48%%
+ 224
or rise of 9.52%
+ 325
or rise of 14.43%
Total number of persons
18,509 (100%) 19,735 (100%) 19,402 (100%)+ 1,226
or rise of 6.62%
– 333
or fall of 1.69%
+ 893
or rise of 4.82%
males
8,627
females
9,882
males
9,194
females
10,541
males
9,274
females
10,128
males
+ 567
females
+ 659
males
+ 80
females
– 413
males
+ 647
females
+ 246
Notes:
1. The percentages in brackets in the Persons columns refer to the proportion of that category in the total number of people in the given years, i.e. 1996, 2002 and 2006
2. The percentage changes in the Change columns refer only to the change in the respective category over the given period, i.e. 1996-2002, 2002-2006 and 1996-2006 using the first year as the base year)
Table 1.H Persons in Sligo and Environs classified by age group in Census years 1996, 2002 and 2006
The Traveller community numbered 143 members in 2006. Alongside 17,298 white persons, Sligo was home to 141 Black and 385 Asian people.
Household types and sizesOf the 6972 households counted in 2006, the largest number – 1950 (circa 28%) – consisted of only one person.
Lone parents lived with their children in 886 households, while 680 house-holds were made up of two or more unrelated persons. The parents-and-children families (1880 units) represented 27% of the total number of households.
While the average household size in the Census area was 2.78 (people per household) in 2006, the most frequent type was the two-person household (29% of all), followed by the one-person (28%) and the three-person household types (19%).
In 2006, 1,297 persons lived in 36 communal establishments (e.g. nursing homes and other care institutions).
1.4 Socio-economic trendsAs a significant regional centre for employment, retail, healthcare, education and recreation, Sligo serves a hinterland extending far be-yond the County boundaries.
There is an important manufacturing base in Sligo City, particularly in IDA’s business park at Finisklin, with names such as Abbott, Fort Dodge and Stiefel Laboratories, all pharmaceutical companies. Indigenous firms like Loftus Automation, Avenue Mould solutions, Garmoore and In-facta are engaged in tool-making, precision engineering and information technology.
While the number of manufacturing jobs has been constantly falling, em-ployment in retail and professional services has seen a rapid expansion. Public-sector jobs also continue to represent a sizeable proportion of the City’s employment, due to employers such as Sligo Regional Hospital, Sligo local authorities, primary and secondary schools, third-level institu-tions, and several sections of central government departments.
Over the decade 1996 to 2006, there have been substantial changes not only in the local economy but also in the social fabric of Sligo City. The following two subsections outline the main features of these changes as reflected in statistical data collected by the Censuses of 1996, 2002 and 2006.
Section 1.4.3 lists the achievements under the NDP 2000-2006 and presents the progress to date in implementing the NDP 2007-2013.
1.4.1 Social change
Number of peopleThe Census reports of 1996, 2002 and 2006 provide figures for Sligo Bor-ough and Sligo Environs, which is a smaller area than that covered by the Sligo and Environs Development Plan. However, the main trends for the Plan area can be discerned from examining the available Census figures.
Having grown by 6.62% (1226 persons) between 1996 and 2002, the pop-ulation of (Census-defined) Sligo and Environs then fell by 1.69% (333 persons) between 2002 and 2006. It is not clear from the CSO statistics whether this “lost” population moved just outside the enumeration bound-aries, yet remained in the SEDP area, or went further away.
Ageing populationA trend visible in many Irish cities is the decrease of the younger popula-tion segments combined with a steady increase in the older-age groups. While the entire City population has risen by 893 between 1996 and 2006, there were 838 fewer children under 14 in 2006 compared to 1996, and 325 more people over 65 in Sligo and Environs.
The proportion of under-14s has fallen sharply from 21.36% in 1996 to 16.06% in 2006, while the largest increase was in the share of the 45 to 64 group, from 17.78% in 1996 to 21.41% in 2006.
Chapter 1. Existing context
4

Gender fluctuationsAn interesting development during the 1996-2006 decade was a strong rise in the number of females in 1996-2002 (659 additional females) fol-lowed by a sudden drop in female population between 2002 and 2006 (413 fewer females), especially in the younger age brackets, 15 to 44 years. At the same time, the male population has increased constantly, but with a marked slowdown between 2002 and 2006 – only 80 additional males.
Spatial mobilityCensus data indicates an increasing mobility of Sligo’s population, in par-ticular residential mobility. While in 2002 the Census counted 982 persons who moved to Sligo City from the county and 587 who came from the rest of Ireland during the year before the Census, in 2006 the number of peo-ple in the same situation was 1306 and 690 respectively.
It must be added that in 2002 there were 380 persons who had an address abroad one year before the Census, while in 2006 there were 858 such people.
It appears that Sligo’s core population – i.e. those who were enumerated at the same address in successive censuses – consists of just over 15,800 residents, and there has been significant in- and out-migration between 1996 and 2002, in the range of 12-14% of the total number of residents.
As a proportion, the number of Sligo-born residents has fallen slightly between 1996 and 2006, by 96 people (2.49%).
At the same time, the number of Sligo residents who were not born in the city has grown constantly during the decade 1996-2006: 12.37% more residents born in Northern Ireland; 26.22% more people born in England, Scotland or Wales; 14.43% more persons born in the rest of the EU (ex-cluding the UK); and almost three times more (+ 202.35% or 535) persons born in countries outside the EU.
Better educationA positive trend has been noticed in the field of education, with fewer people ceasing their education at primary or secondary level and more enrolling in third-level education.
Between 1996 and 2006 the number of persons with primary education only has fallen by 836. In the same period, the number of those educated to degree level has grown from 1250 to 1949.
The number of students aged over 15 and engaged in full-time education was 3315 in 2006 compared to 2156 in 1996 – a rise of over 50%.
Social mobilitySocial classes, as defined by the Census, bring together people with simi-lar levels of occupational skills. In determining social class, no account is taken of the differences between individuals on the basis of other charac-teristics such as education. Social class ranks occupations by the level of skill required.
In social class terms, upward social mobility has become apparent in Sligo and Environs. A fall of 43% (533) in the number of unskilled manual workers between 1996 and 2002 has been accompanied by significant rises in the numbers of semi-skilled, technical and professional workers (419, 351 and 186 respectively).
There was also a noticeable growth in the number of persons who cannot be precisely allocated to one of the six other classes. Those gainfully oc-cupied but not readily categorised grew in numbers from 2647 in 1996 to 4290 in 2006 (increase of 62%).
Highest level of education
Persons 1996 Persons 2002 Persons 2006Change 1996-2002
Change 2002-2006
Change 1996-2006
Primary and no formal education
3,046 (20.93%) 2,390 (14.85%) 2,210 (13.57%)– 656 or fall of 21.53%
– 180 or fall of 7.53%
– 836 or fall of 27.45%
No formal education
n/a n/a 86 (0.53%) n/a n/a n/a
Primary education n/a n/a 2,124 (13.04%) n/a n/a n/a
Lower secondary education
2,134 (14.66%) 2,453 (15.25%) 2,407 (14.78%)+ 319 or rise of 14.95%
– 46 or fall of 1.87%
+ 273 or rise of 12.79%
Upper secondary education
3,717 (25.54%) 2,363 (20.90%) 3,608 (22.15%)– 1,354 or fall of 36.43%
+ 1,245 or rise of 52.69%
– 109 or fall of 12.93%
Third-level non-degree education
1,497 (10.29%) 1,408 (8.75%) 1,372 (8.42%)– 89 or fall of 5.95%
– 36 or fall of 2.56%
– 125 or fall of 8.35%
Degree and higher education
1,250 (8.59%) 1,949 (12.11%) 2,314 (14.21%)+ 699 or rise of 55.92%
+ 365 or rise of 18.73%
+ 1,064 or rise of 85.12%
Students* 2,156 (14.81%) 3,199 (19.88) 3,315 (20.35%)+ 1,043 or rise of 48.38%
+ 116 or rise of 3.63%
+ 1,159 or rise of 53.76%
Not stated 755 (5.19%) 1,328 (8.25%) 1,060 (6.51%)+ 573 or rise of 75.89%
– 268 or fall of 20.18%
+ 305 or rise of 40.39%
Total number of persons aged 15 years and over
14,555 (100%) 16,090 (100%) 16,286 (100%)+ 1,535 or rise of 10.54%
+ 196 or rise of 1.22%
+ 1,731 or rise of 11.89%
* Students = persons who were engaged in full-time education at the time of the enumeration.
Table 1.I Persons aged 15 years and over classified by highest level of education completed in Census years 1996, 2002 and 2006
Chapter 1. Existing context
5
Business Innovation Centre at IT Sligo

1.4.2 Economic change
Economic statusOf the 16,286 Sigo residents aged 15 and over, just over half (8670 or 53%) were working in 2006, according to the Census. Only 5.17% (842 persons) were unemployed. The proportion of the labour force in the pop-ulation over 15 was approximately 60% – this includes those working, the unemployed and those looking for their first regular job. This is a visible change compared to 1996, when just 56% of the over-15s were in the la-bour force and only 46.7% (6,803 people) were actually working.
Unemployment, which has fallen by 23% between 1996 and 2006, is ex-pected to rise by the time this Plan is adopted, because of unfavourable economic circumstances.
The most noticeable developments between 1996 and 2006 have been:
a 54.7% rise in the number of persons unable to work due to sickness or disability (281 additional persons);
a 35% fall in the number of people, women in majority, looking after the home and family;
a 31% increase in the number of retired people (489 additional retired)
OccupationsAccording to Census 2006, almost half of Sligo’s working population was engaged in two sectors: retail/wholesale (23%) and professional services (23.3%). Just over 15% of workers had manufacturing jobs, with construc-tion employing 7.71% of those at work. Only 60 people in Sligo and Envi-rons worked in agriculture and forestry in 2006, compared with 77 in 1996.
During the 1996-2006 decade, 17 agricultural and 167 manufacturing jobs had been lost, but this loss has been offset by a total gain of 1,866 jobs (27% more in 2006 than in 1996). Retail/wholesale has been the fastest-growing employment sector, with 923 jobs created between 2002 and 2006. Construction jobs more than doubled from 310 in 1996 to 671 in 2006.
The most stable sectors have been transport (2.29% of jobs lost) and public administration (3.55% increase in job numbers).
1.4.3 NDP support for Sligo’s development
The National Development Plan is the main policy document co-ordinating investment in the State.
In Sligo, the most important achievements under the first NDP (2000-2006) have been:
the completion of the Inner Relief Road/N4 (2005)
the establishment of the broadband Metropolitan Area Network (MAN)
provision of a Renal Unit at Sligo General Hospital (Acute Hos-pitals Measure)
approval of new Business Incubation Centre at Sligo Institute of Technology (now operational)
The second National Development Plan, NDP 2007-2013 – Transforming Ireland: A Better Quality of Life for All, which takes full cognisance of the NSS, recognises Sligo, together with Derry-Letterkenny and Dundalk, as one of the three gateways in the Border Region.
Gateway Innovation FundGateways are entitled to bid for funding through the Gateway Innovation Fund.
In 2007, Sligo local authorities submitted a proposal for funding of four projects under the Gateway Innovation Fund.
The four projects are:
1. Eastern Garavogue Bridge and approach roads (cost – €34 million)
2. Enhancement of O’Connell Street (cost – €5 million)
3. Cultural Quarter / Green Fort Project (cost – €123 million)
4. Cleveragh Regional Park (cost – €25 million)
The total funding sought amounted to circa €69 million. A decision on the application had not yet been made at the time of preparing the Draft SEDP.
1.4.4 Sligo’s socio-economic priorities
Sligo has benefited from infrastructure improvements under the NDP 2000-2006, resulting in increased private sector investment in retailing, hotels and value-added enterprise. Occupying a strategic position in the North-West, Sligo now needs to attract further investment to drive forward the development of the Gateway and expand its hinterland.
From a social and economic perspective, Sligo’s investment priorities are as follows:
the completion of the remaining sections of the N4 (Dublin Road) requiring upgrades;
the development of the Atlantic Road Corridor (N15-N4-N17) enhancing road connections to other Gateways;
construction of new eastern and western urban distributor road sys-tems to open up strategic land banks for accelerated development of new private housing areas;
strengthening the research and development capacity of Sligo Insti-tute of Technology and linkages between third-level institutions and industry;
development of regional sports and recreation facilities;
continued development of the emerging cultural and entertainment quarter;
targeted urban regeneration including urban enhancement, pedes-trianisation and redevelopment of the Docklands area;
continued support for Sligo Regional Airport.
The NDP Annual Report 2007 highlights the most important projects relevant to Sligo, funded in 2006-2007:
Tourism – the hosting of Rally Ireland (November 2007), along with seven other counties both sides of the border.
Education – continued support (through the the Department of Education and Science) of apprenticeship training jointly provided by the Institute of Technology Sligo and the Fermanagh Institute of Further Education in carpentry and joinery. Projects included the refurbishment of the old engineering wing at Sligo Institute of Tech-nology and renovation of the food laboratory at St Angela’s College.
Healthcare – under the Acute Hospitals Sub-Programme, the con-struction of a new Medical Assessment Unit began in 2007 at Sligo General Hospital. The Board of the HSE has approved Sligo Gen e-ral Hospital’s bid under the Government’s Co-location Programme, involving development of private hospitals on public sites.
Decentralisation – the outputs delivered under this Sub-Pro-gramme in 2007 included new buildings for staff of the Department of Social and Family Affairs in Sligo.
Box 1.J Main projects funded by the NDP in Sligo during 2006-2007
Chapter 1. Existing context
6

7
Chapter 2. Strategic Environmental Assessment
Chapter 2. Strategic Environmental Assessment (SEA)2.1 Legal contextIn June 2001, the European Parliament and Council adopted the Strate-gic Environmental Assessment (SEA) Directive (2001/42/EC), which was transposed into Irish law in the form of Statutory Instruments no. 435 and 436 of 2004 (SEA Regulations). Both sets of regulations became opera-tional on 21 July 2004. The Planning and Development (Strategic Environ-mental Assessment) Regulations 2004 (S.I. No. 436 if 2004) is applicable to Sligo and Environs Development Plan.
2.2 SEA definitionSEA is a systematic process for evaluating, at the earliest stage of de-cision-making, the environmental quality and potential consequences of alternative visions incorporated in plans or programmes. The undertaking of a “full SEA”, i.e the preparation of an Environmental Report, is manda-tory in the case of development plans.
2.3 SEA stagesSEA involves several stages, the most important being:
determining the scope of the assessment;
collecting baseline environmental data;
preparing and evaluating alternative development scenarios;
selecting the optimal scenario and preparing the Draft Plan;
assessing the Draft Plan against baseline data and Strategic Environmental Objectives;
modifying and refining the Draft Plan to minimise negative environmental impacts;
recommending mitigation measures;
establishing a system of monitoring the environmental effects of implementing the Plan, based on appropriate indicators and targets.
2.4 Environmental ReportThe Strategic Environmental Assessment of the Sligo and Environs Devel-opment Plan 2010-2016 has been undertaken by environmental consult-ants CAAS on behalf of Sligo Borough and County Councils.
The resultant Environmental Report (ER), which includes a Non-Technical Summary, is published as a separate document.
The ER has informed the policies and objectives included in the Plan and has also suggested appropriate mitigation measures, which were incor-porated in the relevant chapters of the Plan upon its adoption in Novem-ber 2009.
2.5 ScopingThe scope of environmental issues to be dealt with by the SEA, together with the level of detail to which they are to be addressed, was determined in consultation with the prescribed environmental authorities, i.e. the En-vironmental Protection Agency, the Minister for the Environment, Heritage and Local Government and the Minister for Communications, Marine and Natural Resources.
The most important strategic environmental issues in Sligo City and Envi-rons are identified as follows:
the compliance of the Garavogue River, Lough Gill, Sligo Harbour and the area’s underlying groundwater with the objectives of the Water Framework Directive;
the capacity of the wastewater treatment infrastructure;
the protection of: ecological sites designated under the Habi-tats Directive - including Lough Gill SAC and NHA, and Sligo Harbour SPA - and, the protection of shellfish growing areas in Sligo Harbour;
the removal and deposition of dredged material - which may in-clude contaminated soils - and the remediation of contaminated sites in the Docklands area (this will be addressed as part of the preparation of a local area plan for the Docklands);
the avoidance of incompatible development in areas at risk of flooding;
the protection of archaeological heritage and sensitive land-scape features.
2.6 AlternativesThe SEA Directive requires that reasonable alternatives (taking into account the objectives and the geographical scope of the plan) are identified, described and evaluated in relation to their likely significant effects on the environment.
These alternative strategies must be realistic, capable of implementation, and should represent a range of different approaches within statutory and operational requirements of the plan.
Taking into account the objectives and the geographical scope of the SEDP, three alternatives were formulated through consultation between the plan-making team, relevant sections of the local authorities and SEA consultants.
The Doughnut City, the Horseshoe City and the Compact City scenarios provide alternative visions of how the future development of Sligo City and its Environs might occur.
As the SEDP is required to be reviewed and replaced by a new Develop-ment Plan under planning legislation, a do-nothing alternative was not considered.
Sligo HarbourSPA, SAC, NHA
Ballysadare Bay SPA, SAC, NHA
Lough Gill SAC, NHA
HazelwoodDemesne
Cairns Hill
CarrowmoreArea of
Archaeological Amenity
2.6.1 Scenario 1: Doughnut CityScenario 1 is based upon development occurring in a doughnut-shaped pattern, adjoining the existing development limit on its outside. Lands al-ready zoned that surround the existing built-up area of Sligo City would remain largely undeveloped under this scenario. The availability of newer, more affordable residential development in a rural setting - which seems to be preferred by many Sligo residents - would lead to the hollowing-out of the town.
The scenario is strongly informed by the land zoning requests received in submissions made at the pre-draft stage of the Sligo and Environs Devel-opment Plan review process.
The submissions, coming mainly from landowners, generally requested residential and/or mixed–use zoning of lands ouside the development limit pertaining to the SEDP 2004-2010.
Fig. 2.A Doughnut City

8
Chapter 2. Strategic Environmental Assessment
Sligo HarbourSPA, SAC, NHA
Ballysadare Bay SPA, SAC, NHA
Lough Gill SAC, NHA
HazelwoodDemesne
Cairns Hill
CarrowmoreArea of
Archaeological Amenity
North Fringe LAP
Docklands LAP
Hazelwood –Ballinode LAP
Cranmore –Cleveragh
LAP
Caltragh –Carrowroe
LAP
Eastern GaravogueBridge
WesternDistributor
Road
Sligo HarbourSPA, SAC, NHA
Ballysadare Bay SPA, SAC, NHA
Lough Gill SAC, NHA
HazelwoodDemesne
Cairns Hill
CarrowmoreArea of
Archaeological Amenity
RealignedN15
N16Realigned
City Centre
2.6.2 Scenario 2: Horseshoe CityThe practical experience of planners in Sligo’s local authorities indicates that, if development were not controlled, there would be a preference for low-density residential development outside Sligo City and Environs.
This is particularly the case for areas located to the west and north-west of the city along the Strandhill Road and Rosses Point Road (including Ballincar), where a notable amount of ribbon development has occurred.
The demand for housing in these areas is based on the convenient loca-tion between the city and the seaside settlements of Strandhill and Rosses Point.
It appears that views of Sligo Bay, Knocknarea, Benbulben, and also the attraction of living close to the water and not far from the city make these locations highly desirable in residential terms.
The Horseshoe City scenario is based on the intensification of existing uses and further development along the regional roads around Sligo Bay.
2.6.3 Scenario 3: Compact CityScenario 3 is based upon achieving a balance between the consolidation/regeneration of the existing built-up area and the planned expansion of the City into the Environs.
The scenario identifies five areas:
two areas - Sligo Docklands and Cranmore–Cleveragh - would be subject to comprehensive consolidation/regeneration.
the North Fringe area and the south-western quadrant at Caltragh–Carrowroe are identified for the planned expansion of the City.
to the east of the City, the Hazelwood–Ballinode area, for which a Lo-cal Area Plan is already in place, would be subject to a combination of consolidation (at Ballinode) and planned expansion to the east.
The evaluation presented in Sections 7.3 to 7.6 of the Environmental Re-port indicates that the Compact City scenario for the development of Sligo and Environs would involve the smallest number and least extent of po-tential environmental effects. This is the preferred scenario.
2.7 Evaluation of the PlanSection 8 of the Environmental Report evaluates the goals, policies and objectives of this Plan against sixteen Strategic Environmental Objectives (SEOs), making use of the baseline environmental information and a wide range of maps.
The SEOs were developed from international, national and regional policies which generally govern environmental protection objectives.
The SEOs are used as standards against which the development strategies, goals, policies and objectives of the Draft Plan can be evaluated in order to help identify areas in which significant adverse impacts are likely to occur, if unmitigated against.
A total of 143 sets of policies and objectives were assessed against the SEOs. The assessment indicates that:
98 groups of policies and objectives are likely to improve the status of certain SEOs;
85 groups of policies and objectives are potentially conflicting with the status of certain SEOs, but this is likely to be mitigated;
the interaction of 37 groups of policies and objectives with the status of specific SEOs is uncertain;
6 groups of policies and objectives are not likely to interact with the status of the SEOs.
2.8 Mitigation measuresMitigation measures are measures envisaged to prevent, reduce and, as fully as possible, offset any significant adverse impacts on the environ-ment of implementing the Development Plan.
Section 9 of the Environmental Report recommends general mitigation measures, which have been incorporated in the relevant Plan chapters.
Additional and more detailed mitigation measures than those which have been integrated into the Plan are likely to be required by the development management and EIA processes for individual projects.
2.9 MonitoringThe SEA Directive requires that the significant environmental effects of the implementation of plans and programmes are monitored.
Monitoring enables, at an early stage, the identification of unforeseen adverse effects and the undertaking of appropriate remedial action. In addition to this, monitoring can also play an important role in assessing whether the Plan is achieving its environmental objectives and targets and whether the proposed mitigation measures are being implemented.
The Environmental Report puts forward proposals for monitoring the envi-ronmental effects of the SEDP. The proposals include specific indicators and targets as well as suggestions for putting in place a monitoring sys-tem within the local authorities.
Fig. 2.B Horseshoe City Fig. 2.C Compact City

9
Chapter 3. Strategic goals and broad aims
In recent years, population growth in Gateways has been below levels required for them to perform their lead regional development roles. Population growth in the period from 2002 to 2006 in all Gateways
taken together was 1.0 % per year, half the national population growth rate of 2.0%.
In the Border Region, the population of Sligo – as enumerated within Cen-sus boundaries – declined by 0.4 % p.a. To an extent, this trend reflects the existence of a commuter belt extending far beyond the boundaries of Sligo and Environs as defined in this Plan.
Given the NSS aim of creating more compact, yet expanding urban areas as motors for regional development, the modest changes experienced by Sligo City between 2002 and 2006, combined with a difficult economic environment at national level and international level, poses substantial challenges for the future, especially in the short and medium term.
3.1 Strategic goalsTaking account of recent policies, development trends, the achievements of the previous SEDP and the collective implications of the above for the period to 2016, the strategic goals of this Development Plan are:
SG-1 To support the full implementation of the Gateway status for the City of Sligo, as set out in the NSS, by ensuring the structured and orderly development of Sligo as a compact and sustainable city.
SG-2 To encourage and facilitate the economic development of the Gateway, in co-operation with relevant government bodies, third-level institutions, other state/semi-state agen-cies and the private sector.
SG-3 To promote vigorously Sligo City’s keystone role in the County Settlement Strategy, while managing growth in the Subregion and consolidating the Key Support Towns that sustain villages and rural communities in County Sligo.
SG-4 To drive forward the development of the Gateway City of Sligo towards the NSS target population of 42,000 by 2020.
SG-5 To ensure that the nationally- and internationally-renowned natural and cultural heritage of Sligo City is wisely con-served and enhanced, as a key aspect of Sligo’s identity and attractiveness for economic activity, and as a legacy to be handed forward to future generations.
SG-6 To build up linkages between Sligo and the other Gateways and Hubs within the Border Region and adjoining regions, such as the Western Region and Northern Ireland, by sup-porting the implementation of the RPGs, collaborating on support for critical enabling infrastructure such as road and rail connections, and cooperating in areas of mutual plan-ning interest.
3.2 Broad aims BA-1 Supporting balanced economic developmenta. Facilitate and encourage the sustainable development of the Gate-
way City of Sligo as an economic growth driver for the North-West, in accordance with the NSS.
b. Integrate business locations with the surrounding land use and transportation network.
c. Work with the providers of infrastructure to ensure adequate provi-sion in terms of road, rail, aviation, energy and telecommunications.
d. Work in partnership with key organisations, such as the Industrial Development Agency and Enterprise Ireland, whose remit it is to pro-mote and/or secure economic development.
e. Involve Sligo Institute of Technology in the promotion of Sligo as a cen-tre of third-level education and hence an attractive place for investment.
f. Promote Sligo City as a suitable location for the relocation/decen-tralisation of state and semi-state bodies.
g. Promote Sligo as a higher-order retail and service centre – including healthcare, education, recreation and culture – for a regional catch-ment area.
BA-2 Carefully managing development patternsa. Implement a robust settlement strategy that emphasises the role of
the Gateway City and seeks to maintain the distinctive landscape at-tributes of Sligo.
b. Encourage a mix of land uses integrated with an effective transport network, capable of supporting viable public transport systems and reducing car-based commuting.
c. Promote the consolidation of Sligo City through regeneration and phased expansion based on local area plans.
d. Counteract tendencies towards extensive ribbon development and urban sprawl in the immediate environs of Sligo.
e. Strengthen existing rural communities by ensuring that the planning system facilitates both the housing needs of all persons with links to rural areas, as provided for in the NSS, as well as local enterprise initiative.
BA-3 Protecting environmental qualitya. Wisely conserve the natural and built heritage of Sligo City and the
surrounding area, including the character of the landscape, views and prospects, and the environmental quality of the urban setting.
b. Conserve the historic form and character of Sligo City.
c. Protect the landscape character and ecological integrity of the coastal and lakeshore zone.
d. Promote sustainable water use, based on long-term protection of water resources, and provide for sufficient supply of good quality surface and groundwater.
e. Implement the provisions of the Western River Basin Management Plan (WRBMP).
f. Support the implementation of the National Climate Change Strategy 2007-2012 and successor documents.
BA-4 Increasing mobility sustainablya. Target, prioritise and promote investment in inter-city road and rail
connections, as a means of realising Sligo’s potential as an impor-tant economic centre in the North-West.
b. Support effective and sustainable public transport through the provi-sion of a high-quality bus and rail service with adequate park-and-ride facilities, alongside the promotion of cycle and pedestrian links.
c. Encourage large employers, including public institutions (such as schools), to locate on sites where public transport is available or can be easily provided.
d. Support the development and use of Sligo Regional Airport so as to ensure and enhance Sligo’s accessibility to tourists and businesses, both nationally and internationally.
BA-5 Delivering improved infrastructurea. Provide adequate drinking water, wastewater treatment, water man-
agement services and associated network capacity to accommodate the projected needs of the future population and local businesses.
b. Maximise the use of existing water supply, sewerage, electricity and telecommunications networks and support the extended provision of broadband.
c. Promote the development of gas supply and the generation of alter-native energy forms in Sligo.
d. Implement the Connacht Waste Management Plan 2006-2011 and successor policy documents.
e. Extend the range of recreational facilities and infrastructure provided within parks and other types of open space throughout the Plan area.
Chapter 3. Strategic goals and broad aims of the SEDP
Sligo Borough Council and Sligo County Council will make full use of all their statutory powers to secure the implementation of the strate-gic goals, broad aims, policies and objectives of Sligo and Environs Development Plan. Where necessary and appropriate, lands may be compulsorily purchased in order to progress the implementation of particular objectives of Sligo and Environs Development Plan.


11
Chapter 4. Growth model and key planning issues
T his section expands on the core aims of the Development Plan by outlining a growth framework for the Gateway City based on the Settlement Strategy set out in Sligo County Development Plan
(CDP) and a set of three adjusted population change scenarios developed in light of revised Gateway population targets recommended by the DoEHLG in 2007.
Gateway populationAs indicated in Section 1.3.1 Population estimates, the population of the Gateway is defined as the total population living within the area covered by the Sligo and Environs Development Plan.
This figure includes the residents of Sligo Borough and the Environs as counted by the Census plus the population living in the suburban fringes and in the rural areas within the Plan limit, which includes part of the electoral division of Calry, Drumcliff East, Drumcliff West, Kilmacowen and Knockaree.
The population of the Gateway City of Sligo and Environs is estimated to have been 24,755 in 2006.
Chapter 4. Growth model and key planning issues4.1 Revised population
projectionsIn 2005, having reconsidered its population forecasts in light of the NSS, Sligo County Council provided a proactive basis for the future development of the county, centred on developing Sligo City towards the critical mass that is necessary to sustain the County and the NorthWest into the future.
This involved aiming towards a longterm, strategic population horizon of 50,000 to 80,000 over 20 to 30 years. Of the four population change models that were developed as part of the CDP preparation, the Fast Growth Scenario was selected as the preferred one. This scenario envisaged a County population of up to 75,000 by 2011, with a Gateway population of 35,000–40,000.
Following the publication of Census 2006 reports, it became apparent that despite the Border Region’s population growing more than anticipated
(according to the CSO’s Regional Population Projections 2005), Sligo and Environs – as defined by Census boundaries – had lost 1.69 % of its population (333 residents).
In 2007, revised Regional Population Projections were published by the CSO and subsequently the DoEHLG recommended that Regional Authorities adjust their Gateway population targets.
Based on the Revised Regional Population Projections for the Border Region (RRPPs), the Border Authority recommended that Sligo Borough and County Councils have regard to the RRPPs and consider a target of circa 77,000 residents for the County, of which 42,000 to be resident in the Gateway by the year 2020.
4.1.1 Population change scenariosThree population change scenarios were developed for the purpose of both this Development Plan and the County Development Plan 20112017: a current trend/lowgrowth scenario, a highgrowth scenario and a revised NSStarget scenario. These are summarised in Table 4.A.
4.1.2 Selecting a scenarioIt is evident from Table 4.A that:
a. the lowgrowth scenario would attain neither the Gateway nor the County revised NSS population targets;
b. simultaneous attainment of both Gateway and County revised NSS population targets would involve a substantial depopulation of rural areas.
Therefore, the high-growth scenario is the preferred growth model, as it proposes balance between Gateway and the rest of the County.
The HighGrowth Scenario would see the County population reach the revised NSS target, with substantial progress towards the 42,000 target for the Gateway. Fewer people would be living in the countryside but more would reside in small villages where services and transport can be provided more efficiently.
Regardless of what scenario is selected, the key driver of Sligo City’s population increase is the extent of net migration into the Gateway, which in turn is dependent mainly on business development and job creation, supported by local entrepreneurship and investment in physical and social infrastructure.
Scenarios - main assumptions
Total County population Gateway population Rest of County
population
2016 2020 2016 2020 2016 2020
Low-growth scenario This scenario is based on the recent performance of the housing market, which is considered a reasonable indicator of the general economic trend.
68,000 71,000 29,700 32,000 38,000 39,000
High-growth scenarioThe scenario assumes improved socio-economic conditions and subsequent higher population growth attaining the NSS target for the County, distributed in a balanced manner between Gateway, key support towns, satellites and settlements with special functions, in accordance with the Settlement Strategy
73,000 77,000 33,000 37,000 40,000 39,000
Revised NSS-target scenarioThis scenario assumes that both County and Gateway population targets will be achieved by 2020, with growth strongly concentrated in the Gateway and population declining in rural County areas
73,000 77,000 38,700 42,000 34,000 35,000
Table 4.A Summary of population change scenarios for Sligo City and County to the years 2016 and 2020 (roundedup/down figures)
12
Chapter 4. Growth model and key planning issues
4.2.1 Preferred scenarioThe Development Plan for Sligo and Environs is based on the HighGrowth Scenario, which suggests that Sligo City could grow to circa 33,000 residents by the year 2016 and attain a population of 37,000 by 2020.
In terms of housing requirements corresponding to the population target, it is estimated that in the period 2010–2017, provision will need to be made for up to 4,056 households for Sligo City and Environs, well distributed across the urban area and balanced in terms of private, social and affordable housing.
Reaching a critical mass, i.e. a sufficient population base, would also facilitate the development of critical urban infrastructure such as an efficient public transport system, cultural facilities, sports centres, entertainment quarters, regional offices etc.
Sligo Borough and County Councils acknowledge that the achievement of such growth will depend significantly on assistance from the Government, in terms of:
the provision of key infrastructure (water, transport, energy and telecommunications);
input from key organisations whose remit it is to promote and/or secure economic development, particularly the IDA;
relocation/decentralisation of state or semistate bodies;
promoting Sligo as an attractive place to live and work and ensuring that the Gateway is supported by a robust County settlement structure.
4.2.2 Sligo City and County Settlement Strategy
Sligo’s Settlement Strategy – as set out in the CDP – is based on the following principles:
1. Promotion and development of Sligo as a Gateway City – a nationally significant urban centre, whose location and
scale support the critical mass necessary to sustain strong levels of economic growth and prosperity in the NorthWest.
2. Careful growth management in the Sligo Subregion – the commuter belt of the greater Sligo area, including its satellite
villages and the rural area under urban influence.
3. Development of Key Support Towns of Ballymote, Tobercurry and Enniscrone – to address the imbalance at county level by building on the strengths of these settlements, thus decreasing the pressure on the Subregion and sustaining the rural economy.
4.2.3 Growth management in the Subregion
In order to advance Sligo’s development as a Gateway, it will be neces–sary to ensure that the City is attractive for both investment and people wishing to live in the Subregion. This will be achieved by carefully managing demand for housing in the Subregion, which is an area under strong urban influence .
While the housing needs of members of the rural communities will be generally accommodated, residential development generated by Sligo City will be channelled towards zoned and serviced lands in the satellite villages.
It is essential for the growth of the Gateway that the population targets set out in the CDP are not exceeded in the short to medium term. This is particularly important in the case of the satellite villages (Ballysadare, Collooney, Grange, Rosses Point and Strandhill) but also for the other settlements in the Subregion (Ballintogher, Ballygawley, Calry, Carney, CoolaneyRockfield, Drumcliff, Ransboro and Rathcormack).
4.2 Growth model
N16
N15
N4
N59
N17
N5
N25
N5
N15
N16
Strandhill
Rosses Point
Drumcliff
Grange
Cliffony
Ballinafad
Tobercurry
Achonry
Ballymote
Riverstown
BallintogherBallysadare
Collooney
Coolaney
Beltra
DromoreWest
Aclare
Enniscrone
Gorteen
Bellag hy
Curry
SLIGO
Boyle
Ballina
Bundoran
Easkey
Knock International
Airport
Rural areas served by Key Support Towns
Sligo Sub-Regional Strategy study area
Sligo & Environs Development Plan
NORTH
Sligo: Gateway City
Key Support Townsserving rural areas
towns in adjacent countiesproviding a supporting role
National Primary Roads
National Secondary Roads
Regional Roads
railway in use
disused railway
Fig. 4.B Sligo City and County Settlement Strategy concept
4.3 Key planning issuesThe key planning issues that the SEDP must address are derived from the vision for Sligo’s future, the strategic goals arising from this vision, the analysis of socioeconomic and demographic trends and the preferred growth scenario.
The vision for Sligo focuses on developing a compact city, enhancing its liveability, improving general accessibility, focusing on the environment, supporting economic development, and promoting culture and diversity.
In order to achieve this ambitious vision, Sligo needs to improve its offer in terms of employment, healthcare, education, recreation and shopping, thereby attracting more people to live in the city.
In practice, this means:
developing a robust spatial strategy – see Chapter 5 – which ensures that sufficient land is available for a range of uses at appropriate locations, based on the principles of urban consolidation and sequential development, implemented in detail through the preparation of local area plans for selected areas;
sustaining the Gateway economy and regional retail function by making adequate provision for businesses to locate and expand in Sligo and by promoting the city centre as the main retail development area – see Chapter 6;
providing quality housing – see Chapter 7 – that responds to the needs and aspirations of all sections of the society;
supporting the provision of an array of community facilities, from crèches to burial grounds – see Chapter 8;
promoting the cultural development of Sligo – see Chapter 9;
improving mobility by ensuring that the traffic/circulation network maximises the number of activity locations that can be reached within an acceptable time from home and from the workplace
– see Chapter 10;
expanding the emerging network of recreational open spaces connected by pedestrian and cycle ways – see Chapter 11;
advancing the regeneration of the urban core, kickstarting the redevelopment of edgeofcentre brownfield areas and establishing new urban quarters on greenfield lands, guided by urban design frameworks, masterplans and site briefs – see Chapter 12;
conserving Sligo’s archaeological, architectural and natural heritage – see Chapter 13 and the Record of Protected Structures;
ensuring sufficient capacity of environmental infrastructure, such as water supply, wastewater treatment, waste management and other facilities that provide essential services to a growing city
– see Chapter 14;
supporting the development of telecommunications and energy provision from both conventional and alternative sources
– see Chapter 15;
facilitating development management by setting standards and providing guidance for prospective developers – see Chapter 16.


![Sligo tourism social_media_training_module_4[1]](https://img.pdfslide.us/doc/110x75/546fa561af7959d6478b46da/sligo-tourism-socialmediatrainingmodule41.jpg)