Embed Size (px)
Citation preview

Slide Source:Lipids Online Slide Librarywww.lipidsonline.org
New Approaches to Achieving New Approaches to Achieving Good Glycemic Control in Type 2 Good Glycemic Control in Type 2 Diabetes: Diabetes: Part 1Part 1

Slide Source:Lipids Online Slide Librarywww.lipidsonline.org
Challenges and Solutions :
Too many patients! – Prevention strategies can work
Failure to attain and sustain optimal long-term glycemic control
Hypoglycemia – major limitation to intensive therapy
Inadequate postprandial glucose control
Unpredictable glucose fluctuations
Weight gain – new treatments lead to weight loss
Excess cardiovascular disease and events
Attempting normoglycemia led to increased mortality
Not enough comparative effectiveness studies that are long term – UKPDS and ADOPT demonstrated differences between drugs in the long term
Despite Important Advances in Therapy, Despite Important Advances in Therapy, Glycemic Control Is Not OptimalGlycemic Control Is Not Optimal

Slide Source:Lipids Online Slide Librarywww.lipidsonline.org
Unmet ChallengesUnmet Challenges
Attaining standards of care– Identifying most effective sequence and
combination of therapies
Linking effective diabetes therapies with:– Long-term (durable) glucose control– Proven micro- and macrovascular protection– No side effects such as weight gain and
hypoglycemia– Patient friendliness and not increasing burden
Developing novel therapies based on pathophysiological defects

Slide Source:Lipids Online Slide Librarywww.lipidsonline.org
Pathogenesis Concepts in Type 2 Pathogenesis Concepts in Type 2 DiabetesDiabetes Insulin resistance occurs early, before glucose
intolerance– Genetic cause?– Environmental: obesity, aging, lifestyle, etc.
Healthy cells compensate and remain euglycemic
“Susceptible” cells (in predisposed individuals) -cell dysfunction results in imperfect
compensation– Progress to prediabetes stage– Onset of acquired abnormalities leads to worse
hyperglycemia=glucotoxicity (a vicious cycle)

Slide Source:Lipids Online Slide Librarywww.lipidsonline.org
Pathogenesis of Type 2 DiabetesPathogenesis of Type 2 Diabetes
HyperglycemiaHyperglycemiaHyperglycemiaHyperglycemia
LiverLiver
Increased GlucoseIncreased GlucoseProduction Production
Reprinted with permission from DeFronzo RA. Diabetes. 1988;37:667-687. Copyright © 1998 American Diabetes Association. All rights reserved.
Impaired Insulin Impaired Insulin SecretionSecretion
PancreasPancreas
LiverLiver
Decreased Decreased Glucose UptakeGlucose Uptake
MuscleMuscle

Slide Source:Lipids Online Slide Librarywww.lipidsonline.org
75
100
125
150
Pancreatic Islet Dysfunction Leads to Insufficient Pancreatic Islet Dysfunction Leads to Insufficient Insulin and Elevated Glucagon in Type 2 DiabetesInsulin and Elevated Glucagon in Type 2 Diabetes
Reprinted with permission from Müller WA et al. N Engl J Med. 1970;283:109-115. Copyright © 1970 Massachusetts Medical Society. All rights reserved.
pg
/mL
CHO = high-carbohydrate; NGT = normal glucose tolerance; TD2 = type 2 diabetes
Time (min)
0 60 120 180 240-60
GlucagonGlucagon
0
50
100
150
uU
/mL
InsulinInsulin
GlucoseGlucose
T2D
NGT
T2D
NGT
0100
200
300
400CHO meal
mg/d
L T2D
NGT

Slide Source:Lipids Online Slide Librarywww.lipidsonline.org
Reprinted with permission from DeFronzo R et al. Reprinted with permission from DeFronzo R et al. DiabetesDiabetes. 2009;58:773-795. . 2009;58:773-795. Copyright © 2009 American Diabetes Association. All rights reserved.Copyright © 2009 American Diabetes Association. All rights reserved.
Ominous OctetOminous Octet
In c re a s e dH G P
H y p e rg ly c e m ia
E T IO L O G Y O F T 2 D M
D E F N 7 5 -3 /9 9 D e c re a s e d G lu c o s eU p ta k e
Im p a ire d In s u linS e c re tio n In c re a s e d L ip o ly s is
DecreasedDecreasedIncretin EffectIncretin Effect
Decreased InsulinDecreased InsulinSecretionSecretion
IncreasedIncreasedHepatic GlucoseHepatic Glucose
ProductionProduction
Islet– cell
IncreasedIncreasedGlucagonGlucagonSecretionSecretion
Decreased Decreased Glucose UptakeGlucose Uptake
Increased Increased LipolysisLipolysis
IncreasedIncreasedGlucoseGlucose
ReabsorptionReabsorption
HYPERGLYCEMIAHYPERGLYCEMIA
NeurotransmitterNeurotransmitterDysfunctionDysfunction

Slide Source:Lipids Online Slide Librarywww.lipidsonline.org
Agent Examples Mechanism Action
SUsSUs glyburide, glipizide, glimepiride
Closes KATP channels Pancreatic insulin secretion
‘‘GlinidesGlinides repaglinide, nateglinide
Closes KATP channels Pancreatic insulin secretion
BiguanidesBiguanides metformin Activates AMP-kinase Hepatic glucose production
TZDsTZDs rosiglitazone, pioglitazone
Activates PPAR- Peripheral insulin sensitivity
-GIs-GIs acarbose, miglitol Blocks small bowel-glucosidase
Intestinal carbohydrate absorption
GLP-1 R GLP-1 R agonistsagonists
exenatide, liraglutide
Activates GLP-1 receptors
Pancreatic insulin secretion; glucagon secretion; delays gastric emptying; satiety
Amylino-Amylino-mimeticsmimetics
pramlintide Activates amylin receptors
Pancreatic glucagon secretion; delays gastric emptying; satiety
DPP-4 DPP-4 inhibitorsinhibitors
sitagliptin, saxagliptin
Inhibits DPP-4, endogenous incretins
Pancreatic insulin secretion; pancreatic glucagon secretion
Bile acid Bile acid sequestrantssequestrants
colesevelam Binds bile acid cholesterol
?
D2 agonistsD2 agonists bromocriptine Activates dopaminergic receptors
‘Resets hypothalamic circadian organization’; insulin sensitivity
T2DM: Therapeutic Landscape (Noninsulin) 2012T2DM: Therapeutic Landscape (Noninsulin) 2012
Inzucchi SE et al. Diabetes Care 2012;35:1364-1379.

Slide Source:Lipids Online Slide Librarywww.lipidsonline.org
Agent A1c Advantages Disadvantages Cost
SUsSUs 1–2% Microvasc risk Hypo, wt gain, -cell exhaust
$
‘‘GlinidesGlinides 1–1.5% PPG Hypo, wt gain, -cell exhaust, dose frequency
$ $ $
BiguanidesBiguanides 1–2% Wt loss, no hypo, CVD, ? malignancy
GI, lactic acidosis B12-deficiency
$
TZDsTZDs 1–1.5% No hypo; -cell preservTG HDL BP ? CVD (pio)
Wt gain, edema / HF Bone fxs, ? CVD (rosi)
$ $ $
-GIs-GIs 0.5–1% PPG, ? CVD; GI, dose frequency $ $
GLP-1 R GLP-1 R agonistsagonists
1% Wt loss,? -cell preserv, ? CV benefits
GI; ? pancreatitis, injections
$ $ $
Amylino-Amylino-mimeticsmimetics
0.5% Wt loss, PPG GI, dose frequency, injections
$ $ $
DPP-4 DPP-4 inhibitorsinhibitors
0.6–0.8% No hypo Urticaria / Angioedema; ? pancreatitis
$ $ $
Bile acid Bile acid sequestrantssequestrants
0.5% No hypo; LDL-C GI; TGs $ $ $
D2 agonistsD2 agonists 0.5% No hypo Nausea; dizziness $ $ $
T2DM: Therapeutic Landscape (Noninsulin) 2012T2DM: Therapeutic Landscape (Noninsulin) 2012
Inzucchi SE et al. Diabetes Care 2012;35:1364-1379.

Slide Source:Lipids Online Slide Librarywww.lipidsonline.org
Prevention of Type 2 DiabetesPrevention of Type 2 DiabetesStudy Subjects Intervention Relative Risk Reduction
Da Quing1 IGT Diet or Exercise or Both 42% / 49% / 34%
Finnish DPS2 IGT Lifestyle 58%
DPP3 IGT Lifestyle 58%
DPP3 IGT /“IFG” Metformin 31%
STOP-NIDDM4 IGT Acarbose 25%
EDIP5 IFG Acarbose NS
XENDOS6 IGT Orlistat 45%
TRIPOD7 Prior GDM Troglitazone 55%
DREAM8,9 IFG Rosiglitazone / Ramipril 62% / NS
ACT NOW10 IGT Pioglitazone 72%
ORIGIN11 IGT / “IFG” Insulin Glargine / Omega-3
1Li G et al. Lancet. 2008;371:1783-1789 | 2Tuomilehto J et al. N Engl J Med. 2001;344:1343-1350 | 3Diabetes Prevention Program Research Group. N Engl J Med. 2002;346:393-403 | 4Chiasson JL et al. Lancet. 2002;359:2072-2077| 5Kirkman MS et al. Diabetes Care. 2006;29:2095-2101 | 6Torgerson JS et al. Diabetes Care. 2004;27:155-161 | 8DREAM Trial Investigators. Lancet. 2006;368;1096-1105 | 9DREAM Trial Investigators. N Engl J Med. 2006;355:1551-1562 | 10DeFronzo RA et al. N Engl J Med. 2011;364:1104-1115 | 11ORIGIN Trial Investigators. Am Heart J. 2008;155:26-32.
IFG: impaired fasting glucoseIGT: impaired glucose toleranceGDM: gestational diabetes mellitusNS: not significant
Med
icati
on
Behavio
r

Slide Source:Lipids Online Slide Librarywww.lipidsonline.org
Screening and Diagnosis ofScreening and Diagnosis ofDisorders of Glucose MetabolismDisorders of Glucose Metabolism
• IFG: fasting (8 hours) plasma glucose 100–125 mg/dL• IGT: 2-hour value in 75-g OGTT 140–199 mg/dL• Diabetes: FPG ≥ 126 mg/dL or 2-hour OGTT ≥ 200 mg/dL; should be confirmed on a separate
day
IFG or IGTIFG or IGTIFG or IGTIFG or IGT IFG and IGTIFG and IGT+ Other Features*+ Other Features*
IFG and IGTIFG and IGT+ Other Features*+ Other Features* DiabetesDiabetesDiabetesDiabetes
Screen for Diabetes:Screen for Diabetes:Fasting plasma glucose orFasting plasma glucose or2-hour, 75-g oral glucose 2-hour, 75-g oral glucose
tolerance testtolerance test
Screen for Diabetes:Screen for Diabetes:Fasting plasma glucose orFasting plasma glucose or2-hour, 75-g oral glucose 2-hour, 75-g oral glucose
tolerance testtolerance test
Lifestyle InterventionLifestyle InterventionLifestyle InterventionLifestyle Intervention Lifestyle InterventionLifestyle Interventionand / or Metforminand / or Metformin
Lifestyle InterventionLifestyle Interventionand / or Metforminand / or Metformin
Lifestyle InterventionLifestyle Intervention+ Metformin+ Metformin
Lifestyle InterventionLifestyle Intervention+ Metformin+ Metformin
*<60 years of age, reduced HDL-C, BMI ≥35 kg/m2, hypertension, elevated triglycerides, A1C >6.0%, family history of diabetes in first-degree relative
IFG=impaired fasting glucose; IGT=impaired glucose tolerance

Slide Source:Lipids Online Slide Librarywww.lipidsonline.org
The ABCs of Diabetes CareThe ABCs of Diabetes Care
A1C– American Diabetes Association (ADA) recommends A1C <7.5%
= average glucose of 150 mg/dL– American Association of Clinical Endocrinologists (AACE) /
International Diabetes Federation (IDF) recommend A1C <6.5% = average glucose of 135 mg/dL
Blood pressure– <130/80 mm Hg
Cholesterol– LDL-C: <100 mg/dL (<70 mg/dL in very high-risk patients)– HDL-C: >40 mg/dL in men and >50 mg/dL in women– Non-HDL-C: <130 mg/dL (100 mg/dL in high-risk patients)– TG: <150 mg/dL
Don’t forget aspirin!
American Diabetes Association. Diabetes Care. 2005;28:S4-S36 |International Diabetes Federation. Diabetic Med. 1999;16:716-730.

Slide Source:Lipids Online Slide Librarywww.lipidsonline.org
ACCORD Study Group. N Engl J Med. 2008;358:2545-2559 | ADVANCE Collaborative Group. N Engl J Med. 2008;358:2560-2572.
10,251 participants
Mean age: 62 years
Median duration of diabetes
mellitus: 10 years
Mean A1C at entry: 8.3%
Known heart disease or
at least 2 risk factors
10,251 participants
Mean age: 62 years
Median duration of diabetes
mellitus: 10 years
Mean A1C at entry: 8.3%
Known heart disease or
at least 2 risk factors
Standard
A1C 7.0%–7.9%
Standard
A1C 7.0%–7.9%
ACCORDACCORD ADVANCEADVANCE
Intensive
A1C <6.0%
Intensive
A1C <6.0%
CONCLUSION: Intensive glucose-lowering did not significantly reduce CVD events (primary outcome) may cause harm in high-risk patients with type 2 diabetes (increased mortaltiy).
CONCLUSION: Intensive glucose-lowering did not significantly reduce CVD events (primary outcome) may cause harm in high-risk patients with type 2 diabetes (increased mortaltiy).
11,140 participants
Mean age: 66 years
Mean duration of diabetes
mellitus: 8 years
Mean A1C at entry: 7.48%
History of major CV event
or at least 1 risk factor
11,140 participants
Mean age: 66 years
Mean duration of diabetes
mellitus: 8 years
Mean A1C at entry: 7.48%
History of major CV event
or at least 1 risk factor
Standard
A1C usual care
Standard
A1C usual careIntensive
A1C ≤6.5%
Intensive
A1C ≤6.5%
CONCLUSION: Intensive glucose-lowering did not significantly reduce CVD events (primary outcome) reduces renal complications in high-risk patients by 21% (95% CI, 7–34%) and did not increase mortality
CONCLUSION: Intensive glucose-lowering did not significantly reduce CVD events (primary outcome) reduces renal complications in high-risk patients by 21% (95% CI, 7–34%) and did not increase mortality
Main Findings from the ACCORD and Main Findings from the ACCORD and ADVANCE StudiesADVANCE Studies

Slide Source:Lipids Online Slide Librarywww.lipidsonline.org
A1C <7.0% Is Appropriate for Most A1C <7.0% Is Appropriate for Most Patients with DiabetesPatients with Diabetes
An A1C value of <7.0% is appropriate and well supported by clinical trial results:– There are no data to support an A1C goal of <7.0% for reducing
cardiovascular risk
For individual patients, intensifying the regimen should be weighed by the potential risks and benefits:– History of severe hypoglycemia– Limited life expectancy– Children – Comorbid conditions– Longstanding diabetes and minimal or stable microvascular
complications
Inzucchi SE et al. Diabetes Care 2012;35:1364-1379. | American Diabetes Association. Diabetes Care. 2008;31:S12-S54.

Slide Source:Lipids Online Slide Librarywww.lipidsonline.org
[Insert Title Here].ppt
ACCORD, ADVANCE: Long-Term Glycemic ACCORD, ADVANCE: Long-Term Glycemic Control in High-Risk T2DMControl in High-Risk T2DM
Glycemic control reduces microvascular events
Intensive glucose lowering does not lower major cardiovascular events compared to standard glucose lowering – Antihypertensive, lipid-lowering, and antiplatelet therapies
remain standards of pharmacologic care to reduce cardiovascular events
Lacking consensus for:– Optimal glucose targets for long-term control – Preferred regimen to maintain control
T2DM = type 2 diabetes mellitus
ACCORD Study Group. N Engl J Med. 2008;358:2545-2559 | ADVANCE Collaborative Group. N Engl J Med. 2008;358:2560-2572.

Slide Source:Lipids Online Slide Librarywww.lipidsonline.org
Reprinted from Holman RR et al. N Engl J Med. 2008;359:1577-1589. Copyright © 2008 Massachusetts Medical Society. All rights reserved.
0.0
0.2
0.4
0.6
0.8
1.0
Pro
port
ion w
ith E
ven
t
Years Since Randomization
P=0.01P=0.01
No. at RiskConventional TherapySulfonylurea–insulin
11382729
10132488
8572097
5781459
221577
2066
UKPDS Kaplan–Meier Curves for Prespecified UKPDS Kaplan–Meier Curves for Prespecified Aggregate Clinical Outcome: Aggregate Clinical Outcome: Myocardial InfarctionMyocardial Infarction
10 15 20 250 5
Conventional Conventional TherapyTherapy
Sulfonylurea–insulinSulfonylurea–insulin

Slide Source:Lipids Online Slide Librarywww.lipidsonline.org
Reprinted from Holman RR et al. N Engl J Med. 2008;359:1577-1589. Copyright © 2008 Massachusetts Medical Society. All rights reserved.
0.0
0.2
0.4
0.6
0.8
1.0
Pro
port
ion w
ith E
ven
t
Years Since Randomization
P=0.005P=0.005
No. at RiskConventional TherapyMetformin
411342
360317
311274
213214
95106
416
UKPDS Kaplan-Meier Curves for a Prespecified UKPDS Kaplan-Meier Curves for a Prespecified Aggregate Clinical Outcome: Aggregate Clinical Outcome: Myocardial InfarctionMyocardial Infarction
10 15 20 250 5
Conventional Conventional TherapyTherapy
MetforminMetformin

Slide Source:Lipids Online Slide Librarywww.lipidsonline.org
Most Intensive Less Intensive Least Intensive
Patient AgePatient Age
Disease DurationDisease Duration
40 45 50 55 60 65 70 75
5 10 15 20
Other ComorbiditiesOther Comorbidities
None Few/Mild Multiple/Severe
Hypoglycemia RiskHypoglycemia Risk
Low HighModerate
8.0%8.0%6.0%6.0% 7.0%7.0%
Established Vascular ComplicationsEstablished Vascular Complications
None Early Microvascular Advanced Microvascular
Psychosocioeconomic ConsiderationsPsychosocioeconomic Considerations
Highly Motivated, Adherent, Knowledgeable, Excellent
Self-Care Capacities, Comprehensive Support Systems
Less Motivated, Nonadherent, Limited Insight, Poor
Self-Care Capacities, Weak Support Systems
Cardiovascular
Reprinted with permission from Ismail-Beigi F et al. Ann Intern Med 2011;154: 554-559. Copyright © 2011 American College of Physicians. All rights reserved.
Individualizing A1C Targets in Type 2 DiabetesIndividualizing A1C Targets in Type 2 Diabetes

Slide Source:Lipids Online Slide Librarywww.lipidsonline.org
Therapy for Type 2 Diabetes: Therapy for Type 2 Diabetes: Sites of ActionSites of Action
Saltiel AR, Olefsky JM. Diabetes. 1996;45:1661–1669 |Drucker DJ. Mol Endocrinol. 2003;17:161–171.
Alpha-glucosidase inhibitorsAlpha-glucosidase inhibitors
IncretinsIncretins Insulin secretionInsulin secretion
Glucagon secretionGlucagon secretion
InhibitInhibitcarbohydratecarbohydratebreakdownbreakdown
IncretinsIncretins
Slow gastric emptyingSlow gastric emptying
SecretagoguesSecretagoguesSimulate insulin Simulate insulin
secretionsecretion
ThiazolidinedionesThiazolidinediones Glucose intakeGlucose intake
FFA outputFFA output
MetforminMetforminThiazolidinedionesThiazolidinediones Glucose metabolismGlucose metabolism
MetforminMetforminThiazolidinedionesThiazolidinediones
Suppress glucose productionSuppress glucose production

Slide Source:Lipids Online Slide Librarywww.lipidsonline.org
Initial drug monotherapy
ADA/EASD Position StatementADA/EASD Position Statement
Reprinted with permission from Inzucchi SE et al. Diabetes Care. 2012;35:1364-1379. Copyright © 2012 American Diabetes Association. All rights reserved.
Combination therapy: 2 drugs
Efficacy (A1C)HypoglycemiaWeightSide effectsCosts
More-complex insulin strategies
Combination therapy: 3 drugs
Efficacy (A1C)HypoglycemiaWeightSide effectsCosts

Slide Source:Lipids Online Slide Librarywww.lipidsonline.org
160
150
140
130
120
ADOPT: ADOPT: AA DDiabetes iabetes OOutcome utcome PProgression rogression TTrialrial
Reprinted with permission from Kahn SE et al. N Engl J Med. 2006;355:2427-2443.Copyright © 2006 Massachusetts Medical Society. All rights reserved.
0
1
Fast
ing
Pla
sma G
luco
se
(mg/d
l)
Time (years)0 1 2 3 4 5
Rosiglitazone Sustained Fasting Plasma Glucose Over Time
0
3408 3054 2647 2242 840Number of patients: 4118
SU
MET
RSG
Treatment Difference at 4 Years
RSG VS MET -9.8 (-12.7 to -7.0), P<.001
RSG VS SU -17.4 (-20.4 to -14.5), P<.001

Slide Source:Lipids Online Slide Librarywww.lipidsonline.org
Expectations for New Agents Expectations for New Agents and/or New Strategiesand/or New Strategies
Modify disease progression and halting the decline in -cell function – better long-term control
Reducing cardiovascular morbidity and mortality
Lowering A1C to targets as close to normal as possible without unacceptable hypoglycemia in selected populations
Lowering A1C with no weight gain or lowering A1C with weight loss (ideally)
No unexpected side effects in the long term (eg rosiglitazone)

Slide Source:Lipids Online Slide Librarywww.lipidsonline.org
Incretin Hormones in Incretin Hormones in Type 2 DiabetesType 2 Diabetes

Slide Source:Lipids Online Slide Librarywww.lipidsonline.org
IncretinsIncretins
Gut-derived hormones, secreted in response to nutrient ingestion, that potentiate insulin secretion from islet cells in a glucose-dependent fashion, and lower glucagon secretion from islet cells
Two predominant incretins:– Glucagon-like peptide–1 (GLP-1)– Glucose-dependent insulinotropic peptide (GIP)
(also known as gastric inhibitory peptide)
Incretin effect is impaired in type 2 diabetes– Known as GLP-1 deficiency

Slide Source:Lipids Online Slide Librarywww.lipidsonline.org
The Incretin Effect: Insulin Secretion Is The Incretin Effect: Insulin Secretion Is Greater in Response to Oral vs IV GlucoseGreater in Response to Oral vs IV Glucose
0
50
100
150
200
-30 0 30 60 90 120 150 180 210
Time (min)
Glu
cose
(m
g/d
L)
Insu
lin (
pm
ol/L)
0
100
200
300
400
-30 0 30 60 90 120 150 180 210
Time (min)
Oral
IV
Nauck M et al. J Clin Endocrinol Metab. 1986;63:492-498.
Effect diminished in diabetesEffect diminished in diabetes

Slide Source:Lipids Online Slide Librarywww.lipidsonline.org
Role of Incretins in Glucose HomeostatisRole of Incretins in Glucose Homeostatis
DPP-4=dipeptidyl peptidase–4GIP=glucose-dependent insulinotropic peptideGLP-1=glucagon-like peptide–1
Beta cellsAlpha cellsBeta cellsAlpha cells
InactiveInactiveGLP-1GLP-1
Blood Blood Glucose Glucose
Blood Blood Glucose Glucose
GI tractGI tract
Release of gut Release of gut hormones –hormones –
IncretinsIncretins
Ingestion of foodIngestion of food
Glucose Glucose uptake by uptake by
muscles muscles
Glucose Glucose uptake by uptake by
muscles muscles
Glucose Glucose production production
by liver by liver
Glucose Glucose production production
by liver by liver
InactiveInactiveGIPGIP
DPP-4DPP-4enzymeenzyme
Glucose Glucose dependent dependent glucagon from glucagon from alpha cells alpha cells (GLP-1)(GLP-1)
Glucose-Glucose-dependent dependent insulin from insulin from beta cells beta cells (GLP-1, GIP)(GLP-1, GIP)
ActiveActiveGLP-1 & GIPGLP-1 & GIP
PancreasPancreas

Slide Source:Lipids Online Slide Librarywww.lipidsonline.org
Metabolism of Metabolism of Glucagon-Like Peptide–1Glucagon-Like Peptide–1 and and Glucose-Dependent Insulinotropic PeptideGlucose-Dependent Insulinotropic Peptide
DPP-4
CapillaryCapillary
Dipeptidyl peptidase–4 (DPP-4)– Ubiquitous, specific protease– Cleaves N-terminal dipeptide– Inactivates >50% of GLP-1 ~1 min
>50% of GIP in ~7 min
Active HormonesActive Hormones
GLP-1 [7-36NHGLP-1 [7-36NH22]]
GIP [1-42]GIP [1-42]
Inactive MetabolitesInactive Metabolites
GLP-1 [9-36NHGLP-1 [9-36NH22]]
GIP [3-42]GIP [3-42]
GIP = glucose-dependent insulinotropic peptide; GLP-1 = glucagon-like peptide-1

Slide Source:Lipids Online Slide Librarywww.lipidsonline.org
Glucagon-Like Peptide–1 (GLP-1) IncreasesGlucagon-Like Peptide–1 (GLP-1) Increases-Cell Response and Decreases -Cell Response and Decreases -Cell Workload-Cell Workload
Larsson H et al. Acta Physiol Scand .1997;160:413-422 | Drucker DJ. Diabetes. 1998;47:159-169.
Stomach:Stomach: Helps regulate Helps regulate
gastric emptyinggastric emptying
-Cell -Cell workloadworkload
-Cell -Cell responseresponse
-Cells:-Cells: Enhance glucose- Enhance glucose-dependent insulin dependent insulin
secretionsecretion
GLP-1 secreted GLP-1 secreted upon the ingestion upon the ingestion
of foodof food
GLP-1 secreted GLP-1 secreted upon the ingestion upon the ingestion
of foodof food
-Cells:-Cells: Postprandial Postprandial
glucose secretionglucose secretion
Promotes satiety and Promotes satiety and reduces appetitereduces appetite
Liver:Liver: Glucagon reduces Glucagon reduces
hepatic glucose hepatic glucose outputoutput

Slide Source:Lipids Online Slide Librarywww.lipidsonline.org
Glucagon-Like Peptide–1 Actions Are Glucose Glucagon-Like Peptide–1 Actions Are Glucose Dependent in Patients with Type 2 DiabetesDependent in Patients with Type 2 Diabetes
Nauck NA et al. Diabetologia. 1993;36:741-744.
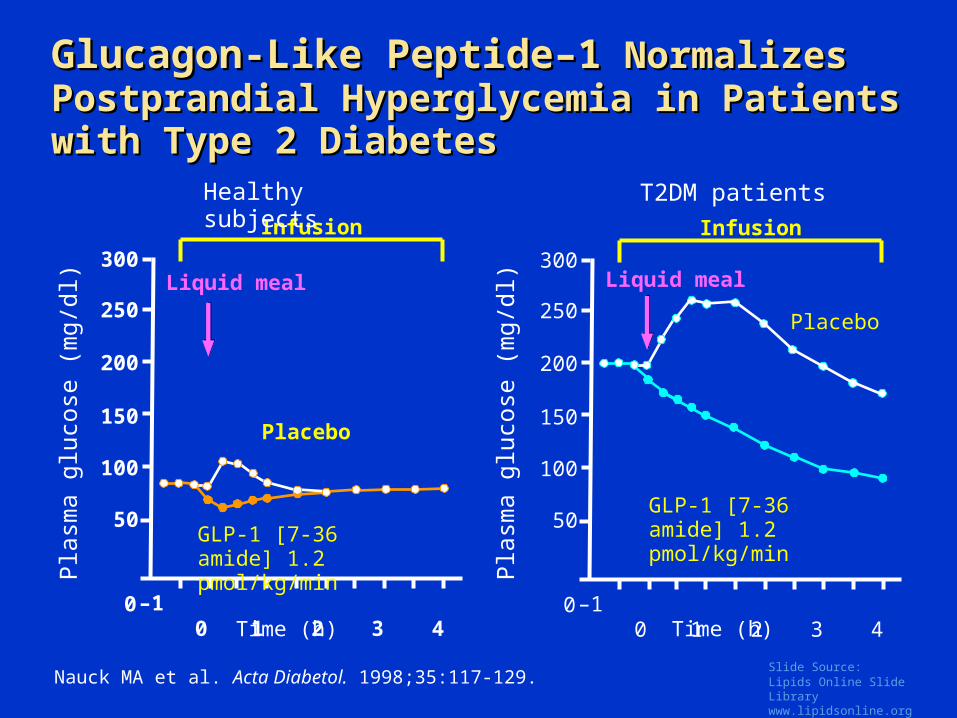
Glucagon-like peptide–1 (GLP-1; 7–36 amide) 1.2 pmol/kg/min or placebo was infused intravenously in 10 fasting patients with type 2 diabetes not controlled with diet and sulfonylurea therapy ± metformin or acarbose (mean A1C 11.6%, mean plasma glucose 13.1 mmol/l)
With GLP-1 treatment– Insulin and C-peptide increased significantly from
baseline in all patients– Glucagon decreased significantly– Plasma glucose was reduced to normal fasting
concentrations (mean 4.9 mmol/l) within 4 hours– Once normalized, plasma glucose was not further Once normalized, plasma glucose was not further
reduced despite ongoing GLP-1 infusionreduced despite ongoing GLP-1 infusion
Slide Source:Lipids Online Slide Librarywww.lipidsonline.org
Glucagon-Like Peptide–1Glucagon-Like Peptide–1 Normalizes Normalizes Postprandial Hyperglycemia in Patients Postprandial Hyperglycemia in Patients with Type 2 Diabeteswith Type 2 Diabetes
Nauck MA et al. Acta Diabetol. 1998;35:117-129.
Time (h)
Pla
sma g
luco
se (
mg/d
l)
0
300
100
50
150
200
250
2 3 4 1 0 –1
Infusion
GLP-1 [7-36 amide] 1.2 pmol/kg/min
Placebo
Liquid meal
0
300
100
50
150
200
250
2 3 4 1 0 –1
Infusion
GLP-1 [7-36 amide] 1.2 pmol/kg/min
Placebo
Liquid meal
Pla
sma g
luco
se (
mg/d
l)
Healthy subjects T2DM patients
Time (h)

Slide Source:Lipids Online Slide Librarywww.lipidsonline.org
Continuous Continuous Glucagon-Like Peptide–1Glucagon-Like Peptide–1 Infusion Reduces Appetite over 6 WeeksInfusion Reduces Appetite over 6 Weeks
All data for patients treated with glucagon-like peptide–1 (n = 10).No changes in these parameters were observed in the saline group.
0
100
200
300
400
500
Mean (SE) AUC for Visual
Analogue Score (mm) vs Time (h)
Time (wk)
610
Zander M et al. Lancet. 2002;359:824–830.
Time (wk)
*Prospective food intake
*Hunger
*Satiety
*Fullness
*p<.05

Slide Source:Lipids Online Slide Librarywww.lipidsonline.org
Incretin-Based Therapies Approved or Incretin-Based Therapies Approved or in Late-Stage Developmentin Late-Stage Development
Dipeptidyl peptidase–4 inhibitors (incretin enhancers)– Sitagliptin: Currently available– Saxagliptin: Currently available– Linagliptin: Currently available (no dose adjustment in renal
insufficiency, unlike others in class)– Vildagliptin:
Approved by EMEA Additional trials requested by FDA
– Alogliptin: NDA filed
Glucagon-like peptide–1 agonists (incretin mimetics)– Exenatide: Currently available - bid– Liraglutide: Currently available – once daily– Exenatide LAR: Currently available- once weekly– Albiglutide– Taspoglutide

Slide Source:Lipids Online Slide Librarywww.lipidsonline.org
Circulating GLP-1 Has Many Circulating GLP-1 Has Many Beneficial EffectsBeneficial Effects
↑ Insulin secretion to maintain glucose homeostasis ↓ Glucagon secretion ↓ Postprandial glycemia ↓ Gastric emptying ↑ Satiety due to delayed gastric emptying ↓ Food ingestion due to effects on brain ↑ Β cell number and ↑ Β cell mass (animal studies)
– ↑ Β cell proliferation and ↑ islet neogenesis– ↓ Apoptosis
Ranganath LR et al. J Clin Pathol. 2008;61:401-409.

Slide Source:Lipids Online Slide Librarywww.lipidsonline.org
Glucagon secretion
Glucose production
Glucose disposal
Insulin secretionInsulin biosynthesis cell proliferation cell apoptosis
Gastric emptying
CardioprotectionCardiac output
Appetite
Neuroprotection
LipogenesisOsteoblast
GLP-1
GIP
Physiological Actions of GLP-1 and GIPPhysiological Actions of GLP-1 and GIP
Sodium excretion

Slide Source:Lipids Online Slide Librarywww.lipidsonline.org
Comparison of Incretin Mimetics Comparison of Incretin Mimetics AvailableAvailable
Nauck M et al. In: Pharmacotherapy of Diabetes: New Developments Improving Life and Prognosis for Diabetic Patients. 2007:111-142.
Available agents: exenatide, exenatide long-acting release (LAR), liraglutide– administered by subcutaneous injection– not DDP-4 substrates
Exenatide: half-life ~2–4 hours; twice-daily injections of 5–10 mg each
Exenatide LAR: half-life >1 week; weekly injections of up to 2 mg
Liraglutide: half-life ~12–14 hours; daily injections of up to 2 mg

Slide Source:Lipids Online Slide Librarywww.lipidsonline.org
-1.5
-1
-0.5
0
0.5
Exenatide + Oral AgentsExenatide + Oral AgentsSummary of A1C ChangesSummary of A1C Changes
Buse JB et al. Diabetes Care. 2004;27:2628-2635 | Defronzo RA et al. Diabetes Care. 2005;28:1092-1100 | Kendall DM et al. Diabetes Care. 2005; 28:1083-1091.
““THE 3 AMIGOS TRIALTHE 3 AMIGOS TRIAL””30-Week, Randomized, Placebo-Controlled30-Week, Randomized, Placebo-Controlled
““THE 3 AMIGOS TRIALTHE 3 AMIGOS TRIAL””30-Week, Randomized, Placebo-Controlled30-Week, Randomized, Placebo-Controlled
*p<0.01 vs. Placebo
A
1C
(%
)
Exenatide + Exenatide + SulfonylureaSulfonylurea
(n = 377)(n = 377)
Exenatide + Exenatide + MetforminMetformin(n = 336)(n = 336)
Exenatide + Exenatide + Sulfonylurea + Sulfonylurea +
MetforminMetformin(n = 733)(n = 733)
Placebo
Exenatide 5 µg
Exenatide 10 µg
0.12%
-0.46%*
-0.86%*
0.08%0.23%
-0.40%* -0.55%
*-0.78%
*-0.77%
*
8.6%8.6%8.6%8.6% 8.2%8.2%8.2%8.2% 8.5%8.5%8.5%8.5%

Slide Source:Lipids Online Slide Librarywww.lipidsonline.org
Efficacy of Exenatide BID in Clinical Efficacy of Exenatide BID in Clinical TrialsTrials
Background Therapya
Mean Disease Duration (y)
ΔA1C (%)
Exenatide BID Placebo
Monotherapy1 2 ‒0.9 ‒0.2b
MET2 5–6 ‒0.8 +0.1b
SU3 6–7 ‒0.9 +0.1b
TZD ± MET4,c 7–8 ‒0.9 +0.1b
SU + MET5 9 ‒0.8 +0.2b
a 16–30 weeks, baseline A1C: 7.8–8.6%b p<0.001 for placebo vs 10 g exenatide BIDc 79% of patients on both agents
1Moretto TJ et al. Clin Ther. 2008;30:1448-1460 | 2Defronzo RA et al. Diabetes Care. 2005;28:1092-1100 | 3Buse JB et al. Diabetes Care. 2004;27:2628-2635 | 4Zinman B et al. Ann Intern Med. 2007;146:477-485 | 5Kendall DM et al. Diabetes Care. 2005; 28:1083-1091 | 6Klonoff DC et al. Curr Med Res Opin. 2008;24:275-286.

Slide Source:Lipids Online Slide Librarywww.lipidsonline.org
Background Therapya
Mean Disease Duration (y)
ΔA1C (%)
Liraglutide Comparators
Monotherapy1 5–61.2 mg: ‒0.81.8 mg: ‒1.1
Glim: ‒0.5b
SU2 6–71.2 mg: ‒1.11.8 mg: ‒1.1
Placebo: +0.2b
Rosi: ‒0.4b
Met3 7–81.2 mg: ‒1.0 1.8 mg: ‒1.0
Placebo: +0.1b
Glim: ‒1.0
Rosi ± Met4,c 91.2 mg: ‒1.5 1.8 mg: ‒1.5
Placebo: ‒0.5b
1Garber A, et al. Lancet. 2009;373:473-481 | 2Marre M et al. Diabet Med. 2009;26:268-278 | 3Nauck M et al. Diabetes Care. 2009;32:84-90 | 4Zinman B et al. Ann Intern Med. 2007;146:477-485 | 5Garber A et al. Diabetes Obes Metab. 2011;13:348-356.
Efficacy of Liraglutide versus Oral Efficacy of Liraglutide versus Oral Agents in Liraglutide Effect and Action Agents in Liraglutide Effect and Action in Diabetes (LEAD) Trial Seriesin Diabetes (LEAD) Trial Series
a26 weeks (except 52 weeks for monotherapy), mean baseline A1C: 8.2–8.6% bp <0.005 vs liraglutide

Slide Source:Lipids Online Slide Librarywww.lipidsonline.org
Efficacy of Exenatide QW versus Oral Efficacy of Exenatide QW versus Oral Agents in the DURATION Trial Series Agents in the DURATION Trial Series
Maintenance of glycemic control has been demonstrated over 3 years (ΔA1C = –1.6%)3
a 26 weeks, baseline A1C: 8.5–8.6% b p <0.05 vs exenatide QW
1Russell-Jones D et al. Diabetes Care. 2012;35:252-258 | 2Bergenstal RM et al. Lancet. 2010; 376:431-439 | 3MacConell L et al. Presented at 71st ADA Scientific Sessions (abstract 969-P), San Diego, CA, 24-28 June 2011.
DURATION = Diabetes Therapy Utilization: Researching Changes in A1C, Weight and Other Factors Through Intervention with Exenatide Once-Weekly
Background Therapya
Mean Disease Duration (y)
ΔA1C (%)
Exenatide QW Comparators
Monotherapy1 3 ‒1.5Met: ‒1.5Pio: ‒1.6
Sita: ‒1.2b
Met2 5–6 ‒1.5Pio: ‒1.2b
Sita: ‒0.9b

Slide Source:Lipids Online Slide Librarywww.lipidsonline.org
Glycemic Control with GLP-1 Receptor Glycemic Control with GLP-1 Receptor Agonists in Head-to-Head Clinical TrialsAgonists in Head-to-Head Clinical Trials
*Significant difference vs comparator GLP-1 *Significant difference vs comparator GLP-1 receptor agonistreceptor agonist
1Buse JB et al. Lancet. 2009;374:39-47 | 2Drucker DJ et al. Lancet. 2008;372:1240-1250 | 3Blevins T, et al. J Clin Endocrinol Metab. 2011;96:1301-1310 | 4Buse JB et al. Presented at 47th EASD Annual Meeting, Lisbon, Portugal, 14 September 2011.
Trial:Size (N):
Study length (weeks):
LEAD-61
46426
DURATION-12
30330
DURATION-53
25424
DURATION-64
91226
-0.8
-1.5
-0.9
-1.3-1.1
-1.9
-1.6-1.5
-2.0
-1.5
-1.0
-0.5
0.0A1
C Ch
ange
(%)
**
**
**
EXN BID
LIRA
EXN QW

Slide Source:Lipids Online Slide Librarywww.lipidsonline.org
-4.0
-3.5
-3.0
-2.5
-2.0
-1.5
-1.0
-0.5
0.0
Exenatide + Oral AgentsExenatide + Oral AgentsSummary of Weight ChangesSummary of Weight Changes
““THE 3 AMIGOS TRIALTHE 3 AMIGOS TRIAL””30-Week, Randomized, Placebo-Controlled30-Week, Randomized, Placebo-Controlled
““THE 3 AMIGOS TRIALTHE 3 AMIGOS TRIAL””30-Week, Randomized, Placebo-Controlled30-Week, Randomized, Placebo-Controlled
*p<0.01 vs. placebo
W
eig
ht
(kg
)
Placebo
Exenatide 5 µg
Exenatide 10 µg
-0.6
-0.9
-1.6*
-0.3
-0.9
-1.6*
-1.6*
-2.8*
-1.6*
Buse JB et al. Diabetes Care. 2004;27:2628-2635 | Defronzo RA et al. Diabetes Care. 2005;28:1092-1100 | Kendall DM et al. Diabetes Care. 2005; 28:1083-1091.
Exenatide + Exenatide + SulfonylureaSulfonylurea
(n = 377)(n = 377)
Exenatide + Exenatide + MetforminMetformin(n = 336)(n = 336)
Exenatide + Exenatide + Sulfonylurea + Sulfonylurea +
MetforminMetformin(n = 733)(n = 733)

Slide Source:Lipids Online Slide Librarywww.lipidsonline.org
Changes in Body Weight with Exenatide Changes in Body Weight with Exenatide versus Insulinversus Insulin
Reprinted with permission from Heine R et al. Ann Intern Med. 2005;143:559–569. Copyright © 2005 American College of Physicians. All rights reserved.
*P<0.0001 compared with insulin glargine measure at the same time point.
-3
-2
-1
0
1
2
Ch
an
ge in
Bod
y W
eig
ht
(kg
)
Weeks
40 12 261882
Exenatide group (n = 275)
**
* **
*
Insulin glargine group (n = 260)

Slide Source:Lipids Online Slide Librarywww.lipidsonline.org
Distribution of Weight Loss and A1C Distribution of Weight Loss and A1C Change with Exenatide BID and Exenatide Change with Exenatide BID and Exenatide QWQW
Reprinted with permission from Drucker DJ et al. Lancet. 2008;372: 1240-1250. Copyright © 2008 Elsevier. All rights reserved.
Once a week (73%)Twice a day (74 %)
Once a week (1%)Twice a day (5%)
Once a week (3%)Twice a day (5%)
Once a week (23%)Twice a day (16%)10
0
-10
-20
-30
-40-6 -5 -4 -3 -2 -1 0 1 2 3
A1C Change (%)
Wei
gh
t C
han
ge
(kg
)

Slide Source:Lipids Online Slide Librarywww.lipidsonline.org
Comparison of Incretin ModulatorsComparison of Incretin Modulators
GLP-1 Analogues DPP-4 Inhibitors
Administration route Injection Oral
GLP-1 Sustained Meal-related
Effect on A1C
Effects on body weight
Side effectsNausea,
Rare: pancreatitis
(Well tolerated) Nasopharyngitis, skin rashes, Stevens-Johnson syndrome
-cell function
GLP-1=glucagon-like peptide–1; DDP-4=dipeptidyl peptidase–4

Slide Source:Lipids Online Slide Librarywww.lipidsonline.org
Cardiovascular Effects of GLP-1 Cardiovascular Effects of GLP-1 AnalogsAnalogs
Beneficial BP effects – Rapid– Probably not due to weight loss– May be direct vascular effects or natriuretic effects– Weight loss may contribute to sustained reductions
Beneficial effects on lipids, other CVD risk factors– Largely mediated through weight loss
May have direct cardioprotective effects

Slide Source:Lipids Online Slide Librarywww.lipidsonline.org
Combination of Basal Insulin with a Combination of Basal Insulin with a GLP-1 Agonist Has a Scientific LogicGLP-1 Agonist Has a Scientific Logic
Basal insulin analogs• Simple to initiate• Control nocturnal and FPG• Lower hypoglycaemia risk vs NPH• Modest weight increase (1–3 kg)• Achieve A1C targets in ~50–60%
GLP-1 agonists• Simple to initiate• Pronounced PPG control• No increase in hypoglycaemia• Weight lowering/neutral effects• Achieve A1C targets in ~40–60%
Complementary actions
Additive effects

Slide Source:Lipids Online Slide Librarywww.lipidsonline.org
Exenatide BID Combined with Exenatide BID Combined with Basal InsulinBasal Insulin
More patients discontinued EXN BID (9%) vs PBO (1%) due to adverse events (p <0.01)1
Significant A1C reduction regardless of intensification order2
– EXN BID + insulin glargine
– Insulin glargine + EXN BID
1Buse JB et al. Ann Intern Med. 2011;154:103-112 | 2Levin PA, et al. Endocr Pract. 2012;18:17-25.
EXN BID + GLAR vs PBO + GLAR1 30-Week Trial (N = 259)
p <0.001

Slide Source:Lipids Online Slide Librarywww.lipidsonline.org
Kruger DF et al. Diabetes Educ. 2010;36(suppl 3):44S-72S | Amylin Pharmaceuticals, Byetta prescribing information, December 2011 | Amylin Pharmaceuticals, Bydureon prescribing information, January 2012 | Novo Nordisk, Victoza prescribing information, April 2012.
Managing Nausea Associated with GLP-1 Managing Nausea Associated with GLP-1 Receptor AgonistsReceptor Agonists Discuss expectations
– Nausea is likely to be mild and resolve in a few weeks– Nausea may actually be “fullness”
Suggest decreased portion sizes Suggest reduced fat content of meals
– Keep a log of foods that cause nausea Be aware of severe persistent abdominal pain, which could indicate
pancreatitis Titrate more slowly – maintain at lower dose for a longer period Be aware of severe GI disease
– GLP-1 receptor agonists slow gastric emptying and are associated with GI adverse events
– GLP-1 receptor agonists have not been studied in patients with severe GI disease
– Avoid exenatide in patients with history of gastroparesis

Slide Source:Lipids Online Slide Librarywww.lipidsonline.org
0.0 0.5 1.0 1.5 2.0
Relative Risk of Acute Pancreatitis (±95% CI)
• The absolute risk of acute pancreatitis was comparable among initiators of exenatide and sitagliptin
Dore DD et al. Curr Med Res Opin. 2009;25(4):1019–1027.
Absolute and Relative Risk of Acute Pancreatitis Absolute and Relative Risk of Acute Pancreatitis with Antidiabetic Agents in Human Subjectswith Antidiabetic Agents in Human Subjects
Exenatide-Met/GlySitagliptin-Met/Gly
Drug Pair 1: Exenatide 0.13% (N = 27,996); Met/Gly 0.13% (N = 27,983)Drug Pair 2: Sitagliptin 0.12% (N = 16,267); Met/Gly 0.12% (N = 16,281)

Slide Source:Lipids Online Slide Librarywww.lipidsonline.org
Incretin-Based Therapies: Incretin-Based Therapies: Reports of Pancreatitis Reports of Pancreatitis
Patients with diabetes should be counseled about the symptoms of pancreatitis
Symptoms include persistent abdominal pain that can radiate to the back and may or may not be accompanied by nausea and vomiting
Exenatide and liraglutide should be stopped if signs of pancreatitis develop and should be used with caution in patients who have a history of the disease

Slide Source:Lipids Online Slide Librarywww.lipidsonline.org
Liraglutide and Exenatide ER: Liraglutide and Exenatide ER: Boxed WarningBoxed Warning
Warning: risk of thyroid C-cell tumors
[Liraglutide/Exenatide extended-release] causes thyroid C-cell tumors at clinically relevant exposures in rodents
Unknown whether [Victoza/Bydureon] causes thyroid C-cell tumors, including medullary thyroid carcinoma (MTC), in humans, as human relevance could not be determined by clinical or nonclinical studies
Contraindicated in patients with:– Personal or family history of MTC – Multiple endocrine neoplasia syndrome type 2 (MEN 2)
Amylin Pharmaceuticals, Bydureon prescribing information, January 2012 | Novo Nordisk, Victoza prescribing information, April 2012.

Slide Source:Lipids Online Slide Librarywww.lipidsonline.org
DPP-4 Inhibitors vs. GLP-1 AgonistsDPP-4 Inhibitors vs. GLP-1 Agonists
DPP-4 inhibitorsDPP-4 inhibitors– GLP-1 and GIP enhancedGLP-1 and GIP enhanced– Physiological fluctuationsPhysiological fluctuations
in hormone levels in hormone levels – Limited by endogenous Limited by endogenous
secretionsecretion– Comparable to TZD, SUComparable to TZD, SU– Superior tolerabilitySuperior tolerability– Weight neutralWeight neutral– Oral, once dailyOral, once daily
GLP-1 agonistsGLP-1 agonists– Pure GLP-1 effectPure GLP-1 effect– Sustained effect that maySustained effect that may
be prolonged be prolonged – Not limited by endogenous Not limited by endogenous
secretionsecretion– Superior to SU, TZDSuperior to SU, TZD– Nausea, vomiting Nausea, vomiting – Weight lossWeight loss– InjectionInjection

Slide Source:Lipids Online Slide Librarywww.lipidsonline.org
Comparison of Dipeptidyl Peptidase–4 Comparison of Dipeptidyl Peptidase–4 (DPP-4) Inhibitors(DPP-4) Inhibitors
Sitagliptin Linagliptin Saxagliptin Vildagliptin
Usual phase 3 dose 100 mg QD 5 mg QD 5 mg QD 50 mg BD
Half-life (t1/2), h 12.4 12.5–21.1 2.2–3.8 1.3–2.4
DPP-4 inhibition at 24 h
~80% ~80% (25 mg) ~55% (5 mg) 50% (100 mg)
Elimination Kidney(mostly unchanged)
Bile but not kidney(mostly unchanged)
Liver and kidneyActive metabolite
Kidney>>LiverInactive metabolite
Renal dose adjustments required
Yes No Yes None for mild impairment; not
recommended for moderate or severe
impairment
Selectivity for DPP-4 >2600-fold vs DPP-8 >10,000-fold vs DPP-9
>10,000-fold vs DPP-8/9
>400-fold vs DPP-8>100-fold vs DPP-9
>90-fold vs DPP-8
Potential for drug–drug interaction
Low Low Strong CYP3A4/5 inhibitors
Low
Food effect No No No No

Slide Source:Lipids Online Slide Librarywww.lipidsonline.org
Properties of Dipeptidyl Peptidase–4 Properties of Dipeptidyl Peptidase–4 (DPP-4) Inhibitors(DPP-4) Inhibitors
Nauck M et al. In: Pharmacotherapy of Diabetes: New Developments Improving Life and Prognosis for Diabetic Patients. 2007:111-142.
Oral administrationOral administration
GLP-1/GLP-1 receptor agonist concentration elevated 3–6 hours GLP-1/GLP-1 receptor agonist concentration elevated 3–6 hours after meals when secretion from endogenous sources is after meals when secretion from endogenous sources is stimulatedstimulated
GLP-1 concentration close to physiological concentration (~ x 2–3)GLP-1 concentration close to physiological concentration (~ x 2–3)
Action through GLP-1 receptors and possibly GIP receptors and/or Action through GLP-1 receptors and possibly GIP receptors and/or other receptorsother receptors
GLP-1 action probably through nerves more than circulationGLP-1 action probably through nerves more than circulation
A1C reduction −0.5% to −1.1%A1C reduction −0.5% to −1.1%
Weight change ±0 kgWeight change ±0 kg
-Cell mass effects probable in animals, no human data -Cell mass effects probable in animals, no human data

Slide Source:Lipids Online Slide Librarywww.lipidsonline.org
Mean
Ch
an
ge f
rom
B
aselin
e in
A1C
(%
)
–0.9
–1.1
-2.0
-1.8
-1.6
-1.4
-1.2
-1.0
-0.8
-0.6
-0.4
-0.2
0.0
–0.8
–1.0
vs Placebo
vs RSG
vs Met
Monotherapy
*Initial combination therapyAll statistically significant
Insulin >30 U/d
Pio 45 mg qd
–1.9
Add-on Combination TherapyMet ≥1500 mg/d
Pio* 30 mg qd
–0.5
–0.9–0.8
Vildagliptin: A1C ChangesVildagliptin: A1C Changes
Reprinted with permission from Rosenstock J et al. Curr Opin Endocrinol Diabetes Obes. 2007;14:98-107. Copyright © 2007 Wolters Kluwer Health. All rights reserved.
Study duration (wks) 24 24 24 52 24 24 24 24
N (ITT population) 380 340 697 780 416 398 592 256
Baseline A1C (%) 8.4 8.3 8.7 8.7 8.4 8.7 8.8 8.5
Slide Source:Lipids Online Slide Librarywww.lipidsonline.org
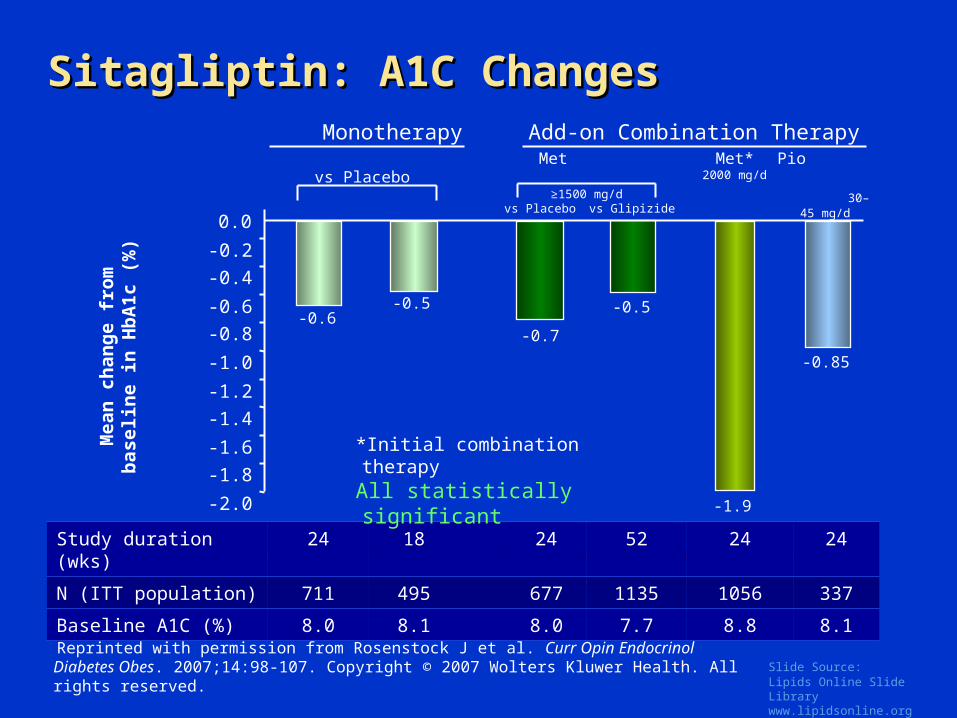
vs Placebo
Mean
ch
an
ge f
rom
b
aselin
e in
Hb
A1c (
%)
-0.6-0.5
vs Glipizide
-0.7
-0.5
-0.85
Pio 30–45
mg/d
Met*2000 mg/d
-1.9
Sitagliptin: A1C ChangesSitagliptin: A1C Changes
Study duration (wks) 24 18 24 52 24 24
N (ITT population) 711 495 677 1135 1056 337
Baseline A1C (%) 8.0 8.1 8.0 7.7 8.8 8.1
*Initial combination therapyAll statistically significant
vs Placebo
Monotherapy Add-on Combination Therapy
-2.0
-1.8
-1.6
-1.4
-1.2
-1.0
-0.8
-0.6
-0.4
-0.2
0.0
Met ≥1500 mg/d
Reprinted with permission from Rosenstock J et al. Curr Opin Endocrinol Diabetes Obes. 2007;14:98-107. Copyright © 2007 Wolters Kluwer Health. All rights reserved.

Slide Source:Lipids Online Slide Librarywww.lipidsonline.org
Efficacy of Add-on SitagliptinEfficacy of Add-on Sitagliptin
LSM = least-squares mean change
1Charbonnel B et al. Diabetes Care 2006;29:2638-2643 |2Rosenstock J et al. Clin Ther 2006;28:1556-1568.
–0.65% (P<0.001)
–0.70% (P<0.001)
1 2

Slide Source:Lipids Online Slide Librarywww.lipidsonline.org
Similar Glycemic Control with Sitagliptin Similar Glycemic Control with Sitagliptin vs Glipizide Added to Metformin vs Glipizide Added to Metformin
Sitagliptin 100 mg qd (n=382)
Glipizide (n=411)
Mean
ch
an
ge in
A1
C
Mean change from baseline (for both groups)*: –0.67%
6.0
6.2
6.4
6.6
6.8
7.0
7.2
7.4
7.6
7.8
8.0
8.2
8.4
0 12 24 38 52Time (weeks)
*Per protocol analysis; –0.51% and –0.56% for sitagliptin and glipizide, respectively, in last observation carried forward (LOCF) analysis
Reprinted with permission from Nauck MA et al. Diabetes Obes Metab. 2007; 9:194-205. Copyright © 2007 John Wiley and Sons. All rights reserved.

Slide Source:Lipids Online Slide Librarywww.lipidsonline.org
-0.8
-0.6
-0.4
-0.2
0
0.2
0.4 0.19
–0.54*–0.45*–0.43*A
dju
sted m
ean ±
SE
change in A
1C
(%)
Reprinted with permission from Rosenstock J et al. Curr Med Res Opin. 2009; 25:2401-2411. Copyright © 2009 Informa Healthcare. All rights reserved.
Saxagliptin Monotherapy in Treatment-NaSaxagliptin Monotherapy in Treatment-Naïve ïve Patients with Type 2 DiabetesPatients with Type 2 Diabetes
*P<0.0001 vs PBO
-0.8
-0.6
-0.4
-0.2
0.0
0.2
0.4
BL 4 6 8 12 16 20 24
Weeks
Mean ±
SE c
hange in
A1
C f
rom
base
line (
%)
PBO
SAXA 5 mg
SAXA 2.5 mg
SAXA 10 mg
2.5 5 10
7.9 8.0 7.9 7.9
Dose
Baseline mean A1C
(%)
PBO
SAXA (mg)
2.5 5 10 PBO100 103 95 92
7.9 8.0 7.9 7.9
Dose
n =
SAXA (mg)
Baseline mean A1C
(%)

Slide Source:Lipids Online Slide Librarywww.lipidsonline.org
-0.8
-0.6
-0.4
-0.2
0
0.2
BL 4 8 12 16 20 24BL
Saxagliptin Add-on to Metformin: Reduction Saxagliptin Add-on to Metformin: Reduction in A1C in Patients with Type 2 Diabetes in A1C in Patients with Type 2 Diabetes Inadequately Controlled on Metformin AloneInadequately Controlled on Metformin Alone
Reprinted with permission from DeFronzo RA et al. Diabetes Care. 2009;32:1649-1655. Copyright © 2009 American Diabetes Association. All rights reserved.
A1
C,
Mean
± S
E C
han
ge
from
Baselin
e (
%)
SAXA 5 mg + MET
SAXA 2.5 mg + MET
SAXA 10 mg + MET
PBO + MET
6

Slide Source:Lipids Online Slide Librarywww.lipidsonline.org
Efficacy of Saxagliptin Monotherapy Efficacy of Saxagliptin Monotherapy Therapy over 24 Weeks Compared with Therapy over 24 Weeks Compared with PlaceboPlacebo
SAXA = saxagliptinFPG = fasting plasma glucosePPG-AUC = postprandial glucose area under the curve
* Placebo-subtracted difference† Statistically significant decrease from baseline
SAXA Dose(Main treatment cohort)
A1C Change (%)*
FPG Change (mg/dL)*
PPG-AUC Change(mg + min/dL)*
2.5 mg once daily −0.62† −21† −6221
5.0 mg once daily −0.64† −15† −6249†
10.0 mg once daily −0.73† −23† −7437†
Rosenstock J et al. Curr Med Res Opin. 2009;25:2401-2411.

Slide Source:Lipids Online Slide Librarywww.lipidsonline.org
Prandial Glucagon after up to 2 Years Add-on Prandial Glucagon after up to 2 Years Add-on Treatment in Patients with Type 2 Diabetes Treatment in Patients with Type 2 Diabetes Inadequately Controlled with Metformin Inadequately Controlled with Metformin
Vildagliptin
Glimepiride
Glu
cag
on
(p
mol.
hr/
L)
0
1
2
3
4
5
-1
-2
-3
-4
-5
p<0.001 for difference between treatment groups
Reprinted with permission from Ahrén B et al. Diabetes Care. 2010;33:730-732. Copyright © 2010 American Diabetes Association. All rights reserved.

Slide Source:Lipids Online Slide Librarywww.lipidsonline.org
Vildagliptin
Glimepiride
Insu
lin
Secre
tory
Rate
R
ela
tive t
o G
lucose
(pm
ol/
min
/m2
/mm
ol/
L)
3.0
4.0
5.0
0.5
0
1.5
2.5
3.5
4.5
2.0
1.0
p=0.022 for difference between treatment
groups
Insulin Secretory Rate Relative to Glucose after up Insulin Secretory Rate Relative to Glucose after up to 2 Years Add-on Treatment in Patients with Type 2 to 2 Years Add-on Treatment in Patients with Type 2 Diabetes Inadequately Controlled with Metformin Diabetes Inadequately Controlled with Metformin
Ahrén B et al. Diabetes Care. 2010;33:730-732.

Slide Source:Lipids Online Slide Librarywww.lipidsonline.org
Adverse Events with Dipeptidyl Adverse Events with Dipeptidyl Peptidase–4 (DPP-4) InhibitorsPeptidase–4 (DPP-4) Inhibitors
Amori RE et al. JAMA. 2007;298:194-206.
Adverse EventsNo. of Studies
Risk Ratio DPP-4 vs. Control
Mean % Experiencing Outcome
DPP-4 Control
Hypoglycemia 20 0.97 1.6% 1.4%
Nausea 10 0.89 2.7% 3.1%
Vomiting 6 0.69 1.3% 1.5%
Diarrhea 7 0.80 3.8% 4.0%
Abdominal pain 5 0.73 2.4% 3.2%
Cough 5 1.07 2.9% 2.4%
Influenza 6 0.87 4.1% 4.7%
Nasopharyngitis 12 1.17 6.4% 6.1%
Upper respiratory tract infection 9 0.99 6.3% 6.4%
Sinusitis 3 0.61 2.0% 3.4%
Urinary tract infection 5 1.52 3.2% 2.4%
Headache 13 1.38 5.1% 3.9%