Embed Size (px)
Citation preview

INTRODUCING
CAD-DrawnDevice Maps and Site
Graphs
VIRTUAL ASSISTANCEFor Commercial Pest Management
ProvidersTargeting Customers with large, complex facilities in
regulated industries
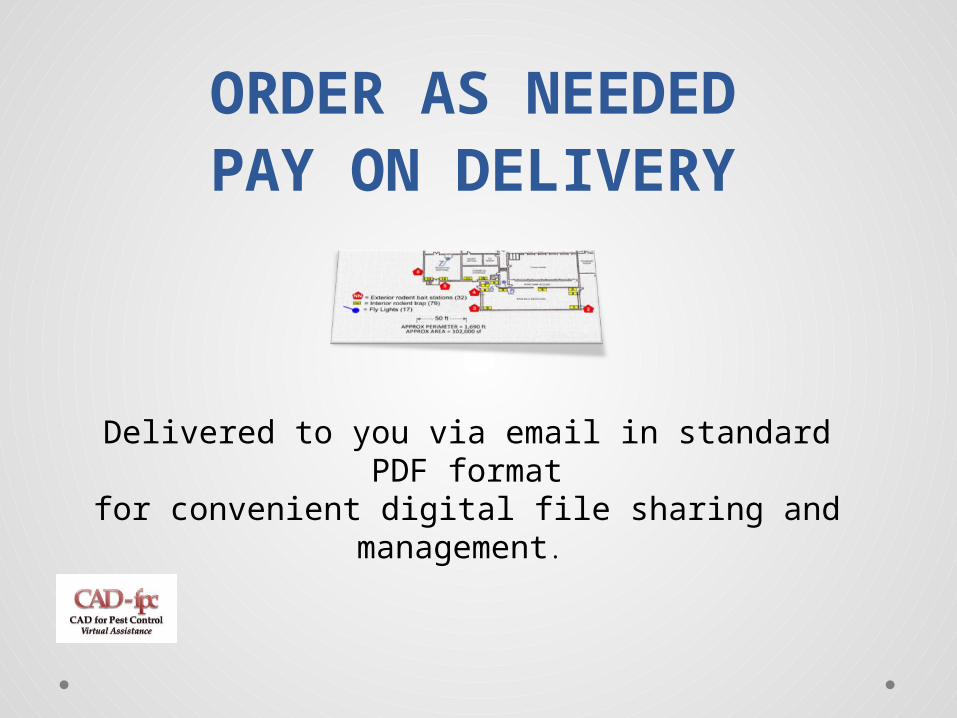
Delivered to you via email in standard PDF format
for convenient digital file sharing and management.
ORDER AS NEEDEDPAY ON DELIVERY

Created From Your Source Drawing
From
Most Any
Source
Drawing
I First
Redact
Drawing Your Finished Product

Source
Drawings
From Architectural Drawing

Source
Drawings:
From Hand-Drawn Sketches
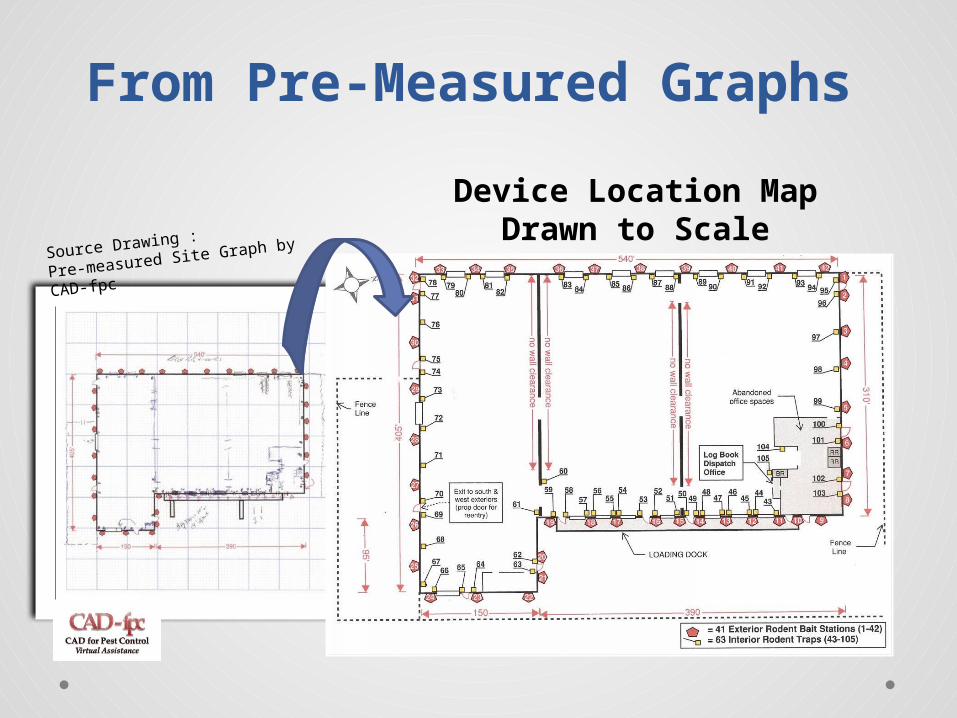
Source Drawing :
Pre-measured Site Graph by
CAD-fpc
Device Location MapDrawn to Scale
Food-Grade Container Warehouse
From Pre-Measured Graphs

Source
Drawings:
(17) Sections
Composite drawing created by CAD-fpc(Device & Service Locations to be mapped)
Regional Hospital
Manipulate Sectional Drawings

Source Drawing: Device & Service Locations Map created by CAD-fpc
Hospital
Identify Sensitive Service Areas

Source Drawing:
Sensitive Service Areas Mapped by CAD-fpc
Nursing Home
Identify Sensitive Service Areas

Pre-measured Site Graphs
From
Satellite
Image
I Create
Digital
Tracing and
Transfer to
Graph
CALIBRATED TO SCALE
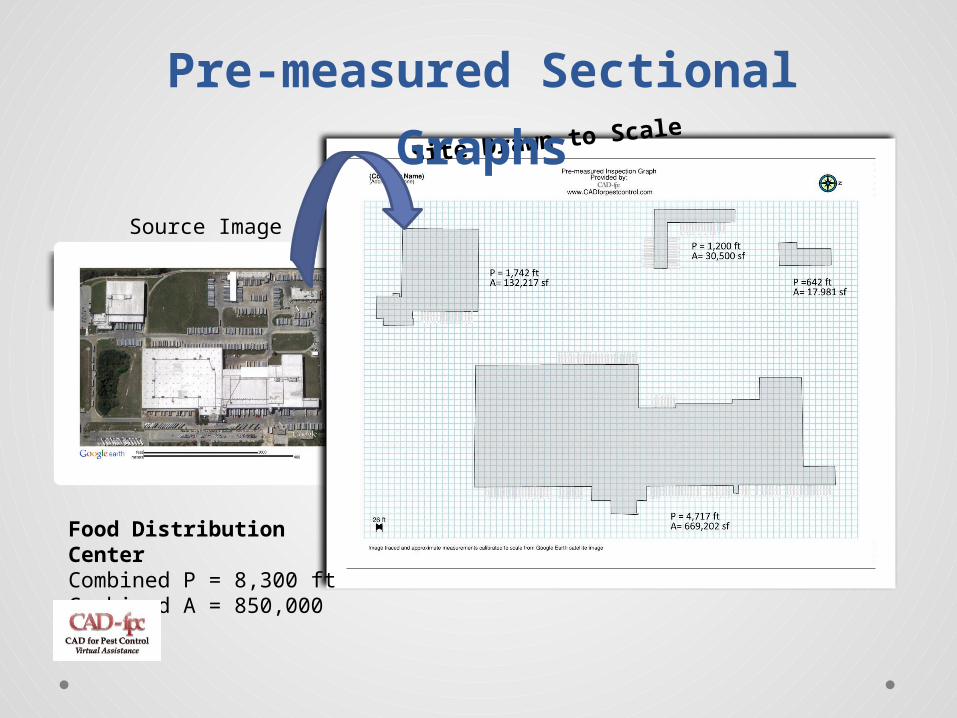
Source Image
Food Distribution CenterCombined P = 8,300 ftCombined A = 850,000 sf
Site Drawn to Scale
Pre-measured Sectional
Graphs
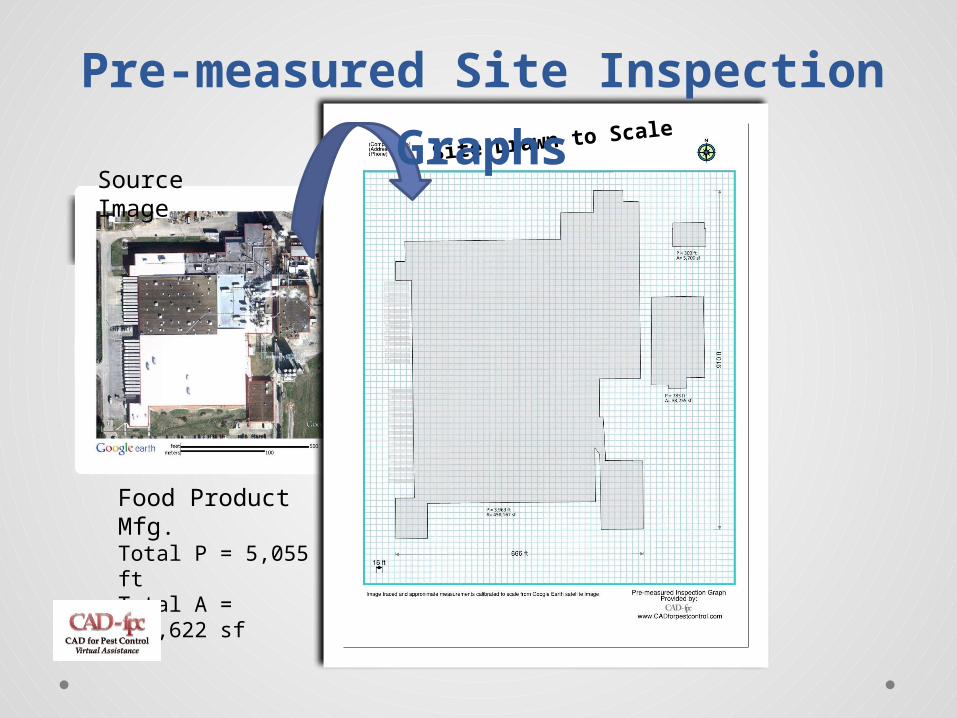
Food Product Mfg.Total P = 5,055 ftTotal A = 497,622 sf
Source Image
Site Drawn to Scale
Pre-measured Site Inspection
Graphs

Source Drawing:
Proportionally Scaled Sectional Drawings by CAD-fpc
72-acre compoundZoned for Cycled
Service
(Interior details to be drawn-in)
Create Sectional Drawings