Embed Size (px)
Citation preview

3Q15

Coreia do Sul
França
Brasil
Alemanha
Canadá
Japão
Rússia
Índia
EUA
China
Total
540
562
584
616
640
996
1.064
1.296
4.330
5.583
23.636
2014
8th
POSITION
Fonte: Global Energy Statistical Yearbook 2015
ELECTRICITY GENERATION
2
(2,3%)
(2,4%)
(2,5%)
(2,6%)
(2,7%)
(5,5%)
(4,2%)
(4,5%)
(18,3%)
(23,6%)
(100%)
World’s Largest Producers (TWh)

Hidráulica Carvão Nuclear Gás Óleo Outras
16,3%
41,3%
10,6%
21,7%
4,4% 5,7%
64,9%
2,4% 1,3%
8,5% 6,7%
16,2%
World Brazil
Fonte: EPE - Balanço Energético 2015 e IEA - Key World Energy Statistics 2015
3
Electricity Generation(%) – World(2013) x Brazil (2015)
4 Source: EPE - Empresa de Pesquisa Energética
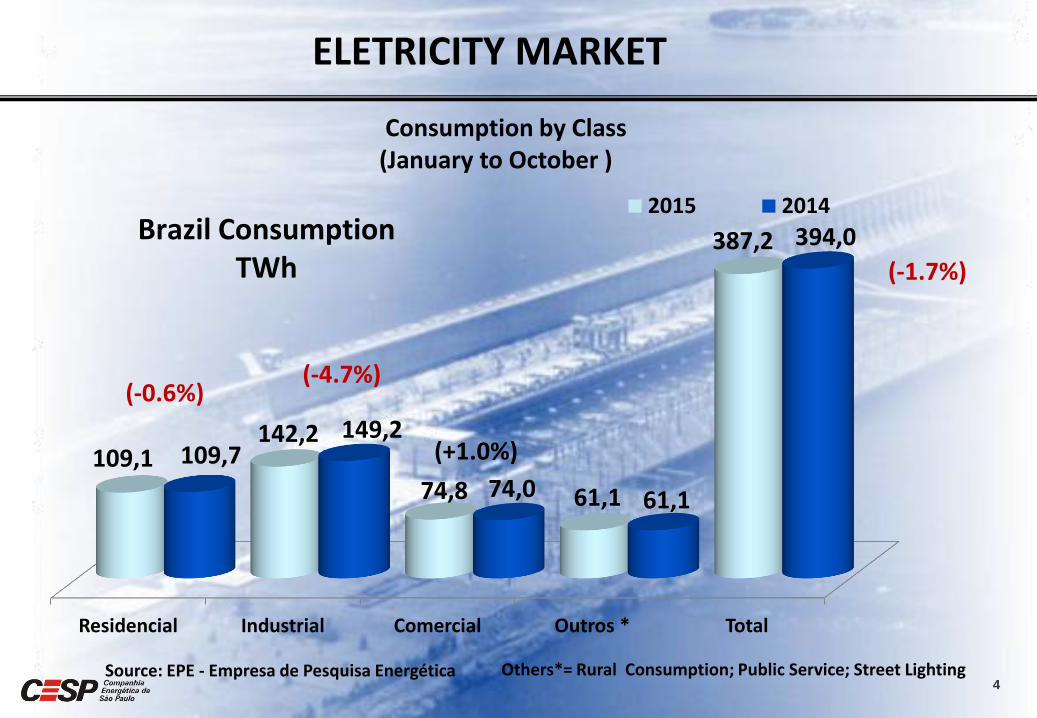
ELETRICITY MARKET
Residencial Industrial Comercial Outros * Total
109,1 142,2
74,8 61,1
387,2
109,7 149,2
74,0 61,1
394,0 2015 2014
Brazil Consumption TWh (-1.7%)
Others*= Rural Consumption; Public Service; Street Lighting
(-0.6%)
(+1.0%)
Consumption by Class (January to October )
(-4.7%)

29.8%
10
20
30
40
50
60
70
80
90
Jan Feb Mar Apr May Jun Jul Aug Sep Oct Nov Dec
2011 2012
2013 2014
2015
19.4%
5
Subsystem South East / Middle West (70% of the country's storage)
Source: ONS
Reservoir Levels

6
Energy Generation 2001 X 2014 - Brazil
Source: ONS
0
10.000
20.000
30.000
40.000
50.000
60.000
70.000
80.000
J F M A M J J A S O N D GH_2001 GH_2014 GT_2001 GT_2014 Carga_2001 Carga_2014
MWmed GH – Hydraulic Generation GT – Thermal Generation
65,114 MW average
37,750 MW average

7
Source: ONS
0
10.000
20.000
30.000
40.000
50.000
60.000
70.000
80.000
J F M A M J J A S O N D
MWavg
GH – Hydraulic Generation GT – Thermal Generation
GH_2001 GH_2015 GT_2001 GT_2015 Carga_2001 Carga_2015
37,835 MW Average
61,347 MW Average
Power Generation 2001 x 2015

PHYSICAL GUARANTEE X HYDRAULIC GENERATION - 2014
8 Source: CCEE GSF – Generation Scaling Factor
44,7
53,8 51,6 49,8 45,8
44,5 45,4 46,9 47,9 48,4 48,3 48,0 47,5
48,2 51,8
50,7 46,7 45,2 41,6
40,3 40,4 39,2
41,9 42,3 42,2 41,7
1,080 0,963
0,983 0,938 0,987 0,936 0,889 0,861
0,819 0,864 0,877
0,877 0,879
-
0,200
0,400
0,600
0,800
1,000
1,200
-
10
20
30
40
50
60
Dez-13 Jan-14 Fev-14 Mar-14 Abr-14 Mai-14 Jun-14 Jul-14 Ago-14 Set-14 Out-14 Nov-14 Dez-14
Physical Guarantee Hydraulic Generation GSF GW average GSF

9 Source: CCEE
Seasonalization of Physical Guarantee as provided by CCEE.
GSF – Generation Scaling Factor
46,7 58,6 58,4 57,6 51,2 49,1 47,5 45,4 45,7 46,4 46,4 46,4 45,7
41.1 47.2 45.8 45.1 42.3 39.9 37.7 38.9 38.8 40.5 42.7 42.4 43.8
0,879 0,806 0,786 0,783 0,825 0,812 0,794
0,857 0,849 0,872 0,921 0,913
0,957
-
0,200
0,400
0,600
0,800
1,000
1,200
-
10
20
30
40
50
60
70
Dec-14 Jan-15 Feb-15 Mar-15 Apr-15 May-15 Jun-15 Jul-15 Aug-15 Sep-15 Oct-15 Nov-15 Dec-15
GSF GW Average GSF Physical Guarantee Hydraulic Generation
PHYSICAL GUARANTEE X HYDRAULIC GENERATION - 2015

10
97.36
135.4
38.73
70.28
29.42
166.69
263.07
688.88
388.48 387.24
369.39
240.08
145.09
227.04 212.32 202.87
116.08
Average Price PLD - R$/MWh
Southeast/ Midwest Subsystem
Annual Average Monthly Average
Source: CCEE
11
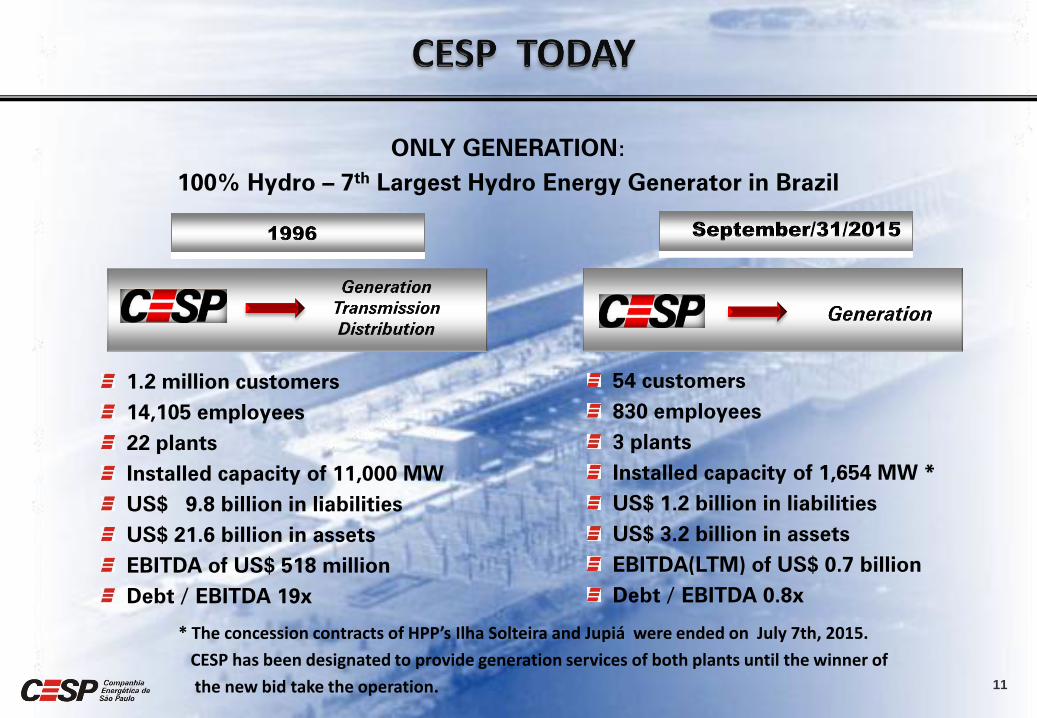
1.2 million customers
14,105 employees
22 plants
Installed capacity of 11,000 MW
US$ 9.8 billion in liabilities
US$ 21.6 billion in assets
EBITDA of US$ 518 million
Debt / EBITDA 19x
54 customers
830 employees
3 plants
Installed capacity of 1,654 MW *
US$ 1.2 billion in liabilities
US$ 3.2 billion in assets
EBITDA(LTM) of US$ 0.7 billion
Debt / EBITDA 0.8x
ONLY GENERATION:
100% Hydro – 7th
Largest Hydro Energy Generator in Brazil
* The concession contracts of HPP’s Ilha Solteira and Jupiá were ended on July 7th, 2015.
CESP has been designated to provide generation services of both plants until the winner of
the new bid take the operation.

13
CESP has three hydroelectric power plants located in the State of São Paulo with total installed capacity of 1,654 MW and total guaranteed power output of 1,081 average megawatts (MW).

14
INSTALLED
CAPACITY
14 1,540.0 1,017.0 23/Jan/99 21/May/28
2 87.0 50.0 20/Apr/78 09/Mar/21
2 27.6 14.0 05/May/72 20/May/20
52 6,649.8 3,698.5 - -
20 3,444.0 1,731.5 18/Jul/73 07/Jul/15
14 1,551.2 886.0 14/Apr/69 07/Jul/15
34 4,995.2 2,617.5 - -
GENERATING
UNITS
PHYSICAL GUARANTEE
(AVERAGE MW)
START
OF
OPERATIONS
CONCESSION
MATURITY
DATE
JUPIÁ
PORTO PRIMAVERA
ILHA + JUPIÁ
PARAIBUNA
JAGUARI
T O T A L
ILHA SOLTEIRA
18 1,654.6 1,081.0 - - PP+PAR+JAG
POWER PLANTS

15
Expiration of Concession
Nov 2011
MP 579
Edition
Including Três Irmãos
Sep 2012
CESP refuses
to renew the
concession
pursuant to
MP 579
Dec 2012
Auction of the Plant
CESP does
not take part
Mar 2014
CESP takes a lawsuit in
the amount of R$ 6.7
billion aiming to
receive the
undisputed
value of R$ 1.7 billion.
Justice denies. CESP appeals and
pleads to receive it in
7 years
Jul 2014
Favorable decision to
CESP
Union appeals
Nov 27 2014 Oct 19 2015
Union obtains a favorable
decision
CESP appeals
Payments have not started

16
MP 579 Edition
Including Ilha Solteira
and Jupiá
Indemnificati
on of R$ 20 million
Sep 2012
CESP refuses
to renew the
concession
pursuant to
MP 579
Dec 2012
Maturation of ACR
contracts
CESP sells 500 MW for
2014 and 100 MW for 1st half of
2015
Dec 2013
Accounting Effects
Provision of IFRS values
Dec 31 2014 Jul 7 2015
Expiration of Concession
Oct 2015
CTG (single applicant)
won the bid for Ilha
Solteira and Jupiá power
plants. Bonus for the grant
of R$ 13.8 billion
Nov 2015
Ministry defined R$ 2
million as compensation for Ilha Solteira
CESP filed a lawsuit
demanding compensation
of R$ 1.5 billion
Ilha Solteira and Jupiá HPP

17
September / 30 / 2015
(R$ million)
Três
Irmãos
Ilha
Solteira Jupiá Total
Assets Available for Reversion 3,529.1 2,126.3 589.6 6,244.9
Provision - Contingent Asset (1,811.7) - - (1,811.7)
Provision - Impairment - (1,656.9) (335.5) (1,992.5)
Accounting Balance 1,717.4 469.4 254.0 2,440.7
18
OPERATIONAL PERFORMANCE

2009 2010 2011 2012 2013 2014 2015
0.928 0.934 0.930 0.925 0.925 0.931 0.940
0.897
0.897
Source: ONS
0.0249
Data compiled by November 2015
19
OPERATIONAL PERFORMANCE
0,0059
0,0063
0,0069 0,0095
0,0101
0,0088
0,0050
2009 2010 2011 2012 2013 2014 2015
0.0249

2007 2008 2009 2010 2011 2012 2013 9M14 9M15
41.203 41.139 39.831 40.947 41.056 42.353
35.946
22.052
14.766 *
20
Energy Production (GWh)
34.304
Physical Guarantee: 3,698 MW avarage and 1.081 *
*without considering HPP’s Ilha Solteira and Jupiá
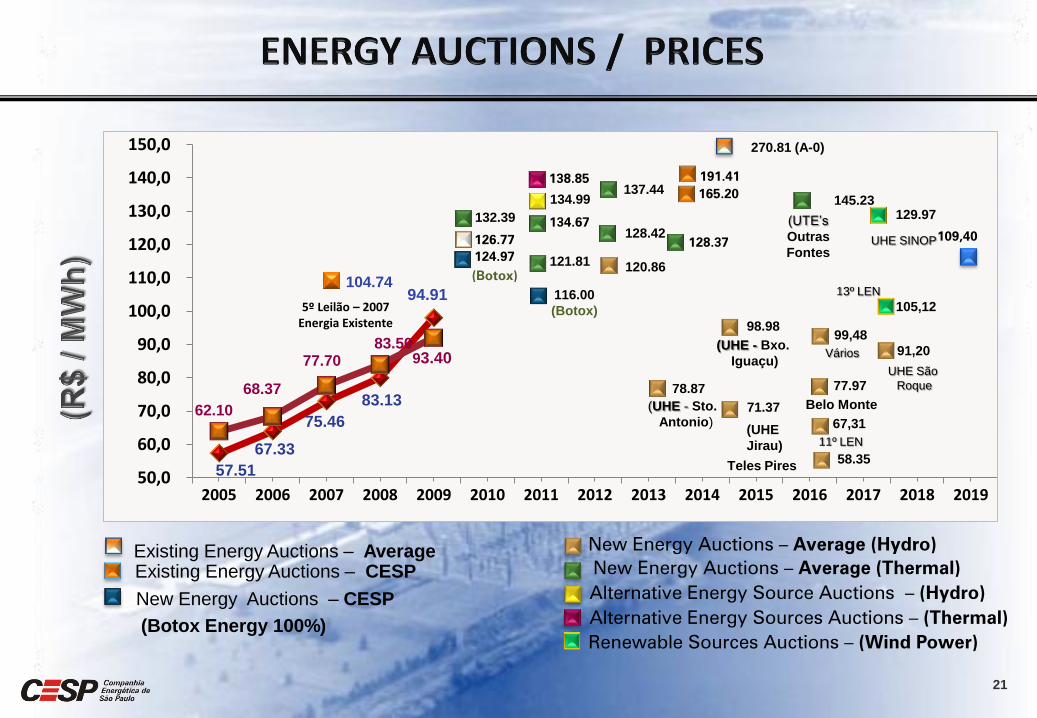
21
57.51
67.33
75.46
83.13
93.40
62.10
68.37
77.70 83.50
94.91
50,0
60,0
70,0
80,0
90,0
100,0
110,0
120,0
130,0
140,0
150,0
2005 2006 2007 2008 2009 2010 2011 2012 2013 2014 2015 2016 2017 2018 2019
109,40
270.81 (A-0)
104.74
5º Leilão – 2007 Energia Existente
132.39
116.00
(Botox)
121.81
134.99
120.86
128.42
137.44
78.87
(UHE - Sto.
Antonio) 71.37
(UHE
Jirau)
98.98
(UHE - Bxo.
Iguaçu)
145.23
(UTE’s
Outras
Fontes
77.97
Belo Monte
58.35 Teles Pires
124.97
(Botox)
126.77
134.67
138.85
191.41
128.37
99,48
Vários
67,31
11º LEN
91,20
UHE São
Roque
New Energy Auctions – Average (Hydro)
New Energy Auctions – Average (Thermal)
Alternative Energy Source Auctions – (Hydro)
Alternative Energy Sources Auctions – (Thermal)
105,12
13º LEN
Renewable Sources Auctions – (Wind Power)
UHE SINOP
165.20
129.97
Existing Energy Auctions – Average Existing Energy Auctions – CESP
New Energy Auctions – CESP
(Botox Energy 100%)

22

23
Capital Increase R$ 3.2 billions
Term: 10 years Grace Period: 5
years (for principal)
To match its cash flow generation with its debt service, CESP has launched a comprehensive capital restructuring plan with the following main components:
Privatization of CTEEP – R$ 1.2 billion Jul/2006
Public Offering of Preferred Class B Shares (PNB) – R$ 2.0 billion
Jul/2006
Bonds Operations US$220 millions = R$ 488 million - Aug/2006 US$350 millions = R$750 million - Jan/2007
FIDC III – R$ 650 million Aug/2006
FIDC IV – R$ 1.25 billion Jun/2007
Funds Involved in the Restructuring - R$ 6.3 billion
1.2
2.0
1.2
0.65
1.25
C
T
E
E
P
P
U
B
L
I
C
O
F
F
E
R
B
O
N
D
S
FIDC III
F
I
D
C
IV
24
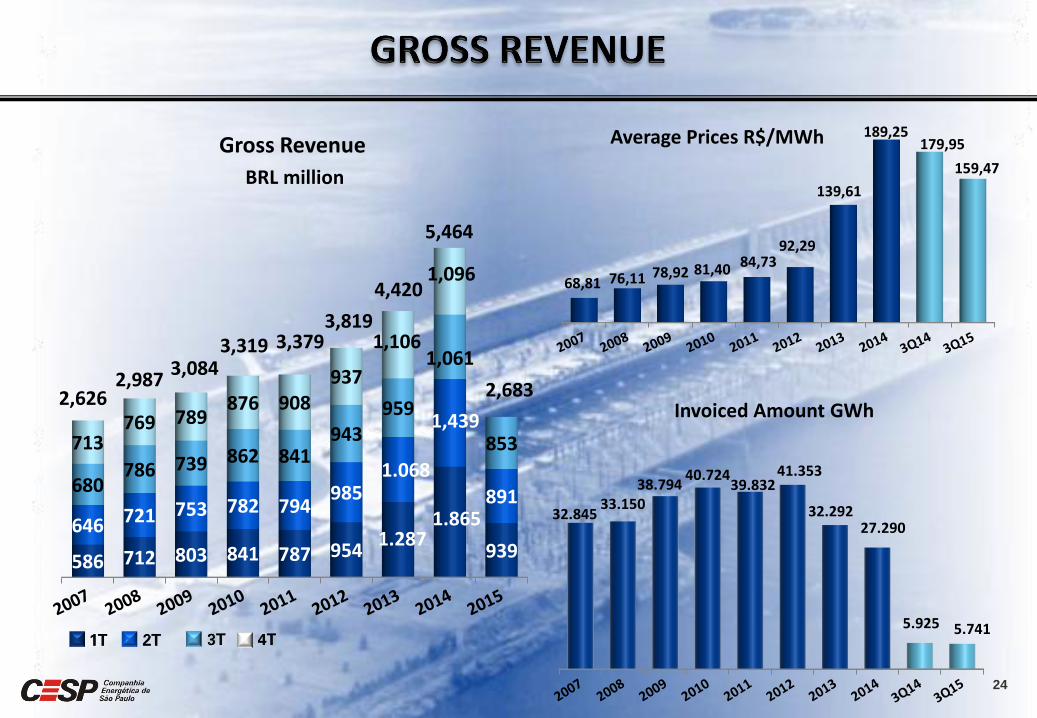
Gross Revenue
BRL million
32.845 33.150
38.794 40.724
39.832 41.353
32.292 27.290
5.925 5.741
586 712 803 841 787 954 1.287
1.865
939 646 721 753 782 794
985 1.068
1,439
891 680
786 739 862 841 943
959
1,061
853 713 769 789
876 908 937
1,106
1,096 68,81 76,11 78,92 81,40 84,73 92,29
139,61
189,25 179,95
159,47
2,626
3,819 3,319
3,084 2,987
4,420
5,464
3,379
Average Prices R$/MWh
Invoiced Amount GWh 2,683
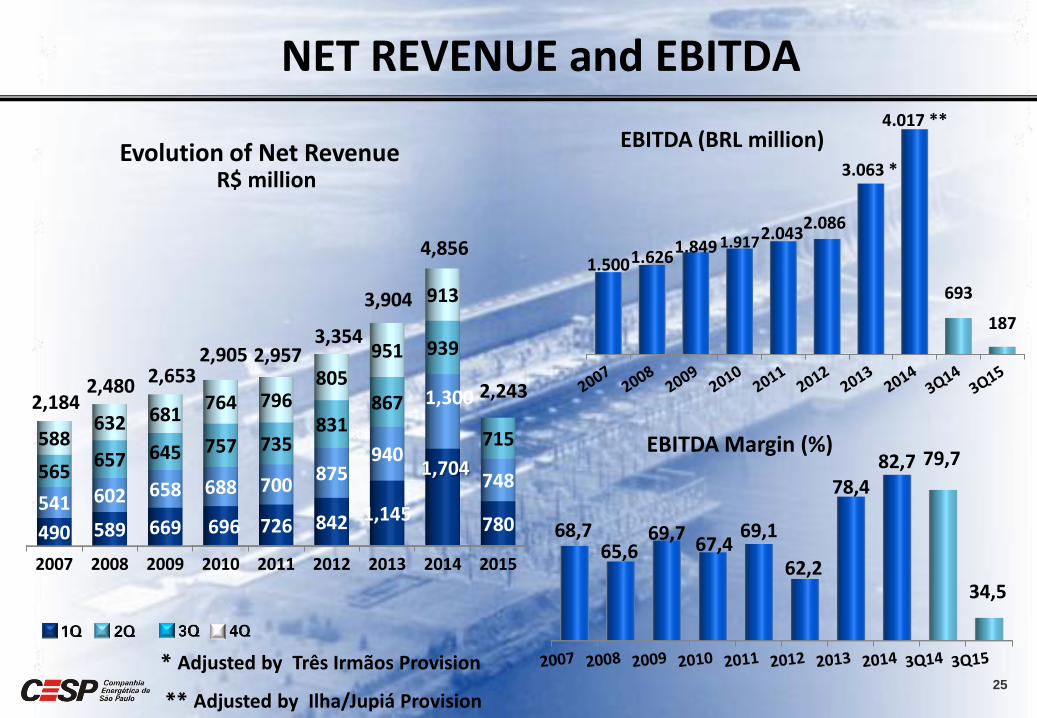
68,7 65,6
69,7 67,4
69,1
62,2
78,4 82,7 79,7
34,5
EBITDA Margin (%)
25
2007 2008 2009 2010 2011 2012 2013 2014 2015
490 589 669 696 726 842 1,145
1,704
780 541 602 658 688 700
875 940
1,300
748 565 657 645 757 735
831 867
939
715 588 632 681
764 796 805
951
913
2,184 2,480 2,653
2,905 2,957
1.500 1.626 1.849 1.917 2.043
2.086
3.063 *
4.017 **
693
187 3,354
Evolution of Net Revenue R$ million
3,904
* Adjusted by Três Irmãos Provision
NET REVENUE and EBITDA
4,856
** Adjusted by Ilha/Jupiá Provision
EBITDA (BRL million)
2,243
26
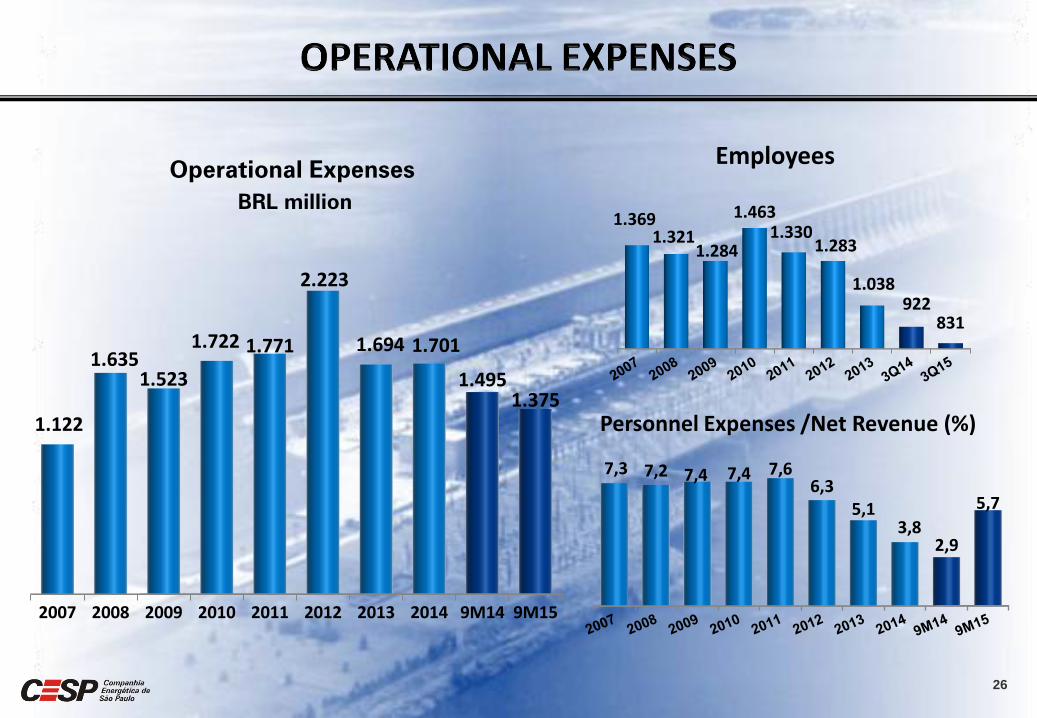
2007 2008 2009 2010 2011 2012 2013 2014 9M14 9M15
1.122
1.635 1.523
1.722 1.771
2.223
1.694 1.701
1.495 1.375
1.369 1.321
1.284
1.463 1.330
1.283
1.038 922
831
7,3 7,2 7,4 7,4 7,6 6,3
5,1 3,8
2,9
5,7
Operational Expenses
BRL million
Personnel Expenses /Net Revenue (%)
Employees

27
2007 2008 2009 2010 2011 2012 2013 2014 9M14 9M15
814
721
592
466 443
380 331
278
209 101
Debt Charges + Monetary Variation
(Excluding Exchange Variation)
R$ million

28
Capital Investments
R$ million
2007 2008 2009 2010 2011 2012 2013 2014 9M15
186
210
101 116 123 129
86
32 15
29
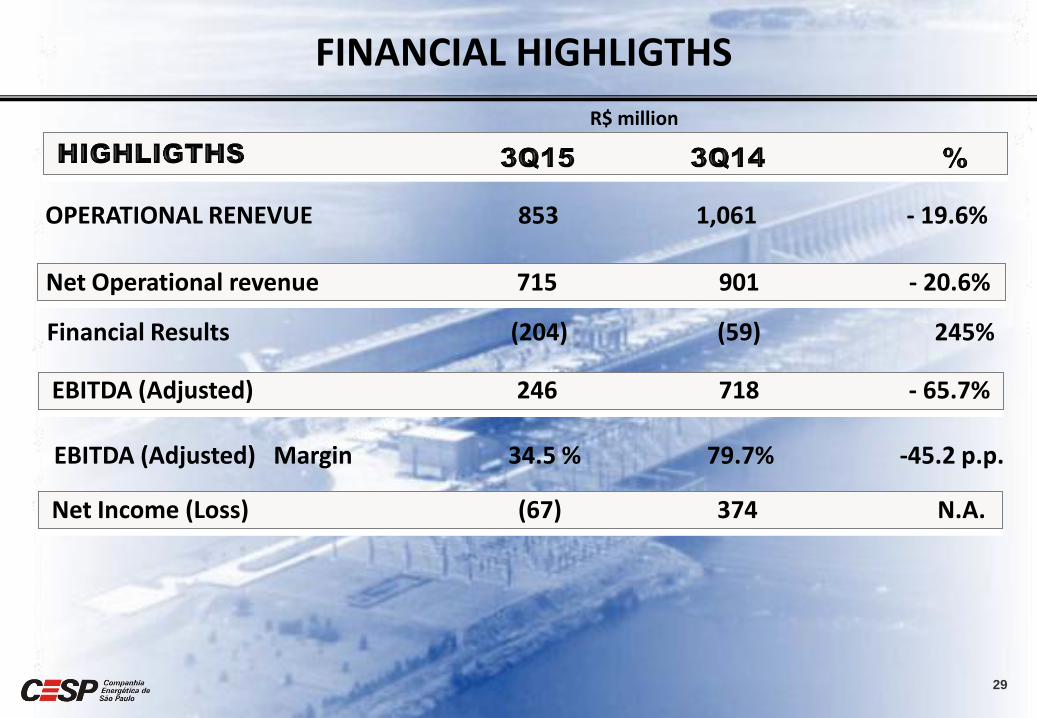
EBITDA (Adjusted) Margin 34.5 % 79.7% -45.2 p.p.
OPERATIONAL RENEVUE 853 1,061 - 19.6%
Net Operational revenue 715 901 - 20.6%
EBITDA (Adjusted) 246 718 - 65.7%
Net Income (Loss) (67) 374 N.A.
FINANCIAL HIGHLIGTHS
Financial Results (204) (59) 245%
R$ million

30
EBITDA (Adjusted) Margin 62.1 % 86.4% -24.3 p.p.
OPERATIONAL RENEVUE 2,684 4,367 - 38%
Net Operational revenue 1,528 2,905 - 41%
EBITDA (Adjusted) 1,392 3,288 - 57%
Net Income 302 1,708 - 72.3%
FINANCIAL HIGHLIGTHS
Financial Results (359) (96) +275%
R$ million
Interest on Equity 193
31

32
Evolution by Currency
FINANCIAL DEBT
September/ 30/2015 R$ 1,719 million
7.5 6.9 7.0
5.3 4.5
4.2 3.7
3.0
-82%
9.8
8.1 6.2 4.6 4.3 2.8 2.2 2.1 1.7 1.1 0.7 0.8
2005 2006 2007 2008 2009 2010 2011 2012 2013 2014 3Q15
45%
55%
1.7
36%
45%
64% 61% 65% 63% 69% 66%
75% 74%
55% 39%
35%
37% 31%
34%
25% 26%
55%
45%
2.8
Local Currency
Debt /
EBITDA

FIDC R$374 21,8%
ELETROBRAS R$ 21 1,2%
Fundação CESP R$ 375
21,8%
BIB'S R$ 2 0,1%
BNDES BRADY R$ 947 55,1%
33
September/30/2015 R$ 1,719 million
Debt in Foreign Currency
US$ 244 million
FINANCIAL DEBT
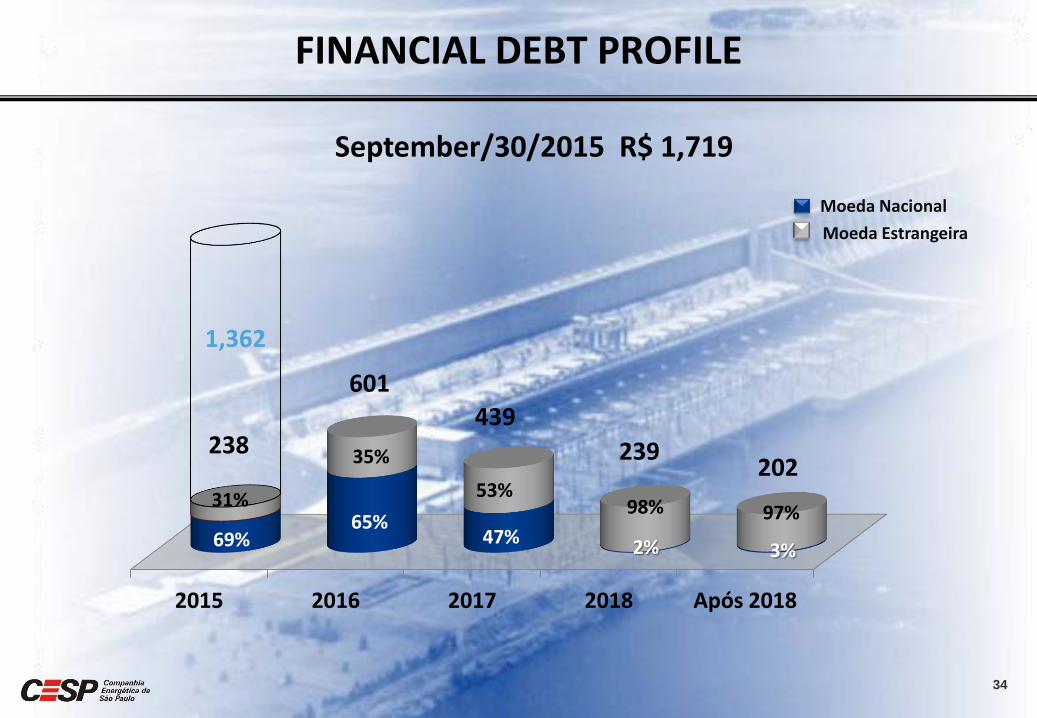
2015 2016 2017 2018 Após 2018
1,362
31%
34
439
239 202
Moeda Nacional
601
69% 65%
35%
53%
47% 2%
98% 97%
3%
Moeda Estrangeira
238
FINANCIAL DEBT PROFILE
September/30/2015 R$ 1,719

35
1 -
2 -
3 -
4 -
Low Operational Costs
Low CAPEX Requirements
Low Working Capital Requirements (less than 5% of net revenues)
Tax Credits Reducing Future Tax Payments
(R$2.3 billion)
Several factors enable CESP to generate strong operational cash flow.

36

37
TOTAL CAPITAL COMMON x PREFERRED
ON 33.3%
PNA 2.3%
PNB 64.4%
ON 1/3
PNA + PNB
2/3
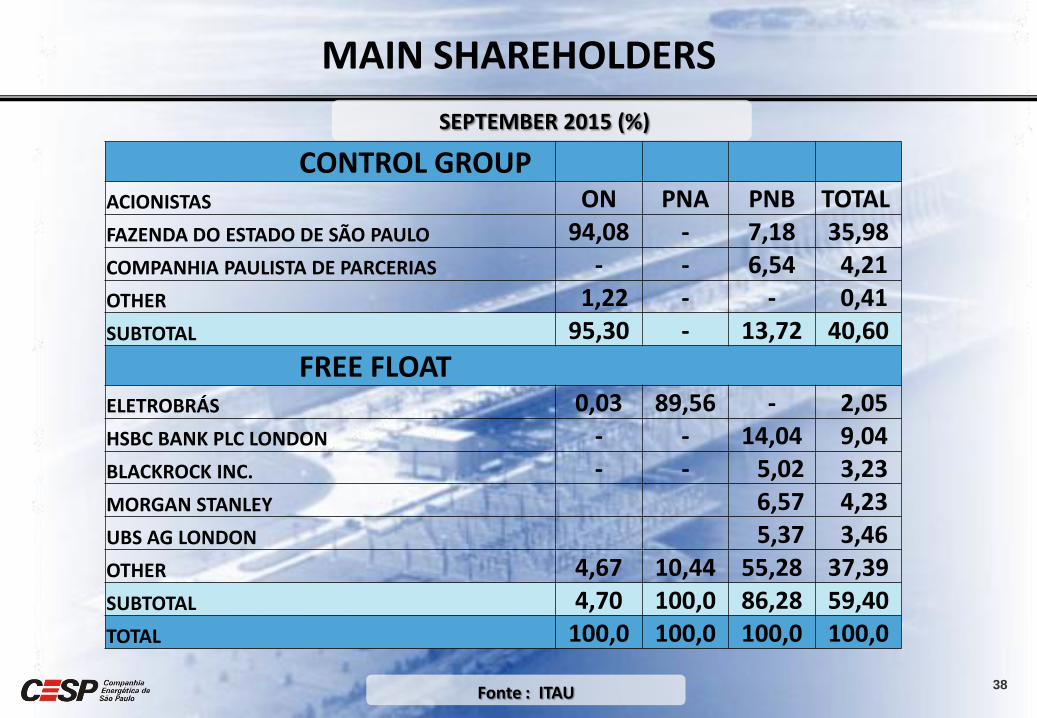
38 Fonte : ITAU
SEPTEMBER 2015 (%)
CONTROL GROUP ACIONISTAS ON PNA PNB TOTAL
FAZENDA DO ESTADO DE SÃO PAULO 94,08 - 7,18 35,98
COMPANHIA PAULISTA DE PARCERIAS - - 6,54 4,21
OTHER 1,22 - - 0,41
SUBTOTAL 95,30 - 13,72 40,60
FREE FLOAT ELETROBRÁS 0,03 89,56 - 2,05
HSBC BANK PLC LONDON - - 14,04 9,04
BLACKROCK INC. - - 5,02 3,23
MORGAN STANLEY 6,57 4,23
UBS AG LONDON 5,37 3,46
OTHER 4,67 10,44 55,28 37,39
SUBTOTAL 4,70 100,0 86,28 59,40
TOTAL 100,0 100,0 100,0 100,0
MAIN SHAREHOLDERS

39
Market 5%
SP Estate 95%
Market 87%
State SP 13%
Common and Preferred (PNA + PNB)
Common Shares Preferred (PNA + PNB)

40
2.6
3.8
93.6
5.1
7.4
181.9
80.1
133.9
3,480.9
33.3
2.3
64.4
109.2
7.4
210.9
1,710.7
133.9
4,034.4
100.0 194.5 3,694.9 100.0 327.5 5,879.0
R$ million
September 2015

41
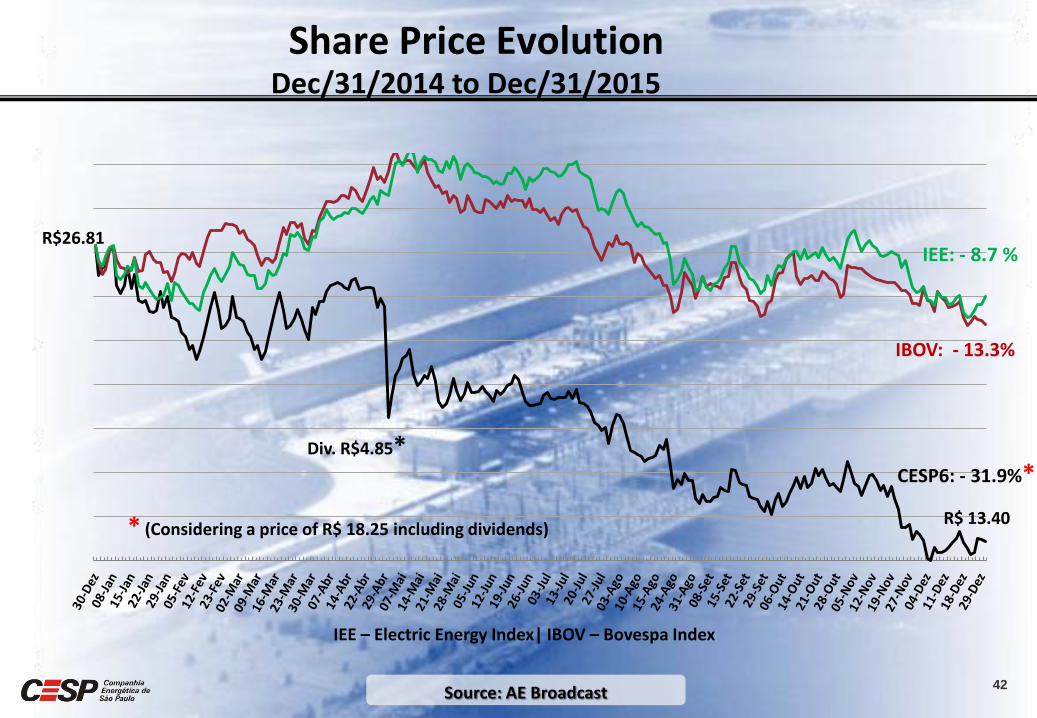
Share Price Evolution
Source: AE Broadcast
IEE – Electric Energy Index| IBOV – Bovespa Index
Dec/31/2014 to Dec/31/2015
Div. R$4.85*
R$26.81
R$ 13.40
CESP6: - 31.9%*
IEE: - 8.7 %
IBOV: - 13.3%
42
* (Considering a price of R$ 18.25 including dividends)

43
Evolution from 2003 to 2015

44